W-1% La2O3 Submitted to a Single Laser Pulse: Effect of Particles on Heat Transfer and Surface Morphology


Abstract
:1. Introduction
2. Materials and Experimental
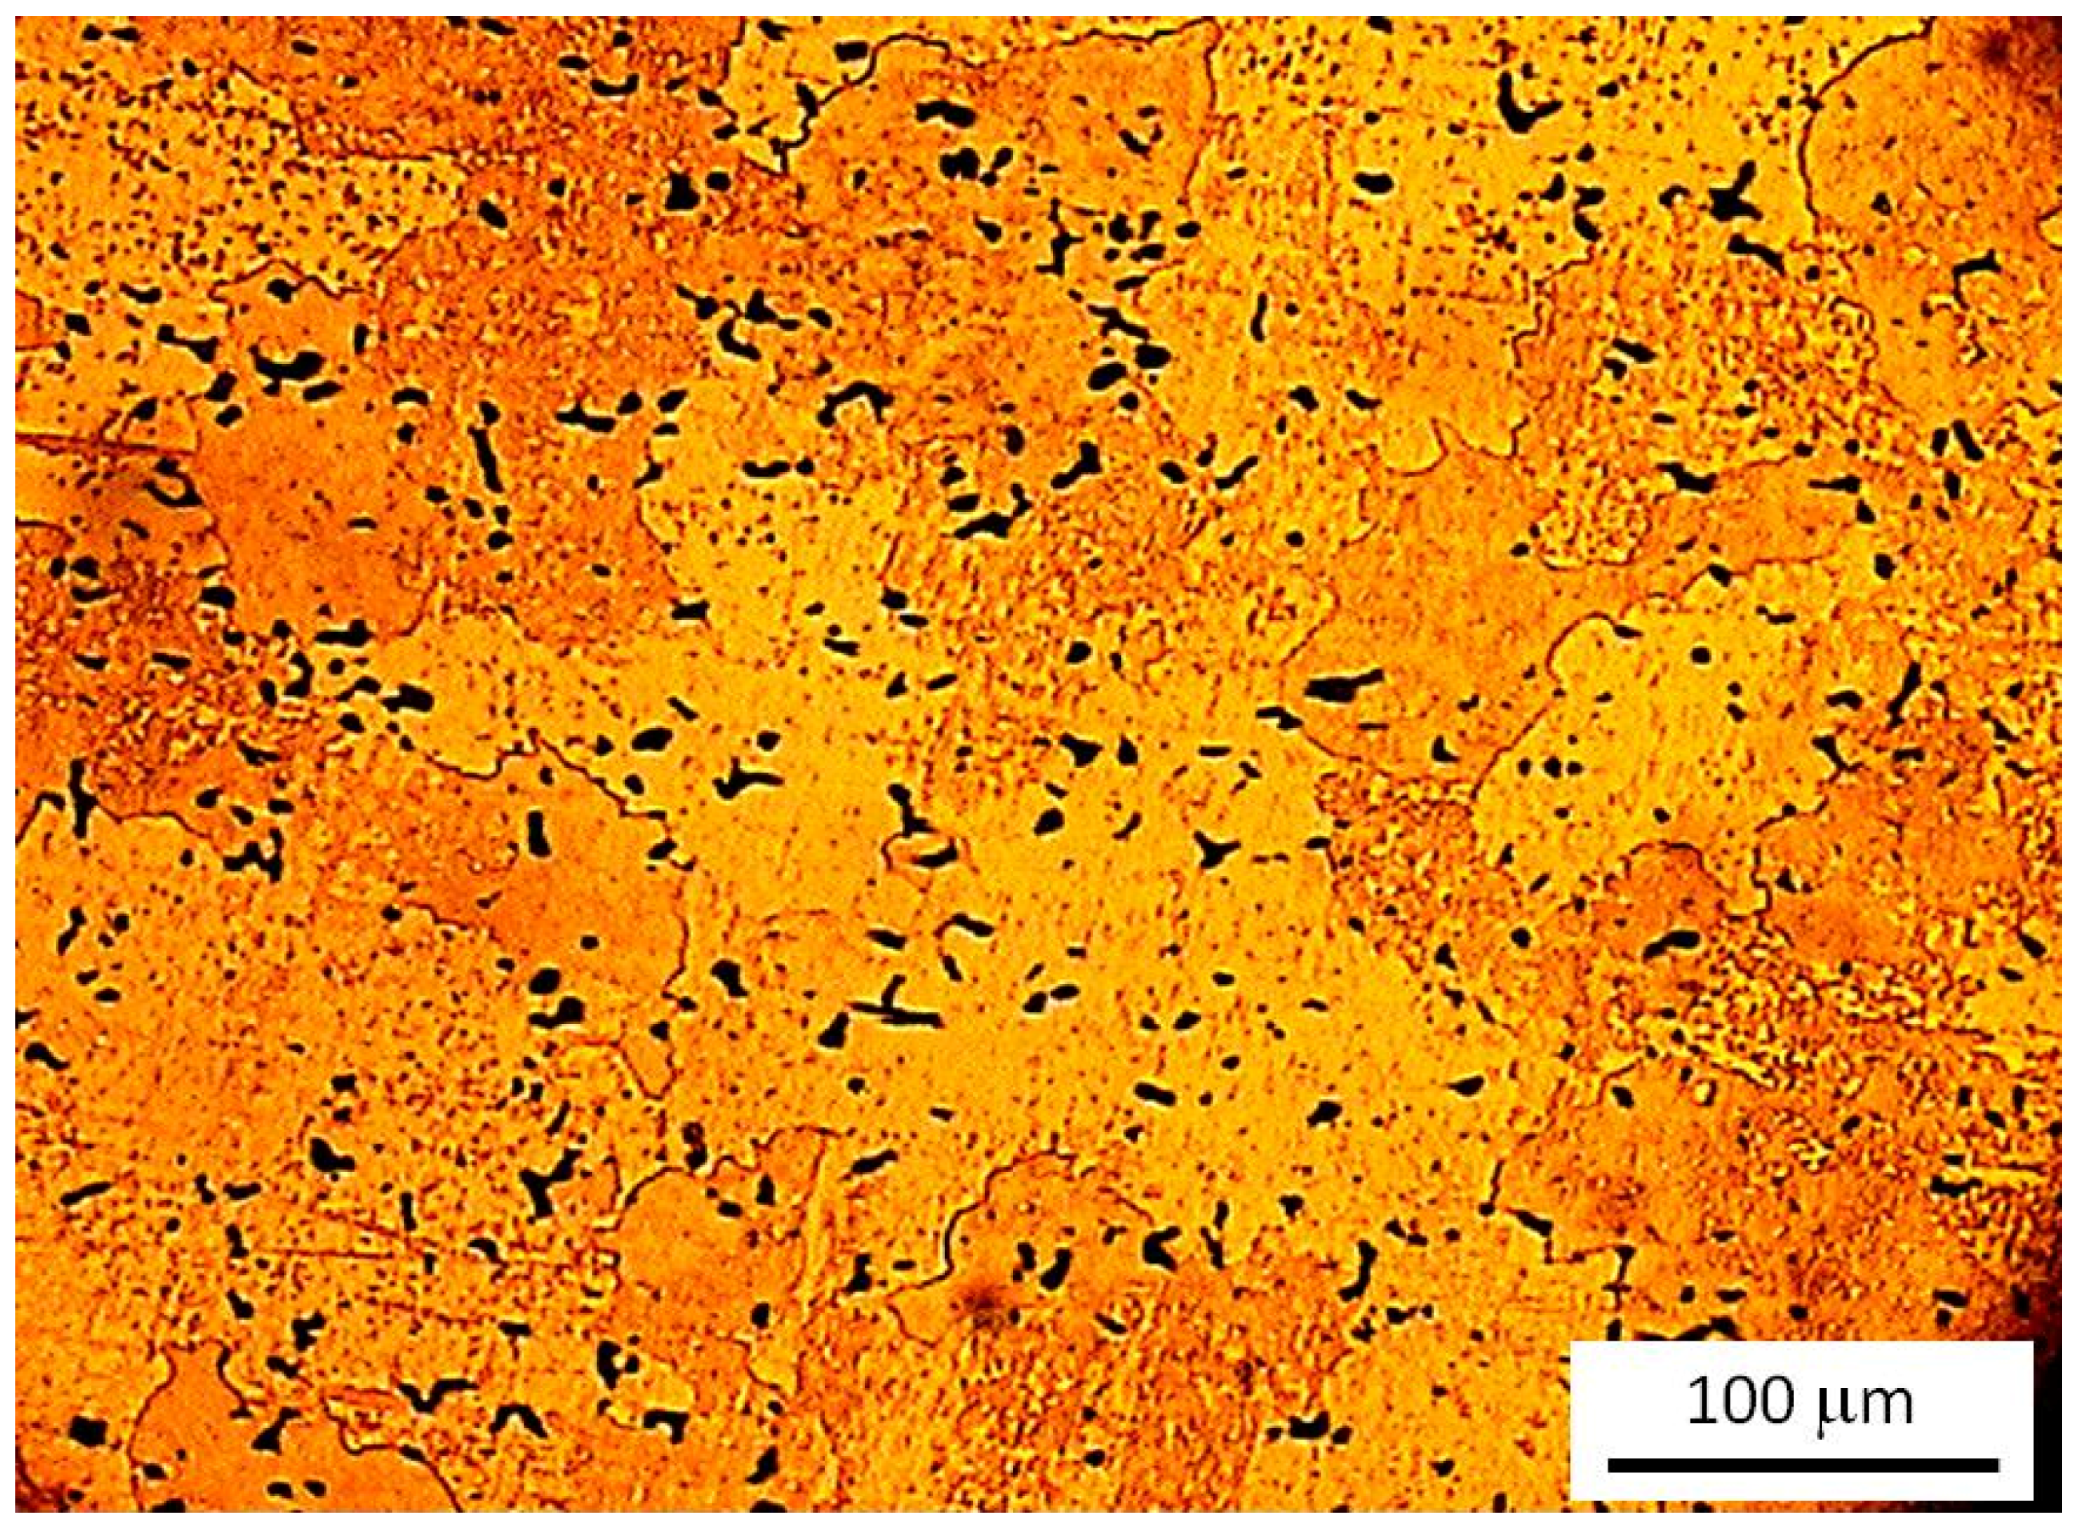
2.1. Sample Characteristics
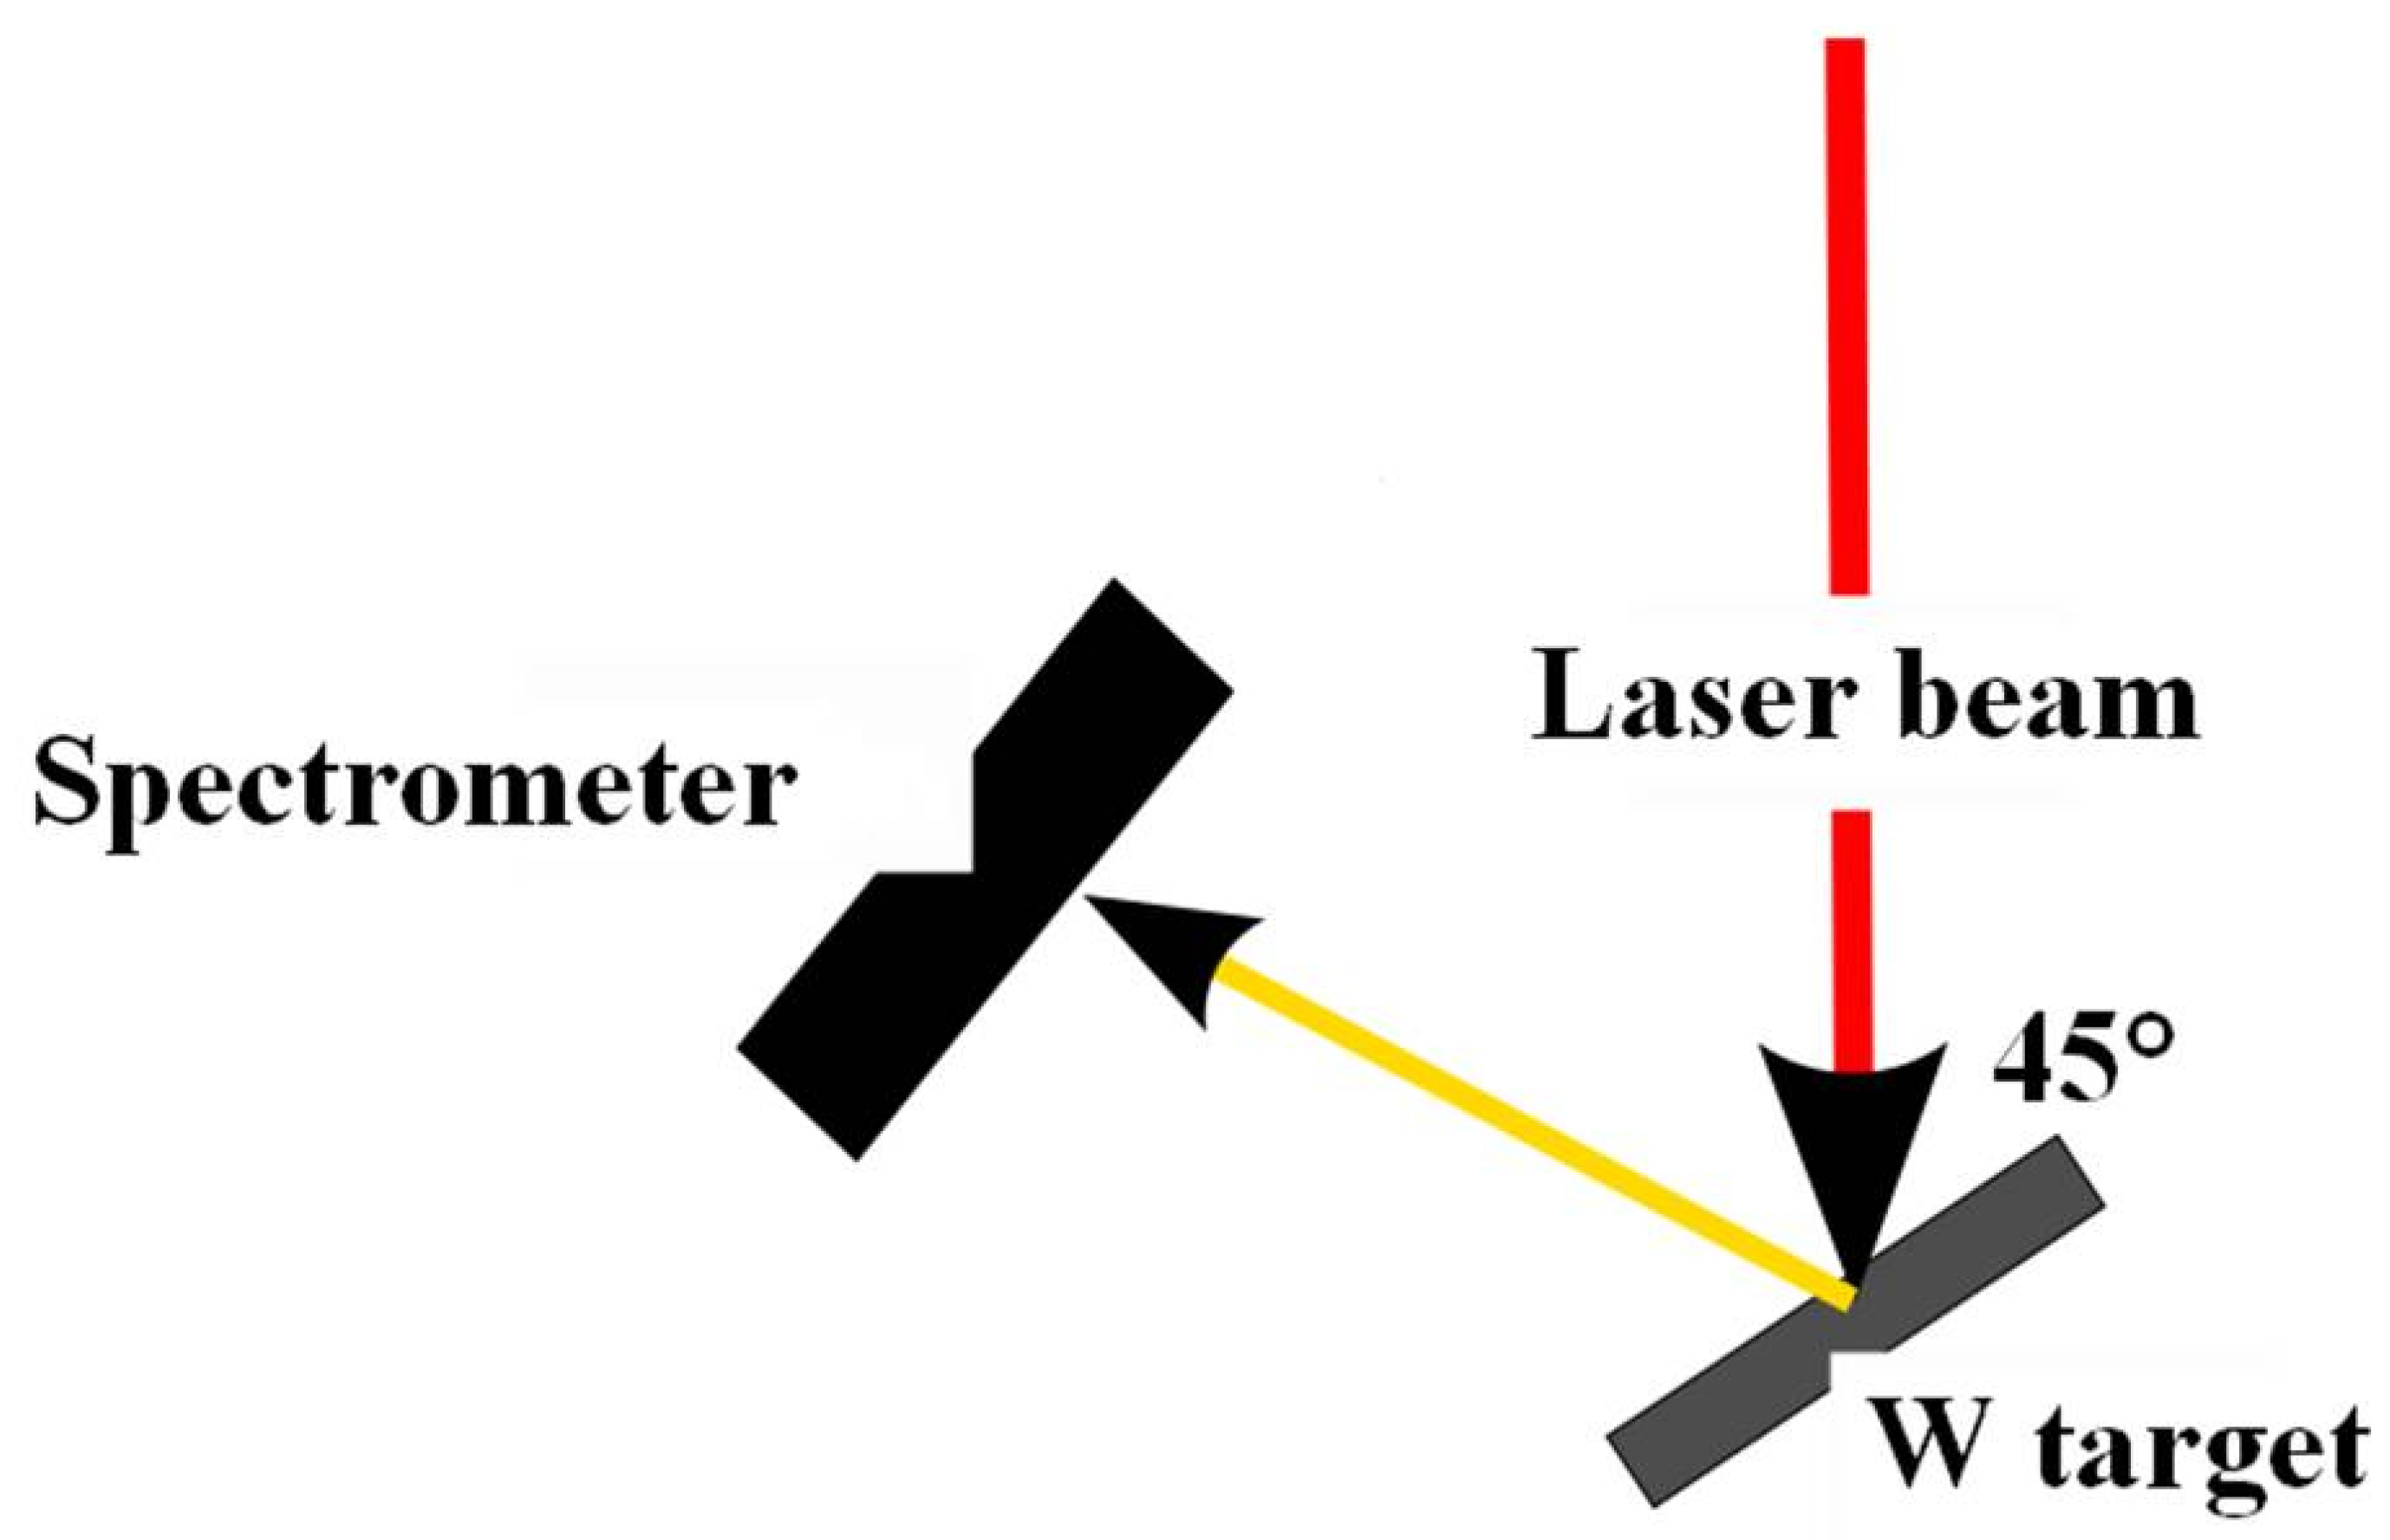
2.2. Laser Source
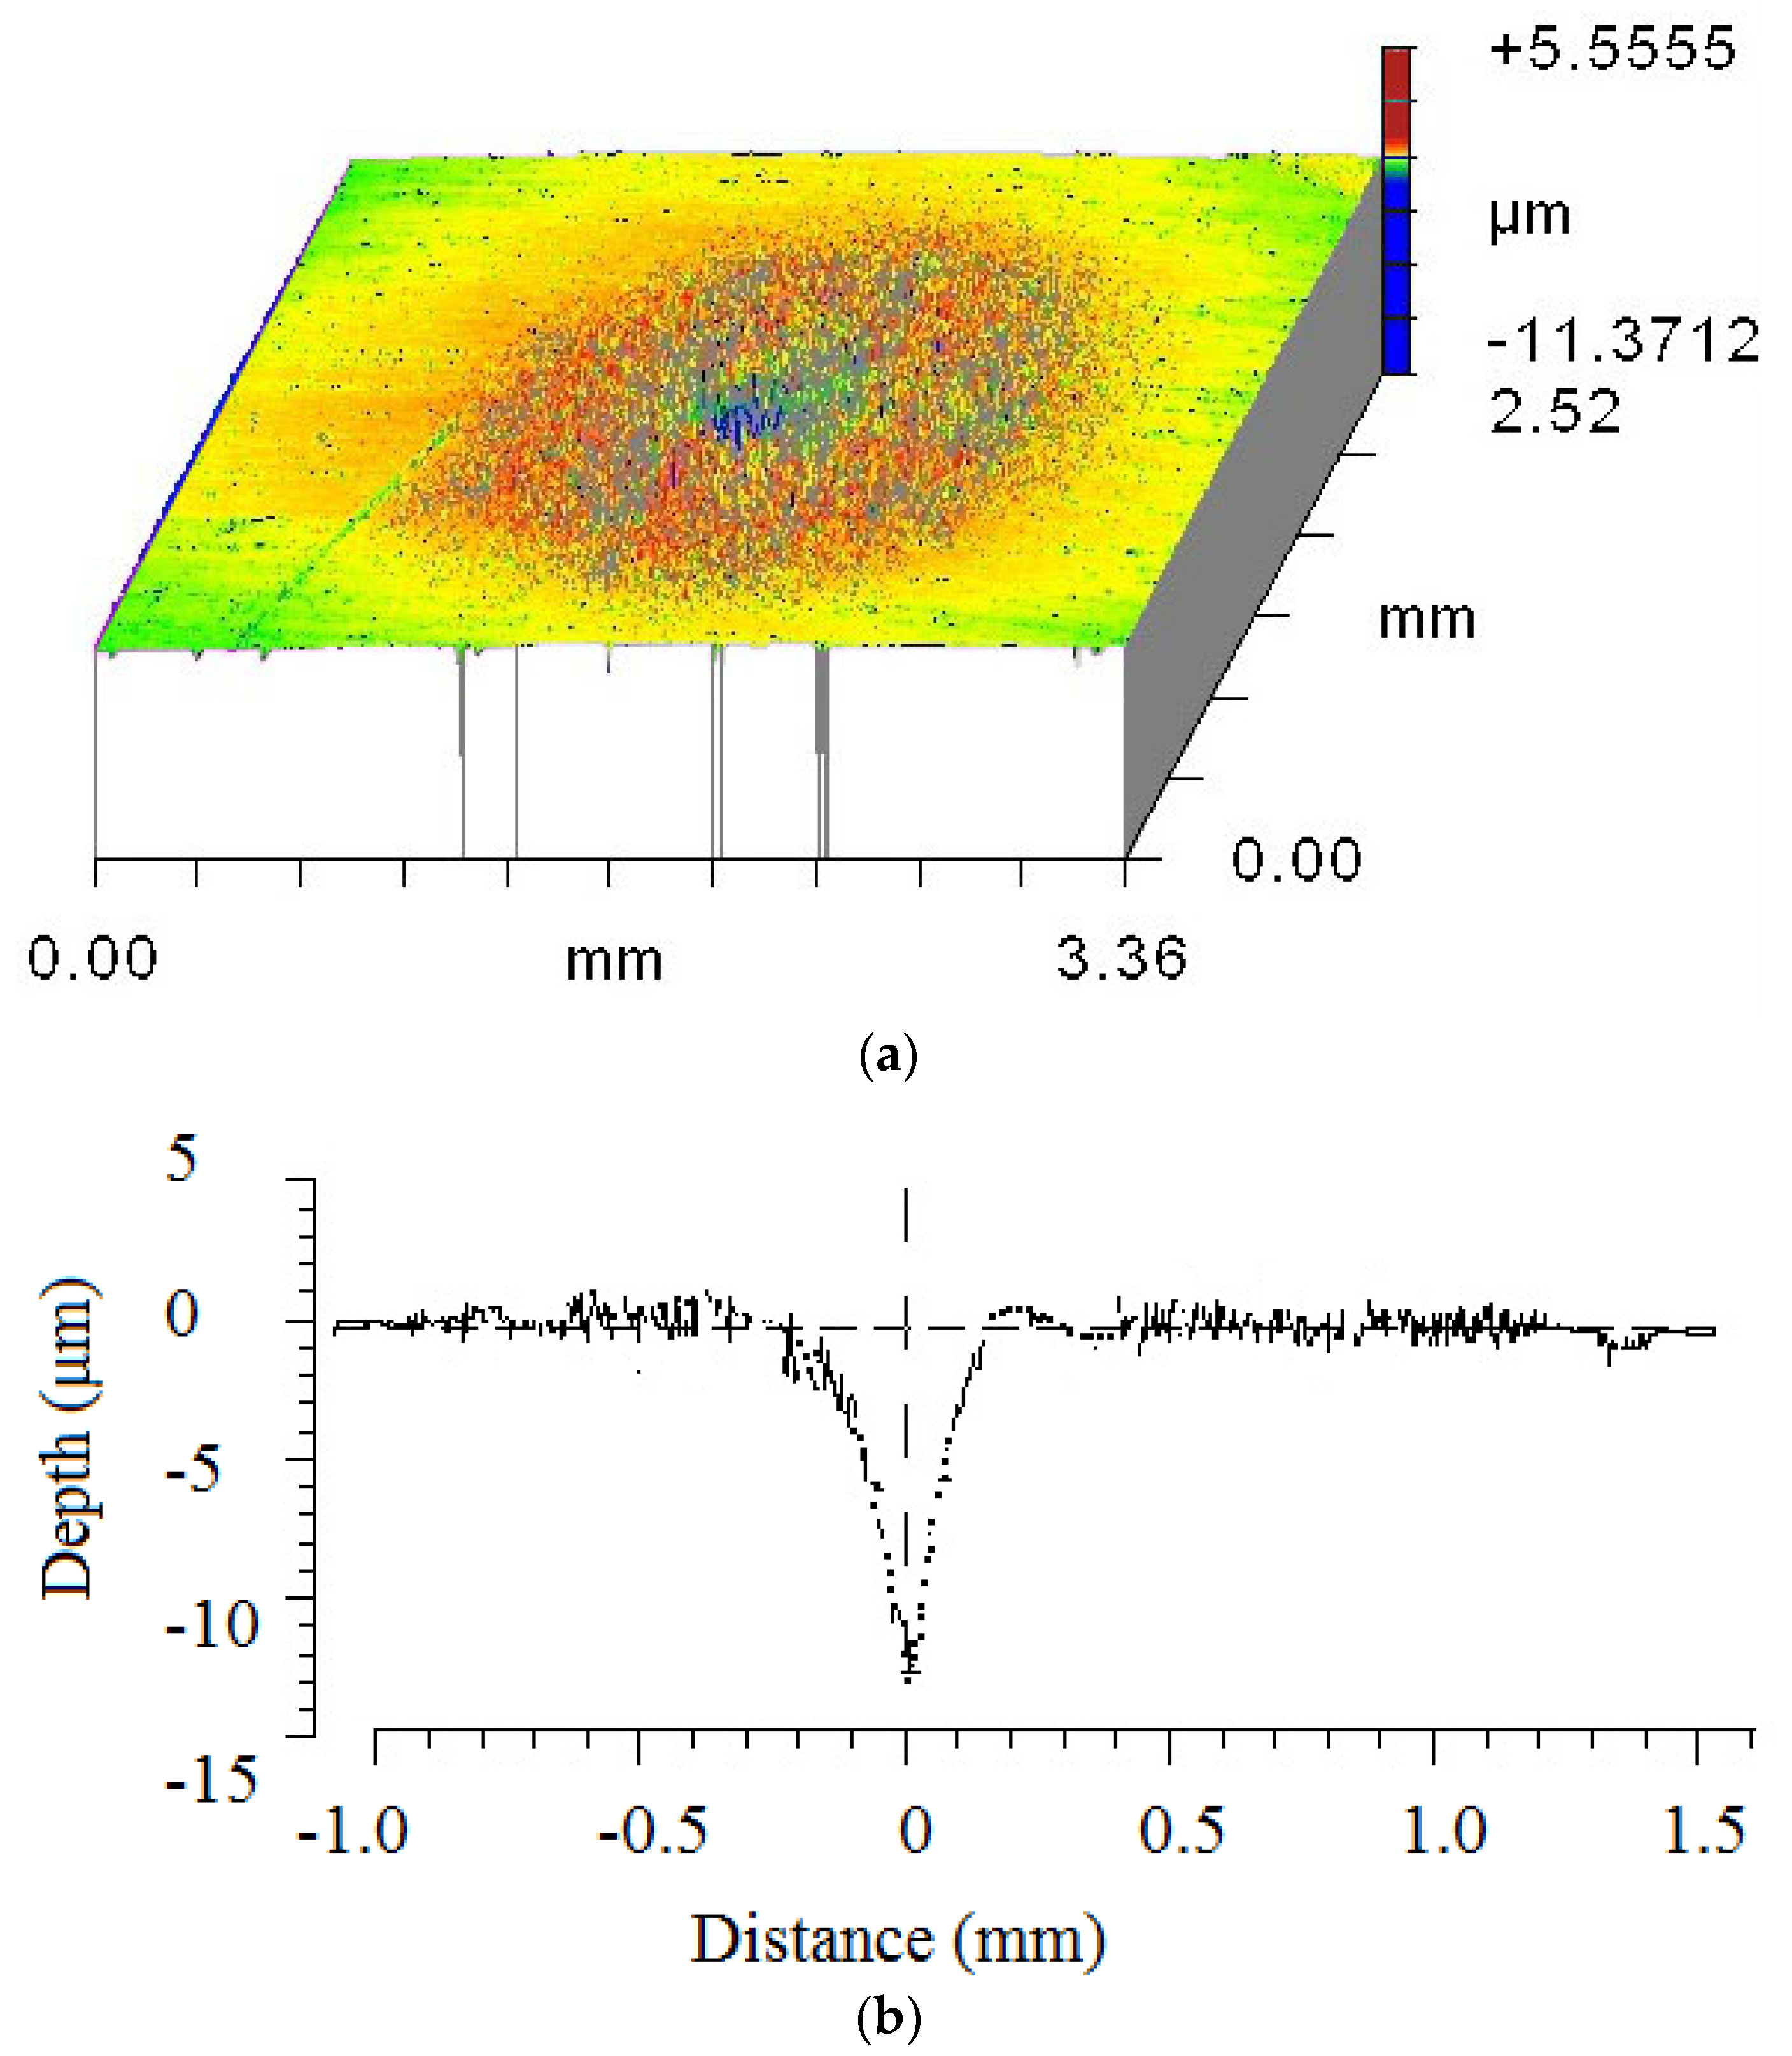
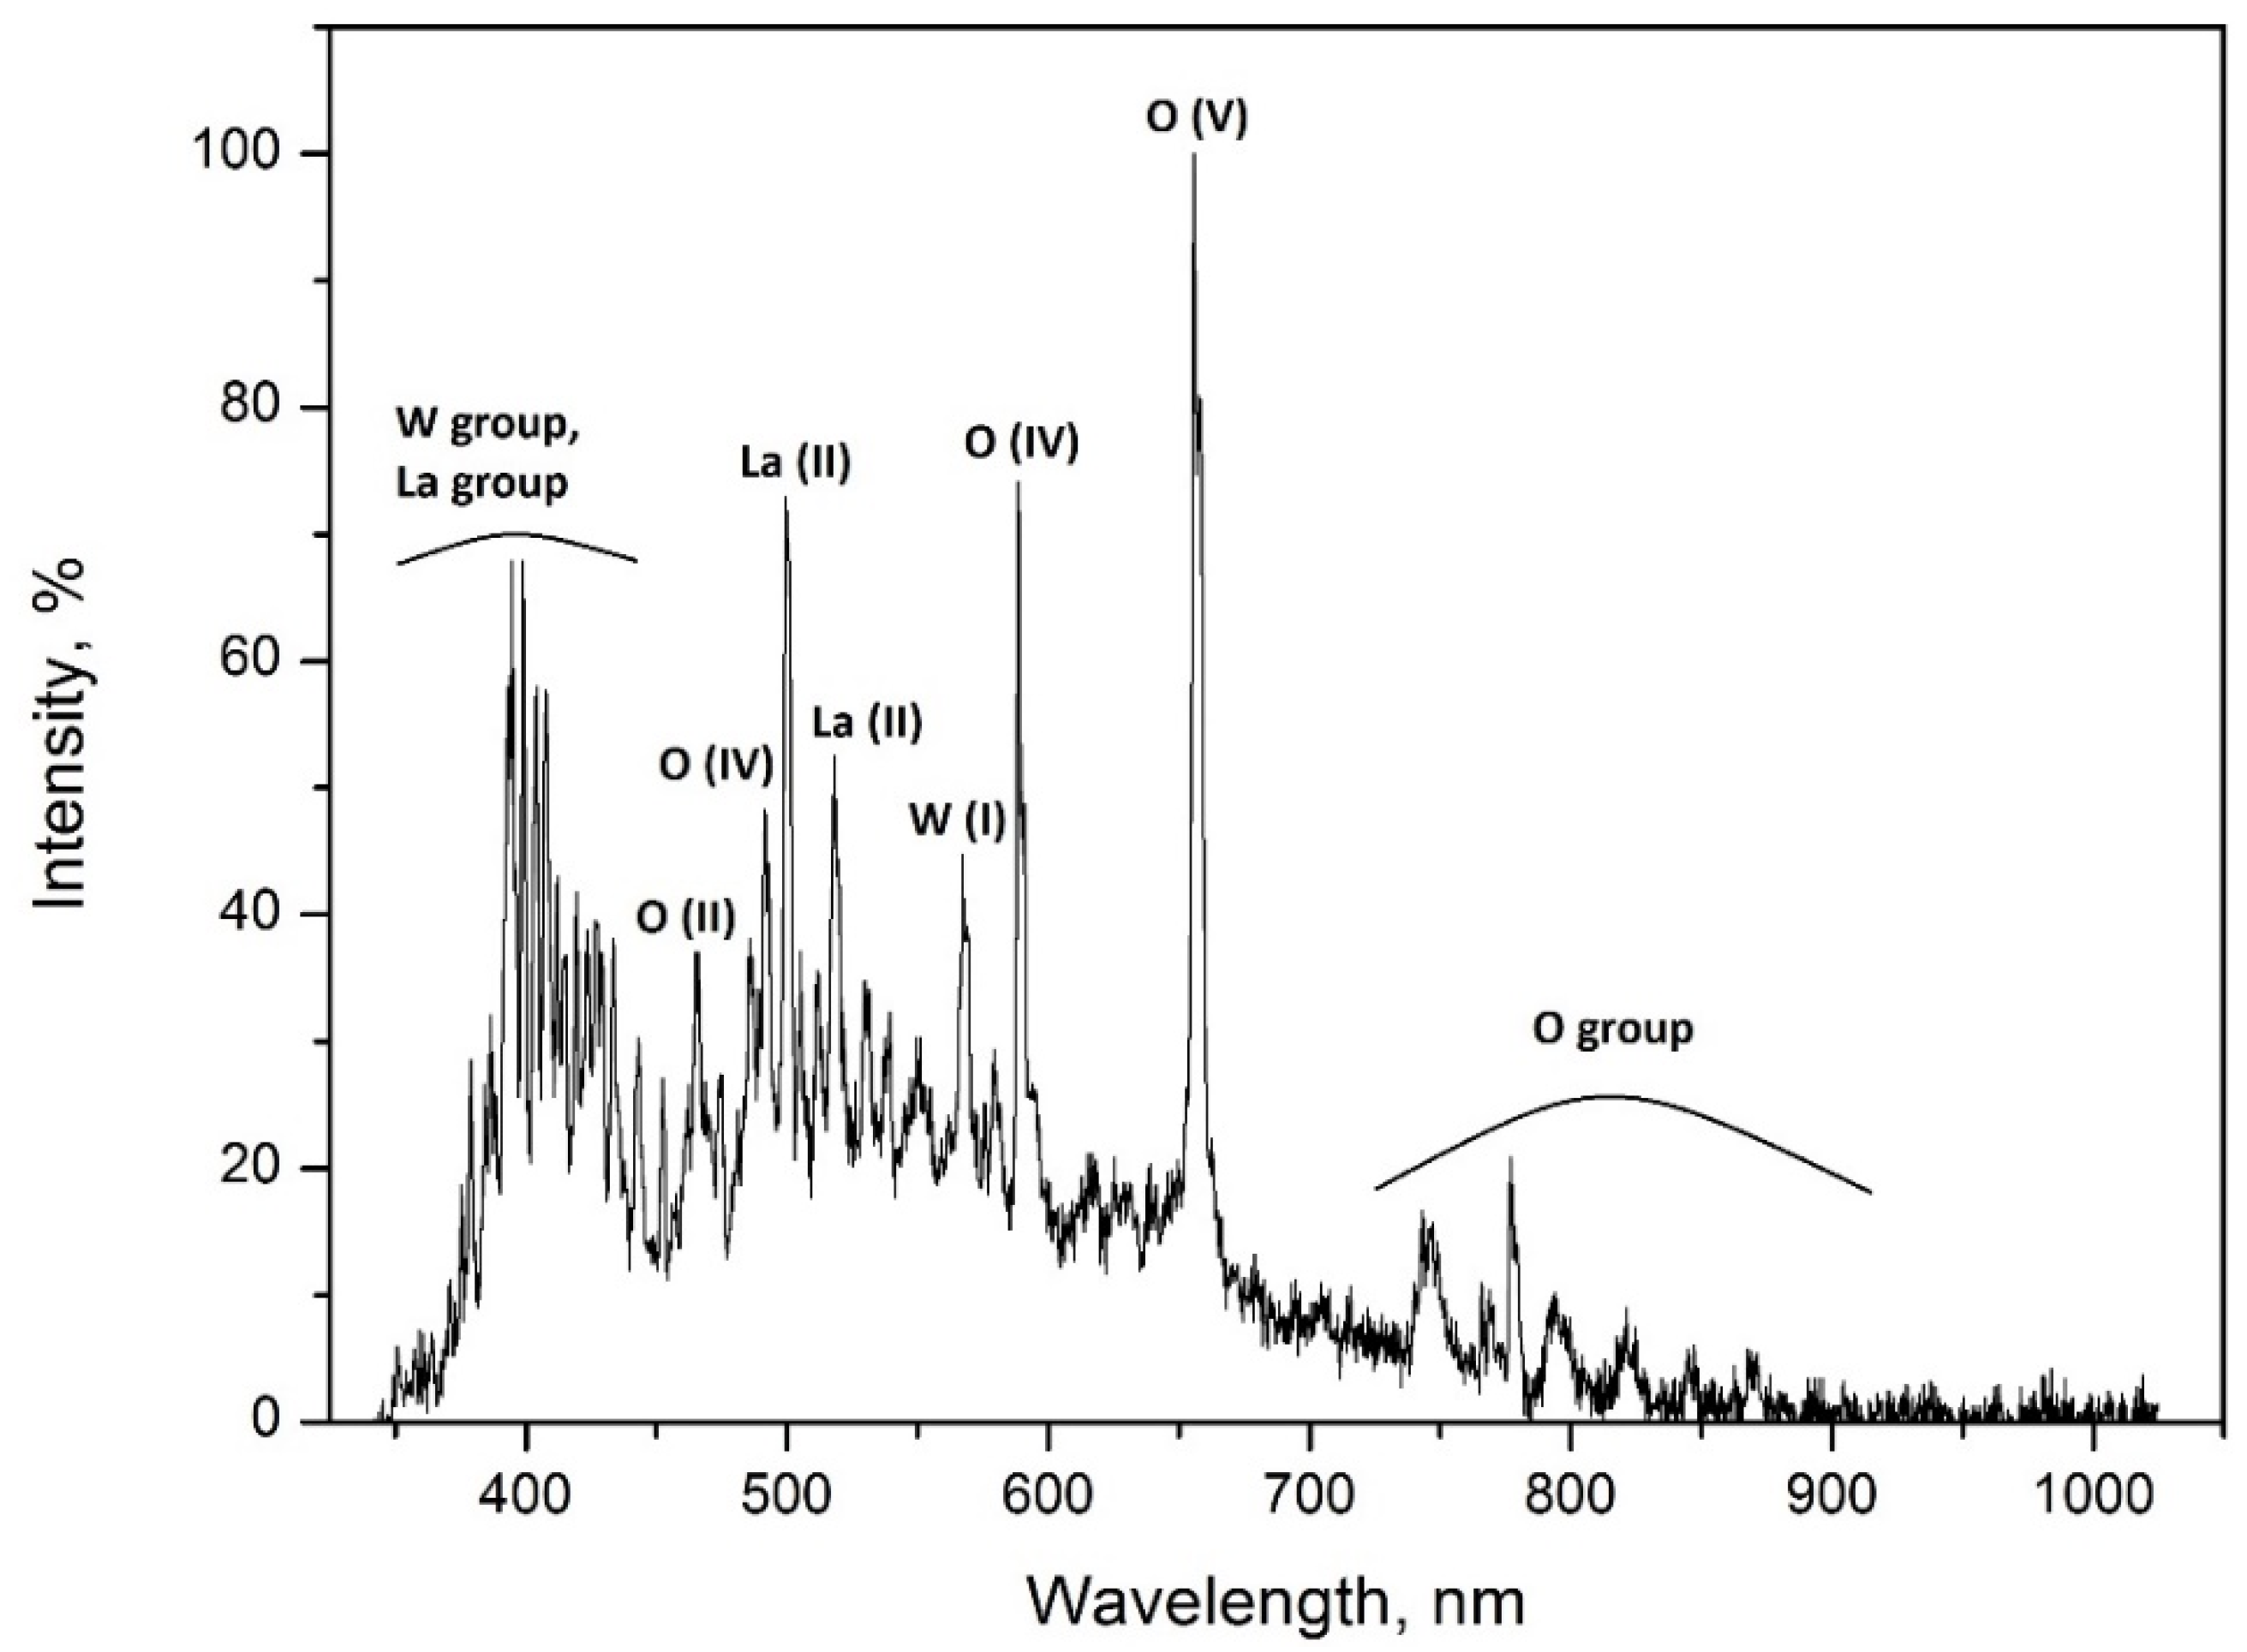
3. Results
4. Discussion
5. Conclusions
- (i)
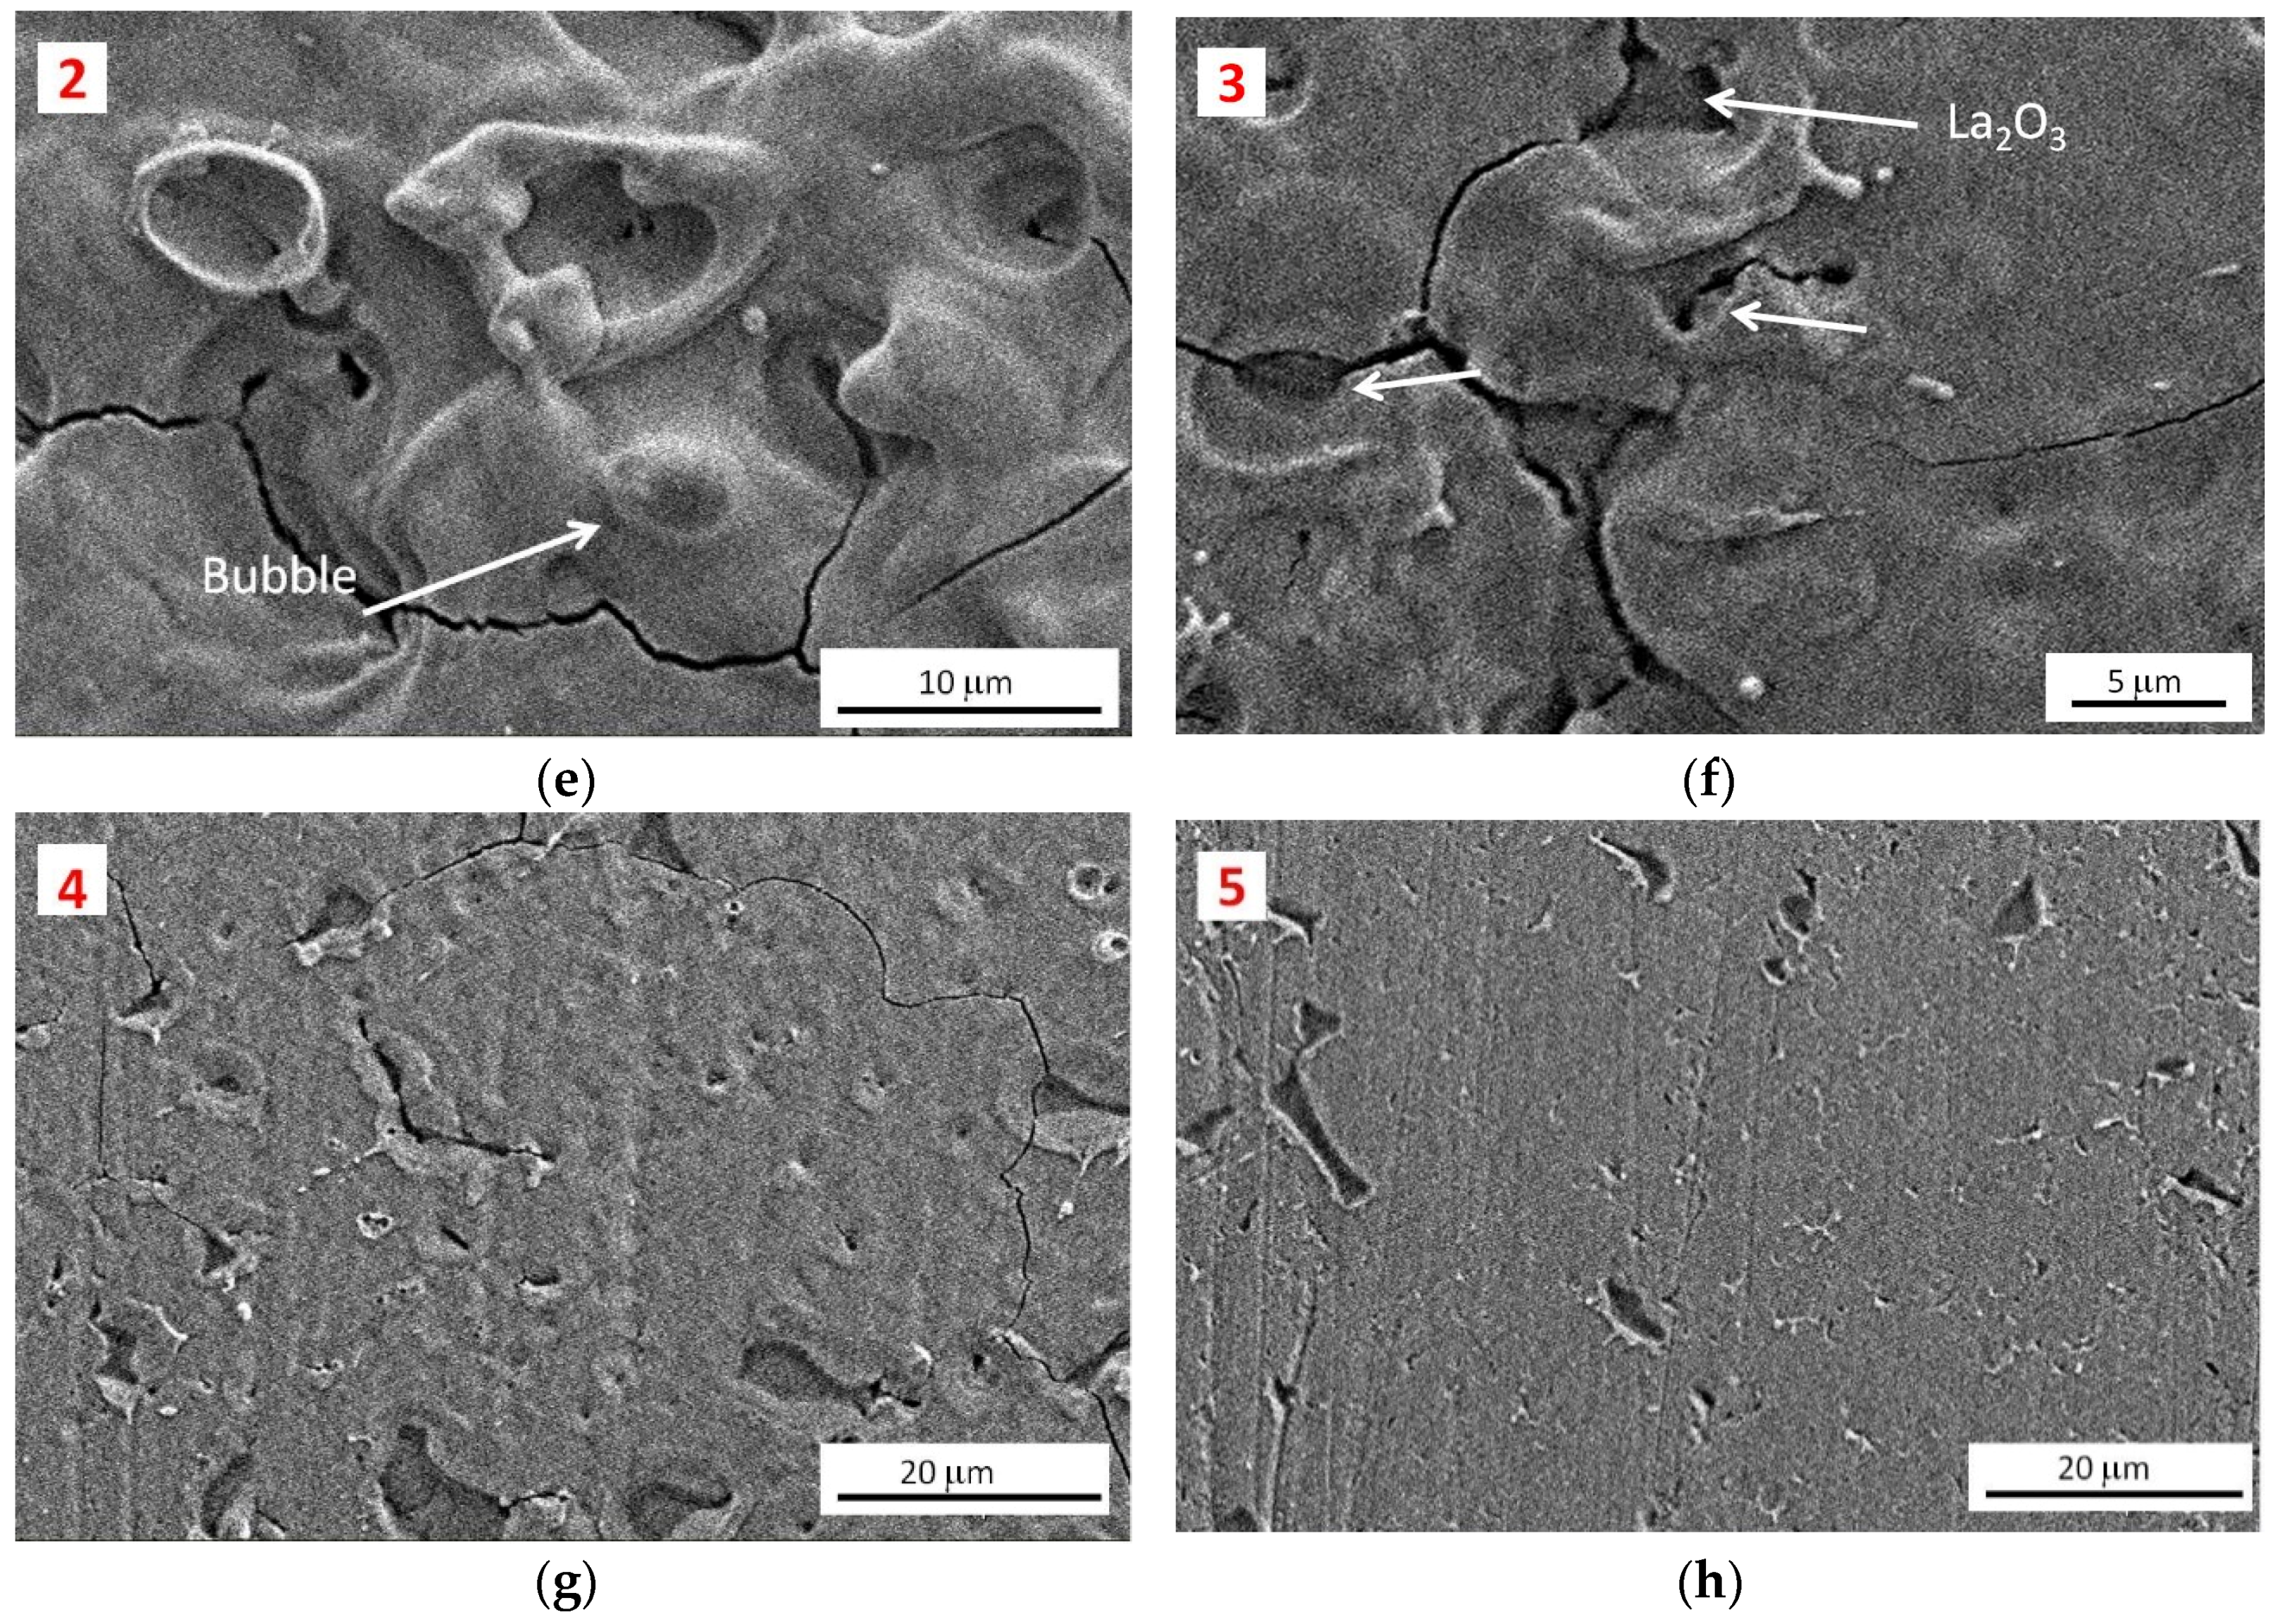
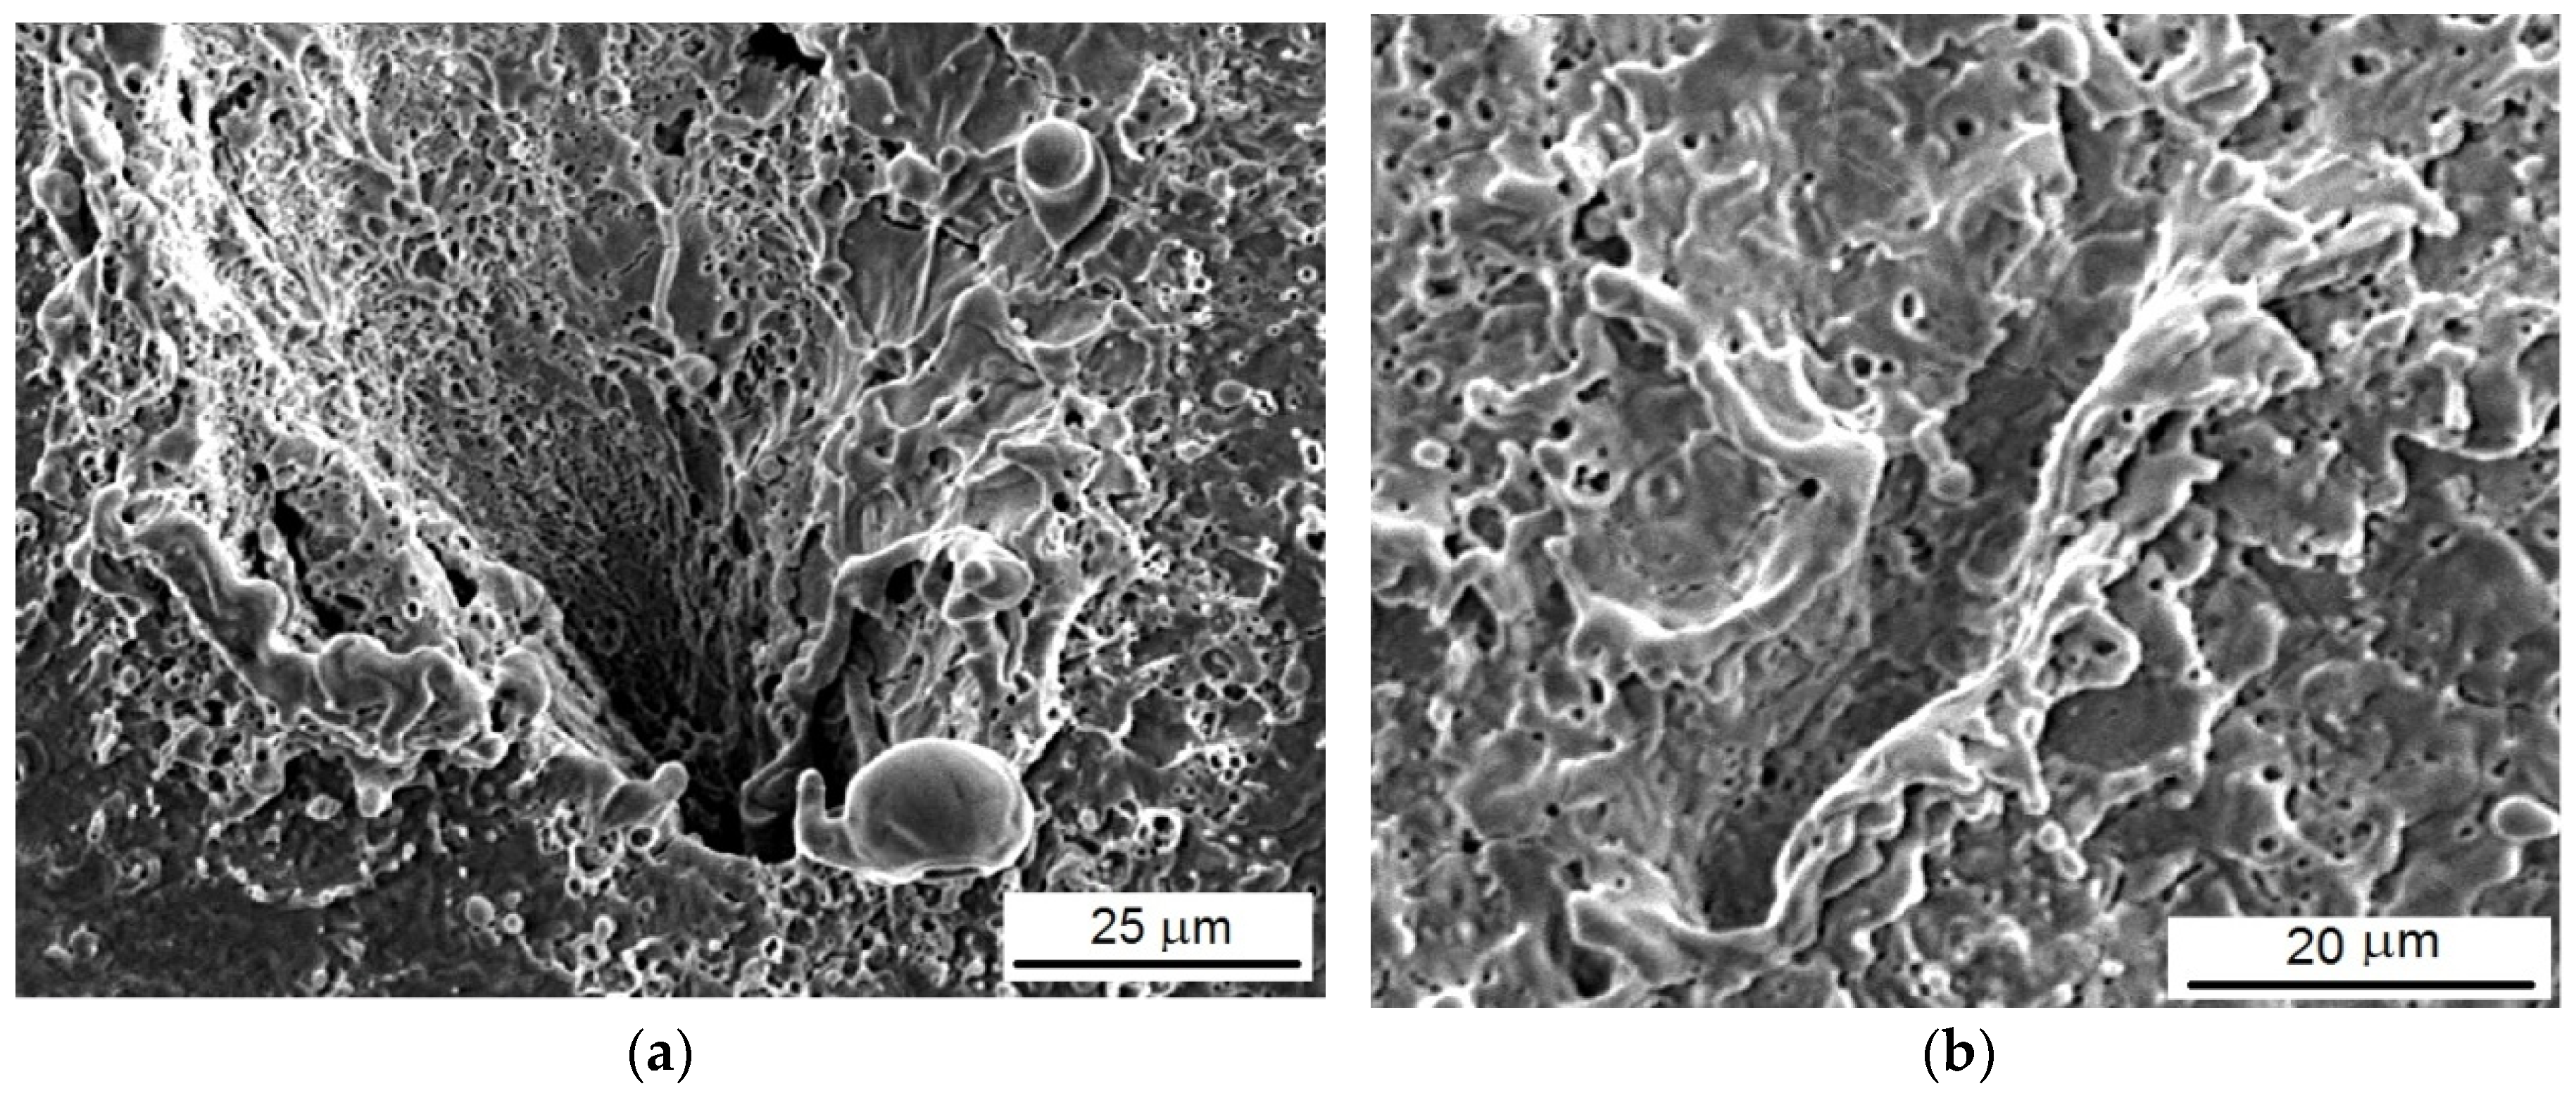
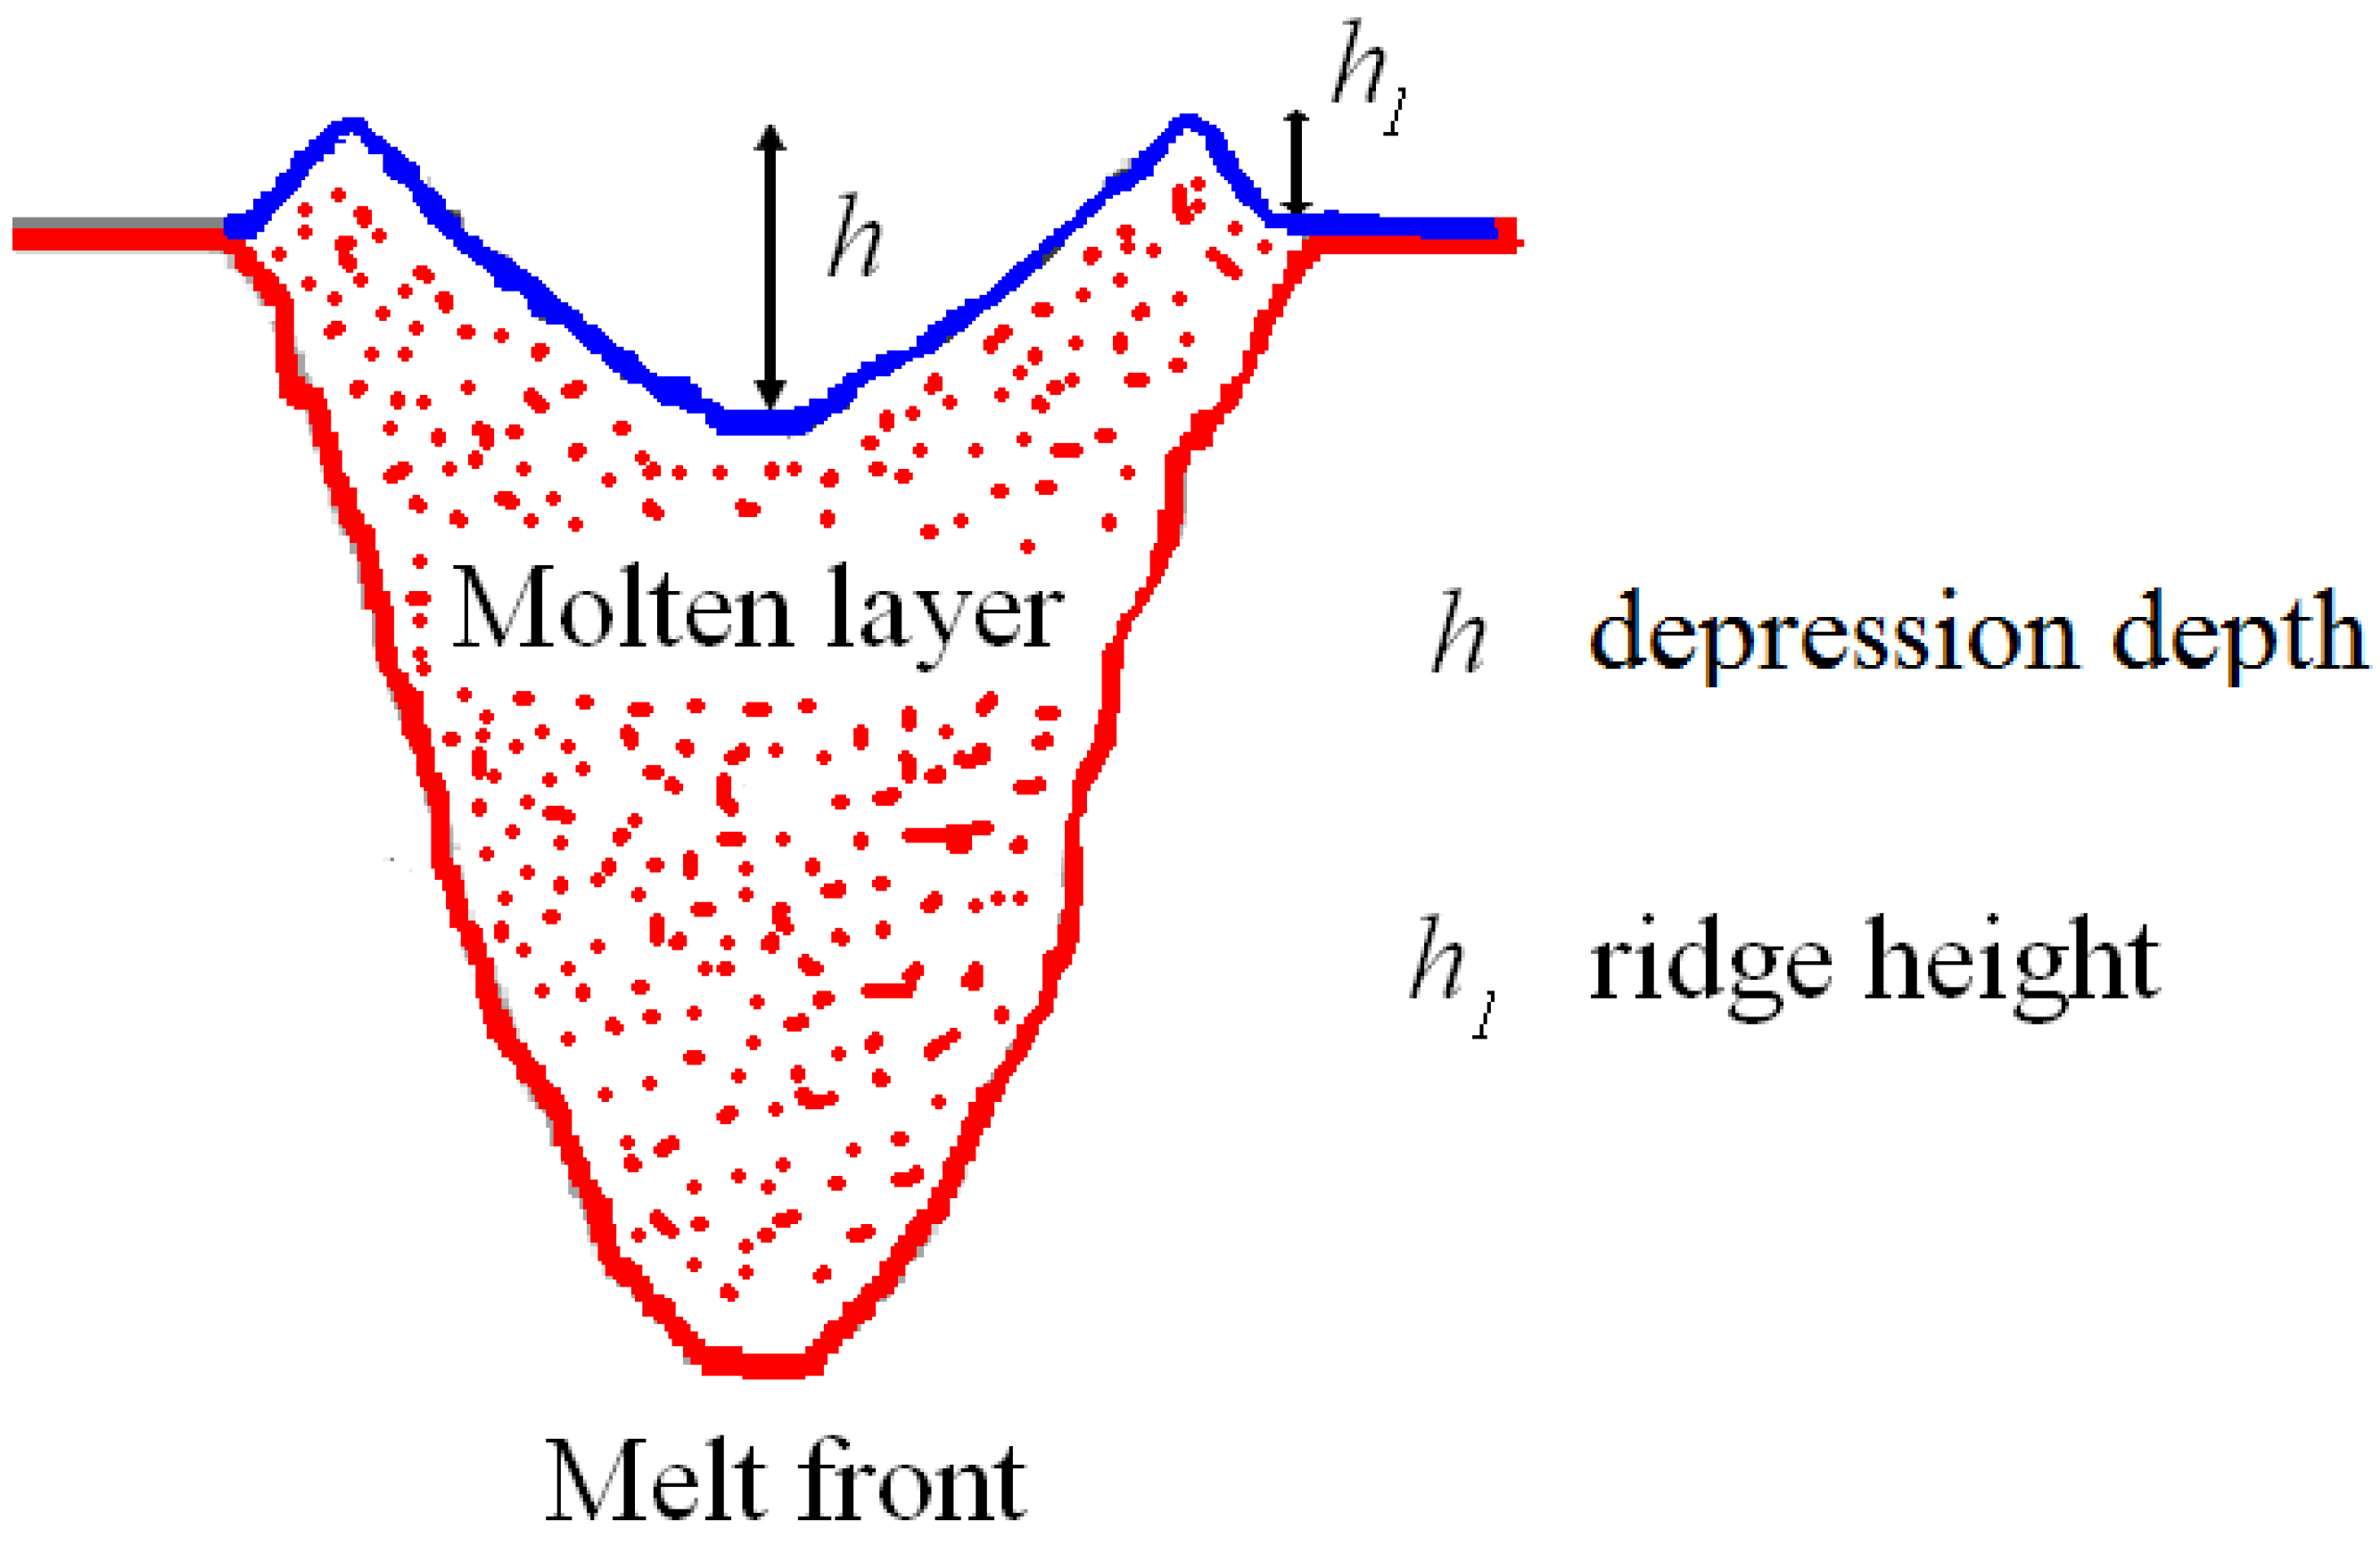
- An erosion zone forms in the laser spot central area surrounded by a ridge owing to the movement of molten metal. La2O3 particles are not observed in the depression because part of them is ejected while other parts melt and re-solidify together to W. In comparison to pure W the depression is larger and shallower because the particles act as scattering centers for phonons and heating is more homogeneously diffused. The morphology of depression and ridge are also affected by a different surface tension, increased by the presence of La and O atoms inside liquid W.
- (ii)
- Hemispherical cavities of about 10 μm and deposited droplets are features typical of the ridge zone. The cavities are due to the bursting of bubbles that induces droplet ejection and subsequently deposits of some of them on the surface of the sample. Such morphology differs remarkably from that of pure W where depression and ridges are scattered with a lot of small pores (≤1 μm). The explanation is given in terms of number of bubble nucleation sites for W vapor bubbles: in the case of W-1% La2O3 La-gas bubbles moving across the pool of liquid metal swallow up impurity clusters by coalescence and reduce the number of potential nucleation sites with the result of a few bubbles growing then to reach a larger size.
- (iii)
- In the zone surrounding the depression ridge thermal stresses due to fast heating and successive cooling produce an extended network of micro-cracks that often follow grain boundaries. This phenomenon was observed also in pure W.
Author Contributions
Conflicts of Interest
References
- Riccardi, B.; Pizzuto, A.; Orsini, A.; Libera, S.; Visca, E.; Bertamini, L.; Casadei, F.; Severini, E.; Montanari, R.; Vesprini, R.; et al. Tungsten thick coatings for plasma facing components. Fusion Technol. 1998, 1, 223. [Google Scholar]
- Roedig, M.; Kuehnlein, W.; Linke, J.; Merola, M.; Rigal, E.; Schedler, B.; Visca, E. Investigation of tungsten alloys as plasma facing materials for the ITER divertor. Fusion Eng. Des. 2002, 61–62, 135–140. [Google Scholar] [CrossRef]
- Bolt, H.; Barabash, V.; Krauss, W.; Linke, J.; Neu, R.; Suzuki, S.; Nyoshida, N. Materials for the plasma-facing components of fusion reactors. J. Nucl. Mater. 2004, 329–333, 66–73. [Google Scholar] [CrossRef]
- Lipa, M.; Durocher, A.; Tivey, R.; Huber, T.; Schedler, B.; Weigert, J. The use of copper alloy CuCrZr as a structural material for actively cooled plasma facing and in vessel components. Fusion Eng. Des. 2005, 75–79, 469–476. [Google Scholar] [CrossRef]
- Uytdenhouwen, I.; Decreton, M.; Hirai, T.; Linke, J.; Pintsuk, G.; Van Oost, G. Influence of recrystallization on thermal shock resistance of various tungsten grades. J. Nucl. Mater. 2007, 363–365, 1099–1103. [Google Scholar] [CrossRef]
- Montanari, R.; Riccardi, B.; Volterri, R.; Bertamini, L. Characterisation of plasma sprayed W-coatings on a CuCrZr alloy for nuclear fusion reactor applications. Mater. Lett. 2002, 52, 100–105. [Google Scholar] [CrossRef]
- Riccardi, B.; Montanari, R.; Casadei, M.; Costanza, G.; Filacchioni, G.; Moriani, A. Optimisation and characterisation of tungsten thick coatings on copper based alloy substrates. J. Nucl. Mater. 2006, 352, 29–35. [Google Scholar] [CrossRef] [Green Version]
- Kaciulis, S.; Mezzi, A.; Montanari, R.; Ucciardello, N.; Volterri, R. Composition of plasma-sprayed tungsten coatings on CuCrZr alloy. Surf. Interface Anal. 2010, 42, 1197–1200. [Google Scholar] [CrossRef]
- Yahiro, Y.; Mitsuhara, M.; Tokunakga, K.; Yoshida, N.; Hirai, T.; Ezato, K.; Suzuki, S.; Akiba, M.; Nakashima, H. Characterization of thick plasma spray tungsten coating on ferritic/martensitic steel F82H for high heat flux armor. J. Nucl. Mater. 2009, 386–388, 784–788. [Google Scholar] [CrossRef]
- Huang, J.; Li, X.; Chen, J.; Liu, Y.; Qi, B.; Jiang, S.; Wang, X.; Luo, G. Vacuum annealing enhances the properties of a tungsten coating deposited on copper by atmospheric plasma spray. J. Nucl. Mater. 2013, 432, 16–19. [Google Scholar]
- Park, J.Y.; Yang, S.J.; Jin, Y.G.; Chong, R.P.; Kim, G.H.; Han, H.N. Effect of annealing with pressure on tungsten film properties fabricated by atmospheric plasma spray. Met. Mater. Int. 2014, 20, 1037–1042. [Google Scholar] [CrossRef]
- Maier, H. Tungsten erosion in the baffle and outboard regions of the ITER-like ASDEX Upgrade divertor. J. Nucl. Mater. 2004, 335, 515–519. [Google Scholar] [CrossRef]
- Maier, H.; Neu, R.; Greuner, H.; Hopf, C.; Matthews, G.F.; Piazza, G.; Hirai, T.; Counsell, G.; Courtois, X.; Mitteau, R.; et al. Tungsten coatings for the JET ITER-like wall project. J. Nucl. Mater. 2007, 363–365, 1246–1250. [Google Scholar] [CrossRef]
- Hirai, T.; Kreter, A.; Linke, J.; Malzbender, J.; Ohgo, T.; Philipps, V.; Pintsuk, G.; Pospieszczyk, A.; Sakawa, Y.; Sergienko, G. Critical heat flux loading experiments on CVD-W coating in the TEXTOR tokamak. Fusion Eng. Des. 2006, 81, 175–180. [Google Scholar] [CrossRef]
- Coenen, J.W.; Bazylev, B.; Brezinsek, S.; Philipps, V.; Hirai, T.; Kreter, A.; Linke, J.; Sergienko, G.; Pospieszczyk, A.; Tanabe, T.; et al. Tungsten melt layer motion and splashing on castellated tungsten surfaces at the tokamak TEXTOR. J. Nucl. Mater. 2011, 415, 78–82. [Google Scholar] [CrossRef]
- Krieger, K.; Lunt, T.; Dux, R.; Janzer, A.; Kallenbach, A.; Müller, H.W.; Neu, R.; Pütterich, T.; Rohde, V. Induced tungsten melting events in the divertor of ASDEX Upgrade and their influence on plasma performance. J. Nucl. Mater. 2011, 415, 297–300. [Google Scholar] [CrossRef]
- Tanabe, T.; Wada, M.; Ohgo, T.; Philipps, V.; Rubel, M.; Huber, A.; Von Seggern, J.; Ohya, K.; Pospieszczyk, A.; Schweer, B. Application of tungsten for plasma limiters in TEXTOR. J. Nucl. Mater. 2000, 283–287, 1128–1133. [Google Scholar] [CrossRef]
- Krieger, K.; Maier, H.; Neu, R. Conclusions about the use of tungsten in the divertor of ASDEX Upgrade. J. Nucl. Mater. 1999, 266–269, 207–216. [Google Scholar] [CrossRef]
- Kubkowska, M.; Skladnik-Sadowska, E.; Kwiatkowski, R.; Malinowski, K.; Kowalska-Strzeciwilk, E.; Paduch, M.; Sadowski, M.J.; Pisarczyk, T.; Chodukowski, T.; Kalinowska, Z.; et al. Investigation of interactions of intense plasma streams with tungsten and carbon fibre composite targets in the PF-1000 facility. Phys. Scr. 2014, 2014, T161. [Google Scholar] [CrossRef]
- Merola, M.; Bobin-Vastra, I.; Cardella, A.; Febvre, M.; Giancarli, L.; Salavy, J.F.; Salito, A.; Schedler, B.; Vieider, G. Manufacturing of a full scale baffle prototype for ITER with a CFC and W plasma spray armour. Fusion Eng. Des. 2000, 49–50, 289–294. [Google Scholar] [CrossRef]
- Zhou, Z.J.; Song, S.X.; Du, J.; Ge, C.C. High heat flux testing of tungsten plasma facing materials. J. Nucl. Mater. 2007, 367–370, 1468–1471. [Google Scholar] [CrossRef]
- Sadowski, M.J.; Skladnik-Sadowska, E.; Malinowski, K.; Wołowskib, J.; Marchenkoc, A.K.; Tsarenkoc, A.V. Investigation of laser interaction with tungsten target by means of time-resolved optical spectroscopy. Radiat. Effects Defects Solids 2008, 163, 569–577. [Google Scholar] [CrossRef]
- Chong, F.L.; Chen, J.L.; Li, J.G.; Zheng, X.B. Failure behaviors of vacuum plasma sprayed tungsten coatings for plasma facing application. J. Nucl. Mater. 2009, 386–388, 780–783. [Google Scholar] [CrossRef]
- Kurehashi, H.; Ohtsuka, Y.; Ueda, Y.; Kurishita, H. Effects of repeated short heat pulses on tungsten. J. Nucl. Mater. 2011, 417, 487–490. [Google Scholar] [CrossRef]
- Linke, J.; Loewenhoff, T.; Massaut, V.; Pintsuk, G.; Ritz, G.; Rodig, M.; Schmidt, A.; Thomser, C.; Uytdenhouwen, I.; Vasechko, V.; et al. Performance of different tungsten grades under transient thermal loads. Nucl. Fusion 2011, 51, 073017. [Google Scholar] [CrossRef]
- Farid, N.; Harilal, S.S.; El-Atwani, O.; Ding, H.; Hassanein, A. Experimental simulation of materials degradation of plasma-facing components using lasers. Nucl. Fusion 2014, 54, 012002. [Google Scholar] [CrossRef]
- Huber, A.; Arakcheev, A.; Sergienko, G.; Steudel, I.; Wirtz, M.; Burdakov, A.V.; Coenen, J.W.; Kreter, A.; Linke, J.; Mertens, P.; et al. Investigation of the impact of transient heat loads applied by laser irradiation on ITER-grade tungsten. Phys. Scr. 2014, T159, 014005. [Google Scholar] [CrossRef]
- Ouaras, K.; Colina Delacqua, L.; Quirós, C.; Lombardi, G.; Redolfi, M.; Vrel, D.; Hassouni, K.; Bonnin, X. Experimental studies of the interactions between a hydrogen plasma and a carbon or tungsten wall. J. Phys. Conf. Ser. 2015, 591, 012029. [Google Scholar] [CrossRef]
- Richetta, M.; Gaudio, P.; Montanari, R.; Pakhomova, E.; Antonelli, L. Laser Pulse Simulation of High Energy Transient Thermal Loads on Bulk and Plasma Sprayed W for NFR. Mater. Sci. Forum 2017, 879, 1576–1581. [Google Scholar] [CrossRef]
- Montanari, R.; Pakhomova, E.; Pizzoferrato, R.; Richetta, M.; Varone, A. Laser pulse effects on plasma sprayed and bulk tungsten. Metals 2017, 7, 454. [Google Scholar] [CrossRef]
- Lassner, E.; Schubert, W.D. Tungsten; Kluwer Academic/Plenum: New York, NY, USA, 1999. [Google Scholar]
- Kitsunai, Y.; Kurishita, H.; Kayano, H.; Hiraoka, Y.; Igarashi, T.; Takida, T. Microstructure and impact properties of ultra-fine grained tungsten alloys dispersed with TiC. J. Nucl. Mater. 1999, 271–272, 423–428. [Google Scholar] [CrossRef]
- Leichtfried, G. Thoria-free ODS-tungsten materials. Proceeding of the Second International Conference on Tungsten and Refractory Metals, Metal Powder Industries Federation, McLean, VA, USA, 17–19 October 1994. [Google Scholar]
- Smid, I.; Akiba, M.; Vieider, G.; Ploechl, L. Development of tungsten armor and bonding to copper for plasma-interactive components. J. Nucl. Mater. 1998, 258–263, 160–172. [Google Scholar] [CrossRef]
- Uytdenhouwen, I.; Massaut, V.; Linke, J.; Van Oost, G. Plasma wall interaction phenomena on tungsten armour materials for fusion applications. In Proceedings of the International Youth Nuclear Congress 2008, Interlaken, Switzerland, 20–26 September 2008. [Google Scholar]
- Yuan, Y.; Greuner, H.; Böswirth, B.; Luo, G.-N.; Fu, B.Q.; Xu, H.Y.; Liu, W. Melt layer erosion of pure and lanthanum doped tungsten under VDE-like high heat flux loads. J. Nucl. Mater. 2013, 438, S229–S232. [Google Scholar] [CrossRef]
- Yuan, Y.; Greuner, H.; Böswirth, B.; Kriegerb, K.; Luoc, G.-N.; Xua, H.Y.; Fua, B.Q.; Lia, M.; Liua, W. Recrystallization and grain growth behavior of rolled tungsten under VDE-like short pulse high heat flux loads. J. Nucl. Mater. 2012, 433, 523–530. [Google Scholar] [CrossRef]
- Zhang, X.; Yan, Q. Morphology evolution of La2O3 and crack characteristic in W–La2O3 alloy under transient heat loading. J. Nucl. Mater. 2014, 451, 283–291. [Google Scholar] [CrossRef]
- JCPDS-International Centre for Diffraction Data. Version 2.14. 1987–1994. Available online: http://www.icdd.com/ (accessed on 27 May 2018).
- Francucci, M.; Gaudio, P.; Martellucci, S.; Richetta, M. Spectroscopy Methods and Applications of the Tor Vergata Laser-Plasma Facility Driven by GW-Level Laser System. Int. J. Spectrosc. 2011, 2011, 792131. [Google Scholar] [CrossRef]
- Shi, Y.; Miloshevsky, G.; Hassanein, A. Boiling induced macroscopic erosion of plasma facing components in fusion devices. Fusion Eng. Des. 2011, 86, 155–162. [Google Scholar] [CrossRef]
- Chicbkov, B.N.; Momma, C.; Nolte, S.; Alvensleben, F.; Tünnerman, A. Femtosecond, picosecond and nanosecond laser ablation of solids. Appl. Phys. A 1996, 63, 109–115. [Google Scholar] [CrossRef]
- Goldstein, H.W.; Walsh, P.N.; White, D. Rare earths: I. Vaporization of La2O3 and Nd2O3: Dissociation energies of gaseous LaO and NdO. J. Phys. Chem. 1961, 65, 1400–1404. [Google Scholar] [CrossRef]
- Grundy, A.N.; Hallstedt, B.; Gauckler, L.J. Thermodynamic assessment of the lanthanum–oxygen system. J. Phase Equilib. 2001, 22, 105–113. [Google Scholar] [CrossRef]
- Hirai, T.; Kühnlein, W.; Linke, J.; Sergienko, G. Dynamic erosion of plasma facing materials under ITER relevant thermal shock loads in the electron beam facility, JUDITH. In Proceedings of the 20th IAEA Fusion Energy Conference, Vilamoura, Portugal, 1–6 November 2004; IAEA Publications: Brussels, Belgium, 2004; pp. 111–2004. [Google Scholar]
- Taniguchi, M.; Nakamura, K.; Sato, K.; Ezato, K.; Yokoyama, K.; Akiba, M. Disruption Erosion Tests on La2O3 Containing Tungsten Material. Fusion Technol. 2001, 39, 890–893. [Google Scholar]
- Swartz, E.T.; Pohl, R.O. Thermal boundary resistance. Rev. Mod. Phys. 1989, 61, 605–668. [Google Scholar] [CrossRef]
- Nan, C.-W.; Birringer, R.; Clarke, D.R.; Gleiter, H. Effective thermal conductivity of particulate composites with interfacial thermal resistance. J. Appl. Phys. 1997, 81, 6692–6699. [Google Scholar] [CrossRef]
- Ho, C.Y.; Powell, R.W.; Liley, P.E. Thermal Conductivity of the Elements: A Comprehensive Review; American Institute of Physics: New York, NY, USA, 1974; pp. 1–796. [Google Scholar]
- Johnson, R.C.; Little, W.A. Experiments on the Kapitza resistance. Phys. Rev. 1963, 130, 596–604. [Google Scholar] [CrossRef]
- Bazylev, B.; Wuerz, H. Melt layer erosion of metallic armour targets during off-normal events in tokamaks. J. Nucl. Mater. 2002, 307–311, 69–73. [Google Scholar] [CrossRef]
- Atterton, D.V.; Hoar, T.P. Surface tension of liquid metals. Nature 1951, 167, 602. [Google Scholar] [CrossRef] [PubMed]
- Yuan, Y.; Xu, B.; Fu, B.Q.; Greuner, H.; Boswirth, B.; Xu, H.Y.; Li, C.; Jia, Y.Z.; Qu, S.L.; Luo, G.-N.; et al. Suppression of cavitation in melted tungsten by doping with lanthanum oxide. Nucl. Fusion 2014, 54, 1–9. [Google Scholar] [CrossRef]


| Properties of W-1% La2O3 | |
|---|---|
| Density (g·cm−3) | 18.90 |
| Thermal expansion coefficient α (K−1) | 4.7 × 10⁻⁶ |
| Thermal conductivity (W·cm−1 K−1) | 1.20 |
| Thermal diffusivity (cm2·s−1) | 0.472 |
| Young’s modulus E (GPa) | 410 |
| Poisson’s ratio | 0.3 |
| Yield Stress σY (MPa) | 765 |
| Ultimate Tensile Strength (MPa) | 870 |
| Micro-hardness HV | 410 |
| {hkl} | Random | W-1% La2O3 |
|---|---|---|
| 110 | 100 | 100 |
| 200 | 15 | 27 |
| 211 | 23 | 40 |
© 2018 by the authors. Licensee MDPI, Basel, Switzerland. This article is an open access article distributed under the terms and conditions of the Creative Commons Attribution (CC BY) license (http://creativecommons.org/licenses/by/4.0/).
Share and Cite
Gaudio, P.; Montanari, R.; Pakhomova, E.; Richetta, M.; Varone, A. W-1% La2O3 Submitted to a Single Laser Pulse: Effect of Particles on Heat Transfer and Surface Morphology. Metals 2018, 8, 389. https://doi.org/10.3390/met8060389
Gaudio P, Montanari R, Pakhomova E, Richetta M, Varone A. W-1% La2O3 Submitted to a Single Laser Pulse: Effect of Particles on Heat Transfer and Surface Morphology. Metals. 2018; 8(6):389. https://doi.org/10.3390/met8060389
Chicago/Turabian StyleGaudio, Pasquale, Roberto Montanari, Ekaterina Pakhomova, Maria Richetta, and Alessandra Varone. 2018. "W-1% La2O3 Submitted to a Single Laser Pulse: Effect of Particles on Heat Transfer and Surface Morphology" Metals 8, no. 6: 389. https://doi.org/10.3390/met8060389
APA StyleGaudio, P., Montanari, R., Pakhomova, E., Richetta, M., & Varone, A. (2018). W-1% La2O3 Submitted to a Single Laser Pulse: Effect of Particles on Heat Transfer and Surface Morphology. Metals, 8(6), 389. https://doi.org/10.3390/met8060389