Article

Fabrication of a Porous Metal via Selective Phase Dissolution in Al-Cu Alloys

by
Juan Vargas-Martínez
1,
John E. Estela-García
2,
Oscar Marcelo Suárez
3,* and
Carmen A. Vega
4
1
Department of Mechanical Engineering, University of Puerto Rico-Mayagüez, Mayagüez, PR 00681, USA
2
Department of Chemical Engineering, University of Puerto Rico-Mayagüez, Mayagüez, PR 00681, USA
3
Department of Engineering Science and Materials, University of Puerto Rico-Mayagüez, Mayagüez, PR 00681, USA
4
Department of Chemistry, University of Puerto Rico-Mayagüez, Mayagüez, PR 00681, USA
*
Author to whom correspondence should be addressed.
Metals 2018, 8(6), 378; https://doi.org/10.3390/met8060378
Submission received: 16 April 2018 / Revised: 17 May 2018 / Accepted: 21 May 2018 / Published: 24 May 2018
(This article belongs to the Special Issue Nanoporous Metals)

Abstract

:
Through free corrosion, a new low cost porous material was successfully fabricated by removing a single phase of a binary aluminum-copper alloy. This selective phase dissolution was carried out an Al-Al2Cu eutectic alloy of the Al-Cu binary system and additionally for two hypereutectic compositions. The porosity of the material depends on the microstructure formed upon solidification. For this reason, several solidification methods were studied to define the most convenient in terms of uniformity and refinement of the average pore and ligament sizes. The samples were corroded in a 10% v/v NaOH aqueous solution, which demonstrated to be the most convenient in terms of time involved and resulting porosity conditions after the corrosion process. The porosity was measured through analysis of secondary electron images. The effectiveness of the process was verified using X-ray diffraction, which showed that, under the proposed methodology, there was complete removal of one of the phases, namely the aluminum one.

1. Introduction

Metallic surface modifications are common research topics studied to increase surface area and achieve innovative materials properties for advanced applications in engineering [1]. Chemical dealloying through selective dissolution and controlled chemical corrosion is a straightforward process enabling nanoporous structures where atoms are prone to exit the surface, creating pores [2].
Nanoporous copper (NPC), prepared mostly from binary alloys, has recently attracted much attention. For instance, copper-manganese [3], corroded at various solution concentrations of HCl, resulted in pore sizes of 15–200 nm. Using copper-zinc binary alloys can yield pores of 200–300 nm [4], 10–150 nm [5] and microporous copper (MPC) of 2 µm pores [6]. Further, vacuum dealloying can create large-size pores, without chemical dissolution. The most used alloys to form NPC are aluminum-copper ones, usually corroded in an alkaline medium, e.g., NaOH, to remove aluminum. Nevertheless, an acid medium (HCl) and a neutral solution (NaCl) have also proved effective; both are employed at different concentrations with the precursor alloy composition from 25 to 50 atomic percent of copper. These results are summarized in Table 1.
Al-Cu alloys can be treated to produce efficient microstructures to enhance pertinent reactions on the porous surface. Therefore, controlling processing parameters upon selective dissolution allows attaining specific pore sizes. Further, in the dealloying process, the precursor grain size affects the pore/ligament size in the resulting nanoporous metals (NPMs). Consequently, the solidification process of the precursor alloy becomes important to adjust the optimal grain size of that nanoporous metal. For this reason, rapid solidification is the most desirable method to achieve smaller grain size. One remarkable tool is the single roller melt spinning apparatus that renders grains of the samples of a few tens of micrometers [9,10,11,12]. After the precursor ingots solidify, they are annealed to stabilize their microstructure [7]. Thus far, the surveyed literature only reports aluminum as the sacrificial element. One report claims nanoporous aluminum (NPAl) [14] with pores smaller than 100 nm in diameter using HNO3 under an applied electrical field. Currently, NPMs continue being widely studied due to their previously mentioned properties and applications. In summary, great strides have been made in NPMs, which are part of a relatively new branch of materials science with few decades of development.
Despite all those NPM developments, an in-depth literature survey reveals that those NPMs have not been previously prepared from precursor aluminum–copper alloys bearing intermetallic phases. Consequently, new NPM materials could be derived from binary Al-Cu alloys having the intermetallic θ phase (Al2Cu) and Al solid solution in appropriate volumetric amounts. Obtaining this material may lead to an innovative catalyst material with properties never seen before.
This study sought to create a porous metal through selective dissolution of aluminum-copper alloys with different compositions as precursors and to monitor the effect of the precursor microstructure in the dissolution under free corrosion. To expand the prospective application landscape, we needed to determine the optimal composition of a binary Al-Cu precursor alloy that yields high porosity in the nanoporous metal. The present endeavor also established the effect of the solution concentration upon dissolution and characterized the dealloyed samples by scanning electron microscope (SEM) to determine the ligament and pore size. Finally, X-ray diffraction (XRD) determined the effectiveness of the dissolution process by revealing the phases present before and after dissolution.

2. Materials and Methods

2.1. Selection of Chemical Compositions

In selective dissolution, solidification affects the samples corrosion as, under free corrosion, the sample porosity will depend on the microstructure of the alloy. Further, assuming total dissolution of one phase in the alloy, the minimum theoretical volume of the remaining phase should be at least fifty volume percent. In an aluminum-copper alloy, this can be achieved, for instance, using the 33.2 wt % Cu eutectic composition. Accordingly, this study focused on three compositions where the θ phase volume percent is 50, 55, and 60; such compositions are Al-17.52 at % Cu, Al-19.17 at % Cu, and Al-20.80 at % Cu, respectively. Hereinafter, we call these compositions EC, HC-1 and HC-2, for eutectic composition, hypereutectic composition 1, and hypereutectic composition 2, respectively.
Our main goal was to increase the specimen area exposed to the corrosive medium as much as possible. Therefore, in theory, the eutectic composition should be the most porous sample. However, this composition is the limit for the formation of ligaments, which must be interconnected to avoid sample destruction. For this reason, the two other compositions with a higher volumetric percent of the remaining phase were also selected to be studied.

2.2. Melting and Sample Preparation

The three compositions were melted in a graphite crucible at about 800 °C for 30 min using an Al-33 wt % Cu master alloy obtained from Milward Alloys, Inc., New York, NY, USA. To adjust the alloy compositions, we added pure copper metal chunks.
To obtain a fine microstructure, three solidification methods were tested: directional solidification, quenching in a graphite mold, and solidification in copper molds. After solidification and to stabilize the microstructure, the samples were annealed at 400 °C for 24 h. The regions solidified in direct contact with the molds were discarded, since they can present a very different microstructure (chilled regions), causing undesirable heterogeneity in pore and ligament sizes within each specimen. Subsequently, the annealed samples are cut as 10 mm × 10 mm × 2 mm specimens and then polished with a 0.05 μm finishing.

2.3. Selective Dissolution

In this process, each sample was placed in a 100 mL NaOH solution with different concentrations, i.e., from 1 to 25 vol. %, at room temperature. The samples were kept in the corrosive medium for at most 24 h or until no bubble formation was observed. The lack of bubble evolution would indicate that the oxidation process had stopped. Thereupon, the samples were removed, placed in a sonicator containing distilled water for 20 min, and immediately immersed into ethanol for 5 min in the same sonicator to stop the corrosive process. Finally, the samples were placed in an oven at 100 °C for 8 h to remove any moisture.

2.4. Characterization

To characterize the new material, we used X-ray diffraction, optical microscopy, and scanning electron microscopy. XRD allowed determining and corroborating the phases present in the material before and after corrosion. The Siemens D500 X-ray diffractometer utilized possesses a copper target and was operated for a 2θ range between 10° and 80°. Additionally, a metallographic optical microscope and a JEOL JSM-7610F FEG-SEM permitted to observe and measure the porosity and the ligament size of the etched material.

3. Results and Discussion

3.1. Effects of Solidification and Annealing

As mentioned, the attained porosity depends directly on the microstructure of the parent (precursor) alloy. In addition, the best way to simplify the subsequent chemical reactions is by having only two phases present in the alloy. Thus, for the studied compositions, a primary aluminum phase and the intermetallic Al2Cu coexist. These two phases should be stable at room temperature according to the Al-Cu equilibrium phase diagrams. However, the type of solidification and the subsequent thermal treatment determine the final volume fractions of these phases and their chemical stability.
There are several solidification processes available for these alloys. The ones selected were those that render finer microstructures to produce finer pores after selective dissolution of the precursor alloy.

3.1.1. Quenching in Cold Water

Upon liquid quenching, the melt was poured directly into water or other liquid so that a high solidification rate was attained by fast heat extraction. Nevertheless, this process is not efficient to grant a large enough thermal gradient, as evidenced by prior results on the dendritic growth of an Al-Zn alloy [14]. In that research, quenching in liquid nitrogen caused larger interdendritic spacing than in cold water quenching. This was likely due to the formation to a sheath of nitrogen gas enclosing the hot specimen, which prevented faster heat transfer. Even so, in this research, we tested this type of solidification and found it inconvenient since the solidified sample ended up with excessive porosity (mostly due to fast vaporization of the quenching liquid). Such porous precursor specimen was deemed inadequate for the corrosion process, as the area exposed to the electrolyte was extreme, leading to pitting corrosion (not selective) as well as to sample brittleness. Therefore, liquid quenching was discarded for this study.

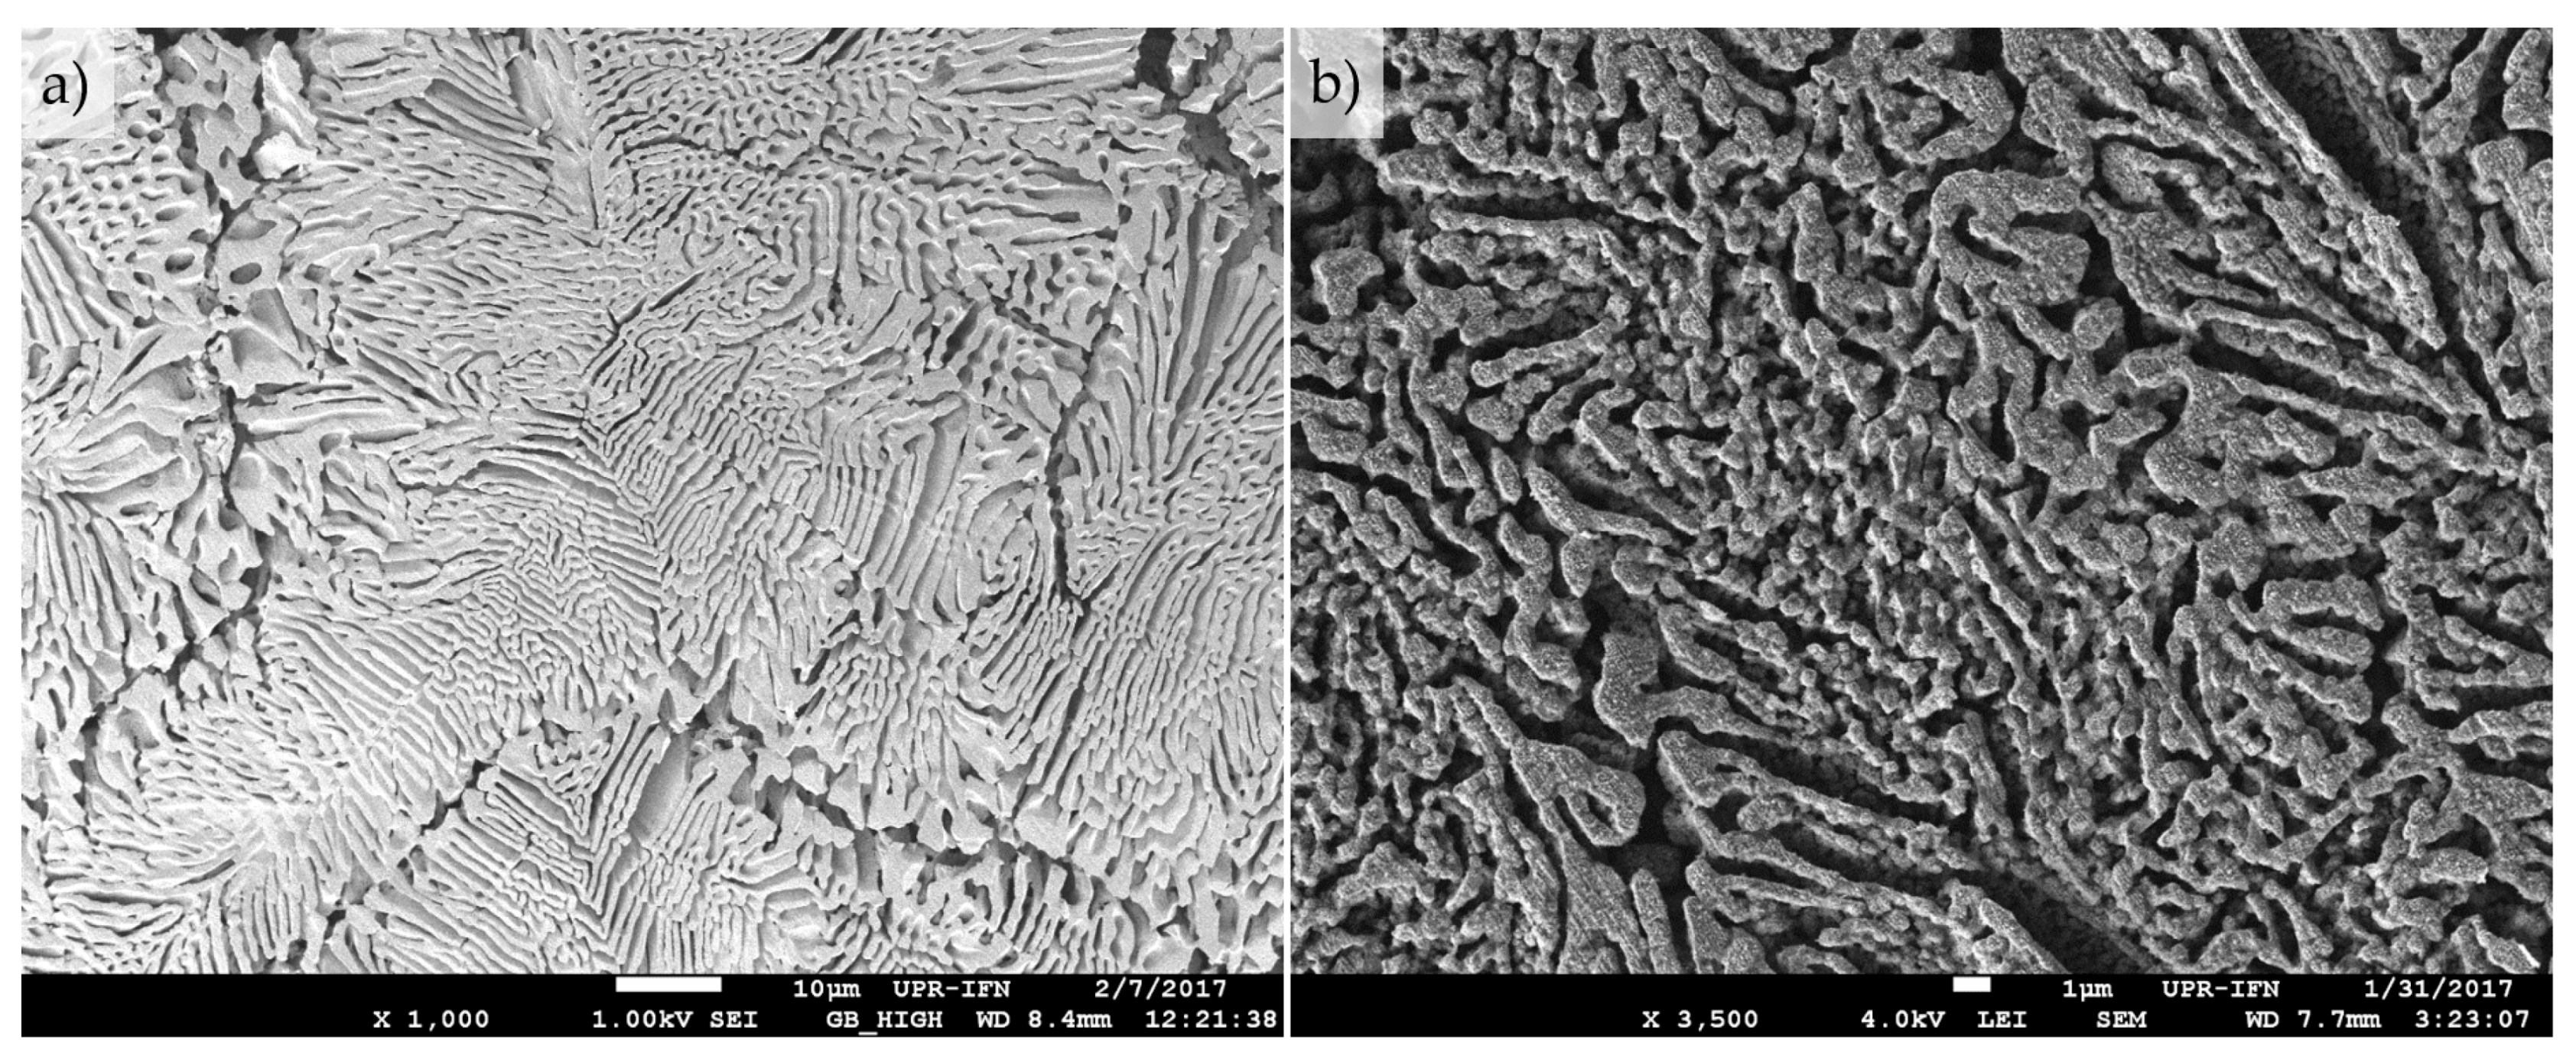
3.1.2. Directional Solidification

Figure 1 shows micrographs of directionally solidified eutectic Al-Cu samples, in which the solidification direction of the main dendrite arms is apparent. Via this directional solidification method, the grain growth direction can be controlled, which is useful to adjust the pore structure. Along the longitudinal direction (parallel to the heat flow), there are different thicknesses of eutectic lamellar structure, with finer lamellae at the center of the colonies. In these photographs, the light areas correspond to the eutectic Al phase, and the dark ones to the intermetallic Al2Cu. Furthermore, at the center of the colonies, formation of thin eutectic lamellas can be observed. The bordering area of the eutectic colonies present a thicker structure than the center as a result of impingement upon the end of solidification. Despite some improvement in the microstructure features, the pore and ligament sizes would produce too large a variability, making it difficult to analyze the actual solidification effect.

3.1.3. Solidification in Copper Molds

Copper bears high thermal conductivity [15], which allowed for a solidifying sample in copper molds to lose heat rapidly. In this next set of experiments, the molten alloy at 800 °C was poured into a pure copper mold. In place of a cylindrical mold, a shallow copper mold was used. A copper sheet at room temperature with similar dimensions was placed onto the mold to shorten the solidification time and obtain a fine microstructure. Here, the solidified specimen was a thin sheet with a more homogeneous growth pattern. This enhanced the possibility of producing uniform porosity and ligament sizes after selective dissolution. To secure a stable microstructure, we used an annealing treatment, as described in the Section 2.2. Hence, in the alloy, only two phases were present: a primary Al phase and a eutectic mixture of aluminum and Al2Cu. As expected, the EC sample shows a lamellar structure, as the one in Figure 2, which presents the specimen after corrosion. This was completed with an immersion into a 10 vol. % NaOH aqueous solution for 24 h. Without corrosion the microstructure was not clearly visible in the SEM using secondary electron imaging only. The overall aspect of the microstructure is depicted in this SEM image, where an equiaxed structure is apparent. This image also demonstrates that this method of solidification is more effective (in terms of uniformity and refinement) than the two described above. Consequently, after annealing, the precursor microstructure remains fine, and pores are not visible. HC-1 samples do not show dendritic formation as one would have expected from the equilibrium phase diagram. This composition is too close to the eutectic composition, i.e., in the coupled zone, where the type of solidification (assuming high undercooling in this research) can lead to eutectic cells formation. This could occur because the eutectic grows more rapidly than dendrites of Al2Cu phase [16]. Figure 3 shows a sample of Al-Cu with hypereutectic composition with proeutectic Al2Cu. This is surrounded by eutectic regions. Therefore, in this sample, there are regions with proeutectic Al2Cu dendrites and zones with lamellar eutectic.

3.1.4. Annealing Effect

Likely because of the solidification method used, the diffusion process was affected, causing the microstructure not to be thermodynamically stable. To enhance diffusion and stabilize the microstructure, a 400 °C annealing was carried out for different time periods. This procedure altered the directional solidification microstructure. In effect, according to the literature, the as-cast microstructure is susceptible to fragmentation, spheroidization, and even coalescence of eutectic phases [17]. Oswalt ripening, where diffusion occurs from high to low curvature phases, was likely taking place [18]. Eutectic spheroidization has been studied in aluminum-silicon systems with aggregates of sodium and strontium [19]. In addition, in aluminum-nickel alloys, the thermal treatment can lead to globulization in eutectic regions where the colony structure leads to an easier globulization [20]. When an annealing is used to modify the eutectic structure, high temperatures (below the eutectic one, natural) are required to activate the diffusion. Oswalt ripening mechanism is, therefore, activated as well. The directional solidification microstructure present high variations in phase curvature favor a Gibbs-Thomson effect between the central and external regions of each colony. These curvature differences enhance its assisted diffusion, because the driving force for ripening process increases with high curvature differences, causing the disappearance of the smaller regions. Figure 4 shows a magnified area of the longitudinal section of a directionally solidified eutectic sample. On the right of the image, finer formations are apparent. On the contrary, on the left of this image a perimeter of a colony is observed where the morphology presents larger phases.
Microstructural modifications of the directionally solidified samples become apparent after a 4-h annealing (to the left of Figure 5). Most lamellae have been destroyed or fragmented. After the 24-h annealing, the as-cast microstructure is completely modified. Now, the morphology is very uniform without eutectic lamellas (to the right of Figure 5). The microstructure morphology variations only occurred in samples with directional solidification. In samples solidified in copper molds, the annealing did not alter the overall structure morphology since these samples present an interface between phases with much less curvature than the eutectic colonies. In other words, smooth planar surfaces avoid the fragmentation during heat treatments even at temperatures near the equilibrium solidus line [17].

3.2. Free Corrosion of Directionally Solidified Samples

Free corrosion in NaOH aqueous solution was carried out at different concentrations: 1, 10, and 25 vol. %. Table 2 presents a summary of the observations.
The 25 vol. % aqueous solution completely dissolved the sample, which was destroyed in a relatively short time. The 1 vol. % NaOH concentration produced a similar result as 10 vol. % but at a much longer time. Optical microscopy observations demonstrated that selective dissolution of the Al phase became apparent. Since the selective dissolution process using a 1 vol. % NaOH solution took too long, thereafter the study focused only on the 10 vol. % concentration. Under these conditions, apparent selective dissolution was achieved with controlled exposure time. This meant that the sample must be removed from the solution when chemical reactions were still occurring; otherwise, the sample would be fully dissolved by the electrolyte, as in the case of the 25% solution.
Hereafter, the samples prepared were immersed into a 100 mL of 10 vol. % NaOH aqueous solution. This concentration allowed maintaining a stable reaction rate. This reaction is 2Al(s) + 2NaOH(aq) + 6H2O ⟶ 2Na+(aq) + 2[Al(OH)4] + 3H2(g). According to this, tetrahydroxyaluminate ([Al(OH)4]), ionic sodium, and hydrogen gas are the reaction products. Hydrogen is responsible for the bubble formation, which has been used to monitor visually the chemical reaction progress.
The samples exposed for 4 h to the corrosion medium did not show microstructural variations. Likely, selective dissolution occurred as the intermetallic phase remained. In other words, Al2Cu did not react with the NaOH solution. The colony structure of a lamellar eutectic achieved by directional solidification was preserved when compared with the unetched microstructure in Figure 1, i.e., before corrosion. Figure 6 shows the lamellar structure of the eutectic colony center after directional solidification. Pores of approximately 400 nm have been obtained, although this pore size can vary depending on the local solidification time. The perimeter of a eutectic colony with voids of around 2 µm are much larger than those present in the interlamellar regions. The SEM images demonstrate that 4 h sufficed to achieve selective dissolution using a 10 vol. % NaOH solution. Thereupon, the intermetallic phase would begin to react with NaOH. Alternatively, those ligaments could detach due to brittleness as a consequence of the mass removal, as indicated in Figure 6d.

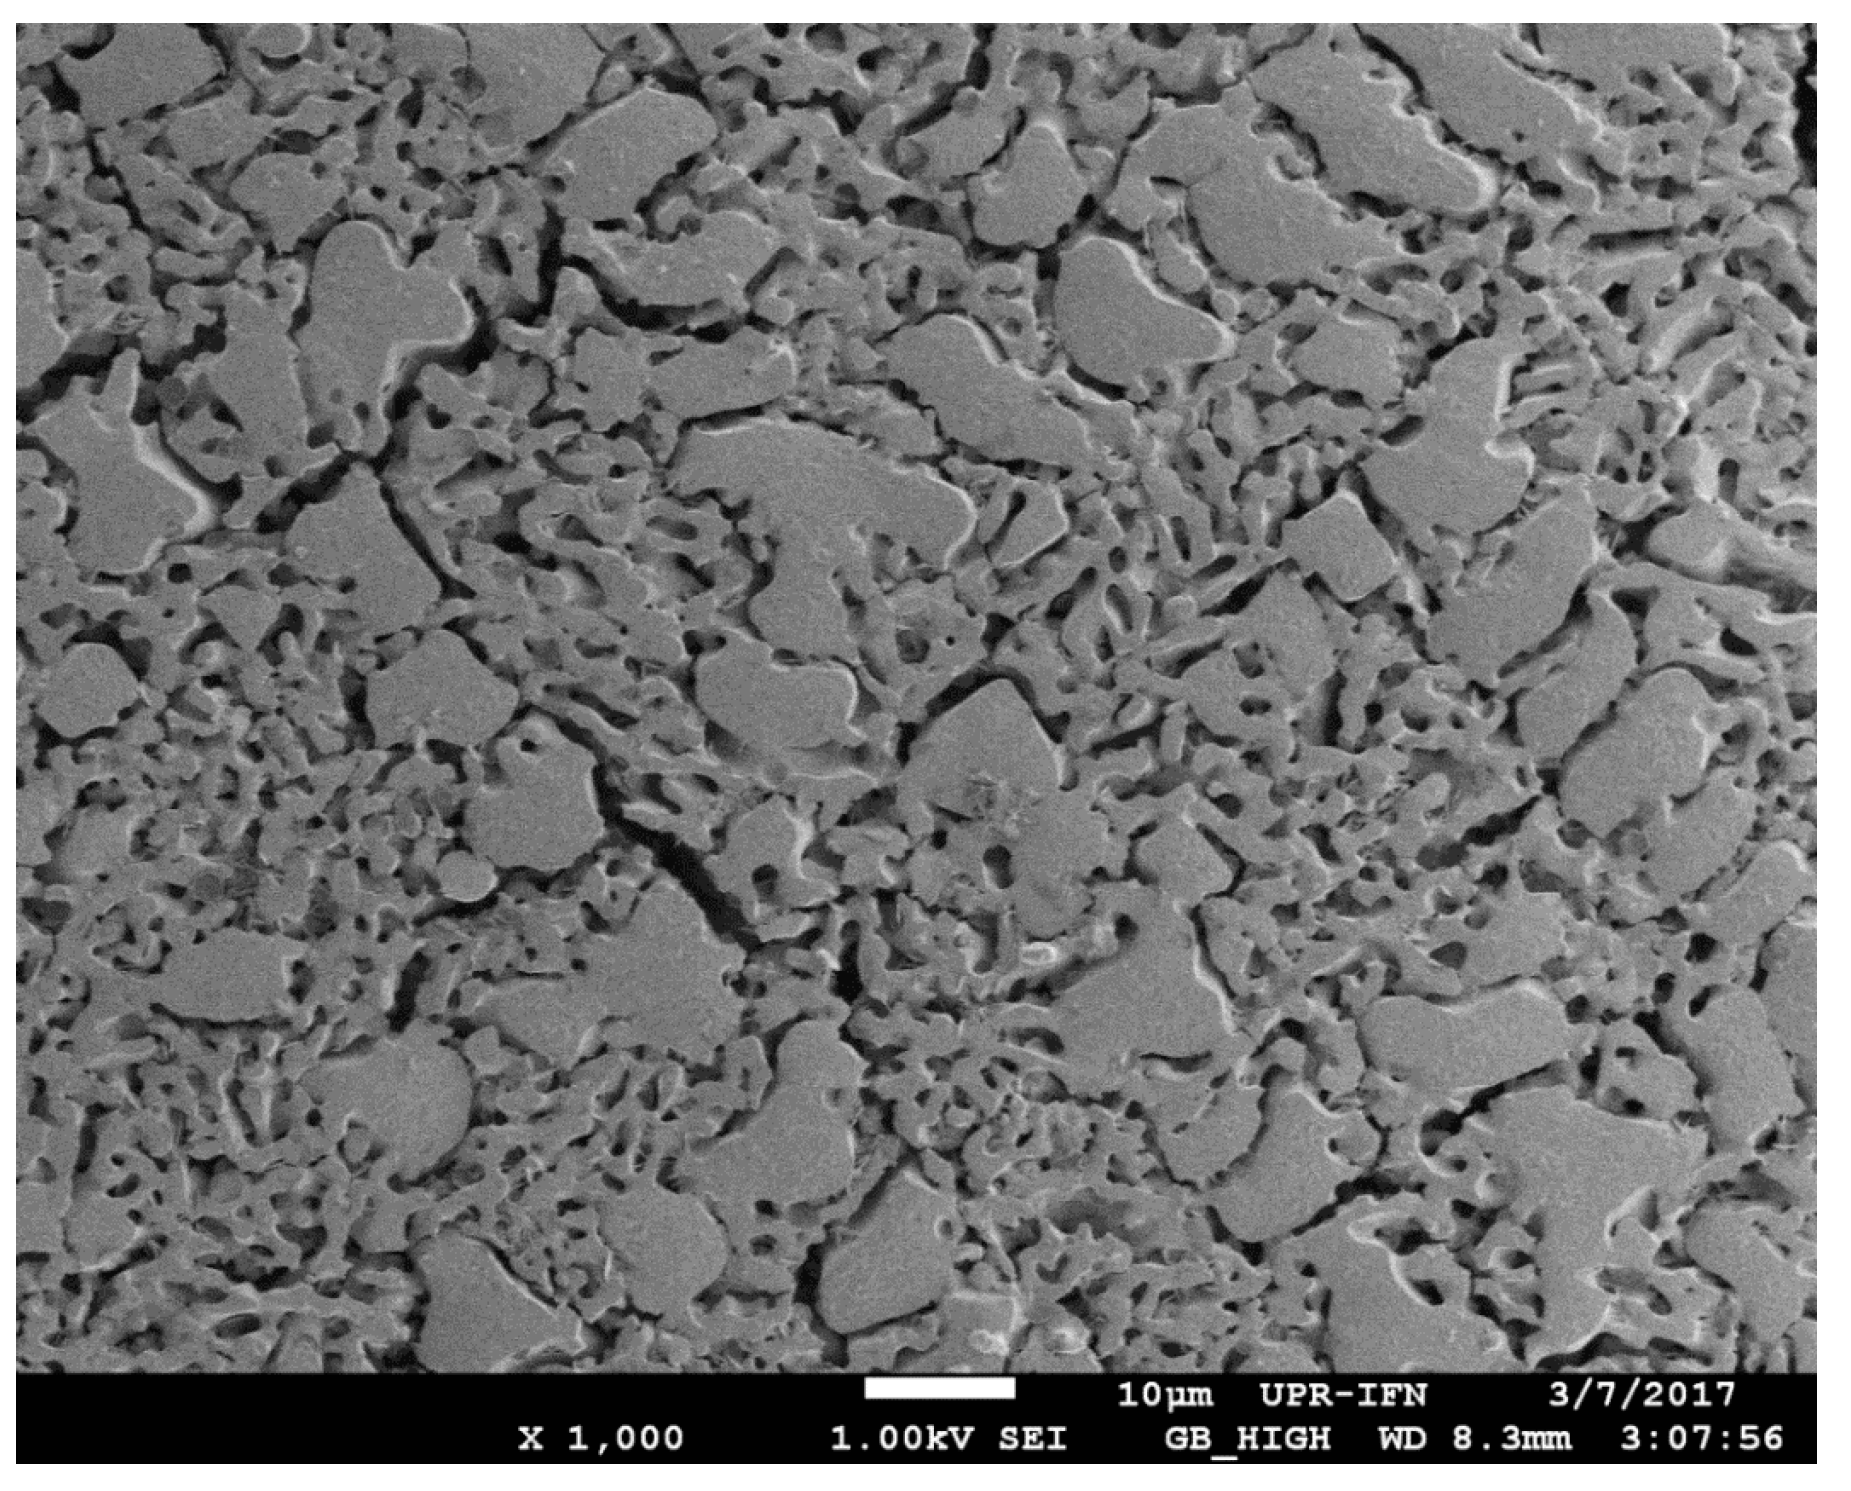
3.3. Selective Dissolution of Samples Solidified in Copper Molds

The results of the directionally solidified samples demonstrate that the 10 vol. % NaOH aqueous solution is effective for this process. Consequently, the samples solidified in copper molds have been corroded with this solution concentration. Again, the evolution of hydrogen gas has been an indicator of ongoing corrosion in the sample. Thus, if this bubble formation is not exhibited after 24 h corrosion one can assume that the reaction stopped or, at least, slowed down significantly. At the end of this process the sample maintained the initial dimensions with enough structural integrity (no crumbling). Change in the sample coloration was observed, now brown copper (as seen in Figure 7), and the surface of the sample is still reflective as before corrosion.
This technique is assumed to lead to selective dissolution, in which the NaOH reacts with Al, and the θ phase remains as an interconnected network of ligaments. Now, the process does not depend as much on controlling the exposure time. Instead, the samples remained submerged during noticeable bubble evolution. Thus, the process becomes reproducible and repeatable. All three compositions presented similar behavior during corrosion, starting with a relatively fast reaction until dissolution stopped before 24 h.
Using the SEM images, we measured the resulting porosity (in percent) of the samples, as well as the pore and ligament size after corrosion. The porosity analysis was performed in MATLAB™, whereas pores and ligaments size were measured using ImageJ software.

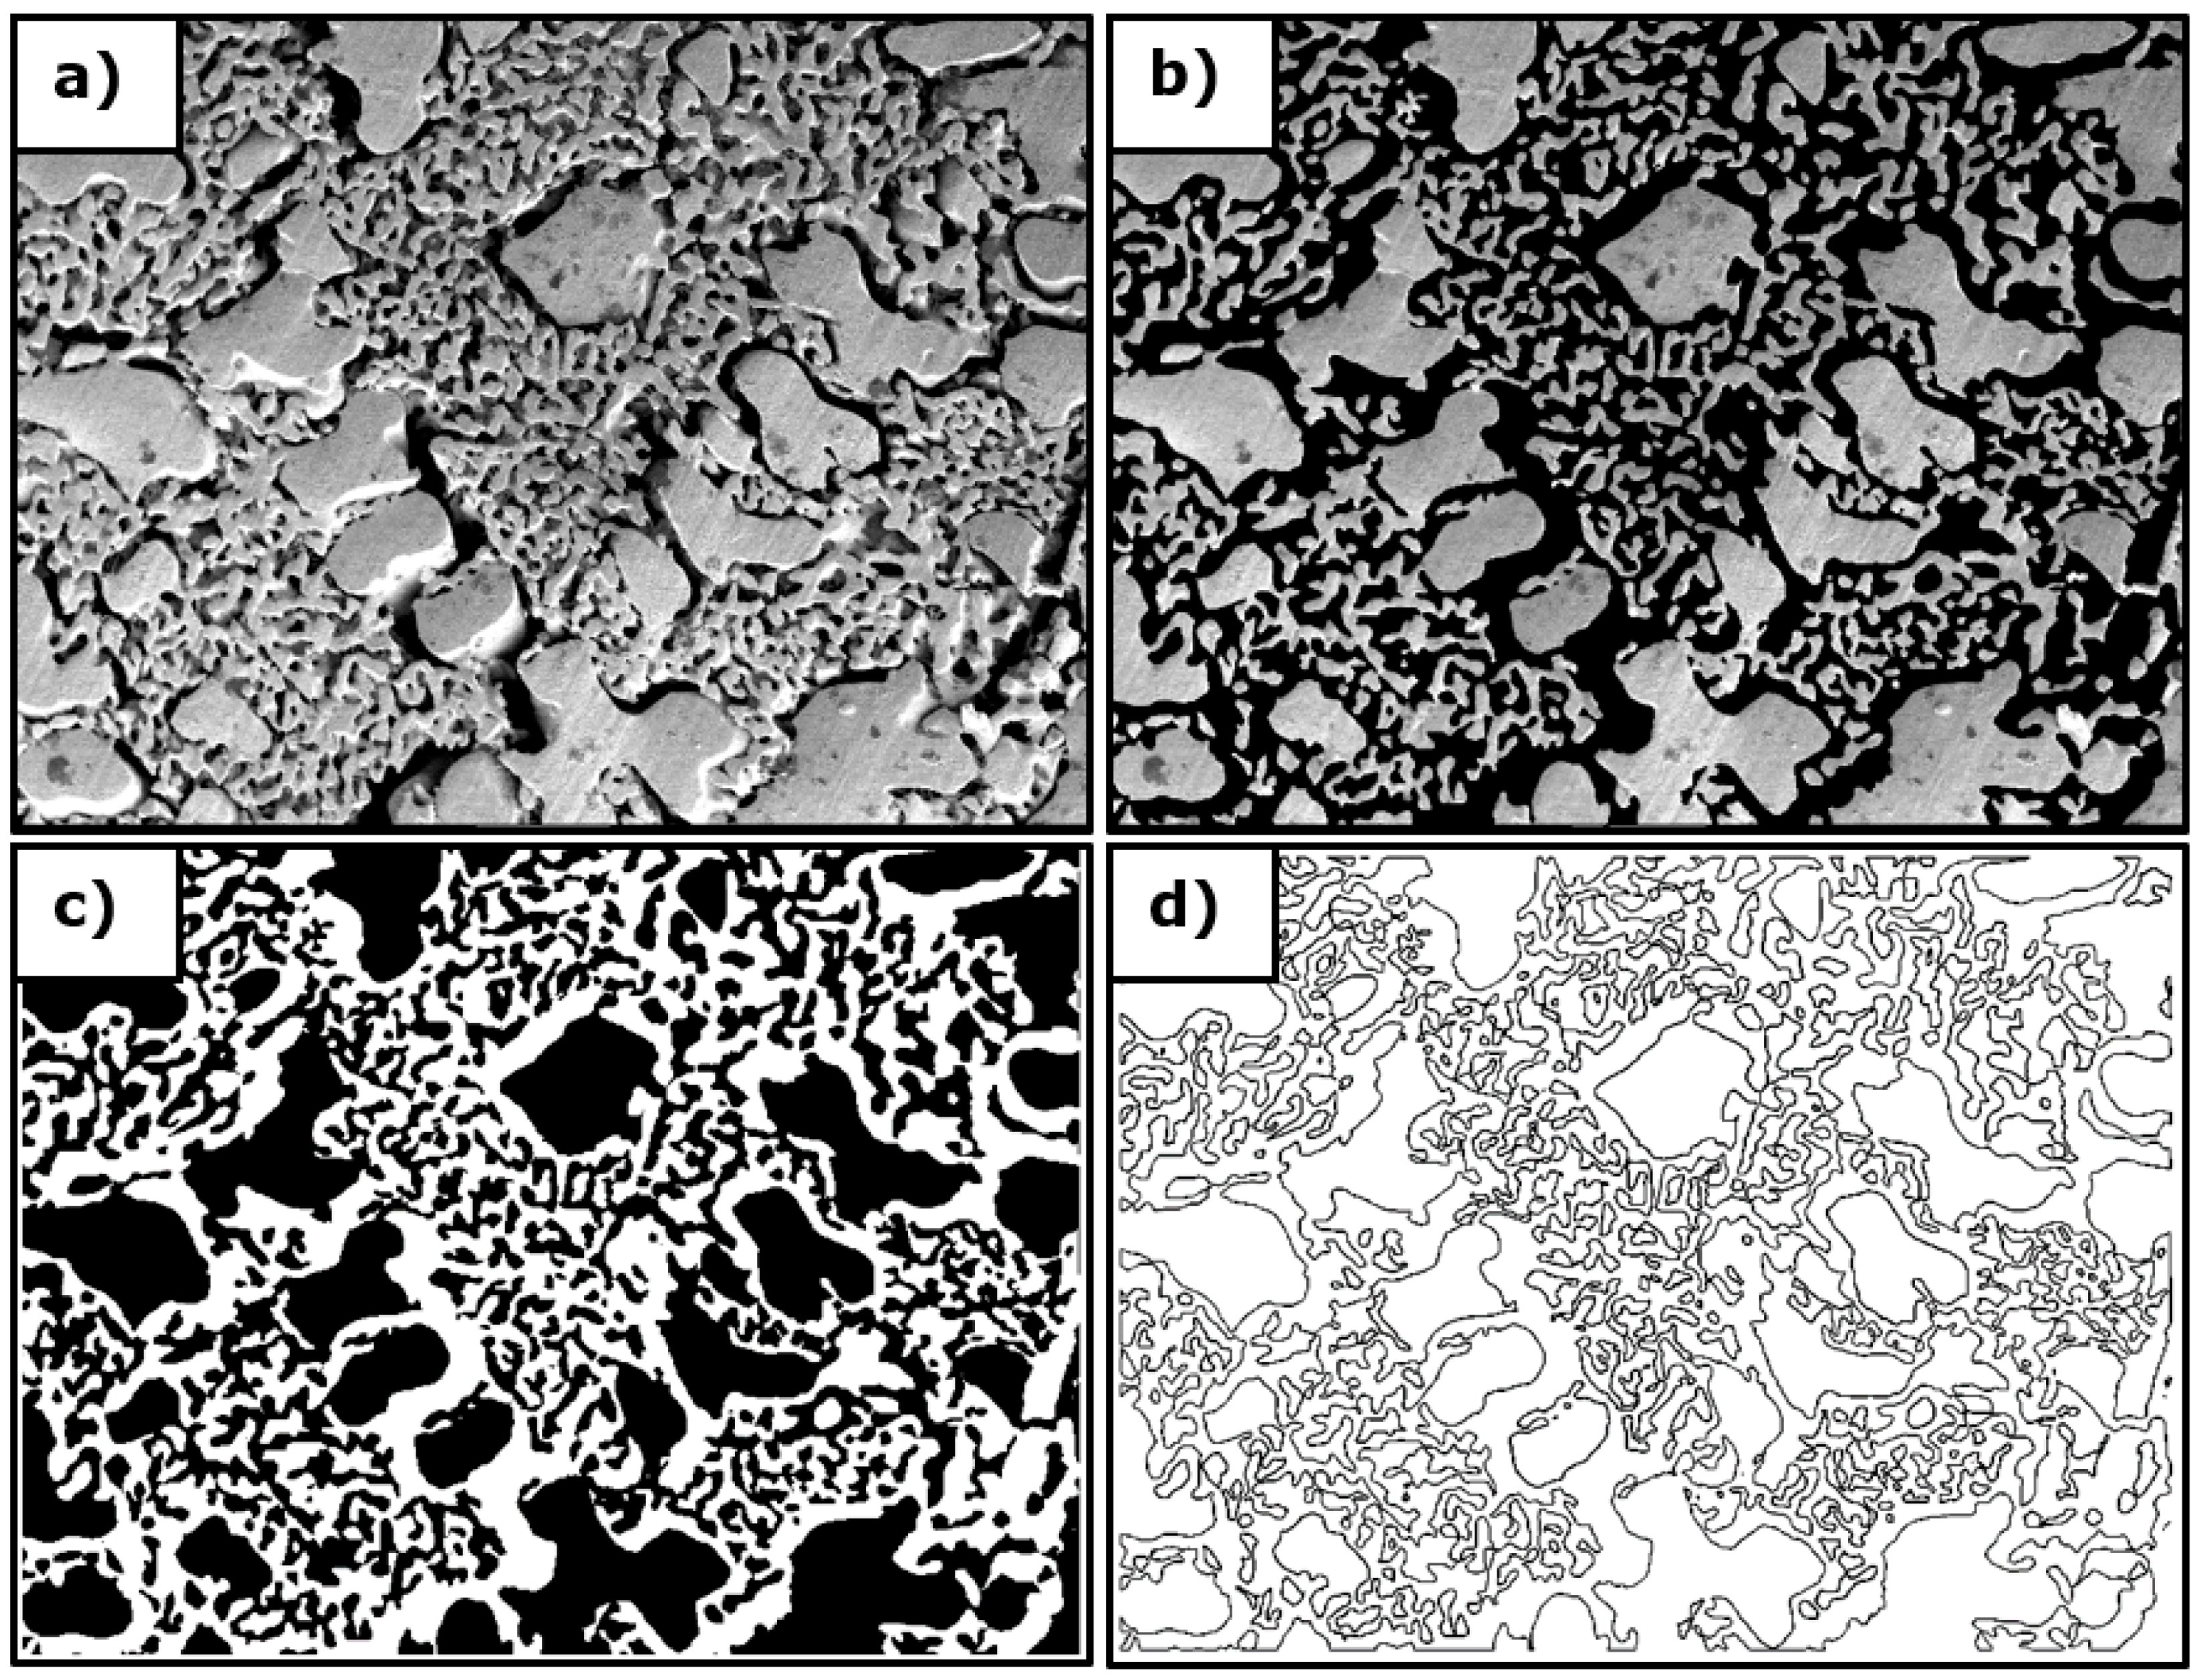
3.3.1. Sample Porosity

Figure 8 reveals the surface of the HC-2 and EC samples. A finer grain is observed in the EC specimen than in the HC-2 one, although both keep similar microstructure features. This causes the surface to turn rough leading to a larger surface area of the sample, more than expected. The specimens displayed this feature throughout the entire surface in the eutectic laminae for all three compositions.
The porosity analysis was performed on the SEM images at different magnifications and in all three compositions. We measured the sample porosity following the steps illustrated in Figure 9: (a) original SEM photograph; (b) removal of areas that do not correspond to the observed cutting plane; (c) conversion of the RGB image to binary image and black and white inversion, so that the white areas correspond to pores; and (d) boundaries of pores observed in the photograph. This analysis revealed porosities of 51.3%, 50.6%, and 45.6% for EC, HC-1, and HC-2, respectively. These results show that the process removed more mass than expected compared to the information provided by the Al-Cu equilibrium diagram. This is particularly true for the hypereutectic compositions, where the excess porous area is about 4.4%. For the EC, there seems to be no significant excess, since it was expected to lose 50% of its volume, equivalent to the amount of Al phase. Moreover, the mass loss could be considered a consequence of the solidification microstructure. Upon solidification, the high thermal gradient produced finer grains, i.e., numerous grain boundaries. Many atoms are not perfectly bonded to the crystalline structure, leading to a corrosion process that removed more atoms than expected during selective dissolution. Furthermore, the formation of metastable precipitates during solidification is another important factor. Despite the cooling rate, during solidification, some Cu can dissolve into Al and then, upon solid state cooling, may form metastable precipitates. When the corrosion takes place, these small precipitates could have been released into the electrolyte, leading to the formation of more pores or larger porosity. Image analysis allowed correlating the measured porous area with the porosity volume. Similarly, pore boundaries (perimeters) could also be associated to the increase of surface area. When performing this calculation, the said area in all three compositions increased approximately seven times compared with the initial area. However, this result assumes that the pore boundaries are perfectly defined; in other words, the surface appears smoother at a lower magnification, unlike that observed in Figure 8, where the surface area is rough. For this reason, the increased area turns out to be smaller than expected. Measurements of this surface area using a Brunauer-Emmett-Teller (BET) surface area analyzer for EC resulted in an area close to 0.41 m2 for 3 mm × 2 mm × 10 mm samples, which represents a surface area more than 3600 times larger than the initial area.

3.3.2. Pore and Ligament Size

ImageJ (image analyzer) allowed determining the pore and ligament size of the three compositions. Several images of each composition were considered. Figure 10 shows typical microstructure images used in this measurement; one can observe the morphology differences of large eutectic regions. Only the HC-2 specimen presents proeutectic θ dendritic formation. Using the values measured using ImageJ, we produced the graphs in Figure 11 as well as Table 3. Instances of smaller pore size are highlighted in the HC-1 specimen with many more values in the first two quartiles. This occurred because the microstructure of HC-1 sample does not show a dendritic formation. Instead, there are regions in which the laminae thicknesses vary much; even more, in some areas this is even finer than in the EC. The pore sizes in EC and HC-1 present a similar range of values. However, the dispersion is much higher in HC-2, as Table 3 shows. According to the phase diagram, HC-1 should have had dendritic formations. Nevertheless, the solidification conditions, as discussed above, effect a eutectic microstructure throughout the entire sample. Therefore, the growth of the lamellas was not as uniform as in EC samples, producing the high dispersion observed in the pore and ligament sizes.
The results of the porosity measurement suggest that corroded eutectic alloy presented larger surface area and porosity than the hypereutectic compositions. Furthermore, the box plot of the ligament size revealed much less dispersion from the eutectic composition than from hypereutectic ones. The EC presents 50 vol. % of both phases, which leads to similar lamellae thickness (eutectic Al 2 Cu and eutectic Al) and, therefore, to a better homogeneity of the final ligaments size. These findings prove that the porosity can be controlled by the selection of the composition that would withstand the corrosion process.
As aforementioned, a nanoporous metal from a parent Al-Cu alloy could be obtained through selective dissolution by removing the Al phase. According to the literature, in dealloying Al-Cu alloys, pores and ligaments of smaller sizes (10–500 nm) have been attained [8,9,10,11,12,13]. In these studies, NPC was obtained via corroding the Al primary phase and also the intermetallic phase, i.e., Al2Cu. As a result, pure nanoporous Cu was fabricated. At this point, we deem important to underscore that this process differs from the selective solution, since dealloying involves diffusion of adatoms during the removal of one element (not one phase as in this research).
On the other hand, selective dissolution removes the Al phase but not Al atoms forming the intermetallic phase (Al2Cu); in other words, dealloying of this phase did not take place in the presented corrosion process. This result can be further corroborated by observing the phase morphology in the SEM images. The retention of the Al2Cu phase is further substantiated by the X-ray diffraction results. Additionally, free corrosion was used to achieve selective dissolution, which is much easier than the dealloying process where a specific applied electrical field is needed to create the most favorable dealloying conditions. Therefore, the proposed methodology is much less expensive, permitting to fabricate a new porous metal material. This paper describes the fabrication of a low-cost metallic porous metallic material. The potential applications for this type of material are related to catalysis as well as sorbent material thanks to its large surface area. For instance, they can be used as a supporting framework for nanoporous high-performance sorbents [21]. The pore size and surface area define other specific applications of this novel material [22]. Further, the manufacturing process is quite adaptable to those applications, since by adjusting the solidification conditions one can modify the porosity and ligaments of the metallic framework. The scope of the present research could have been much expanded if we had had access to a three-dimensional X-ray tomography unit. However, we deem that the methodology used provides enough evidence of the effectiveness of the proposed selective dissolution.
The average pore and ligament sizes achieved in this research are 652 and 959 nm, respectively, among the three compositions studied. Although these values do not fall into the nanoscale classification, the dimensions of the pores and ligaments can be significantly reduced using a solidification method that further refines the microstructure, e.g., rapid solidification process. Again, the porosity obtained via selective dissolution depends directly on the as-cast microstructure.

3.3.3. Corrosion Procedure

Ideally, Al(OH)4 is dissolved by the electrolyte without creating another reaction during corrosion. However, Counter et al. [23] demonstrated that with a supersaturation of Al(OH)4, ion formation of aluminum hydroxide (Al(OH)3) nuclei can occur. These nuclei grow for hours (i.e., upon aging) and eventually become better defined structures observable at the nanometric scale. The Al(OH)3 formation is achieved through a supersaturation of Al(OH)4 ions, which can be reached at the sample surface during the corrosion process. Counter et al., also demonstrated that the formation and growth of Al(OH)3 removed the Al(OH)4 ions supersaturation promoting the reaction to continue.
The red circles in Figure 12 are some areas with some probable Al(OH)3 formation during the selective dissolution process; formations of different sizes are apparent. A 24 h corrosion process of the HC-2 sample was followed by passivation in ethanol to stop the chemical reaction. During the corrosion the sample was not aerated and the solution of NaOH remained motionless. Since the NaOH solution must be in constant motion to avoid Al(OH)4 ions supersaturation (followed by formation of Al(OH)3) we used a magnetic stirrer. In effect, the SEM images proved that this method was effective to prevent the Al(OH)3 formation.
As aforementioned, when we do not observe any bubble evolution from the sample undergoing selective solution, we assumed that the reaction stopped. This occurs as the sample is still within the NaOH solution. Once the sample is removed from the electrolyte and comes in contact with air, other reactions could occur leading to the formation of aluminum oxide on the sample surface. For this reason, the sample must be passivated as soon as it is removed from the solution. Figure 13 shows an EC sample that was not correctly passivated; days later, some aluminum oxide formed on the corroded surface. This sample had been soaked in ethanol without stirring.

3.4. XRD Results

The phases present in the material were studied via X-ray diffraction. In Al-Cu alloys, according the pertinent equilibrium phase diagram, only Al and Al2Cu should be present in a stable, uncontaminated specimen for compositions rich in aluminum. Therefore, through XRD the effectiveness of the selective dissolution process can be evaluated, as the selectively removed phase should not be present in the resulting diffractogram. Hence, samples before and after corrosion have been studied within the same 2θ range. This allowed characterizing the material assisted by a computer database containing the powder diffraction file [24]. This process was performed using Match! ™ software. Moreover, XRD may show whether another (unintended) phase formed from the reactions during and after the selective dissolution.
Figure 14 displays the XRD pattern obtained from an EC sample before selective dissolution. The phase peaks are labeled with the corresponding Miller indices of planes that reflected the X-ray beam and the respective phases.
Figure 15 presents the diffractogram generated by an EC sample after selective dissolution. Only the peaks corresponding to the intermetallic phase are present, proving that the selective dissolution was successful. To make the process entirely effective, after dissolution, we must stop the corrosion process. Otherwise, the sample could contain aluminum oxide as a result of a stationary solution and air exposure. These are undesirable oxides in the nanoporous material. An example of this situation is presented in Figure 16 that shows the XRD diffraction pattern of a corroded and not-correctly-passivated EC sample (shown in Figure 13). Peaks of aluminum oxide and aluminum hydroxide are apparent in this diffractogram. This further demonstrates the need to passivate the porous metal as soon as it is manufactured.

4. Conclusions

The present research sought to design an inexpensive method to produce porous metallic samples via selective dissolution. The work completed led us to the following conclusions:
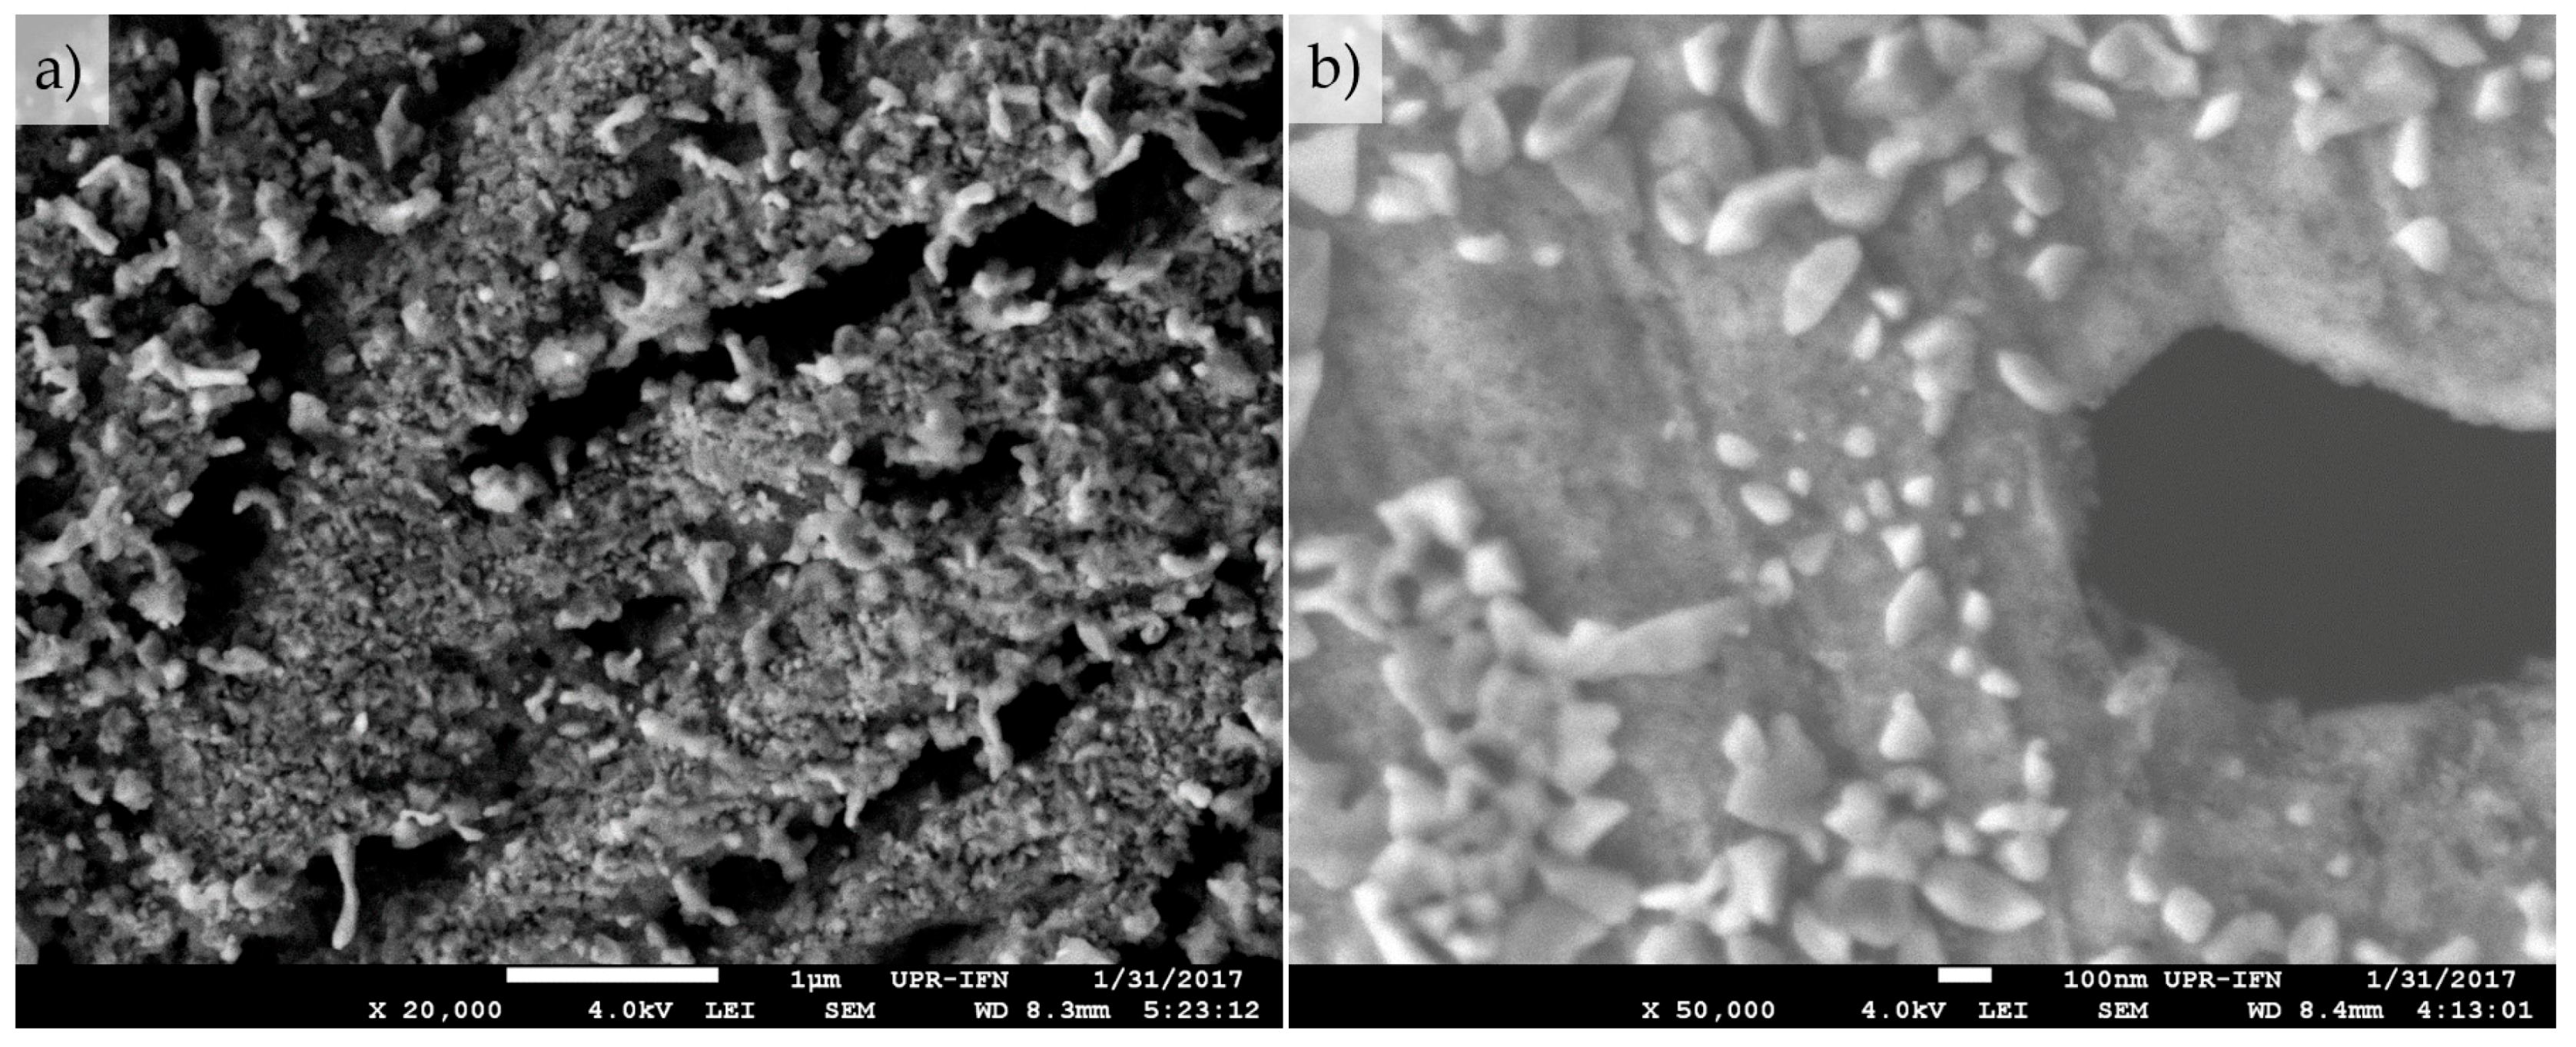
  • Successful selective dissolution of the Al phase from a precursor Al-Cu alloy was achieved, proving the feasibility of manufacturing a porous metallic material made of an intermetallic phase. The pore sizes varied between 230 nm and 1850 nm.
  • Solidification on copper sheets allowed a higher thermal gradient, causing finer microstructure. In addition, this solidification method avoided the formation of pores during this process.
  • The smallest average pores (652 nm) were obtained in the Al-19.17 at % Cu specimen (named as hypereutectic composition 1), while larger ones (959.5 nm) were obtained in Al-20.80 at % Cu specimens (hypereutectic composition 2).
  • Samples of eutectic composition present a greater uniformity and smaller ligaments size after the selective dissolution (433.4 nm). The ligaments for the hypereutectic compositions had a more variable and greater thickness. In addition, the parent eutectic alloy led to the highest porosity percent. This composition is the best one of those studied based one its high porosity, greater homogeneity, and, thus, final larger surface area.
  • A 10 vol. % NaOH aqueous solution allowed a rapid chemical reaction and selective dissolution of the primary Al phase for the three compositions studied.
  • During corrosion, the electrolyte must be stirred lest the concentration of the resulting Al(OH)4 ion increases on the sample surface. This avoids the Al(OH)3 formation. After corrosion, the sample should be in contact with air for the shortest time possible to avoid oxidation.
  • The X-ray diffraction results validated the complete removal of aluminum phase present in the sample before the corrosion process, which was carried out for 24 h.

Author Contributions

J.V.-M., the main author, was the one responsible for the design and completion of the experimental section and the analysis of the results. He was also in charge of the redaction of the manuscript. J.E.E.-G. participated in the corrosion of the samples and a portion of the manuscript. V.A.V. contributed with the planning and interpretation of the corrosion process. O.M.S. leads the Nanotechnology Center hosting this research and also contributed significantly to the manuscript preparation. A.J.H.-M. provided the original conceptual framework on the possibility of creating nanoporous metallic materials as an expansion of his own work on nanoporous sorbents.

Funding

This research was funded by National Science Foundation grant number 1345156.

Acknowledgments

This material is based upon work supported by the National Science Foundation under Grant No. 1345156 (CREST program). This funding also allows for covering the costs to publish in this open access journal. The authors would like to thank additional support provided by the Department of Engineering Sciences and Materials of the University of Puerto Rico—Mayagüez. The deepest gratitude extends to Mr. Boris Rentería, technician of the UPRM Nanotechnology Center for his assistance in the use of the pertinent instrumentation. Further assistance in the microstructure characterization were provided by Universidad del Turabo, Universidad de Puerto Rico—Cayey and Universidad de Puerto Rico—Rio Piedras.

Conflicts of Interest

The authors declare no conflict of interest.

References

  1. Erlebacher, J.; Newman, R.C.; Sieradzki, K. Fundamental physics and chemistry of nanoporosity evolution during dealloying. In RSC Nanoscience and Nanotechnology; Royal Society of Chemistry: London, UK, 2012; pp. 11–29. ISBN 9781849733748. [Google Scholar]
  2. Vu, T.N. Selective Dissolution from Zn-Al Alloy Coatings on Steel; Material Chemistry; L’Universite Pierre et Marie Curie: Paris, France, 2012. [Google Scholar]
  3. Chen, L.-Y.; Yu, J.-S.; Fujita, T.; Chen, M.-W. Nanoporous Copper with Tunable Nanoporosity for SERS Applications. Adv. Funct. Mater. 2009, 19, 1221–1226. [Google Scholar] [CrossRef]
  4. Mao, R.; Liang, S.; Wang, X.; Yang, Q.; Han, B. Effect of preparation conditions on morphology and thermal stability of nanoporous copper. Corros. Sci. 2012, 60, 231–237. [Google Scholar] [CrossRef]
  5. Yeh, W.J.; Chava, S. Fabrication of metallic nanoporous films by dealloying. J. Vac. Sci. Technol. B Microelectron. Nanometer Struct. 2009, 27, 923. [Google Scholar] [CrossRef]
  6. Sun, Y.; Ren, Y.; Yang, K. New preparation method of micron porous copper through physical vacuum dealloying of Cu-Zn alloys. Mater. Lett. 2016, 165, 1–4. [Google Scholar] [CrossRef]
  7. Song, T.; Yan, M.; Shi, Z.; Atrens, A.; Qian, M. Creation of bimodal porous copper materials by an annealing-electrochemical dealloying approach. Electrochim. Acta 2015, 164, 288–296. [Google Scholar] [CrossRef]
  8. Zhang, S.; Xing, Y.; Jiang, T.; Du, Z.; Li, F.; He, L.; Liu, W. A three-dimensional tin-coated nanoporous copper for lithium-ion battery anodes. J. Power Sources 2011, 196, 6915–6919. [Google Scholar] [CrossRef]
  9. Jiang, H.; Li, J.; Geng, H.; Wang, Q. Influence of cooling rate and addition of lanthanum and cerium on formation of nanoporous copper by chemical dealloying of Cu15Al85 alloy. J. Rare Earths 2013, 31, 1119–1124. [Google Scholar] [CrossRef]
  10. Liu, W.B.; Zhang, S.C.; Li, N.; Zheng, J.W.; Xing, Y.L. Influence of phase constituent and proportion in initial Al-Cu alloys on formation of monolithic nanoporous copper through chemical dealloying in an alkaline solution. Corros. Sci. 2011, 53, 809–814. [Google Scholar] [CrossRef]
  11. Qi, Z.; Zhao, C.; Wang, X.; Lin, J.; Shao, W.; Zhang, Z.; Bian, X. Formation and characterization of monolithic nanoporous copper by chemical dealloying of Al-Cu alloys. J. Phys. Chem. C 2009, 113, 6694–6698. [Google Scholar] [CrossRef]
  12. Liu, W.B.; Zhang, S.C.; Li, N.; Zheng, J.W.; Xing, Y.L. A facile one-pot route to fabricate nanoporous copper with controlled hierarchical pore size distributions through chemical dealloying of Al-Cu alloy in an alkaline solution. Microporous Mesoporous Mater. 2011, 138, 1–7. [Google Scholar] [CrossRef]
  13. Nam, S.; Jo, H.; Choe, H.; Ahn, D.; Choi, H. Development of nanoporous copper foams by chemical dealloying of mechanically alloyed Al-Cu compounds. Mater. Trans. 2014, 55, 1414–1418. [Google Scholar] [CrossRef]
  14. Suárez, O.M.; Estremera, E.G.; Soler, R.; Declet, A.; Hernández-Maldonado, A.J. Fabrication of porous and nanoporous aluminum via selective dissolution of Al-Zn alloys. Adv. Mater. Sci. Eng. 2014, 1–7. [Google Scholar] [CrossRef]
  15. ASM International Handbook Committee. ASM Specialty Handbook: Copper and Copper Alloys; Davis, J.R., Ed.; ASM International: Materials Park, OH, USA, 2001; p. 652. ISBN 978-0-87170-726-0. [Google Scholar]
  16. Kurz, W.; Fisher, D.J. Fundamentals of Solidification, 3rd ed.; Trans Tech publications: Aedermannsdorf, Switzerland, 1989; Volume 1, p. 242. ISBN 0878495223, 9780878495221. [Google Scholar]
  17. Zolotorevsky, V.S.; Belov, N.A.; Glazoff, M.V. Casting Aluminum Alloys; Elsevier: Amsterdam, The Netherlands, 2007; p. 529. ISBN 978-0-08-045370-5. [Google Scholar]
  18. Voorhees, P.W. The Theory of Ostwald Ripening. J. Stat. Phys. 1985, 38, 231–252. [Google Scholar] [CrossRef]
  19. Osório, W.R.; Garcia, L.R.; Goulart, P.R.; Garcia, A. Effects of eutectic modification and T4 heat treatment on mechanical properties and corrosion resistance of an Al-9 wt % Si casting alloy. Mater. Chem. Phys. 2007, 106, 343–349. [Google Scholar] [CrossRef]
  20. Belov, N.A.; Alabin, A.N.; Eskin, D.G. Improving the properties of cold-rolled Al-6%Ni sheets by alloying and heat treatment. Scr. Mater. 2004, 50, 89–94. [Google Scholar] [CrossRef]
  21. Wei, X.; Wang, Y.; Hernández-Maldonado, A.J.; Chen, Z. Guidelines for rational design of high-performance absorbents: A case study of zeolite adsorbents for emerging pollutants in water. Green Energy Environ. 2017, 2, 363–369. [Google Scholar] [CrossRef]
  22. Bhattacharyya, S.; Mastai, Y.; Panda, R.N.; Yeon, S.; Hu, M.Z. Advanced nanoporous materials: Synthesis, properties, and applications. J. Nanomater. 2014, 2–4. [Google Scholar] [CrossRef]
  23. Counter, J.A.; Addai-Mensah, J.; Ralston, J. The formation of Al(OH)3 crystals from supersaturated sodium aluminate solutions revealed by cryovitrification-transmission electron microscopy. Colloids Surf. A Physicochem. Eng. Asp. 1999, 154, 389–398. [Google Scholar] [CrossRef]
  24. Graulis, S.; Chateigner, D.; Downs, R.T.; Yokochi, A.F.T.; Quirós, M.; Lutterotti, L.; Manakova, E.; Butkus, J.; Moeck, P.; Le Bail, A. Crystallography open database—An open-access collection of crystal structures. J. Appl. Crystallogr. 2009, 42, 726–729. [Google Scholar] [CrossRef] [PubMed]
Figure 1. Optical micrograph of EC sample directionally solidified: (a) longitudinal section; and (b) cross-sectional view.
Metals 08 00378 g001
Figure 2. SEM images of: (a) EC and; (b) HC-1 samples solidified in a copper mold and corroded for 24 h in 10 vol. % NaOH aqueous solution.
Metals 08 00378 g002
Figure 3. SEM image of a HC-2 sample solidified in a copper mold and after corrosion for 24 h in 10 vol. % NaOH aqueous solution.
Metals 08 00378 g003
Figure 4. Optical micrograph of Al-Cu eutectic alloy directionally solidified, longitudinal section view magnified more than in Figure 1.
Metals 08 00378 g004
Figure 5. Optical micrograph of eutectic Al-Cu directionally solidified after annealing for: (a) 4 h and, (b) 24 h.
Metals 08 00378 g005
Figure 6. SEM images of: (a) Al-Cu eutectic directionally solidified and corroded in 10 vol. % NaOH aqueous solution for 4 h; (b) Al-Cu eutectic colony in a directionally solidified specimen corroded in 10 vol. % NaOH aqueous solution for 4 h; (c) the perimeter of Al-Cu eutectic colony in a directionally solidified specimen corroded in 10 vol. % NaOH aqueous solution for 4 h; and (d) ligament detachment in a eutectic Al-Cu specimen directionally solidified and corroded.
Metals 08 00378 g006
Figure 7. Photographs of a HC-2 sample (a) before and (b) after corrosion in 10 vol. % NaOH for 24 h.
Metals 08 00378 g007
Figure 8. Surface of: (a) HC-2 and (b) EC samples after corrosion.
Metals 08 00378 g008
Figure 9. Example of steps for percent porosity estimation of one sample. (a) original SEM photograph; (b) removal of areas that do not correspond to the observed cutting plane; (c) conversion of the RGB image to binary image and black and white inversion, so that the white areas correspond to pores; and (d) boundaries of pores observed in the photograph.
Metals 08 00378 g009
Figure 10. SEM image of: (a) EC and (b) HC-2 samples corroded to determine pore and ligament size.
Metals 08 00378 g010
Figure 11. Box plot of: (a) pore size and (b) ligament size for the three compositions studied.
Metals 08 00378 g011
Figure 12. SEM images of: (a) a HC-2 sample with formation of aluminum hydroxide during selective dissolution and; (b) SEM image with more magnification than (a).
Metals 08 00378 g012
Figure 13. SEM image of (a) EC sample with aluminum oxide formation due to incorrect treatment after corrosion and; (b) SEM image with more magnification than (a).
Metals 08 00378 g013
Figure 14. XRD pattern obtained from non-corroded EC sample.
Metals 08 00378 g014
Figure 15. XRD diffraction pattern for corroded EC sample.
Metals 08 00378 g015
Figure 16. XRD diffraction pattern for EC sample corroded, without stirring during corrosion and aerated after that. Take from the same sample viewed in Figure 13.
Metals 08 00378 g016
Table 1. Summary of NPC from Al-Cu binary alloy.
Precursor Alloy (at %)SolutionPore Size (nm)Ligament Size (nm)Reference
Al75Cu25 and Al67Cu33NaCl50–200~[7]
Al75Cu25NaOH10–5010–50[8]
Al85Cu15HCl~60–120[9]
Al100-xCux, x = 33,35,40,50NaOH20–20020–200[10]
Al100-xCux, x = 33,35,40,50HCl and NaOH~100–500[11]
Al65Cu35NaOH~25–350[12]
NaOH25 ± 2030 ± 20[13]
Table 2. Observed reactions for samples directionally solidified in NaOH at different concentrations.
NaOH ConcentrationCorrosion Observation
1 vol. %Slow reaction, selective dissolution at long time.
10 vol. %Fast corrosion, selective dissolution at controlled periods of time.
25 vol. %Very fast and aggressive reaction, no selective dissolution.
Table 3. Pore and ligament size measurements.
TypeAverage Size (nm)Standard Deviation (nm)
ECHC-1HC-2ECHC-1HC-2
Pore689.7652.0959.5166.0304.3312.0
Ligament433.4584.51114.194.9261.0291.9

