Plasma Electrolytic Oxidation of High-Strength Aluminium Alloys—Substrate Effect on Wear and Corrosion Performance


1
Department of Corrosion Protection and Testing, EXCOR Korrosionsforschung GmbH, Magdeburger Straße 58, 01067 Dresden, Germany
2
Materials and Surface Engineering Group, Chemnitz University of Technology, D-09107 Chemnitz, Germany
*
Author to whom correspondence should be addressed.
Metals 2018, 8(5), 356; https://doi.org/10.3390/met8050356
Submission received: 12 April 2018
/
Revised: 7 May 2018
/
Accepted: 8 May 2018
/
Published: 15 May 2018
(This article belongs to the Special Issue Plasma Electrolytic Oxidation)
Abstract
:With the progress in materials science and production technology and the establishment of light-weight design in many fields of the industry, the application of light metals no longer requires only mechanical strength, but also a significant protection of the material against wear and corrosion. Hard and wear-resistant oxide coatings on aluminium are produced by plasma electrolytic oxidation (PEO). During PEO, a conversion of the aluminium substrate to a ceramic oxide takes place. While the role of strength-giving alloying elements like Cu, Mg/Si, Zn, and Zn/Cu on the PEO process has selectively been subject of investigation in the past, the significance of the alloy composition for the service properties of the coatings is still unknown. Therefore, the performance of PEO coatings produced on the widely used commercial high-strength alloys AlCu4Mg1 (EN AW-2024), AlMgSi1 (EN AW-6082), and AlZn5.5MgCu (EN AW-7075) is examined with regard to their behaviour in the rubber-wheel test according to ASTM G65 and the current density-potential behaviour of the substrates with undamaged and worn coatings in dilute NaCl solution. To give a reference to the unalloyed material the testings were carried out also on Al 99.5 (EN AW-1050) which was treated in an adjusted PEO process. Although differences in the conversion of intermetallic phases during PEO and the phase composition of the coatings on the various substrates are determined, the service properties are hardly depending on the alloying elements of the investigated aluminium materials. The wear rates in the rubber-wheel test are low for all the alloyed samples. The current density-potential curves show a decrease of the corrosion current density by approximately one order of magnitude compared to the bare substrate. Eventually, previous wear of the coatings does not deteriorate the corrosion behaviour. PEO layers on technically pure aluminum can resist the testing regimes if they are prepared in an electrolyte with an elevated silicate content and without additional hydroxide ions, during a longer process time.

1. Introduction
The growing environmental awareness has led to weight-reduction efforts for any components and assemblies, which are in motion during their service to increase the energy-efficiency of the system. The replacement of the conventional construction material steel by light metals, especially aluminium, plays a vital role in this respect. The development of high-strength alloys has allowed for the application of this material in many fields, which require mechanical strength. Yield strengths of over 300 MPa can be achieved especially with the age-hardenable alloying systems of the 2000 series (copper), the 6000 series (magnesium, silicon), and the 7000 series. However, a strengthening of the material as well as its surface to withstand not only mechanical loads, but also strong corrosive and tribological loads, cannot easily be achieved. Plasma electrolytic oxidation (PEO) is the method of choice for this case, since oxide-ceramic coatings of several ten to hundred microns of thickness with excellent coating/substrate bonding and high hardness are generated during this process. While the rather high electrical energy consumption of the process is admittedly a drawback, the operating materials (electrolytes) are usually environmentally friendly. PEO is a conversion coating process, which means that the metallic substrate is consumed for the production of the oxide ceramic coating under discharge action [1,2,3]. Thus, alloying elements in the substrate play a crucial role during the formation of the oxide coating and hence affect the structure of the coating, its composition, and its properties. Generally, PEO coatings on aluminium are comprised of various modifications of alumina (-, -, -, -AlO or amorphous AlO) [4,5,6]. Further phases also occur, which can include electrolyte components (e.g., mullite from silicate-containing electrolytes) [7,8,9]. The presence of elements such as Mg, Cu or Zn suppresses the transition from - to -alumina, which again leads to a decreased hardness [10,11]. Nevertheless, all these phases exhibit a significantly higher hardness compared to the substrate [12,13,14] and also compared to oxide coatings produced by anodising or hard-anodising. The high hardness, residual compressive stresses in the oxide coating [15], and the compact microstructure of the oxide coatings produced by PEO lead to a high wear resistance [12,16,17]. Since the oxide is chemically stable and its morphology is often compact, corrosion resistance is also enhanced [18,19,20]. In this regard, the incorporation of inhibitors or sealants into the coating leads to a further improvement [21,22,23]. The effect of the substrate alloy on the service properties of the PEO coatings has, however, been insufficiently addressed until now. Therefore, the current work utilises a PEO process in alkaline silicate solutions with bipolar-pulsed current to investigate the effect of three different, widely used commercial high-strength alloys on the corrosion and wear performance of the produced PEO coatings. Thus, the relevance and the significance of the influence of different alloy compositions on the integral wear and corrosion properties of the PEO coatings shall be clarified.
2. Materials and Methods
2.1. Substrate Materials and Coating Formation
Technically pure aluminium and three different commercially available alloys were used as substrate material for the PEO process. Their compositions are given in Table 1.
The samples were sheets of 100 mm × 25 mm with a thickness of 3 mm. Pretreatment included etching in 3 wt. % sodium hydroxide solution at 50 C for 3 min and subsequent pickling in 1:1 nitric acid at room temperature for 30 min. Each step was followed by rinsing under deionised water. The PEO process was carried out in a laboratory plant using a power supply capable of effectively providing 550 V and 50 A at the maximum (Plating Electronic, Sexau , Germany). Stainless steel sheets were used as counter electrodes in a basin with an electrolyte volume of 12 L, including the amount of electrolyte continuously pumped through a heat exchange to maintain the electrolyte temperature at 18 ± 2 C. The composition of the electrolytes used in this study is given in Table 2.
Electrolyte 1 was used for PEO processes on aluminum alloys in this study. Its base composition (silicate and hydroxide content) is known as suitable for the formation of compact and wear resistant PEO coatings on AlMgSi1 from earlier works [17]. The phosphate was added to buffer local acidification processes during the anodic half cycles on the electrodes, and thus to slow electrolyte aging. All the chemicals used were deployed by Sigma Aldrich and are of analytical grade. The process was current-controlled (bipolar rectangular pulse current, frequency 50 Hz, current density in both the anodic and the cathodic half-period 30 A/dm) and the PEO treatment time was 60 min. As the mentioned process parameters did not lead to technically relevant layers on Al 99.5, the samples were prepared in a modified solution with elevated silicate content and without additional hydroxide compounds, called electrolyte 2 in the following text. The process time was elevated up to 120 min. After the PEO process, the samples were rinsed under deionised water.
2.2. PEO Process Characterisation
The process voltage was monitored by a ScopeCorder DL850 (Yokogawa, Musashino, Japan). A 10:1 voltage probe was used to acquire the voltage signal from the electrodes. The measurement duration was 100 ms, the sampling rate was 1 MS/s. The measurements took place one time per second during the process initiation (first 95 s) and afterwards every 10 s. The recorded signals were filtered using a low-pass filter with a cutoff frequency of 15 kHz. Subsequently, minimum and maximum voltage values were extracted from every measurement. The resulting data were used to generate process time depending envelopes of the cathodic and anodic process voltage.
2.3. Coating Characterisation
The coating morphology and the coating thickness were assessed in the cross sections of the coatings by light microscopy with digital image analysis. Substrate distance depending profiles of the coatings Martens hardness were determined with a Fischerscope HM2000 XYm (Fischer, Sindeldingen, Germany). The test load was 100 mN, the application and the dwelling time of the test load were 30 s in each case (HM0.1/30/30). The visual appearance of the coatings was evaluated by colour measurement with a BYK Gardner Spectro-Guide Sphere Gloss-S (D65 illuminant, 10 observer angle, BYK Additves & Instruments, Duisburg, Germany). The colour values (L, a, b) were obtained from a circular area with a diameter of 15 mm at three different locations on three samples for each alloy. Scanning electron microscopy (SEM, LEO 1455VP, Zeiss, Jena, Germany) and energy-dispersive X-ray spectroscopy (EDX, GENESIS, EDAX, Mahwah, NJ, USA) were conducted to evaluate the morphology of the coatings in the cross section as well as their element contents; images were obtained in backscattered electron mode using 25 kV excitation voltage, working distance 16 mm). The phase composition of the coatings was determined by X-ray diffraction (XRD) analysis with a Bruker D8 Discover (Bruker, Billerica, USA) using Co-K radiation and a LynxEye-XE detector. A point focus tube with polycap optics was used in combination with a pinhole aperture of 1 mm diameter. The angular step width was 0.01, the effective step time 576 s. Additionally, electron backscatter diffraction (EBSD) measurements were carried out to evaluate the phase distribution within the PEO layers. Using a field emission SEM (NEON 40EsB, Zeiss, Jena, Germany) equipped with an EBSD system (OIM 5.31, EDAX TSL, Mahwah, NJ, USA), EBSD data sets were obtained at an acceleration voltage of 15 kV with a 120 m aperture in high current mode. The sample tilt was 70. The sampling step size was 150 nm. Using the software OIM 6.1 (EDAX TSL, Mahwah, NJ, USA), data analysis started with indexing the obtained Kikuchi patterns by cubic and trigonal alumina, followed by a careful cleanup procedure comprising neighbour confidence index (CI) correlation and grain CI standardization using a minimum CI of 0.1.
2.4. Wear and Corrosion Resistance
The wear performance of the coatings was determined in the rubber-wheel test according to ASTM G65 with a force of 130 N. The weight of the samples was determined before the rubber-wheel test and the weight measurement was repeated after abrasion distances of 71.8 m, 718 m and 1436 m (30 s, 5 min, 10 min corresponding to ASTM G65 procedure C, E, B, respectively). The procedure was aborted for the coatings on Al 99.5 after 718 m of wear distance because they did not resist the third step of the testing scenario. Six wear traces were used to determine the mean mass loss of the coatings for each of the substrates. The corrosion performance of the coatings was assessed by current density-potential curves obtained in 0.1 mol/L sodium chloride solution with a Potentiostat PS6 (Meinsberger, Weilheim, Germany). The active surface area was circular with a diameter of 1 cm. A three-electrode arrangement was used. A platinum sheet served as the counter electrode, a saturated Ag/AgCl electrode was the reference electrode. All potentials are given with reference to the standard hydrogen electrode (SHE). The size of the active area allowed for measurements within the wear traces of the rubber-wheel test. Thus, current density-potential curves were measured at bare samples, PEO-coated samples, and PEO-coated samples that previously underwent the rubber-wheel test (three independent samples for each of the states and each of the alloys). The principal arrangement and the dimensions of the significant features are shown in Figure 1.
The measurement was started at a potential approx. 200 mV below the free corrosion potential of the sample in the solution after an exposition of 30 min without polarisation. The potential was then increased with a rate of 1 mV/s and was terminated at a potential approx. 1000 mV above the just mentioned free corrosion potential. The corrosion current density was determined by fitting the Butler-Volmer equation to the registrated curves with the free corrosion potential as the zero of the curve:
The variables are i—current density, —corrosion current density, —charge transfer coefficient, z—amount of electrons involved in the reaction, F—Faraday constant (96,485.34 C·mol), R—universal gas constant (8.31446 J·molK), T—temperature (298.15 K), E—electrode potential, —free corrosion potential. The best fit results were obtained for and . Curve fitting was conducted in Matlab (version 2015a, TheMathWorks, Natick, MA, USA).
3. Results and Discussion
3.1. Electrical Process Data
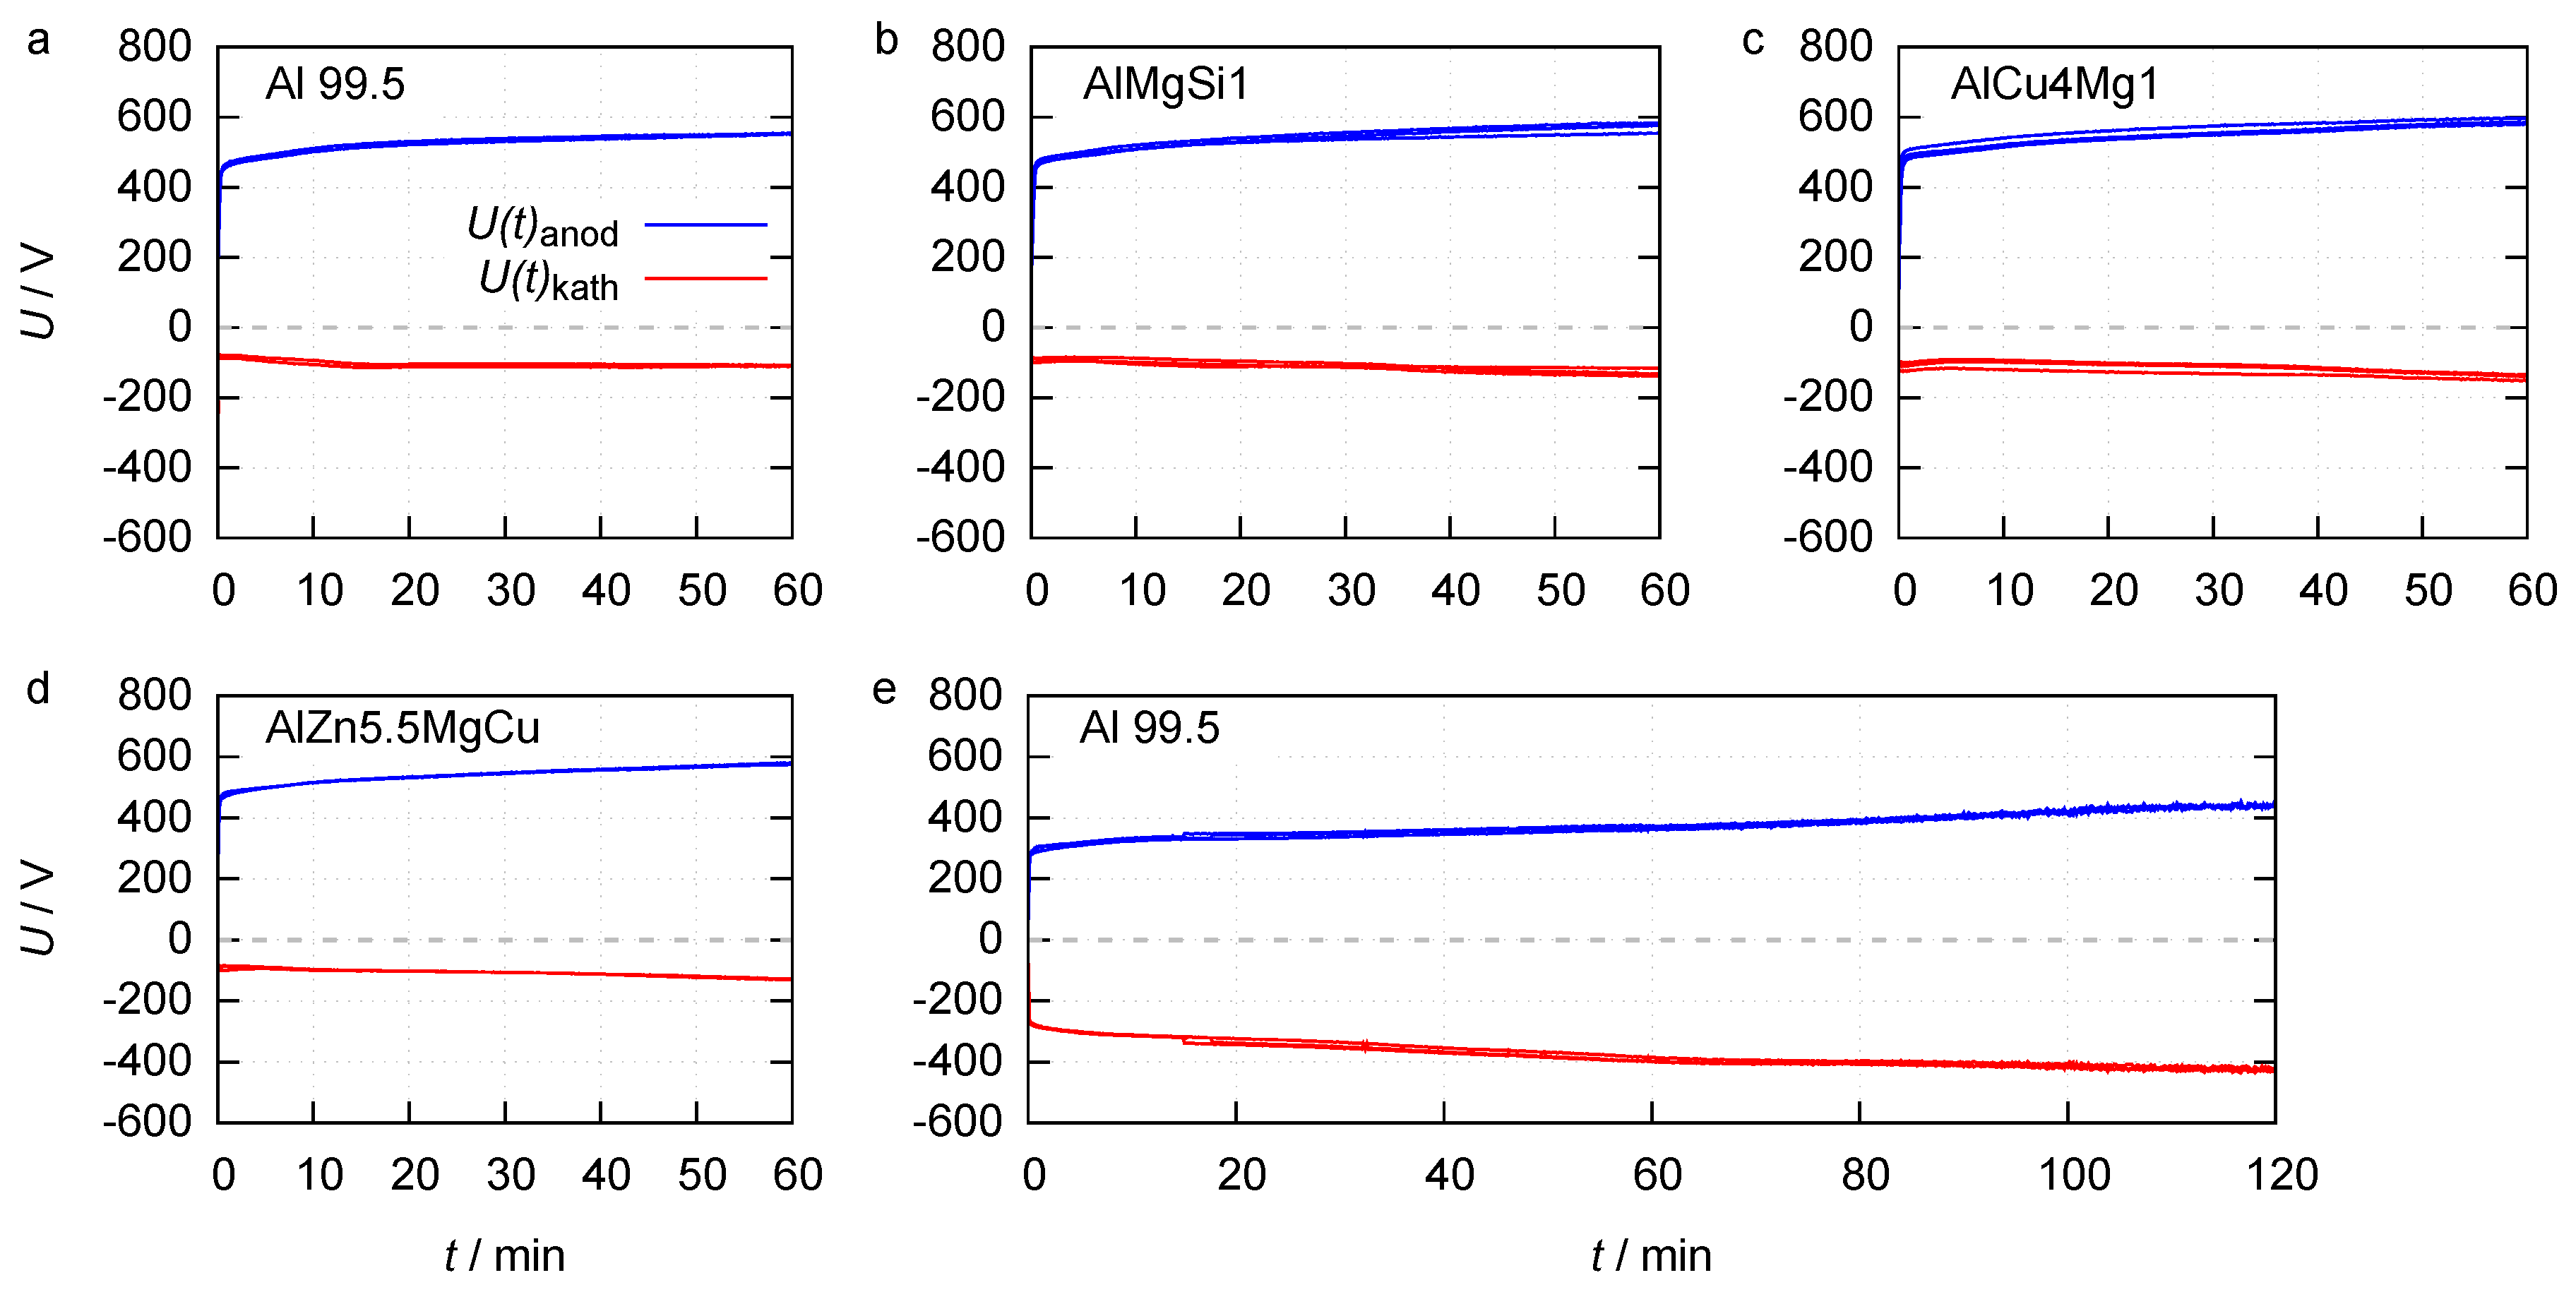
The anodic and cathodic envelopes of the process voltages are depicted in Figure 2.
The course of the voltage envelopes is quite similar for the processes in electrolyte 1. The maximum anodic voltage increases rapidly and linearly during the first seconds, until rising to a characteristic value of around 440 V which can be identified as the ignition voltage. Subsequently, the voltage increases slower until the end of the process. For the Al 99.5 substrate the maximum anodic voltage at the end of the process is 555 V. The maximum cathodic voltage increases from 73 V at PEO initiation up to 110 V at the process end. The maximum cathodic voltage at PEO initiation (90 V), as well as the maximum anodic and cathodic voltage at the end of the process (580 V and 100 V), are almost identical for the PEO on the three high strength alloys. The fact that the ignition voltage on all four materials is similar, but the rise of the maximum anodic and cathodic process voltage in dependency of the process time is lower on technically pure aluminium, indicates that the layer formation is limited during these processes. The envelopes of the PEO on Al 99.5 in electrolyte 2 are nearly symmetric to the time axes. After achieving the ignition voltage of approximately 270 V, the maximum anodic voltage rises up to 439 V at the process end. The maximum cathodic voltage grows from 272 V up to 428 V between PEO initiation and the end of the process. The lowered ignition voltage in electrolyte 2 can be explained by a reduced activation energy for the injection of electrons of the electrolyte during the discharge initiation, as a result of the elevated silicate content [24]. The high increase of the anodic voltage between discharge initiation and process end suggests a high layer growth. The high cathodic voltage over the entire process time could indicate that, under these certain process conditions, cathodic discharges took place.
3.2. Coating Morphology and Composition
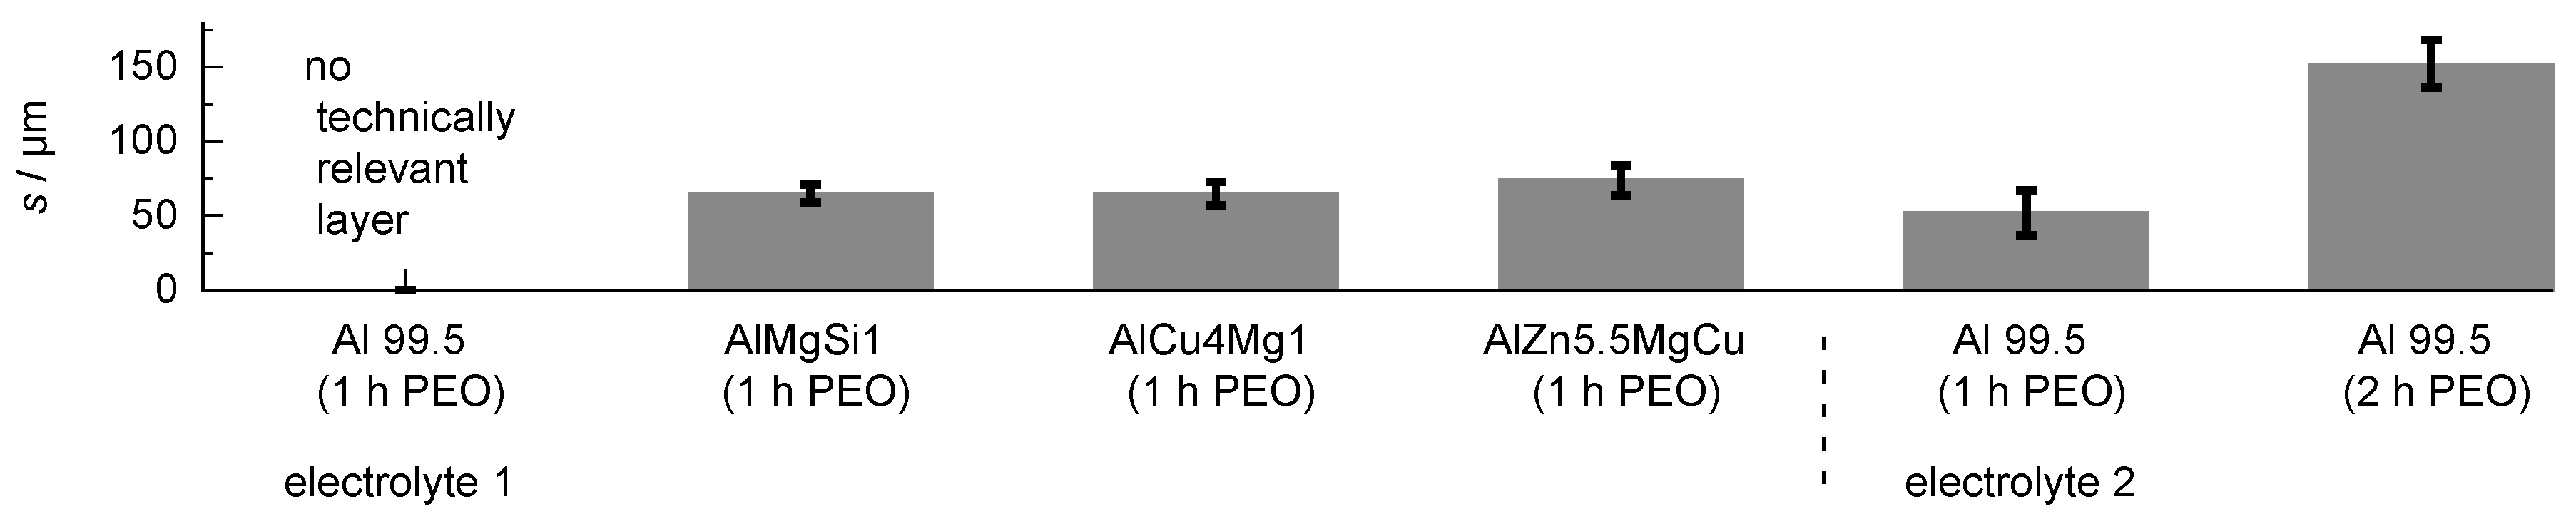
The coating thickness in dependence of the substrate material and the adjusted process parameters is given in Figure 3.
Although numerous discharge events were visible on the whole sample over the entire process time, the PEO treatment of Al 99.5 in electrolyte 1 did not lead to the formation of a technically relevant layer after 1 h. One explanatory approach for this could be that the aluminum oxide modifications which are formed on pure aluminum under PEO conditions are subjected to a much stronger chemical re-dissolution by the electrolyte. The PEO process on Al 99.5 in electrolyte 2 leads to formation of a oxide coating of m after 1 h and of m after 2 h of treatment time. The improved layer formation can be explained by better passivation behaviour of electrolyte 2 because of its elevated silicate content, and a lower chemical re-dissolution of the formed oxide as a result of the waiver of additional hydroxide compounds [25]. The highest coating thickness for the high strength materials was obtained for the AlZn5.5MgCu alloy ( m), while the coating thickness for the AlMgSi1 alloy and the AlCu4Mg1 alloy was almost identical with m and m, respectively. Cross sections of the coatings are given in Figure 4.
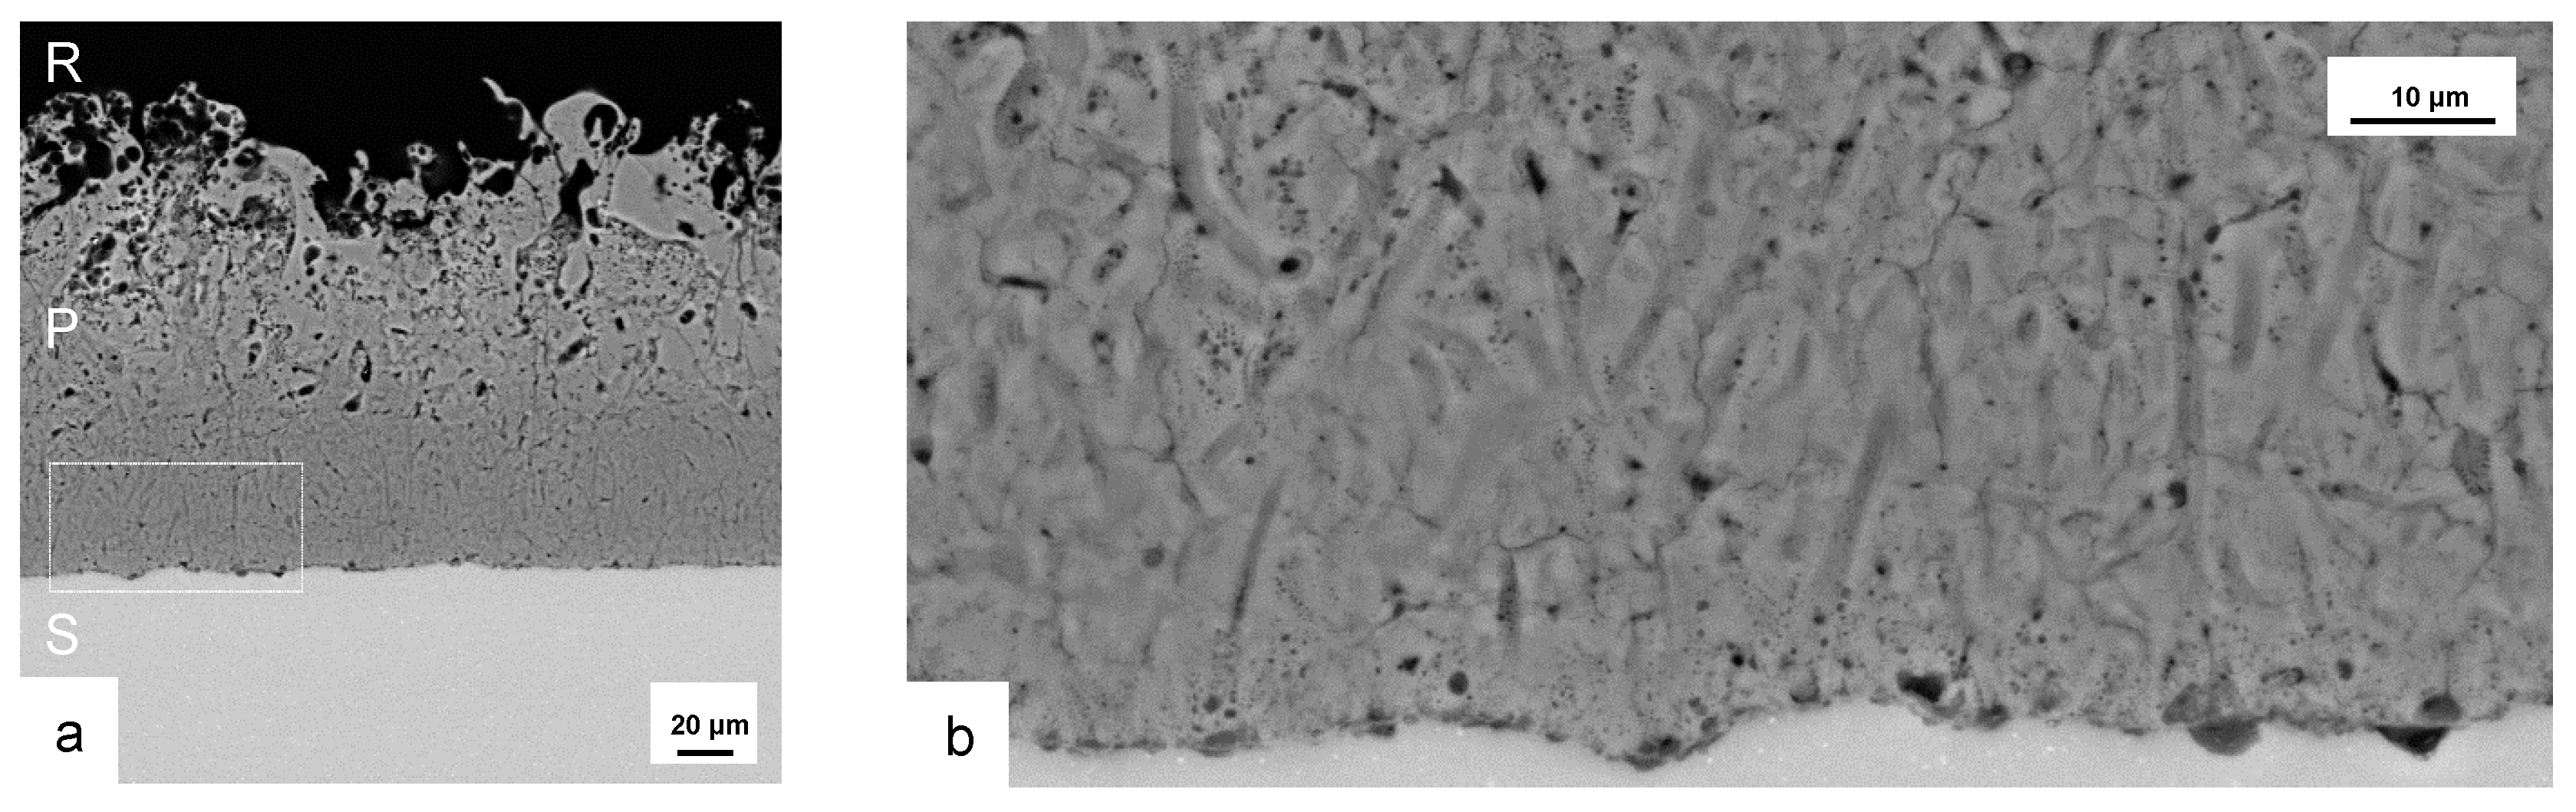
The layer formed on Al 99.5 in electrolyte 1 is very thin and shows a lot of inhomogeneities. Other parts of the sample were nearly uncoated. So the process parameters used are not suitable for a formation of protective PEO surfaces on this material. The images of the further layers show the typical morphology of PEO coatings with a rather loose structure in the outer region (technological layer) and a compact oxide in the inner region (working layer). The inner region of the coating includes some smaller flaws in the micron range as well as a micro-crack network. With regard to the morphology of the outer, more porous, and the inner, compact layer, no significant differences are visible between the oxide coatings on the high strength alloys formed in electrolyte 1. The structural defects of the layer formed on Al 99.5 in electrolyte 2 show a similar distribution but are more numerous and larger. Since these coatings did not withstand the rubber-wheel test, they were not taken into account for the further investigations. Figure 5 shows a cross section of the PEO coating formed on Al 99.5 in electrolyte 2 after 2 h of treatment time (a) and a magnification of its interface zone between layer and substrate (b).
The morphology of the coating can be subdivided into technological and working layer also. However it is noticeable that the working layer is pervaded by elongated vertical structures of increased porosity in micron and submicron range which reach up to the substrate. These structures can be interpreted as results of single discharges which formed less dense oxide zones. Further information is gained by analysis of the element content in the cross sections of the coatings by EDX. Point measurements of the coating formed in electrolyte 2 on Al 99.5 after 2 h of PEO treatment show the presence of stoichiometric AlO with less than 1 wt. % of silicon. The outer part of the porous technological layer shows an elevated Si-content of 3–4 wt. %. These observations suggest a significant incorporation of electrolyte constituents during the PEO, which is pronounced stronger at the outer part of the layer. For the AlMgSi1 substrate, likewise, silicon is detected only in the outer region of the coating. The silicon content is approx. 2–3 wt. %, which significantly exceeds the silicon content in the alloy and is thus attributed to the incorporation of electrolyte components also. Further, the oxide coatings on the AlMgSi1 alloy contain a low amount of magnesium (<1 wt. %). Interestingly, primary iron-containing intermetallic phases are observed to take part in the substrate conversion process as shown in Figure 6.
At the substrate/oxide interface, a Al(SiFeMn) phase is found to be oxidized in steps. The EDX analysis of the intermetallic phase shown in Figure 6 in comparison to similar intermetallic phases in the unaffected substrate reveals a depletion of iron and manganese with a concurrent slight enrichment of magnesium and a significant increase in oxygen content. No iron or manganese is detected in the PEO coatings, which indicates that these elements are eventually dissolved into the electrolyte. In any case, not even one of the observed intermetallic phases with such a conspicuous element content variation is detected in the whole unaffected substrate in the considered cross-section. Since this phenomenon appears at the oxide/substrate interface and a significant amount of oxygen is detected by EDX only in this phase, which appears darker in Figure 6, it is ascribed to the oxidation of the substrate during the PEO process. For the AlCu4Mg1 substrate, a low amount of copper is detected in the inner, compact part of the coating. In the outer, more porous part of the coating, a low, yet substantial amount of silicon (approx. 2 wt. %) is detected, which originates from the silicate electrolyte. Figure 7 shows a detail of a PEO coating on the AlCu4Mg1 alloy using backscattered electrons (material contrast). The regions with a high brightness correspond with the occurrence of copper, which was identified by EDX analysis (not shown here). Copper is incorporated into the coating presumably as copper oxide. However, the occurrence of the copper-rich regions obviously does not cause exorbitant flaw formation in the coating, e.g., because of excessive oxygen evolution at copper-containing intermetallic phases.
For the AlZn5.5MgCu alloy, again a significant silicon content is detected in the outer, porous layer of the PEO coating. In the compact part of the coating, a significant amount of magnesium and zinc (1–2 wt. %) is detected by EDX, while copper, which is also a main alloying element in this substrate, hardly appears in the coating at all.
Information on the phase composition of the coatings is derived from XRD. The phase composition of the coatings depends on the substrate. Figure 8 shows the X-ray diffraction diagram for the PEO coatings on the four investigated materials. The highest characteristic intensities of the phases are denoted with symbols above the diffraction diagrams.
The diffractogram of the PEO layer on technically pure aluminum differs from the other patterns by significant peaks of the aluminum silicon mixed oxide mullite. The appearance of this phase can be explained by the incorporation of constituents of electrolyte 2, in which the silicate content was higher. The diffraction pattern of the coatings on the high strength alloys are similar and show characteristic peaks for the -, - and -phases. However, it is noticeable that on the AlZn5.5MgCu alloy the peaks for the -phase are distinctly less pronounced. It can thus be stated that the existence of zinc in the alloy obviously impedes the formation of the -alumina phase, which is supported by the results of other researchers [10,11]. The results of the EBSD measurement show the distribution of the single phases within the layers and are depicted in Figure 9.
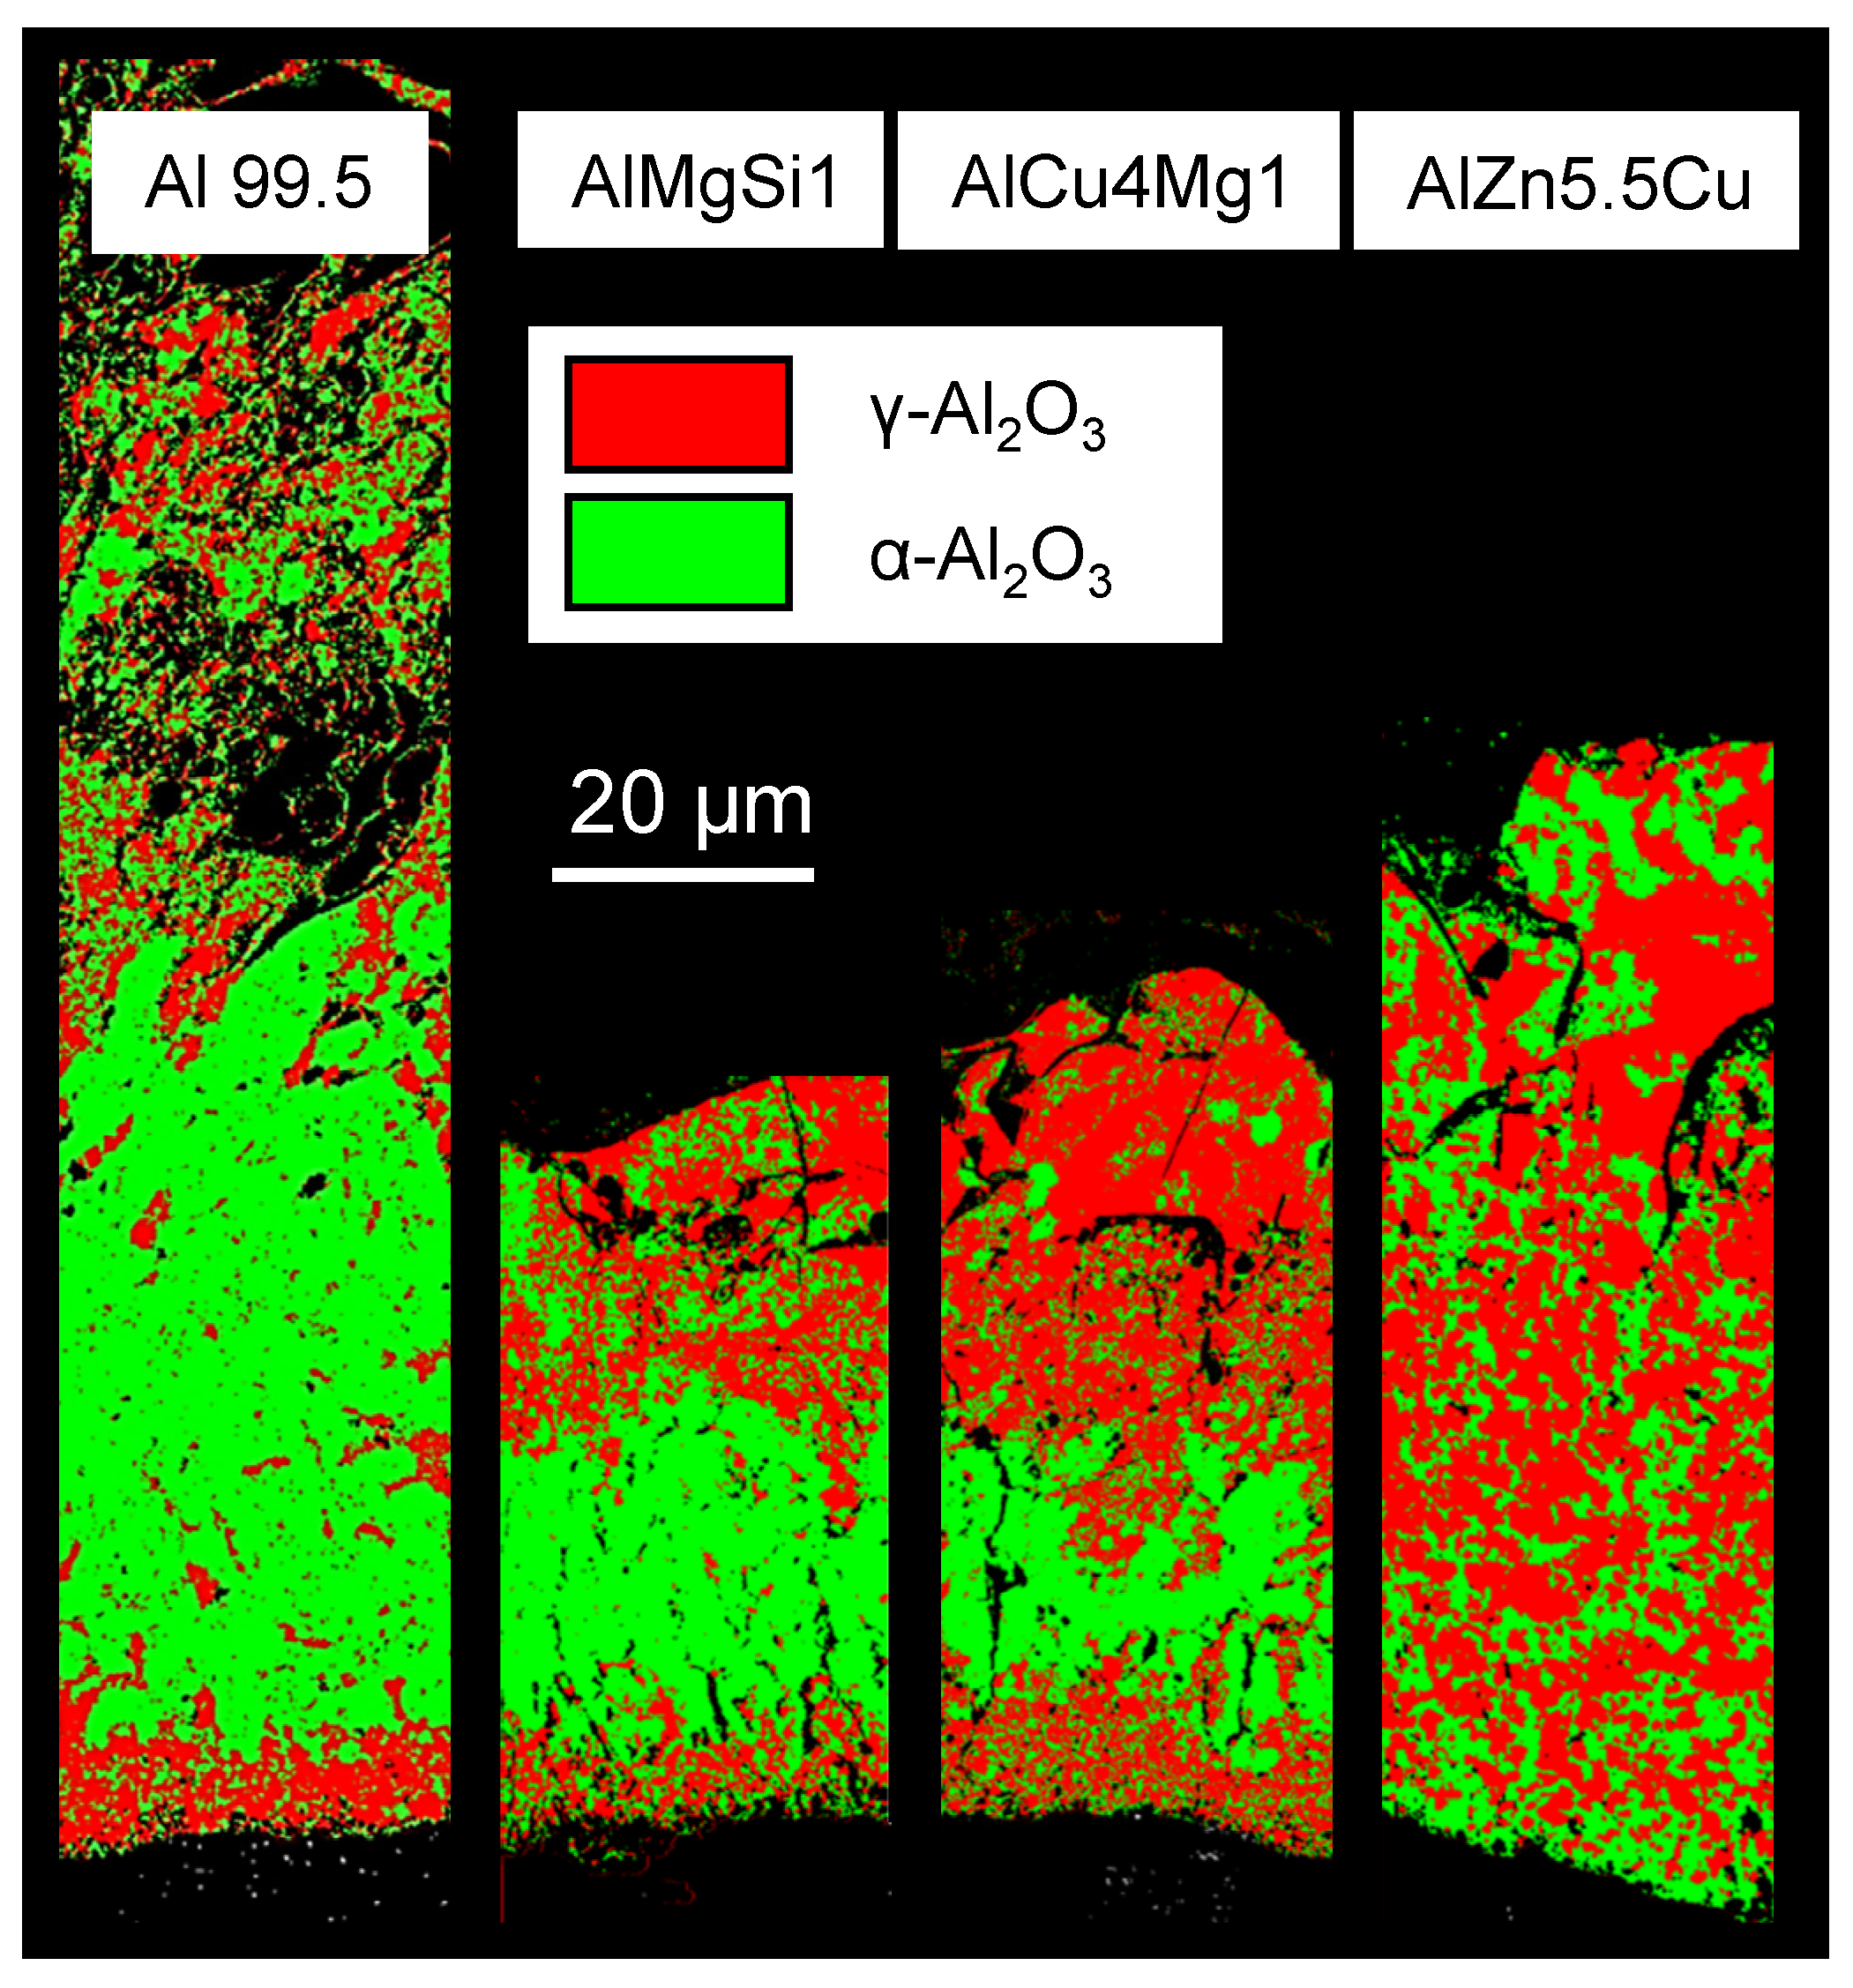
Because of the insufficient data base for analysis of the -alumina phase and mullite, only - and -alumina were considered in this mapping. The last mentioned phase is also known as corundum and is the hardest AlO-modification. The phase distribution on Al 99.5, AlMgSi1 and AlCu4Mg1 shows some similarities. The -phase dominates at the substrate/layer-interface. The corundum constituents are located above this zone, within the first half of the layer. The outer parts of the coating are dominated by the -phase also. Respecting the fact that the layer is growing into the substrate during the PEO process this conspicuous phase distribution can be interpreted as follows. The aluminium oxide is formed as the -phase firstly, which explains the elevated -AlO content at the substrate/layer-interface. Afterwards occurs a successive transformation from - to -AlO because of the high temperature around the plasma discharge channels. This leads to the enrichment of corundum within the inner part of the working layer. However this transformation mechanism seems to be onset only in later process stadiums during the formation of the inner working layer. This would explain why the outer areas of the PEO layers show no elevated corundum content. The EBSD mappings of the layers on AlMgSi1 and AlCu4Mg1 furthermore show the conspicuousness of a relatively clear demarcation between the and -alumina rich layer zone. This indicates that the process stages responsible for the formation of the individual layer areas also differ significantly, for example by their discharge behaviour. Thus, further research based on the methods of optical and spectroscopic process observation could be suitable for the investigation of these oxide transformation mechanisms. The phase distribution within the layer on AlZn5.5MgCu differs significantly from the other investigated coatings. The -alumina phases are homogeneously distributed within the layer and show a clear enrichment close to the substrate/layer-interface. This observation is in accordance with the works of Sundararajan [5] but cannot be explained by the data obtained by this study. It indicates complex interaction between the aluminium oxide formation and transformation and the substrate alloying elements during the PEO process. In consideration of the properties of the coatings in service, e.g., wear resistance, it has previously been found that the phase composition of the coating plays a minor role in comparison to the morphology [17].
3.3. Coating Hardness
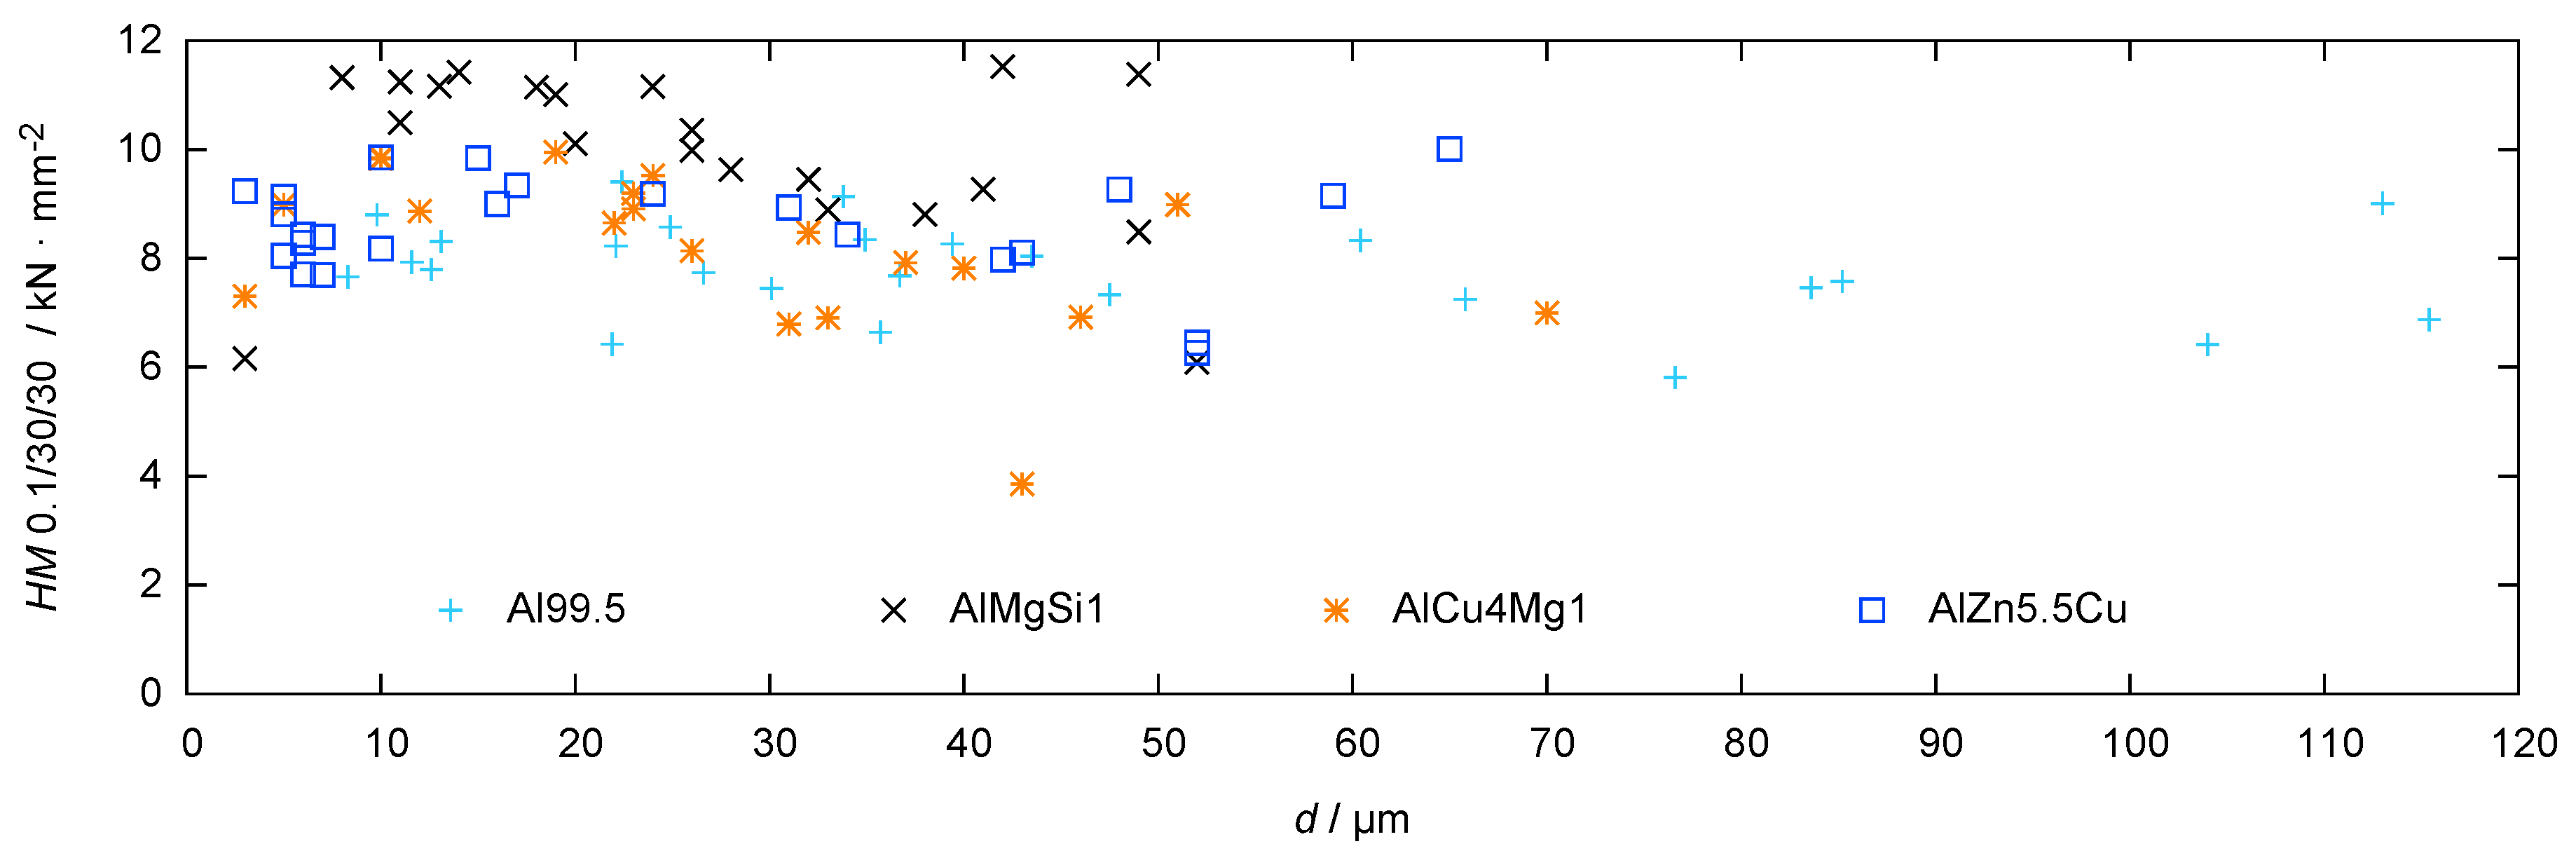
The results of the hardness measurements in dependence of the substrate distance are shown in Figure 10.
The high test load of 100 mN allows for an integral assessment of the coating hardness. In other words, the size of the hardness indents are at least in the same order of magnitude as the typical flaws in the coating. Thus, the measured values are expected to reflect both the phase composition and the coating morphology. All investigated coatings show a graded hardness profile which is in good correlation with the findings regarding layer morphology and phase composition. In general, the inner zone shows a higher hardness than the outer one, which can be explained by the denser structure of the working layer in comparison to the technological layer (see Figure 4). In addition, in case of Al 99.5, AlMgSi1 and AlCu4Mg, the increased hardness in the inner layers can be explained by the enrichment of corundum in these regions (see Figure 9). However, the coatings which were obtained on technically pure aluminum show the lowest hardness values despite their high amount of this phase. This can be attributed to the numerous defects within these layers (see Figure 5). The coatings which were generated on AlZn5.5MgCu show elevated hardness values close to the substrate and a hardness profile with a small fluctuation range at the outer zones. This can be attributed to the enriched corundum content at the substrate/layer-interface and the uniform distribution of corundum and the -phase within the rest of the layer (see Figure 9). Nevertheless, compared to the bare aluminium substrate, which has a hardness of approx. 1900 N/mm (measurement of the AlZn5.5MgCu alloy), the hardness is in any case significantly increased by the PEO coating.
3.4. Visual Coating Appearance
The results of the colour measurements for the assessment of the visual appearance of the coated alloys are provided in Table 3.
The L-value representing the brightness decreases with an increasing amount of alloying elements in the coating (copper and zinc). With respect to the colour (a-, b-value), each of the alloys leads to a characteristic appearance of the oxide coatings. With regard to the deviation of the values, the oxide coatings on technically pure aluminum and the AlMgSi1 alloy exhibit a mostly uniform appearance, which is reflected by the low standard deviations of the L-, a-, and b-values. Meanwhile, the other two alloys—independent of the likewise compact coating structure—lead to the formation of an oxide with a darker and also “cloudy” appearance, which is reflected by the higher standard deviations of the characteristic colour values. With the described PEO process, it is thus not possible to form oxide coatings of unobjectionable visual appearance on the AlZn5.5MgCu and the AlCu4Mg1 alloy. This can also be attributed to the incorporation of copper and zinc in the coatings in the form of oxides, which—despite of the low amounts of elements and because of their uneven distribution in the coating—presumably lead to the “cloudy” appearance.
3.5. Wear Behaviour
Figure 11 shows the evolution of the mass loss during the rubber-wheel test for the PEO-coated AlCu4Mg1 alloy.
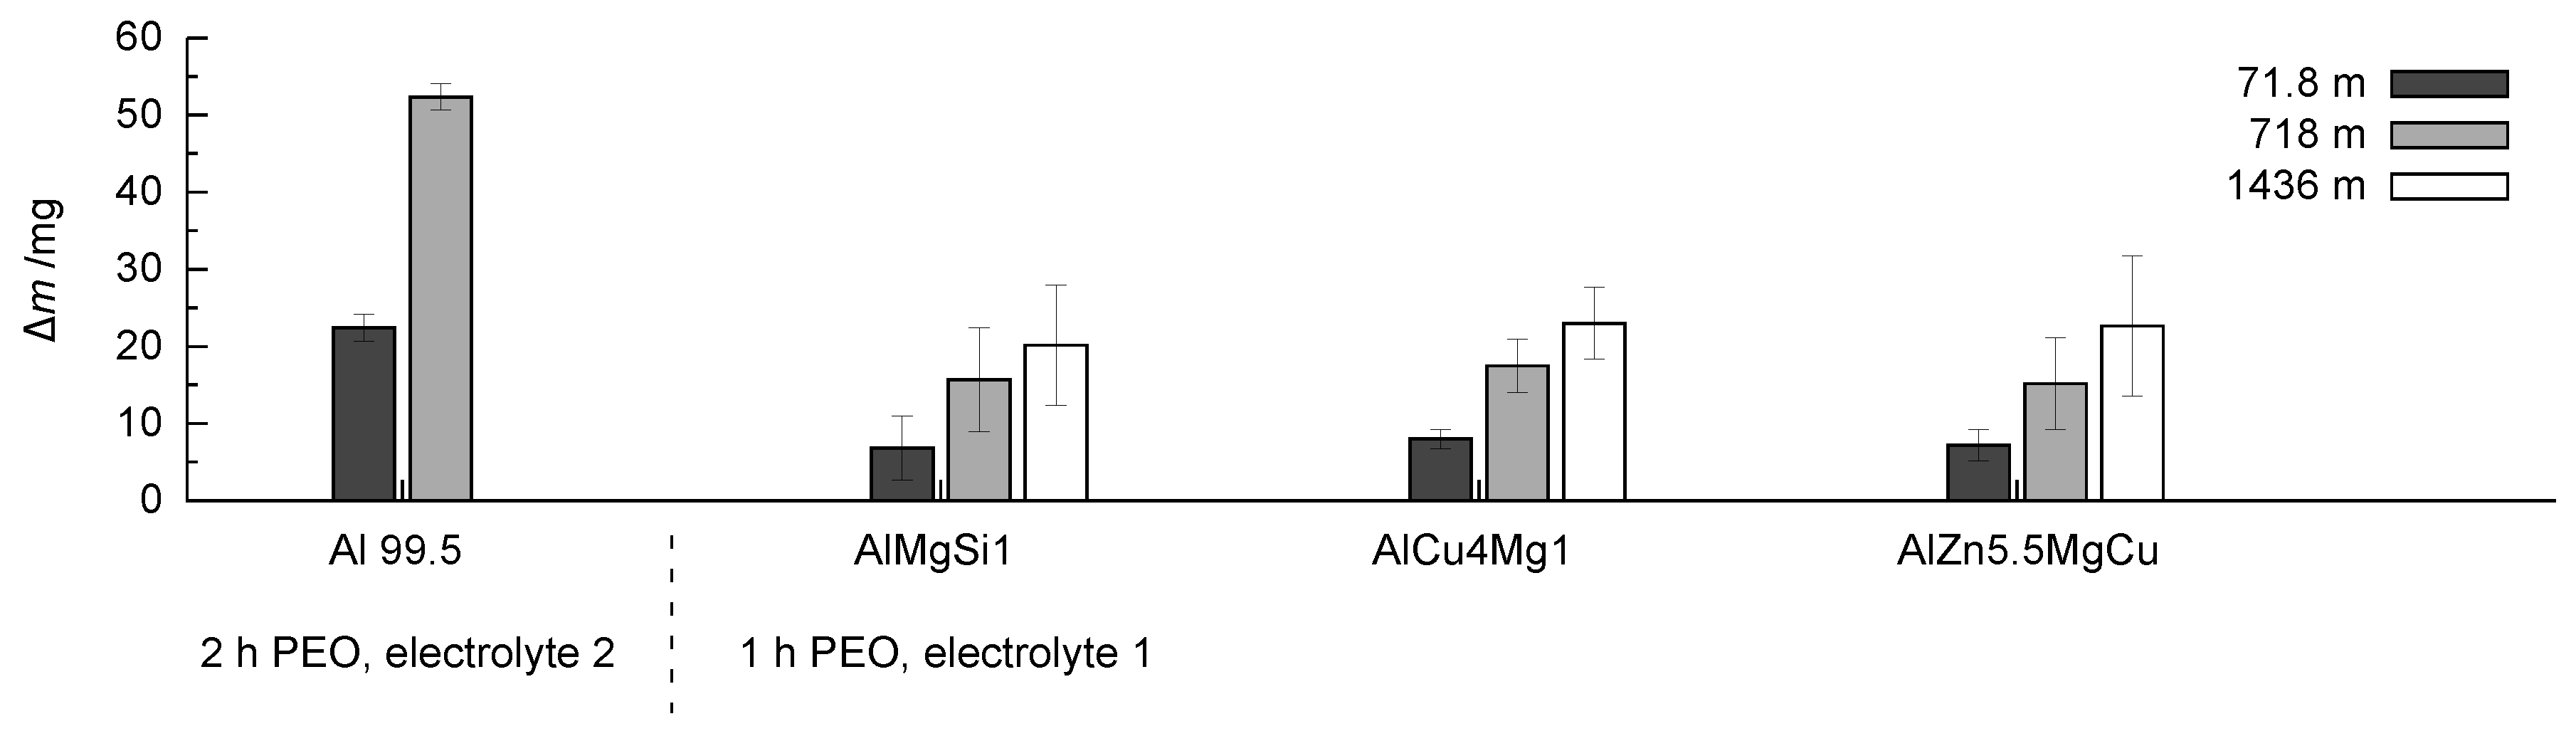
It is recognisable that, within the first stage of the test, a comparably high mass loss occurs. This is due to the initial wear of the sample and the removal of the outer, rather porous layer, which is an expected result. With increasing wear distance, the mass loss is growing more slowly, which is due to the loading of the less porous, compact inner part of the oxide coating. This behaviour is similar for the coatings which were obtained on the three high strength alloys after 1 h of treatment in electrolyte 1. Figure 12 shows the values of the mass loss obtained for the different coatings.
The coating generated on technically pure aluminium shows high mass loss after the second testing step also. Further testing of the layer up to 1436 m wear path leads to layer failure, therefore, the measured mass losses are not listed here. The coatings generated on the three high strength alloys shows a completely different behaviour. While the trends of a rather high initial wear and a comparably low mass loss become evident in the further course of the rubber-wheel test, the results do not differ significantly when the coatings on the three high strength alloys are compared to each other. Despite of the high test load (130 N), the absolute amount of wear remains exceptionally low for all of the samples (for a comparison to state-of-the-art hard coatings, refer to [26]). The established differences in the phase composition, the element content, and the hardness profile of the coatings obviously do not affect the wear performance significantly. As can be seen in Figure 13, even after a sliding distance of 1436 m, a sufficient stock of compact oxide coating is available to face further wear.
3.6. Corrosion Behaviour
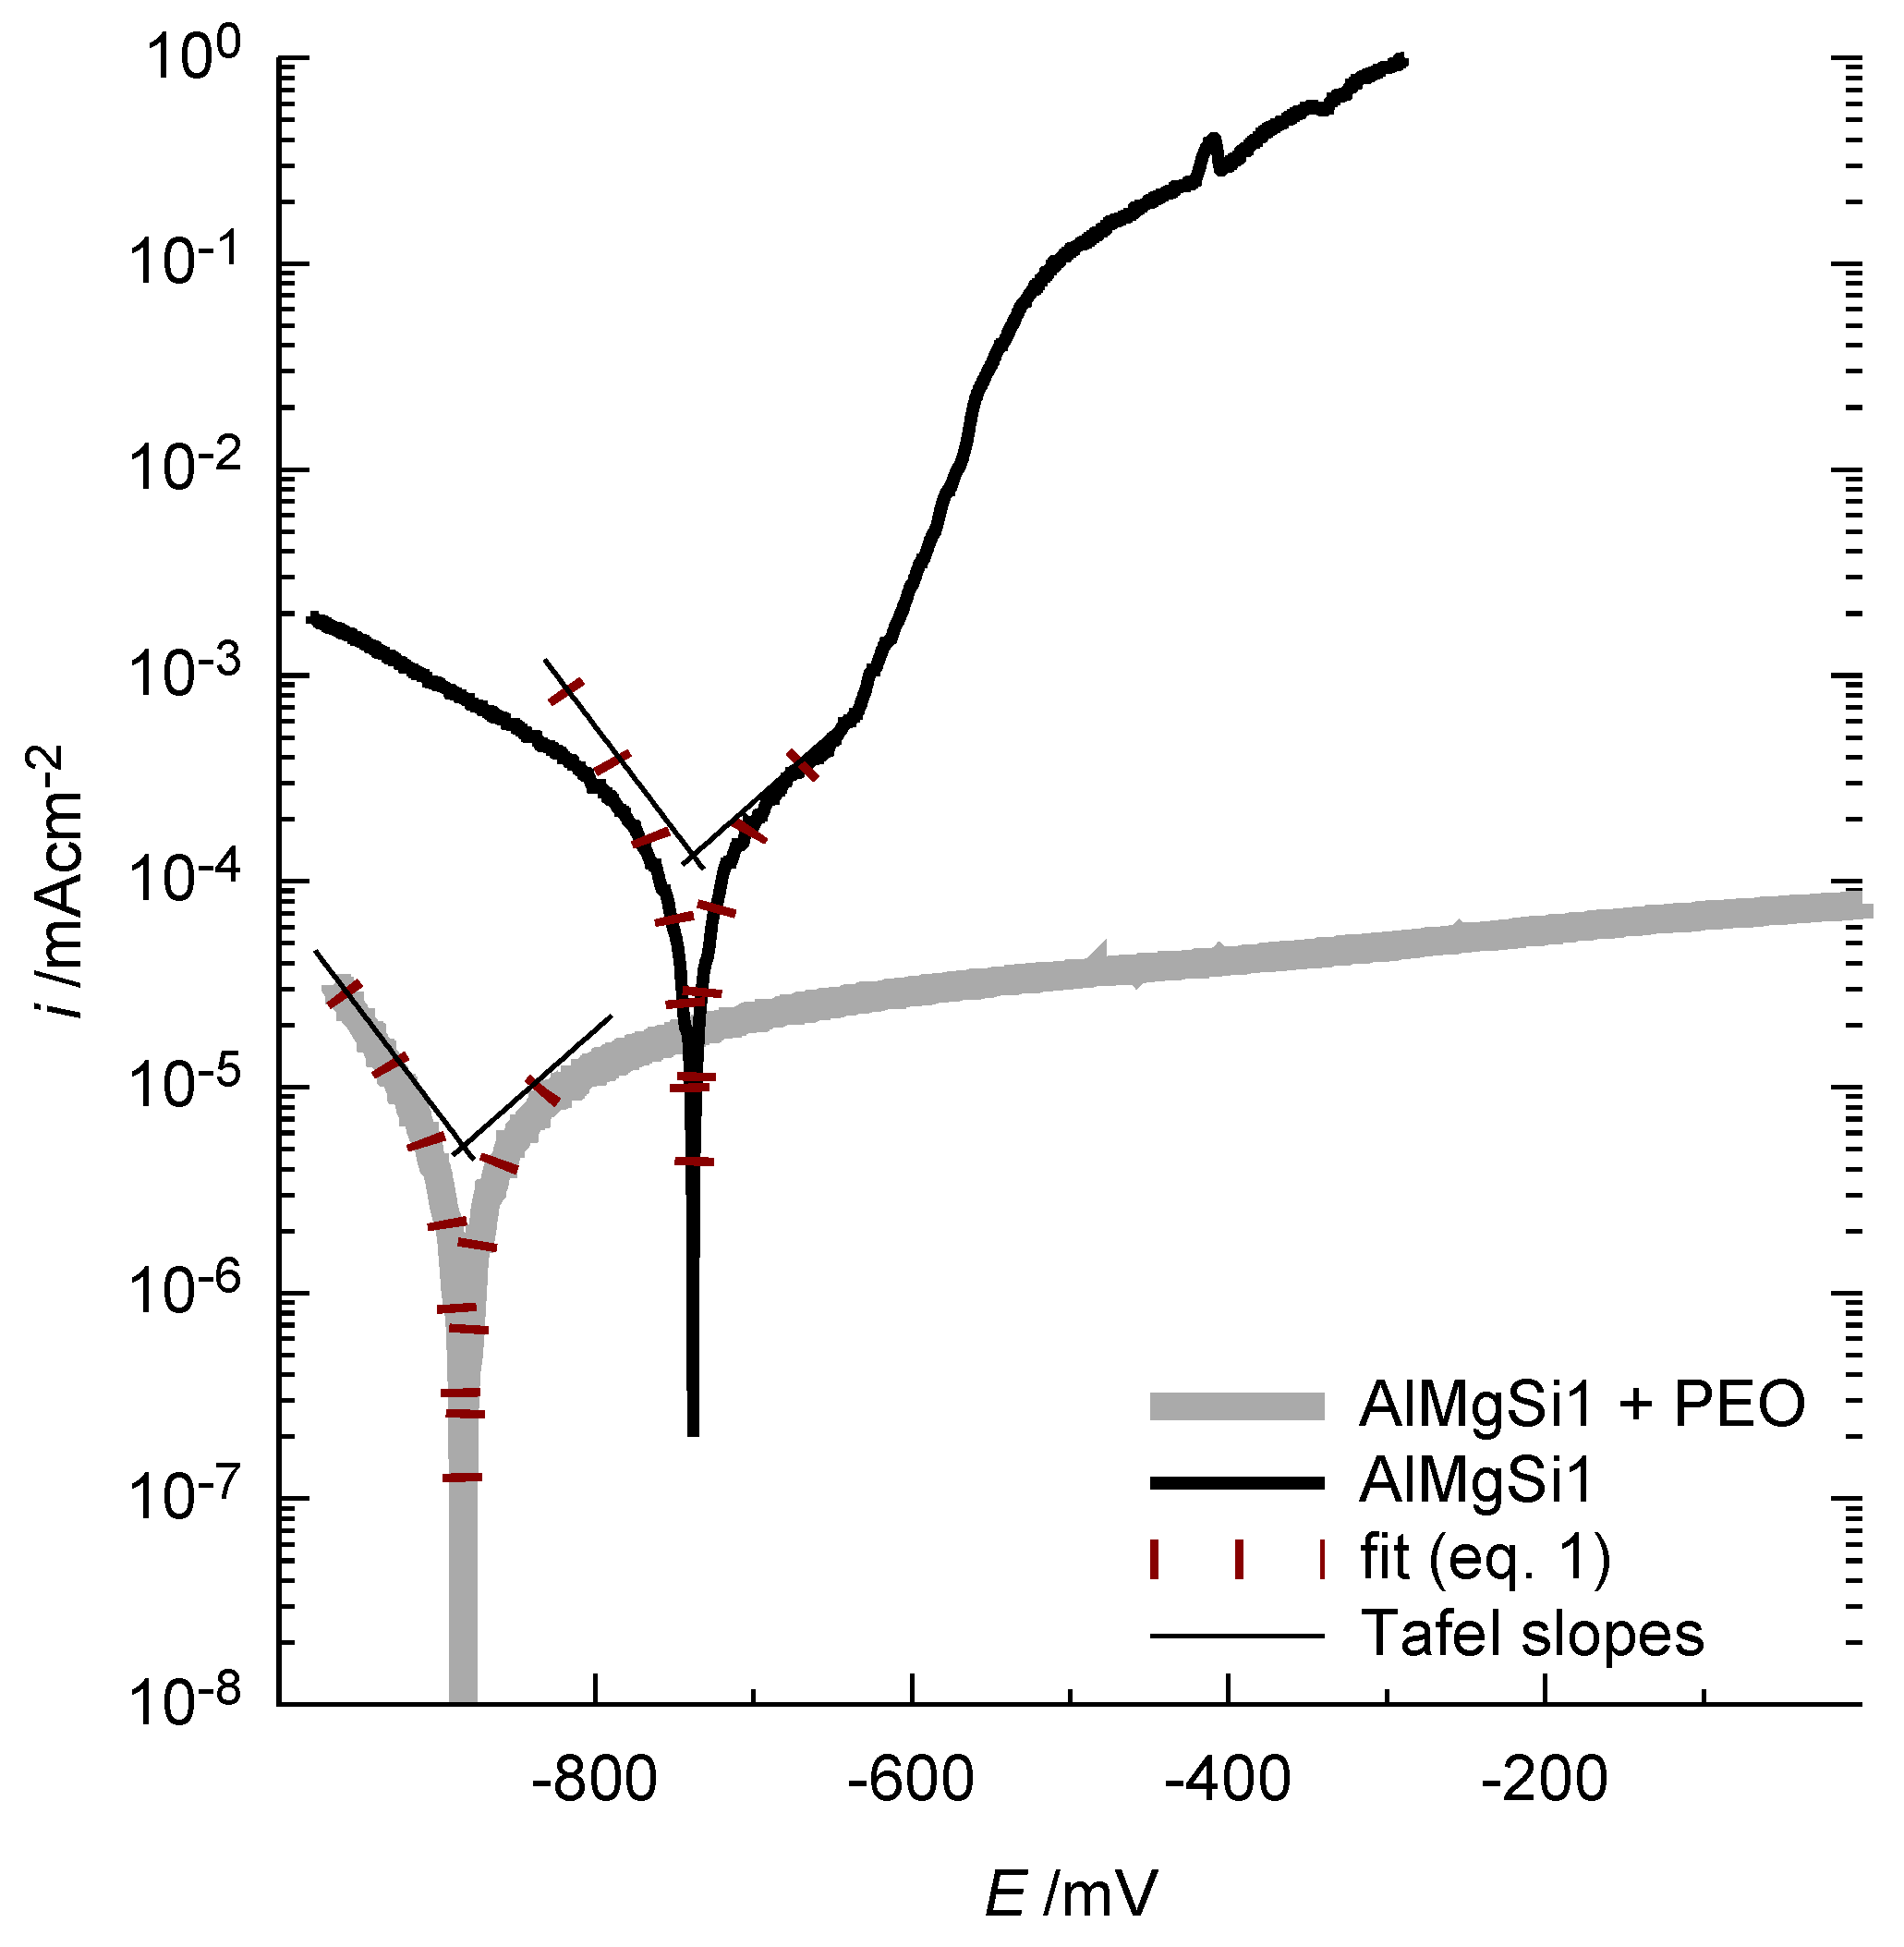
The results of the corrosion test are set out below. Figure 14 shows a representative current density-potential curve in dilute sodium chloride solution for a bare and a PEO-coated AlMgSi1 substrate.
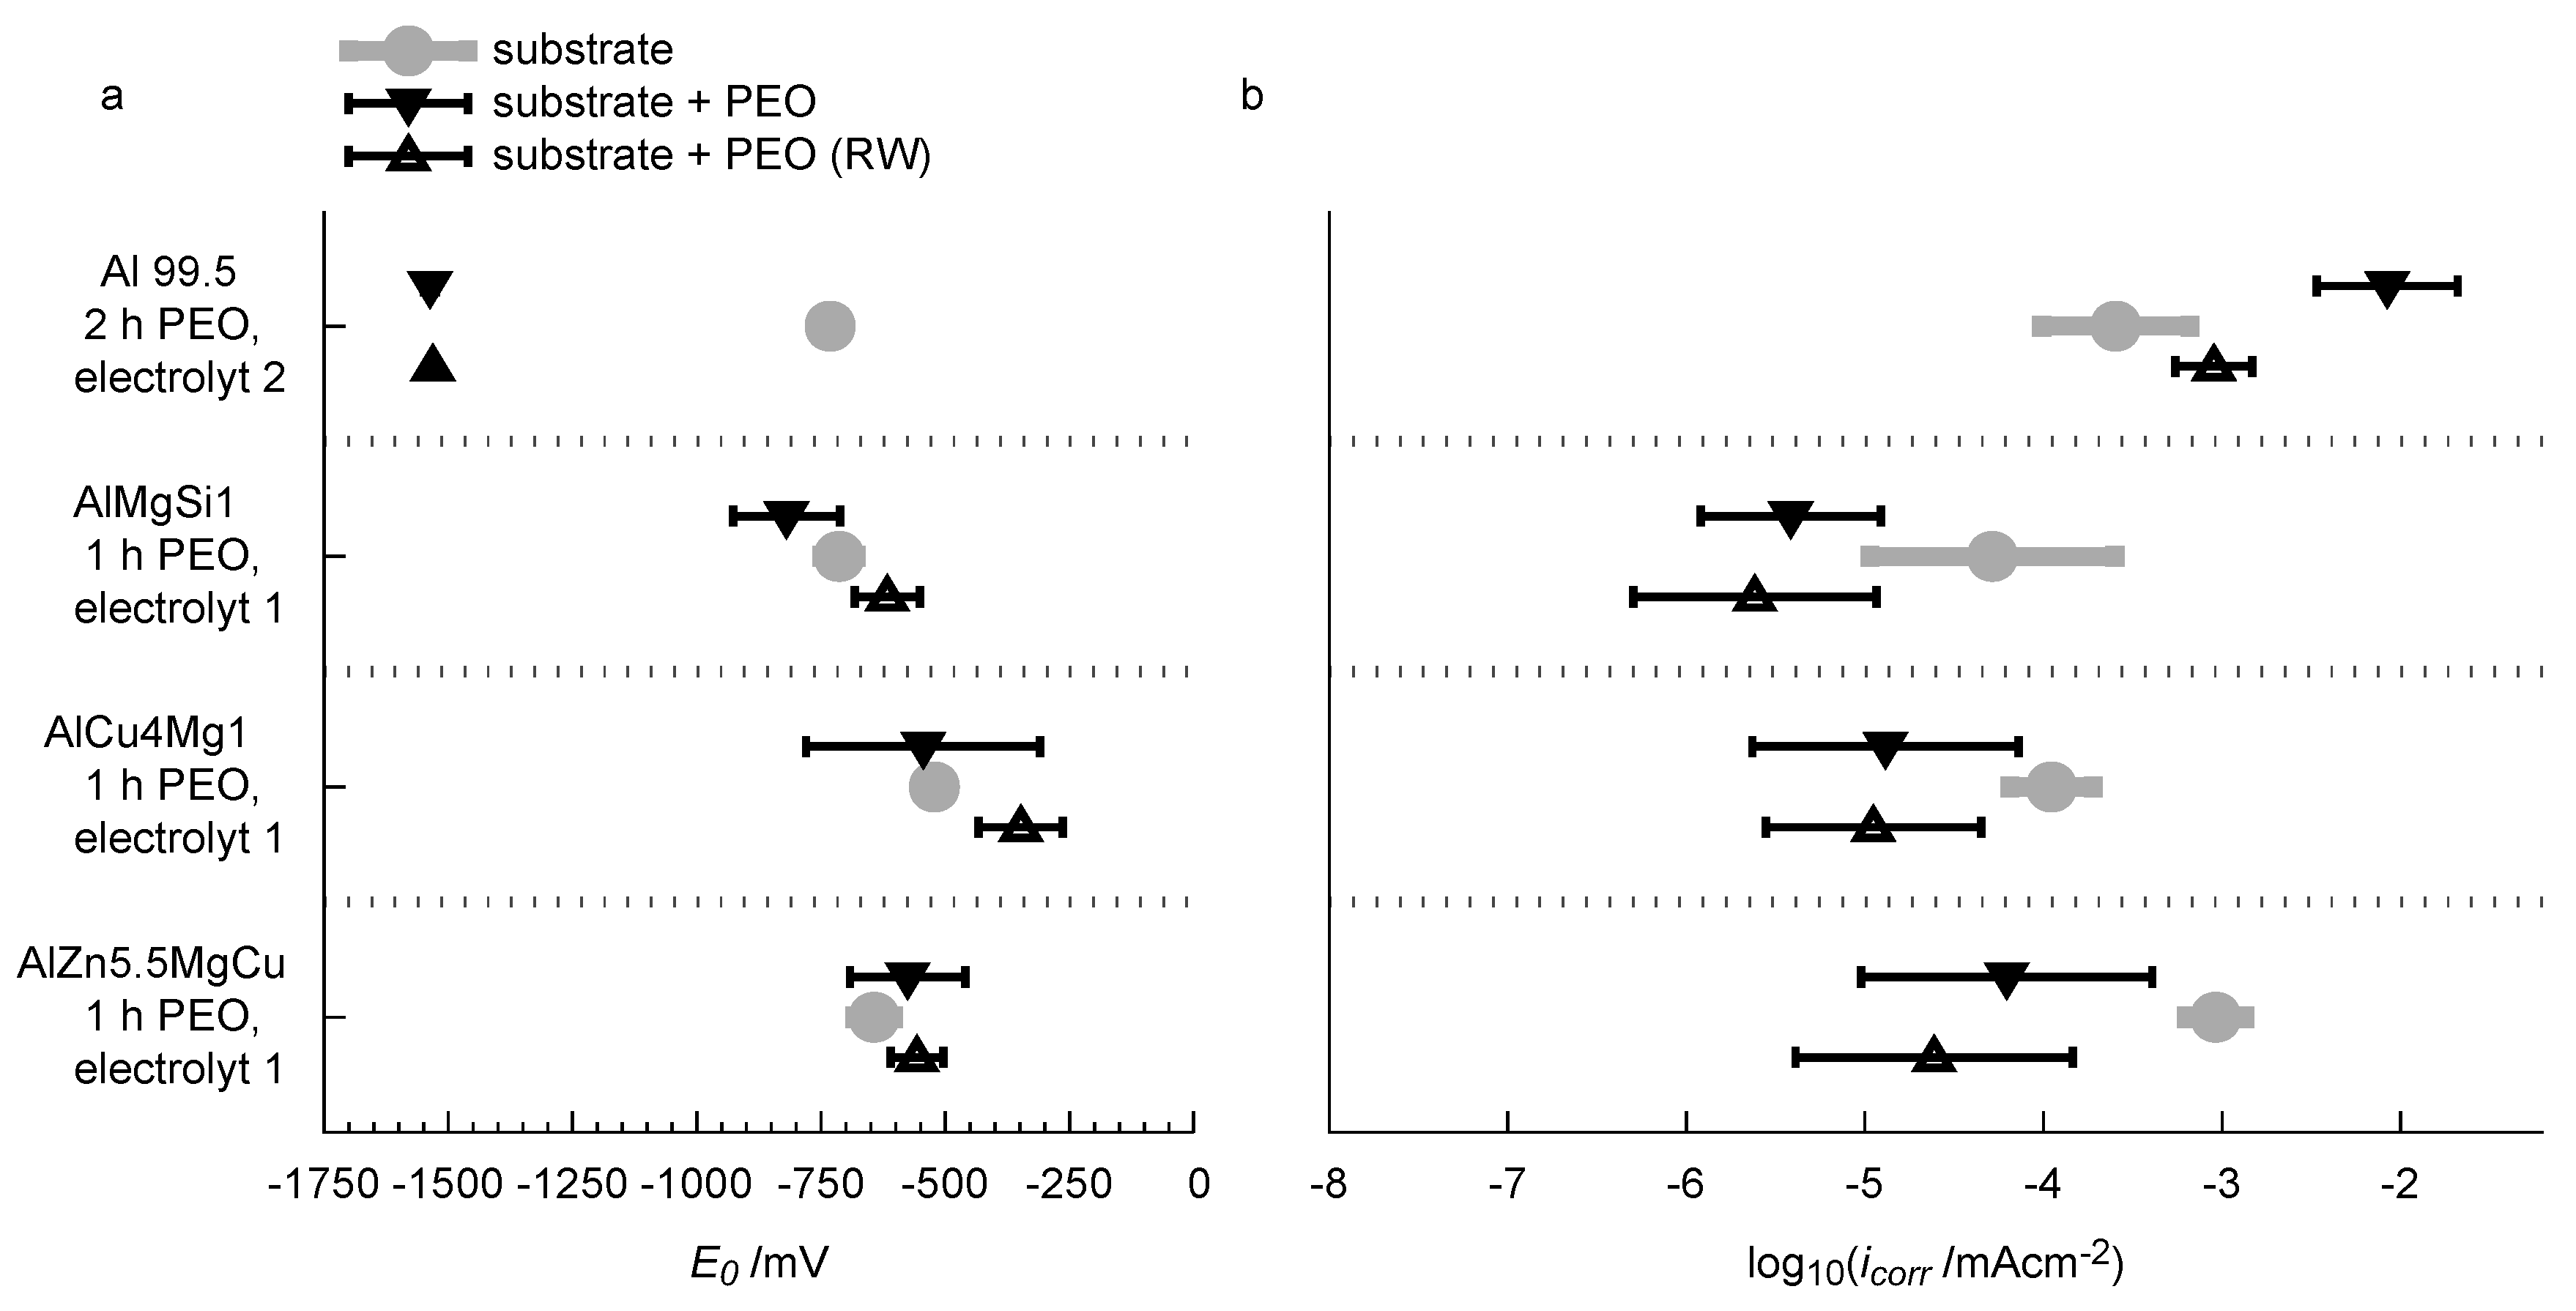
It is obvious that the oxide coating significantly decreases the current density over the whole potential range. For reasons of comprehensibility, the obtained fits of the Butler-Volmer equation (Equation (1)) are also included in the diagram. The Butler-Volmer equation is only valid for small overpotentials. For the shown curves, it is in good congruence with the measured values for a potential range of approx. ±40 mV around the free corrosion potential. The corrosion current densities and free corrosion potentials obtained by this method are considered as an appropriate parameter for describing the corrosion tendency of the samples. The results of the current density-potential curves for the bare alloys and the PEO-coated alloys are shown in Figure 15a (free corrosion potential) and b (corrosion current density).
Conspicuously, is lowered significantly from −713 mV down to −1537 mV for technically pure aluminum after the PEO treatment and the rubber-wheel testing. Simultaneously the PEO process leads to a significant increase in the corrosion current density from 1.1 × mA/cm up to 8.4 × mA/cm. One explanatory approach could be that the micro porous structure of the layer (see Figure 5) allows for a localized access of the corrosion media (the NaCl solution) to the bare aluminium substrate. Under these conditions, pitting corrosion, a corrosion mechanism for which aluminum materials are known to be sensitive, is likely to occur. Hence, the rate of the anodic reaction is increased. This would explain the elevated corrosion current density after the PEO, and the fact that an additional rubber-wheel testing lowers the value of the layers, because some pores are closed by abraded material. On the other hand, the micro porous PEO layer still lowers the active surface area for cathodic partial reactions such as formation of molecular oxygen and ions by consumption of electrons. The increased rate of the anodic partial reaction would thus influence the equilibrium of the corrosion redox reaction and shift its OCP to lower values. This would explain the significantly lowered free corrosion potential. The free corrosion potential is significantly different for the bare high strength alloys and amounts to −714 mV for AlMgSi1, −522 mV for AlCu4Mg1 and −643 mV for AlZn5.5MgCu. No indubitable trends are recognised with regard to the free corrosion potential of the substrates with the PEO coatings and after partial abrasion of the coatings in the rubber-wheel test. The PEO treatment generally increases the standard deviation of the free corrosion potential compared to the bare substrate. Partial abrasion of the PEO coating slightly shifts the free corrosion potential towards more noble values, but the absolute change is still relatively small compared to the deviation of the results. For the corrosion current density, a significant influence of the PEO coatings is observed (Figure 15b). The oxide coatings reduce the corrosion current density by approx. one order of magnitude for all of the three investigated high strength alloys. For the AlMgSi1 alloy, the corrosion current density is reduced from 4.1 × mA/cm to 3.0 × mA/cm. For AlCu4Mg1, the corrosion current density is reduced from 8.7 × mA/cm to 1.0 × mA/cm. For AlZn5.5MgCu, which shows the highest corrosion current density in the bare state within the investigated high strength alloys was lowered from 7.2 × mA/cm to 4.9 × mA/cm by the PEO treatment (all values averaged from 3 independend measurements, standard deviations are given in Figure 15).
The abrasion of the PEO coatings tends to further decrease the corrosion current density. For the three high strength alloys this effect is, however, small in consideration of the standard deviations of the results. Obviously, the dense microstructure of the coatings (compare Figure 4) reliably hinders the corrosive media to attack the substrate. The slight reduction of the corrosion current density after the rubber-wheel test is potentially caused by the deposition of abraded material in microcracks and small flaws of the coatings so that the access of corrosive media to the substrate is further impeded. Thus, the rate of substrate dissolution is decreased. The slight shift of the free corrosion potential towards more noble values can also be explained by this fact. Further, it is noticeable that the AlMgSi1 alloy, which shows the lowest average corrosion current density in the bare surface state, also has the lowest corrosion current density values with the PEO coatings. Likewise, the AlZn5.5MgCu alloy, which shows the highest corrosion current density in the bare state, features its highest values after PEO. Although the corrosion current densities of the PEO-coated AlZn5.5MgCu and the bare AlMgSi1 and AlCu4Mg1 alloys have similar values, the PEO coating still leads to a significant reduction of the current density under higher anodic overpotentials so that corrosive attack is likely to remain low. With regard to technological application of PEO coatings for substrate protection under combined abrasive and corrosive stress, it is obvious from the results that the influence of the alloy on the corrosion performance is small compared to the influence of the PEO coating before and/of after abrasive stress.
4. Conclusions
PEO coatings were produced on technically pure aluminum and three different commercially available and widely used high-strength aluminium alloys. It has been found that the PEO of technically pure aluminum leads to less protective coatings also by adjusted electrolyte and process time. This behaviour is caused by the defective microstructure of the resulting layers. The origin of this porosity can be explained by the following approaches:
- (i)
- The aluminum oxide modifications formed by PEO on Al 99.5 are more sensitive to chemical dissolution by the electrolyte used. This consideration is supported by the fact that the layer formation was just possible after the elevation of the silicate content of the electrolyte and the withdrawal of the additional hydroxide compounds improved its passivation and lowered the chemical dissolution of aluminum oxide respectively. Furthermore, the results of the EBSD measurements (Figure 9) showed that the presence and consequently also the absence of certain alloying elements within the substrate material can significantly affect the oxide formation and transformation processes.
- (ii)
- The shifted electrolyte composition leads to initiation of cathodic discharges during the PEO process which is suggested by the time axis symmetric course of the anodic and cathodic process voltage envelopes (Figure 2e). Therefore, the channels within the PEO layer could undergo discharge phenomena during both the cathodic and anodic half cycle. This could hinder the solidification of dense oxide zones.
The resulting morphology of the coatings on the three high strength alloys is independent of the substrate with a compact working layer near the substrate and a rather porous technological layer at the outer surface. The participation especially of an iron-containing primary phase in the AlMgSi1 alloy and of zinc- and copper-rich phases in the AlZn5.5MgCu and the AlCu4Mg1 alloy in the PEO conversion process is established. EDX analysis shows that a low amount of alloying and electrolyte elements is always incorporated into the coating. With regard to the wear properties, no dependence of the coatings’ performance in the rubber-wheel test (ASTM G65) on the substrate material exists. All the coatings show an excellent wear behaviour after the initial abrasion of the technological layer. The current density-potential curves obtained from PEO-coated samples reveal a significant decrease of the corrosion current density by approximately one order of magnitude compared to the bare substrates for each of the alloys. The corrosion performance even tends to improve after wearing the coatings, which can be attributed to deposition of abraded material in small flaws of the coatings and hence a further impediment of the access of the corrosive medium to the substrate. Overall, it has been shown that the PEO process offers a robust method to produce wear and corrosion resistant oxide coatings on a representative selection of commercially available high-strength aluminium alloys.
Author Contributions
M.S. designed and performed most of the PEO experiments as well as the corrosion and wear testings and wrote the corresponding sections of the paper. F.S. prepared the experimental setup for the electrical process observation, processed the generated data and wrote the sections concerning their interpretation. R.M. coordinated and carried out the microscopic investigations of the formed layers. I.S. gave advice to M.S. regarding the experimental design, analyzed and discussed the results with F.S. and revised the manuscript. T.L. coordinated the research project. He gave advice to M.S. and F.S. regarding the focus of the manuscript, the experimental design and appropriate methods. Furthermore, he discussed the results with the other authors and revised the manuscript.
Acknowledgments
The financial support of this work by the Deutsche Forschungsgemeinschaft (DFG) is gratefully acknowledged (project number La-1274/37-1). The support of Dagmar Dietrich, Christel Pönitz, Sigrid Kaufmann, Gabriele Tauchmann, Elke Benedix, Dagobert Spieler, Marc Pügner and Shreyas Hebbar (all from the Institute of Materials Science and Engineering, TU Chemnitz) is also gratefully acknowledged.
Conflicts of Interest
The authors declare no conflicts of interest. The founding sponsors had no role in the design of the study; in the collection, analyses, or interpretation of data; in the writing of the manuscript, and in the decision to publish the results.
References
- Rakoch, A.G.; Bardin, I.V.; Kovalev, V.L.; Avanesyan, T.G. Microarc oxidation of light constructional alloys: Part 1. Main notions on the microarc oxidation of light constructional alloys. Rus. J. Non-Ferr. Met. 2013, 54, 341–344. [Google Scholar] [CrossRef]
- Yerokhin, A.L.; Nie, X.; Leyland, A.; Matthews, A.; Dowey, S.J. Plasma electrolysis for surface engineering. Surf. Coat. Technol. 1999, 122, 73–93. [Google Scholar] [CrossRef]
- Wielage, B.; Alisch, G.; Lampke, T.; Nickel, D. Anodizing—A key surface treatment for aluminium. Key Eng. Mater. 2008, 384, 263–281. [Google Scholar] [CrossRef]
- Rakoch, A.G.; Gladkova, A.A.; Ovalev, V.L.; Seferyan, A.G. The mechanism of formation of composite microarc coatings on aluminum alloys. Prot. Met. 2013, 384, 880–884. [Google Scholar] [CrossRef]
- Sundararajan, G.; Krishna, L.R. Mechanisms underlying the formation of thick alumina coatings through the mao coating technology. Surf. Coat. Technol. 2003, 167, 269–277. [Google Scholar] [CrossRef]
- Klapkiv, M. Simulation of synthesis of oxide-ceramic coatings in discharge channels of a metal-electrolyte system. Mater. Sci. 1999, 35, 279–283, UDC 533.9:541.115. [Google Scholar] [CrossRef]
- Curran, J.A.; Kalkanci, H.; Magurova, Y.; Clyne, T.W. Mullite-rich plasma electrolytic oxide coatings for thermal barrier applications. Surf. Coat. Technol. 2007, 201, 8683–8687. [Google Scholar] [CrossRef]
- Dehnavi, V.; Liu, X.Y.; Luan, B.L.; Shoesmith, D.W.; Rohani, S. Phase transformation in plasma electrolytic oxidation coatings on 6061 aluminum alloy. Surf. Coat. Technol. 2014, 251, 106–114. [Google Scholar] [CrossRef]
- Kalkanci, H.; Kurnaz, S.C. The effect of process parameters on mullite-based plasma electrolytic oxide coatings. Surf. Coat. Technol. 2008, 203, 15–22. [Google Scholar] [CrossRef]
- Oh, J.M.; Mun, J.I.; Kim, J.H. Effects of alloying elements on microstructure and protective properties of Al2O3 coatings formed on aluminum alloy substrates by plasma electrolysis. Surf. Coat. Technol. 2009, 204, 141–148. [Google Scholar] [CrossRef]
- Tillous, K.; Toll-Duchanoy, T.; Bauer-Grosse, E.; Hericher, L.; Geandier, G. Microstructure and phase composition of microarc oxidation surface layers formed on aluminium and its alloys 2214-t6 and 7050-t7. Surf. Coat. Technol. 2009, 203, 2969–2973. [Google Scholar] [CrossRef]
- Nie, X.; Meletis, E.I.; Jian, J.C.; Leyland, A.; Yerokhin, A.L.; Matthews, A. Abrasive wear/corrosion properties and tem analysis of Al2O3 coatings fabricated using plasma electrolysis. Surf. Coat. Technol. 2002, 149, 245–251. [Google Scholar] [CrossRef]
- Becerik, D.A.; Ayday, A.; Kumruoglu, L.C.; Kurnaz, S.C.; Oezel, A. The effects of Na2SiO3 concentration on the properties of plasma electrolytic oxidation coatings on 6060 aluminum alloy. J. Mater. Eng. Perform. 2012, 21, 1–5. [Google Scholar] [CrossRef]
- Dudareva, N.Y.; Abramova, M.M. The structure of plasma-electrolytic coating formed on Al-Si alloys by the micro-arc oxidation method. Prot. Met. 2016, 52, 100–104. [Google Scholar] [CrossRef]
- Shen, D.; Cai, D.; Guo, G.; Liu, P. Evolution of residual stresses in micro-arc oxidation ceramic coatings on 6061 Al alloy. CJME 2013, 26, 1149–1153. [Google Scholar] [CrossRef]
- Krishna, L.R.; Purnima, A.S.; Sundararajan, G. A comparative study of tribological behavior of microarc oxidation and hard-anodized coatings. Wear 2006, 261, 1095–1101. [Google Scholar] [CrossRef]
- Sieber, M.; Mehner, T.; Dietrich, D.; Alisch, G.; Nickel, D.; Meyer, D.; Scharf, I.; Lampke, T. Wear-resistant coatings on aluminium produced by plasma anodising-a correlation of wear properties, microstructure, phase composition and distribution. Surf. Coat. Technol. 2014, 240, 96–102. [Google Scholar] [CrossRef]
- Chuanyu, S.; Wang, Y. Influence of electrolyte parameters on the properties of the ceramic coatings deposited on aluminum alloy by plasma electrolytic oxidation. Powder Metall. Met. Ceram. 2015, 54, 101–105. [Google Scholar] [CrossRef]
- Kurbatkina, E.I.; Rakoch, A.G.; Belov, N.A.; Avanesyan, T.G. Corrosion resistance of boron-bearing aluminum alloys and its increase after plasma electrolytic oxidation. Prot. Met. 2014, 50, 889–892. [Google Scholar] [CrossRef]
- Xiang, N.; Song, R.G.; Li, H.; Wang, C.; Mao, Q.Z.; Xiong, Y. Study on microstructure and electrochemical corrosion behavior of peo coatings formed on aluminum alloy. J. Mater. Eng. Perform. 2015, 24, 5022–5031. [Google Scholar] [CrossRef]
- Oleinik, S.V.; Rudnev, V.S.; Kuzenkov, A.Y.; Yarovaya, T.P.; Trubetskaya, L.F.; Nedozorov, P.M. Modification of plasma electrolytic coatings on aluminum alloys with corrosion inhibitors. Prot. Met. 2013, 49, 885–890. [Google Scholar] [CrossRef]
- Oleinik, S.V.; Rudnev, V.S.; Kuzenkov, A.Y.; Yarovaya, T.P.; Trubetskaya, L.F.; Nedozorov, P.M. Corrosion inhibitors in peo-coatings on aluminum alloys. Prot. Met. 2014, 50, 893–897. [Google Scholar] [CrossRef]
- Ye, Z.; Liu, D.; Zhang, X.; Yang, Z.; Lei, M. Effect of shot peening and plasma electrolytic oxidation on the intergranular corrosion behavior of 7a85 aluminum alloy. Acta Mater. 2014, 27, 705–713. [Google Scholar] [CrossRef]
- Simchen, F.; Sieber, M.; Lampke, T. Electrolyte influence on ignition of plasma electrolytic oxidation processes on light metals. Surf. Coat. Technol. 2017, 315, 205–213. [Google Scholar] [CrossRef]
- Moon, S.; Jeong, Y. Generation mechanism of microdischarges during plasma electrolytic oxidation of Al in aqueous solutions. Corros. Sci. 2009, 51, 1506–1512. [Google Scholar] [CrossRef]
- Wank, A.; Schwenk, A.; Wielage, B.; Pokhmurska, H. Behavior of thermally sprayed wear protective coatings exposed to different abrasive wear conditions in comparison to hard chromium platings. In Proceedings of the 2007 International Thermal Spray Conference and Exposition, Beijing, China, 14–16 May 2007; pp. 1011–1016. [Google Scholar]
Sample Availability: Samples of the compounds are available from the authors. |
Figure 1.
Sample dimensions and placement of the active areas for the corrosion measurement: 1—PEO-coated sample, 2—ruber-wheel wear trace, 3—corrosion measurement of unworn PEO-coated substrate, 4—corrosion measurement of worn PEO-coated substrate (dimensions in mm; the diameter of elements 3 and 4 is 10 mm each).
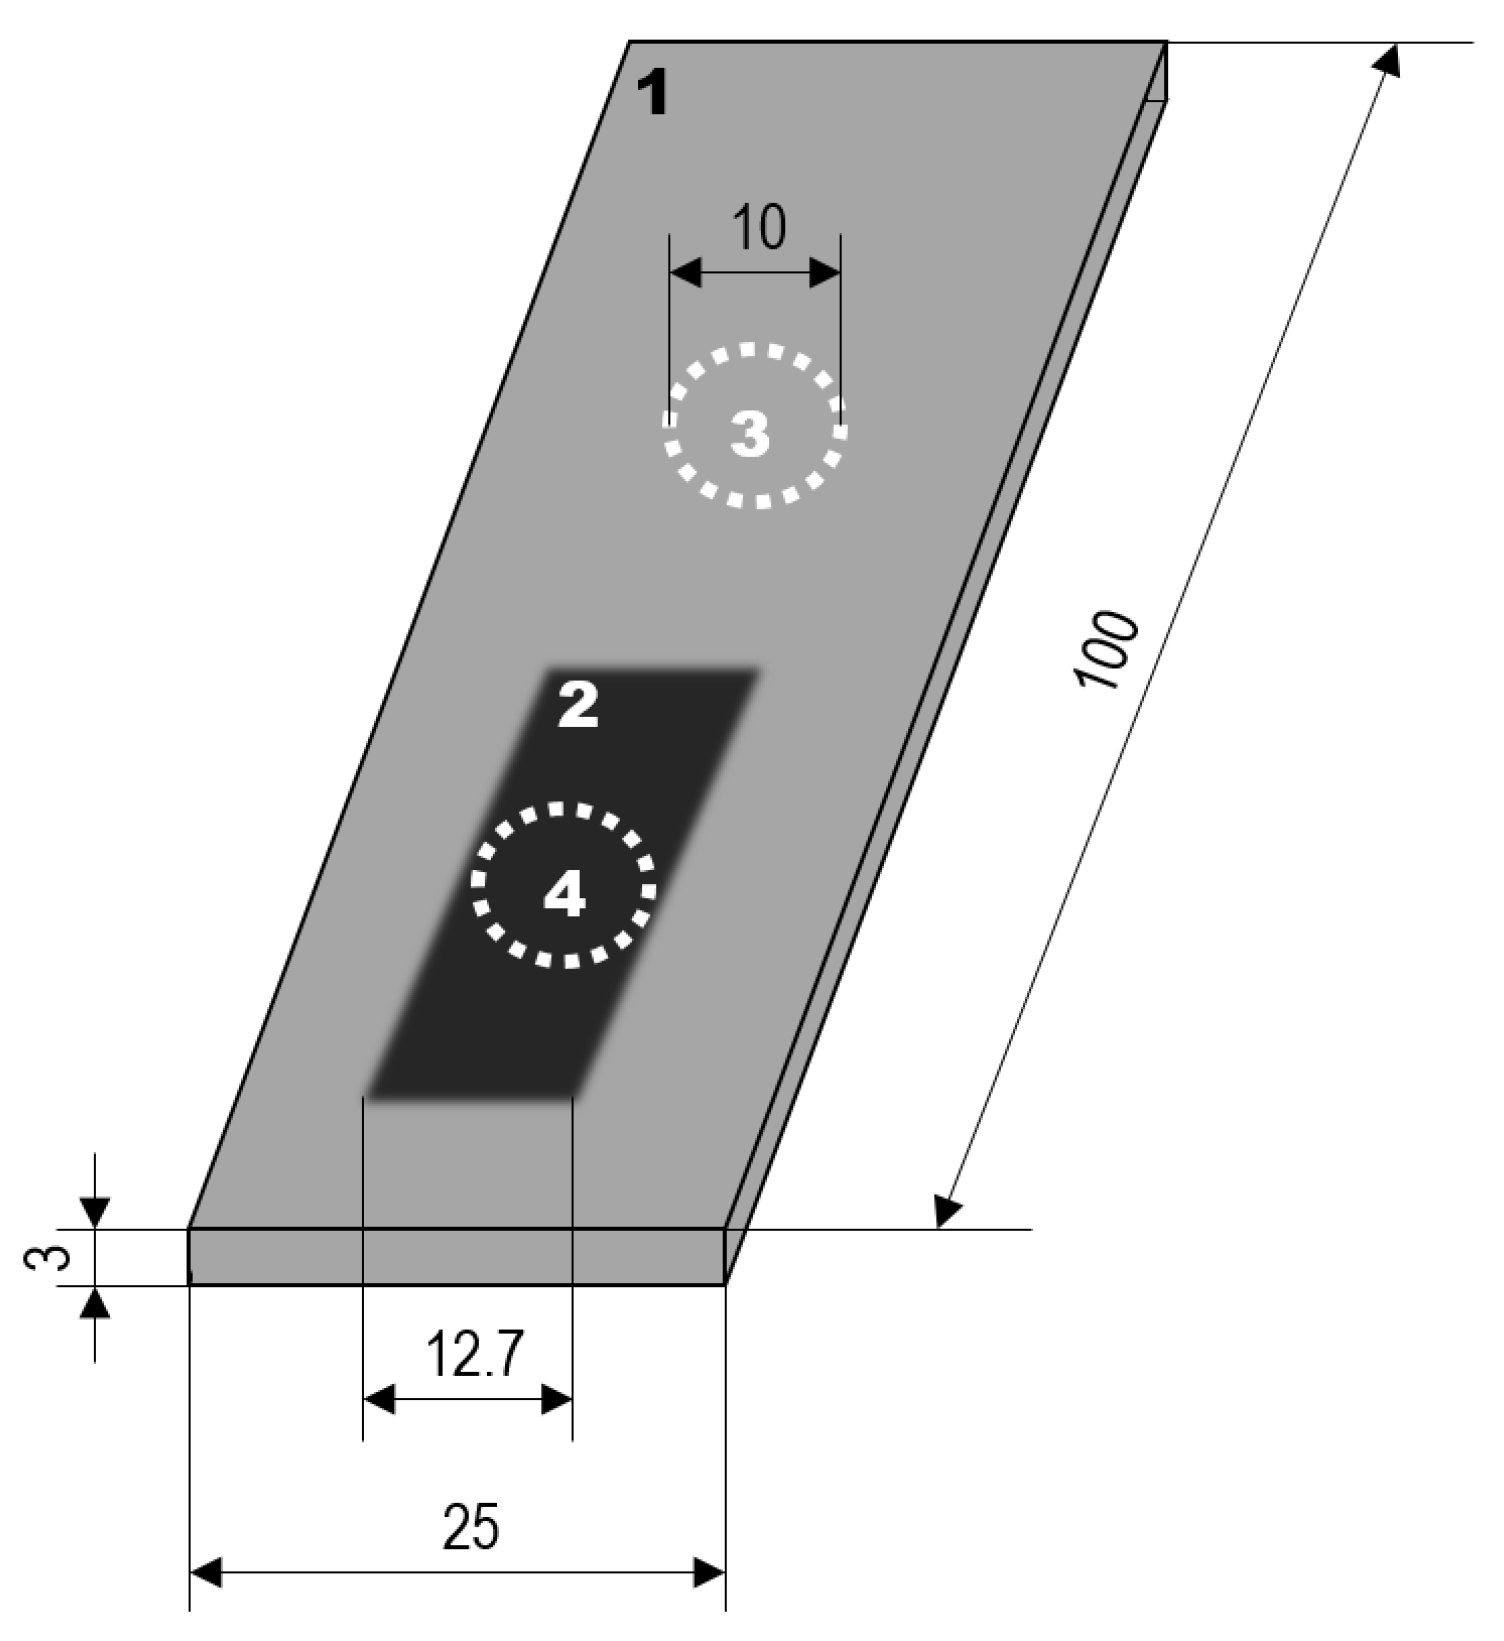
Figure 2.
Anodic and cathodic process voltage envelopes for 1 h of PEO on Al 99.5, AlMgSi1, AlCu4Mg1 and AlZn5.5MgCu in electrolyte 1 (a–d) and 2 h of PEO on Al 99.5 in electrolyte 2 (e).
Figure 2.
Anodic and cathodic process voltage envelopes for 1 h of PEO on Al 99.5, AlMgSi1, AlCu4Mg1 and AlZn5.5MgCu in electrolyte 1 (a–d) and 2 h of PEO on Al 99.5 in electrolyte 2 (e).

Figure 3.
Layer thickness produced by PEO (symmetric bipolor rectangular current pattern of 30 A/dm) in dependence of the substrate material and adjusted process parameters.
Figure 3.
Layer thickness produced by PEO (symmetric bipolor rectangular current pattern of 30 A/dm) in dependence of the substrate material and adjusted process parameters.

Figure 4.
Representative cross sections of coatings produced by PEO (symmetric bipolor rectangular current pattern of 30 A/dm, 1 h) on Al 99.5 (a) and the three alloys AlCu4Mg1, AlMgSi1, AlZn5.5MgCu (b–d) in electrolyte 1 and on Al 99.5 in electrolyte 2 (e). E—embedding resin, P—PEO coating, S—substrate.
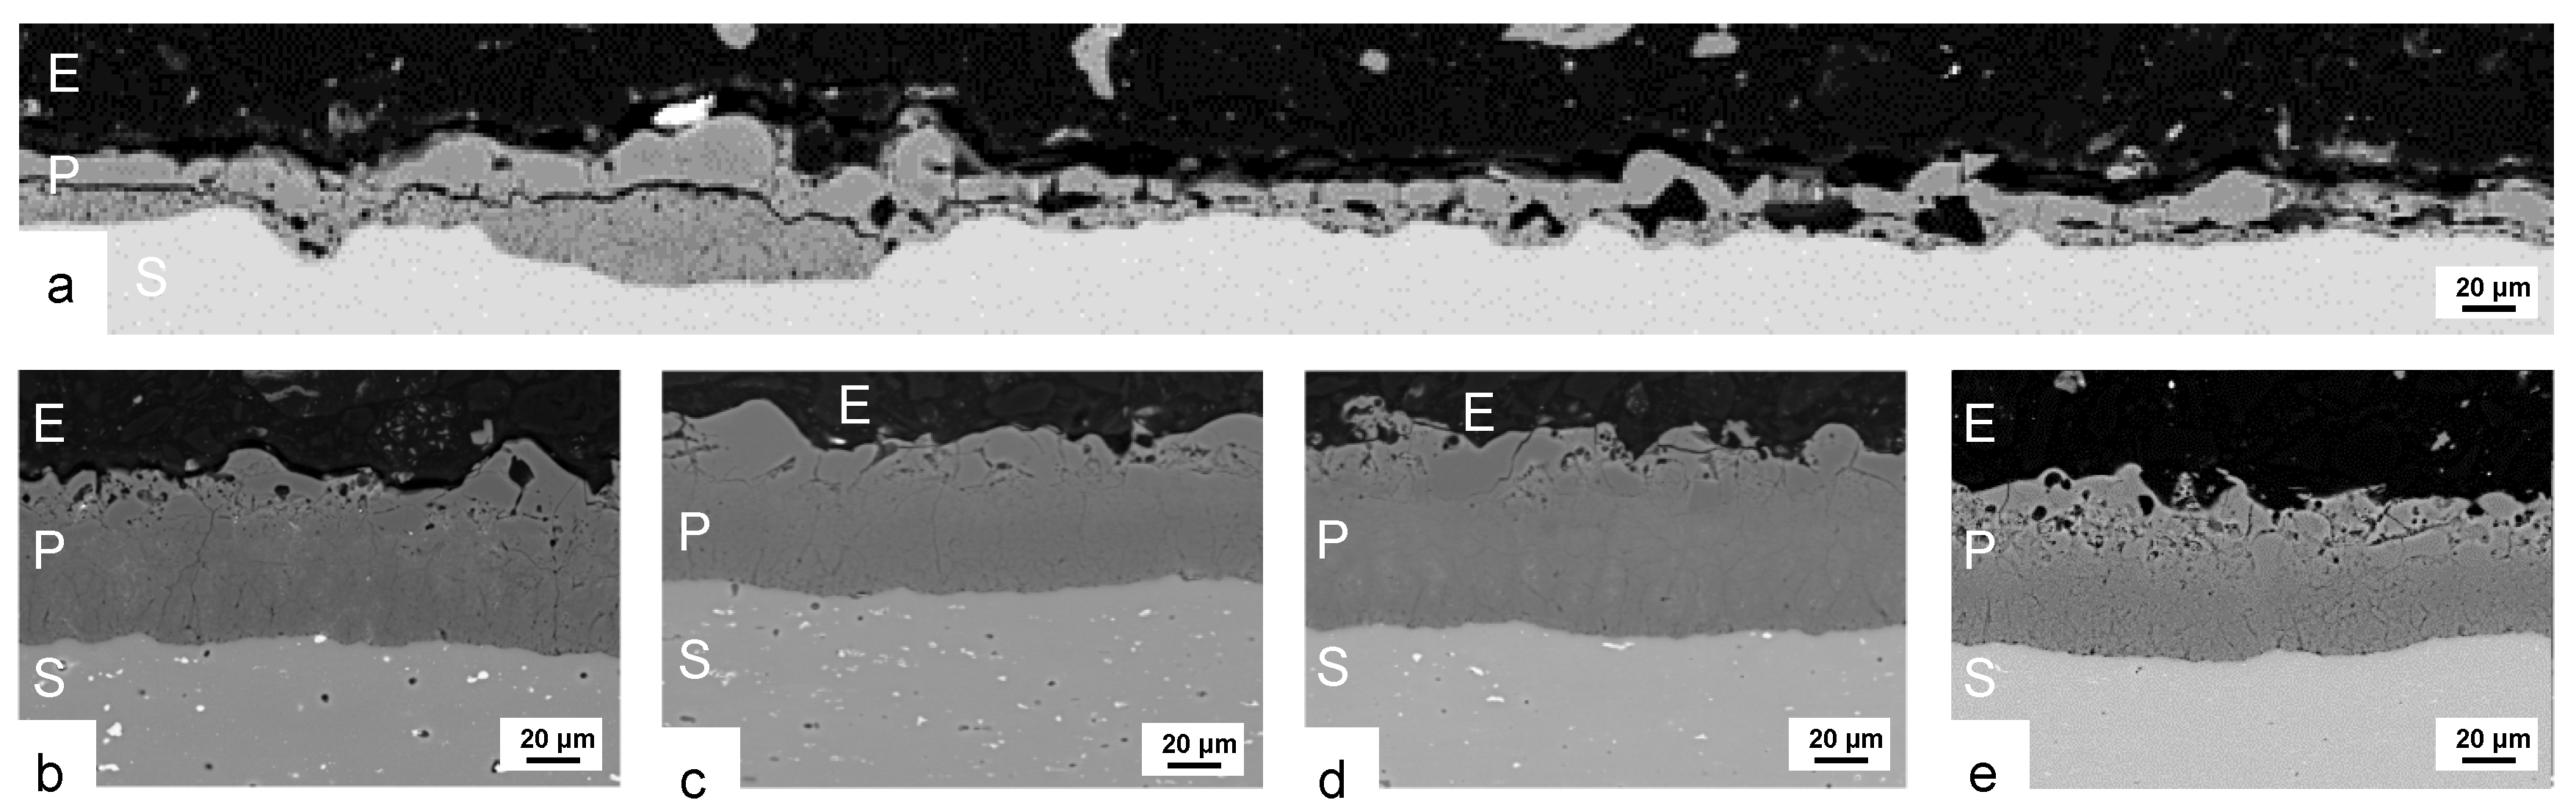
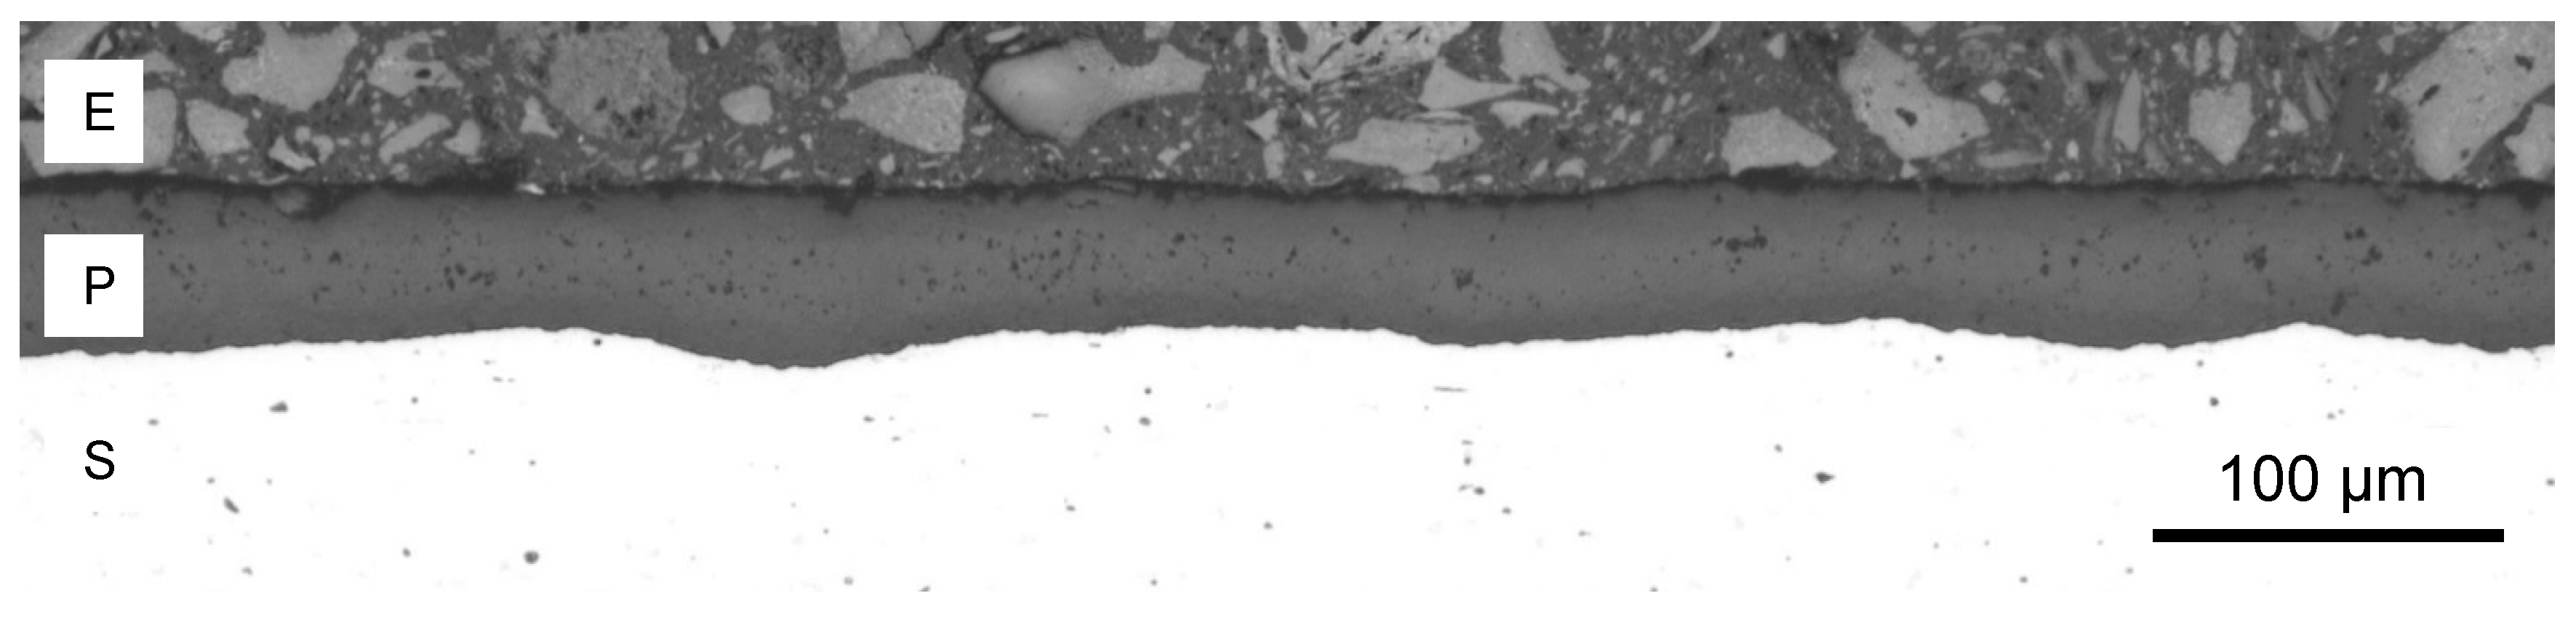
Figure 5.
Representative cross sections of coatings produced by PEO (symmetric bipolor rectangular current pattern of 30 A/dm, 2 h) on Al 99.5 (a) in electrolyte 2 and a magnification of the substrate/layer-interface (b). E—embedding resin, P—PEO coating, S—substrate.
Figure 5.
Representative cross sections of coatings produced by PEO (symmetric bipolor rectangular current pattern of 30 A/dm, 2 h) on Al 99.5 (a) in electrolyte 2 and a magnification of the substrate/layer-interface (b). E—embedding resin, P—PEO coating, S—substrate.

Figure 6.
Oxidation of a Al(SiFeMn) phase during PEO of the AlMgSi1 alloy. In the darker region of the intermetallic phase at the substrate/oxide-interface, iron and manganese are depleted, while the oxygen and magnesium content increases.
Figure 6.
Oxidation of a Al(SiFeMn) phase during PEO of the AlMgSi1 alloy. In the darker region of the intermetallic phase at the substrate/oxide-interface, iron and manganese are depleted, while the oxygen and magnesium content increases.
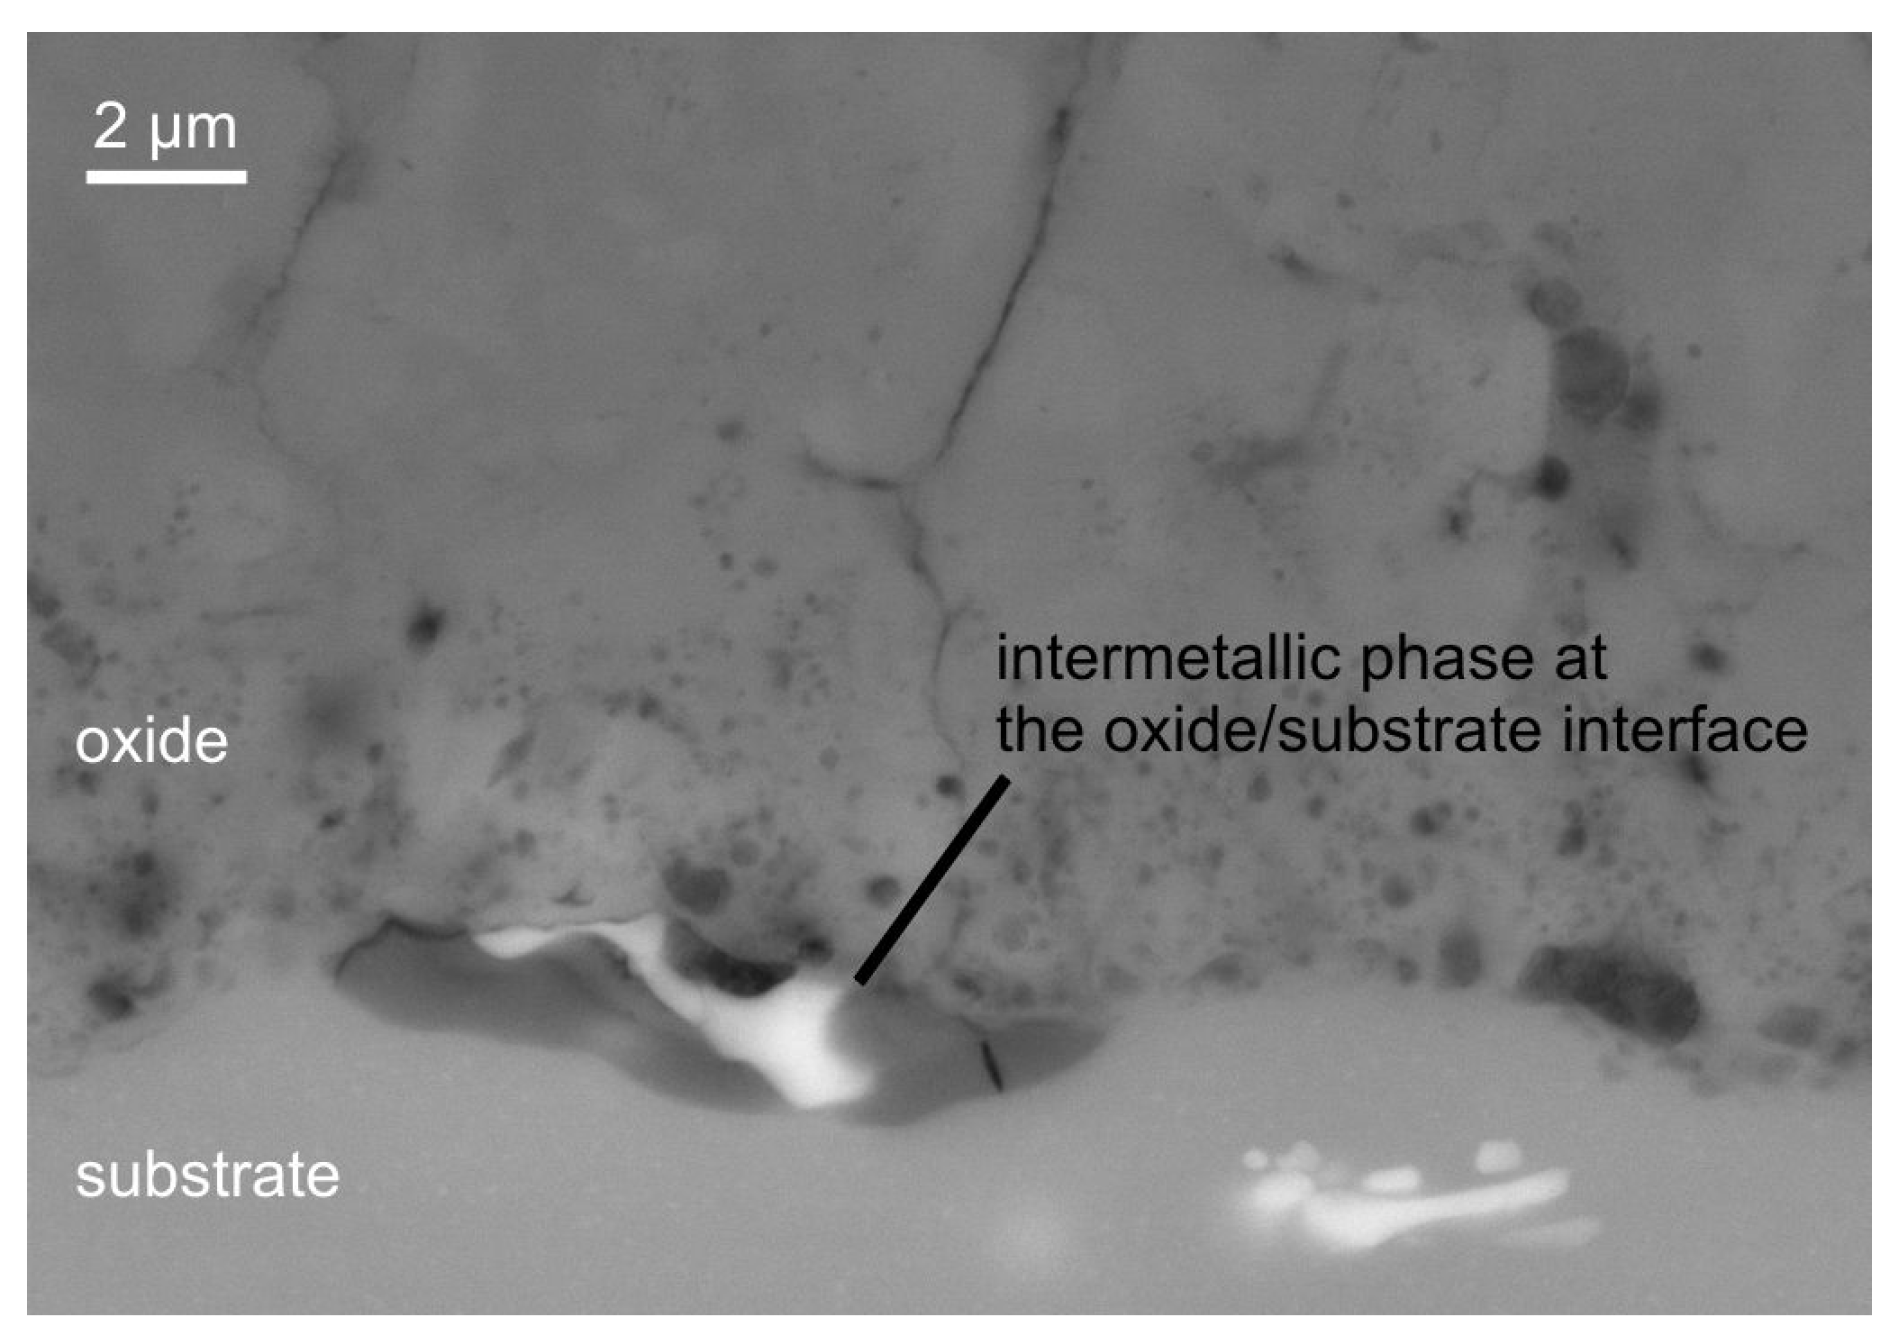
Figure 7.
Detail of the cross section of a PEO coating on the AlCu4Mg1 substrate. A copper-rich region evolves in the oxide coating above an intermetallic phase in the substrate, with (b) being a magnification of (a).
Figure 7.
Detail of the cross section of a PEO coating on the AlCu4Mg1 substrate. A copper-rich region evolves in the oxide coating above an intermetallic phase in the substrate, with (b) being a magnification of (a).

Figure 8.
XRD diffraction diagrams for the coatings produced by PEO (symmetric bipolor rectangular current pattern of 30 A/dm) on the investigated materials.
Figure 8.
XRD diffraction diagrams for the coatings produced by PEO (symmetric bipolor rectangular current pattern of 30 A/dm) on the investigated materials.
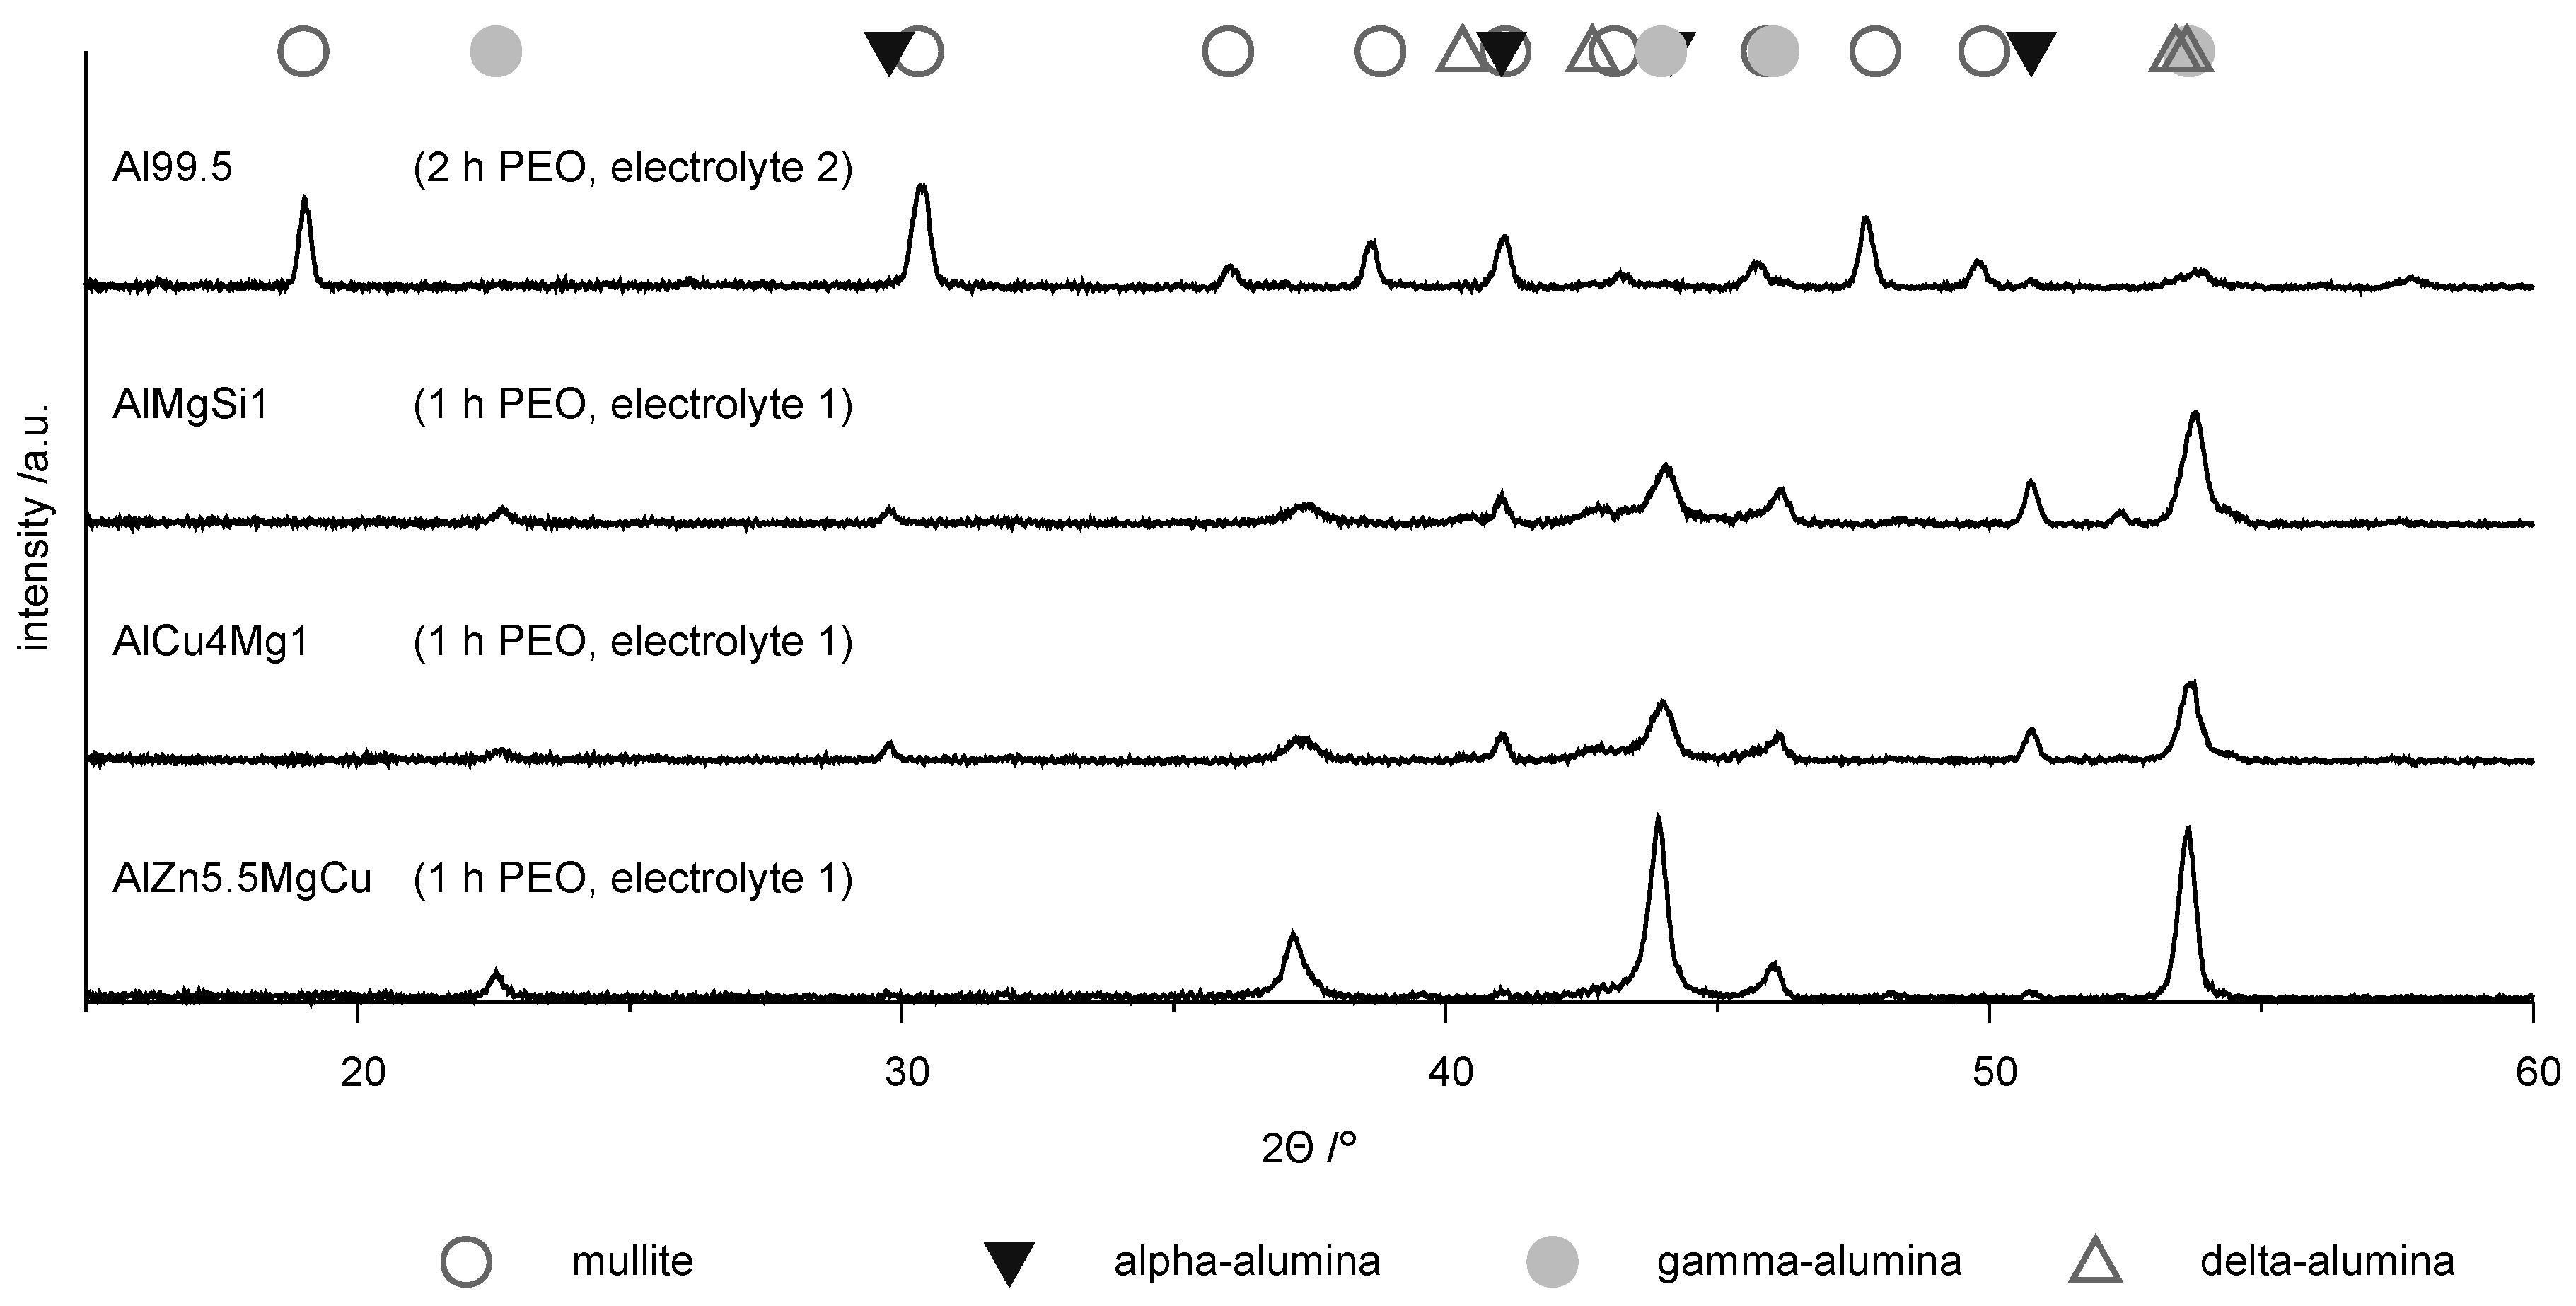
Figure 9.
EBSD-mapping including the - and -alumina phases for the coatings produced by PEO (symmetric bipolor rectangular current pattern of 30 A/dm) on Al 99.5 in electrolyte 2 after 2 h of treatment and on the three high strength aluminium alloys in electrolyte 1 after 1 h of treatment.
Figure 9.
EBSD-mapping including the - and -alumina phases for the coatings produced by PEO (symmetric bipolor rectangular current pattern of 30 A/dm) on Al 99.5 in electrolyte 2 after 2 h of treatment and on the three high strength aluminium alloys in electrolyte 1 after 1 h of treatment.

Figure 10.
Hardness profiles for the coatings produced by PEO (symmetric bipolor rectangular current pattern of 30 A/dm) on Al 99.5 in electrolyte 2 after 2 h of treatment and on three high strength aluminium alloys in electrolyte 1 after 1 h of treatment (substrate hardness < 2000 N/mm).
Figure 10.
Hardness profiles for the coatings produced by PEO (symmetric bipolor rectangular current pattern of 30 A/dm) on Al 99.5 in electrolyte 2 after 2 h of treatment and on three high strength aluminium alloys in electrolyte 1 after 1 h of treatment (substrate hardness < 2000 N/mm).

Figure 11.
Representative evolution of the mass loss m with increasing wear distance s in the rubber-wheel test for the PEO-coated AlCu4Mg1 alloy (compare Figure 9).
Figure 11.
Representative evolution of the mass loss m with increasing wear distance s in the rubber-wheel test for the PEO-coated AlCu4Mg1 alloy (compare Figure 9).
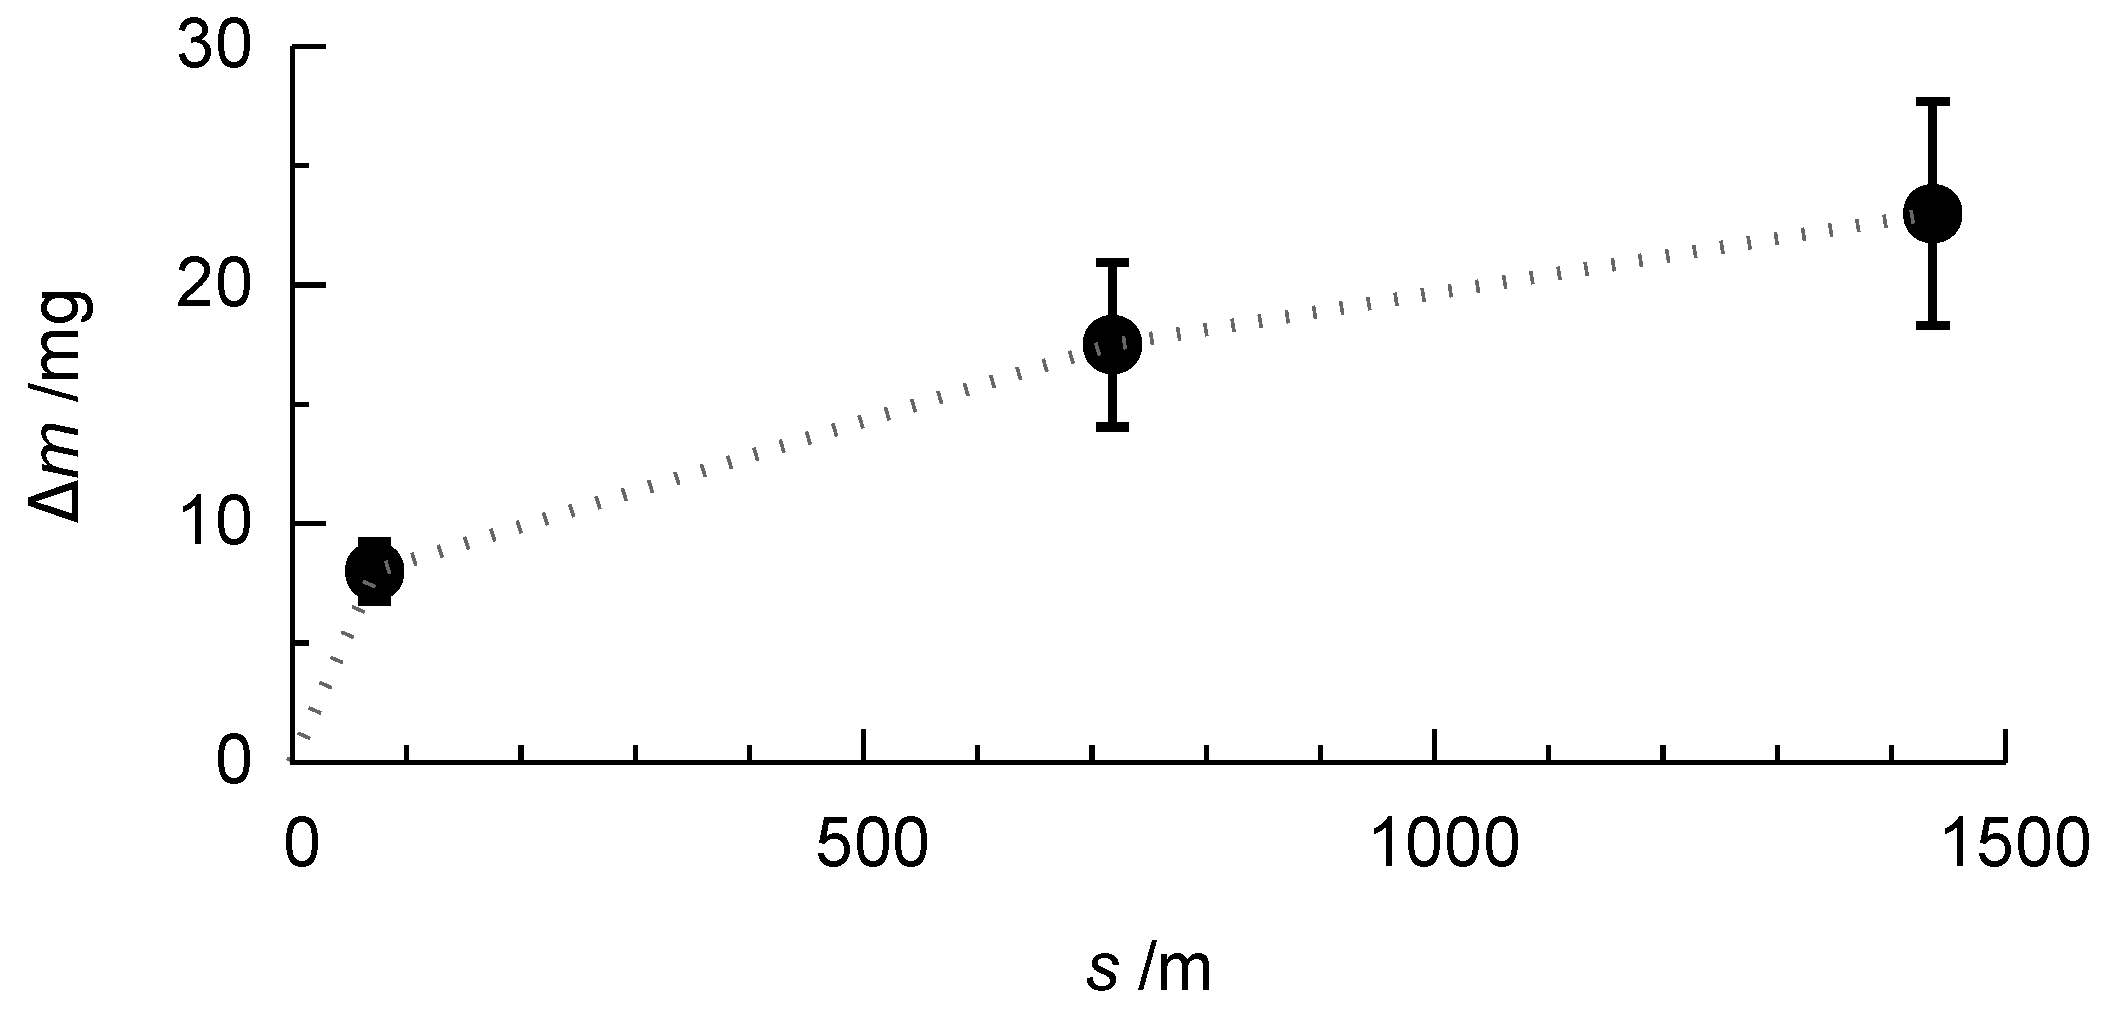
Figure 12.
Comparison of the mass loss m in dependence of the wear distance in the rubber-wheel test for coatings produced by PEO (symmetric bipolor rectangular current pattern of 30 A/dm) for the investigated coatings.
Figure 12.
Comparison of the mass loss m in dependence of the wear distance in the rubber-wheel test for coatings produced by PEO (symmetric bipolor rectangular current pattern of 30 A/dm) for the investigated coatings.

Figure 13.
Representative cross section of the wear trace of a PEO coating on the AlMgSi1 alloy after a sliding distance of 1436 m (rubber-wheel test ASTM G65 B). In comparison to Figure 4, it is evident that only the outer, rather porous part of the oxide coating was removed. E—embedding resin, P—PEO coating, S—substrate; contrast of embedding resin against coating has been increased by image manipulation.

Figure 14.
Representative current density-potential curves for the bare and the PEO-coated AlMgSi1 substrate in 0.1 mol/L NaCl solution: The PEO coating reduces the current flow (indicating the corrosion activity) significantly, especially for high anodic potentials. The fitted curves, according to Equation (1), for the determination of the corrosion current density are given for comprehensibility.

Figure 15.
Summary of the results of the current density-potential curves with regard to the free corrosion potential (a) and the corrosion current density (b).
Figure 15.
Summary of the results of the current density-potential curves with regard to the free corrosion potential (a) and the corrosion current density (b).


Table 1.
Nominal composition of the used alloys in wt. % (Al balance).
| Element | Al 99.5 | AlCu4Mg1 | AlMgSi1 | AlZn5.5MgCu |
|---|---|---|---|---|
| Si | ≤0.25 | ≤0.5 | 0.7–1.3 | ≤0.4 |
| Fe | ≤0.4 | ≤0.5 | ≤0.5 | ≤0.5 |
| Cu | ≤0.05 | 3.8–4.9 | ≤0.1 | 1.2–2.0 |
| Mn | ≤0.05 | 0.3–0.9 | 0.4–1.0 | ≤0.3 |
| Mg | ≤0.05 | 1.2–1.8 | 0.6–1.2 | 2.1–2.9 |
| Cr | ≤0.1 | ≤0.25 | 0.18–0.28 | |
| Zn | ≤0.05 | ≤0.25 | ≤0.2 | 5.1–6.1 |
| Ti | ≤0.03 | ≤0.15 | ≤0.1 | ≤0.2 |
| others | ≤0.05 | ≤0.15 |
Table 2.
Compositions of the electrolytes use in this study.
| Substance | NaSiO·5 HO | KOH | NaHPO |
|---|---|---|---|
| c / g·L | |||
| electrolyte 1 | 5 | 5 | 1 |
| electrolyte 2 | 10 | 1 | |
Table 3.
L, a, b values representing the colour of the PEO coatings obtained in a silicate-alkali-phosphate electrolyte (30 A/dm, 60 min) in dependence of the substrate alloy.
Table 3.
L, a, b values representing the colour of the PEO coatings obtained in a silicate-alkali-phosphate electrolyte (30 A/dm, 60 min) in dependence of the substrate alloy.
| Colour Coordinates | Al 99.5 | AlMgSi1 | AlCu4Mg1 | AlZn5.5MgCu |
|---|---|---|---|---|
| L | 89.59 ± 0.4 | 67.6 ± 0.3 | 49.2 ± 1.1 | 56.9 ± 1.4 |
| a | −0.579 ± 0.05 | 2.81 ± 0.12 | 0.94 ± 0.16 | 0.24 ± 0.21 |
| b | 0.949 ± 0.26 | 8.31 ± 0.21 | 3.21 ± 0.24 | −0.8 ± 0.5 |
© 2018 by the authors. Licensee MDPI, Basel, Switzerland. This article is an open access article distributed under the terms and conditions of the Creative Commons Attribution (CC BY) license (http://creativecommons.org/licenses/by/4.0/).
Share and Cite
MDPI and ACS Style
Sieber, M.; Simchen, F.; Morgenstern, R.; Scharf, I.; Lampke, T. Plasma Electrolytic Oxidation of High-Strength Aluminium Alloys—Substrate Effect on Wear and Corrosion Performance. Metals 2018, 8, 356. https://doi.org/10.3390/met8050356
AMA Style
Sieber M, Simchen F, Morgenstern R, Scharf I, Lampke T. Plasma Electrolytic Oxidation of High-Strength Aluminium Alloys—Substrate Effect on Wear and Corrosion Performance. Metals. 2018; 8(5):356. https://doi.org/10.3390/met8050356
Chicago/Turabian StyleSieber, Maximilian, Frank Simchen, Roy Morgenstern, Ingolf Scharf, and Thomas Lampke. 2018. "Plasma Electrolytic Oxidation of High-Strength Aluminium Alloys—Substrate Effect on Wear and Corrosion Performance" Metals 8, no. 5: 356. https://doi.org/10.3390/met8050356
Note that from the first issue of 2016, this journal uses article numbers instead of page numbers. See further details here.