Effect of Solidification Cooling Rate on Microstructure and Mechanical Properties of an Extruded Mg-Zn-Y Alloy


1
Research Center for Structural Materials, National Institute for Materials Science, Tsukuba 305-0047, Japan
2
Department of Mechanical Engineering, Kobe University, Kobe 657-8501, Japan
*
Author to whom correspondence should be addressed.
Metals 2018, 8(5), 337; https://doi.org/10.3390/met8050337
Submission received: 30 March 2018
/
Revised: 19 April 2018
/
Accepted: 5 May 2018
/
Published: 10 May 2018
(This article belongs to the Special Issue Latest Developments in Magnesium Technology—Alloying, Processing, Microstructure, Deformation Mechanism and Mechanical Properties)
Abstract
:The Effect of the solidification conditions and subsequent extrusion of a Mg-3.0Zn-0.5Y (at. %) alloy containing quasicrystalline icosahedral (i-) phase was studied. Solidification was carried out by three methods using a chill casting mold, a conventional steel mold and a water-cooled mold. Subsequently, castings were extruded in the temperature range of 235–270 C at an extrusion ratio of 25:1. The solidification molds showed different characteristics. The water-cooled mold was most effective in cooling through the walls, but least effective at the center of the mold. The conventional cast mold was the most effective in cooling at the mold center. All the castings had an interdendritic eutectic structure of the i-phase, and a supersaturation of the matrix in zinc. As a result, all the extrusions had similar grain size close to 1 m and very fine nano-size precipitation. Yield strengths in tension were in the range of 376 and 404 MPa, and from 300 to 330 MPa in compression. All elongations to fracture were about 13%. It is concluded that supersaturation of the matrix during solidification is the main factor, resulting in the dynamic precipitation of very fine precipitates and fine grain size during extrusion.
1. Introduction
Being the lightest of all metals for structural applications, magnesium and its alloys have a huge potential for making lighter structures with the aim of energy savings. Of all the possible strengthening methods, grain refinement is especially effective in the case of magnesium and its alloys [1]. A convenient method of grain refinement is by dynamic recrystallization during wrought processing, such as rolling and extrusion. However, wrought processing also introduces a basal texture, due to the hexagonal crystal structure of the magnesium alloys, which introduces an anisotropy of mechanical properties. The very fine grained structure obtained by dynamic recrystallization not only enhances the strength of the alloy, but is also characterized by a weaker texture.
One of the widely studied alloy systems of magnesium is Mg-Zn-Y, which contains such interesting ternary phases as a long range ordered phase of magnesium along its c-axis (long period stacking ordered, or LPSO, MgZnY) and an icosahedral quasicrystal (i-phase, MgZnY) [2,3]. Very high strength has been reported in alloys containing the LPSO phase after wrought processing [4,5,6]. In the case of alloys containing the i-phase, very high strengths in combination with good ductility and low anisotropy have been reported [7,8,9,10,11,12,13,14,15,16,17,18,19,20,21,22]. Apart from the dispersion of the i-phase, these alloys are strengthened by Zn solid solution and Mg-Zn binary phase precipitation. Extruded alloys of Mg-Zn-Ho showed low anisotropy of deformation [14]. These alloys show high fracture toughness [23,24], superplasticity and low temperature formability [25]. Fatigue properties are also noteworthy [26]. Very high strengths were shown after powder metallurgy of Mg-Zn-Y alloys in which the grain size was reduced to the sub-micron level [16]. However, it was also shown that micron and sub-micron grain size could be obtained by simple extrusion from alloys cast by chill casting method, resulting in tensile yield stresses (YS) nearing or better than 400 MPa, accompanied by total elongation of over 13% [17,18,19,21]. The supersaturated matrix in these alloys resulted in dynamic precipitation of nano-sized precipitates of Mg-Zn phase during extrusion.
Recently, there have been many reports of various solidification processes applied to i-phase containing Mg-Zn-Y alloys [27,28,29] and their hot deformation characteristics [22,30,31]. In this study solidification methods were used for the purpose of obtaining the best mechanical properties after subsequent wrought processing. Since chill casting of the alloy was deemed necessary to achieve these properties after extrusion [17,18,19,21], in the present study chill casting is compared with a conventional steel mold casting and a water-cooled mold casting of a Mg-Zn-Y alloy. The effect of these three casting processes on solidification and extruded microstructure, as well as on mechanical properties are studied.
2. Experimental Procedure
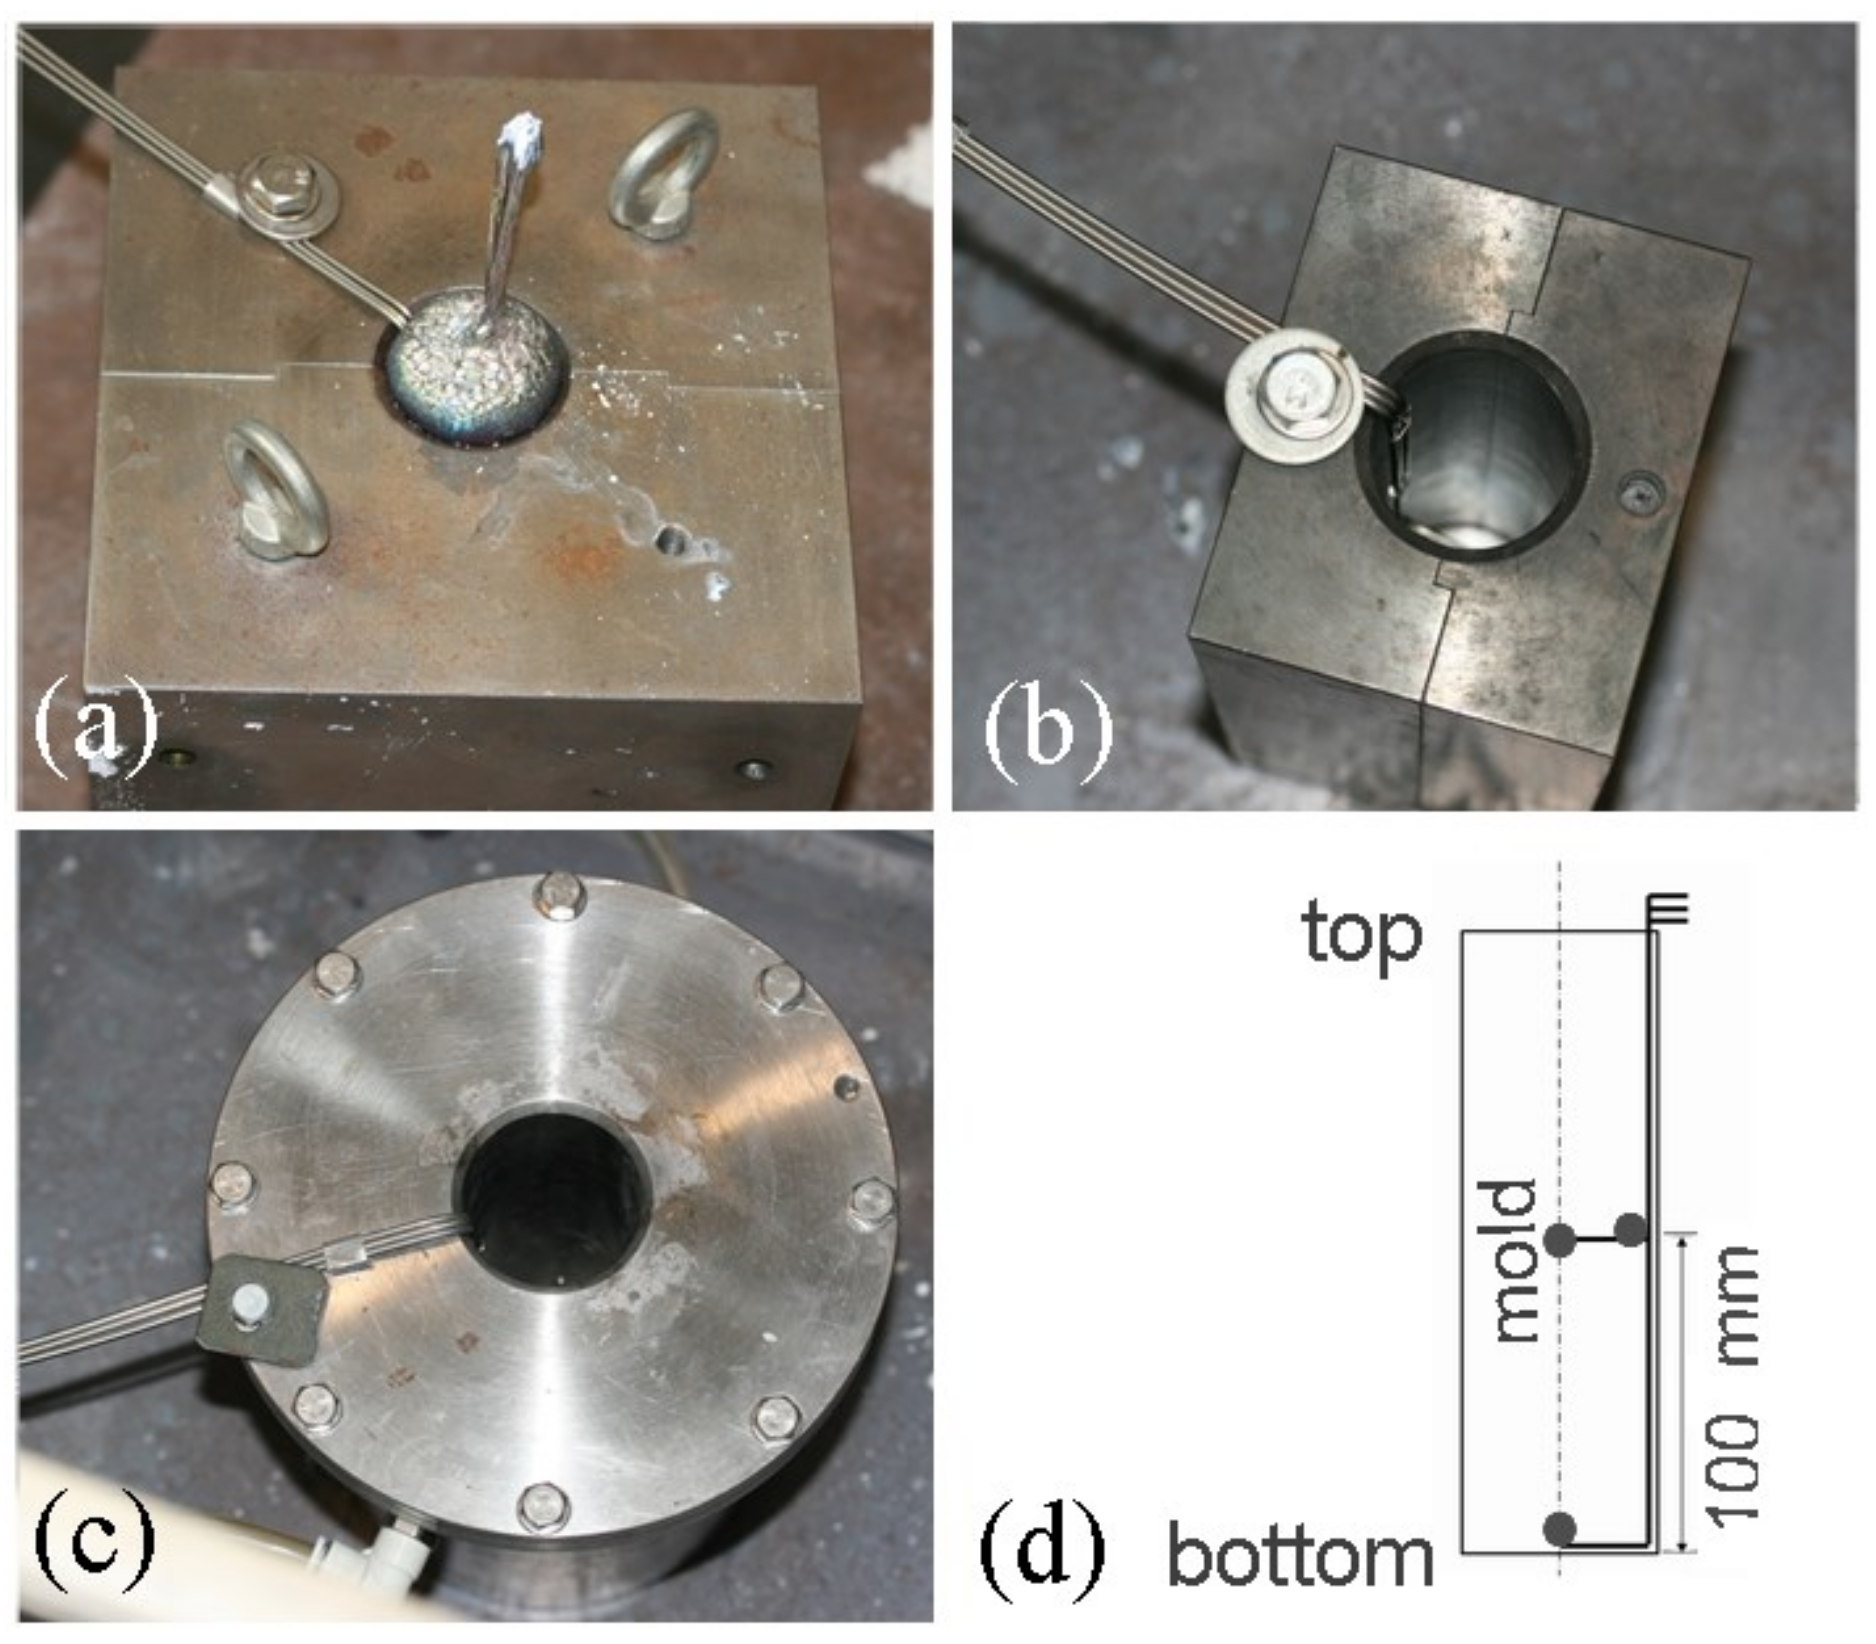
An alloy of composition Mg-3.0%Zn-0.5at%Y was prepared by the melting of pure elements and a Mg-Y master alloy under a protective gas atmosphere in an electric furnace. Degassing treatment was performed with Ar gas at a rate of 1 L/m, while stirring at 300 rpm. The alloy was cast at melt temperature of 750 C in three kinds of molds: a conventional steel mold, a chill-casting mold and a water-cooled mold, shown in Figure 1. Mold dimensions are given in Table 1. The chill casting mold was built of SS400 steel, equivalent of ASTM A36. In the water-cooled mold, water was circulated at room temperature. To measure the cooling rate of the melt in the mold, temperature measurements were taken at three locations, shown in Figure 1d, at side (wall, at half height), middle-center and bottom-center, with a K-type sheath thermocouple sheathed in SUS316 tube of diameter 1.6 mm. The sampling rate of the temperature was 1 s. Samples were cut from the center, wall and bottom parts of the castings for observation of the microstructure by optical microscopy and scanning electron microscope (SEM). A JEOL 7100 SEM (JEOL Ltd., Tokyo, Japan) was employed, attached with X-ray energy dispersive spectroscopy (EDS).
The chill cast alloy was extruded at 235 C, conventionally cast alloy at 240 C and water cooled (WC) alloy at 266 C (these were the temperatures recorded during the extrusion). The extrusion ratio was 25:1, forming a rod of diameter 8 mm. Samples were cut along the middle of the length of the rods (longitudinal sections) for observation of microstructure by SEM and transmission electron microscopy (TEM). TEM observations were performed on a JEOL 2000FX microscope (JEOL Ltd., Tokyo, Japan). Samples were sliced from the rods, mechanically ground and then ion milled until perforation for TEM observations. Grain size was measured by linear intercept method. The average grain diameters obtained were multiplied by a factor of 1.74 to compensate for stereological effects [32]. Synchrotron radiation diffraction experiment was performed at Spring-8 facility in Japan, with a radiation of 0.6304 Åwavelength.
Samples for tensile and compressive mechanical testing were machined along the extruded rods. Tensile samples had a gauge length of 15 mm and diameter of 3 mm. Compression test samples were cylinders of diameter 4 mm and length 8 mm. An initial strain rate of /s was employed.
3. Results
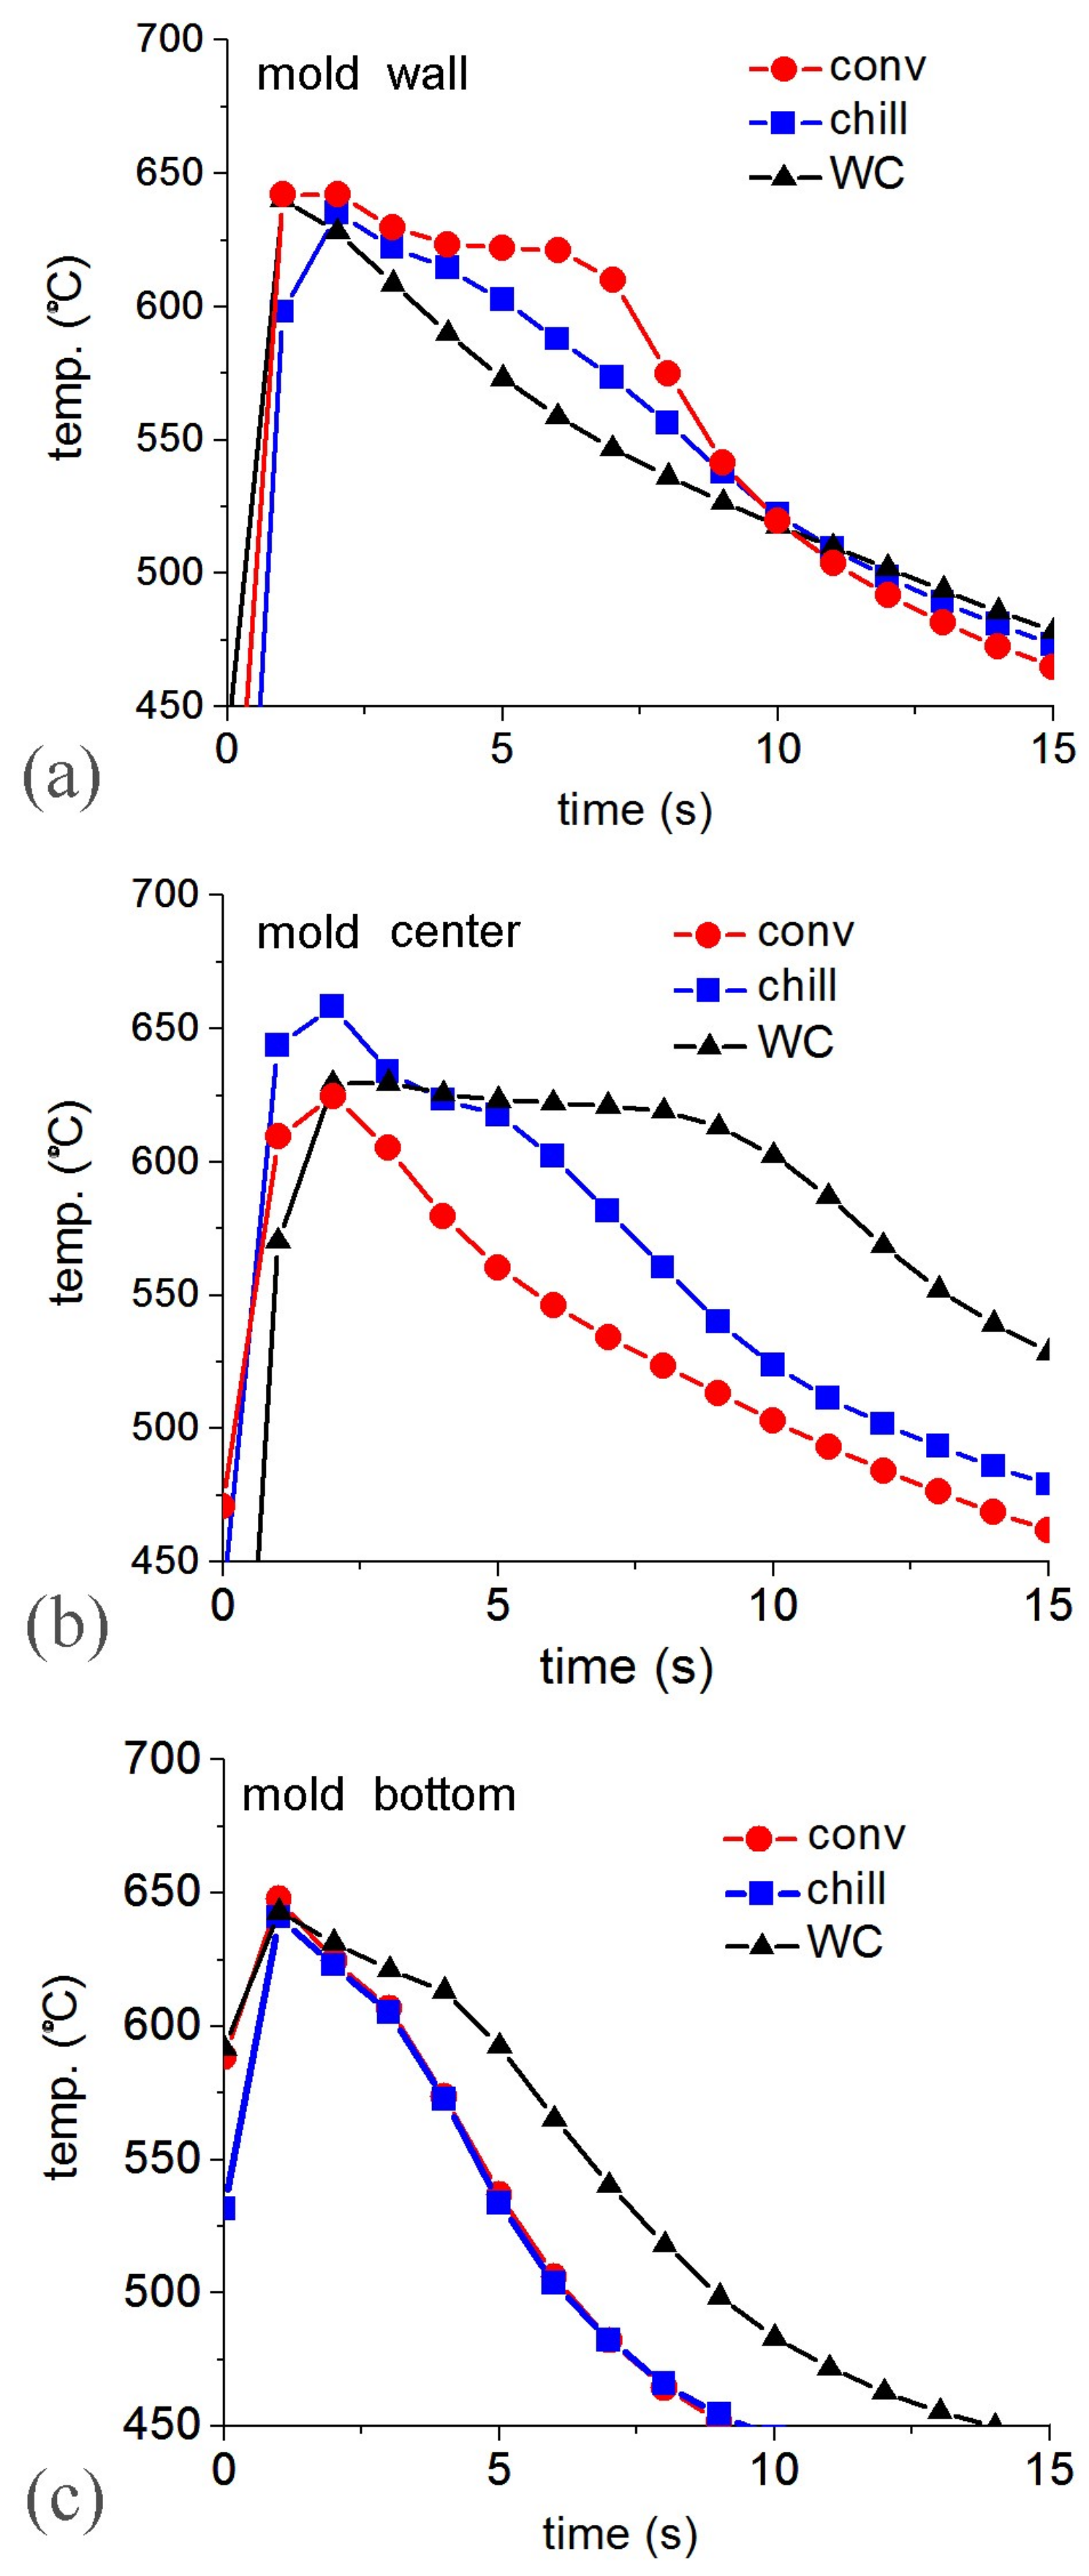
Cooling rates during solidification at the three locations are plotted in Figure 2. At the wall, the water-cooled mold had the fastest cooling, followed by chill casting. In case of the conventional casting mold, the heat removal from the walls was not very efficient, and the cooling rate was very sluggish up to about 6 s. At the center of the mold the fastest cooling was in case of the conventional mold, followed by chill casting. In case of the water cooled mold the heat removal from the center was very sluggish, stagnating at about 625 C for about 8 s. In the chill casting mold the temperature at the center first shot up to over 610 C before cooling. Cooling from the bottom was the most efficient in all the molds, with the cooling plots of the chill and conventional casting almost coincidental, followed by a slower rate for water cooling.
In the chill-cast mold, the cooling rates from the wall were at first faster than from the center, and then kept the same pace with each other after about 8 s. Cooling from the bottom was much more efficient than the other two. In the case of the conventional mold, cooling from the wall was inefficient, and lagged behind that from the bottom by about 10 s. Cooling at the center is at a slower rate, and catches up with the wall temperature after about 18 s. In the case of the water-cooled mold, cooling from the wall was very efficient and led the center by about 75 K after 20 s. In summary, the bottom of the chill cast mold cooled quickly, followed by the wall and the center. In the conventional mold, cooling from the bottom was also quick, followed by the center, while from the walls is sluggish. In case of the water cooled mold, cooling from the bottom and the wall were moderately good while it was sluggish at the center.
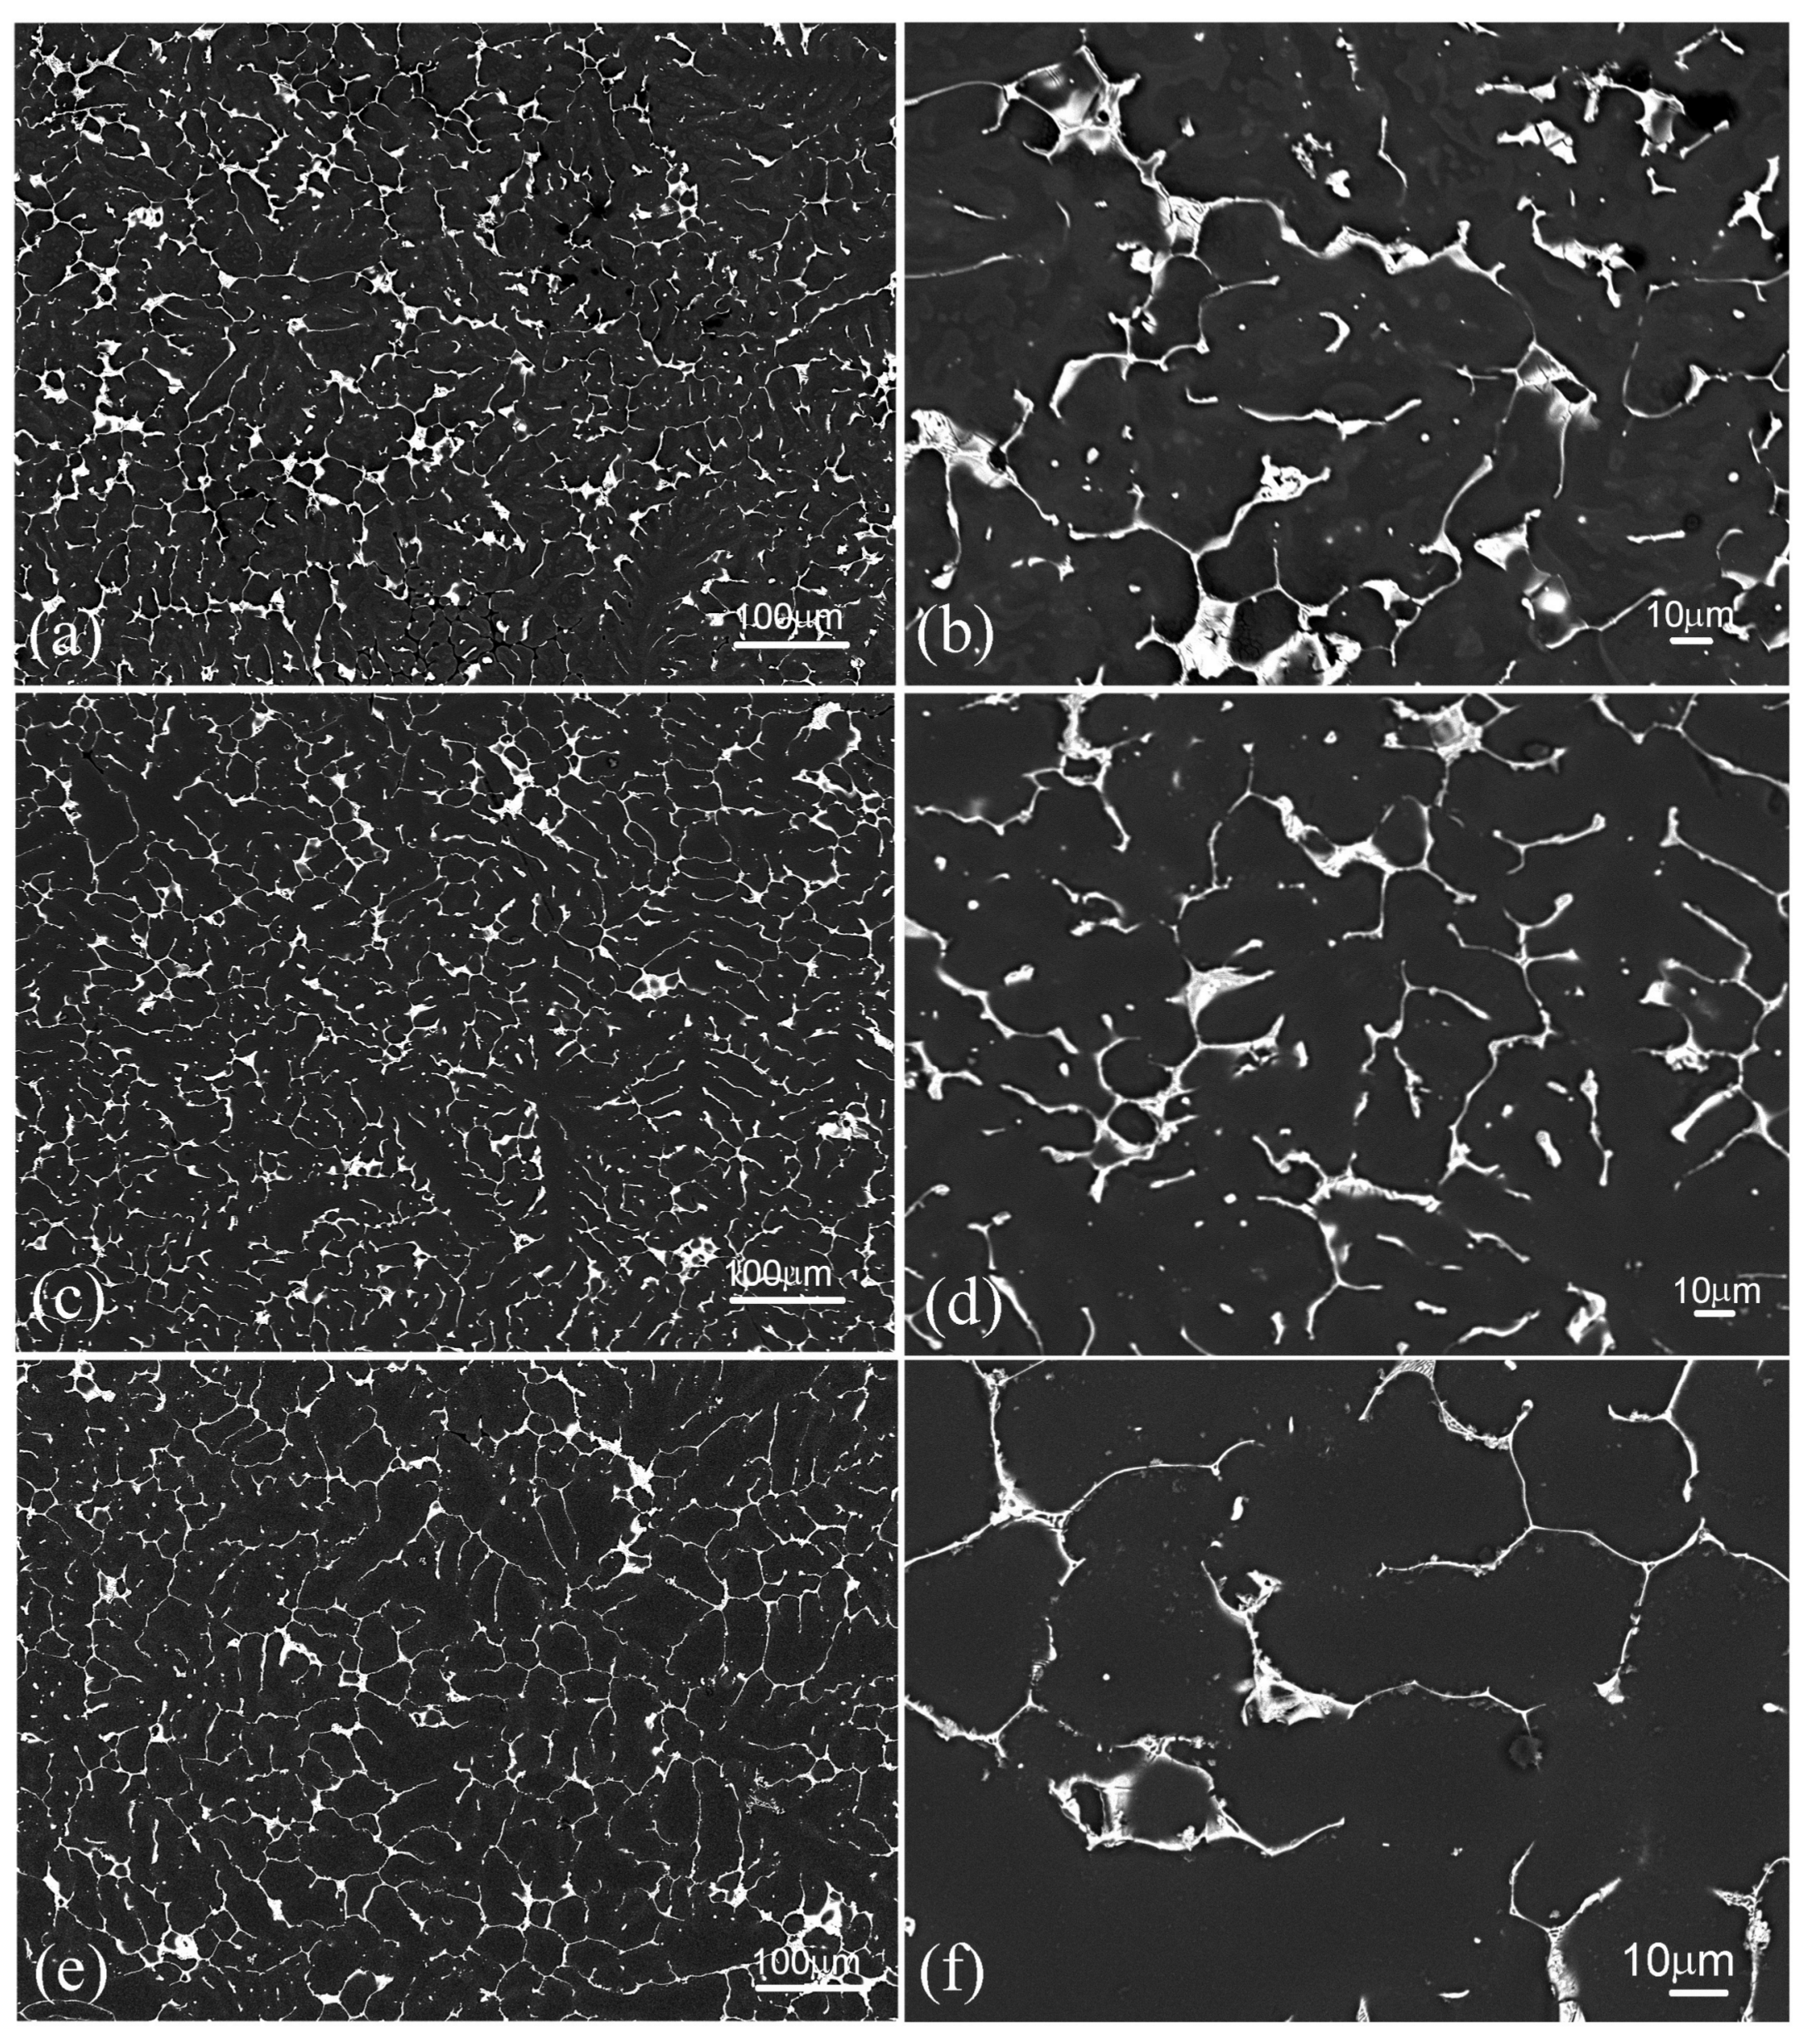
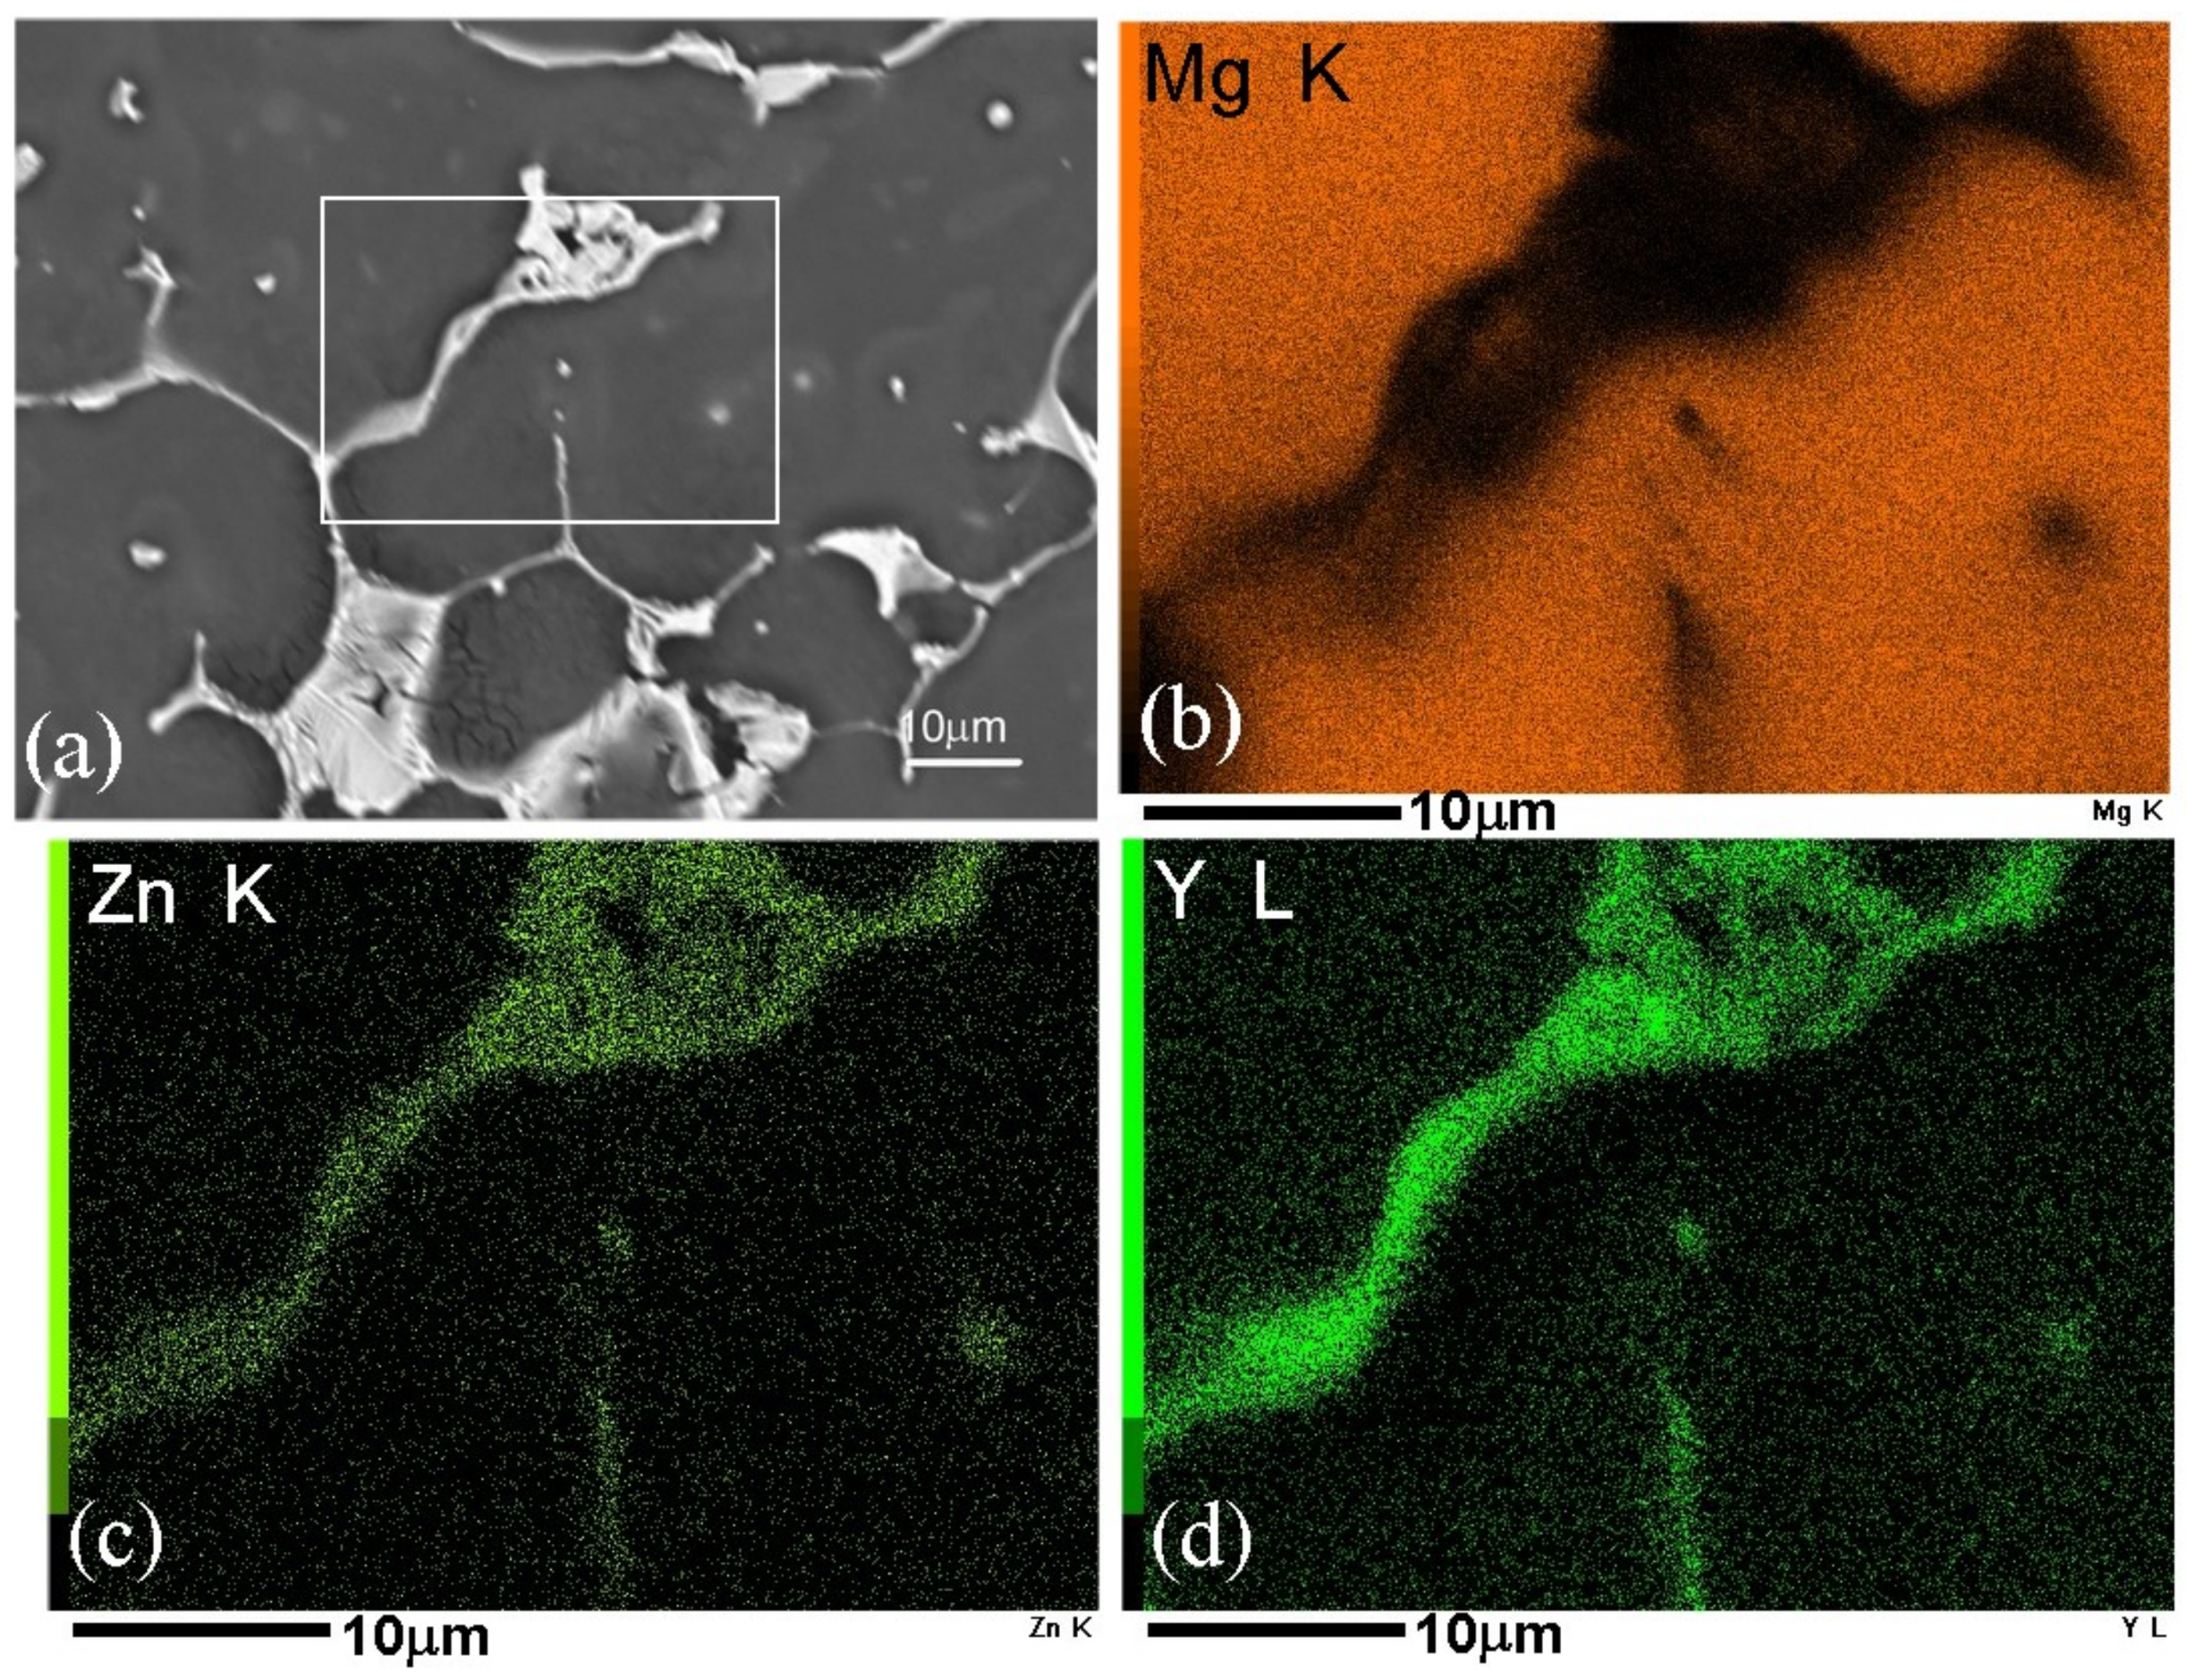
Solidification structures are shown in Figure 3 and Figure 4 at the center and the wall of each type of the casting. The microstructure was characterized by -Mg solid-solution dendrites with an interdendritic eutectic phase. Figure 5 shows that this interdendritic phase was a ternary phase, which was confirmed to be mainly the i-phase by electron diffraction, as shown in Figure 6. In Figure 3, the dendritic microstructures (defined by the bright eutectic structures of the i-phase in between) appeared similar for the chill-cast and the conventionally cast, but were visibly coarser for the water-cooled casting. The micrograph corresponding to chill-cast mold (Figure 3b) shows well defined interdendritic eutectic region. However, the region of -Mg in between is not smooth. It shows some gray patterns, indicative of solute supersaturation region. The dendritic regions from the conventional casting (Figure 3d) shows a uniform contrast. Figure 3f shows that in case of water-cooled mold, the dendrite size is large, with uniform contrast. All the castings showed much finer dendritic structure near the wall, than the center of the castings (Figure 4). All the higher magnification micrographs of Figure 4b,d,f show regions of gray contrast in the dendritic regions, with chill cast casting more prominently than the conventional casting. The most prominent regions of such feature are in the water-cooled casting (Figure 4f), in which a flowing pattern of gray is visible. However, the microstructure of the water-cooled casting near the wall showed signs of much faster solidification. The dendrites were long, and the eutectic phase was fine and discontinuous (Figure 4e). In case of faster phase transformation (solidification) there are more nucleation points and shorter growth. Thus the eutectic phase is not continuous everywhere and not uniformly distributed. Supersaturation in the matrix shows that the solute did not have enough time to partition before solidification. This corresponds to the fast cooling rate in the beginning of the solidification, Figure 2a. Study of the supersaturation by EDS is described in the following.
The dispersion of the alloying elements in the alloys was studied by EDS in SEM. Apart from the -Mg solid solution and the interdendritic eutectic phase, supersaturation of the matrix in zinc was found in the rapidly cooled parts of the castings, as indicated in the SEM micrographs above. Figure 7 shows elemental concentrations along the EDS line scans in samples from the center of chill and conventional mold castings. High concentrations of solutes Zn and Y were observed at positions of the ternary phase, marked by arrowheads in the backscattered electron micrographs. A subtle contrast within the matrix in Figure 7a also suggests non-uniform concentration of solute. The corresponding concentration profile shows that, although the concentration of yttrium was more or less uniform within the matrix, zinc was locally concentrated, pointed out by arrows (an uneven solute distribution is also reflected in the concentration profile of Mg). Similar features are observed in Figure 7b. This supersaturation of solute in the matrix is an important feature, and results in dynamic precipitation during the extrusion process.
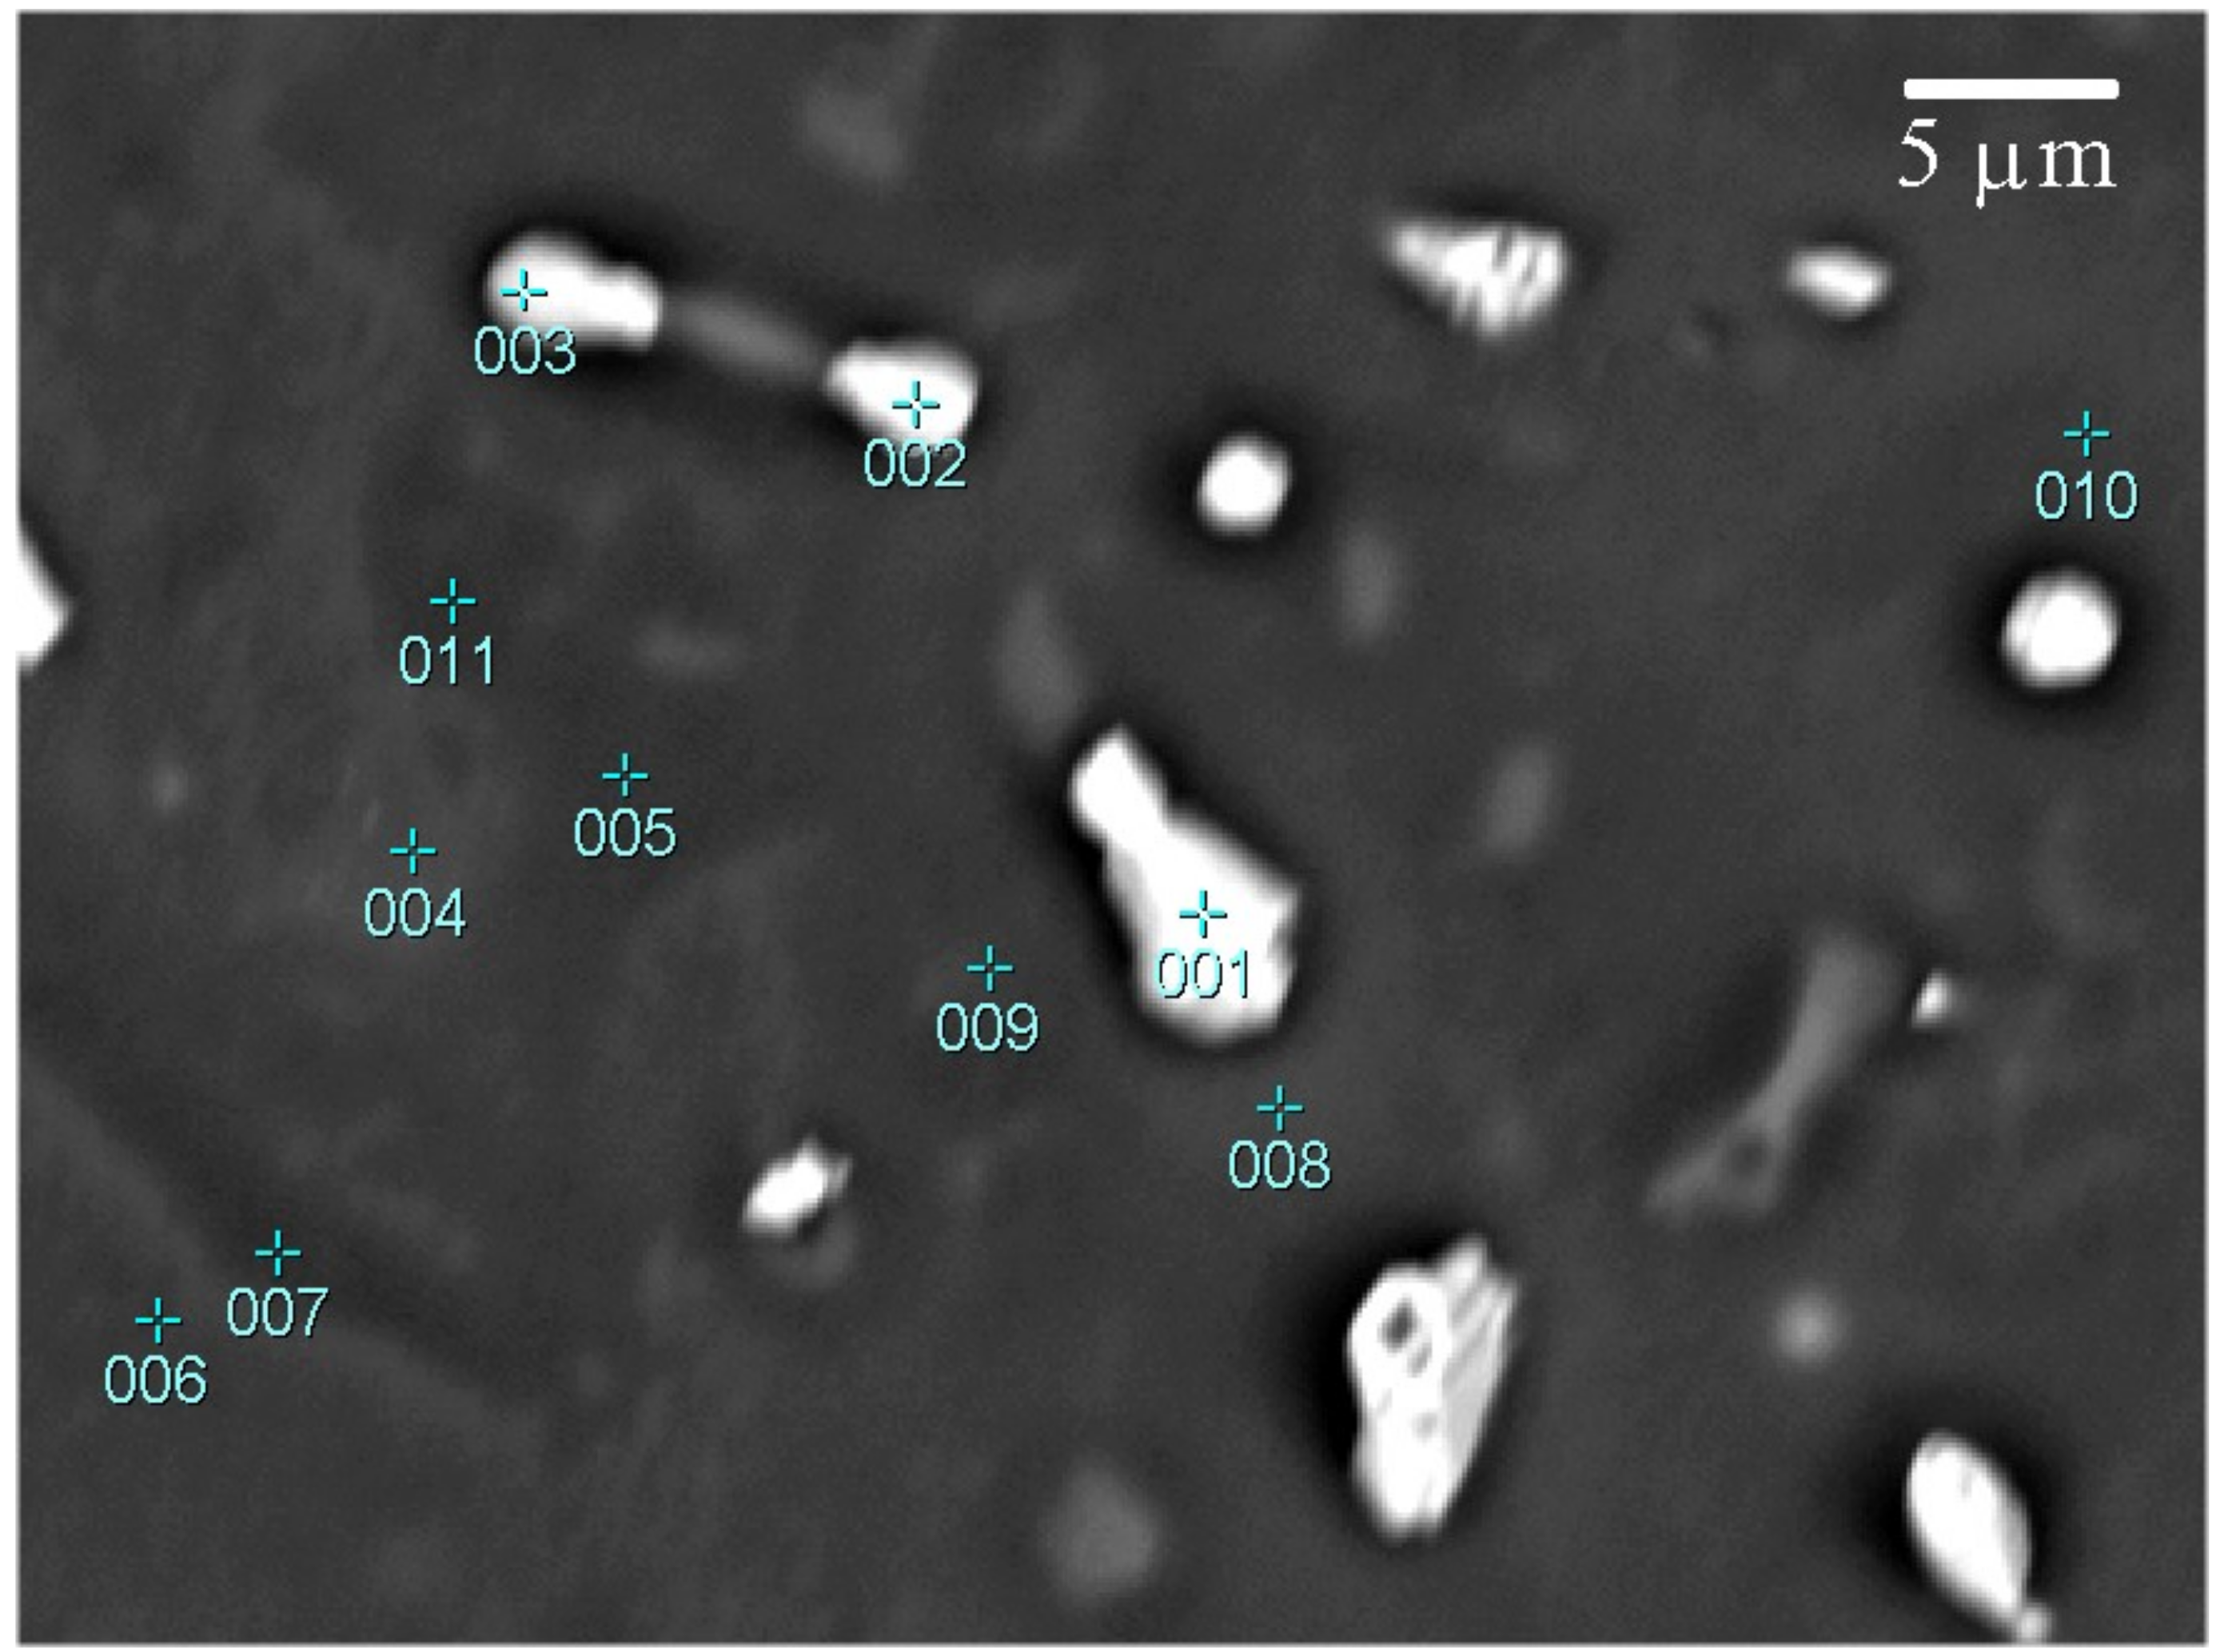
Figure 8 shows microstructure of water-cooled casting near the mold wall (which indicated high solute supersaturation in SEM micrographs of Figure 4f). Composition by EDS was determined at locations numbered in this image, and listed in the accompanying table. Points 2 and 3 could be identified as i-phase, while point 8 could be identified as a Mg-Zn binary phase. In the super-saturated matrix there are two distinct regions of 2.53 ± 0.17 at. % Zn and 1.86 ± 0.03 at. % Zn. In some regions such as identified by point 8, zinc concentrations of as much as 7 at. % were detected. A low uniform concentration of yttrium occurred at about 0.20 ± 0.015 at. %. Richer solute concentration regions could be distinguished by contrast in the backscattered images. In the faster cooled regions of the casting there could be larger areas of super-saturated matrix, at the expense of the eutectic phase. For example, at the center of the casting, the chill cast casting showed 7.7% eutectic (by volume) and 19.6% supersaturated region, while the conventional casting showed only the eutectic phase, which was 10.5%.
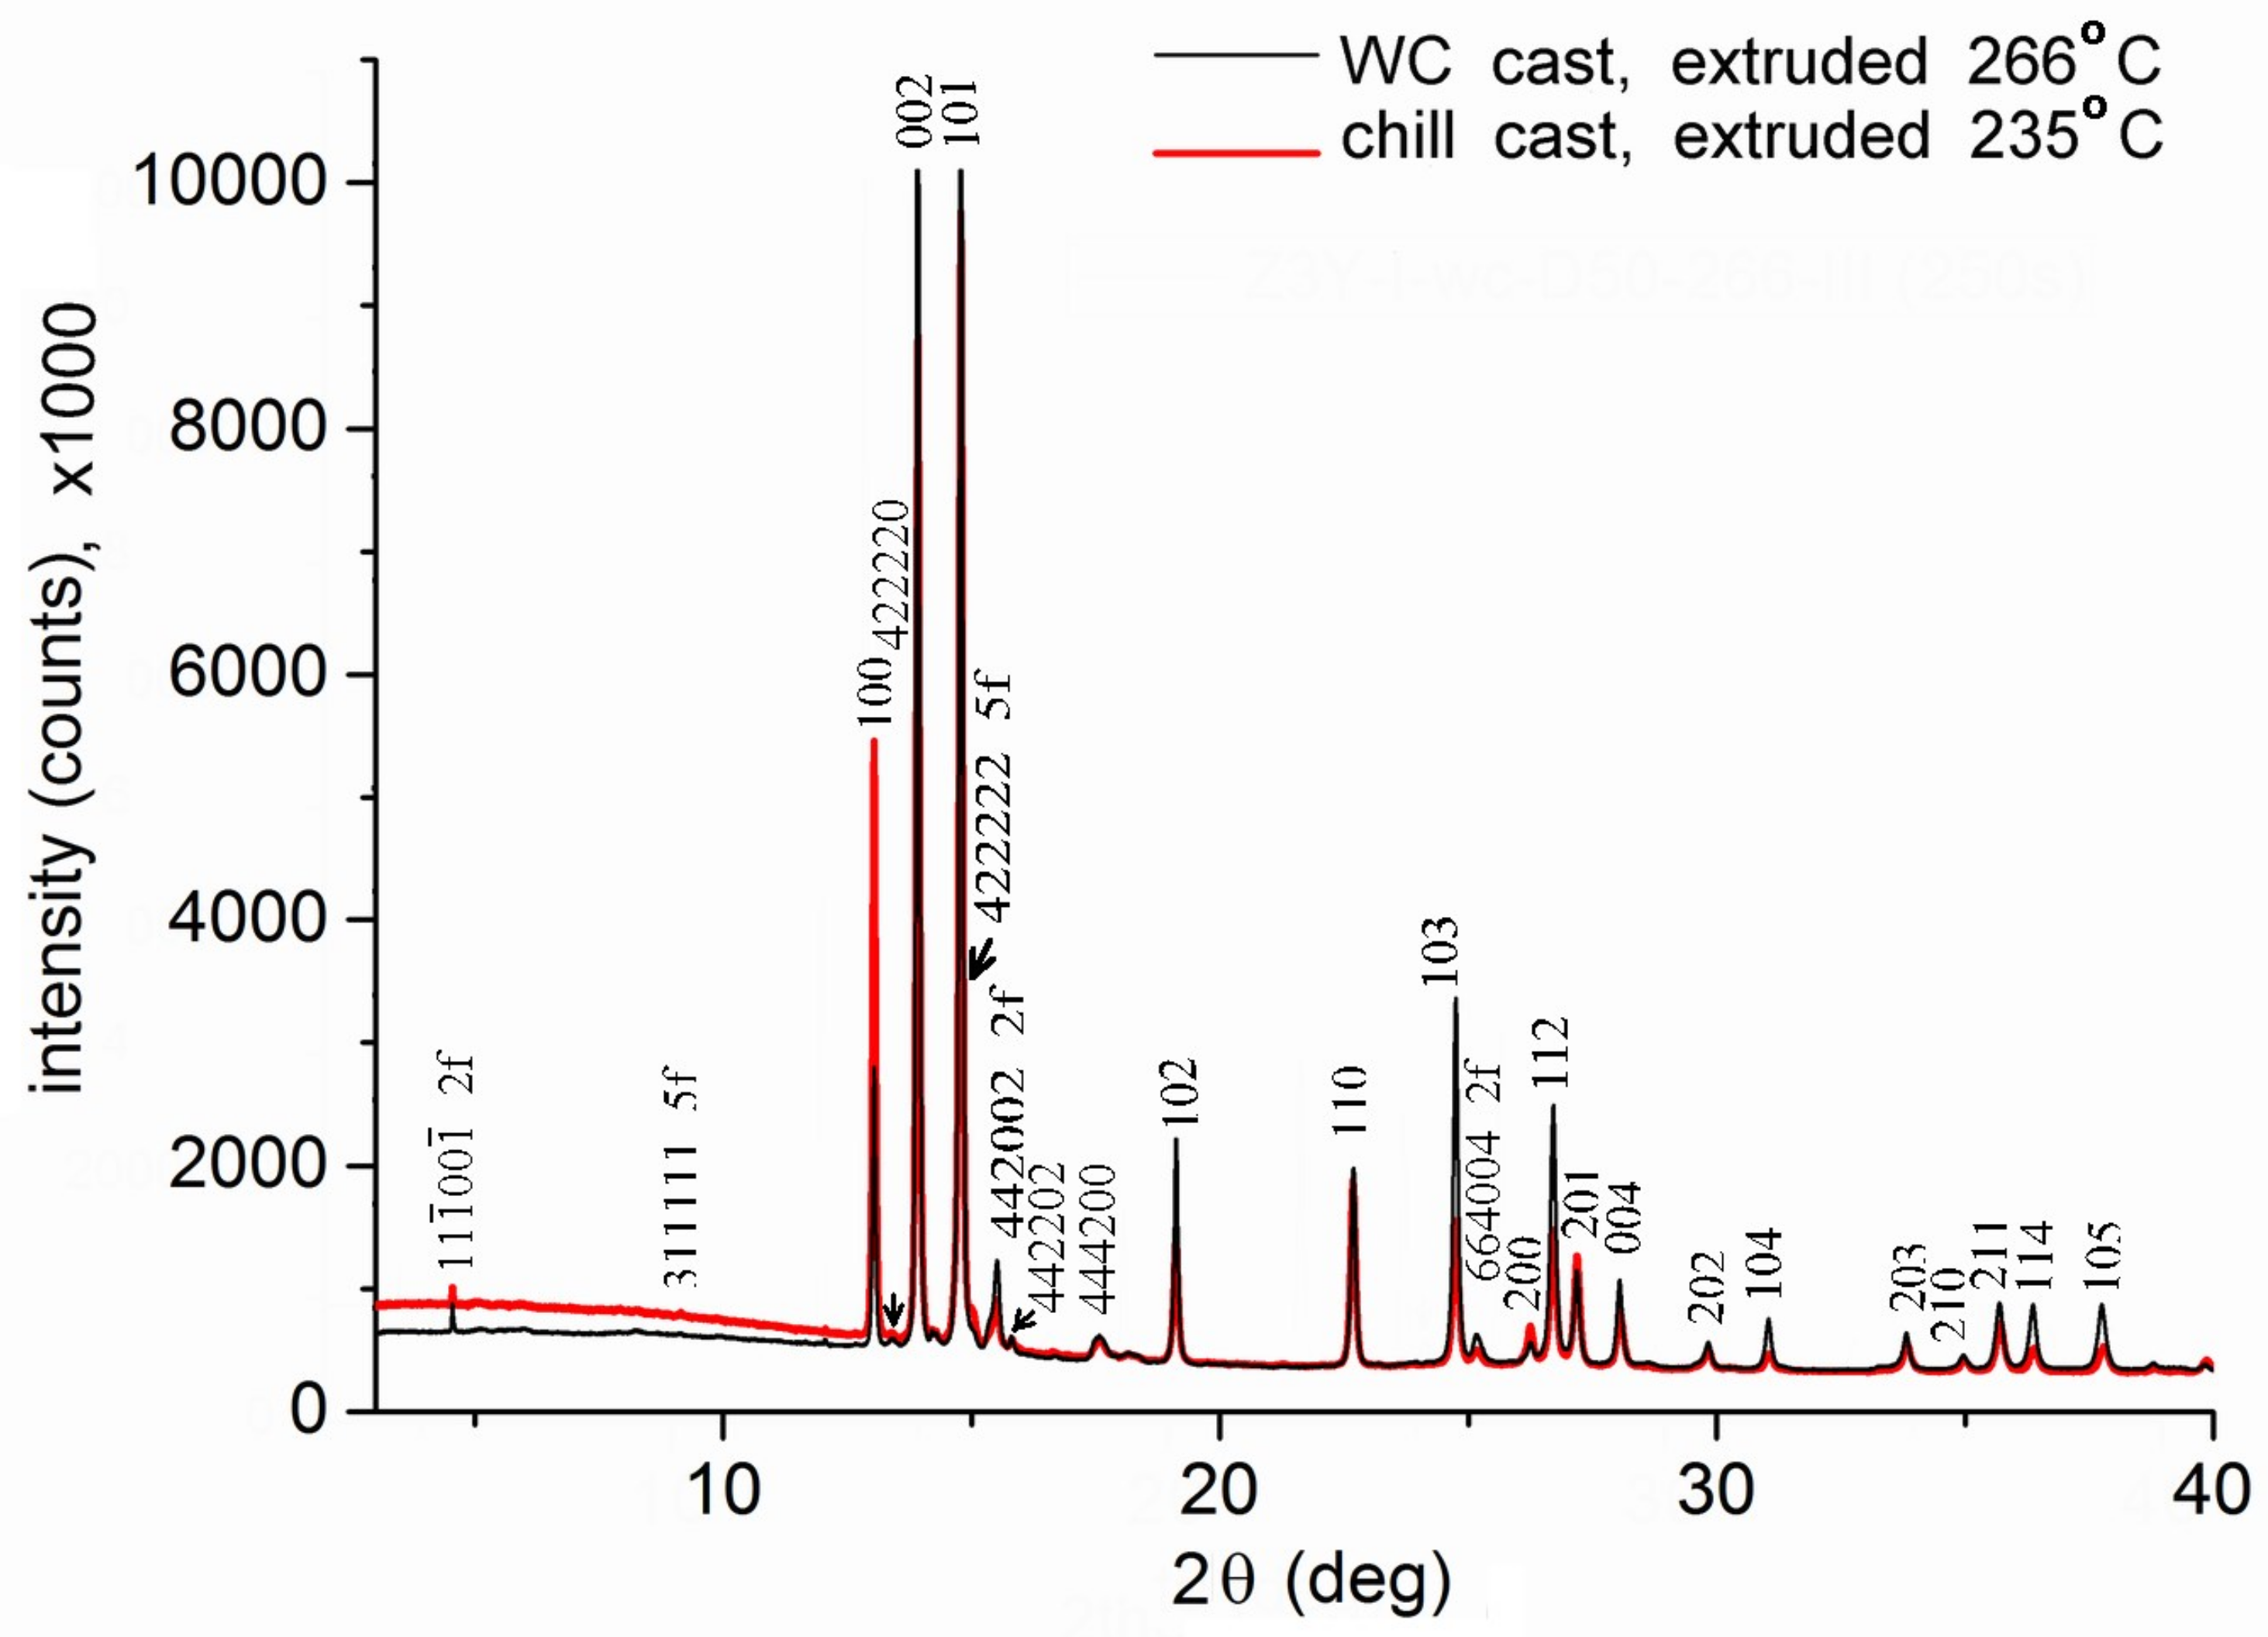
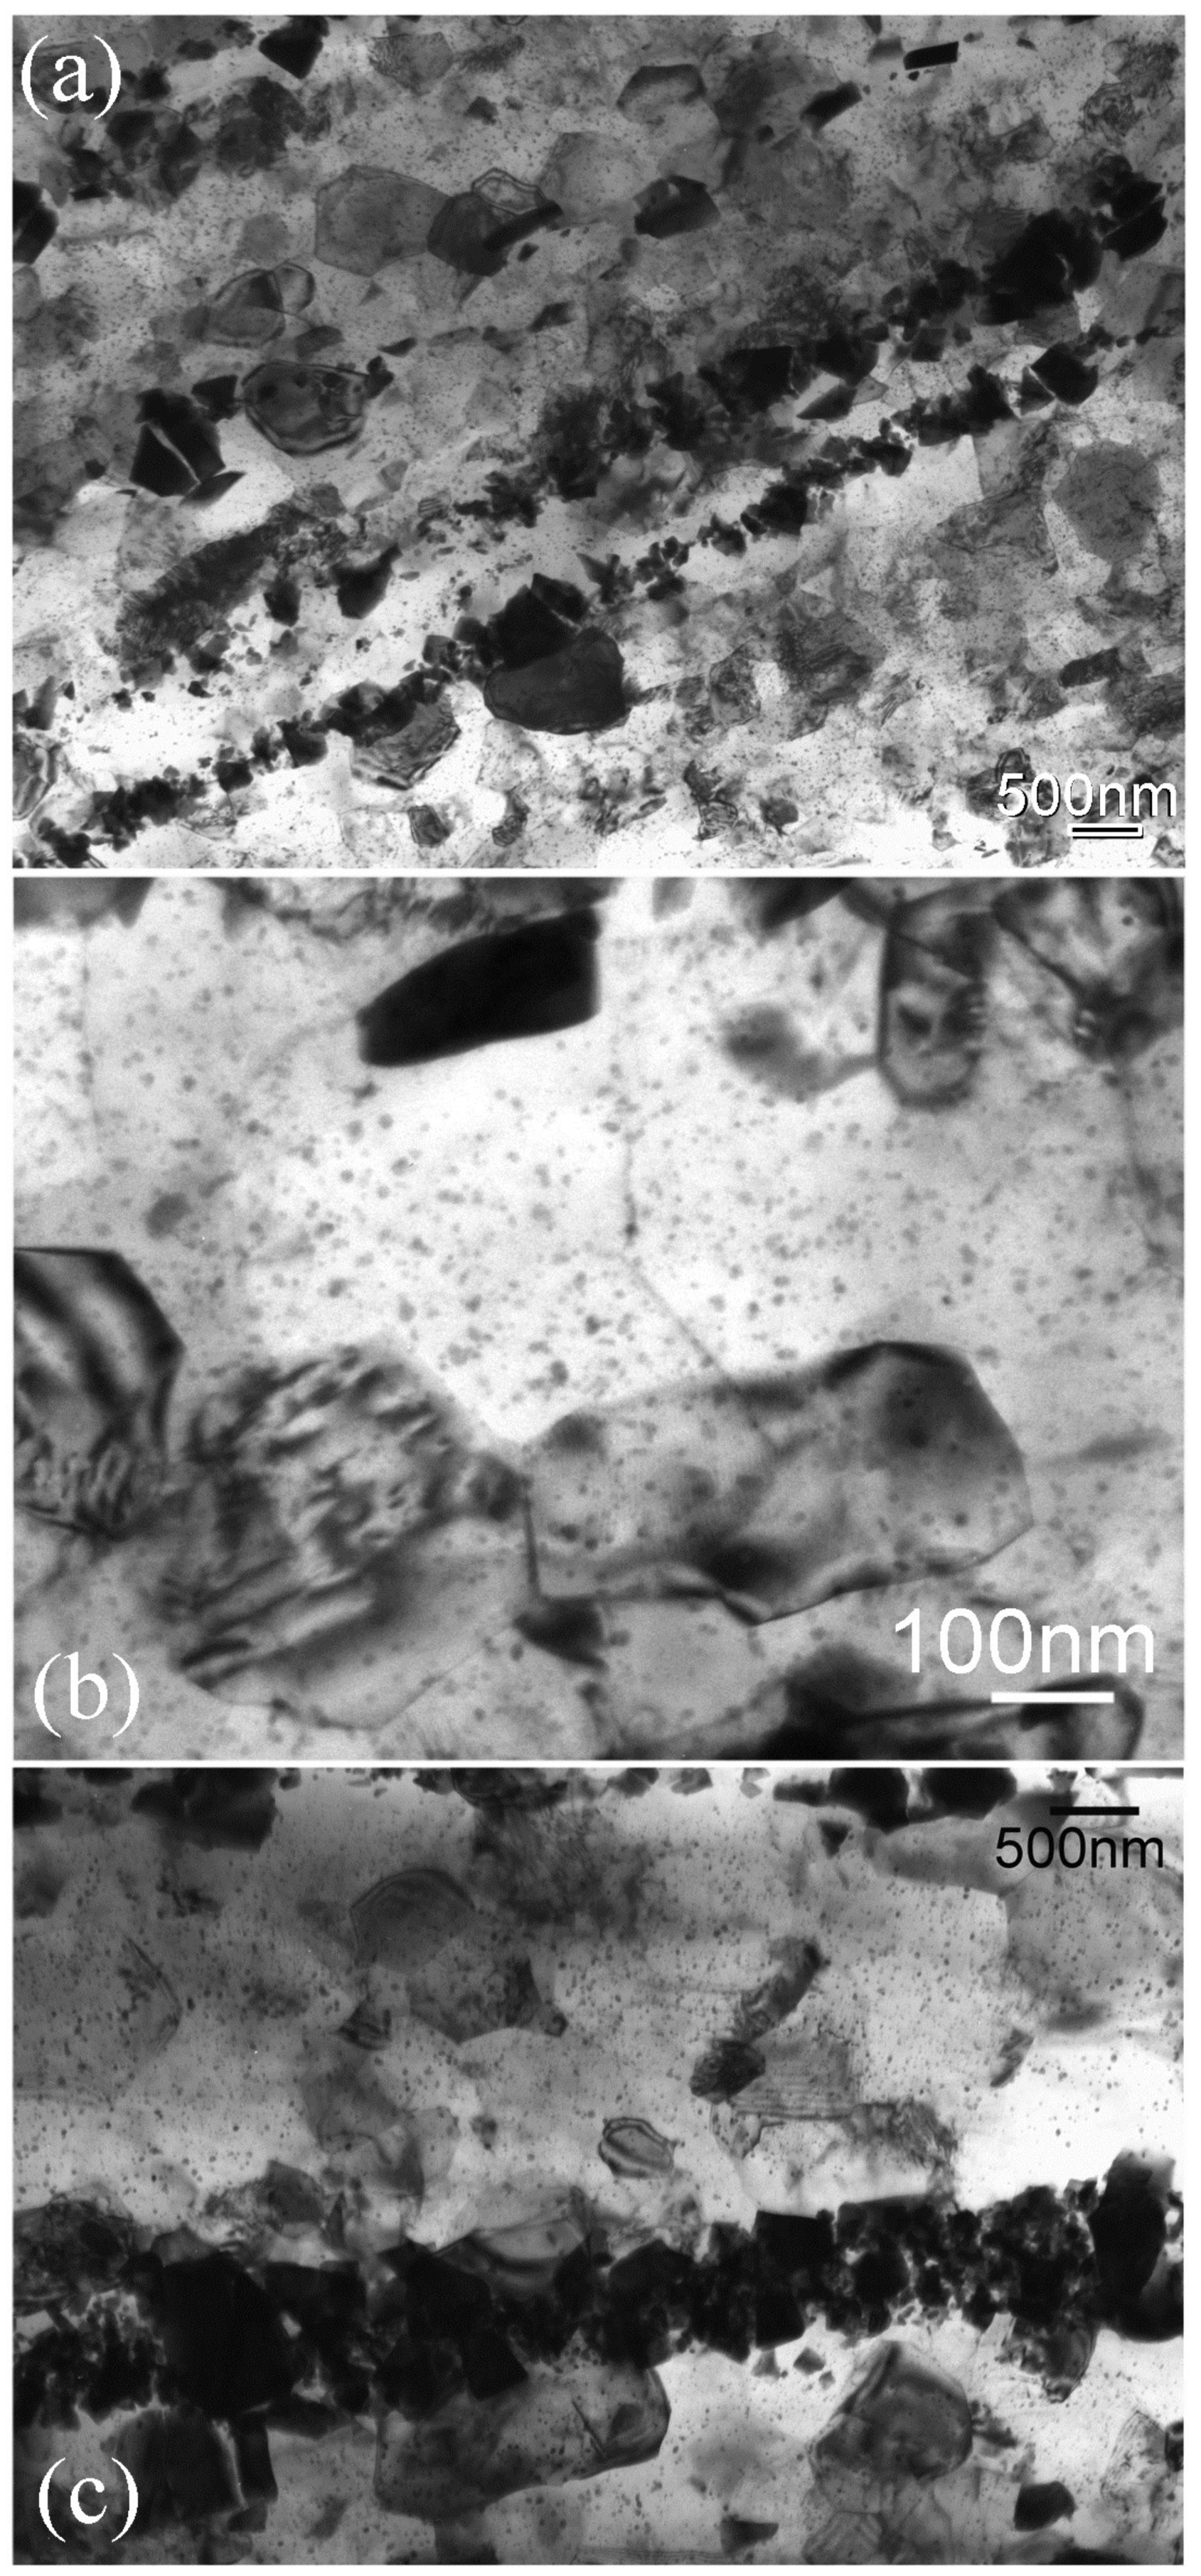
Synchrotron radiation diffraction patterns for two of the extruded alloys are shown in Figure 9. Both the patterns are nearly identical in their peaks. -Mg and main icosahedral phase peaks are indexed. Extrusion caused distribution of the eutectic phase along the extrusion direction, as shown in Figure 10. The lower magnification micrographs, Figure 10a,b show that the eutectic phase is now well distributed throughout the alloys. Higher magnification micrographs, Figure 10c,d show that the particles are varied is size. Occasional large particles can be as large as 5 m, while most are in the range of nanometers to about half a micron. Finer details are visible from TEM micrographs. Figure 11a shows the microstructure of the extruded conventionally molded cast alloy. Dark fragments of the i-phase were dispersed along the extrusion direction, especially as two nearly continuous rows. Along these rows, the particle sizes were in the range 100 to 500 nm. Recrystallized grains of typical size of 1 m are clearly observed. It must be pointed out here that there were also large unrecrystallized regions. In a more detailed micrograph of Figure 11b from the same sample, very fine precipitates were observed, with size of about 15 nm. These were Mg-Zn precipitates. Microstructure of the extruded rod from the water-cooled mold casting is shown in Figure 11c. Horizontal rows of fragmented i-phase particles are observed, among recrystallized grains with very fine precipitates inside. The extruded rod of the chill cast casting showed a similar microstructure, to that reported earlier [18].
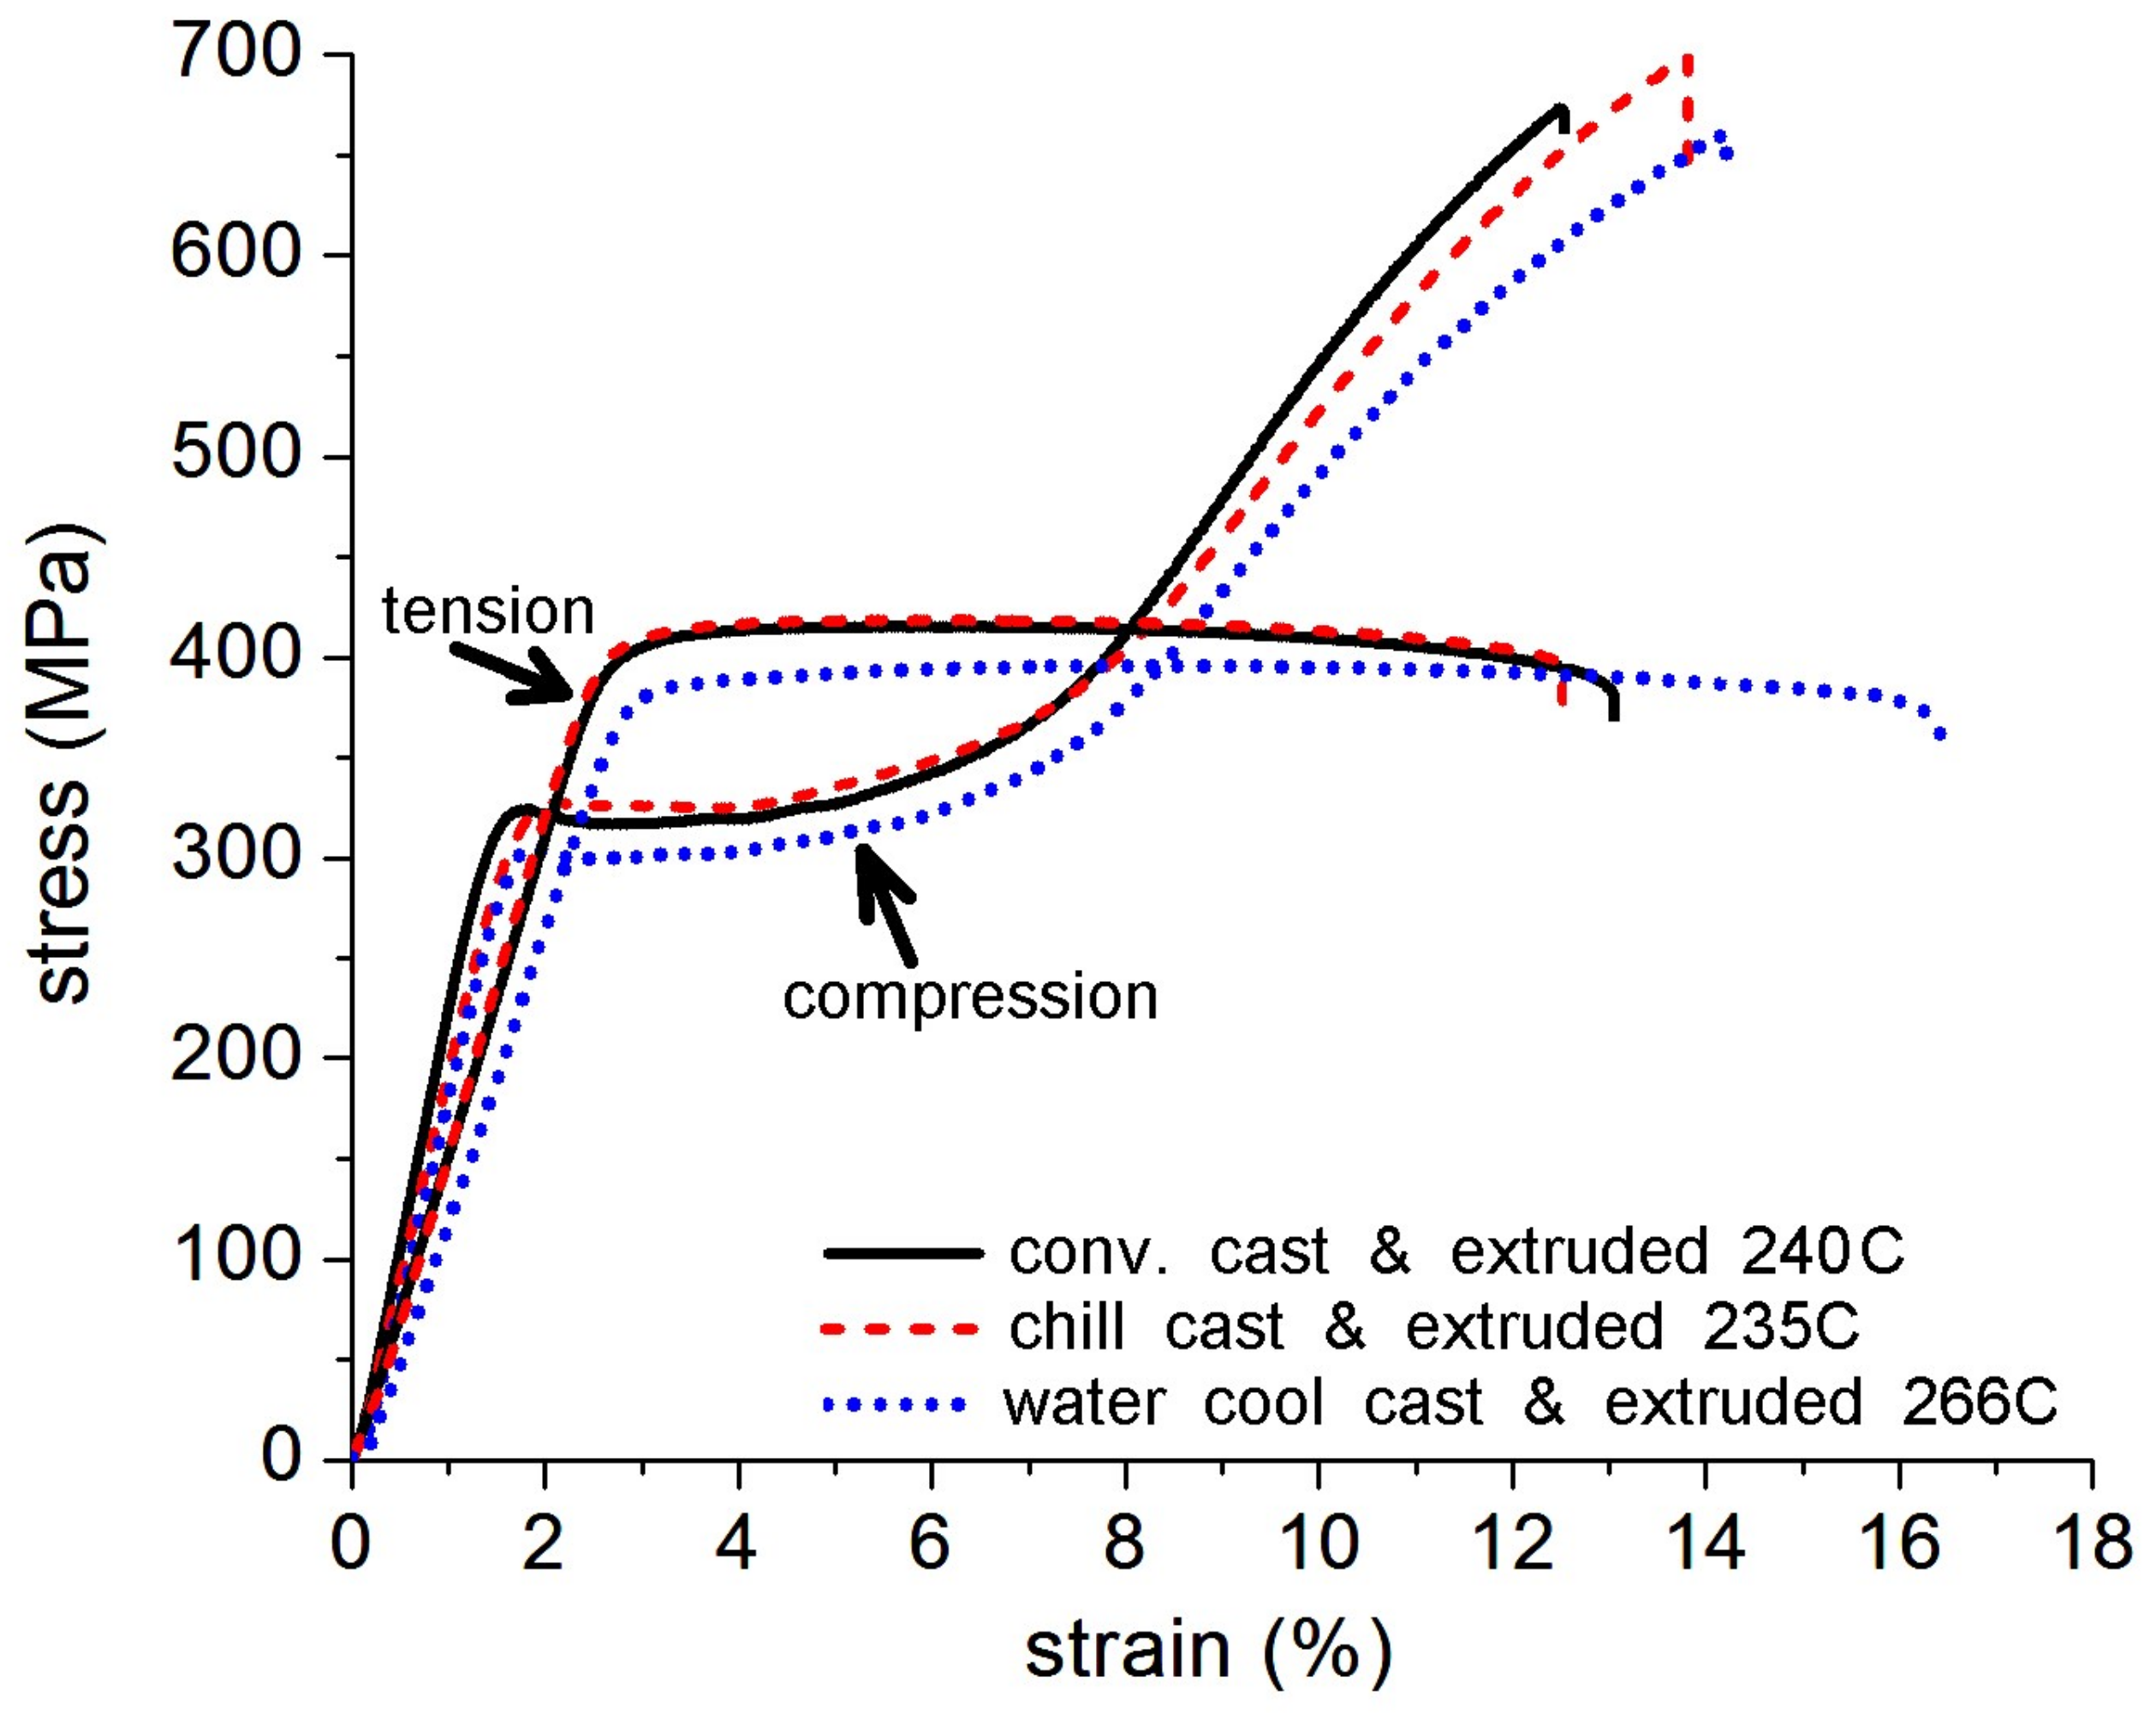
Figure 12 shows stress-strain plots of the tensile and compression tests on the extruded alloys. Some deviations in the elastic limit are ascribed to microyielding [33]. The extrusions made from the alloy cast by three different molds showed similar strengths in tension and compression. The yield strengths in tension are close to 400 MPa, while in compression they were close to 300 MPa. These values are listed in Table 2, along with other parameters such as the extrusion temperature and average grain size. The alloys showed very little strain hardening due to a very fine grain size. The water-cooled cast extrusion had a relatively coarser grain size and lower strength, which is apparently due to a higher extrusion temperature. However, all the extrusions showed about the same yield asymmetry. The yield asymmetry ratio (YAS; i.e., the ratio of YS in compression to YS in tension) was about 0.81. The YAS can be related to the composition of the alloy and the extrusion temperature. The YAS becomes lower with a lower concentration of solute [18,19,21] and a lower extrusion temperature [19]. Both conditions result in a lower rate of recrystallization. Table 2 shows total elongations to failure for both tensile and compression tests. Elongations in tension and compression had similar values, except for the water-cooled mold case, where the tensile elongation is higher. At this high YS, these alloys exhibits the longest elongation to failure, than any other magnesium alloys. With a combination of high strength and ductility, they should have very high toughness. High fracture toughness is shown for this class of alloys [23].
4. Discussion
The three solidification molds exhibited various efficiencies for faster solidification. The heat removal from the wall was the most efficient in the case of the water-cooled mold, followed by the chill-casting mold. In the case of the conventional mold the temperature still hovered at about 620 C for 7 s, while it reached 550 C in water-cooled mold. In all cases the temperature reached about 520 C after 10 s. However, at the center of the casting the heat removal in the water-cooled mold was very sluggish, hovering over 600 C for 10 s, while it reached 525 C in the chill-casting mold, and 500 C in the conventional mold being the most efficient. The bottom cooling was very efficient in all cases, reaching below 450 C within 10 s in chill-cast and conventional mold and being at about 480 C in water-cooled mold. Thus, in each case some part of the casting had higher solidification rate.
The quasicrystal phase stimulates dynamic recrystallization by the nucleation of recrystallized matrix phase grains over its surface [30,31,34]. The dynamic precipitation of very fine precipitates is an important phenomenon, which keeps the grain size fine by pinning the grain boundaries. This precipitation is a result of the super-saturation of the matrix. By fast cooling during solidification, some part of the casting is always supersaturated in solute. Since some part of all the castings are supersaturated, fine grains are obtained in all cases. Therefore very fine grain size was obtained after the extrusion of all castings studied here.
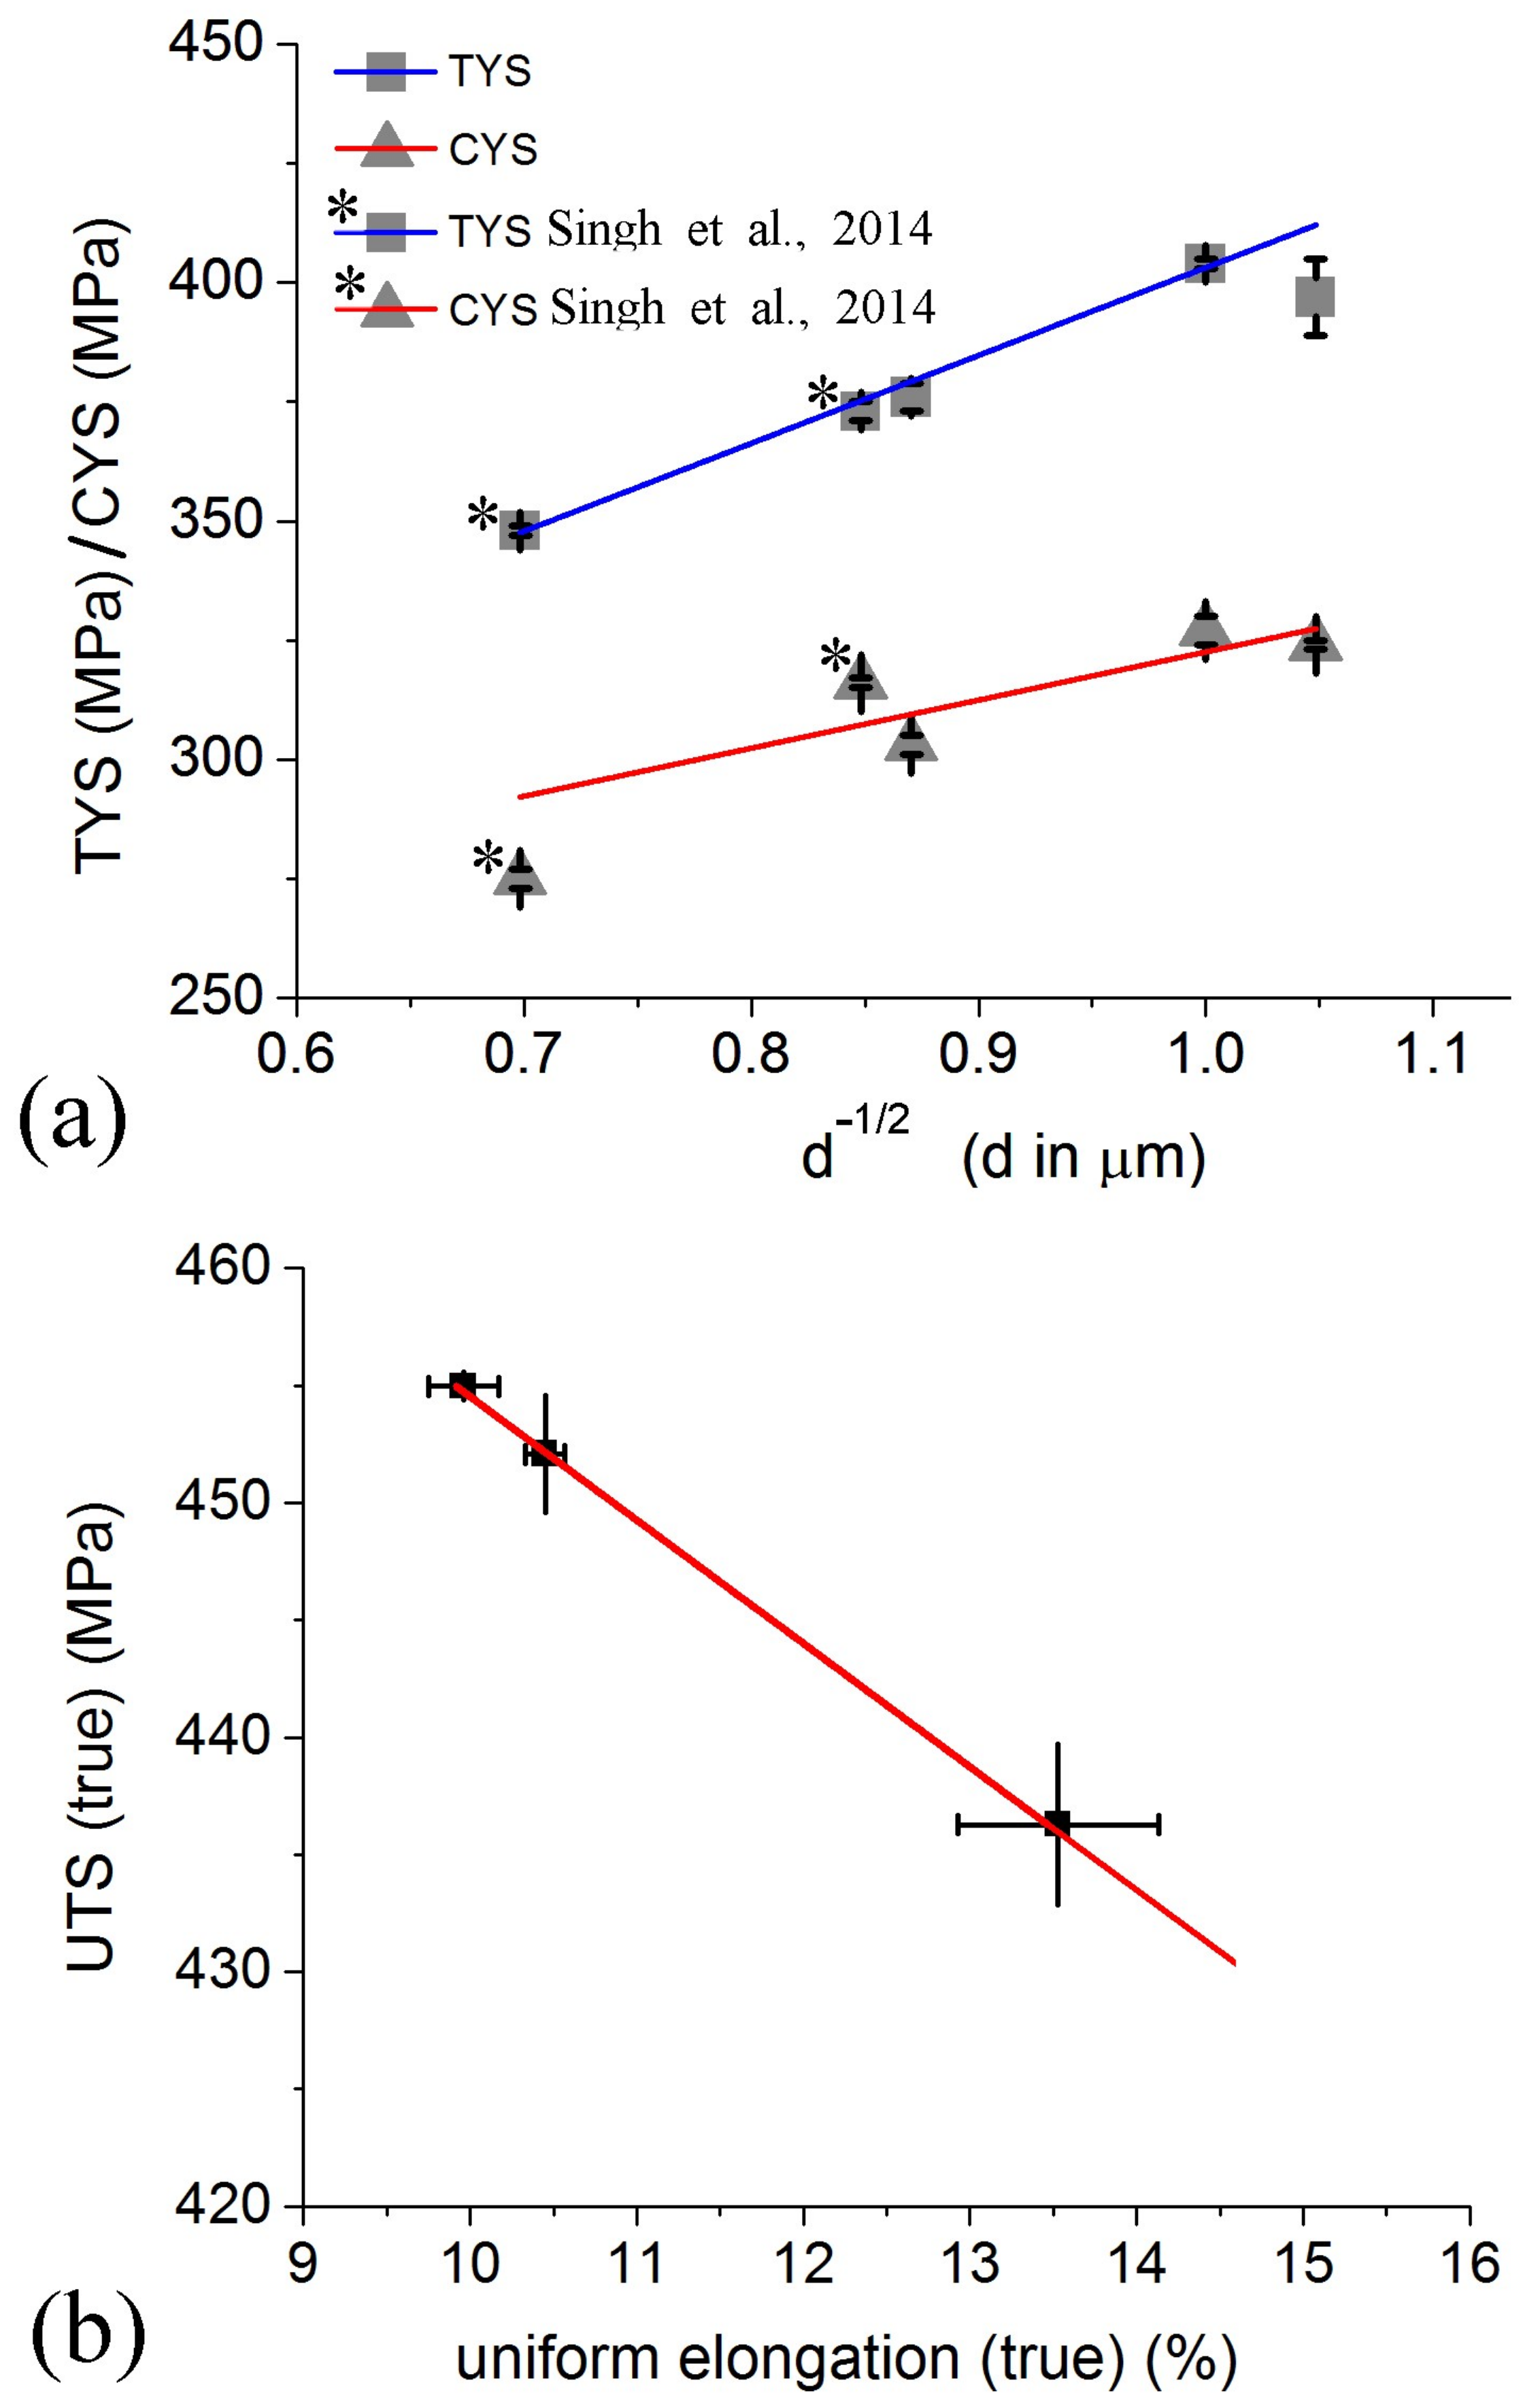
In this study the extrusion process was attempted at a low temperature of about 250 C in order to get very fine grain size. The extrusion temperatures recorded are the temperatures at which the extrusions occurred under the actual experimental conditions. The differences in the extrusion temperatures are the likely cause of the differences in the average grain sizes, even if small. The difference in grain sizes influenced the mechanical properties, as observed in Table 2. From this data, Hall-Petch plots were made for tension and compression yield strengths, shown in Figure 13a. Included in this plot are two points from chill-cast and extruded Mg-3.0Zn-0.5Y alloy extruded at 250 and 300 C from Singh et al. [19] (the data for extrusion at 350 C was not considered because above 300 C, the distribution of the solutes, mainly zinc, could be different with respect to the precipitation state, influencing the strength). It is observed in Figure 13a that the plotted points lie reasonably well on a linear relationship in tension (intercept = 218.74 ± 6.05 and slope k = 184.50 ± 7.01) or compression ( = 221.64 ± 37.66, k = 100.89 ± 40.65). The small deviations from the plot are likely to be due to sampling for grain size measurements. More importantly, it should be considered that the samples were not uniformly recrystallized everywhere, and that there were large regions where recrystallization had not occurred. The slopes of the plots for tension and compression are different, diverging towards the fine grain size. It has been proposed that these plot for wrought magnesium alloys should converge towards the finer grain size, because twinning (predominant in compression) is more sensitive to grain size than slip, and that texture formed by wrought processing is weaker in fine grained alloys than in coarse grained [17]. However, since the Mg-3.0Zn-0.5Y alloy was not fully recrystallized after extrusion, this condition is changed [19]. The unrecrystallized regions of the alloy, which contain lattice strain in form of dislocations and subgrain/low angle boundaries, offer resistance to further slip but almost none to twinning [18,19,21]. Since twinning is associated with compression, the compression will become easier and the slope of the Hall-Petch plot in compression lower (extrusions at lower temperates are likely to have larger unrecrystallized regions; in other words, finer grained alloys are associated with larger regions of unrecrystallized grains).
The grain size obtained by the extrusion of a particular (composition) alloy at a certain temperature determines the strength, and also the associated ductility. This becomes clear by especially looking at the tensile test values of the water-cooled mold cast extrusion in Table 2. Relationships between various parameters have been determined by Raeisinia et al. [35]. Following their work, ultimate tensile strength (UTS) is plotted against uniform elongation in Figure 13b. These values are from true stress—true strain data (engineering stress-strain plots also gave similar relationship). It can be observed that the points fall perfectly on a linear plot (intercept 96.38 ± 3.95 and slope −0.19 ± 0.01). Thus all the alloys possesed the same combination of strength and ductility, irrespective of the casting method and the extrusion temperature, and therefore are expected to exhibit same levels of high toughness.
5. Conclusions
Three different types of mold (chill cast, conventional steel and water-cooled) were used to cast a Mg-3.0Zn-0.5Y (at. %) alloy, and all the alloys were extruded at a temperature close to 250 C at an extrusion ratio of 25:1, into rods of 8 mm diameter. Each of the casting methods had a cooling efficiency in some way and therefore produced castings with -matrix supersaturated in zinc. This supersaturation resulted in a very fine precipitation during extrusion. Thus each extruded alloy had a very fine microstructure with about 1 m grain size, and very high mechanical properties with tensile yield strengths of about 400 MPa and compression yield strengths of over 300 MPa. It is thus concluded that the type of casting mold is not critical for high strength extrusions.
Author Contributions
All authors are senior scientists and worked in consultation with each other. The authors are listed in order of importance of their contribution.
Acknowledgments
The authors are grateful to the Boeing Company for funding this research and D.S. Shih for useful discussions. Authors are also grateful to Yoshitaka Matsushita for synchrotron radiation experiment.
Conflicts of Interest
The authors declare no conflict of interest.
References
- Armstrong, R.; Codd, I.; Douthwaite, M.; Petch, N.J. The plastic deformation of polycrystalline aggregates. Philos. Mag. 1962, 7, 45–58. [Google Scholar] [CrossRef]
- Lebrun, N.; Stamou, A.; Baetzner, C.; Robinson, J. Magnesium-Yttrium-Zinc. In Ternary Phase Diagrams; Petzow, G., Effenberg, E., Eds.; VCH: Vancouver, BC, Canada, 1988; pp. 702–710. [Google Scholar]
- Tsai, A.P.; Murakami, Y.; Niikura, A. The Zn-Mg-Y phase diagram involving quasicrystals. Philos. Mag. A 2000, 80, 1043–1054. [Google Scholar] [CrossRef]
- Kawamura, Y.; Hayashi, K.; Inoue, A.; Masumoto, T. Rapidly solidified powder metallurgy Mg97Zn1Y 2 alloys with excellent tensile yield strength above 600 MPa. Mater. Trans. 2001, 42, 1172–1176. [Google Scholar] [CrossRef]
- Yamasaki, M.; Anan, T.; Yoshimoto, S.; Kawamura, Y. Mechanical properties of warm-extruded Mg–Zn–Gd alloy with coherent 14H long periodic stacking ordered structure precipitate. Scr. Mater. 2005, 53, 799–803. [Google Scholar] [CrossRef]
- Yamasaki, M.; Hashimoto, K.; Hagihara, K.; Kawamura, Y. Effect of multimodal microstructure evolution on mechanical properties of Mg–Zn–Y extruded alloy. Acta Mater. 2011, 59, 3646–3658. [Google Scholar] [CrossRef]
- Bae, D.H.; Kim, S.H.; Kim, D.H.; Kim, W.T. Deformation behavior of Mg–Zn–Y alloys reinforced by icosahedral quasicrystalline particles. Acta Mater. 2002, 50, 2343–2356. [Google Scholar] [CrossRef]
- Bae, D.H.; Lee, M.H.; Kim, K.T.; Kim, W.T.; Kim, D.H. Application of quasicrystalline particles as a strengthening phase in Mg–Zn–Y alloys. J. Alloys Compd. 2002, 342, 445–450. [Google Scholar] [CrossRef]
- Singh, A.; Nakamura, M.; Watanabe, M.; Kato, A.; Tsai, A.P. strengthened Mg–Zn–Y alloys by extrusion. Scr. Mater. 2003, 49, 417–422. [Google Scholar] [CrossRef]
- Taniuchi, H.; Watanabe, H.; Okumura, H.; Kamado, S.; Kojima, Y.; Kawamura, Y. Microstructures and Tensile Properties of Mg-Zn-Y Alloys Containing Quasicrystals. Mater. Sci. Forum 2003, 419–422, 255–260. [Google Scholar] [CrossRef]
- Singh, A.; Watanabe, M.; Kato, A.; Tsai, A.P. Microstructure and strength of quasicrystal containing extruded Mg–Zn–Y alloys for elevated temperature application. Mater. Sci. Eng. A 2004, 385, 382–396. [Google Scholar] [CrossRef]
- Zhang, Y.; Zeng, X.; Liu, L.; Lu, C.; Zhou, H.; Li, Q.; Zhu, Y. Effects of yttrium on microstructure and mechanical properties of hot-extruded Mg–Zn–Y–Zr alloys. Mater. Sci. Eng. A 2004, 373, 320–327. [Google Scholar] [CrossRef]
- Zheng, M.Y.; Qiao, X.G.; Xu, S.W.; Wu, K.; Kamado, S.; Kojima, Y. In-situ quasicrystal-reinforced magnesium matrix composite processed by equal channel angular extrusion (ECAE). J. Mater. Sci. 2005, 40, 2587–2590. [Google Scholar] [CrossRef]
- Singh, A.; Somekawa, H.; Mukai, T. Compressive strength and yield asymmetry in extruded Mg–Zn–Ho alloys containing quasicrystal phase. Scr. Mater. 2007, 56, 935–938. [Google Scholar] [CrossRef]
- Muller, A.; Garces, G.; Perez, P.; Adeva, P. Grain refinement of Mg–Zn–Y alloy reinforced by an icosahedral quasicrystalline phase by severe hot rolling. J. Alloys Compd. 2007, 443, L1–L5. [Google Scholar] [CrossRef]
- Mora, E.; Garces, G.; Onorbe, E.; Perez, P.; Adeva, P. High-strength Mg–Zn–Y alloys produced by powder metallurgy. Scr. Mater. 2009, 60, 776–779. [Google Scholar] [CrossRef]
- Singh, A.; Osawa, Y.; Somekawa, H.; Mukai, T. Ultra-fine grain size and isotropic very high strength by direct extrusion of chill-cast Mg–Zn–Y alloys containing quasicrystal phase. Scr. Mater. 2011, 64, 661–664. [Google Scholar] [CrossRef]
- Singh, A.; Osawa, Y.; Somekawa, H.; Mukai, T.; Parrish, C.J.; Shih, D.S. Development of Very High Strength and Ductile Dilute Magnesium Alloys by Dispersion of Quasicrystal Phase. Metall. Mater. Trans. A 2014, 45A, 3232–3240. [Google Scholar] [CrossRef]
- Singh, A.; Osawa, Y.; Somekawa, H.; Mukai, T. Effect of microstructure on strength and ductility of high strength quasicrystal phase dispersed Mg–Zn–Y alloys. Mater. Sci. Eng. 2014, A611, 242–251. [Google Scholar] [CrossRef]
- Singh, A. Tailoring microstructure of Mg–Zn–Y alloys with quasicrystal and related phases for high mechanical strength. Sci. Technol. Adv. Mater. 2014, 15, 04480. [Google Scholar] [CrossRef] [PubMed]
- Singh, A.; Osawa, Y.; Somekawa, H.; Mukai, T.; Parrish, C.J.; Shih, D.S. Effect of alloy composition on microstructure and strength of fine grained extruded Mg-Zn-Y alloys containing quasicrystal phase. In Magnesium Technology; Manuel, M.V., Singh, A., Alderman, M., Neelameggham, N.R., Eds.; TMS: Warrendale, PA, USA, 2015; pp. 215–220. [Google Scholar]
- Kwak, T.Y.; Kim, W.J. The effect of volume fraction and dispersion of icosahedral phase particles on the strength and work hardening of Mg–Zn–Y alloys. Mater. Sci. Eng. A 2017, 684, 284–291. [Google Scholar] [CrossRef]
- Somekawa, H.; Singh, A.; Mukai, T. High fracture toughness of extruded Mg–Zn–Y alloy by the synergistic effect of grain refinement and dispersion of quasicrystalline phase. Scr. Mater. 2007, 56, 1091–1094. [Google Scholar] [CrossRef]
- Somekawa, H.; Singh, A.; Osawa, Y.; Mukai, T. High Strength and Fracture Toughness Balances in Extruded Mg–Zn–RE Alloys by Dispersion of Quasicrystalline Phase Particles. Mater. Trans. 2008, 49, 1947–1952. [Google Scholar] [CrossRef]
- Somekawa, H.; Singh, A.; Mukai, T. Superplastic Behavior in Mg–Zn–Y Alloy with Dispersed Quasicrystal Phase Particles. Adv. Eng. Mater. 2009, 11, 782–787. [Google Scholar] [CrossRef]
- Xu, D.K.; Liu, L.; Xu, Y.B.; Han, E.H. The fatigue behavior of I-phase containing as-cast Mg–Zn–Y–Zr alloy. Acta Mater. 2008, 56, 985–994. [Google Scholar] [CrossRef]
- Ma, R.; Dong, X.; Chen, S.; Pan, Z.; Ling, H.J.; Fan, Z. Effect of quasicrystal phase on mechanical properties and damping capacities of Mg–Zn–Y–Zr alloys. Mater. Sci. Eng. A 2013, 587, 328–335. [Google Scholar] [CrossRef]
- Zhang, L.; Zhou, W.; Hu, P.H.; Zhou, Q. Microstructural characteristics and mechanical properties of Mg–Zn–Y alloy containing icosahedral quasicrystals phase treated by pulsed magnetic field. J. Alloys Compd. 2016, 688, 868–874. [Google Scholar] [CrossRef]
- Fang, X.G.; Wu, S.; Lü, S.; Wang, J.; Yang, X. Microstructure evolution and mechanical properties of quasicrystal-reinforced Mg–Zn–Y alloy subjected to ultrasonic vibration. Mater. Sci. Eng. A 2017, 679, 372–378. [Google Scholar] [CrossRef]
- Kwak, T.Y.; Lim, H.K.; Kim, W.J. Hot compression characteristics and processing maps of a cast Mg–9.5Zn–2.0Y alloy with icosahedral quasicrystalline phase. J. Alloys Compd. 2015, 644, 645–653. [Google Scholar] [CrossRef]
- Kwak, T.Y.; Lim, H.K.; Kim, W.J. Effect of the volume fraction of the icosahedral phase on the microstructures, hot compressive behaviors and processing maps of Mg–Zn–Y alloys. J. Alloys Compd. 2017, 725, 711–723. [Google Scholar] [CrossRef]
- Thompson, A.W. Calculation of True Volume Grain Diameter. Metallography 1972, 5, 366–369. [Google Scholar] [CrossRef]
- Agnew, S.R.; Tome, C.N.; Brown, D.W.; Holden, T.M.; Vogel, S.C. Study of slip mechanisms in a magnesium alloy by neutron diffraction and modeling. Scr. Mater. 2003, 48, 1003–1008. [Google Scholar] [CrossRef]
- Singh, A.; Basha, D.A.; Somekawa, H.; Tsuchiya, K. Nucleation of recrystallized magnesium grains over quasicrystalline phase during severe plastic deformation of a Mg–Zn–Y alloy at room temperature. Scr. Mater. 2017, 134, 80–84. [Google Scholar] [CrossRef]
- Raeisinia, B.; Sinclair, C.W.; Poole, W.J.; Tome, C.N. On the impact of grain size distribution on the plastic behaviour of polycrystalline metals. Model. Simul. Mater. Sci. Eng. 2008, 16, 025001. [Google Scholar] [CrossRef]
Figure 1.
Appearance of the (a) chill cast, (b) conventional cast and (c) water-cooled molds, and (d) the location of thermocouples.
Figure 1.
Appearance of the (a) chill cast, (b) conventional cast and (c) water-cooled molds, and (d) the location of thermocouples.

Figure 2.
Plots showing cooling rates during solidification in chill casting, conventional and water-cooled mold, at (a) the wall, (b) center and (c) bottom of the mold.
Figure 2.
Plots showing cooling rates during solidification in chill casting, conventional and water-cooled mold, at (a) the wall, (b) center and (c) bottom of the mold.

Figure 3.
Solidification microstructure at the center of the casting, observed by SEM, for (a,b) Chill, (c,d) Conventional and (e,f) Water-cooled castings. (b,d,f) are higher magnification micrographs of (a,c,e), respectively.
Figure 3.
Solidification microstructure at the center of the casting, observed by SEM, for (a,b) Chill, (c,d) Conventional and (e,f) Water-cooled castings. (b,d,f) are higher magnification micrographs of (a,c,e), respectively.

Figure 4.
Solidification microstructure near the wall of the casting (100 cm up from the bottom), observed by SEM, for (a,b) Chill, (c,d) Conventional and (e,f) Water-cooled castings. (b,d,f) are higher magnification micrographs of (a, c, e), respectively.
Figure 4.
Solidification microstructure near the wall of the casting (100 cm up from the bottom), observed by SEM, for (a,b) Chill, (c,d) Conventional and (e,f) Water-cooled castings. (b,d,f) are higher magnification micrographs of (a, c, e), respectively.

Figure 5.
(a) A backscattered SEM image showing the dendritic structure in chill-cast alloy. The EDS elemental maps of an area marked by a rectangle in (a): (b) Mg-K, (c) Zn-K and (d) Y-L show the interdendritic phase to be a ternary.
Figure 5.
(a) A backscattered SEM image showing the dendritic structure in chill-cast alloy. The EDS elemental maps of an area marked by a rectangle in (a): (b) Mg-K, (c) Zn-K and (d) Y-L show the interdendritic phase to be a ternary.

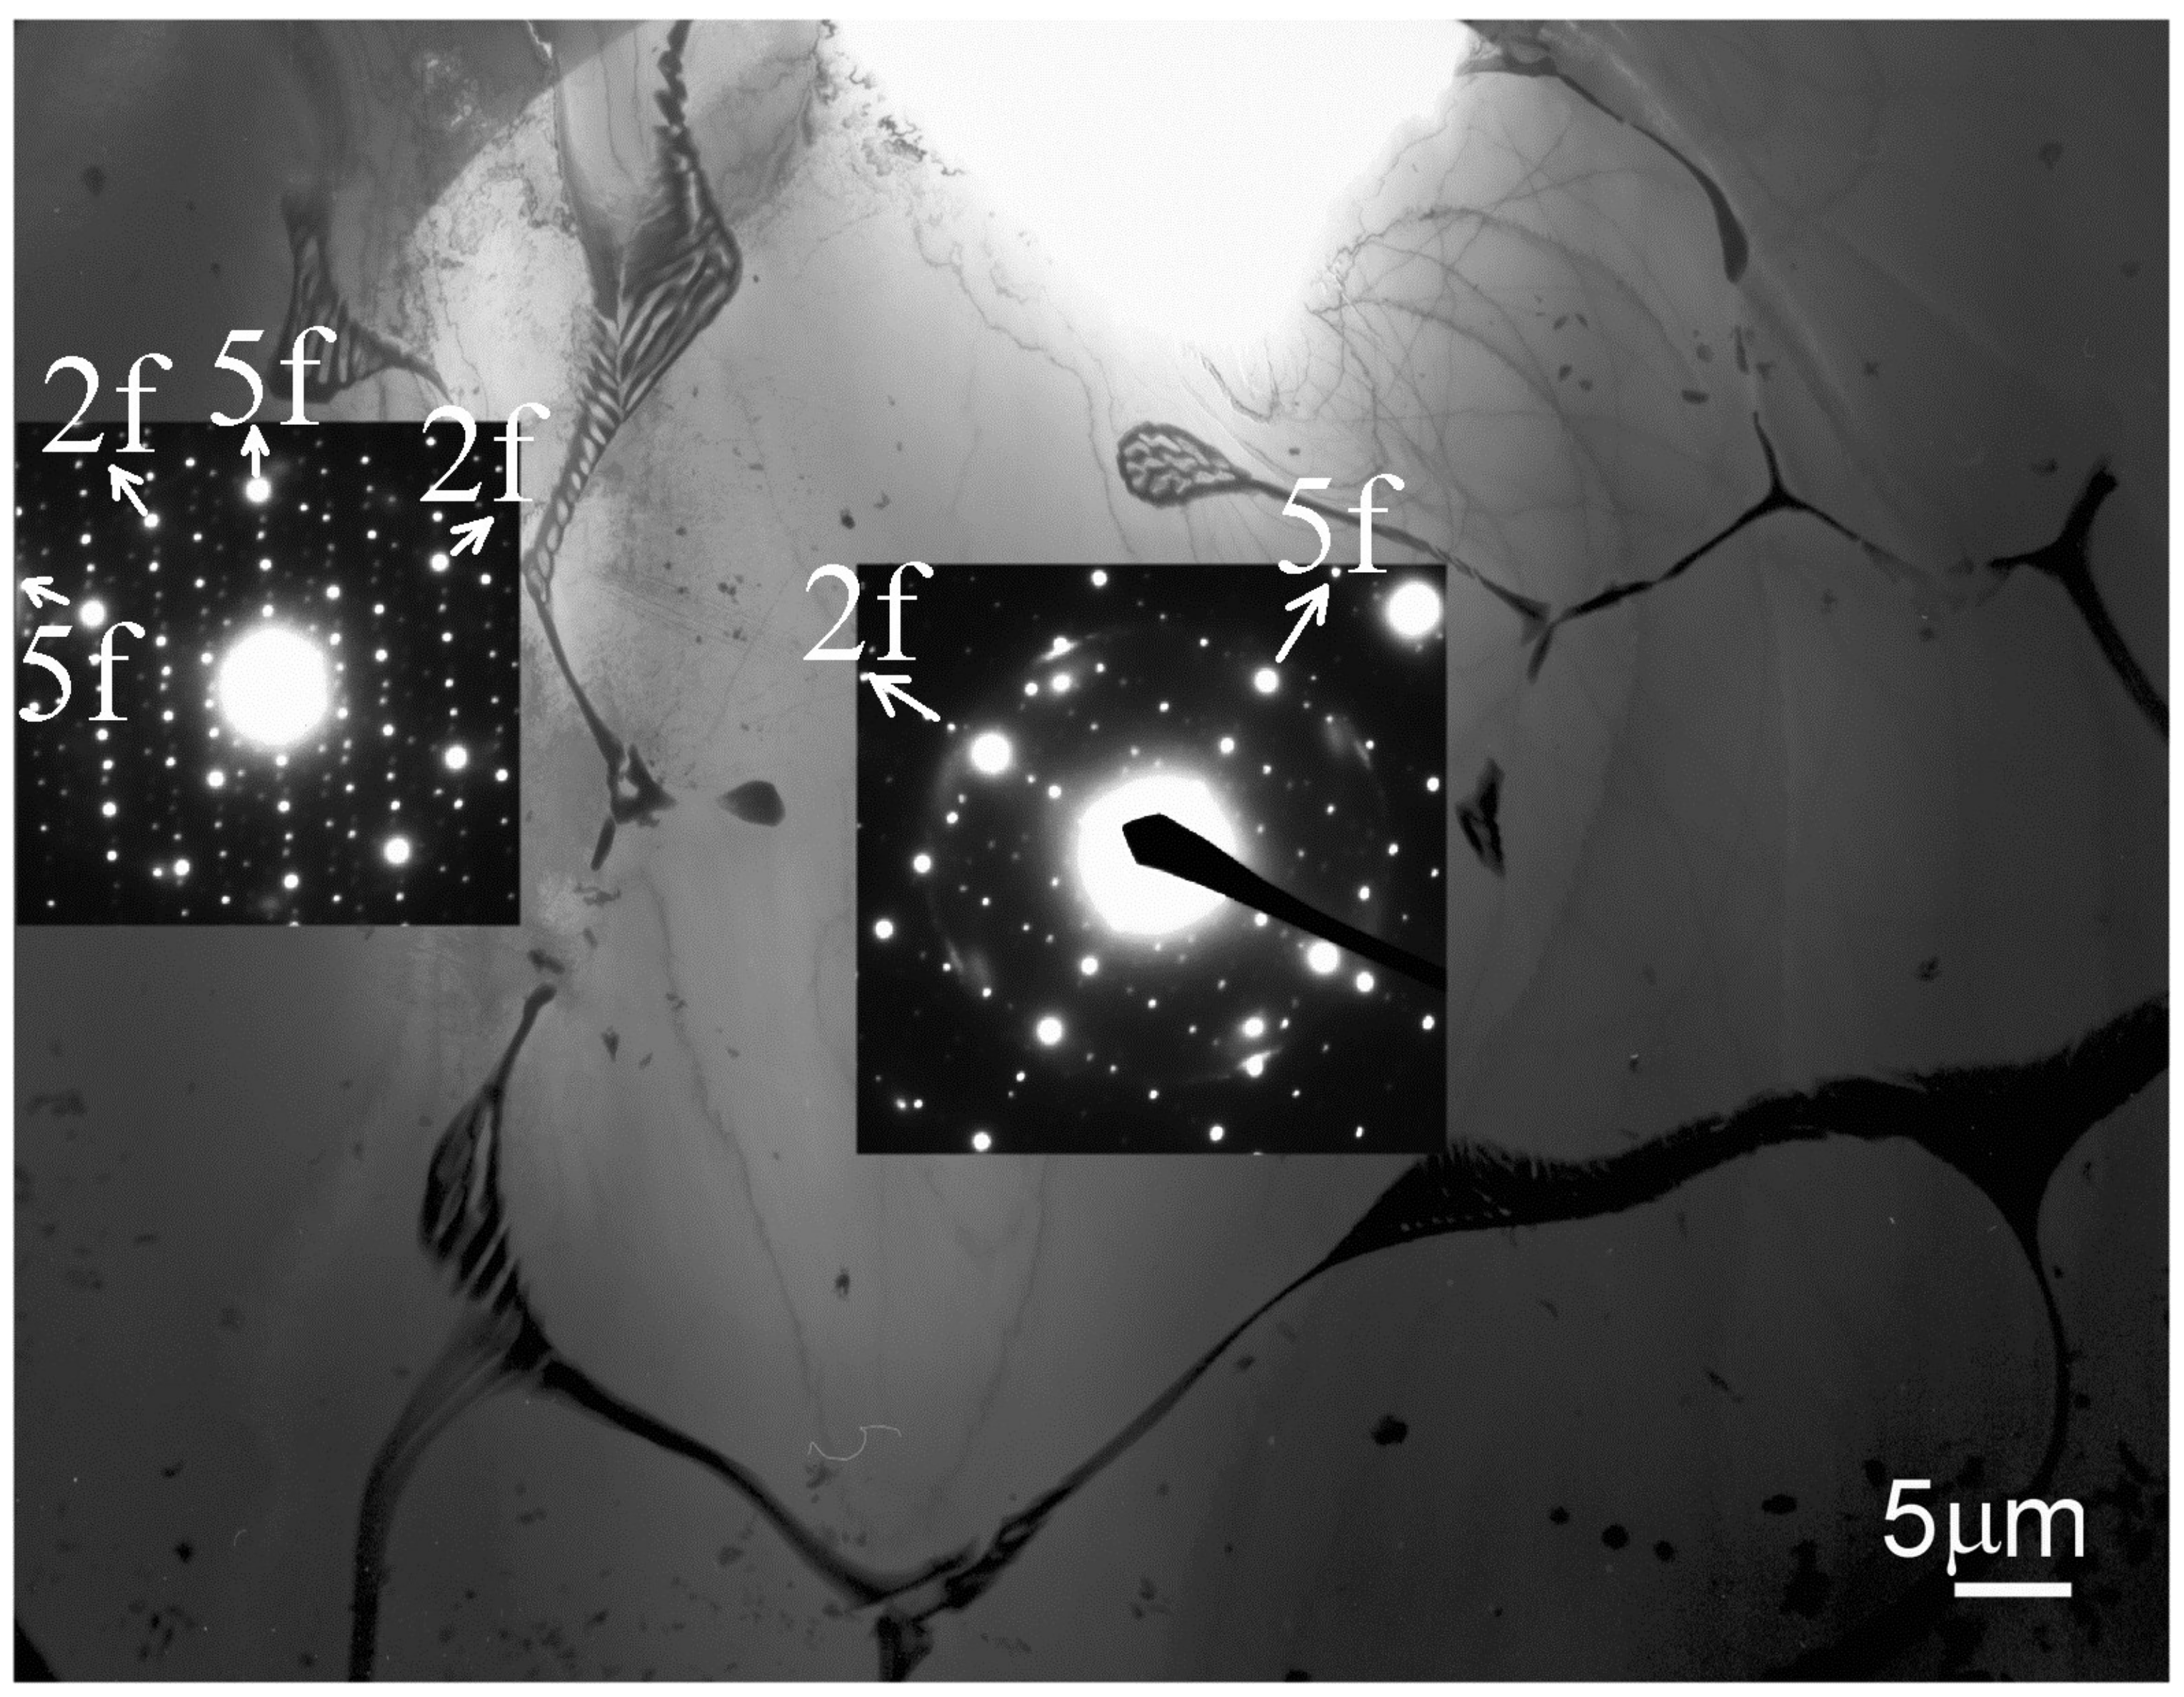
Figure 6.
A TEM micrograph from the chill cast alloy showing eutectic phase in interdendritic spaces. The eutectic phase is identified to be i-phase by electron diffraction patterns inset. 2f and 5f represent twofold and fivefold symmetry reciprocal directions.
Figure 6.
A TEM micrograph from the chill cast alloy showing eutectic phase in interdendritic spaces. The eutectic phase is identified to be i-phase by electron diffraction patterns inset. 2f and 5f represent twofold and fivefold symmetry reciprocal directions.

Figure 7.
Backscattered electron SEM micrographs from the center of the castings of (a) chill cast and (b) conventional molds. EDS line scan were made along the horizontal line drawn (arrowheads show the ternary phase on the line). The concentration profiles of Mg, Zn and Y along the line are plotted below each micrograph. Arrows indicate local zinc concentrations.

Figure 8.
A backscattered SEM image from a sample near the wall of the water-cooled casting. The compositions at points indicated in the image are given in the accompanying table.
Figure 8.
A backscattered SEM image from a sample near the wall of the water-cooled casting. The compositions at points indicated in the image are given in the accompanying table.

| Point | Concentration (at%) | |||
| Mg | Zn | Y | Phase | |
| 1 | 79.53 | 19.14 | 1.33 | Mg-Zn |
| 2 | 62.37 | 33.14 | 4.5 | iQC |
| 3 | 51.64 | 38.23 | 19.13 | iQC |
| 4 | 97.09 | 2.73 | 0.18 | SS matrix |
| 5 | 97.93 | 1.84 | 0.23 | matrix |
| 6 | 97.70 | 2.04 | 0.26 | SS matrix |
| 7 | 97.99 | 1.81 | 0.2 | matrix |
| 8 | 92.83 | 7.01 | 0.16 | Mg-Zn |
| 9 | 97.24 | 2.54 | 0.21 | SS matrix |
| 10 | 96.97 | 2.83 | 0.2 | SS matrix |
| 11 | 97.89 | 1.92 | 0.18 | matrix |
Figure 9.
Synchrotron X-ray diffraction patterns of the extruded rods after extrusion of chill cast and water-cooled mold castings. Three digit indices are for -Mg planes and six digits for the icosahedral phase (twofold and fivefold symmetry planes are marked 2f and 5f, respectively).
Figure 9.
Synchrotron X-ray diffraction patterns of the extruded rods after extrusion of chill cast and water-cooled mold castings. Three digit indices are for -Mg planes and six digits for the icosahedral phase (twofold and fivefold symmetry planes are marked 2f and 5f, respectively).

Figure 10.
SEM images of (a,c) chill cast and (b,d) water-cooled cast alloy after extrusion. The extrusion direction is vertical in these micrographs. The relatively low magnification micrographs of (a,b) show the overall distribution of icosahedral phase particles, while the higher magnification micrographs of (c,d) show that locally the size and distribution of the particles is varied.

Figure 11.
TEM micrographs showing microstructure of the (a,b) conventionally cast and (c) water-cooled cast alloy after extrusion. Dark phase is the i-phase. Very fine precipitate (as seen in (b)) are observed in all extruded alloys.
Figure 11.
TEM micrographs showing microstructure of the (a,b) conventionally cast and (c) water-cooled cast alloy after extrusion. Dark phase is the i-phase. Very fine precipitate (as seen in (b)) are observed in all extruded alloys.

Figure 12.
Engineering stress-strain plots for tensile and compression tests on extruded rods made from chill cast, conventional and water-cooled mold castings.
Figure 12.
Engineering stress-strain plots for tensile and compression tests on extruded rods made from chill cast, conventional and water-cooled mold castings.

Figure 13.
Plots of (a) tensile and compression yield stresses (TYS and CYS, respectively) against d, where d is average grain size in m (i.e., the Hall-Petch plots) and (b) ultimate tensile strengths (UTS) against uniform elongation (from true stress-true strain data). Two data points in (a), marked by asterix, are taken from [19] for a chill cast alloy of same composition Mg-3.0Zn-0.5Y in at%, extruded at 250 and 300 C.


Table 1.
Dimensions of the molds used.
| Mold Type | Dimensions (mm) | ||||
|---|---|---|---|---|---|
| Inside | Outer | ||||
| Diameter | Height | Length | Breadth | Height | |
| Chill cast | 46 | 200 | 210 | 210 | 250 |
| Conventional | 46 | 235 | 100 | 120 | 270 |
| Water cooled | 50–55 | 200 | - | - | - |
Table 2.
Extrusion temperature, grain size, yield strength, ultimate tensile strength (UTS) and elongation to failure in tension and compression, and the yield symmetry ratio corresponding to each casting method.
Table 2.
Extrusion temperature, grain size, yield strength, ultimate tensile strength (UTS) and elongation to failure in tension and compression, and the yield symmetry ratio corresponding to each casting method.
| Casting Method | Extrusion Temperature (C) | Grain Size m | Yield Strength (MPa) | Elongation | Yield Asymmetry Ratio | ||
|---|---|---|---|---|---|---|---|
| Tensile (UTS) | Compression | Tensile | Compression | ||||
| Chill cast | 235 | 1.00 ± 0.18 | 404 ± 1 | 327 ± 3 | 12.3 ± 0.7 | 13.1 ± 0.3 | 0.81 |
| (418 ± 0) | |||||||
| Conventional | 240 | 0.91 ± 0.20 | 397 ± 8 | 324 ± 1 | 13.0 ± 0.1 | 12.5 ± 0.2 | 0.82 |
| (415 ± 2) | |||||||
| Water cooled | 266 | 1.32 ± 0.22 | 376 ± 3 | 303 ± 2 | 16.7 ± 1.2 | 13.7 ± 0.2 | 0.82 |
| (391 ± 1) | |||||||
© 2018 by the authors. Licensee MDPI, Basel, Switzerland. This article is an open access article distributed under the terms and conditions of the Creative Commons Attribution (CC BY) license (http://creativecommons.org/licenses/by/4.0/).
Share and Cite
MDPI and ACS Style
Singh, A.; Osawa, Y.; Somekawa, H.; Mukai, T. Effect of Solidification Cooling Rate on Microstructure and Mechanical Properties of an Extruded Mg-Zn-Y Alloy. Metals 2018, 8, 337. https://doi.org/10.3390/met8050337
AMA Style
Singh A, Osawa Y, Somekawa H, Mukai T. Effect of Solidification Cooling Rate on Microstructure and Mechanical Properties of an Extruded Mg-Zn-Y Alloy. Metals. 2018; 8(5):337. https://doi.org/10.3390/met8050337
Chicago/Turabian StyleSingh, Alok, Yoshiaki Osawa, Hidetoshi Somekawa, and Toshiji Mukai. 2018. "Effect of Solidification Cooling Rate on Microstructure and Mechanical Properties of an Extruded Mg-Zn-Y Alloy" Metals 8, no. 5: 337. https://doi.org/10.3390/met8050337
Note that from the first issue of 2016, this journal uses article numbers instead of page numbers. See further details here.