Article

Effect of Dynamic Reheating Controlled by the Weaving Width on the Microstructure of GTA Bead-On-Pipe Weld Metal of 25% Cr Super Duplex Stainless Steel

1
Department of Hybrid Materials & Machining Technology, Graduate School of Convergence Science, Pusan National University, Busan 46241, Korea
2
Material Science and Engineering Department, Pusan National University, Busandaehak-ro 63 beon-gil, Heumjeong-gu, Busan 46241, Korea
*
Authors to whom correspondence should be addressed.
Metals 2018, 8(5), 312; https://doi.org/10.3390/met8050312
Submission received: 10 March 2018 / Revised: 15 April 2018 / Accepted: 26 April 2018 / Published: 1 May 2018

Abstract

:
Gas tungsten arc welding (GTAW) with three different heat inputs controlled by the weaving width was performed to understand their effects on the microstructural changes during bead-on-pipe welding of super duplex stainless steel. The microstructure of the weld metals was categorized into three different types of zones: non-reheated, reheated type, and reheating-free zone. Even though single-pass welding with different weaving widths was employed, a reheated microstructure was detected, which has been previously observed with multiple pass welding. This phenomenon was called “dynamic reheating”, because it was produced by the weaving operation during welding regardless of the weaving width. The categorized area fraction varied with the weaving width change. Electron backscatter diffraction (EBSD) results at the edge (the area near the fusion line) of the low-heat-input condition indicated a higher austenite volume fraction and a lower Cr2N fraction than that of the medium heat input condition. Thus, it described an inverse relationship, because higher heat input provided a lower austenite fraction. In addition, it was observed clearly that the austenite fraction at the medium heat input condition was dramatically increased by reheating, while the Cr2N fraction was reduced. Regardless of the weaving width, reheating contributed to the increase of the austenite fraction, further reducing the Cr2N quantity. The edge areas in the map showed an inverse relationship in the reheated area fraction between low heat input and medium heat input. For this reason, the austenite fraction on the weld metal was determined not only by the heat input, but also by the amount of reheating.

Graphical Abstract

1. Introduction

Since its introduction, super duplex stainless steel (SDSS) has been widely used as a material for aggressive corrosion environments, such as process piping of offshore topside structures and in chemical industries [1,2,3,4,5,6]. However, it has been reported that abnormally heat-treated SDSS exhibits severe deleterious corrosion resistance. Many researchers have focused their studies on the changes of the microstructure of the material when it is being thermally treated, such as through welding or heat treatment, utilizing simulation programs and isothermal heat treatments [7,8,9,10,11]. They have presented the importance of precipitates and the secondary austenite phase after thermal treatment on the mechanical and corrosion properties of SDSS. When SDSS is welded or heat-treated abnormally, many unfavorable phases are introduced and subjected to pitting initiation sites, creating chemically-inhomogeneous states across the phase, such as a depletion zone [12,13].
It was reported that a secondary austenite was transformed from both the growth of primary austenite and additional precipitation during heat treatment [14,15]. This secondary austenite contains different chemical compositions compared with those of the primary austenite, which lack major corrosion resistance elements. Therefore, the secondary austenite was pointed out as a pitting corrosion initiation site and should be avoided [3]. Verma et al. [8] recently reviewed all the viewpoints, such as welding, mechanical, and corrosive properties, dissimilar joints, and other future issues. Many researchers have reported the important role of Cr2N and secondary austenite on pitting corrosion resistance. Pettersson et al. [16] studied the CrN precipitation of UNS S32750 material with respect to cooling rate changes. Kim et al. and Zhang et al. reported Cr depletion zones across Cr2N boundaries [17,18]. Moreover, the quantity of Cr2N in high Mn DSS increased as the alloying content increased [19].
Heat simulation tests using duplex stainless steels have shown that the creation of secondary austenite is closely related with Cr2N dissolution. However, the research was not focused on the weld metal, but the Heat Affected Zone (HAZ) [12,13,20,21]. Liao studied the formation of Cr2N when duplex stainless steel was simulated thermally and reported that nitrides of high density precipitated in the interior of grains and away from the austenitic structures. Furthermore, the size of Cr2N precipitates tends to increase with the decrease in the cooling rate [22]. The observation of microstructural changes by heat treatment simulation with three kinds of welding consumables [23] and studies of the welding condition effects were conducted [24,25]. Nitrogen loss on multiple-pass weld metal without welding wire was conducted to understand the nitrogen behavior [26]. The nitrogen quantity decreased as the number of welding passes increased. Therefore, a high fraction of the ferrite phase in the final pass was detected. Studies of the multiple thermal cycle effects on the microstructure revealed that multiple reheating was found to promote precipitation of the sigma phase relatively more than slower cooling [27]. Additionally, the aging effect of super duplex stainless steel on sliding tribocorrosion in a chloride solution was studied and reported that isothermal heat treatment induced the growth of secondary phases, including the sigma phase, secondary austenite, and chi phase. It was revealed that pitting corrosion was preferentially associated with secondary austenite, and material loss calculated from the current transients during pitting was much greater than that measured through surface profiling of wear tracks [28].
The welds were prepared under non-equilibrium conditions due to the fact that welding processes involve rapid heating and cooling compared to isothermal heat treatment. Moreover, the bead underwent additional heating cycles provided during multiple pass welding and dynamical reheating caused by weaving during single-pass welding [29]. Many researchers have emphasized the importance of these additional heating effects [30,31,32]. However, there is no significant research on the actual welding cases.
As a characteristic of gas tungsten arc welding (GTAW), weaving is normally used to form a backing bead, eliminating additional back-side welding. However, this weaving technique induces the reheating phenomenon, which is typically presented during multiple-pass welding on the previous bead even during single-pass welding. Therefore, it introduces a variety of microstructural changes, as well as the effect of dynamic reheating of the single-pass weld metal [29]. However, the effect of the weaving width and heat input (HI) changes have not been reported yet.
In this study, the effect of dynamic reheating induced by changing the weaving width on the single bead-on-pipe (BOP) weld was investigated to determine the relationship between the weaving width, HI, austenite volume fraction, and the microstructural change in terms of phase distribution over the weld metal.

2. Materials and Methods

2.1. Materials

A UNS S32750 SDSS (Tubacex Tubos Inoxidables S.A., Amurrio, Spain) pipe of 168 mm outer diameter and 7.11 mm thickness was used as the base material, and a rod 2.4 mm in diameter (categorized as AWS 5.9 ER2594 (SANDVIK, Stockholm, Sweden)) was used as a welding wire for GTAW. Chemical compositions and mechanical properties of the pipe and the wire are shown in Table 1 and Table 2, respectively. Chemical composition analysis of the welding wire showed that it contained more nickel (approximately 3 wt. %) than the base material. The purpose of adding nickel to the welding wire was to enhance the austenite phase formation on the weld metal, which contained a low austenite fraction owing to rapid cooling during BOP welding. The major chemical elements of the base metal were Cr, 25.5 wt. %; Ni, 6.65 wt. %; and N, 0.26 wt. %. All PREN values were greater than 40, as shown in Table 1.

2.2. Welding Condition

As shown in Figure 1, manual GTAW with a 2.4 mm diameter EWTh-2 (tungsten-2% thoria) non-consumable electrode and 99.99% argon shielding gas with a 15 L/min flow rate were applied to the pipe material, using an ER2594 welding rod. Manual-type GTAW was the main welding process used to join the pipe, and a weaving technique was normally adopted to form a sound back bead of the pipe. The welding HI were controlled using different weaving widths to understand the effect of weaving width together with HI, which were 7.8 kJ/cm, 14.7 kJ/cm, and 32.0 kJ/cm, respectively. BOP single-pass welding was applied without back shielding. Welding current and voltage was maintained constantly as shown in Table 3 and welding speeds were varied by controlling the weaving width. Those conditions are specified as low, medium, and high heat input.

2.3. Macro-Micro Structural Analysis

The cross-section and the half-surface of the weld bead were polished, and then the overall bead appearance was investigated. The half-surface observation clearly showed the effect of weaving on the previous bead in terms of different welding conditions. The reason for the half-surface preparation was that the BOP specimen was curved, as it was a quarter section of the pipe. Therefore, the half-surface specimen was sufficient to obtain the overall bead appearance due to the fact that the bead was almost symmetrical in the center of the weld bead. The specimen was cut and mounted. Then, the surface was polished using SiC sandpaper and a mixture of 1 µm diamond with 0.04 µm silica. The electrolytic etching method was employed as per the ASTM E407 No. 96 (86 g NaOH + 50 mL water) solution at 6 V DC for 5–10 s to investigate the microstructural changes. Microstructural analysis was conducted using an Olympus (Tokyo, Japan) BX-51M on the edge and center regions, which showed different characteristics.

2.4. EBSD Investigation

The specimen was polished with several emery papers of different numbers and diamond paste (1 µm). It was then finalized with silicate (0.04 µm) for electron backscatter diffraction (EBSD) investigation. EBSD analysis was conducted in the edge area for each condition, in order to understand the phase distribution induced by different weaving widths. The observations were performed using a Carl Zeiss (Oberkochen, Germany) SUPRA45 field-emission scanning electron microscope.

3. Results

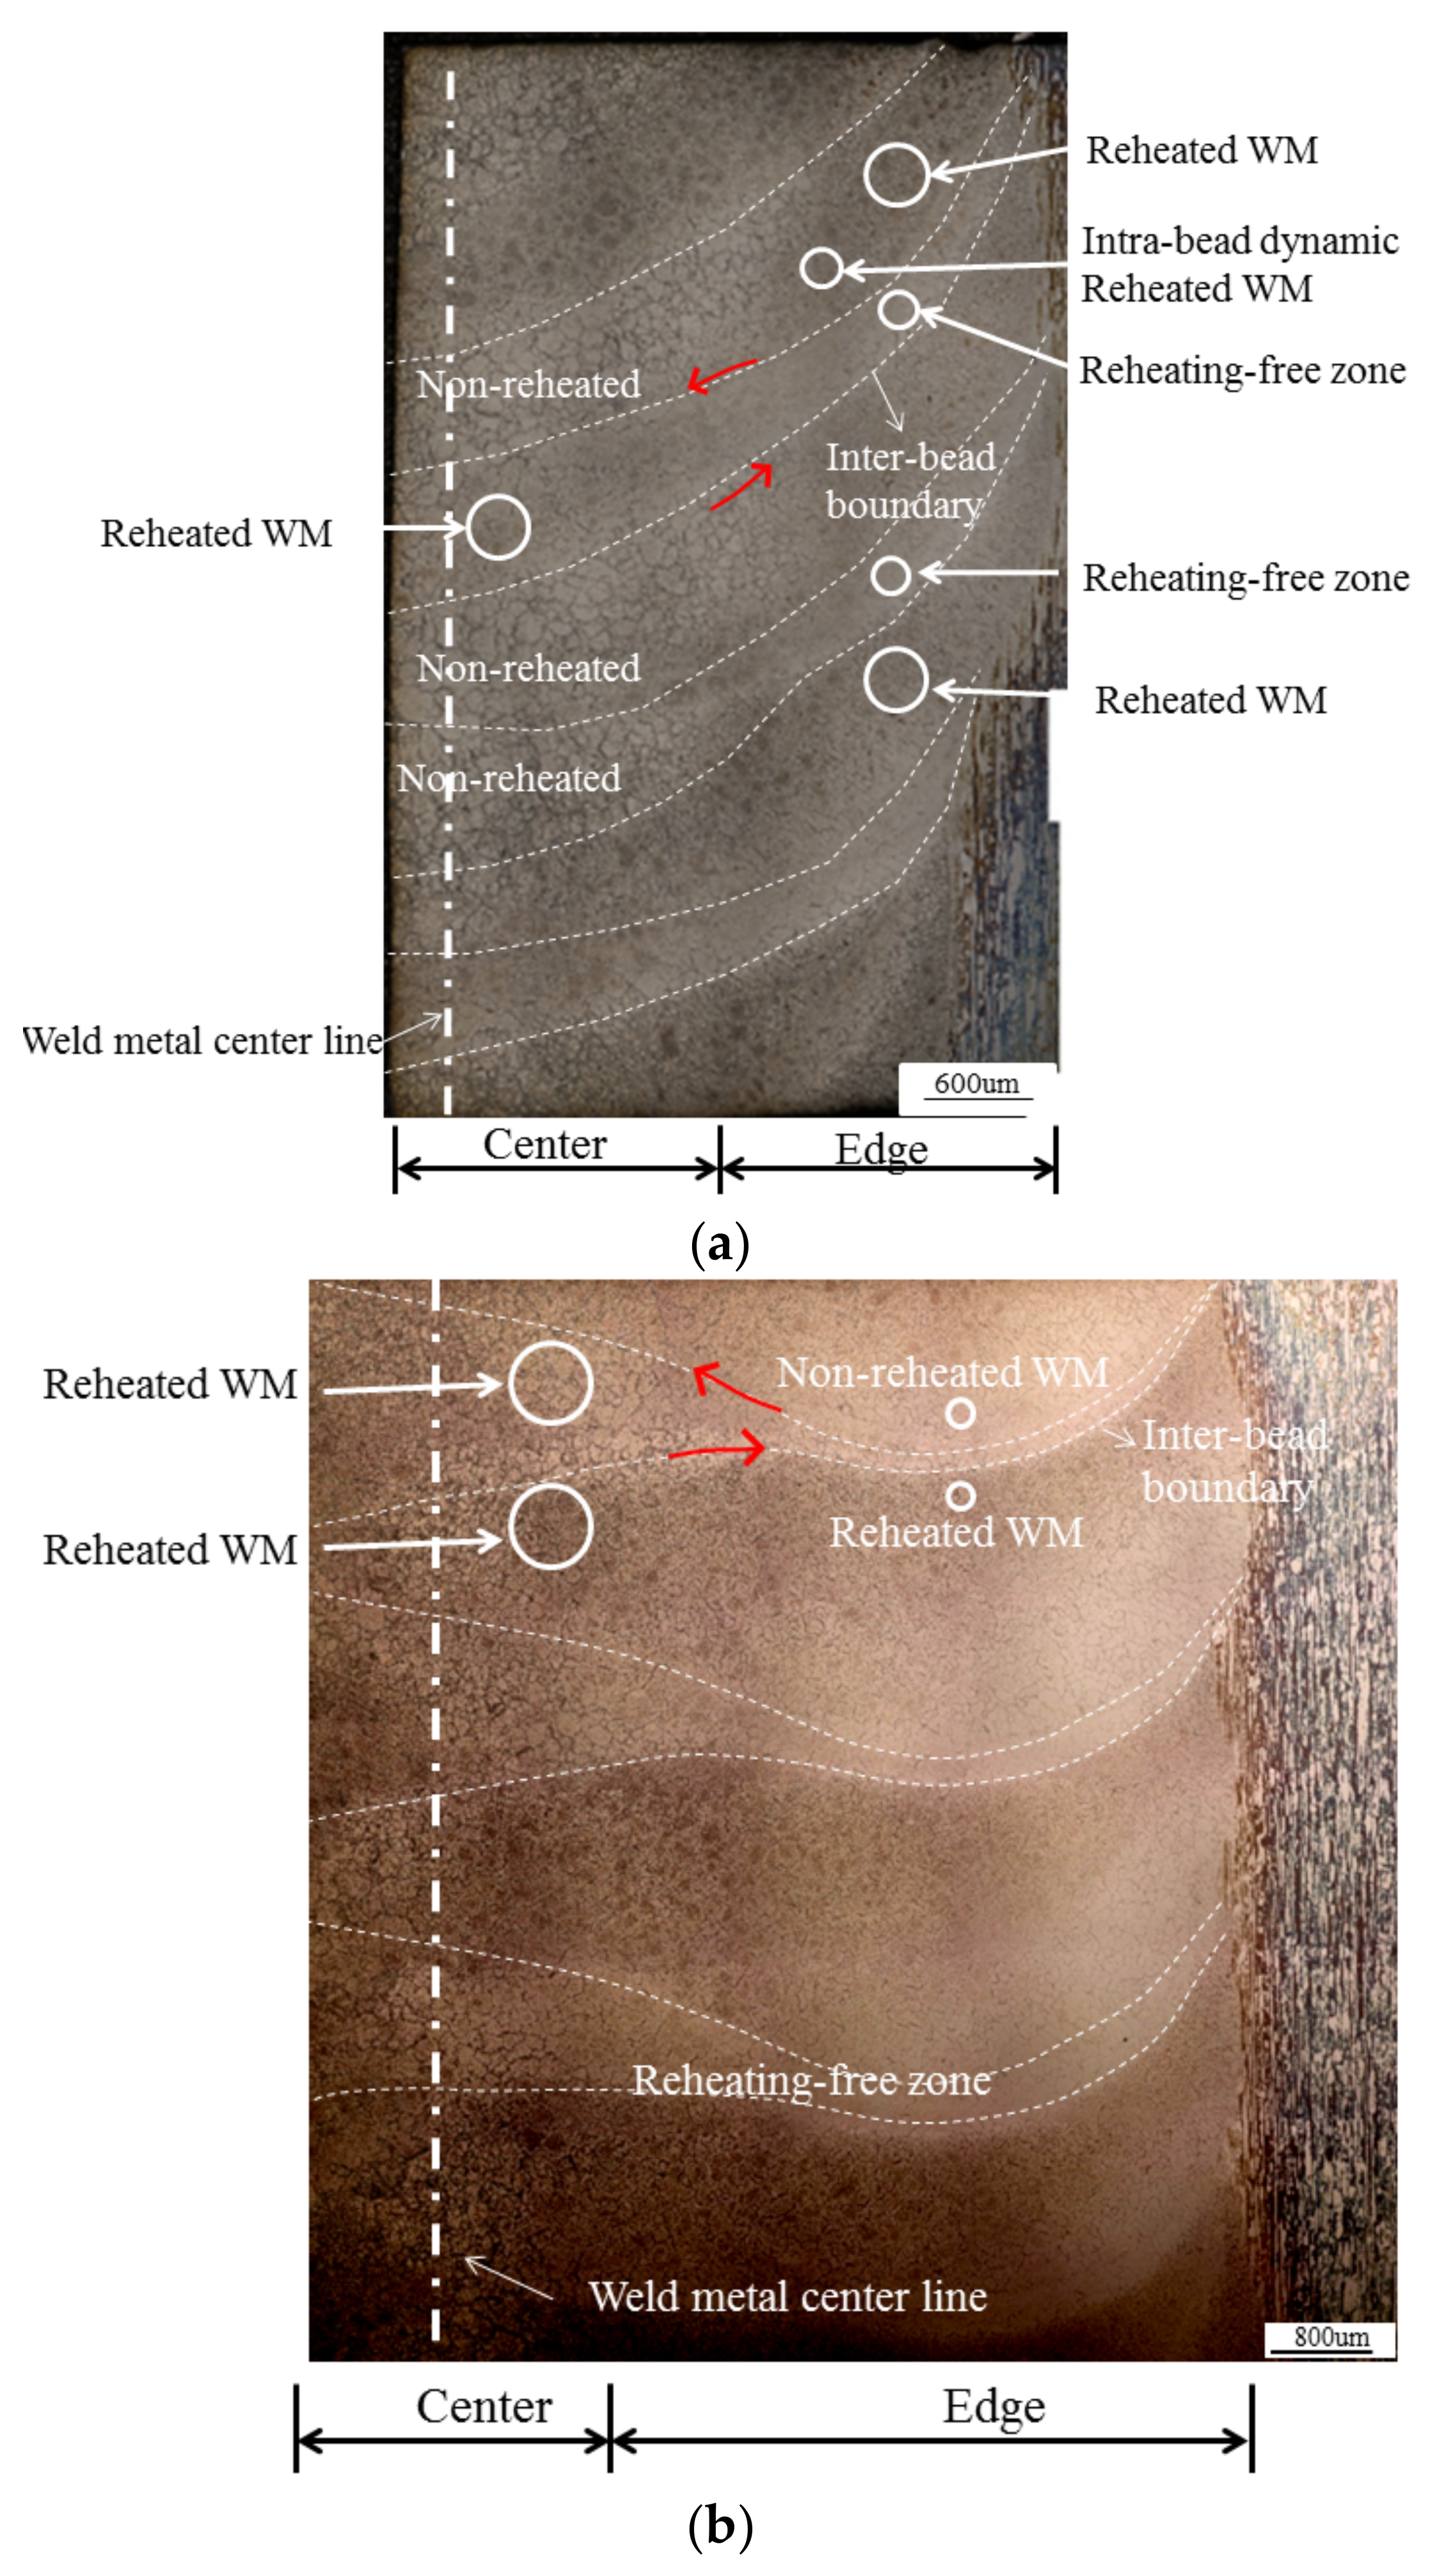
3.1. Macrostructural Analysis

The outer appearance of the as-welded specimen and their schematic diagrams of bead stacking-up sequences are shown in Figure 2. As shown in Figure 2a–c, different bead widths induced different welding HI, providing different welding speeds. The schematic is illustrated with reference to the movie clip [33] and actual observations. It was expected that the molten pool shape would vary with the HI as shown in Figure 2d–f. These shapes and sizes also affected the microstructure of the final weld metal, providing more opportunities to approach the equilibrium states. As shown in Figure 3, the macroscopic observation indicated the width and contour of the weld metal with the weaving width (heat input). The width of low, medium, and high heat input was 8.8, 14.2, and 20.5 mm, respectively. The bead cross-section showed a curved shape since the welding was conducted on the section of pipe.
Low HI specimens indicated that the molten pool width was almost the same as its bead width and the molten pool lasted longer than any other case, especially in the center area. The retained molten metal in the center area was maintained and provided additional heat toward its surrounding bead. The Medium HI condition showed a clear weaving path because the previous weld bead had sufficient time to cool down. The high HI condition showed a very wide bead compared with any other conditions. It was considered that there was no residual molten pool due to the fact that previous weld beads had enough time to cool down completely when the next bead approached. To investigate in detail, the surface was polished and analyzed by using an optical microscope and EBSD.
The surface macro specimen showed dramatic changes to the microstructure under low and medium HI, but not under high HI conditions, as shown in Figure 4a–c. The high HI condition showed an unclear bead boundary in the picture. It was converted into an area map later and confirmed after completion of the microstructural analysis results and EBSD results.
The low HI condition can be classified into the center and edge areas. The center area contained the molten pool which was produced during previous weld passes and lasted longer than in the edge area. In addition, the center area was overlapped by the next molten pool. Therefore, the molten pool can affect the solidified weld metal around it. The bead width was so small that the effect of the center molten pool was higher. The edge area was solidified quickly due to the many heat sinks around it. As shown in Figure 4a, there are several special areas, which were the reheated area (dynamic reheated area), non-reheated area and reheating-free area. Detailed feature will be discussed later.
The medium HI condition showed a very clear picture of the reheated area. It is considered that reheating took place after complete solidification of the previous weld bead, except in the center area. It also shows the center area with a small molten pool path. As shown in Figure 4b, areas were categorized into a reheated area, a dynamic reheated area, and a reheating-free area. They will be discussed later.
For the high HI condition, the image of the weld bead is not clear. It showed the same microstructure because the weld speed was so low that the bead was reheated mutually. As shown in Figure 4c, there was only one area of reheated area. This will be discussed later.

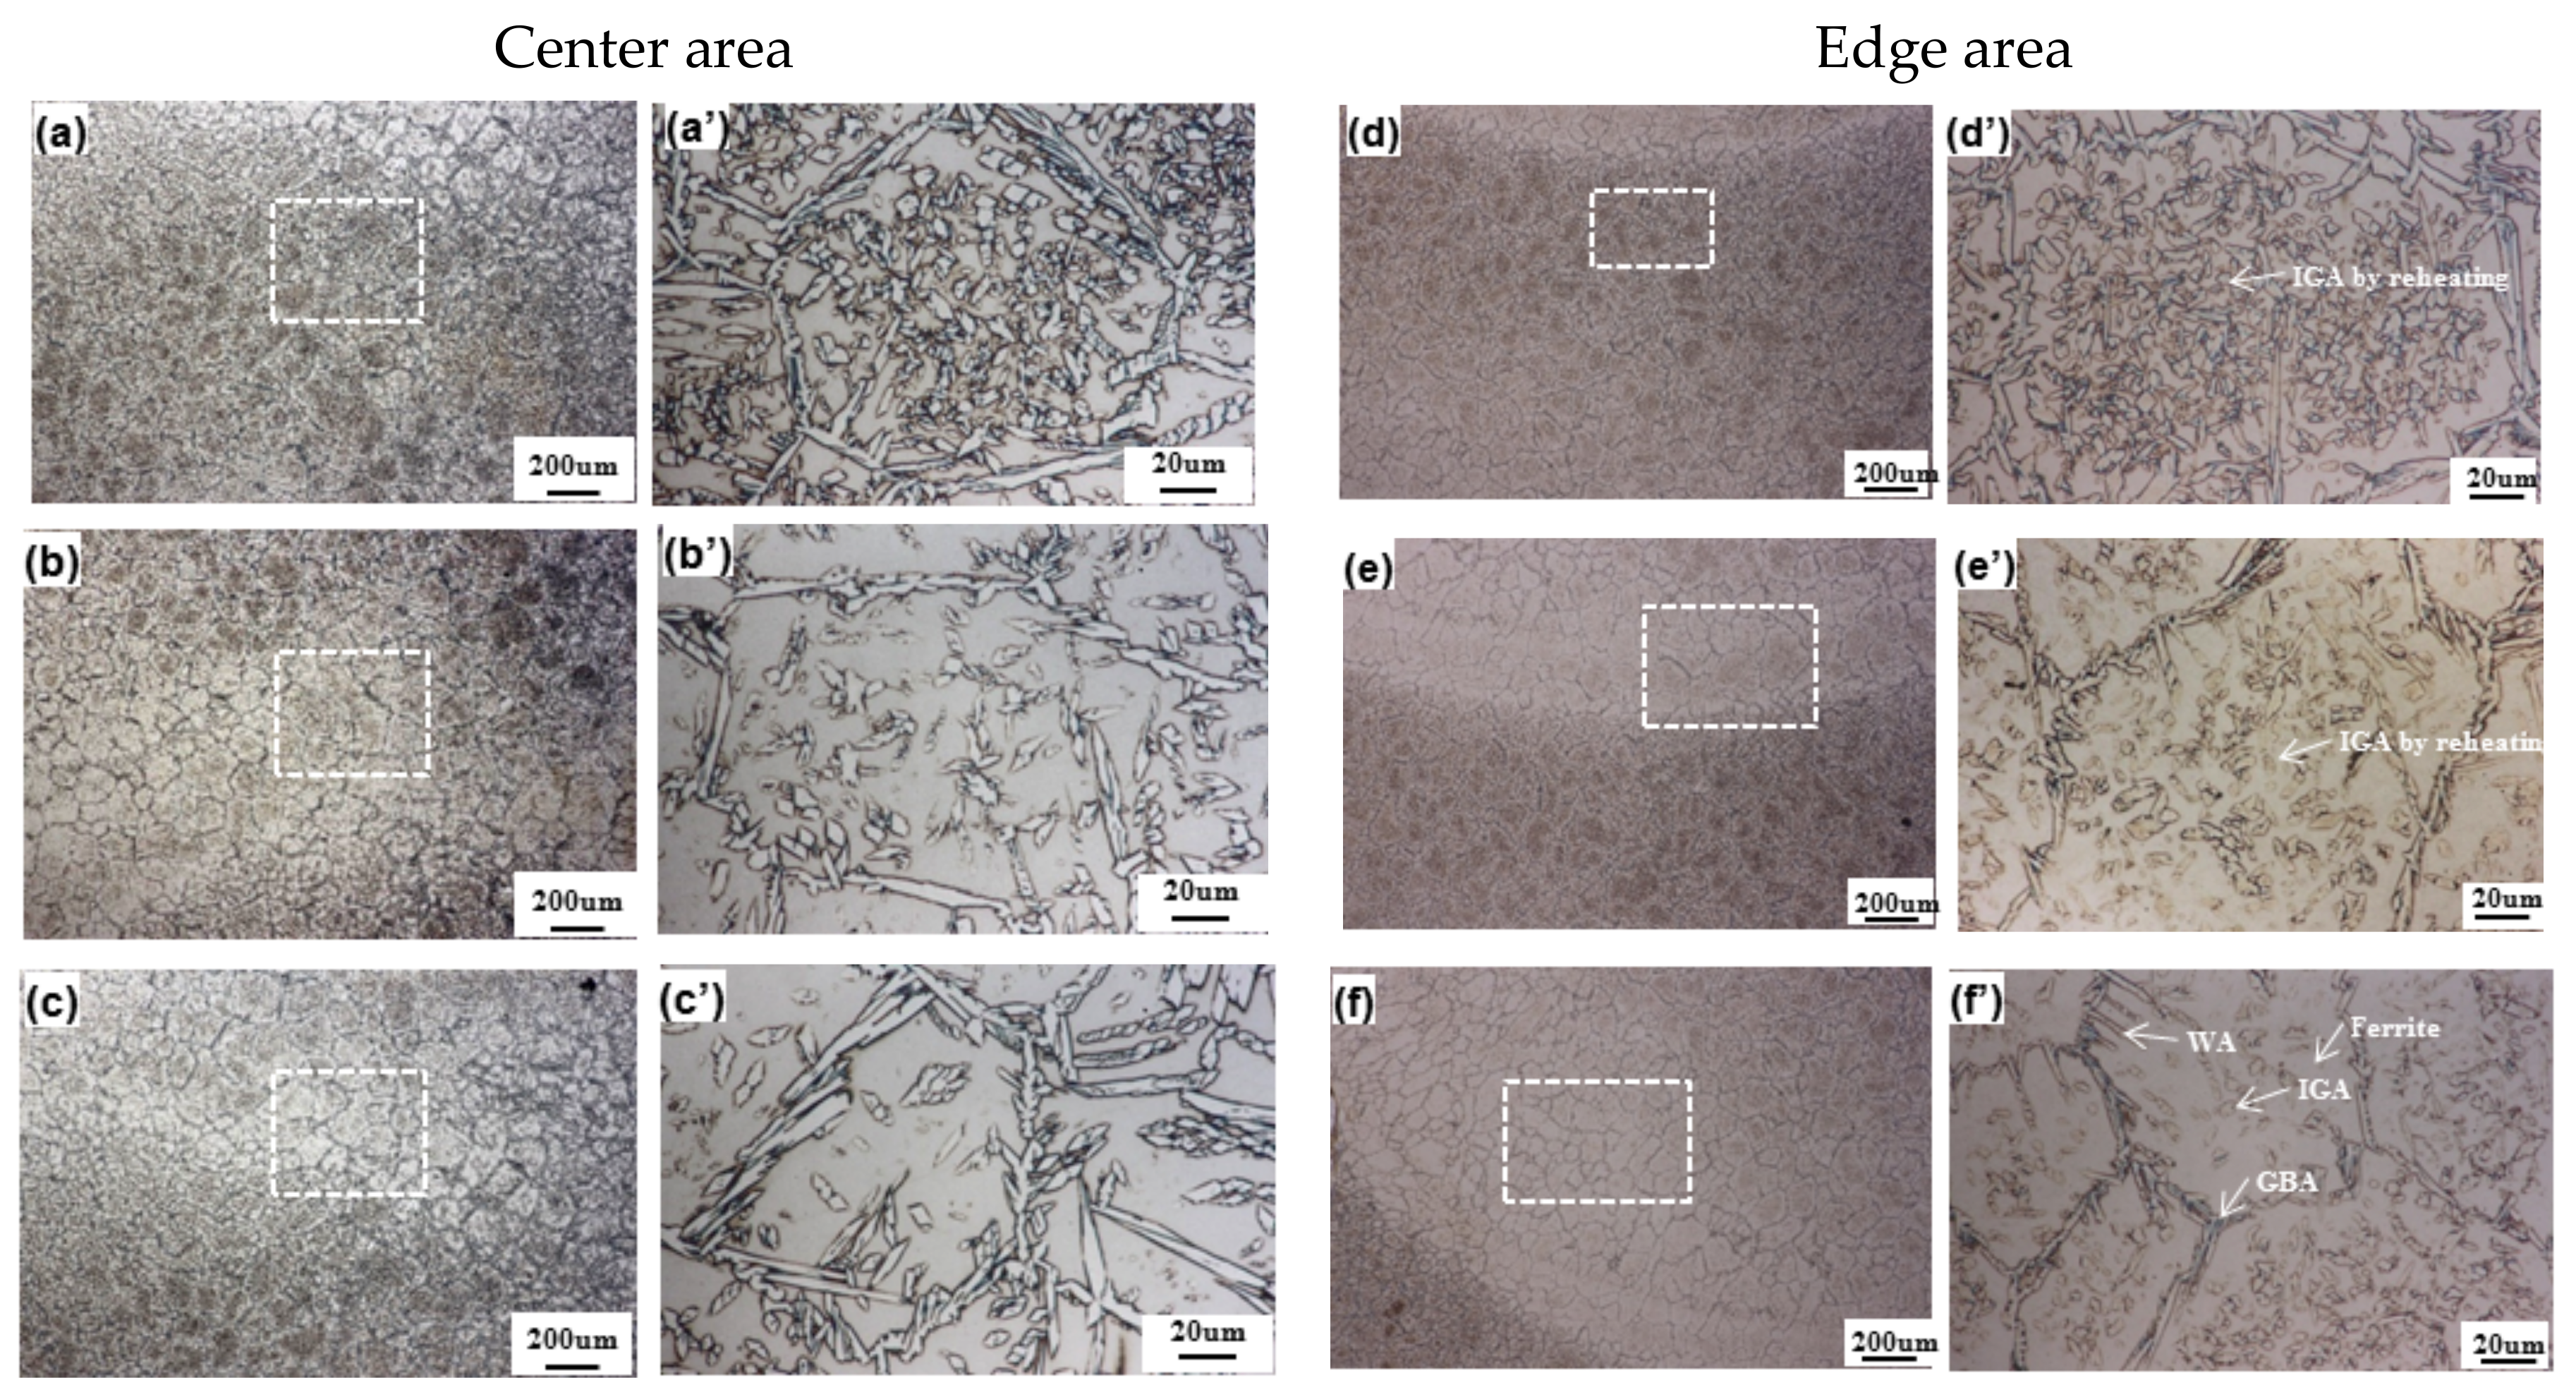
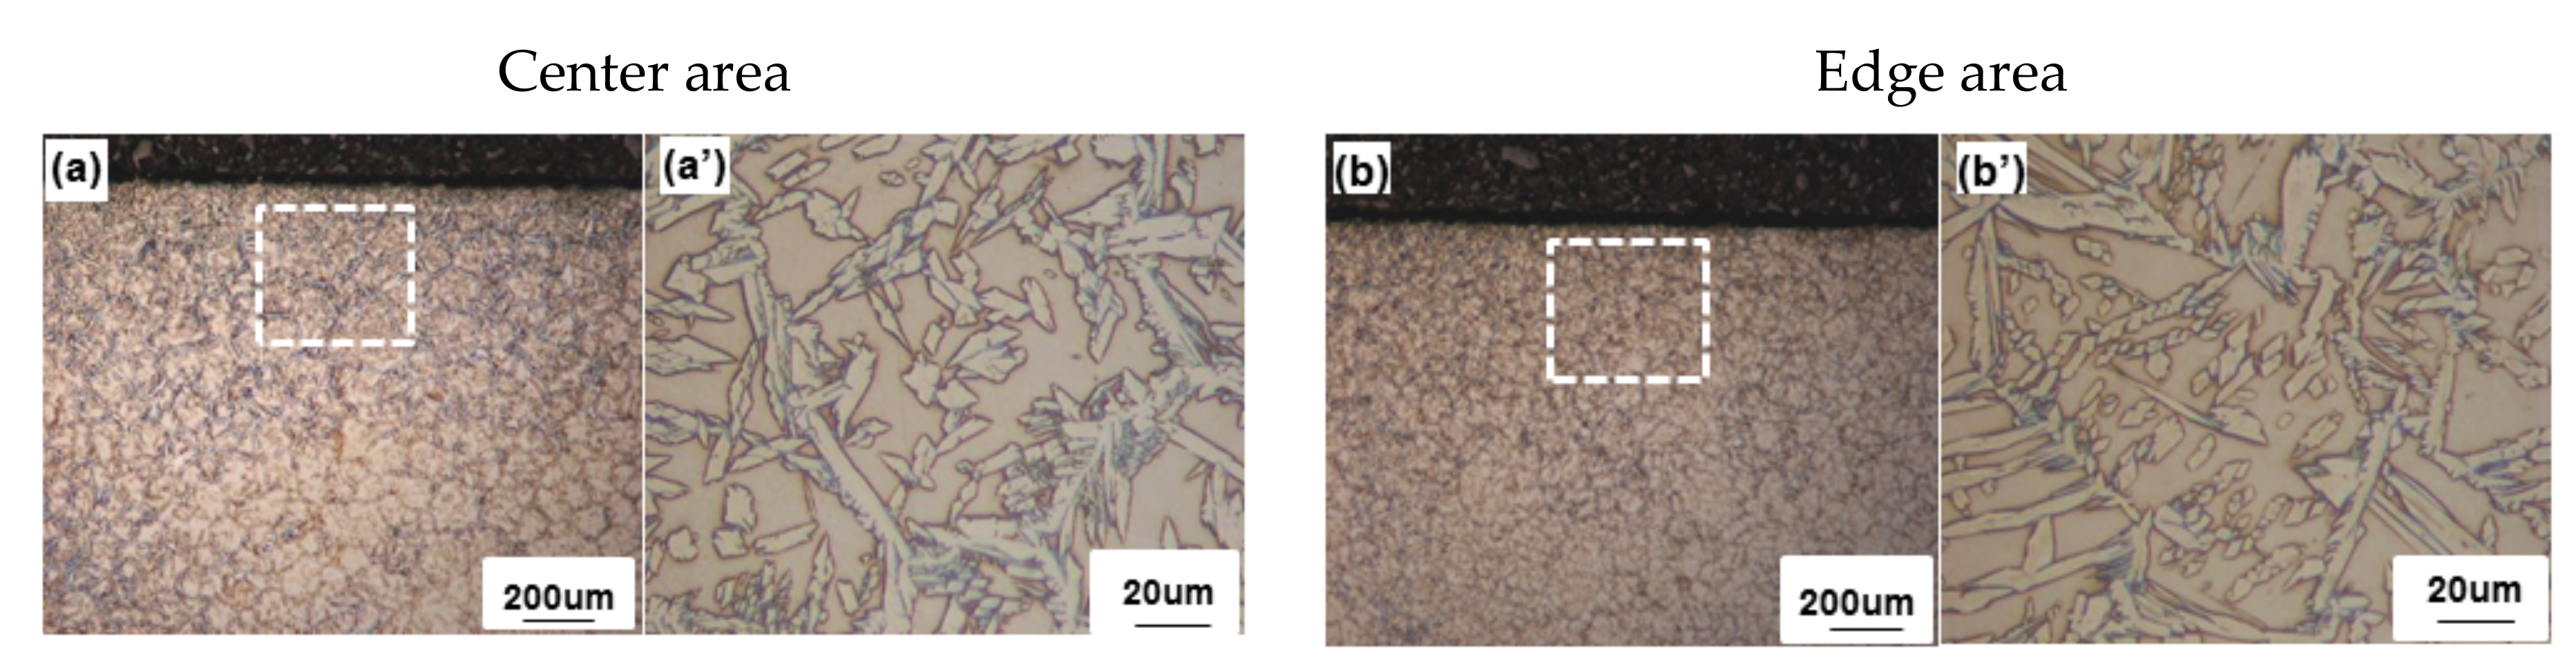
3.2. Microstructural Analysis

3.2.1. Low Heat Input Condition

As shown in Figure 5, the low HI condition presented the existence of grain boundary austenite (GBA), Widmanstätten austenite (WA), and intragranular austenite (IGA) in the ferrite phase matrix. The volume fraction of the austenite phase at the center region was higher than that at the edge area. The center area showed reheated areas and non-reheated areas, while the edge area showed reheated and RFZ. RFZ is a reheated area in which the microstructure resembled that of the non-reheated one due to the fact the area was reheated by weaving before the bead cooled down completely. The reheated area showed many IGA phases in the ferrite phase interior. However, the edge area showed a reheated area and RFZ while the center area presented reheated and non-reheated areas.

3.2.2. Medium Heat Input

As shown in Figure 6, the microstructure of the medium HI condition (14.7 kJ/cm) was different in the center area than at the edge areas. The microstructure consisted of the ferrite phase, GBA, WA, and IGA. There were three areas, namely, the reheated area, non-reheated area, and RFZ. The grain size of the center was larger than that of the edge areas due to the slow cooling rate. The molten pool moved from the left edge to the center, and then to the right edge. Afterwards, it returned from the right edge to the center, and then to the left edge during weaving activity. Thus, the center area contained liquid metal which was produced during previous bead welding and thermally affected its surroundings. In addition, the center area was cooled very slowly, because it was surrounded by the left and right edge areas. For this reason, the center area had a lower cooling rate than both edge areas. This was confirmed by a previous study, showing a larger grain size in the center compared with the edge [29].

3.2.3. High Heat Input Condition

As shown in Figure 7, the high HI condition presented a high volume fraction of austenite regardless of the location. Large IGA and thicker GBA were observed. From the surface analysis, there were no clear features of the reheated area, which were clearly visible in the low and medium HI conditions. It was considered that the entire area was reheated because the low welding speed provided the weld bead with more time to approach the equilibrium state, thus obtaining a higher austenite volume fraction.

3.3. Regional Microstructure Categorization

During macro- and microstructural analysis, several different microstructural areas were analyzed, which were non-reheated, reheated, and RFZ areas. The area fractions were varied with changing weaving widths, as shown in Figure 8. Low HI and medium HI cases showed three different areas, while the high HI case indicated only a reheated area. Non-reheated areas contained relatively low austenite fractions. Reheated areas contained relatively high austenite phases induced by reheating. RFZ showed slightly low austenite volume fractions even though they were located in the reheating path. The area fraction changes of HI were calculated and are presented below.

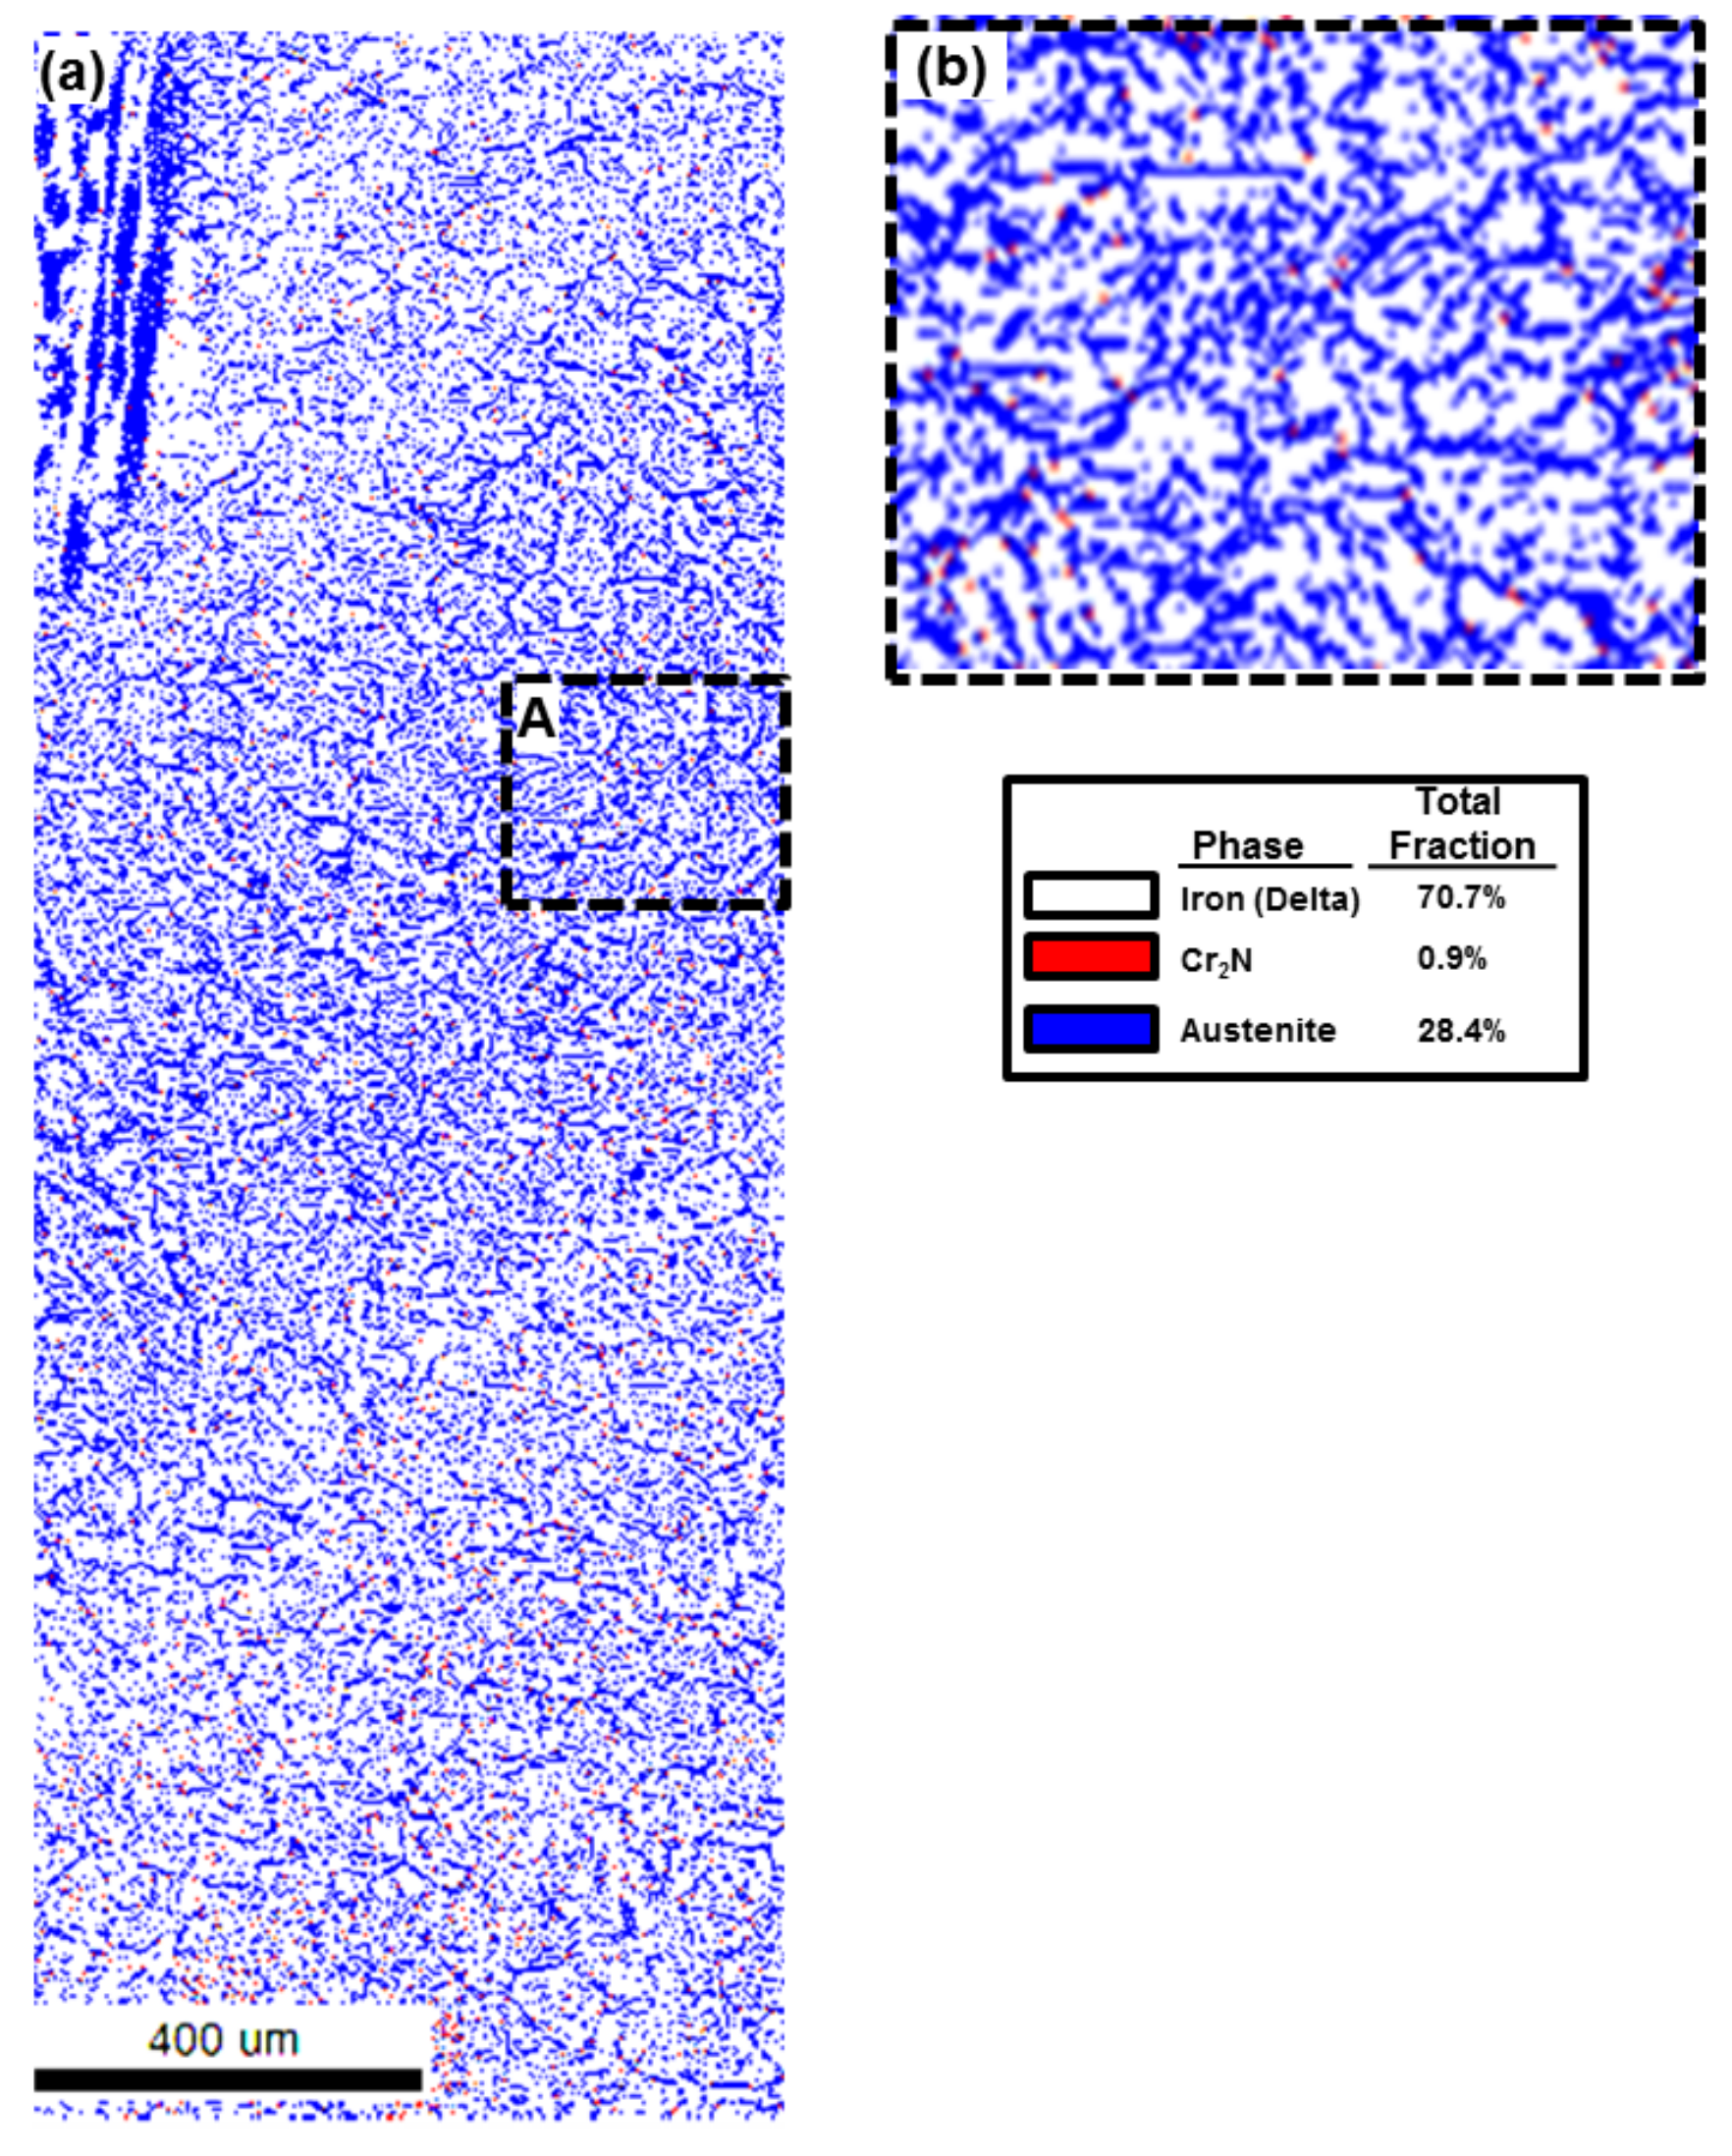
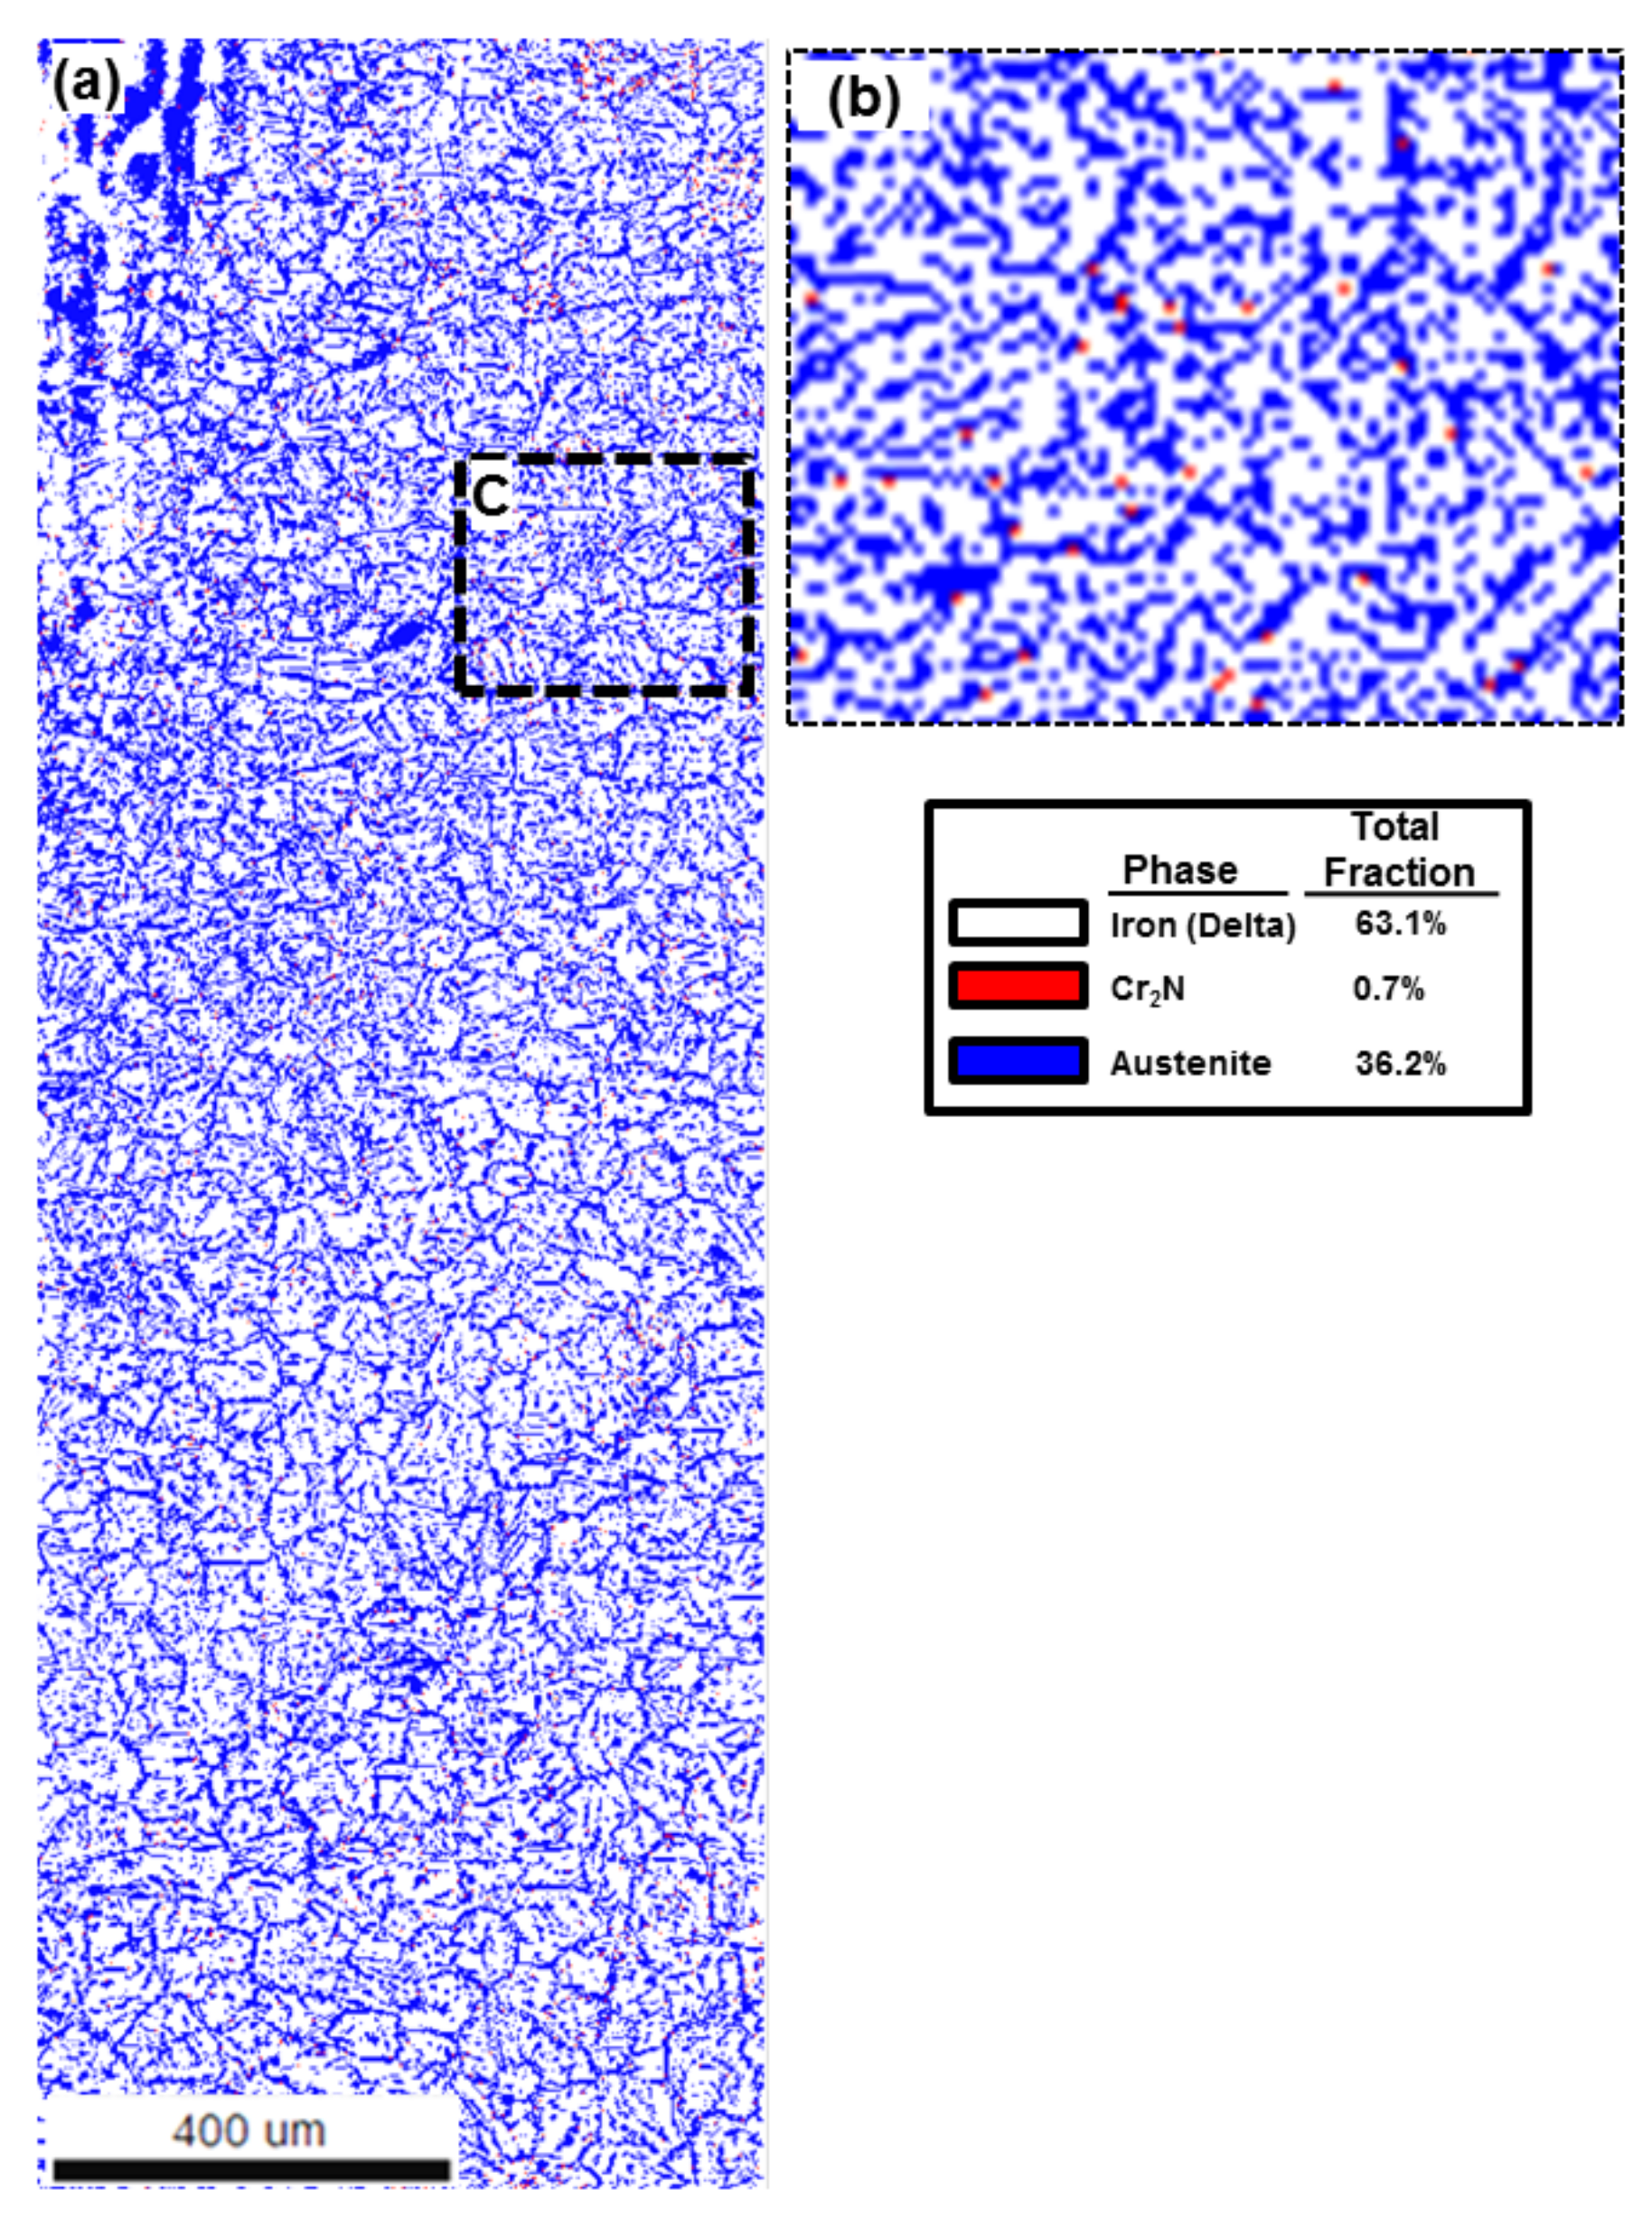
3.4. EBSD Analysis in the Edge Area

EBSD analysis was focused not on the center area, but on the edge areas because the reheating phenomenon is presented more clearly than at the center area. Additionally, pitting corrosion sites were commonly found at the edge areas. Therefore, an investigation at the edges was more useful to understand the relationship between microstructural changes and pitting corrosion resistance for future studies. EBSD results showed three different major phases, which were the austenite phase, the ferrite phase, and Cr2N.
At the low HI area, the overall phase distribution showed that the austenite phase, the ferrite phase, and Cr2N were mixed well. The phase ratio was 70.7% of the ferrite phase, 28.4% of the austenite phase, and 0.9% Cr2N, as shown in Figure 9.
For the medium HI area, some of the areas showed a high fraction of the austenite phase due to reheating. There were two of these areas, as shown in Figure 10. One was a low austenite phase fraction area and the other was a higher austenite phase area. The area of the high fraction of austenite was formed by the reheating of the following bead. The phase ratio was 83.8% of the ferrite phase, 13.9% of the austenite phase, and 2.2% of Cr2N.
For the high HI area, as shown in Figure 11, three phases of ferrite, austenite, and Cr2N were distributed evenly, showing a fraction of 63.1% of the ferrite phase, 36.2% of the austenite phase, and 0.7% Cr2N.
The phase fractions were presented quite differently between the low, high, and medium HI cases. They are summarized in the Table 4. The volume fraction of ferrite indicated 70.7% for low HI, 83.8% for medium HI, and 63.1% for high HI. The austenite phase fraction showed 28.4% for low HI, 13.9% medium HI, and 36.2% for high HI. The Cr2N volume fraction was 0.9% for low HI, 2.2% for medium HI, and 0.7% for high HI. From the medium HI case, the reheated areas and non-reheated areas were compared with its phase fraction in Table 5. The phase fraction of the non-reheated areas was 92.9% ferrite phase, 4.4% austenite phase, and 2.7% Cr2N. However, this changed to 72.1% ferrite phase, 26.6% austenite phase, and 1.4% Cr2N for the reheated area. By the reheating process, the phase volume fraction varied because more austenite was formed. From the EBSD analysis, the austenite volume fraction was increased by reheating. However, according to typical HI, there was no relationship between HI and the austenite volume fraction, as reported previously with a proportional relationship [8]. Low HI showed a greater austenite fraction than medium HI. The fraction of austenite was considerably higher and close to that of the high HI condition. Low HI and medium HI conditions showed an inverse relationship, which will be discussed later.

4. Discussion

4.1. Microstructural Categorization

There were several areas of a non-reheated area, a reheated area, and a RFZ categorized by heating cycles with different HI, as shown in Figure 12. The welding process was GTAW and single-pass welding with weaving. Therefore, it was considered that there were only non-reheated areas, as shown in Figure 12a. However, there were reheated areas found which are normally discovered in multiple-pass welding. As shown in Figure 12b, firstly, a non-reheated area was formed by the first welding bead. Afterwards, the bead was solidified as the temperature decreased below the solidus line. Lastly, the following bead passing along the first one, providing heat, thus reheating the previous weld bead. The RFZ was a reheated area, but there were no characteristics of it being reheated due to the area being at a very high temperature or in a liquid phase. Therefore, the area was re-melted or heated-up by the molten pool again, as shown in Figure 12c. However, there was no microstructural effect by this reheating process.

4.2. Area Fraction Change by Heat Inputs

Figure 13 presents the heat flows with welding HI. There are four areas: molten pool, liquid area, previous bead’s liquid area, and solidified area. The molten pool is the liquefied area by the arc during welding. The liquid area is the retained molten pool after the arc moves away. The previous bead liquid area is the liquid area of the previous weld bead because the liquid was retained until the following bead is passing. The solidified area is already solidified when the following bead is passing. As shown in Figure 13a, the low HI condition indicated the previous bead liquid area was larger and lasted longer than in any other cases, thus greatly affecting its surroundings. The medium HI case shows a small quantity of liquid retained in the center area, as shown in Figure 13b. The following bead affected greatly the previous bead which was already cooling down. Both cases indicated that the edge area was affected only by the molten pool. However, the center area was affected by the molten pool, as well as by the previous liquid area. The high HI case showed that the molten pool greatly affected its surroundings due to its low moving speed, as shown in Figure 13c.
Figure 14 presents an area ratio map of the reheated area, non-reheated area, and RFZ with three different welding conditions. It was calculated using Adobe Photoshop CS6TM software (Version: 13.0.1, Adobe, San Jose, CA, USA) from Figure 8. In the center area, low HI presented 40.4% of the reheated area and 50.9% of the non-reheated area. Medium HI indicated 60.6% of the reheated area, 13% of the non-reheated area, and 26.4% of the RFZ. High HI was formed entirely of the reheated area. However, in the edge area, low HI presented 68.7% of the reheated area and 31.3% of the non-reheated area. Medium HI indicated 57.2% of the reheated area, 40.6% of the non-reheated area, and 2.2% of the RFZ. The area ratio varied with the change of HI, residual liquid, and inter-reaction.

4.3. Microstructural Change between Reheated Weld Metal and Non-Reheated Weld Metal

Figure 15 shows the equilibrium phase fraction and Gibbs free energy related to temperature. The ferrite fraction was increased with the decrease in temperature. The austenite phase volume fraction was increased from the solidus line and the Cr2N volume fraction was increased with the decrease in temperature. However, welding was not at an equilibrium state, showing fast cooling, thus inducing higher ferrite fraction and Cr2N. Therefore, there was a driving stabilization force introducing the austenite phase increment when it was reheated. When the bead, which has a lower austenite phase was heated again, the microstructure of the bead moved to the equilibrium status, increasing austenite phase fraction. For this reason, the weld metal, which was at a non-equilibrium state, changed toward the equilibrium state spontaneously when it was heated again.
To compare the effect of reheating, two areas, non-reheated and reheated, of medium HI are presented in Figure 16. This shows the mixture of non-reheated and reheated areas. Two parts were cropped and its major phases were calculated. Reheated areas showed 26.6% of the austenite phase and 1.4% of Cr2N, while non-reheated areas indicated 4.4% of the austenite phase and 2.7% of Cr2N. Therefore, reheating induced an increment of the austenite phase, lowering the Cr2N content.
The role of Cr2N was as a nitrogen sink during rapid cooling. Rapid cooling induced super saturation of nitrogen in the ferrite phase due to the fact that the ferrite phase has low solubility of nitrogen when it cools. There are two options to reduce nitrogen content. One is the formation of an additional austenite phase. The other is Cr2N precipitation. The austenite phase formation also requires considerable time; therefore, Cr2N formation was the best option to reduce nitrogen. EBSD results showed that the reheated areas had low fractions of Cr2N, while non-reheated areas showed high levels of Cr2N content. From the previous results [29], there was a band without Cr2N at the austenite-ferrite phase boundary in the reheated areas. It was concluded that the band was secondary austenite produced by Cr2N dissolution by reheating, as other researchers have reported [12,13,15,34].

4.4. Chromium Nitride (Cr2N) Fraction in the Edge

The formation of Cr2N was introduced by super-saturated nitrogen in the interior of a ferrite phase when it was rapidly cooled during welding. The edge cooling rate was faster than that of the center due to the brief occurrence of the molten pool and many heat sinks around it. The weld bead formed by different weaving widths, which was proportional to the HI, showed different tendencies of solidification. High HI showed no reheating microstructures in the edges, while the low and medium HI condition indicated a mixed structure of non-reheated areas and reheated areas. The Cr2N was dissolved into the austenite phase when it was reheated during welding. Therefore, the fraction of Cr2N was high in the non-reheated area of the medium HI area. However, all the other areas, like the edge area of low HI and high HI, which were reheated, presented very low Cr2N content [12,15,21,35].

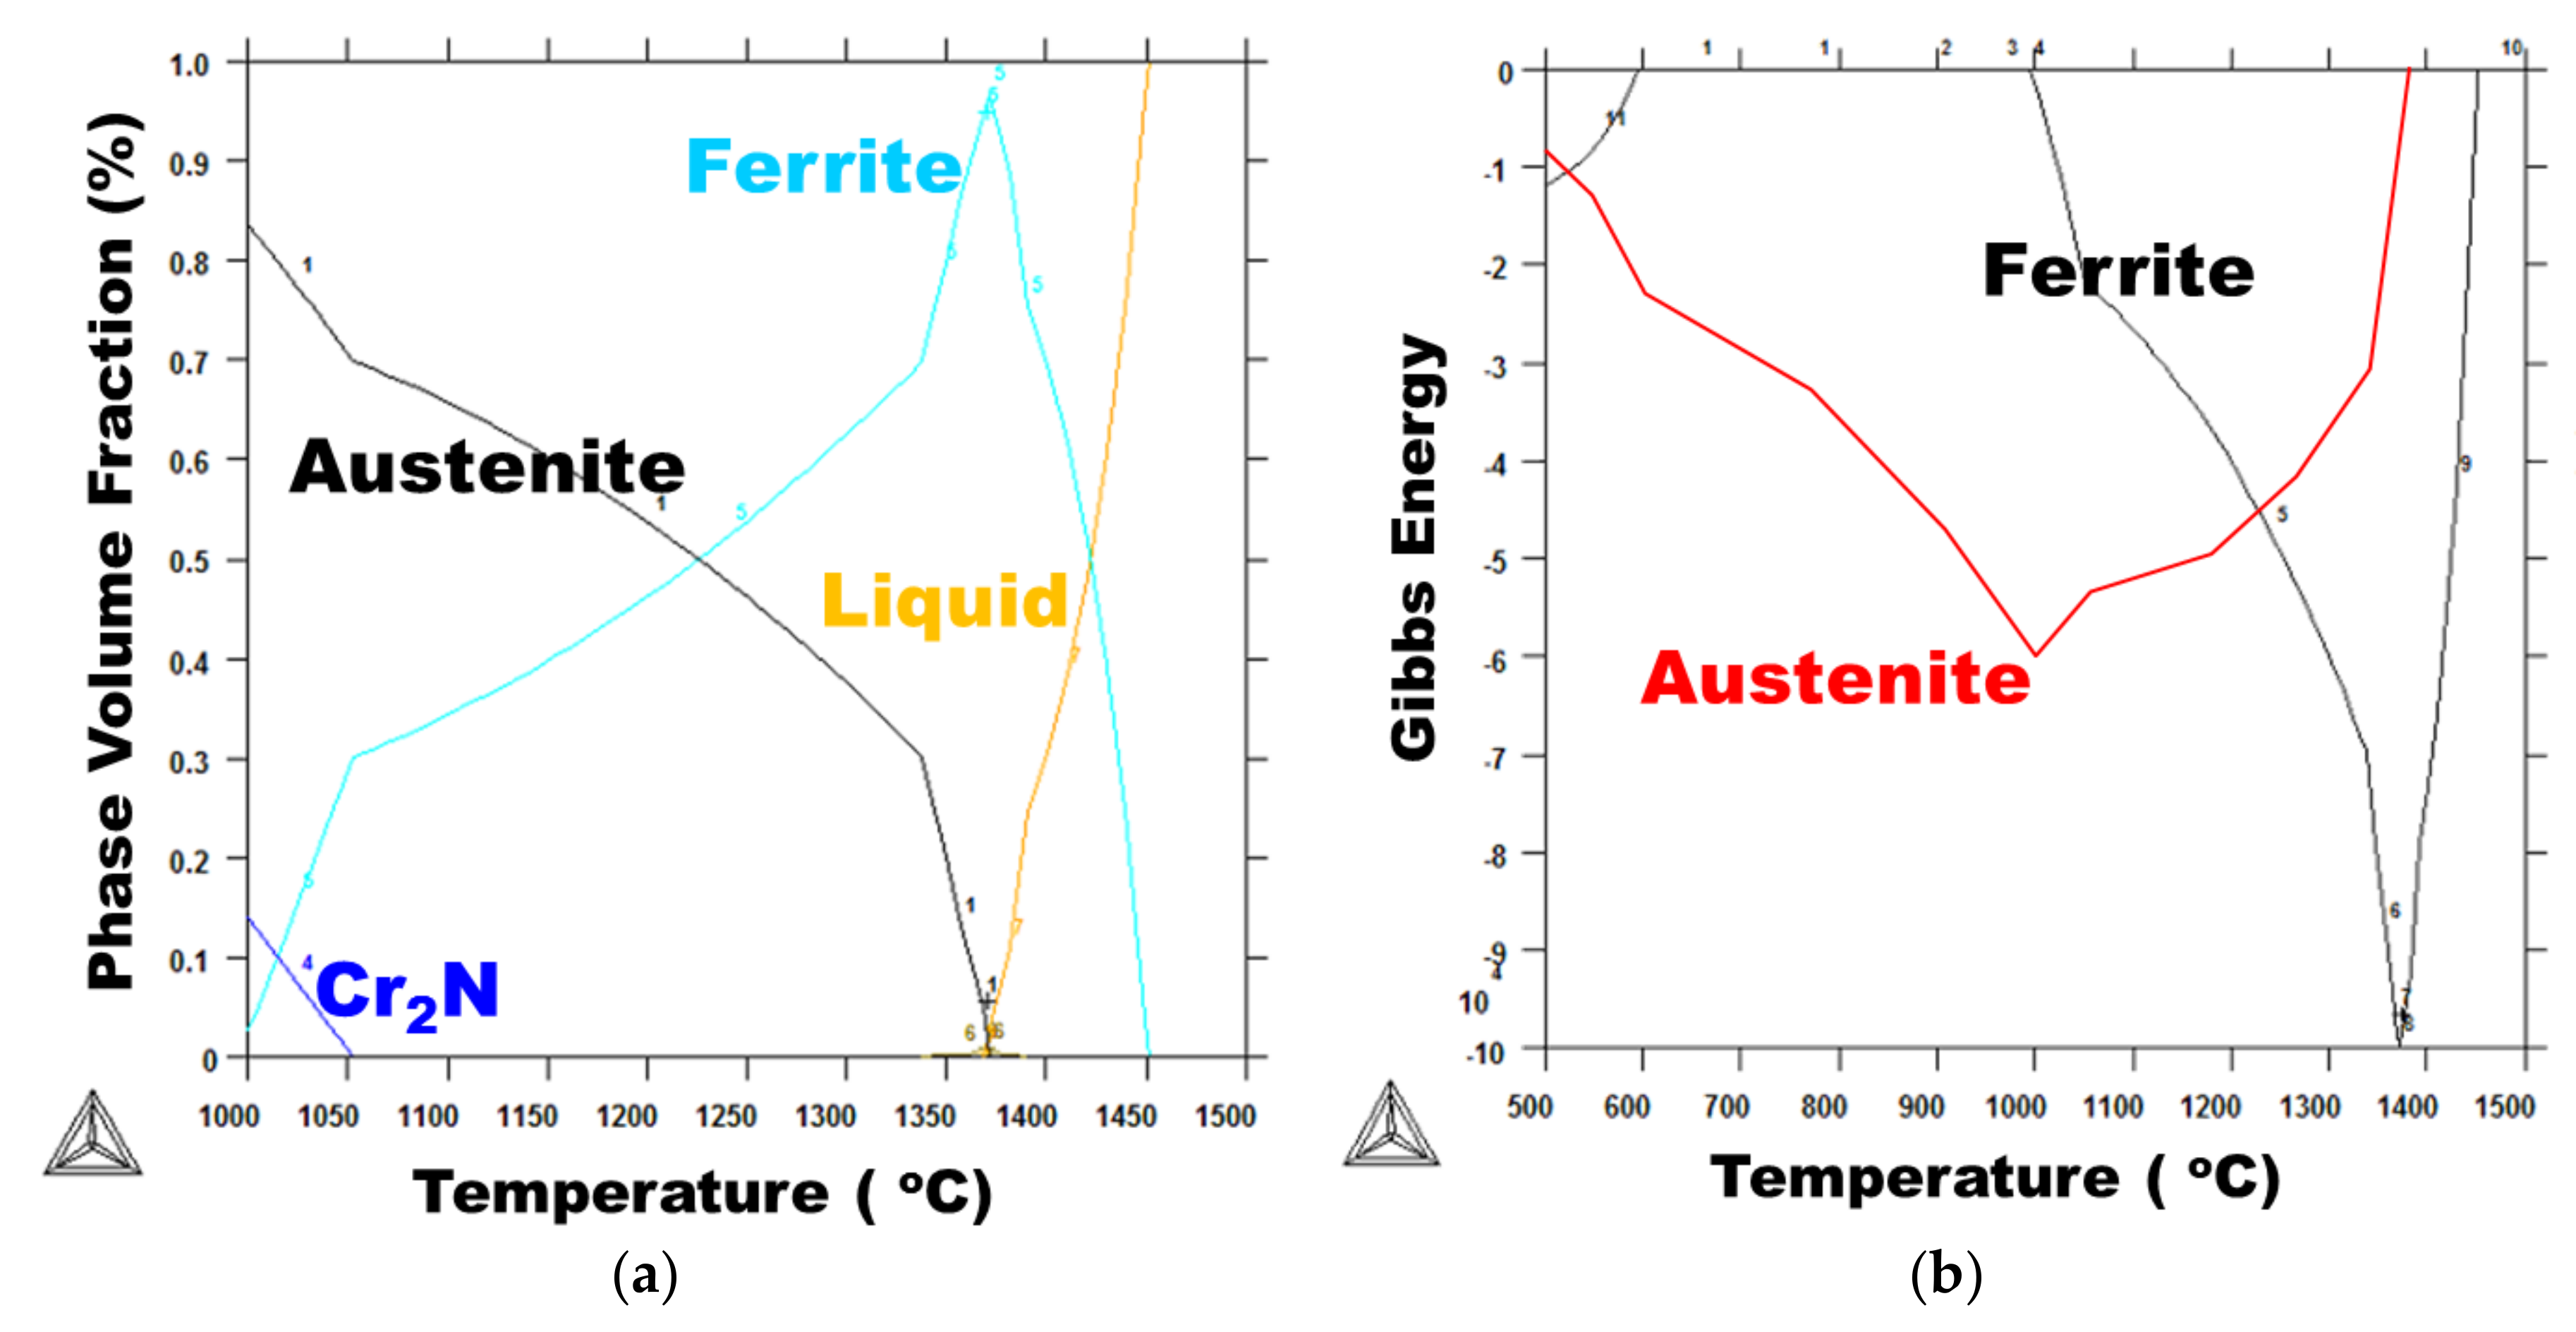
4.5. Austenite Volume Fraction Determination

The austenite fraction and HI had a proportional relationship because HI explains the cooling rate. A low cooling rate provides more time for the weld metal to be able to approach the equilibrium state. Moreover, the cooling rate is determined by the weld HI. It was calculated by Poorhaydari et al. [36]. Therefore, high HI presents a lower cooling rate. However, in this research, there were two heating systems. One was the non-reheated area, which were governed by HI directly, and the other was the reheated area, which were related with HI indirectly.
In the ideal case, the austenite phase fraction at the weld metal will be increased up to the fraction of the equilibrium state. However, the welding process was in a non-equilibrium state, providing a rapid heating/cooling process even under very high HI. A higher HI was applied, thus obtaining the higher austenite fraction in the weld metal [12,35]. From the EBSD analysis results in the edge area, as shown in Figure 17, the austenite fraction was not proportional with the welding HI as expected. Low HI showed a higher austenite fraction than that of the medium HI condition as shown in ‘A’ of Figure 17. It was an inverse relationship compared with other researches [12,35]. As shown in Figure 16, the austenite fraction of the weld metal was dramatically increased from 4.4% to 26.6% when the weld metal was reheated. The reheated area fraction bar chart is shown on the bottom of Figure 17. As shown in Figure 17, the austenite phase fraction has a similar tendency as the reheating area fraction. For these reasons, the determination of the austenite fraction was made not only by welding HI, but also by the degree of reheating. It was considered that the reheating effect on the austenite phase fraction determination in the edge area was greater than that of HI.

5. Conclusions

Single-pass GTA welding was carried out with several heat inputs controlled by the weaving width on a 25% Cr super duplex stainless steel pipe. From the microstructural analysis and EBSD observation, the below conclusions were obtained:
1
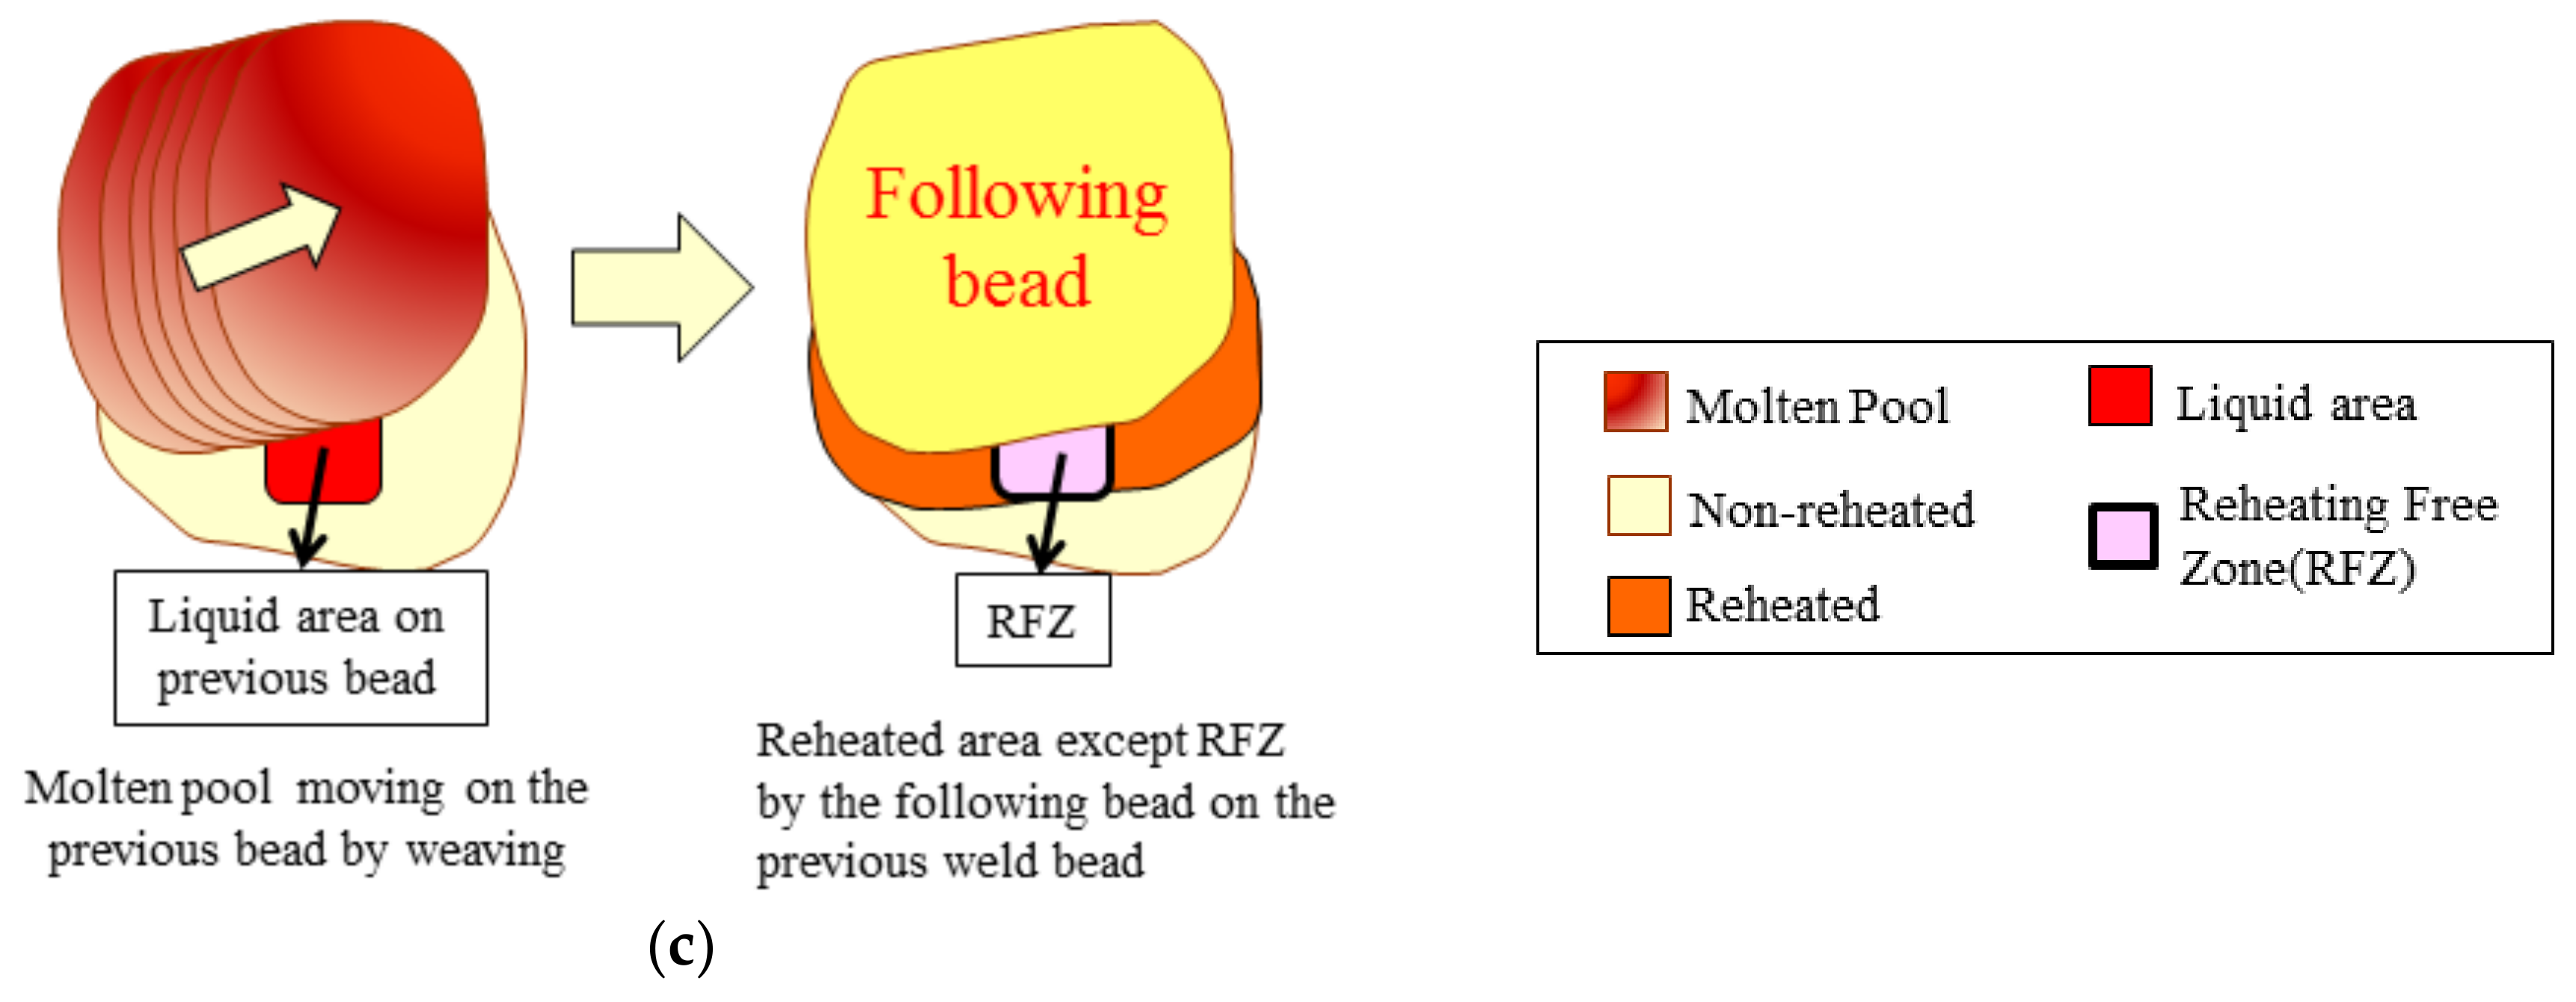
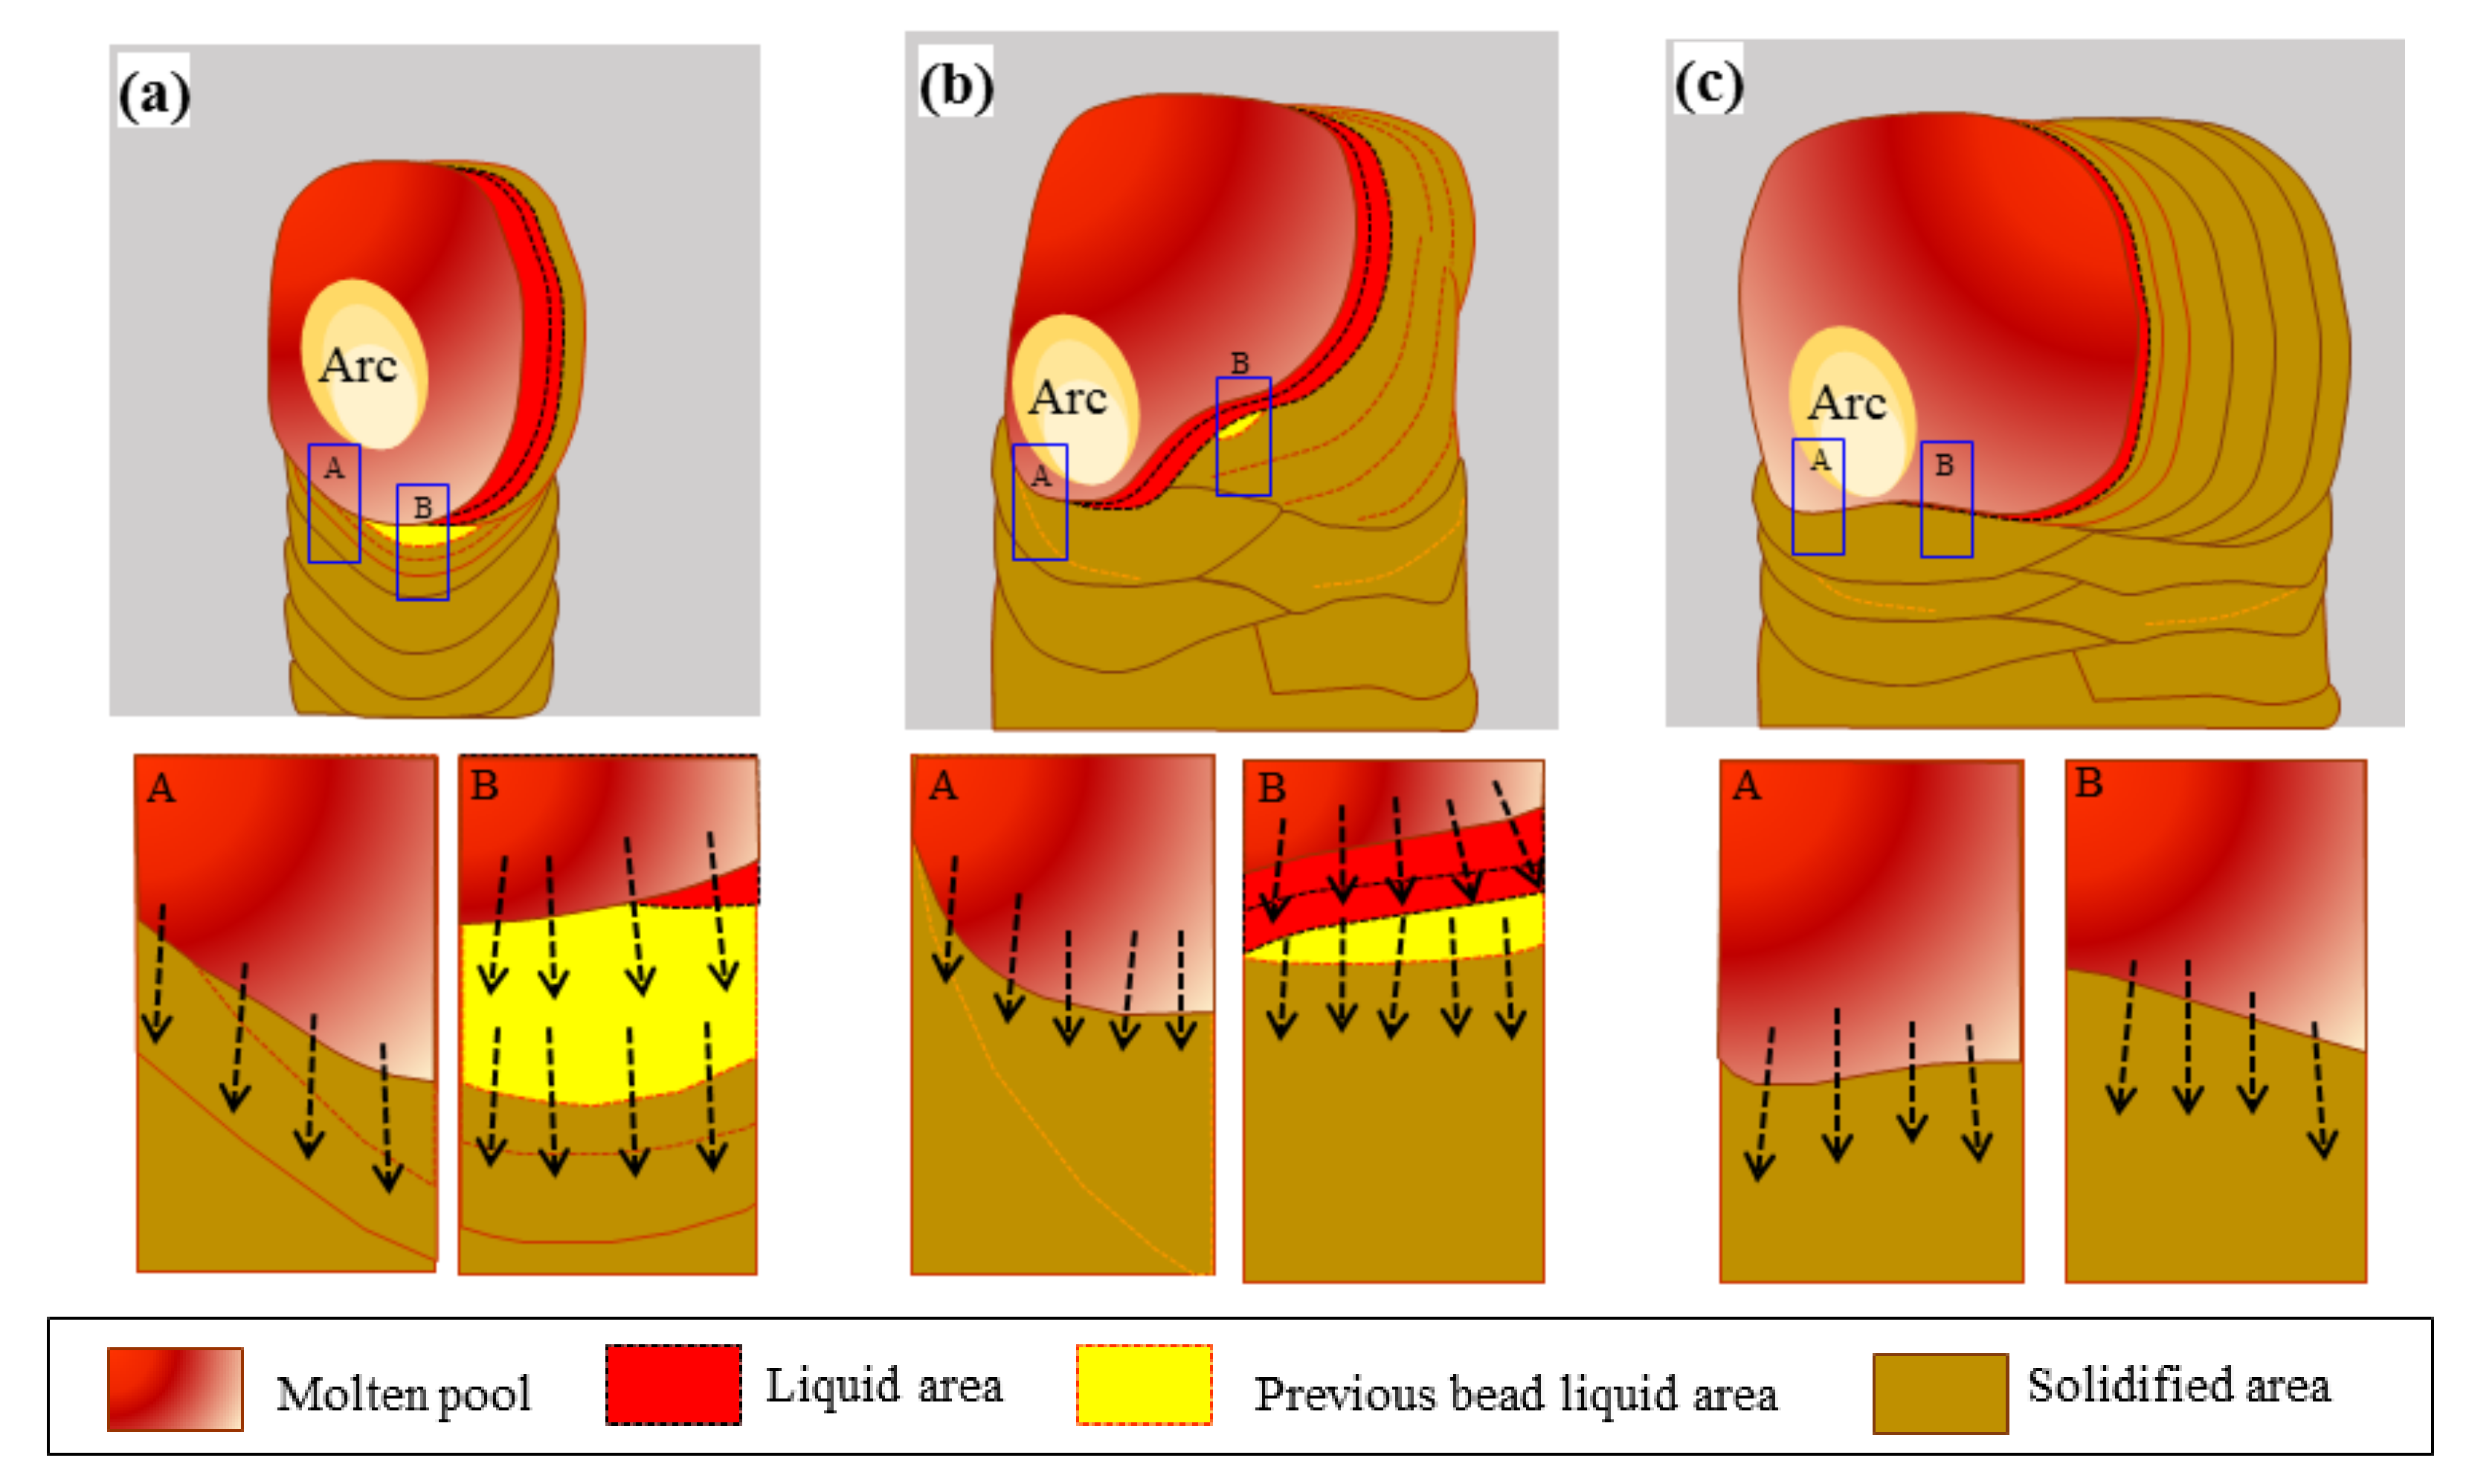
Dynamic reheating was induced simultaneously while one welding pass was produced on the single-pass weld bead regardless of the welding bead width and heat input.
2
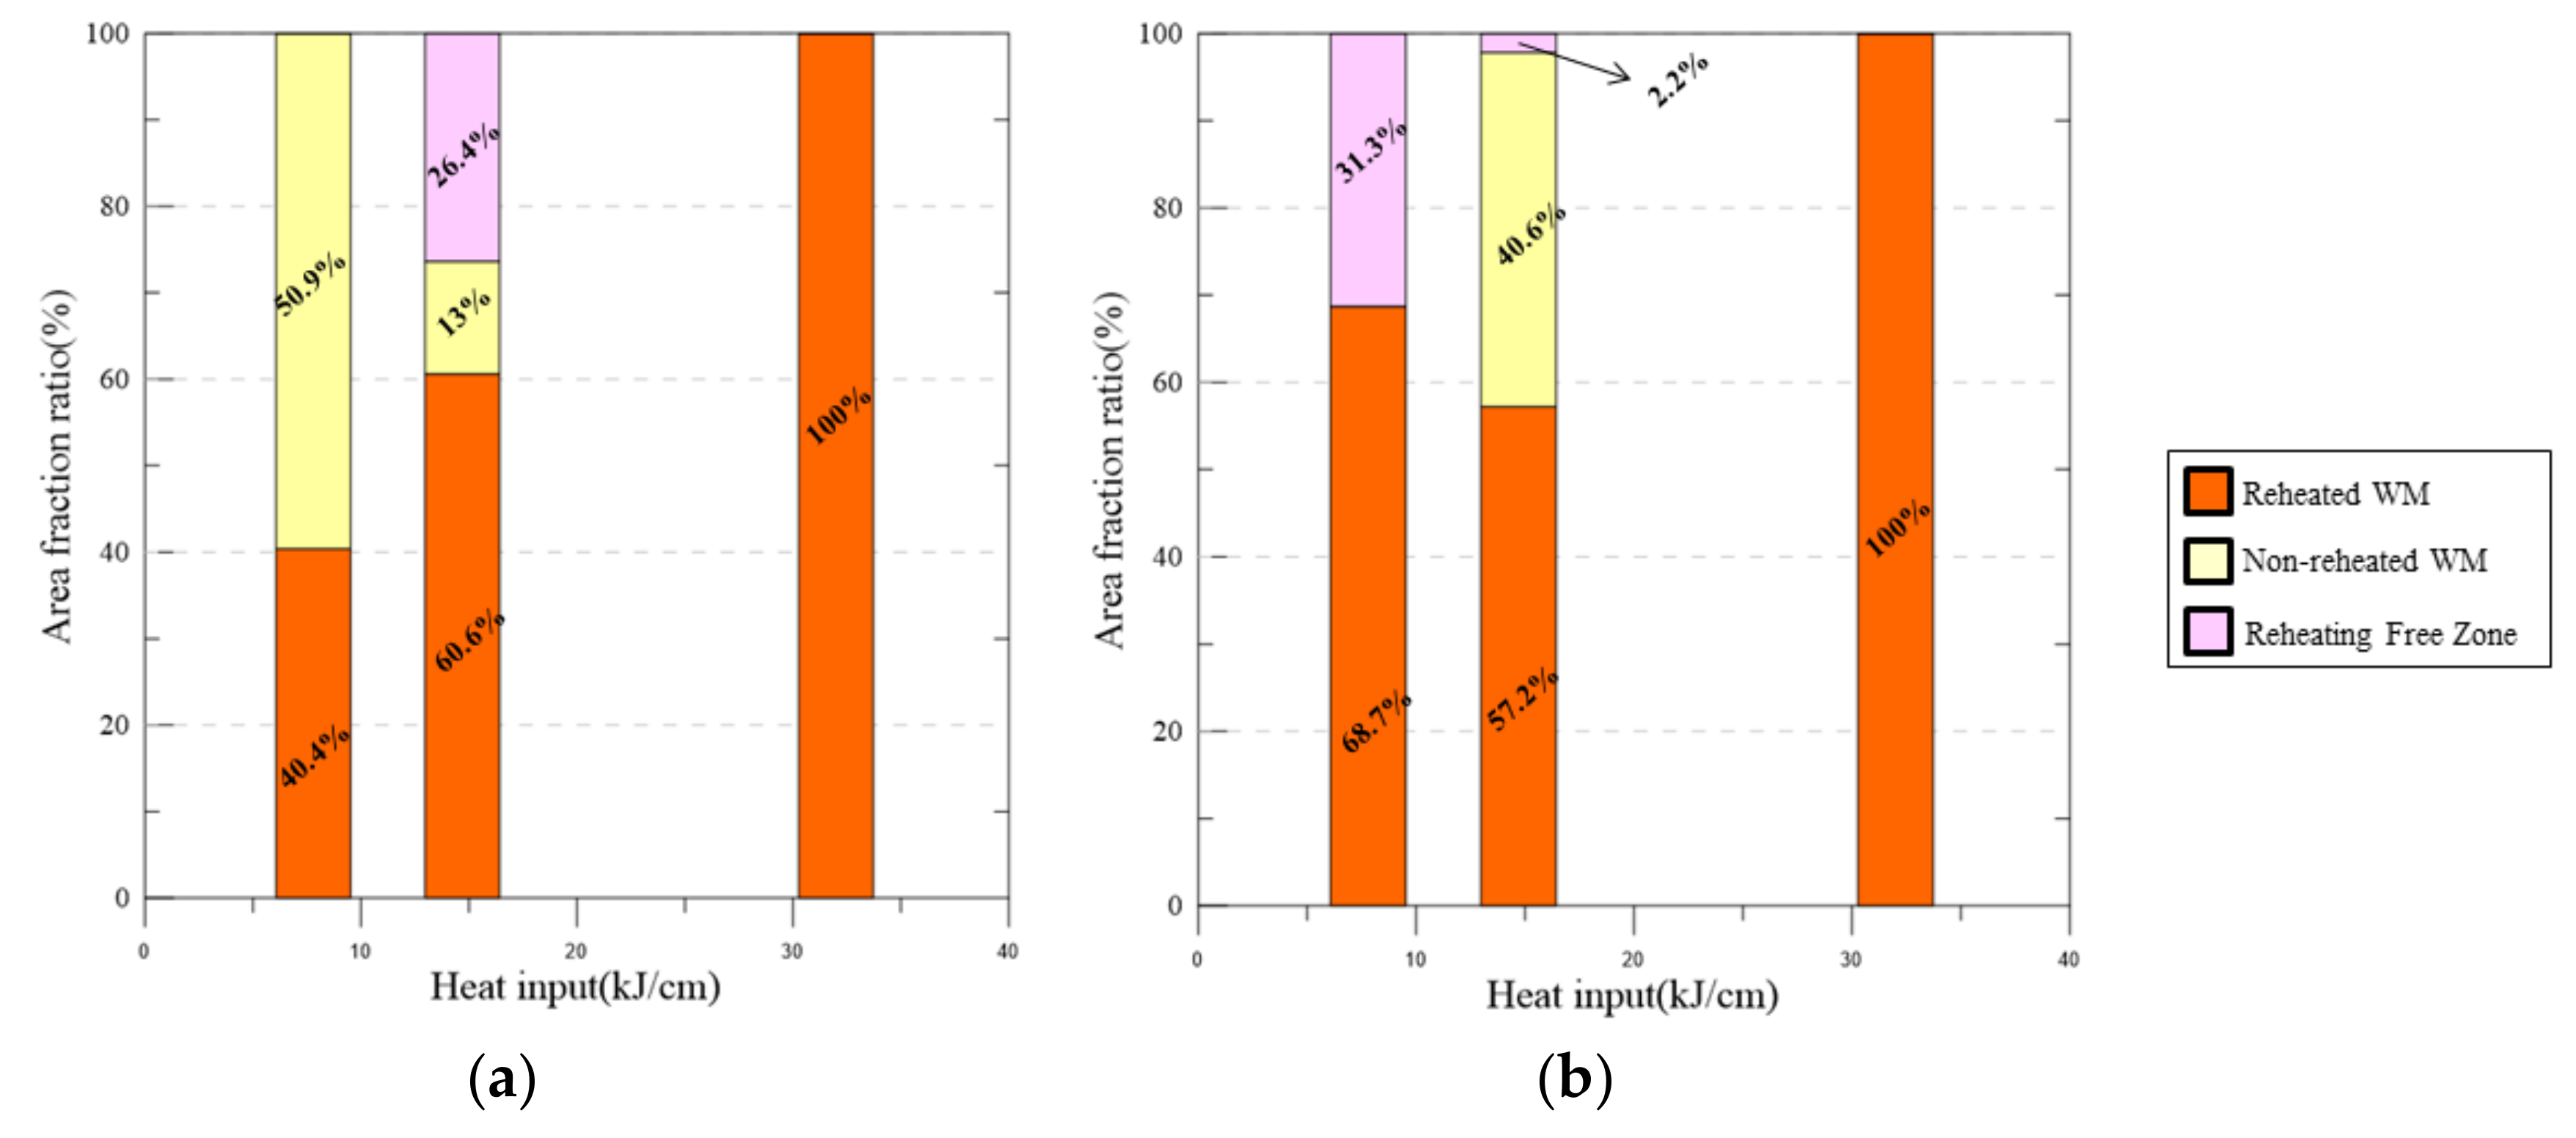
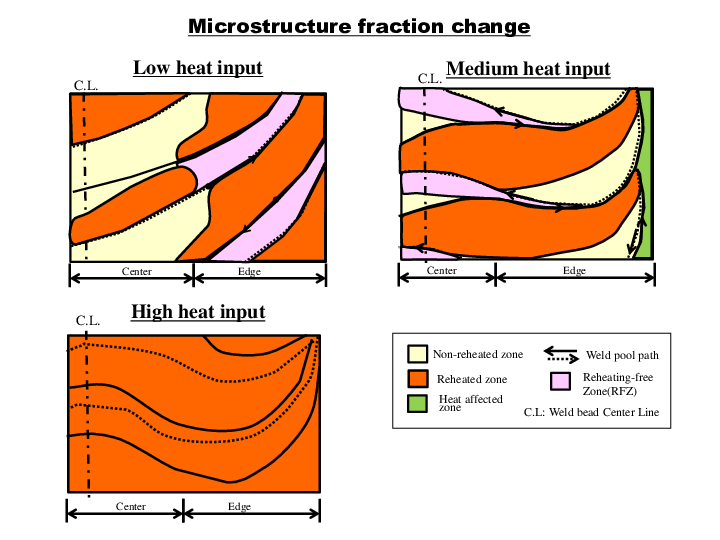
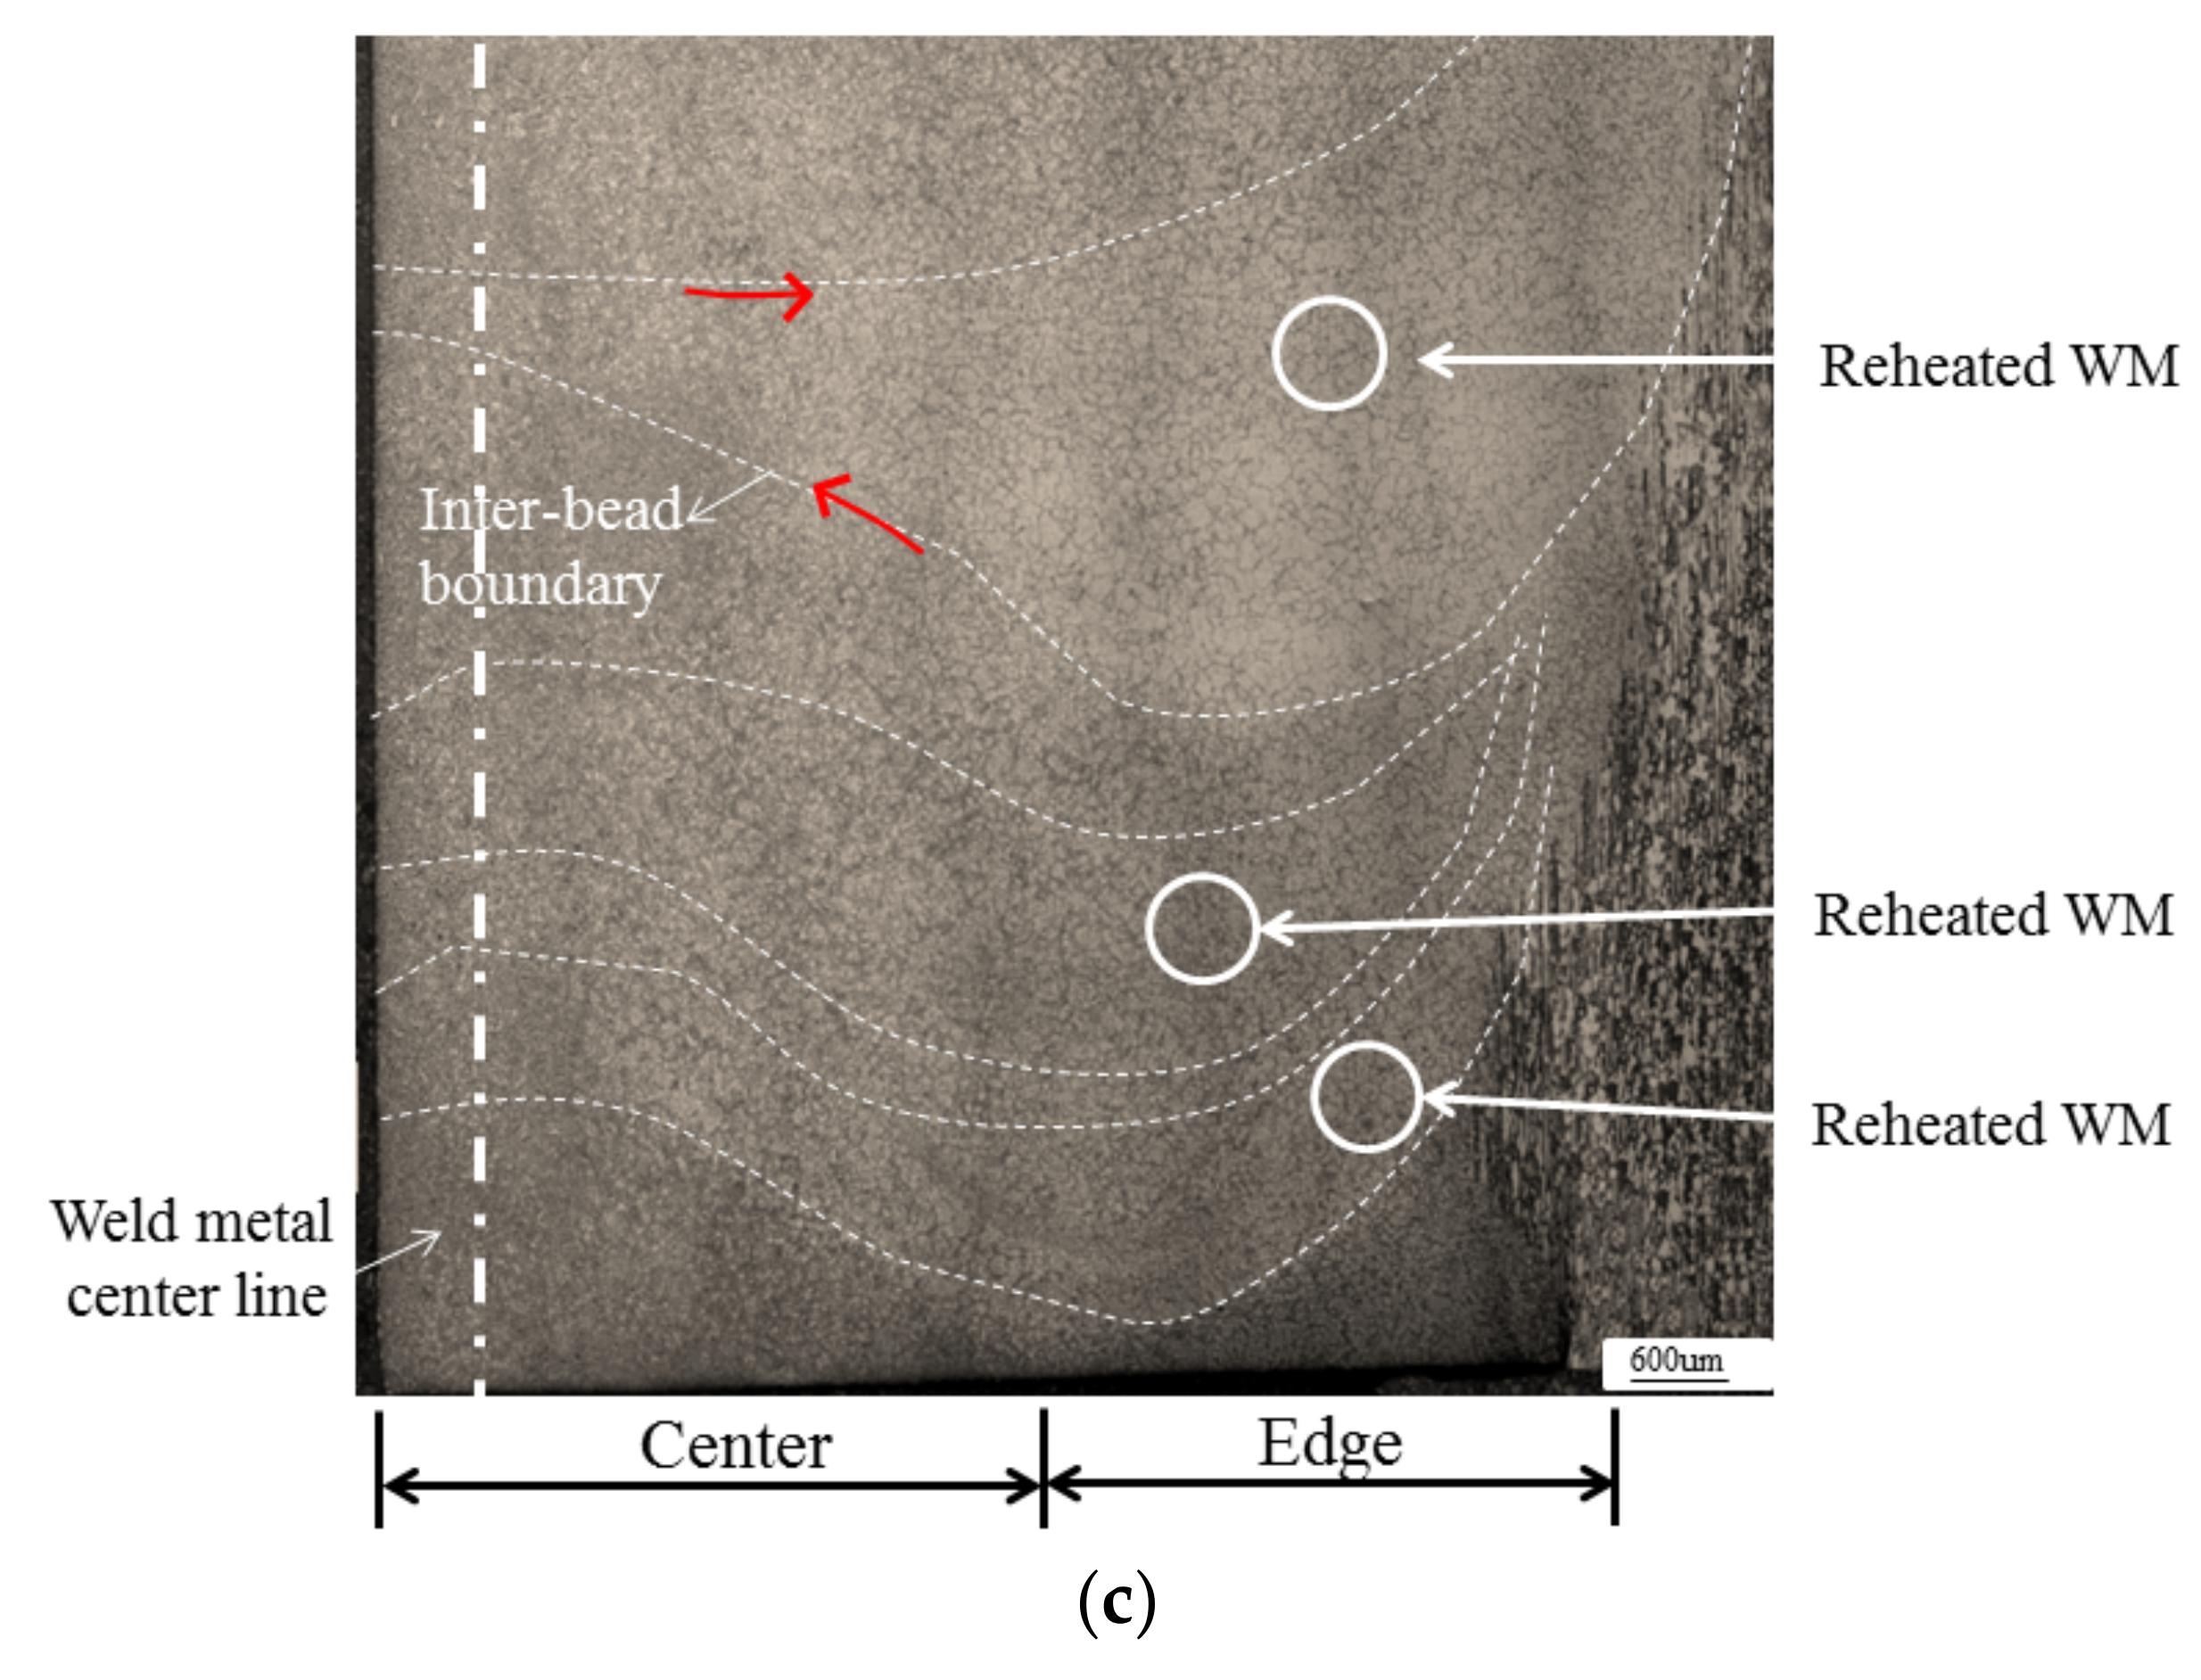
The microstructural analysis results indicate that reheated areas, non-reheated areas, and RFZ existed. Macroscopic inspection showed that low heat input and medium heat input cases were able to distinguish those categorized areas clearly. However, the high heat input case failed to provide much information due to the fact that it has only one area type, the reheated area.
3
The volume fraction of each area of reheated, non-reheated, and RFZ varied with the change in the bead width because of the size of the center molten pool and their interaction.
4
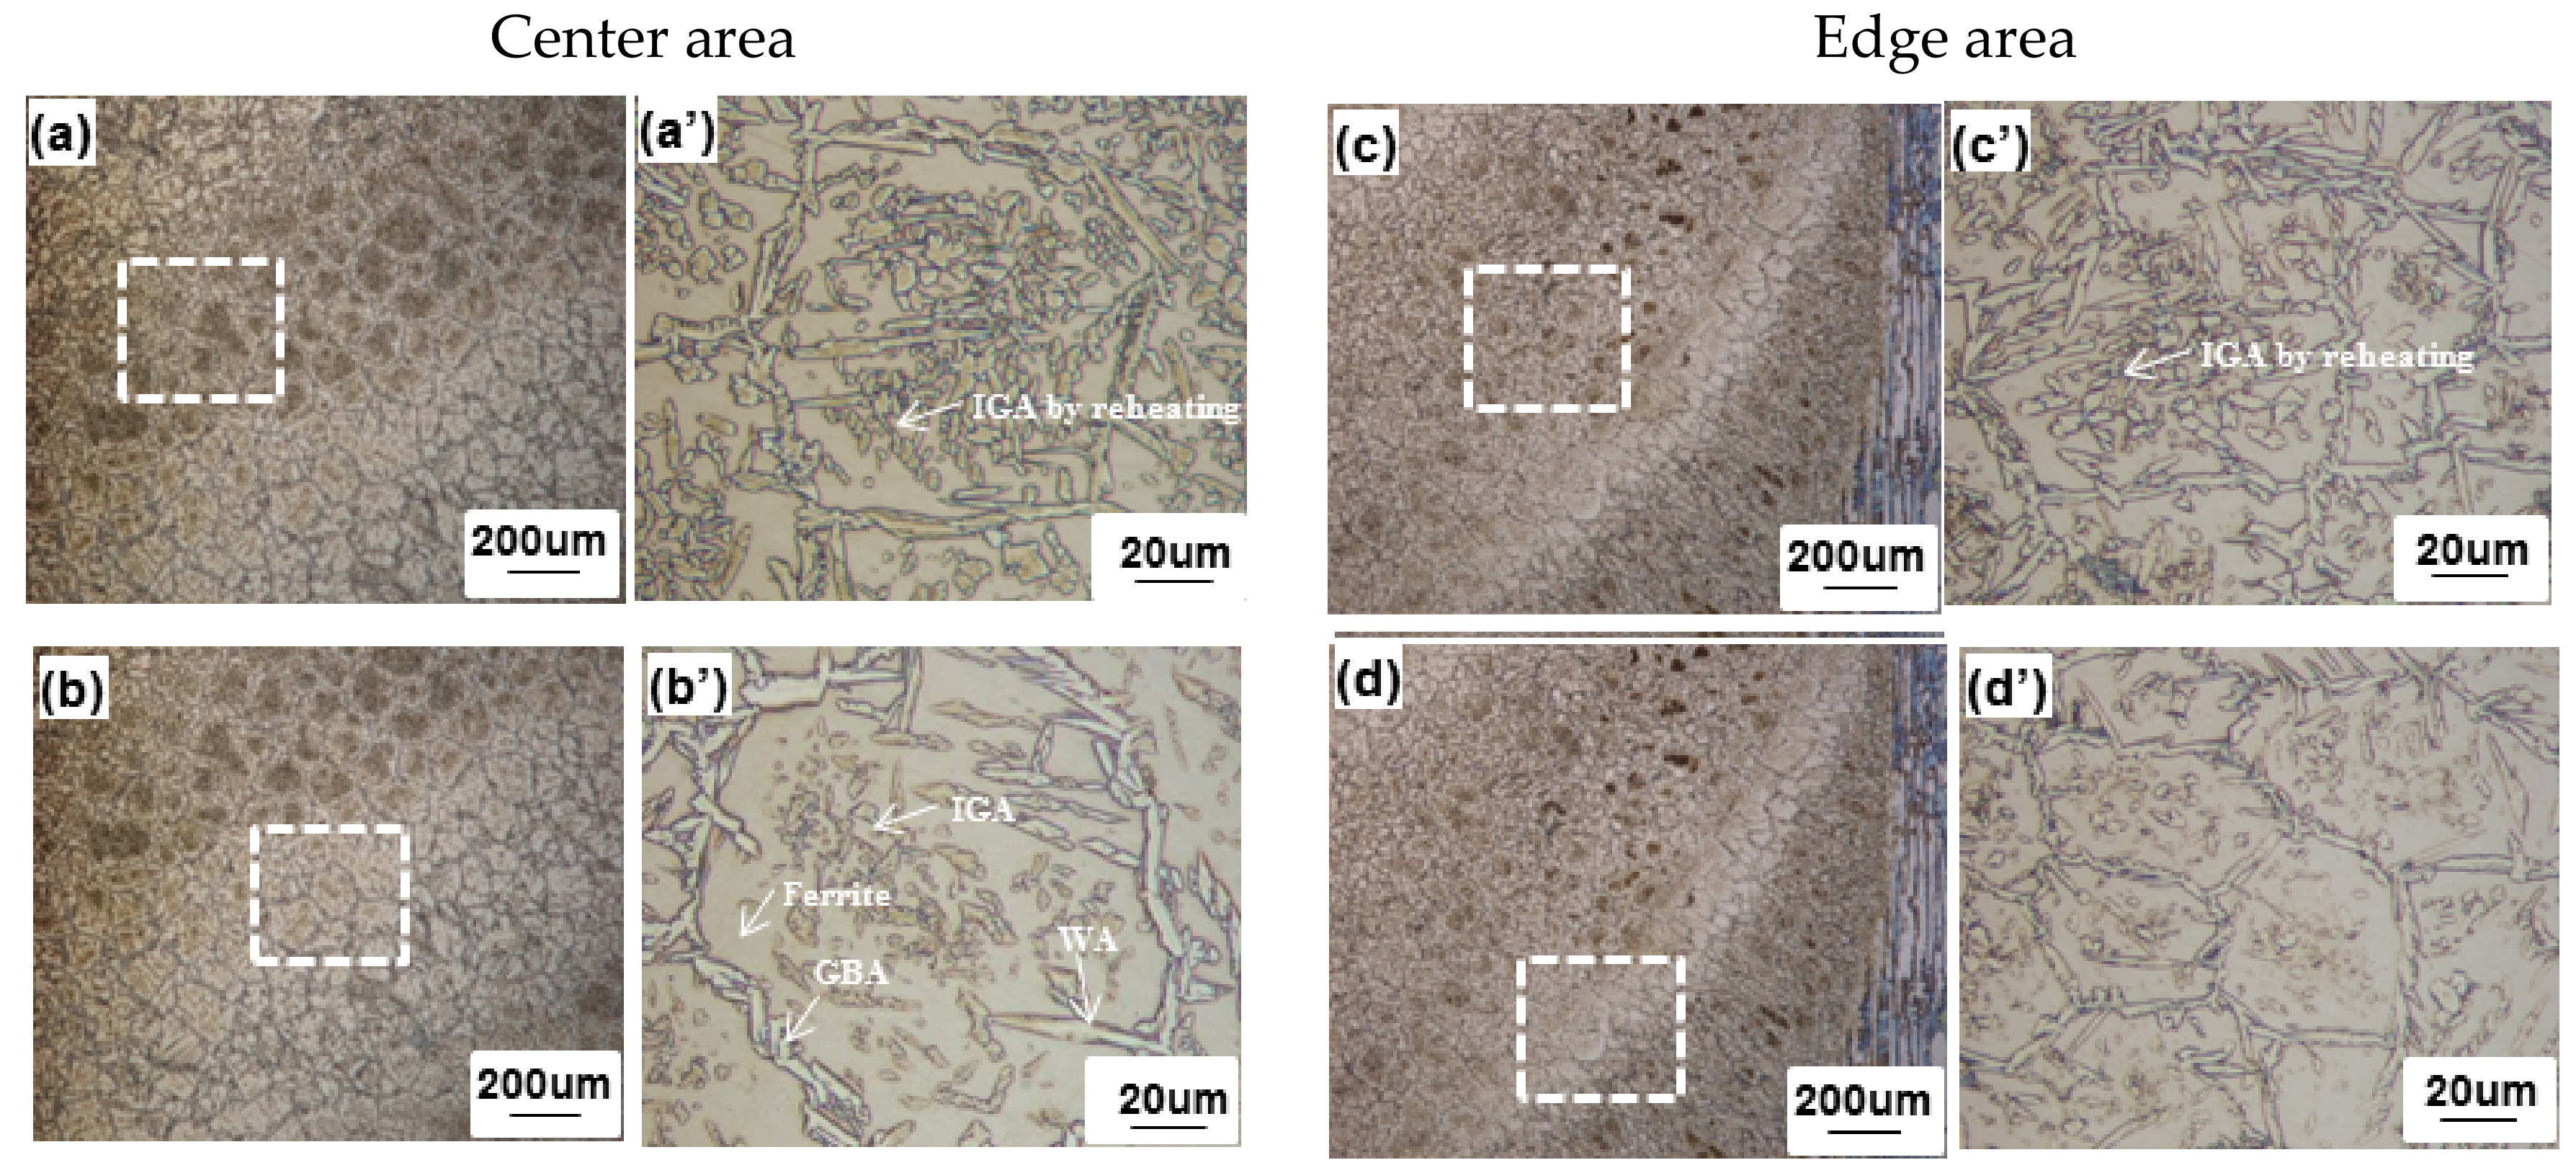
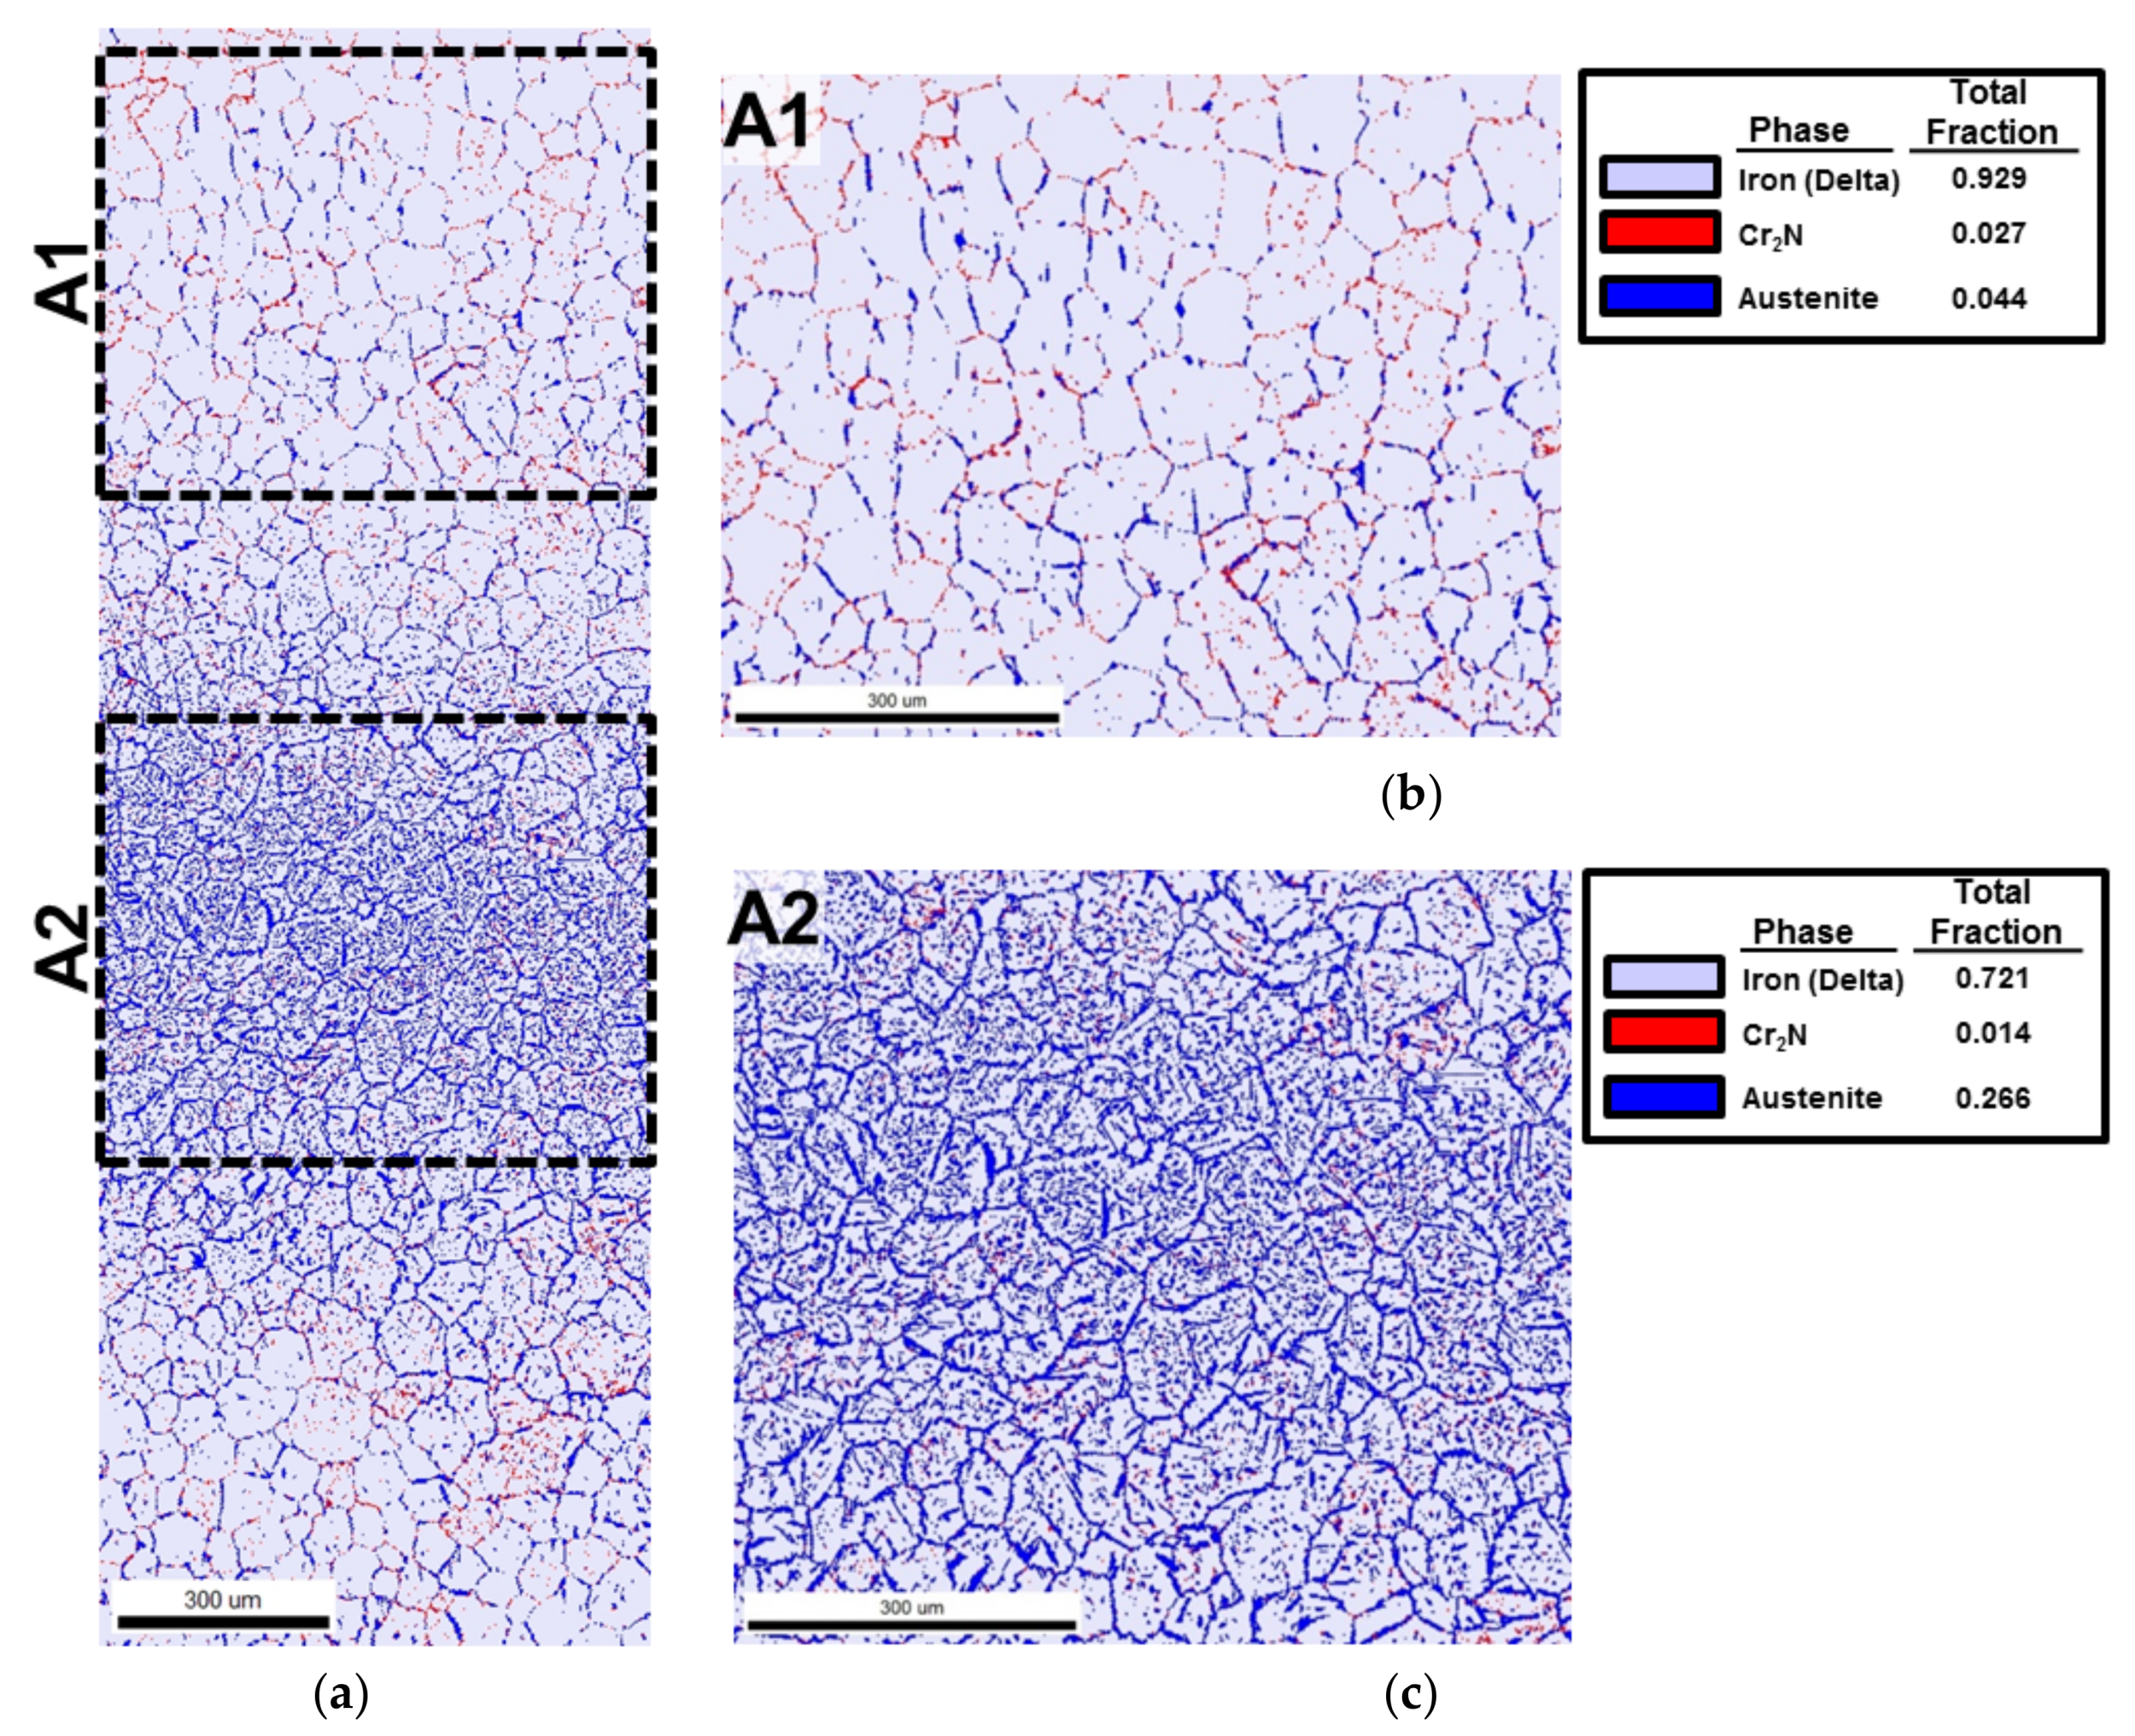
The Cr2N fraction was higher at the non-reheated areas while it was lower at the reheated areas, since it was considered that Cr2N was decreased by reheating.
5
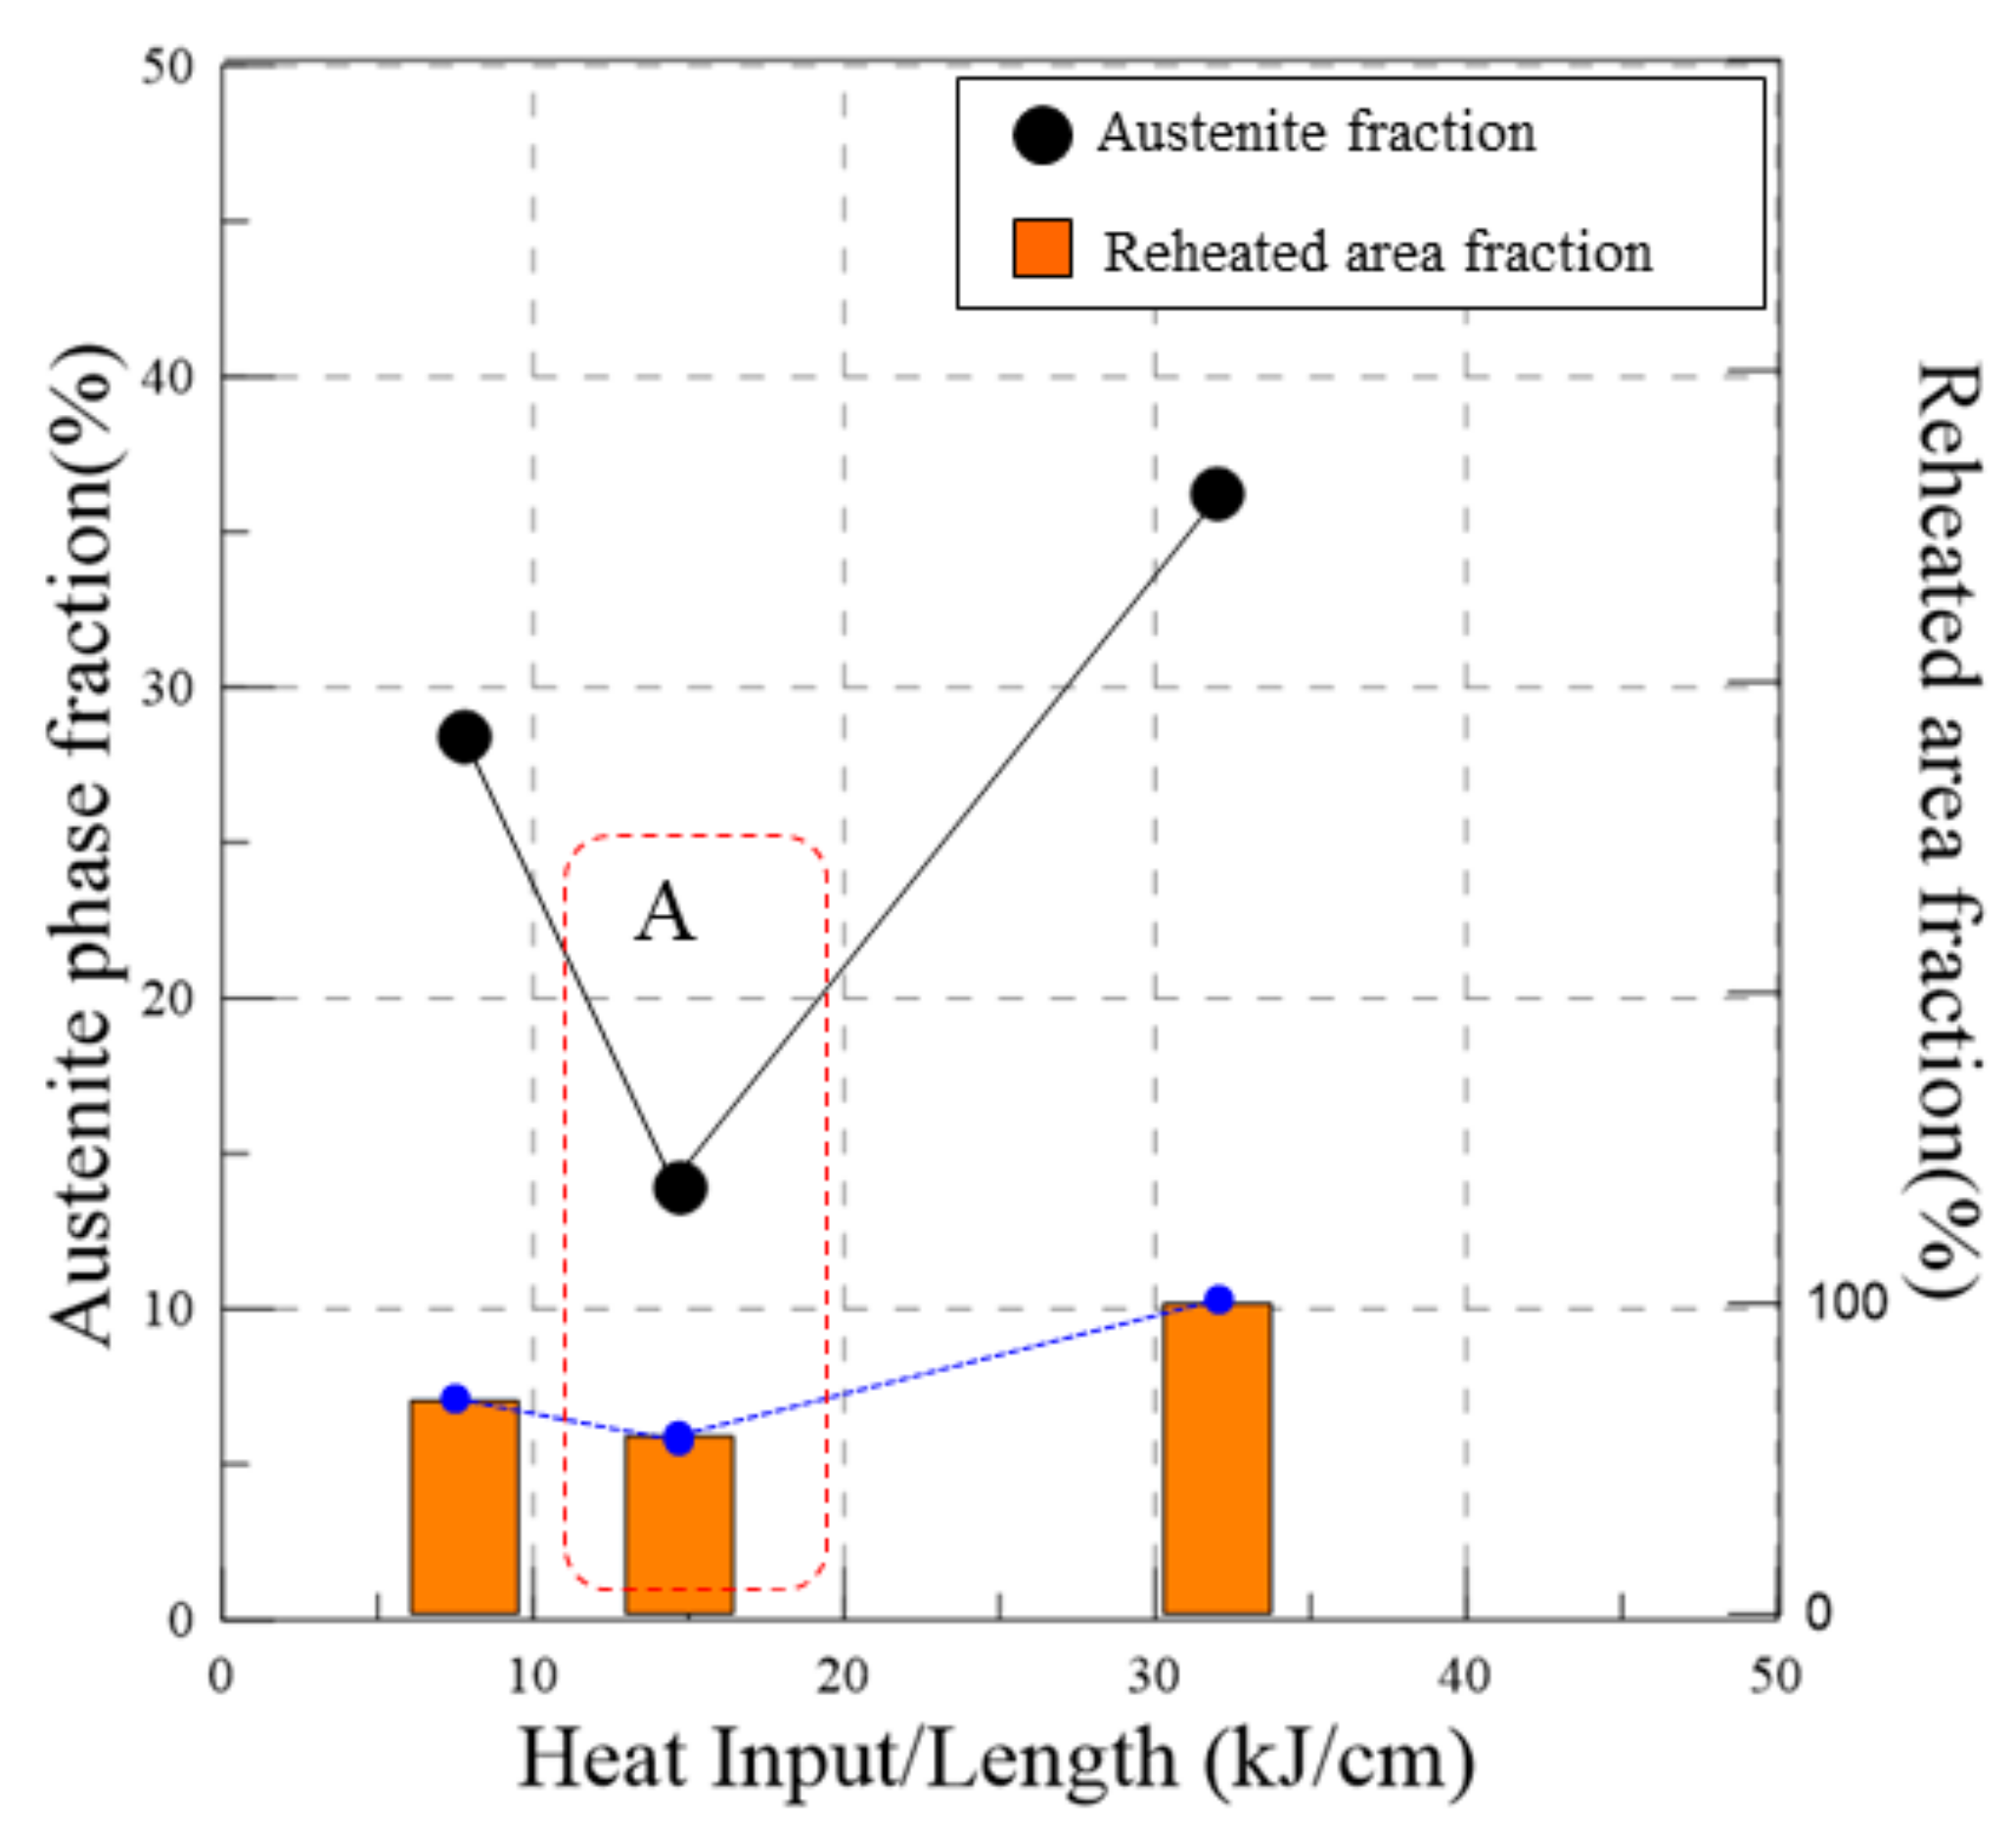
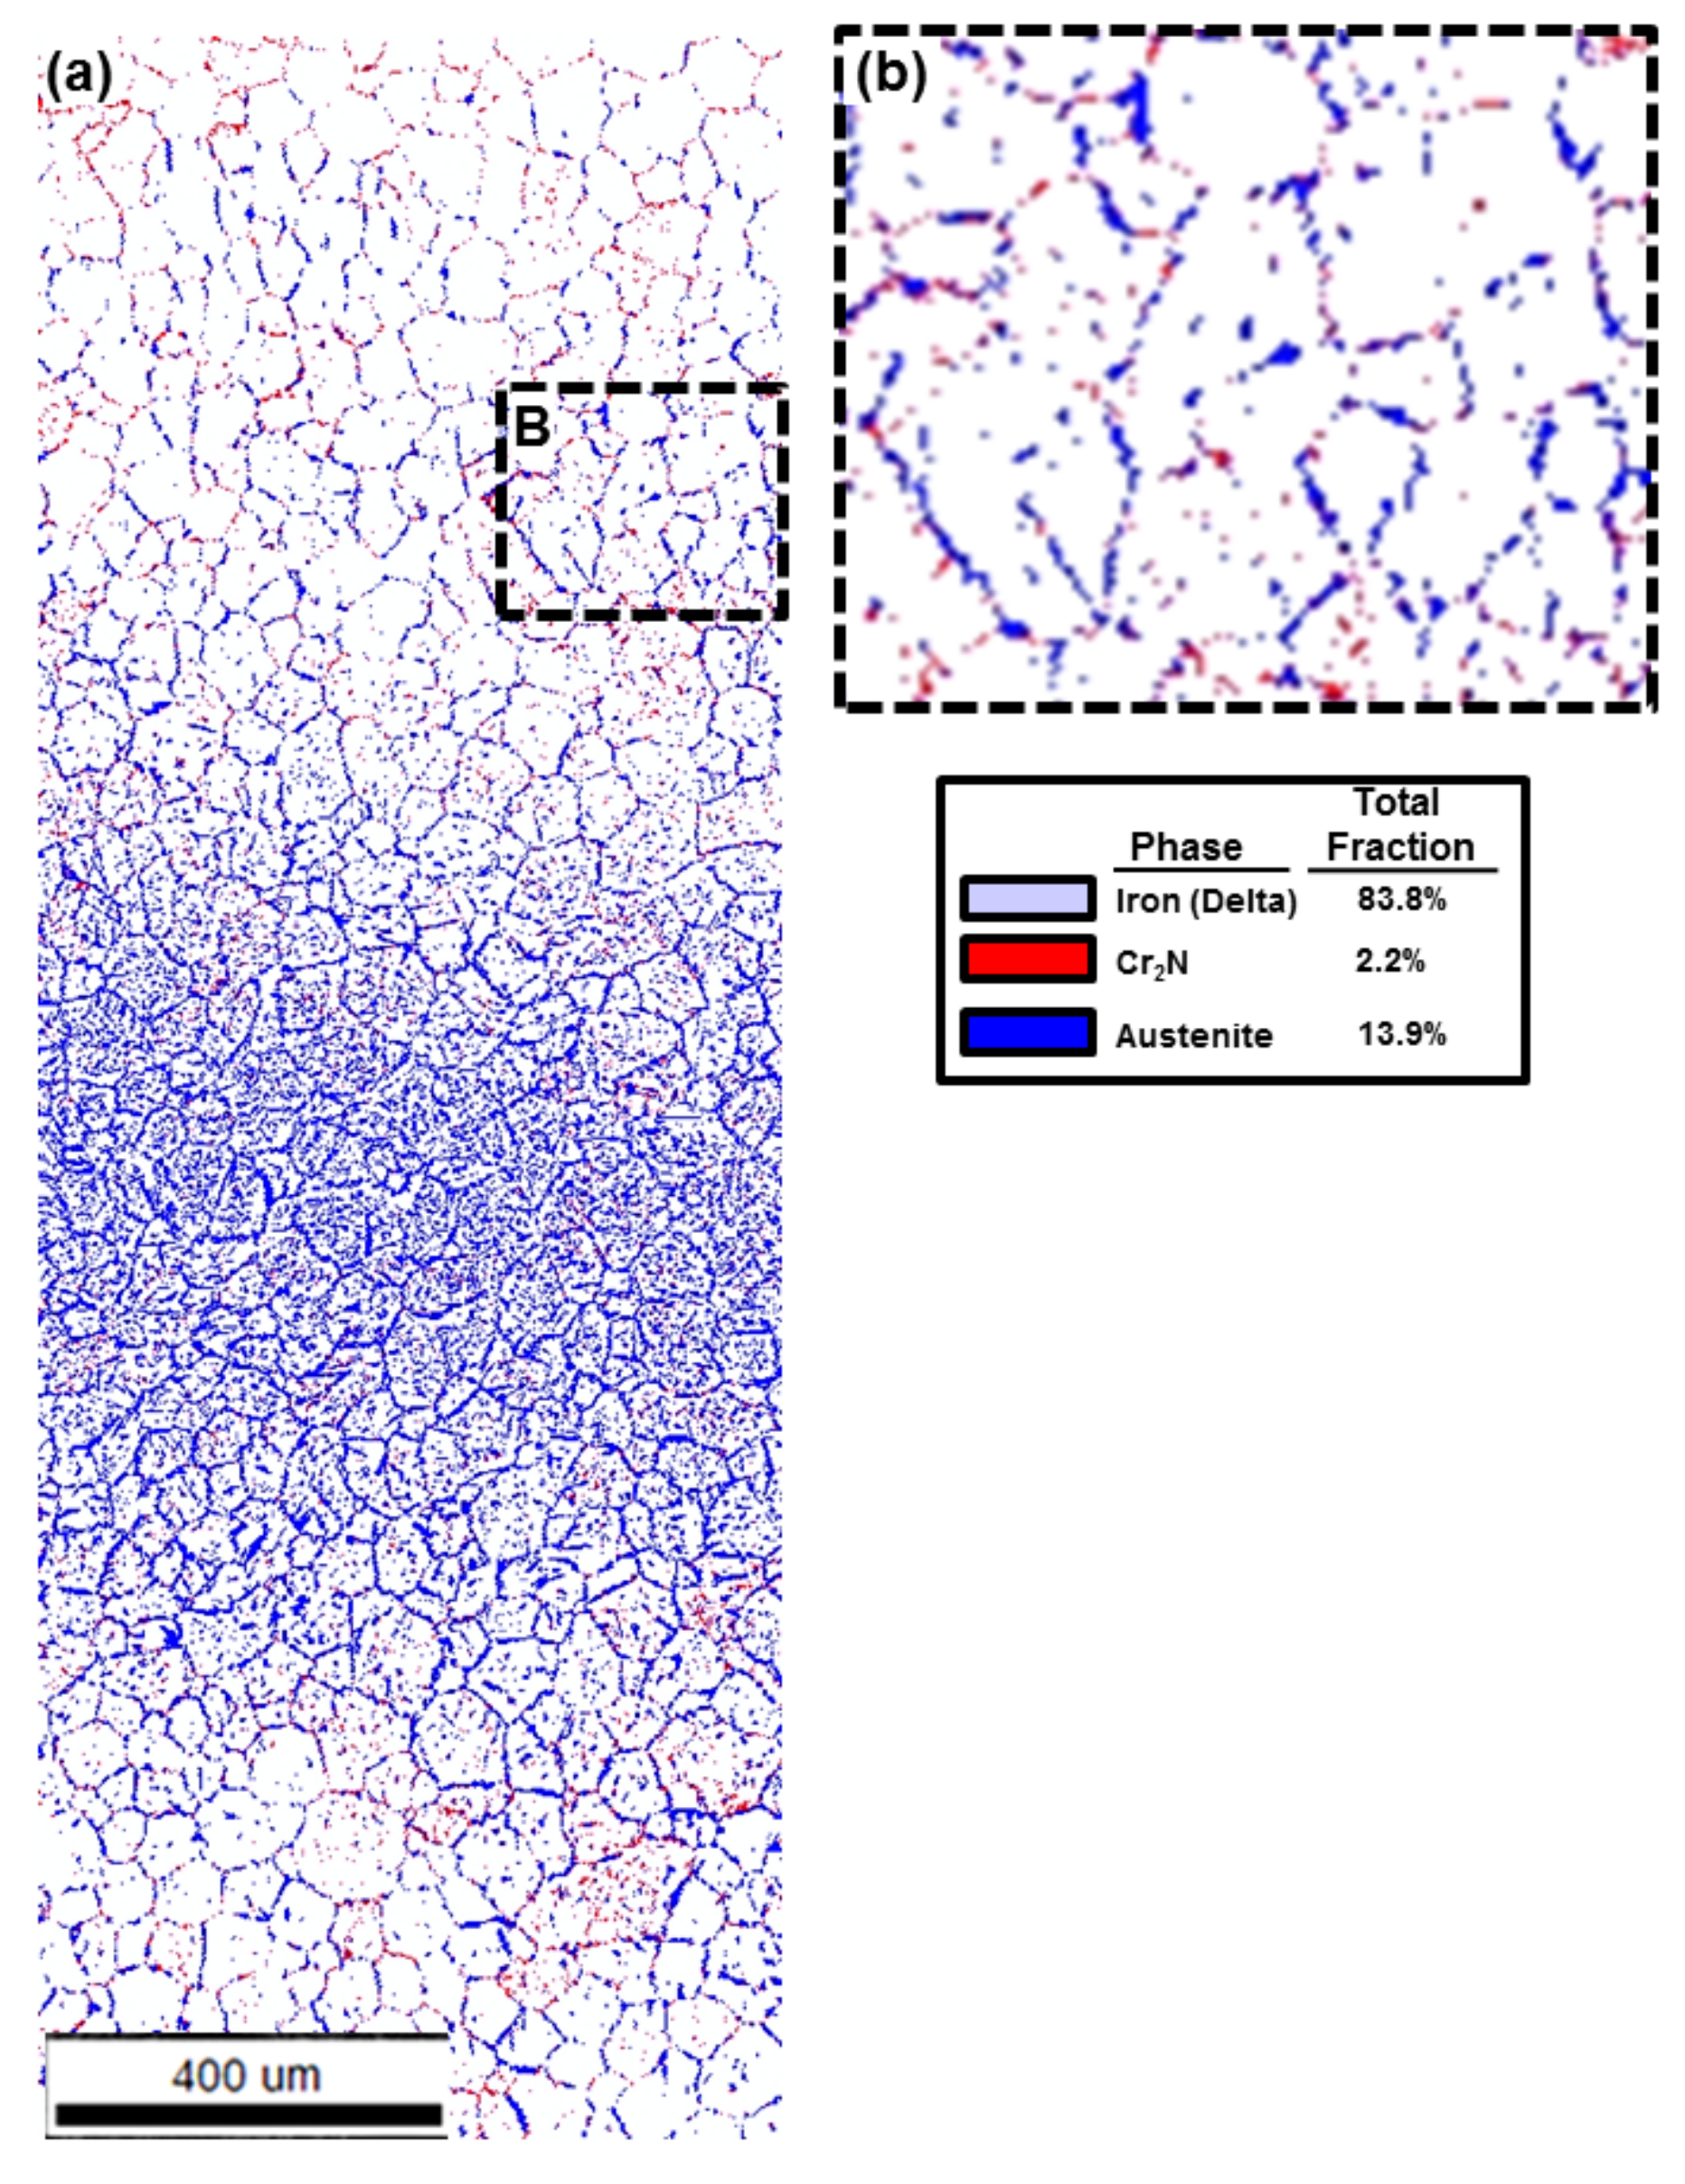
The edge EBSD results indicate that the austenite phase volume fraction of the low heat input was higher than that of the medium heat input. It described an inverse relationship, as expected. In this research, the determination of the austenite fraction was deeply related to the quantity of reheating rather than the heat input.

Author Contributions

Hee-Joon Sung, Hye-Sung Na, and Chung-Yun Kang conceived and designed the experiments; Hee-Joon Sung and Hye-Sung Na performed the experiments; Hee-Joon Sung, Hye-Sung Na, and Chung-Yun Kang analyzed the data; and Hee-Joon Sung wrote this paper.

Acknowledgments

This work was supported by a National Research Foundation of Korea (NRF) grant funded by the Korean government (MSIP) (No. 2012R1A5A1048294).

Conflicts of Interest

The founding sponsors had no role in the design of the study; in the collection, analyses, or interpretation of data; in the writing of the manuscript; or in the decision to publish the results.

References

  1. Sedriks, A.J. Effects of alloy composition and microstructure on the passivity of stainless steels. Corrosion 1986, 42, 376–389. [Google Scholar] [CrossRef]
  2. Bernhardsson, S. Duplex Stainless Steels’91; Charles, J., Bernhardsson, S., Eds.; Les Editions de Physique: Beaune, France, 1991; Volume 1, p. 185. [Google Scholar]
  3. Nilsson, J.-O. Super duplex stainless steels. Mater. Sci. Technol. 1992, 8, 685–700. [Google Scholar] [CrossRef]
  4. Luo, H.; Dong, C.F.; Li, X.G.; Xiao, K. The electrochemical behaviour of 2205 duplex stainless steel in alkaline solutions with different pH in the presence of chloride. Electrochim. Acta 2012, 64, 211–220. [Google Scholar] [CrossRef]
  5. Alvarez-Armas, I. Duplex stainless steels: Brief history and some recent alloys. Recent Pat. Mech. Eng. 2008, 1, 51–57. [Google Scholar] [CrossRef]
  6. Messer, B.; Wright, A.; Oprea, V. Duplex Stainless Steel Welding. Best Practices; Fluor Canada Ltd.: Calgary, AB, Canada, 2007; Volume 11, pp. 45–63. [Google Scholar]
  7. Calliari, I.; Bassani, P.; Brunelli, K.; Breda, M.; Ramous, E. Effect of continuous cooling on secondary phase precipitation in the super duplex stainless steel ZERON-100. J. Mater. Eng. Perform. 2013, 22, 3860–3866. [Google Scholar] [CrossRef]
  8. Verma, J.; Taiwade, R.V. Effect of welding processes and conditions on the microstructure, mechanical properties and corrosion resistance of duplex stainless steel weldments—A review. J. Manuf. Process. 2017, 25, 134–152. [Google Scholar] [CrossRef]
  9. Deng, B.; Jiang, Y.M.; Gao, J.; Li, J. Effect of annealing treatment on microstructure evolution and the associated corrosion behavior of a super-duplex stainless steel. J. Alloys Compd. 2010, 493, 461–464. [Google Scholar] [CrossRef]
  10. Cervo, R.; Ferro, P.; Tiziani, A. Annealing temperature effects on super duplex stainless steel UNS S32750 welded joints. I: Microstructure and partitioning of elements. J. Mater. Sci. 2010, 45, 4369–4377. [Google Scholar] [CrossRef]
  11. Chan, K.; Tjong, S. Effect of secondary phase precipitation on the corrosion behavior of duplex stainless steels. Materials 2014, 7, 5268–5304. [Google Scholar] [CrossRef] [PubMed]
  12. Angelini, E.; De Benedetti, B.; Rosalbino, F. Microstructural evolution and localized corrosion resistance of an aged superduplex stainless steel. Corros. Sci. 2004, 46, 1351–1367. [Google Scholar] [CrossRef]
  13. Dominguez-Aguilar, M.A.; Newman, R.C. Detection of deleterious phases in duplex stainless steel by weak galvanostatic polarization in halide solutions. Corros. Sci. 2006, 48, 2577–2591. [Google Scholar] [CrossRef]
  14. Ramirez, A.J.; Lippold, J.C.; Brandi, S.D. The relationship between chromium nitride and secondary austenite precipitation in duplex stainless steels. Metall. Mater. Trans. A 2003, 34, 1575–1597. [Google Scholar] [CrossRef]
  15. Zhang, Z.; Jing, H.; Xu, L.; Han, Y.; Gao, Z.; Zhao, L.; Zhang, J. Microstructural characterization and electron backscatter diffraction analysis across the welded interface of duplex stainless steel. Appl. Surf. Sci. 2017, 413, 327–343. [Google Scholar] [CrossRef]
  16. Pettersson, N.; Pettersson, R.F.A.; Wessman, S. Precipitation of chromium nitrides in the super duplex stainless steel 2507. Metall. Mater. Trans. A 2015, 46, 1062–1072. [Google Scholar] [CrossRef]
  17. Kim, S.-T.; Lee, I.-S.; Kim, J.-S.; Jang, S.-H.; Park, Y.-S.; Kim, K.-T.; Kim, Y.-S. Investigation of the localized corrosion associated with phase transformation of tube-to-tube sheet welds of hyper duplex stainless steel in acidified chloride environments. Corros. Sci. 2012, 64, 164–173. [Google Scholar] [CrossRef]
  18. Zhang, S.; Jiang, Z.; Li, H.; Feng, H.; Zhang, B. Detection of susceptibility to intergranular corrosion of aged super austenitic stainless steel S32654 by a modified electrochemical potentiokinetic reactivation method. J. Alloys Compd. 2017, 695, 3083–3093. [Google Scholar] [CrossRef]
  19. Ha, H.; Kwon, H. Effects of Cr2N on the pitting corrosion of high nitrogen stainless steels. Electrochim. Acta 2007, 52, 2175–2180. [Google Scholar] [CrossRef]
  20. Nilsson, J.O.; Wilson, A. Influence of isothermal phase transformations on toughness and pitting corrosion of SDSS SAF 2507. Mater. Sci. Technol. 2013, 9, 545–554. [Google Scholar] [CrossRef]
  21. Eleonora Bettini, U.K.; Leygraf, C.; Pan, J. Study of corrosion behavior of a 2507 SDSS: Influence of quenched-in and isothermal nitrides. Int. J. Electrochem. Sci. 2014, 9, 61–80. [Google Scholar]
  22. Liao, J. Nitride Precipitation in weld HAZs of a duplex stainless steel. ISIJ Int. 2001, 41, 460–467. [Google Scholar] [CrossRef]
  23. Nilsson, J.-O.; Huhtala, T.; Jonsson, P.; Karlsson, L.; Wilson, A. Structural stability of super duplex stainless weld metals and its dependence on tungsten and copper. Metall. Mater. Trans. A 1996, 27, 2196–2208. [Google Scholar] [CrossRef]
  24. Devendranath Ramkumar, K.; Mishra, D.; Ganesh Raj, B.; Vignesh, M.K.; Thiruvengatam, G.; Sudharshan, S.P.; Arivazhagan, N.; Sivashanmugam, N.; Rabel, A.M. Effect of optimal weld parameters in the microstructure and mechanical properties of autogeneous gas tungsten arc weldments of super-duplex stainless steel UNS S32750. Mater. Des. (1980–2015) 2015, 66, 356–365. [Google Scholar] [CrossRef]
  25. Eghlimi, A.; Shamanian, M.; Raeissi, K. Effect of current type on microstructure and corrosion resistance of super duplex stainless steel claddings produced by the gas tungsten arc welding process. Surf. Coat. Technol. 2014, 244, 45–51. [Google Scholar] [CrossRef]
  26. Hosseini, V.A.; Wessman, S.; Hurtig, K.; Karlsson, L. Nitrogen loss and effects on microstructure in multipass TIG welding of a SDSS. Mater. Des. 2016, 98, 88–97. [Google Scholar] [CrossRef]
  27. Hosseini, V.A.; Bermejo, M.A.V.; Gårdstam, J.; Hurtig, K.; Karlsson, L. Influence of multiple thermal cycles on microstructure of heat-affected zone in TIG-welded super duplex stainless steel. Weld. World 2016, 60, 233–245. [Google Scholar] [CrossRef]
  28. Shockley, J.M.; Horton, D.J.; Wahl, K.J. Effect of aging of 2507 super duplex stainless steel on sliding tribocorrosion in chloride solution. Wear 2017, 380–381, 251–259. [Google Scholar] [CrossRef]
  29. Sung, H.-J.; Na, H.-S.; Kang, C.-Y. Effect of Dynamic Reheating Induced by Weaving on the Microstructure of GTAW Weld Metal of 25% Cr Super Duplex Stainless Steel Weld Metal. Metals 2017, 7, 490. [Google Scholar] [CrossRef]
  30. VernotLoier, C.; Cortial, F.; Buchon, A.; Corrieu, J.M. Feasibility of heavy section pieces made of X 2 Cr Ni Mo N 25-7-4 superduplex steel. Mater. Sci. Eng. A 1996, 211, 104–116. [Google Scholar] [CrossRef]
  31. Dabala, M.; Calliari, I.; Variola, A. Corrosion behavior of a superduplex stainless steel in chloride aqueous solution. J. Mater. Eng. Perform. 2004, 13, 237–240. [Google Scholar] [CrossRef]
  32. Cervo, R.; Ferro, P.; Tiziani, A. Annealing temperature effects on superduplex stainless steel UNS S32750 welded joints. II: Pitting corrosion resistance evaluation. J. Mater. Sci. 2010, 45, 4378–4389. [Google Scholar] [CrossRef]
  33. Chul, S.J. Weld Camera YouTube, 27 June 2016. Available online: https://www.youtube.com/watch?v=3mpyWP9OKGo (accessed on 30 September 2017).
  34. Garzon, C.; Ramirez, A. Growth kinetics of secondary austenite in the welding microstructure of a UNS S32304 duplex stainless steel. Acta Mater. 2006, 54, 3321–3331. [Google Scholar] [CrossRef]
  35. Sieurin, H.; Sandström, R. Austenite reformation in the heat-affected zone of duplex stainless steel 2205. Mater. Sci. Eng. A 2006, 418, 250–256. [Google Scholar] [CrossRef]
  36. Poorhaydari, K.; Patchett, B.-M.; Ivey, G. Estimation of Cooling Rate in the Welding of Plates with Intermediate Thickness. Weld. J. 2005, 38, 149-s–155-s. [Google Scholar]
Figure 1. Schematic of bead-on-pipe welding.
Metals 08 00312 g001
Figure 2. Bead appearance and schematic of molten pool movement by weaving: bead surface (a) Low heat input; (b) medium heat input; (c) high heat input; schematic diagram of (d) low heat input; (e) medium heat input; and (f) high heat input.
Metals 08 00312 g002
Figure 3. Cross section of different heat inputs: (a) low heat input (bead width 8.8 mm); (b) medium heat input (bead width 14.2 mm); and (c) high heat input (bead width 20.5 mm).
Metals 08 00312 g003
Figure 4. Region map on the macro of top view from location ‘A’, ’B’, ’C’ from Figure 2a–c: (a) low heat input; (b) medium heat input; and (c) high heat input.
Metals 08 00312 g004aMetals 08 00312 g004b
Figure 5. Microstructural analysis at the edge and the center of weld metal of low heat input; the center: (a,a’) reheated weld metal (WM); (b,b’) non-reheated WM; the edge: (c,c’) reheated WM; and (d,d’) reheating-free zone.
Metals 08 00312 g005
Figure 6. Microstructural analysis at the edge and the center of weld metal of medium heat input; the center: (a,a’) reheated WM; (b,b’) reheating-free zone; (c,c’) non-reheated WM; the edge: (d,d’) reheated WM; (e,e’) reheating-free zone; and (f,f’) non-reheated WM.
Metals 08 00312 g006
Figure 7. Microstructural analysis at the edge and the center of weld metal of high heat input; (a,a’) Reheated WM at the center; (b,b’) Reheated WM at the edge.
Metals 08 00312 g007
Figure 8. Schematic region map with the typical microstructure on the macroscopic of top view: (a) low heat input; (b) medium heat input; and (c) high heat input.
Metals 08 00312 g008
Figure 9. Electron backscatter diffraction (EBSD) results at the edge of the low heat input weld: (a) phase map; and (b) magnification at location ‘A’ of (a).
Metals 08 00312 g009
Figure 10. EBSD results at the edge of the medium heat input weld: (a) phase map; and (b) magnification at location ‘B’ of (a).
Metals 08 00312 g010
Figure 11. EBSD results at the edge of high heat input weld: (a) phase map; and (b) magnification at location ‘C’ of (a).
Metals 08 00312 g011
Figure 12. Schematic diagram of the non-reheated area, reheated area and reheating-free zone; (a) non-reheated area; (b) reheated area; and (c) reheating-free zone.
Metals 08 00312 g012aMetals 08 00312 g012b
Figure 13. Schematic diagram of bead creation with respect to the heat input and heat flow; (a) low heat input; (b) medium heat input; and (c) high heat input.
Metals 08 00312 g013
Figure 14. Area fraction variation with the welding heat input change; (a) center region; and (b) edge region.
Metals 08 00312 g014
Figure 15. Phase volume fraction and Gibbs free energy diagram versus temperature calculated by Thermo-CalcTM (Version 6.0, TCW5, Database: TCFE6, Thermo-Calc Software, Stockholm, Sweden): (a) Phase volume fraction; and (b) Gibbs energy.
Metals 08 00312 g015
Figure 16. EBSD results at non-reheated areas and reheated areas of medium HI conditions from Figure 10; (a) location of non-reheated and reheated areas; (b) non-reheated area; and (c) reheated area.
Metals 08 00312 g016
Figure 17. Comparison of the austenite fraction and the reheated area fraction at the edge area.
Metals 08 00312 g017
Table 1. Chemical composition of the base metal and welding wire.
MaterialChemical Composition (wt. %)PREN 3
CSiMnCrNiMoNOther
Base metal 1 (UNS S32750)0.0220.230.6425.56.73.520.26Cu: 0.1642.8
Welding wire 2 (AWS ER2594)0.010.410.3825.09.53.930.24-42.1
1 Diameter: 168 mm, thickness: 7.11 mm; 2 AWS A5.9, diameter: 2.4 mm; 3 PREN: wt. % Cr + 3.3 × wt. % Mo + 16 × wt. % N.
Table 2. Mechanical properties of the base metal and weld metal.
MaterialStrength (MPa)El. (%)Absorbed Energy (J)Ferrite Content (%) 1
Y.S.T.S.
Base metal (UNS S32750)561–625812–85634–42120–231 @ −51 °C47.61–50.46
Welding wire (AWS A5.9 ER2594)68587430181–194 @ −50 °C44
1 Ferrite content was measured by ASTM E562.
Table 3. Welding conditions of bead-on-pipe single-pass welding.
Cond.Current (A)Voltage (V)Welding Speed (cm/min)Heat Input (kJ/cm)Bead Width (mm)
Low97118.37.88.8
Medium97114.414.714.2
High97112.032.020.5
Table 4. Summary of phase fractions at the edge of the weld under several welding conditiosn from the EBSD results.
Volume Fraction LocationFerrite Phase (Volume %)Austenite Phase (Volume %)Cr2N (Volume %)
Low HI70.728.40.9
Medium HI83.813.92.2
High HI63.136.20.7
Table 5. Summary of phase fractions at the center and the edge of the weld of the medium heat input from the EBSD result.
Phase Volume
Fraction (%)
Location
EdgeCenter
PhaseNon-Reheated (WM)Reheated (WM)Non-Reheated (WM)Reheated (WM)
Ferrite92.972.177.267.2
Austenite4.426.621.732.3
Cr2N2.71.40.110.04

