Vibration Fatigue Damage Accumulation of Ti–6Al–4V under Constant and Sequenced Variable Loading Conditions

Abstract
:1. Introduction
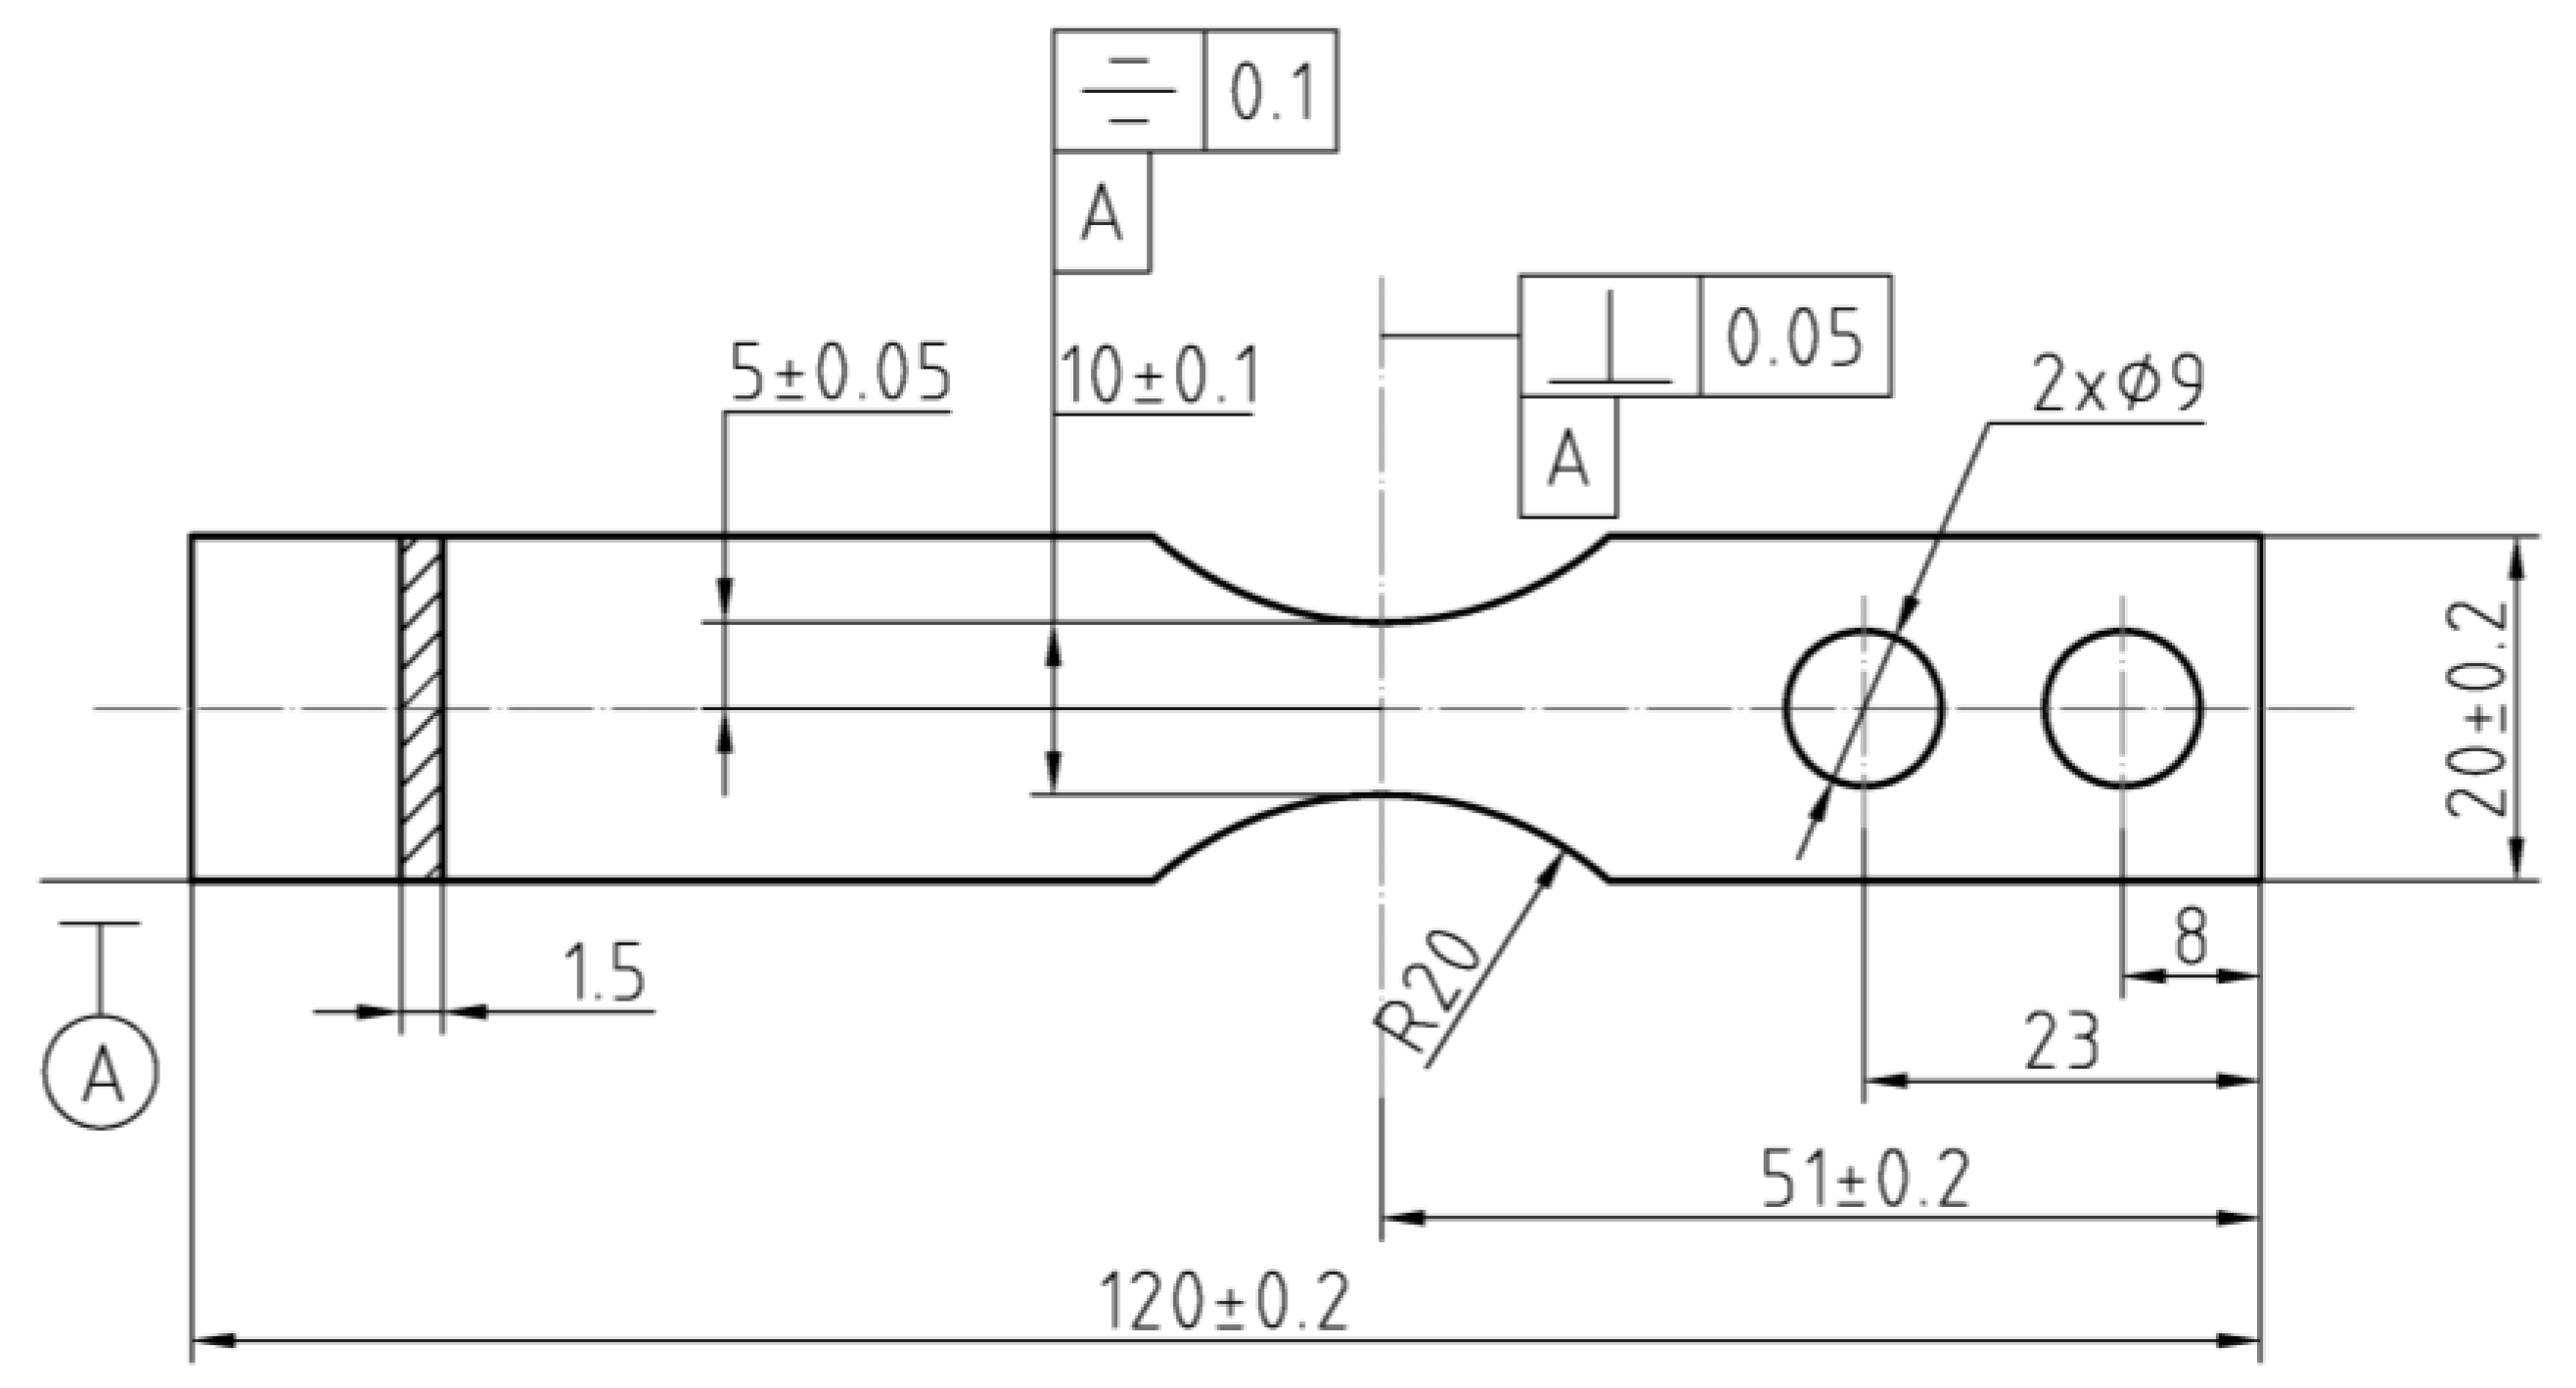
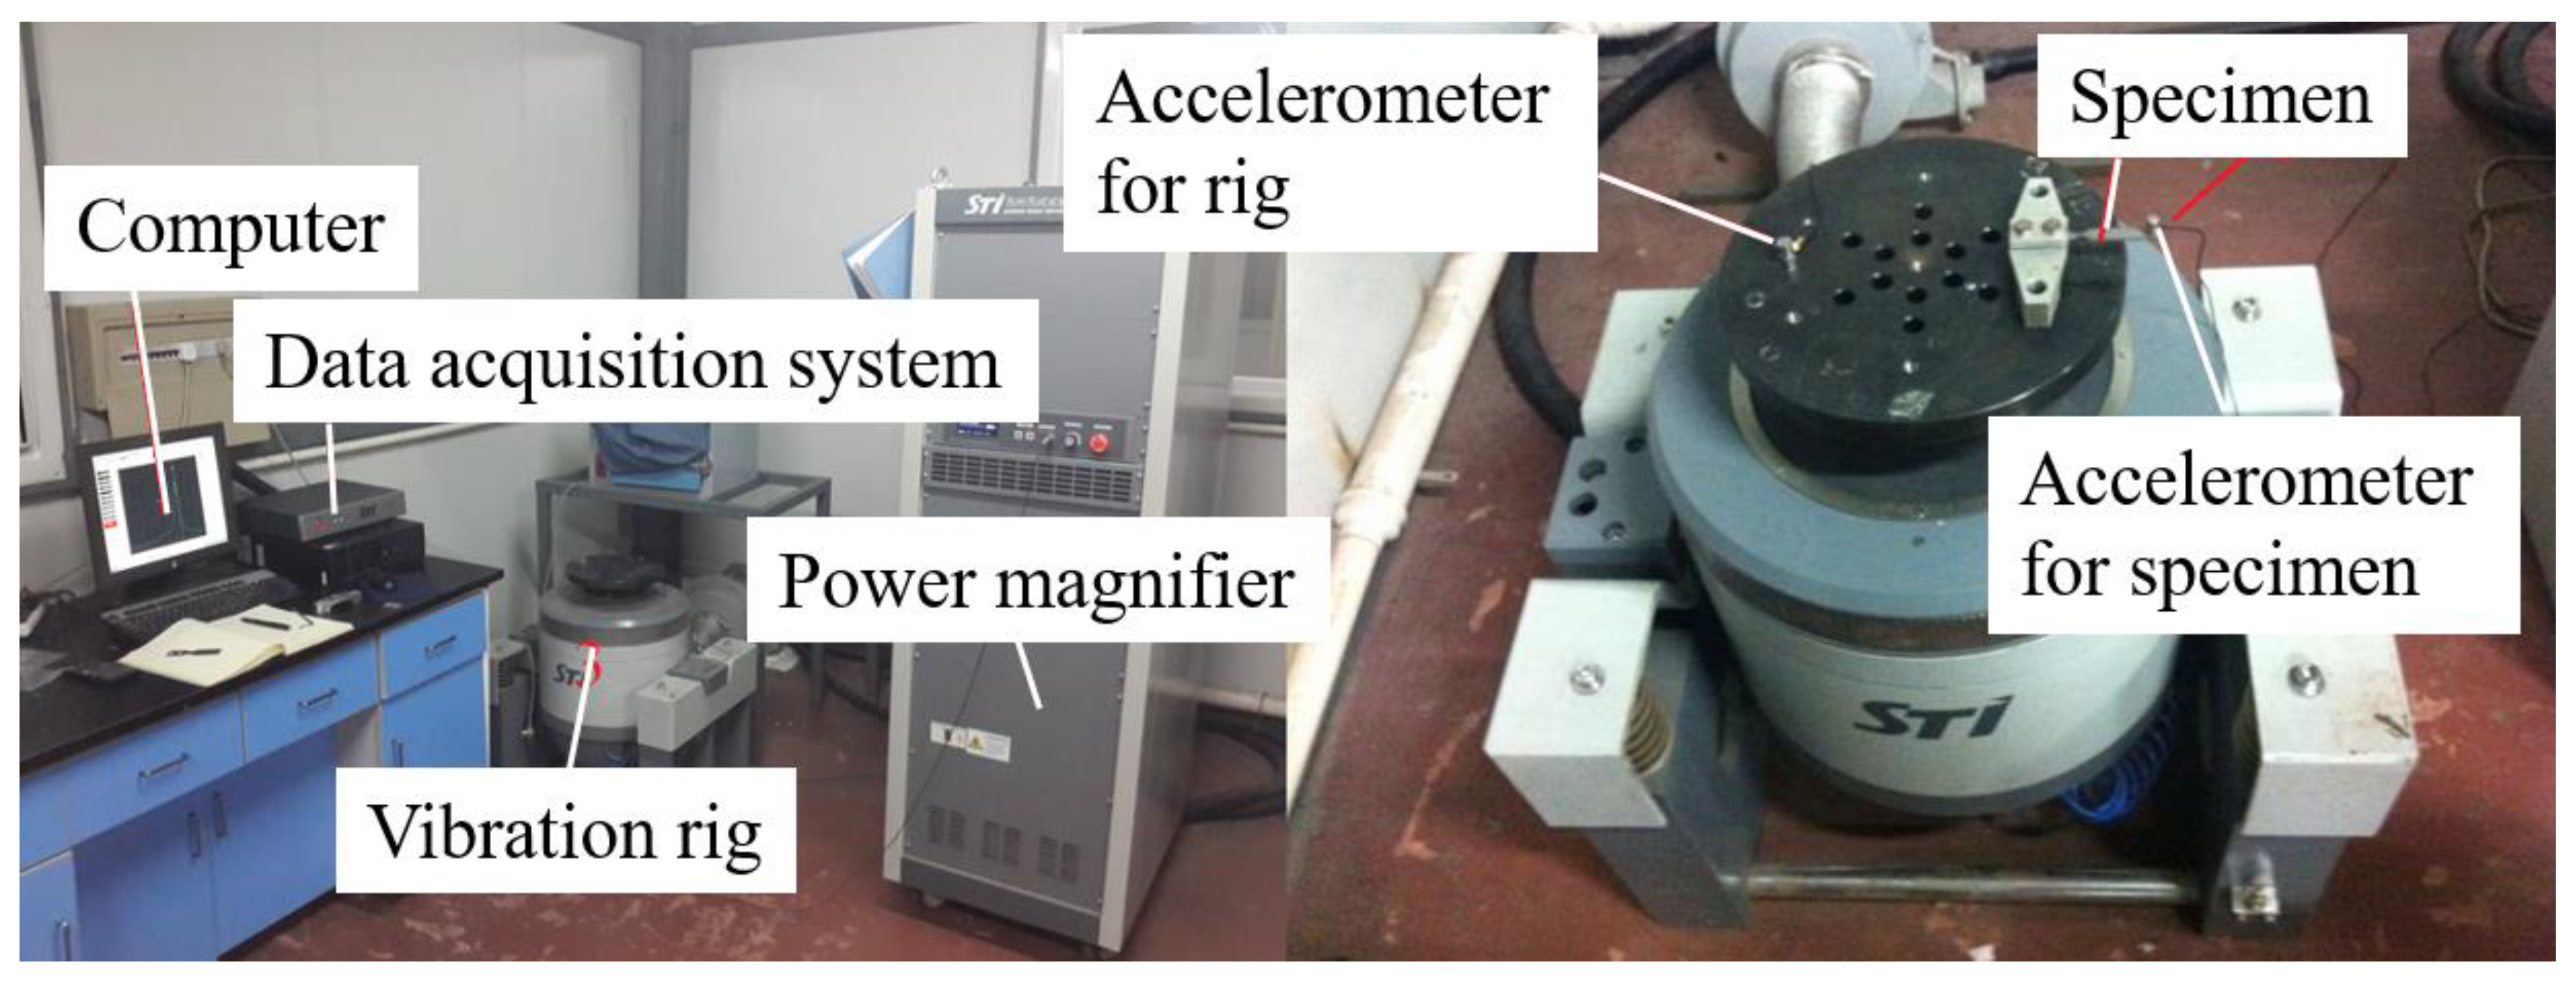
2. Experiments
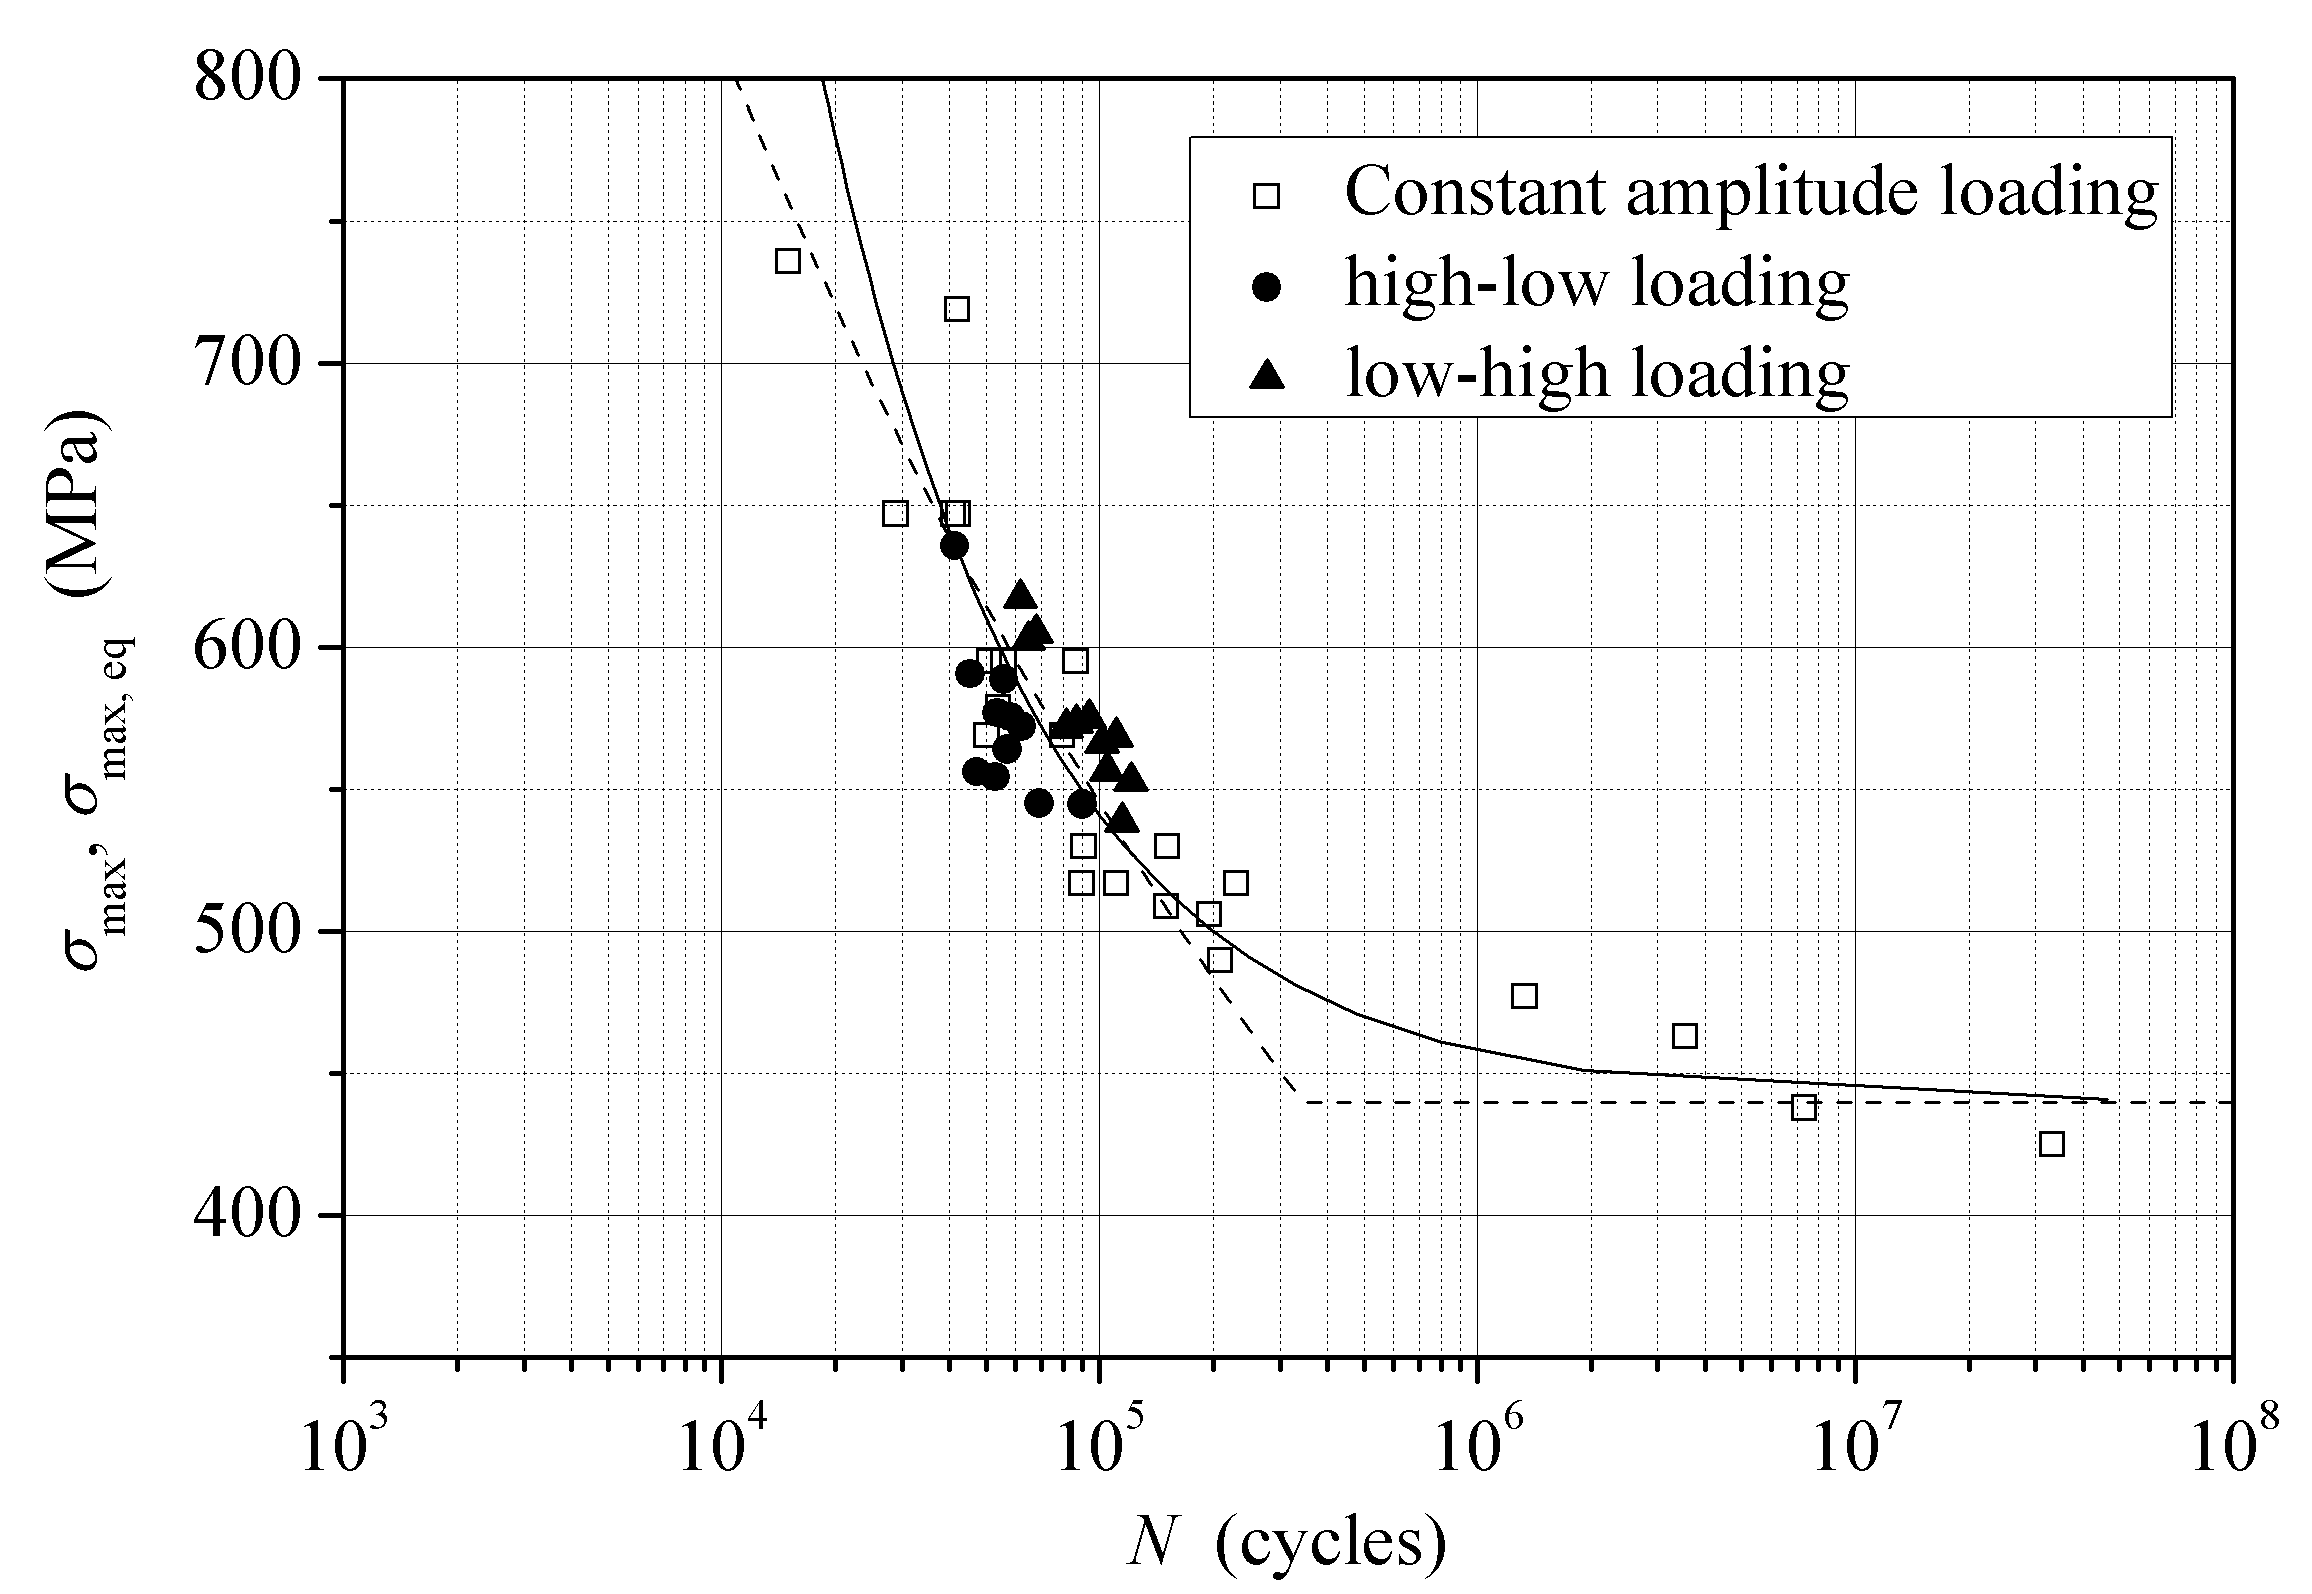
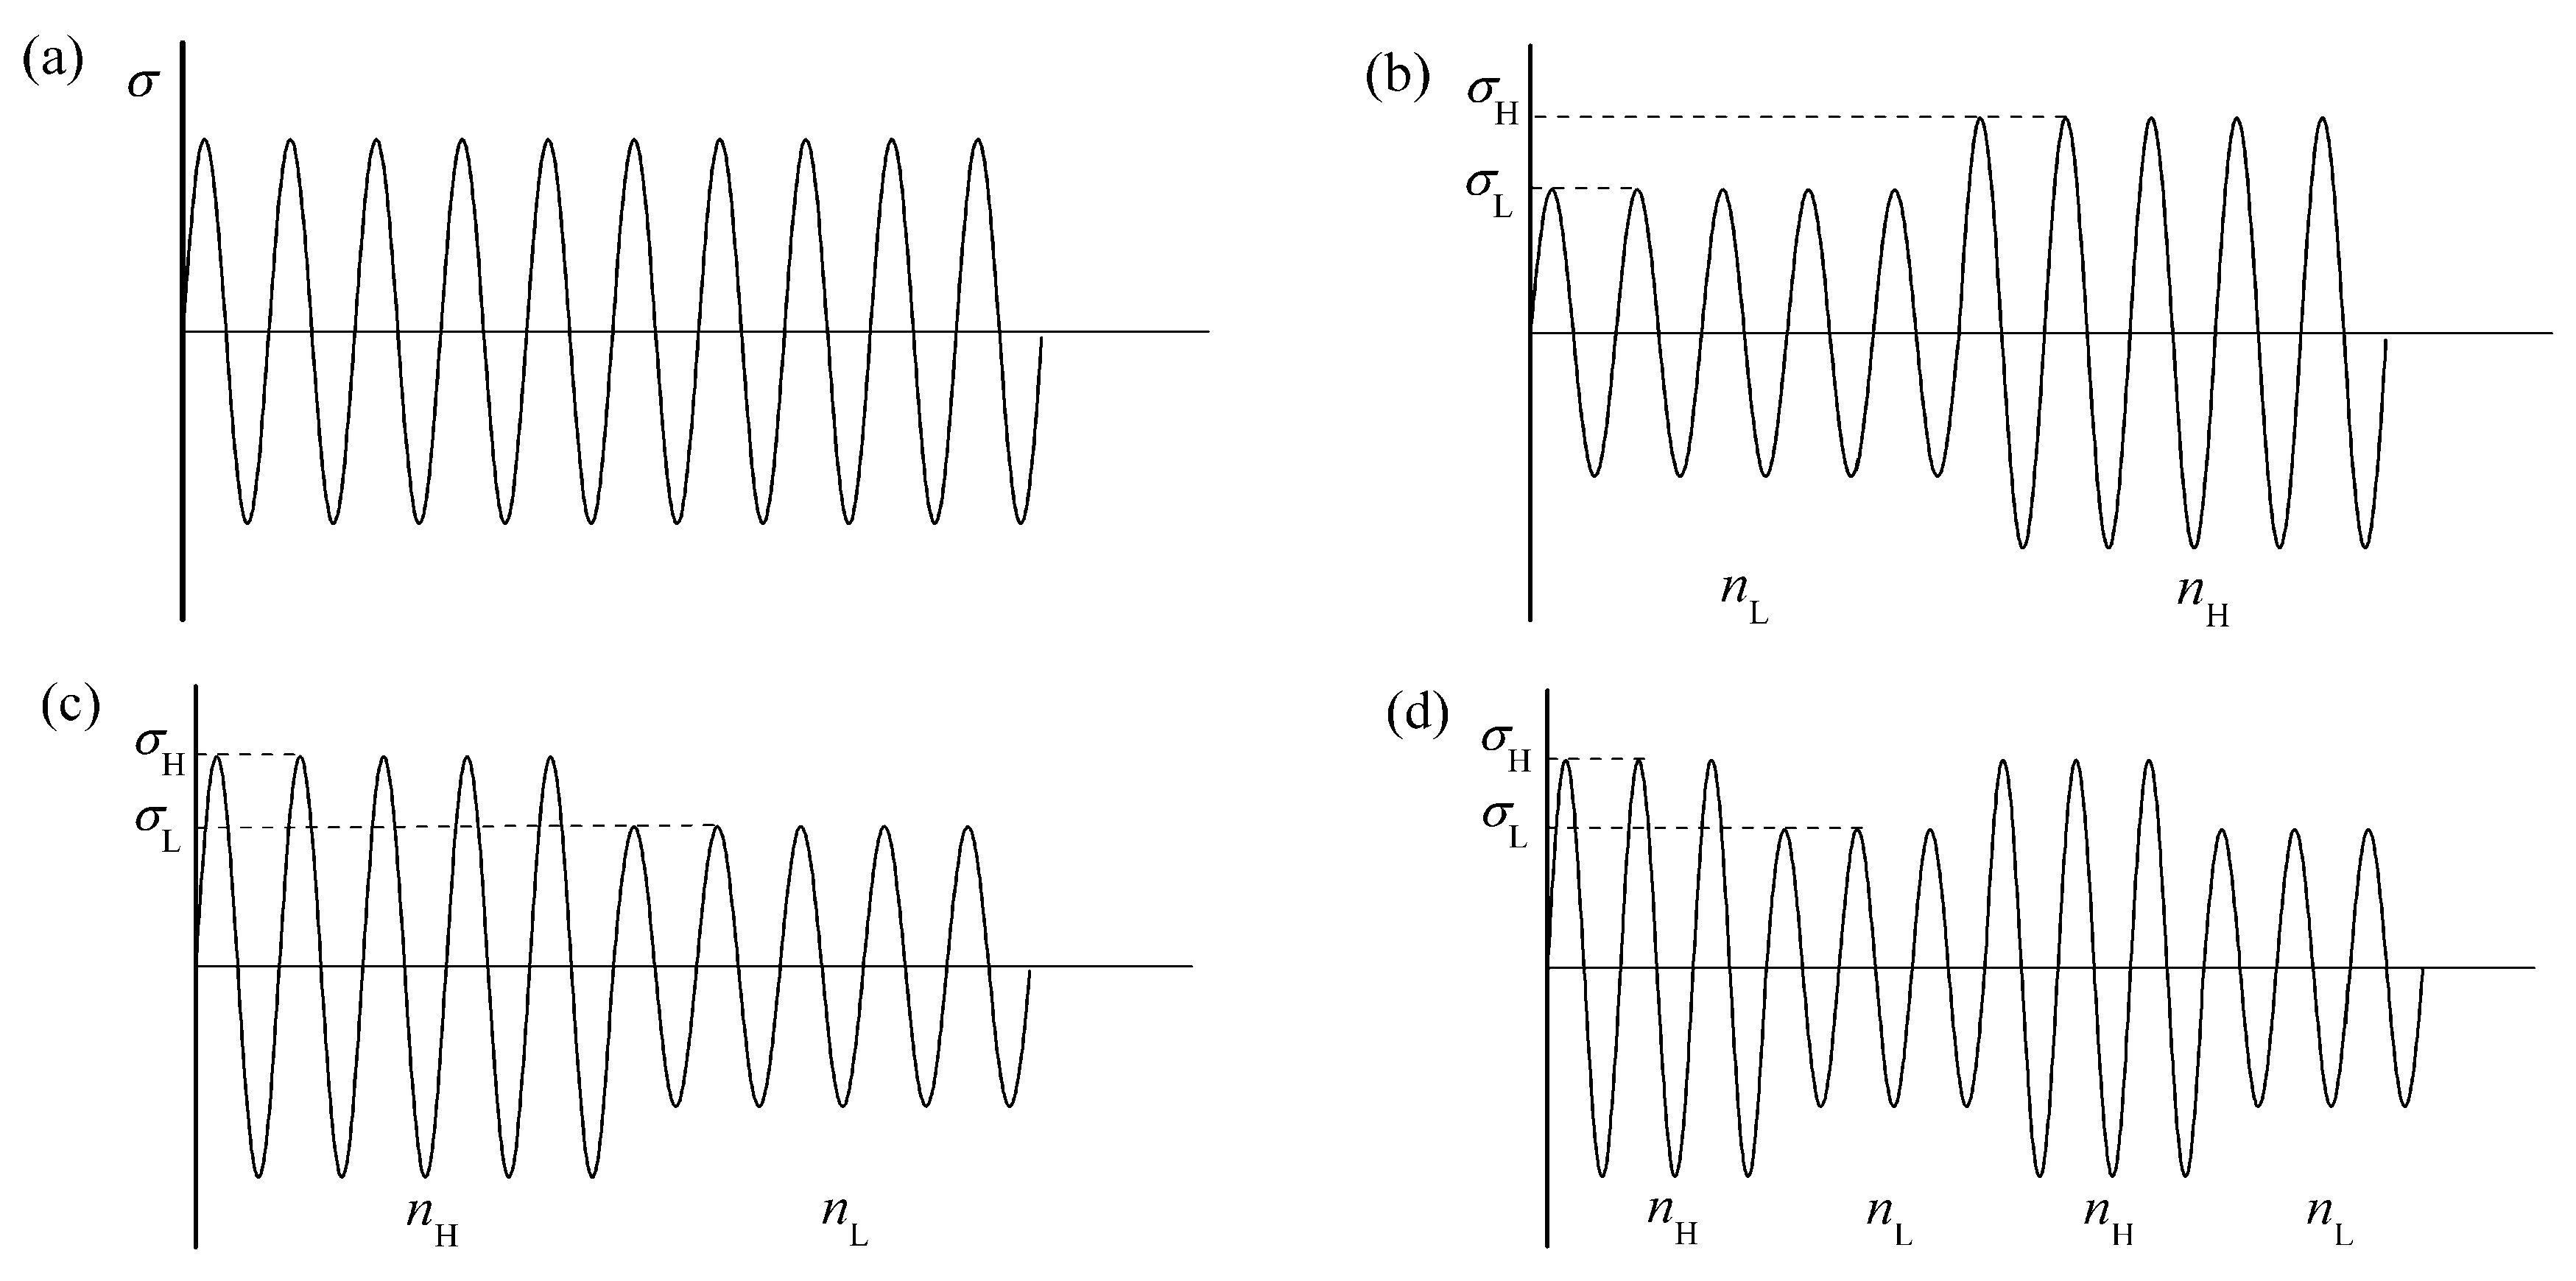
- In the CAV test, the maximum stress and the stress amplitude are constant (see Figure 3a), and the maximum stress is within the range of 420–570 MPa.
- The two-block loading test consists of the high-low (H-L) and the low-high (L-H) cases (Figure 3b,c). Three stress levels are used including 517 MPa, 595 MPa, and 647 MPa. The specimen is firstly loaded at one stress level for certain cycles and then loaded at another stress level until failure.
- The loading spectra of the two-level block loading test (Figure 3d) are composed of several loading blocks with different stress levels. The loading level within each block is the same, but the difference between loading levels and the cyclic ratio between blocks are variable. Therefore, two sorts of two-level block loading tests are studied: (a) variable loading difference of 23 and 153 MPa with the constant cyclic ratio of 1. and (b) variable cyclic ratio from 0.2 to 20 at the constant load difference of 59 MPa.
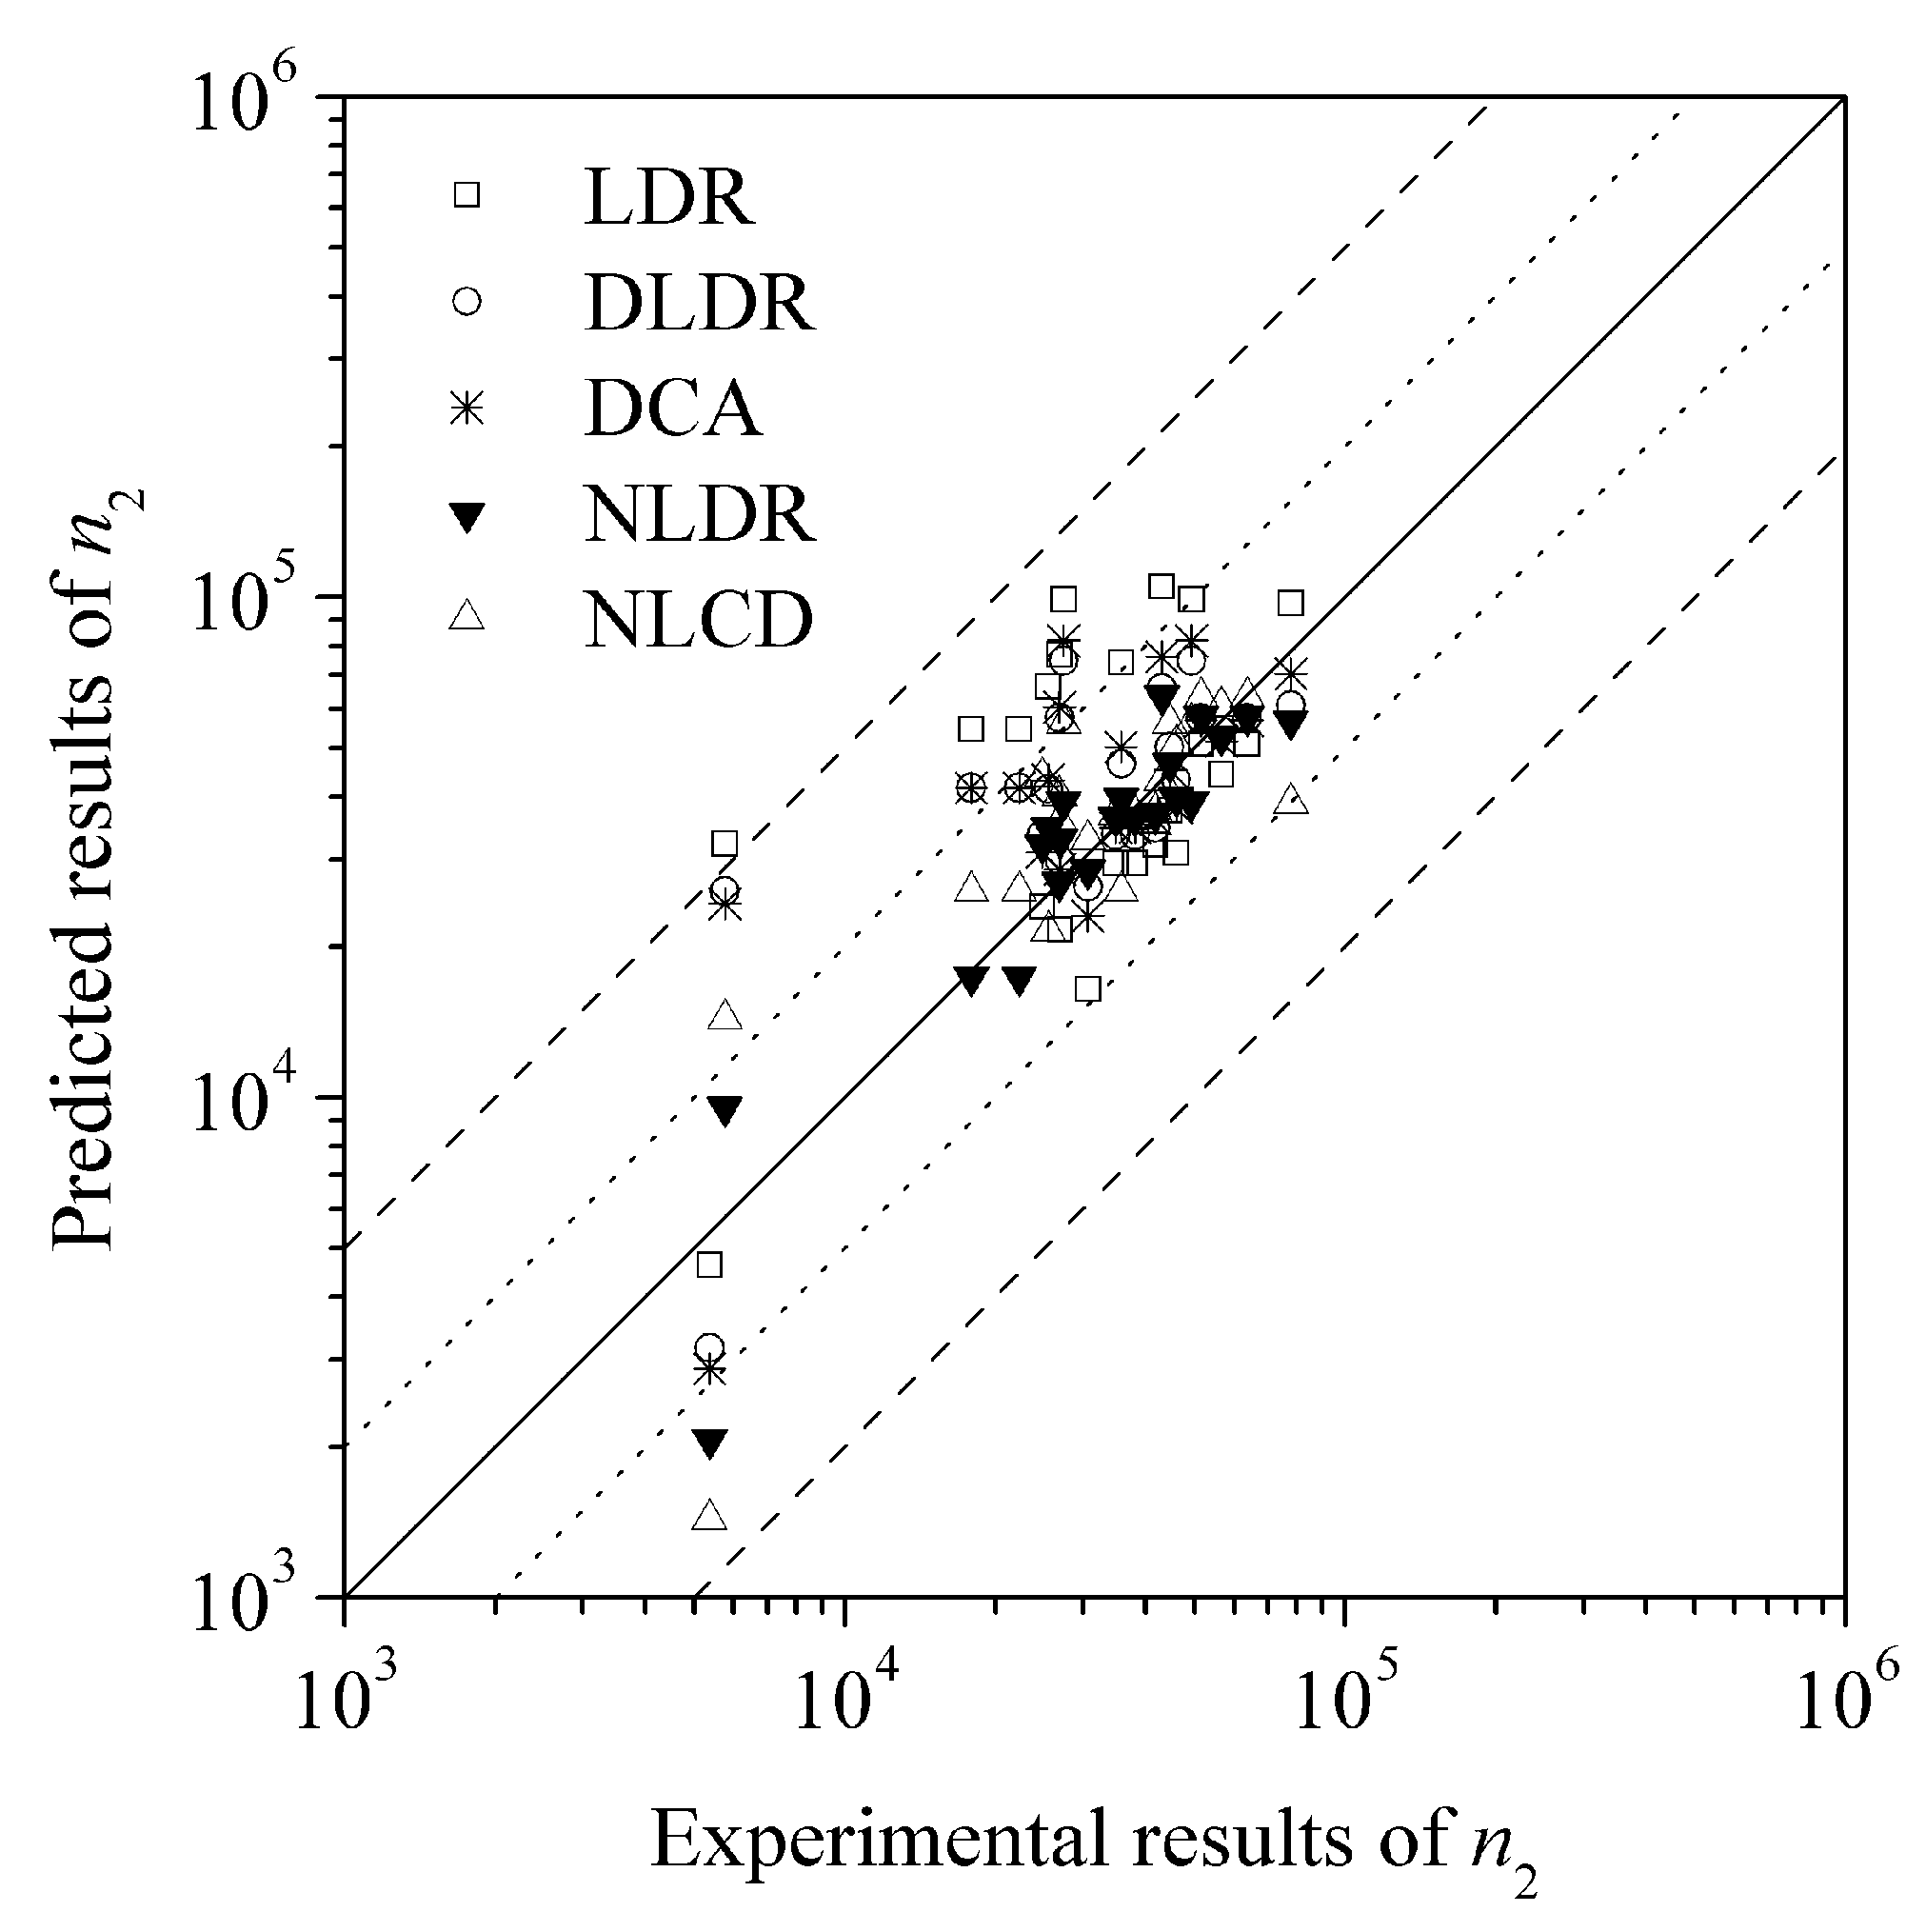
3. Damage Models
4. Results and Discussion
4.1. Constant Amplitude Loading Test
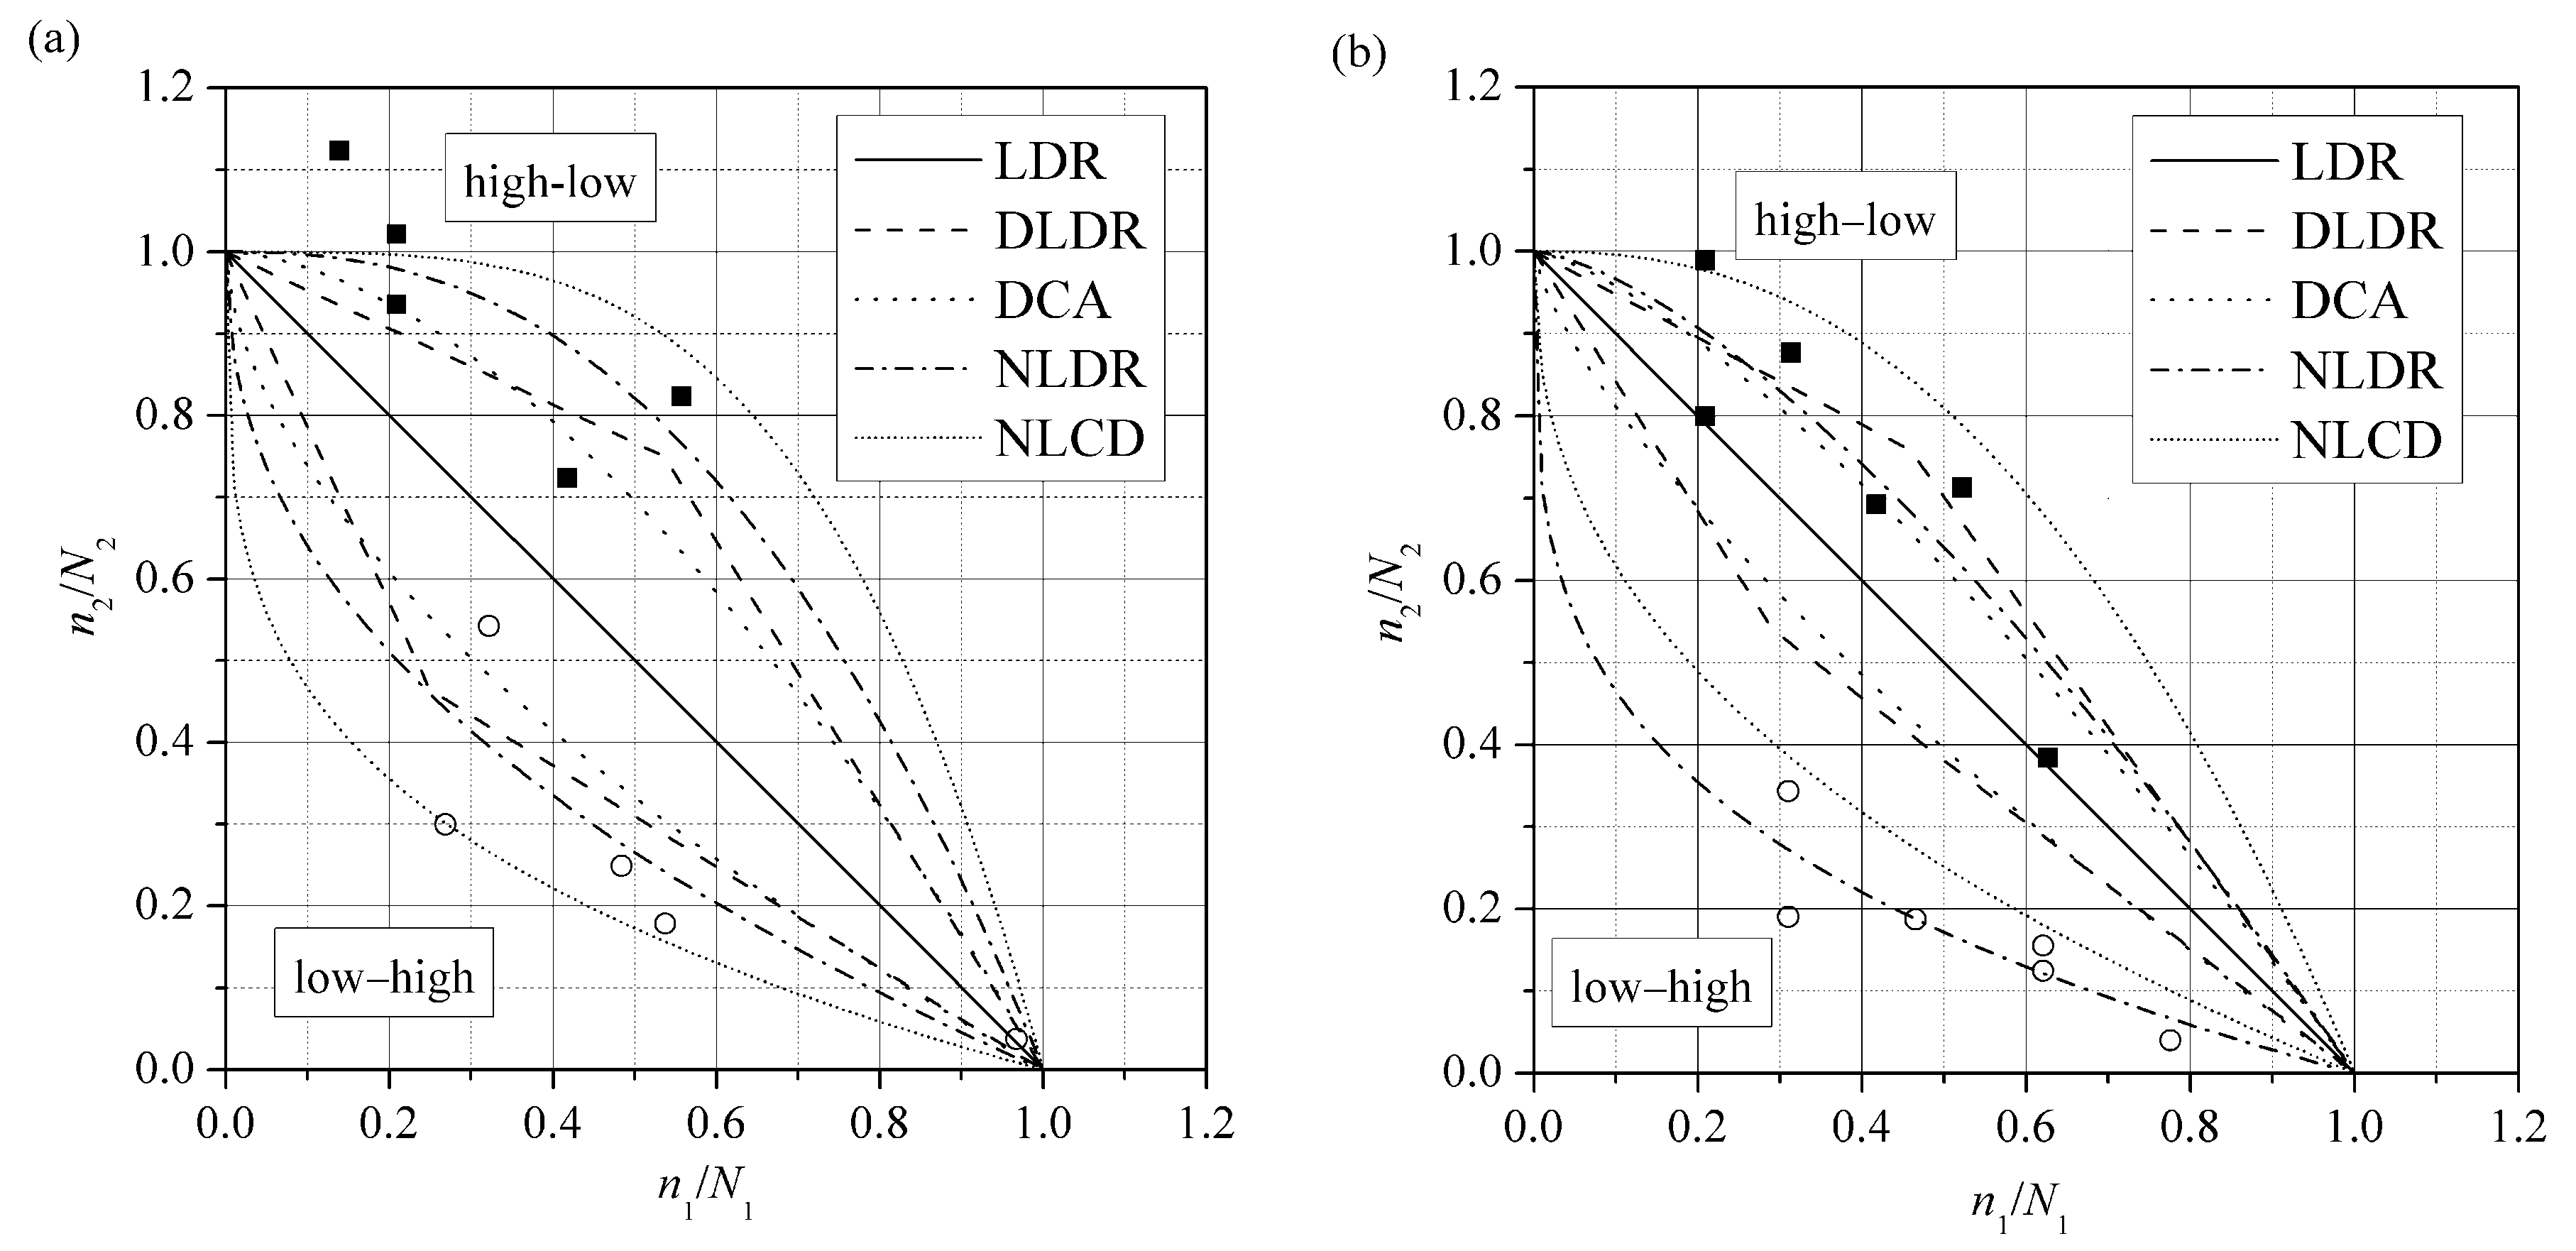
4.2. High-Low and Low-High Block Loading Test Results
4.3. Two-Level Repeated Block Loading Test Results
5. Conclusions
Author Contributions
Acknowledgments
Conflicts of Interest
References
- Donachie, M.J. Titanium: A Technical Guide; ASM International: Materials Park, OH, USA, 2000. [Google Scholar]
- Witek, L. Experimental crack propagation and failure analysis of the first stage compressor blade subjected to vibration. Eng. Fail. Anal. 2009, 16, 2163–2170. [Google Scholar] [CrossRef]
- Jeelani, S.; Ghebremedhin, S.; Musial, M. A study of cumulative fatigue damage in titanium 6Al-4V alloy. Int. J. Fatigue 1986, 8, 23–27. [Google Scholar] [CrossRef]
- Dattoma, V.; Giancane, S.; Nobile, R.; Panella, F.W. Fatigue life prediction under variable loading based on a new non-linear continuum damage mechanics model. Int. J. Fatigue 2006, 28, 89–95. [Google Scholar] [CrossRef]
- Aïd, A.; Amrouche, A.; Bouiadjra, B.B.; Benguediab, M.; Mesmacque, G. Fatigue life prediction under variable loading based on a new damage model. Mater. Des. 2011, 32, 183–191. [Google Scholar] [CrossRef]
- Pereira, H.F.; De Jesus, A.M.; Ribeiro, A.S.; Fernandes, A.A. Fatigue damage behavior of a structural component made of P355NL1 steel under block loading. J. Press. Vessel Technol. 2009, 131, 021407. [Google Scholar] [CrossRef]
- Cortez, R.; Mall, S.; Calcaterra, J.R. Investigation of variable amplitude loading on fretting fatigue behavior of Ti–6Al–4V. Int. J. Fatigue 1999, 21, 709–717. [Google Scholar] [CrossRef]
- Jin, O.; Lee, H.; Mall, S. Investigation into cumulative damage rules to predict fretting fatigue life of Ti–6Al–4V under two-level block loading condition. Transactions of the American Society of Mechanical Engineers. J. Eng. Mater. Technol. 2003, 125, 315–323. [Google Scholar] [CrossRef]
- Mall, S.; Nicholas, T.; Park, T.-W. Effect of predamage from low cycle fatigue on high cycle fatigue strength of Ti–6Al–4V. Int. J. Fatigue 2003, 25, 1109–1116. [Google Scholar] [CrossRef]
- Casciati, F.; Casciati, S.; Faravelli, L.; Marzi, A. Fatigue damage accumulation in a Cu-based shape memory alloy: Preliminary investigation. Comput. Mater. Contin. 2011, 23, 287–306. [Google Scholar]
- Mutoh, Y.; Tanaka, K.; Kondoh, M. Fretting fatigue in SUP9 spring steel under random loading. JSME Int. J. Ser. 1 Solid Mech. Strength Mater. 1989, 32, 274–281. [Google Scholar] [CrossRef]
- Dungey, C.; Bowen, P. The effect of combined cycle fatigue upon the fatigue performance of Ti–6Al–4V fan blade material. J. Mater. Process. Technol. 2004, 153, 374–379. [Google Scholar] [CrossRef]
- Kinyon, S.E.; Hoeppner, D.W. Spectrum load effects on the fretting behavior of Ti–6Al–4V. In Fretting Fatigue: Current Technology and Practices; ASTM International: Materials Park, OH, USA, 2000. [Google Scholar]
- Zhu, S.-P.; Yue, P.; Yu, Z.-Y.; Wang, Q. A combined high and low cycle fatigue model for life prediction of turbine blades. Materials 2017, 10, 698. [Google Scholar] [CrossRef] [PubMed]
- Mlikota, M.; Schmauder, S.; Božić, Ž.; Hummel, M. Modelling of overload effects on fatigue crack initiation in case of carbon steel. Fatigue Fract. Eng. Mater. Struct. 2017, 40, 1182–1190. [Google Scholar] [CrossRef]
- Yuan, H.; Zhang, W.; Kim, J.; Liu, Y. A nonlinear grain-based fatigue damage model for civil infrastructure under variable amplitude loads. Int. J. Fatigue 2017, 104, 389–396. [Google Scholar] [CrossRef]
- Salvati, E.; Sui, T.; Zhang, H.; Lunt, A.J.G.; Fong, K.S.; Song, X.; Korsunsky, A.M. Elucidating the mechanism of fatigue crack acceleration following the occurrence of an underload Advanced Engineering. Materials 2016, 18, 2076–2087. [Google Scholar]
- Li, Y.; Aubin, V.; Rey, C.; Bompard, P. The effects of variable stress amplitude on cyclic plasticity and microcrack initiation in austenitic steel 304 L. Comput. Mater. Sci. 2012, 64, 7–11. [Google Scholar] [CrossRef]
- Miner, M.A. Cumulative damage in fatigue. J. Appl. Mech. 1945, 12, A159–A164. [Google Scholar]
- Marco, S.; Starkey, W. A concept of fatigue damage. Trans. ASME 1954, 76, 627–632. [Google Scholar]
- De Jesus, A.M.; Ribeiro, A.S.; Fernandes, A.N.A. Finite element modelling of fatigue damage using a continuum damage mechanics approach. In Proceedings of the ASME/JSME 2004 Pressure Vessels and Piping Conference, San Diego, CA, USA, 25–29 July 2004; American Society of Mechanical Engineers: New York, NY, USA, 2004; pp. 3–12. [Google Scholar]
- Manson, S.; Halford, G.R. Practical implementation of the double linear damage rule and damage curve approach for treating cumulative fatigue damage. Int. J. Fract. 1981, 17, 169–192. [Google Scholar] [CrossRef]
- Rabotnov, Y.N. Creep Problems in Structural Members; North-Holland Pub. Co.: Amsterdam, The Netherlands, 1969. [Google Scholar]
- Chaboche, J.L.; Lesne, P.M. A non-linear continuous fatigue damage model. Fatigue Fract. Eng. Mater. Struct. 1988, 11, 1–17. [Google Scholar] [CrossRef]
- Schijve, J. Fatigue of Structures and Materials; Springer: New York, NY, USA, 2001. [Google Scholar]


| No. | finit/Hz | ffinal/Hz | 2A/mm | σmax/MPa | N/Cycles |
|---|---|---|---|---|---|
| 1 | 82.65 | 81.41 | 32.4 | 736 | 15,000 |
| 2 | 83.43 | 82.57 | 31.7 | 719 | 42,000 |
| 3 | 79.68 | 77.28 | 29.0 | 647 | 41,800 |
| 4 | 81.69 | 79.52 | 29.0 | 647 | 40,900 |
| 5 | 77.23 | 76.40 | 29.0 | 647 | 28,900 |
| 6 | 76.55 | 75.45 | 27.0 | 595 | 86,500 |
| 7 | 75.81 | 74.86 | 27.0 | 595 | 51,100 |
| 8 | 81.60 | 79.83 | 26.0 | 569 | 50,400 |
| 9 | 80.24 | 77.43 | 26.0 | 569 | 79,500 |
| 10 | 80.64 | 79.52 | 24.0 | 517 | 89,700 |
| 11 | 81.10 | 80.13 | 24.0 | 517 | 111,000 |
| 12 | 79.55 | 78.54 | 24.0 | 517 | 230,232 |
| 13 | 81.60 | 80.78 | 23.6 | 506 | 195,000 |
| 14 | 80.94 | 80.14 | 23.0 | 490 | 209,000 |
| 15 | 80.10 | 79.00 | 22.5 | 477 | 1,333,900 |
| 16 | 80.56 | 79.83 | 22.0 | 463 | 3,540,000 |
| 17 | 81.09 | 80.18 | 21.0 | 438 | 7,330,000 |
| 18 | 80.66 | 79.68 | 20.5 | 425 | 33,100,000 |
| Stress Level/MPa | Load Sequences | n1 | n1/N1 | n2 | n2/N2 | n1/N1 + n2/N2 | Predicted n2/N2 | ||||
|---|---|---|---|---|---|---|---|---|---|---|---|
| LDR | DLDR | DCA | NLDR | NLCD | |||||||
| 647/517 | High-low | 10,000 | 0.27 | 43,000 | 0.30 | 0.57 | 0.73 | 0.46 | 0.53 | 0.44 | 0.30 |
| 12,000 | 0.32 | 77,900 | 0.54 | 0.86 | 0.68 | 0.42 | 0.49 | 0.39 | 0.27 | ||
| 18,000 | 0.48 | 35,700 | 0.25 | 0.73 | 0.52 | 0.32 | 0.35 | 0.28 | 0.18 | ||
| 20,000 | 0.54 | 25,500 | 0.18 | 0.72 | 0.46 | 0.29 | 0.30 | 0.24 | 0.15 | ||
| 36,000 | 0.97 | 5400 | 0.04 | 1.01 | 0.03 | 0.02 | 0.02 | 0.01 | 0.01 | ||
| Low-high | 20,000 | 0.14 | 41,800 | 1.12 | 1.26 | 0.86 | 0.93 | 0.97 | 0.99 | 1.00 | |
| 30,000 | 0.21 | 34,800 | 0.94 | 1.15 | 0.79 | 0.90 | 0.93 | 0.98 | 0.99 | ||
| 30,000 | 0.21 | 38,000 | 1.02 | 1.23 | 0.79 | 0.90 | 0.93 | 0.98 | 0.99 | ||
| 60,000 | 0.42 | 26,900 | 0.72 | 1.14 | 0.58 | 0.80 | 0.77 | 0.89 | 0.96 | ||
| 80,000 | 0.57 | 30,600 | 0.82 | 1.39 | 0.43 | 0.71 | 0.62 | 0.77 | 0.88 | ||
| 595/517 | High-low | 20,000 | 0.31 | 27,400 | 0.19 | 0.50 | 0.69 | 0.52 | 0.57 | 0.27 | 0.39 |
| 20,000 | 0.31 | 49,400 | 0.34 | 0.65 | 0.69 | 0.52 | 0.57 | 0.27 | 0.39 | ||
| 30,000 | 0.47 | 26,900 | 0.19 | 0.66 | 0.53 | 0.40 | 0.42 | 0.19 | 0.28 | ||
| 40,000 | 0.62 | 22,300 | 0.16 | 0.78 | 0.38 | 0.29 | 0.29 | 0.12 | 0.18 | ||
| 40,000 | 0.62 | 17,900 | 0.12 | 0.74 | 0.38 | 0.29 | 0.29 | 0.12 | 0.18 | ||
| 50,000 | 0.78 | 5800 | 0.04 | 0.82 | 0.22 | 0.18 | 0.17 | 0.07 | 0.10 | ||
| Low-high | 30,000 | 0.21 | 63,800 | 0.99 | 1.20 | 0.79 | 0.89 | 0.88 | 0.90 | 0.98 | |
| 30,000 | 0.21 | 51,600 | 0.80 | 1.01 | 0.79 | 0.89 | 0.88 | 0.90 | 0.98 | ||
| 45,000 | 0.31 | 56,600 | 0.88 | 1.19 | 0.69 | 0.84 | 0.80 | 0.82 | 0.94 | ||
| 60,000 | 0.42 | 44,700 | 0.69 | 1.11 | 0.58 | 0.78 | 0.70 | 0.72 | 0.87 | ||
| 75,000 | 0.52 | 46,000 | 0.71 | 1.23 | 0.48 | 0.67 | 0.59 | 0.62 | 0.79 | ||
| 90,000 | 0.62 | 24,800 | 0.38 | 1.00 | 0.38 | 0.52 | 0.48 | 0.50 | 0.68 | ||
| σH/MPa | σL/MPa | Δσ/MPa | nH | nL | nL/nH | Total nH | Total nL | Nf | |||
|---|---|---|---|---|---|---|---|---|---|---|---|
| Exp. | LDR | DCA | NLCD | ||||||||
| 663 | 626 | 37 | 2000 | 2000 | 1 | 18,000 | 17,360 | 35,360 | 37,346 | 37,033 | 36,362 |
| 663 | 600 | 63 | 2000 | 2000 | 1 | 22,640 | 22,000 | 44,640 | 41,032 | 40,384 | 38,606 |
| 663 | 578 | 85 | 2000 | 2000 | 1 | 16,830 | 16,000 | 32,830 | 44,308 | 42,851 | 40,173 |
| 663 | 545 | 118 | 2000 | 2000 | 1 | 24,000 | 23,560 | 47,560 | 48,531 | 46,263 | 41,573 |
| 663 | 510 | 153 | 2000 | 2000 | 1 | 28,800 | 28,000 | 56,800 | 52,556 | 49,636 | 41,647 |
| 626 | 603 | 23 | 3000 | 3000 | 1 | 18,000 | 17,700 | 35,700 | 49,632 | 49,346 | 48,792 |
| 626 | 569 | 57 | 3000 | 3000 | 1 | 22,600 | 21,000 | 43,600 | 56,413 | 55,617 | 53,200 |
| 626 | 539 | 87 | 3000 | 3000 | 1 | 33,000 | 31,260 | 64,260 | 62,330 | 60,972 | 55,577 |
| 626 | 510 | 116 | 3000 | 3000 | 1 | 30,000 | 29,200 | 59,200 | 67,869 | 65,903 | 56,054 |
| 598 | 563 | 35 | 5000 | 5000 | 1 | 40,840 | 40,000 | 80,840 | 68,403 | 67,424 | 65,604 |
| 598 | 524 | 74 | 5000 | 5000 | 1 | 41,600 | 40,000 | 81,600 | 79,852 | 76,631 | 69,960 |
| 598 | 510 | 88 | 5000 | 5000 | 1 | 30,000 | 27,560 | 57,560 | 82,637 | 80,052 | 70,202 |
| 569 | 539 | 30 | 5000 | 5000 | 1 | 50,000 | 47,600 | 97,600 | 90,172 | 89,124 | 86,583 |
| 569 | 510 | 59 | 5000 | 5000 | 1 | 45,000 | 43,300 | 88,300 | 101,519 | 99,484 | 90,577 |
| σH/MPa | σL/MPa | Δσ/MPa | nH | nL | nL/nH | Total nH | Total nL | Nf | |||
|---|---|---|---|---|---|---|---|---|---|---|---|
| Exp. | LDR | DCA | NLCD | ||||||||
| 569 | 510 | 59 | 1000 | 20,000 | 20 | 9000 | 167,880 | 176,880 | 140,818 | 139,554 | 124,749 |
| 569 | 510 | 59 | 1000 | 20,000 | 20 | 7000 | 126,820 | 133,820 | 140,818 | 139,554 | 124,749 |
| 569 | 510 | 59 | 1000 | 10,000 | 10 | 15,000 | 148,180 | 163,180 | 135,527 | 135.587 | 111,827 |
| 569 | 510 | 59 | 1000 | 10,000 | 10 | 14,000 | 136,450 | 150,450 | 135,527 | 135.587 | 111,827 |
| 569 | 510 | 59 | 2000 | 10,000 | 5 | 28,000 | 132,800 | 160,800 | 127,584 | 126,351 | 110,039 |
| 569 | 510 | 59 | 2000 | 10,000 | 5 | 22,000 | 109,160 | 131,160 | 127,584 | 126,351 | 110,039 |
| 569 | 510 | 59 | 5000 | 5000 | 1 | 45,000 | 43,300 | 88,300 | 101,519 | 101,007 | 90,577 |
| 569 | 510 | 59 | 5000 | 5000 | 1 | 55,000 | 52,660 | 107,660 | 101,519 | 101,007 | 90,577 |
| 569 | 510 | 59 | 10,000 | 2000 | 0.2 | 70,000 | 13,830 | 83,830 | 84,639 | 84,099 | 81,180 |
| 569 | 510 | 59 | 10,000 | 2000 | 0.2 | 60,000 | 11,600 | 71,600 | 84,639 | 84,099 | 81,180 |
© 2018 by the authors. Licensee MDPI, Basel, Switzerland. This article is an open access article distributed under the terms and conditions of the Creative Commons Attribution (CC BY) license (http://creativecommons.org/licenses/by/4.0/).
Share and Cite
Lin, J.; Li, W.; Yang, S.; Zhang, J. Vibration Fatigue Damage Accumulation of Ti–6Al–4V under Constant and Sequenced Variable Loading Conditions. Metals 2018, 8, 296. https://doi.org/10.3390/met8050296
Lin J, Li W, Yang S, Zhang J. Vibration Fatigue Damage Accumulation of Ti–6Al–4V under Constant and Sequenced Variable Loading Conditions. Metals. 2018; 8(5):296. https://doi.org/10.3390/met8050296
Chicago/Turabian StyleLin, Jiewei, Weidong Li, Shuo Yang, and Junhong Zhang. 2018. "Vibration Fatigue Damage Accumulation of Ti–6Al–4V under Constant and Sequenced Variable Loading Conditions" Metals 8, no. 5: 296. https://doi.org/10.3390/met8050296
APA StyleLin, J., Li, W., Yang, S., & Zhang, J. (2018). Vibration Fatigue Damage Accumulation of Ti–6Al–4V under Constant and Sequenced Variable Loading Conditions. Metals, 8(5), 296. https://doi.org/10.3390/met8050296