The Prediction of the Mechanical Properties for Dual-Phase High Strength Steel Grades Based on Microstructure Characteristics

1
Institute of Technology and Material Engineering, Faculty of Mechanical Engineering, Technical University of Kosice, Mäsiarska 74, 040 01 Košice, Slovakia
2
Institute of Materials Research, Slovak Academy of Sciences, Watsonova 47, 040 01 Košice, Slovakia
*
Author to whom correspondence should be addressed.
Metals 2018, 8(4), 242; https://doi.org/10.3390/met8040242
Submission received: 28 February 2018
/
Revised: 29 March 2018
/
Accepted: 3 April 2018
/
Published: 5 April 2018
(This article belongs to the Special Issue Mechanical Behavior of High-Strength Low-Alloy Steels)
Abstract
:The decrease of emissions from vehicle operation is connected mainly to the reduction of the car’s body weight. The high strength and good formability of the dual phase steel grades predetermine these to be used in the structural parts of the car’s body safety zones. The plastic properties of dual phase steel grades are determined by the ferrite matrix while the strength properties are improved by the volume and distribution of martensite. The aim of this paper is to describe the relationship between the mechanical properties and the parameters of structure and substructure. The heat treatment of low carbon steel X60, low alloyed steel S460MC, and dual phase steel DP600 allowed for them to reach states with a wide range of volume fractions of secondary phases and grain size. The mechanical properties were identified by a tensile test, volume fraction of secondary phases, and grain size were measured by image analysis. It was found that by increasing the annealing temperature, the volume fraction of the secondary phase increased, and the ferrite grains were refined. Regression analysis was used to find out the equations for predicting mechanical properties based on the volume fraction of the secondary phase and grain size, following the annealing temperature. The hardening mechanism of the dual phase steel grades for the states they reached was described by the relationship between the strain-hardening exponent and the density of dislocations. This allows for the designing of dual phase steel grades that are “tailored” to the needs of the automotive industry customers.
1. Introduction
For reasons of environmental protection, an increased emphasis has been placed on the reduction of exhaust emissions from car use in recent years. The reduction in vehicle weight is considered to be one of the decisive factors for improving fuel consumption and hence, reducing emissions [1,2]. The considerable potential for vehicle weight reduction is hidden in the body, which accounts for about 25% of the total mass of cars. In the segment of middle and lower vehicle classes, the base material is steel. In the higher-end segment, the concepts of an aluminum-based light alloy body or a combined body of steel, aluminum, and composite materials are applied. When aluminum alloys or composite materials are applied, the weight reduction is achieved, even at the expense of higher costs.
The intention of the automotive industry is to produce vehicles not only with reduced weight but also with a high level of safety characteristics such as strength, stiffness, and deformation work [3,4,5]. In comparison to other materials, the advantage of steel grades is the variability in performance properties (strength, stiffness, energy absorption ability, corrosion resistance of galvanized sheets, and so forth), technological properties (formability and weldability by application of various technologies), their recyclability at the end of the car’s lifetime, and the lower production costs. To meet the oftentimes contradictory demands of the automotive industry on the utility properties, the steel industry is constantly developing new concepts of high-strength steel grades (DP—dual phase steel, CP—complex phase steel, TRIP—transformation induced plasticity steel, TWIP—twining induced plasticity steel, and so forth). It appears that thanks to a wide variety of combinations of strength, plasticity properties (yield strength Rp0.2 = 280–700 MPa, ultimate tensile strength Rm = 600–1000 MPa, ductility A = 12–34%, strain-hardening exponent n = 0.09–0.21, and normal anisotropy ratio r = 0.9–1), and cost from all the known high-strength steel sheets used in the construction of motor vehicles, dual phase steel grades take the largest share [6,7].
Dual phase steel grades (DP) consist of a fine-grained ferrite matrix with dispersed islands of martensite or lower bainite and often, with a certain share of residual austenite. The soft ferritic structure is the carrier of the plastic properties and the hard particles of the martensitic phase are the carriers of the strength properties. The share of martensite in dual phase steel grades ranges from 10 to 30%. With a greater share of martensite in the ferrite matrix, the clustering of martensitic islands may occur, which results in the deterioration of their strength-plastic properties combination [8,9,10,11,12].
The dual phase ferritic-martensitic structure can be obtained from any low-carbon steel by a controlled rolling or intercritical annealing method, provided that the transformation of austenite to perlite is avoided [13,14,15]. Perlite formation is suppressed by the Cr and Mo elements which, at the same time, support the formation of martensite. Further enhancement of the over-hardenability can be achieved by the addition of Mn, Si, and P. The silicon inhibits the perlite and carbides formation, Nb ensures ferritic grain refinement and increases the temperature of intercritical annealing Tnr [16].
2. Mechanics of Plastic Flow during Deformation
The mechanical properties of dual phase ferritic-martensitic steel depend on the chemical composition, the volume fraction of martensite, the volume fraction of ferrite, the carbon content in martensite, the grain size of martensite, and their strength [17,18]. To describe the behavior of dual phase ferritic-martensitic steel under plastic deformation, various constitutive equations were proposed [9,15,19,20,21,22]. Increasing the intercritical temperature increases the amount of austenite generated and this is transformed to martensite during rapid cooling. Thus, the strength and hardness of the material increases as well. The carbon content in martensite is larger for dual phase steels with low volume fractions of martensite. Otherwise, the carbon content in martensite decreases when the volume fraction of martensite increases. The carbon content in martensite controls the phase hardness and influences the final properties of the material. By controlling the metallurgical processes, it is possible to reach ferritic-martensitic structures with volume fractions of martensite from 35 to 50% with a wide combination of strength and plastic properties [17,18].
The effective use of dual phase steels in the automotive industry requires a better understanding of how they behave in crashes, as well as how they behave when processed by stamping to the structural parts of the safety zones. Nowadays, numerical simulations of crash tests and metal forming processes, based on the Finite Element Method, are widely used to predict the deformation behavior of materials. Thus, to describe the material behavior under deformation, the following constitutive equations are used [23]:
where σs is the true stress, K is the material constant, n is the strain-hardening exponent that expresses the intensity of the strain-hardening and the ability of the material to deform uniformly, ϕi is true strain and ϕ0 is the pre-strain [24].
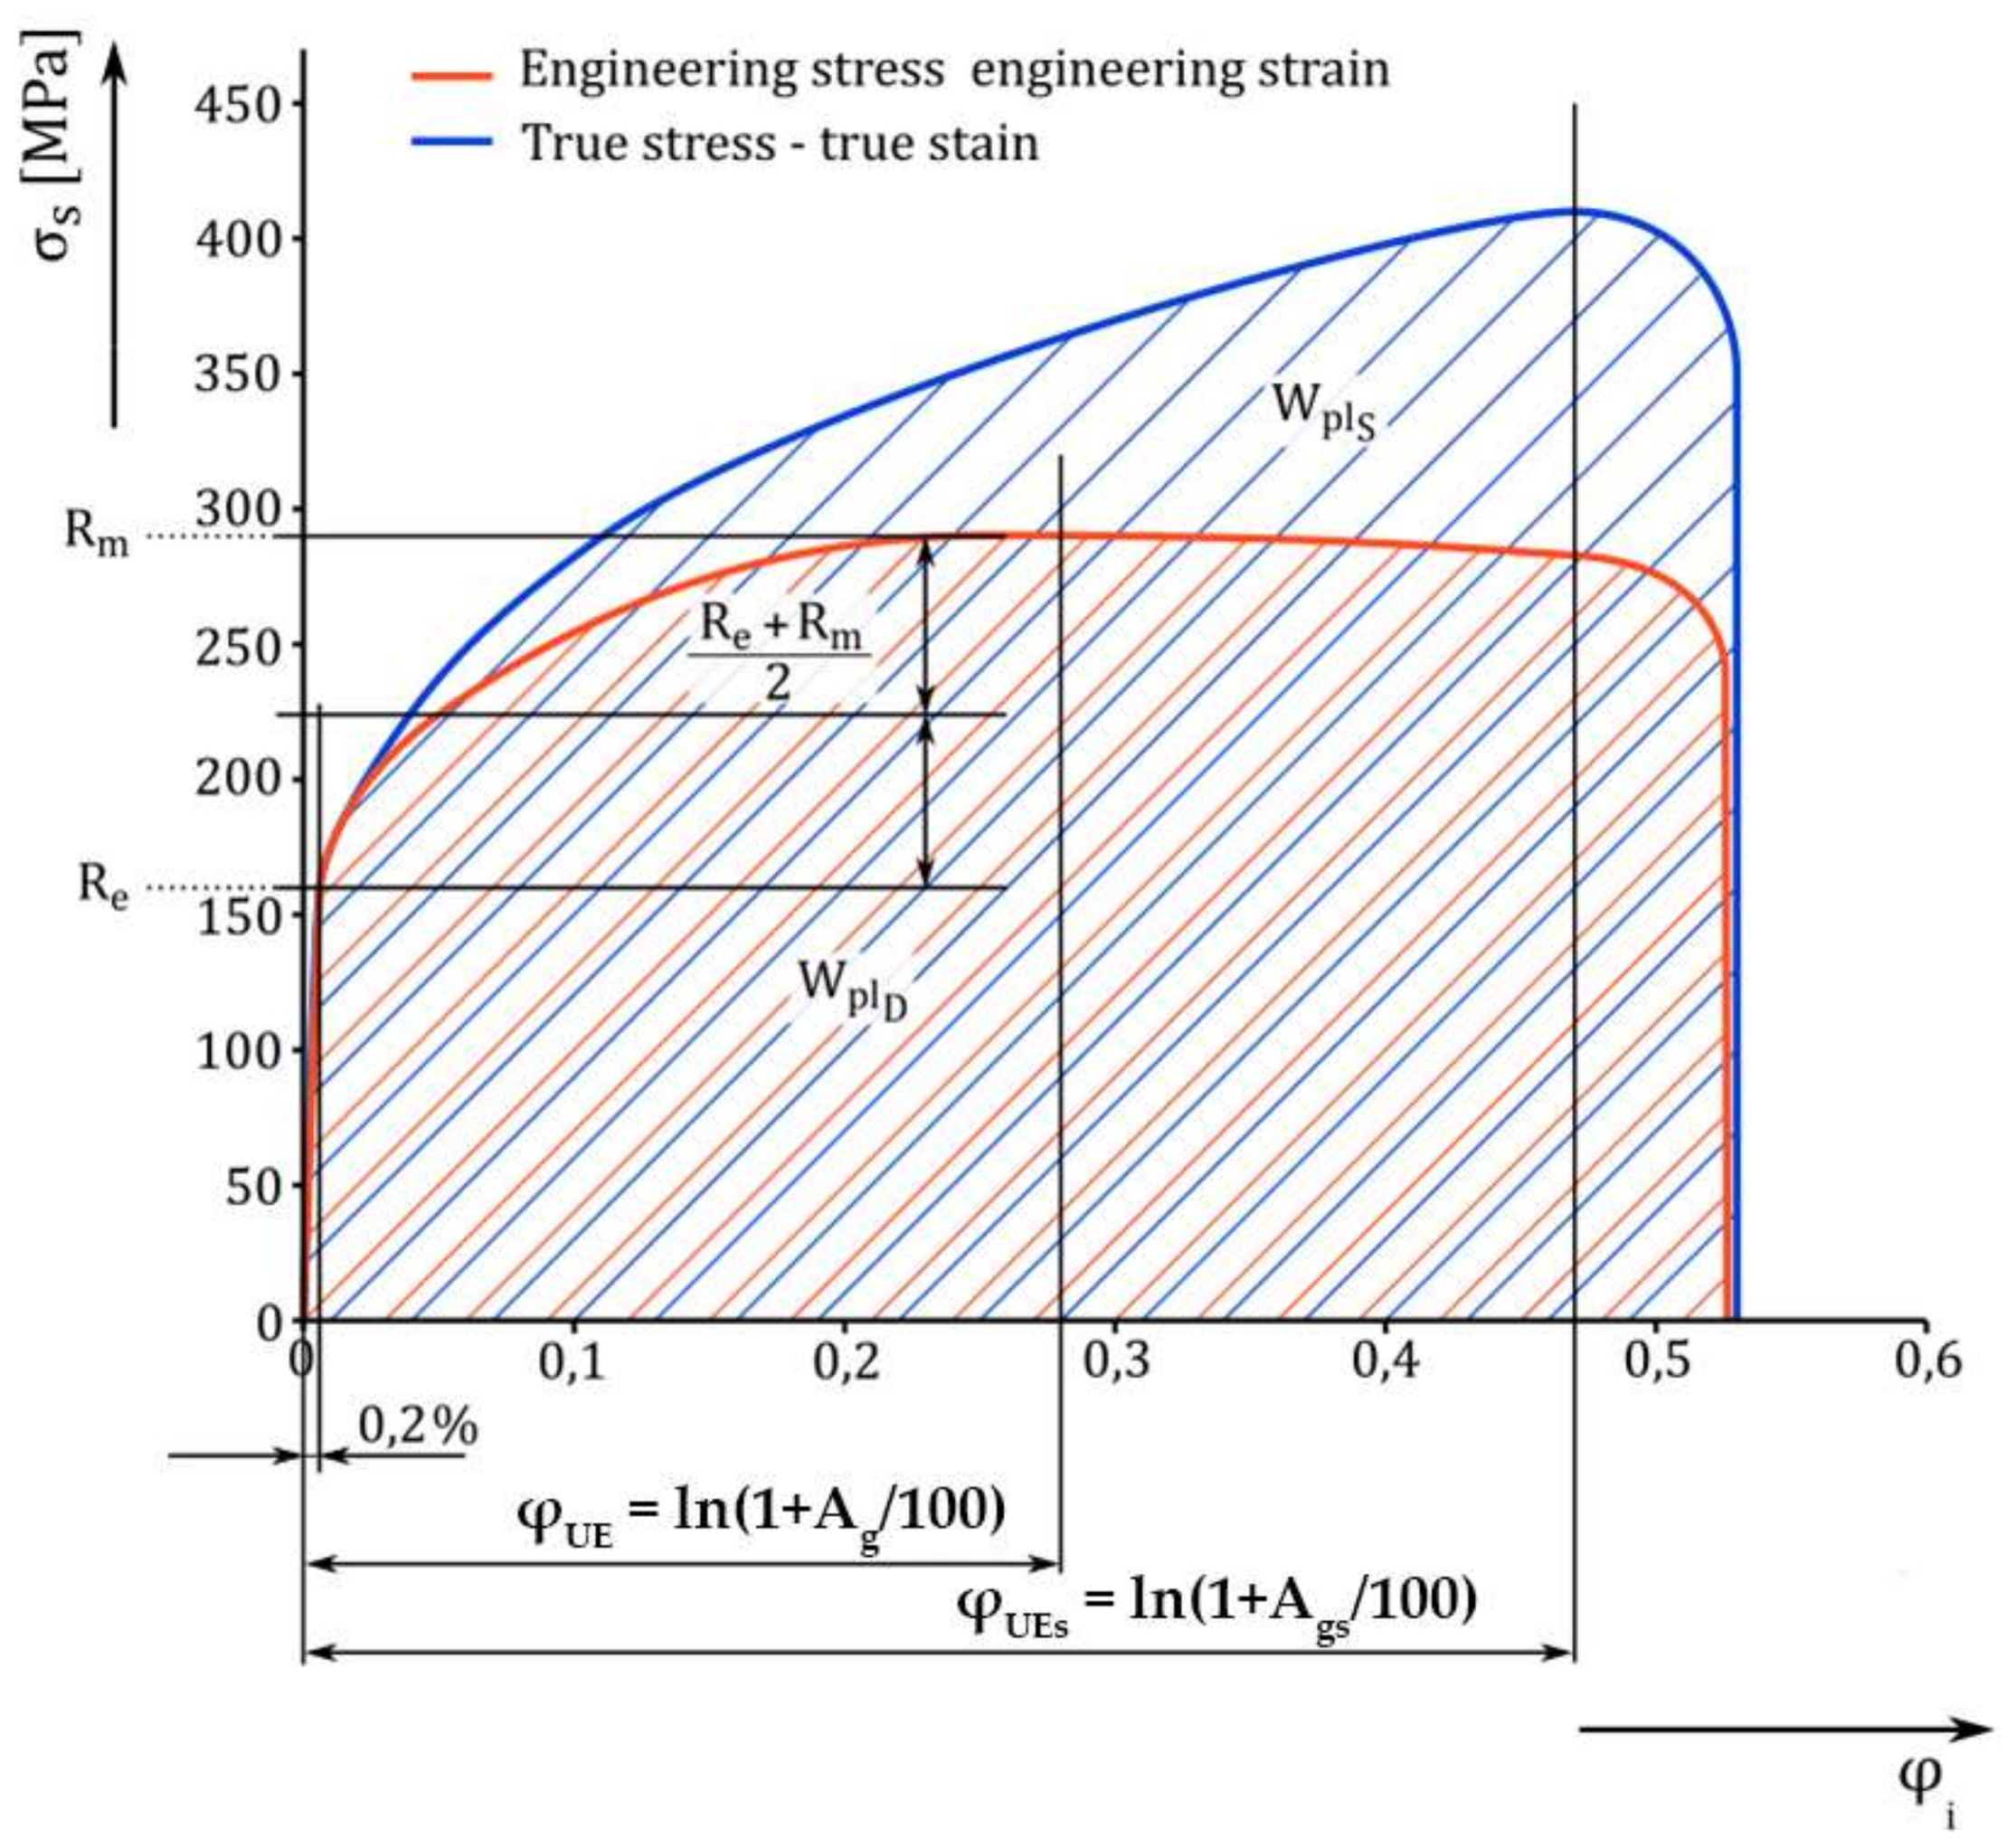
These models can be used to prepare the production of DP steel grades with precisely defined “tailor-made” properties for the components of the vehicle’s deformation zones at the front and the side impact. When selecting material for the car-body safety zones, the main criterion is resistance to deformation (that is, deformation work) that is consumed at the crash. This can be determined by the tensile test record σs–ϕ (Figure 1):
where V0 is the specimen volume on the initial length L0, ϕUE is the uniform true strain (true strain at tensile strength), and ϕ0.002 = 0.002 is the true strain at yield strength.
The parts of the body deformation zones are elastically and plastically deformed during impact and during their production. However, crash tests are only concerned with plastic deformation. After we insert Equation (1) into Equation (3) and make adjustments, we get the following:
After the integration and adjustment Equation (4) we get the following:
The values of the material constant K and the strain-hardening exponent n can be determined from the tensile test record by regression analysis. However, to gain a better understanding of the mechanics of the deformation process, the strain-hardening exponent n, and the material constant K can be determined from the mutual bonds of the mechanical properties of metallic materials. If Equation (1) (or, by analogy, Equation (3)) is subjected to a logarithmic operation, we get the following linear dependence:
and we express the contribution to strain-hardening at tensile strength Rm (Rm refers to the ultimate tensile strength) with respect to the yield strength, depending on the uniform deformation, in the interval from ϕ = 0.002 to ϕUE [25] as follows:
which yields the exponent of the strain-hardening n:
The n value is not constant throughout the uniform deformation, so it is necessary to expect a certain uncertainty in the calculation of the deformation work and the actual strength, especially in the case of minor strains. The exact determination of the strain-hardening exponent requires the division of an even deformation region into several intervals and the expression of the strain-hardening exponent in terms of deformation:
where n0 is the strain-hardening exponent found in the first interval (for example, ϕi is the true strain between 0.002 and 0.02), p is the constant determined by the approximation of the dependence of the strain-hardening exponent on the deformation at individual intervals.
From the Equation (6), it follows that the material constant K will be
Upon adjustment, we get the following:
The above-mentioned mechanical properties of materials (the yield strength Re, the tensile strength Rm, the material constant K, the strain-hardening exponent n, the maximum value of uniform deformation ϕUE, and so forth) are given by their internal structure—the structure of the material, which, in turn, depends on the chemical composition of steel and on its production technology. The production of “tailored” or “customized” steel grades, with exactly defined properties, requires knowledge of not only the above-mentioned relationships that determine the mechanical properties but also knowledge of the relationships between the structural parameters and the mechanical properties of the metallic materials.
Due to the fact that the structural parts of the safety zones are deformed at higher strain rates when a car crashes, the influence of the strain rate needs to be included in constitutive equations. In Reference [26] the authors included the influence of strain rate and temperature into these equations. Authors from References [27,28] included the strain rate influence into the constitutive equations when predicting the deformation work. It has been found that the influence of the strain rate was low at quasistatic strain rates [28], but a notable effect was found at higher strain rates and that it is connected to the evolution of the dislocation density.
In the literature, the structural nature of the material properties of ferritic-martensitic steel grades is given a great deal of attention [29,30,31]. Based on the dislocation theory, founded on the motion of dislocations and their interaction with various obstacles (grain boundaries, precipitates, interstitial atoms, fractions of different phases, as well as other dislocations), the actual stress necessary for plastic deformation flow can be expressed in terms of the individual contributors to hardening:
where σ0 is Peierls stress necessary to overcome the lattice friction stress, the resistance of alloying elements dissolved in solid solution, the precipitation matrix resistance, and the lattice defects [32]; ∆σg is the hardening effect depending on the size of the ferritic grain; ∆σS is the effect of substitute hardening; ∆σIN is the effect of interstitic hardening; ∆σP is the effect of precipitation hardening; ∆σPR is the effect of perlite hardening; ∆σSG is the effect subgrain hardening (also possible to be expressed as ∆σFMaB—the hardening through bainitic or martensitic fractions or plates); ∆σD is the dislocation density hardening effect, and so forth [33,34].
For dual phase ferritic-martensitic (DP) steel grades, Equation (1) can be adjusted as follows:
The hardening effect of ferritic grain size:
The hardening effect of the martensitic or bainitic fractions:
The hardening effect of the dislocation density:
where dα is the mean grain size of ferrite, ky is the strengthening coefficient, α is a material constant, G is the shear modulus (80,000 MPa), b is Burger’s vector, and ρD is the dislocation density.
The aims of the experimental research were to prepare materials with different volume fractions of martensite up to 50% from commercial steels, to describe the relationship between the mechanical properties and the temperature of the intercritical annealing, and to describe the relationship between properties that are sensitive to changes of the sub-structural parameter when cold deformed.
3. Materials and Methods
The deformation behavior of the dual phase steel types (Equations (13)–(17)) depends mainly on the chemical composition, the volume of martensite, the morphology and distribution in the ferrite matrix, as well as the ferrite grain size dα. The aim of the experimental research was to prepare materials (states) with a martensite volume of up to 50% from commercially produced low carbon steel types of 3–3.3 mm thickness: A (X60), B (S460MC), and C (DP600), whose chemical composition and values of carbon equivalent CE calculated from Equation (18) [35] are listed in Table 1.
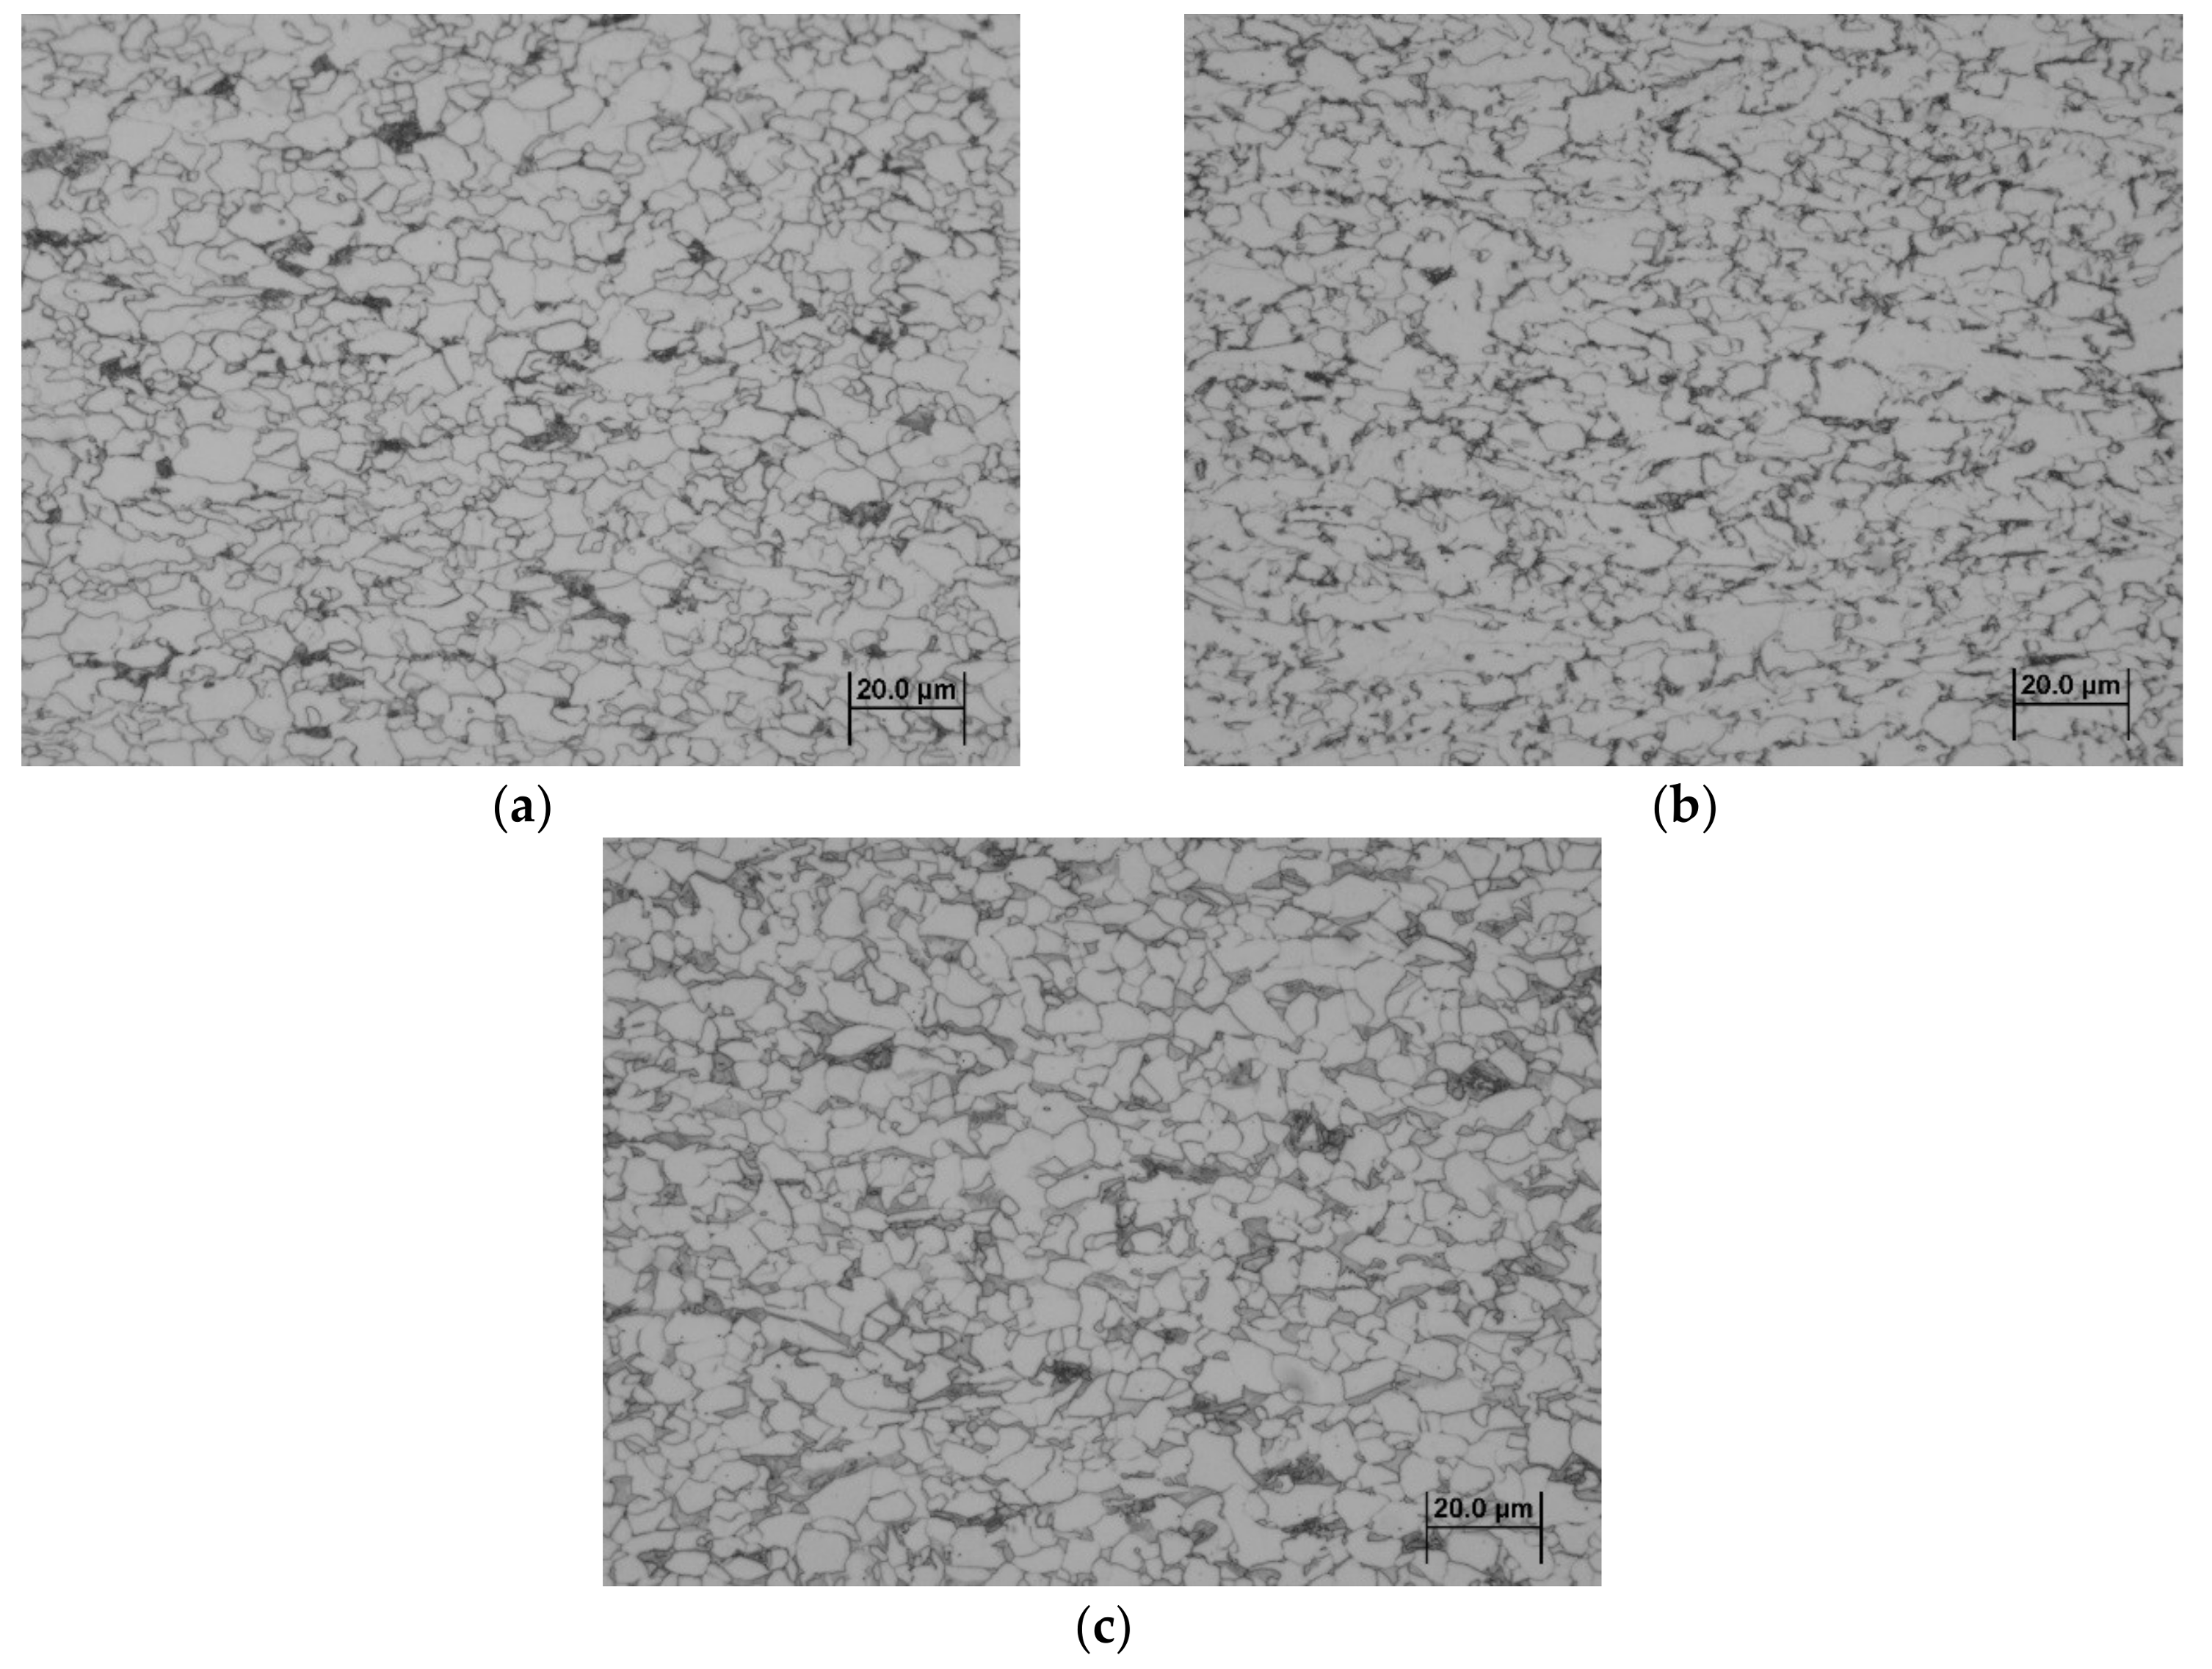
The microstructures of the initial materials A, B, and C used are shown in Figure 2. The low carbon steel microstructure (A) is ferritic-pearlite (Figure 2a). The low-carbon micro-alloyed steel (B) microstructure is ferritic-pearlite with a low perlite content (Figure 2b). The microstructure of steel C is a ferritic-martensitic one with a martensitic volume of 24% (Figure 2c). As can be seen from Table 1, the carbon content and the average size of the ferritic grain dα are approximately equal for as-received steels A, B, and C. The dispersion of the mean ferrite grain size under the surface and in the middle of the sheet thickness of the as-received A, B, and C materials was ±10%.
Prior to the heat treatment, the proper starting and final temperatures of the transformation of ferrite to austenite AC1, AC3, Ar1, and Ar3 were set according to Andrews [36] (Table 2). The non-recrystallization temperature Tnr and the critical cooling time between 800 and 500 °C for the beginning of the perlite precipitation were calculated according to the equations listed in Reference [37].
The as-received materials samples were prepared by single-step annealing in a flowing cantalum furnace REH-B-10-60 (Linn High Therm GmbH, Bad Frankenhausen, Germany) with a protective argon atmosphere. The samples made out of material A (marked as DPA) were annealed at temperatures 740, 790, and 840 °C. Then, considering the results reached, the samples made out of materials B and C (marked as DPB and DPC) were annealed at temperatures of 750 and 820 °C (which lie between the temperatures AC1–AC3) with the same steady-state 10 min for each temperature, followed by cooling in water with a cooling rate of 30 °C/s [38].
Samples for metallographic analysis were hot mounted in dentacrylate, wet grinded (sandpaper 220–1200), and polished by diamond grit in suspension. Then, the samples were etched in 2% Nital.
The grain size dα was identified by the linear method according to the Slovak standard STN 42 0462 on the microscope Olympus GX71. The volume fraction of secondary phases (VFSP) was measured by the grid method (square foil 15 × 15 cm with grid 1 × 1 cm) and by the image analysis method using the image analyzer Image J at a magnification 1000× [38].
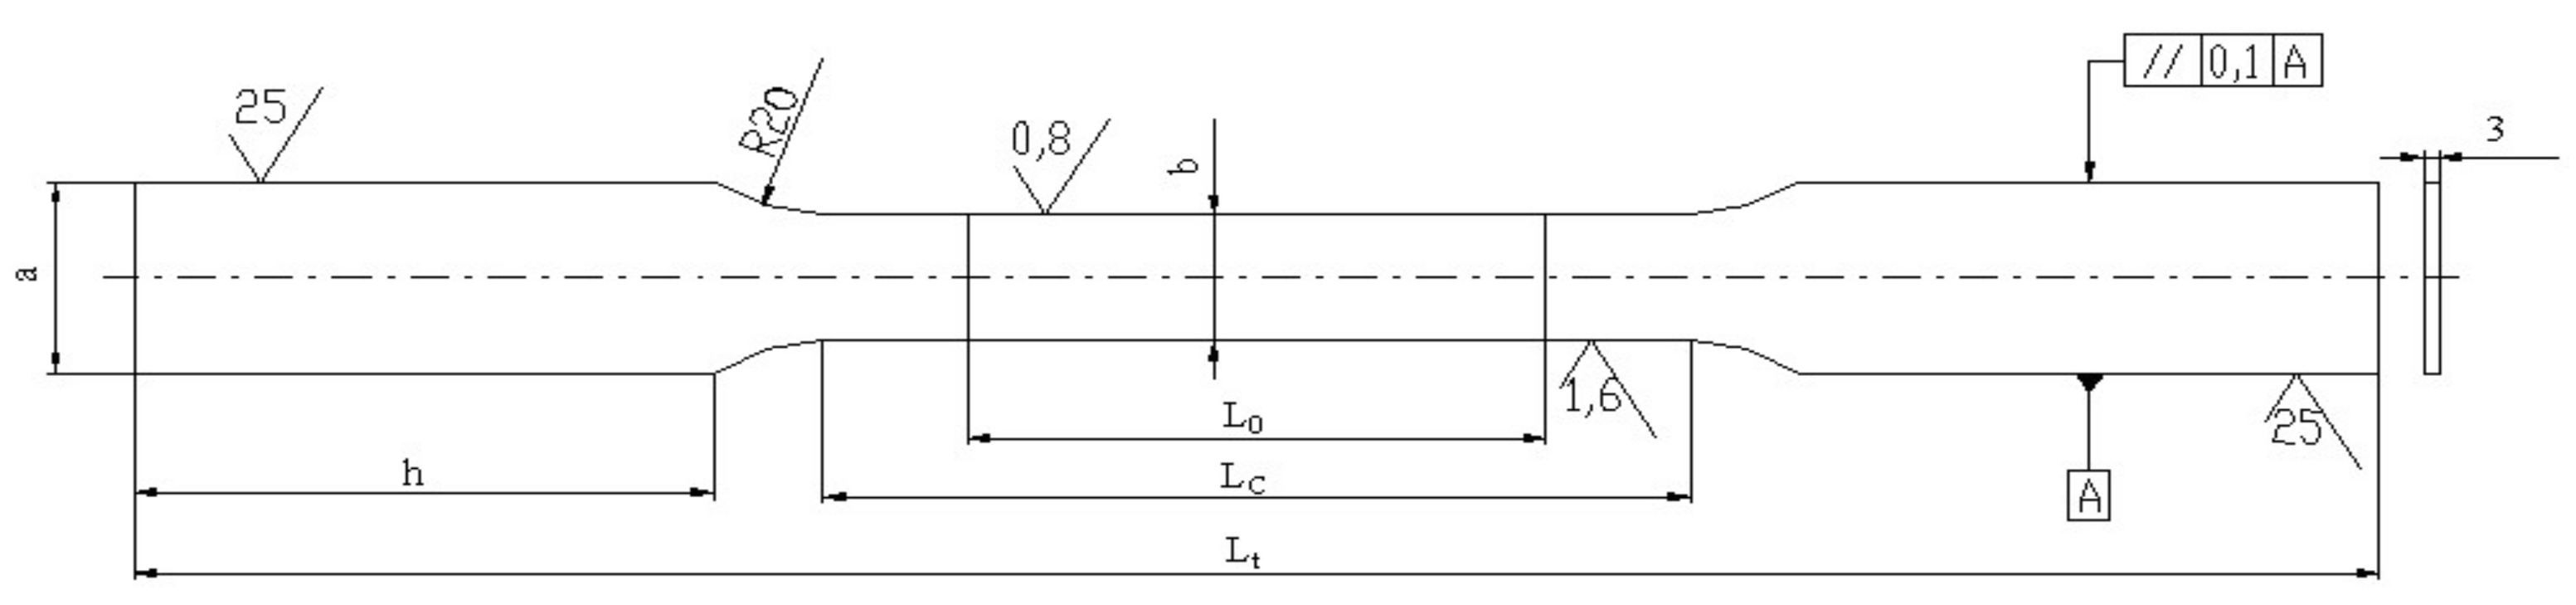
Mechanical properties of as-received materials A, B, and C, and the samples after annealing DPA, DPB, and DPC were measured by static tensile tests according to STN EN ISO 6892-1 at room temperature on a testing machine TIRAtest 2300. These are shown in Table 3. The transversal feed was 1 mm·min−1 and the corresponding quasistatic strain rate was 0.003 s−1. Five specimens for each material and annealing state were tested. The specimen’s shape is shown in Figure 3 and the dimensions were as follows: L0 = 20 and 35 mm, LC = 50 mm, a = 14 mm, h = 15 mm, b = 8 ÷ 10 mm [38].
4. Results and Discussion
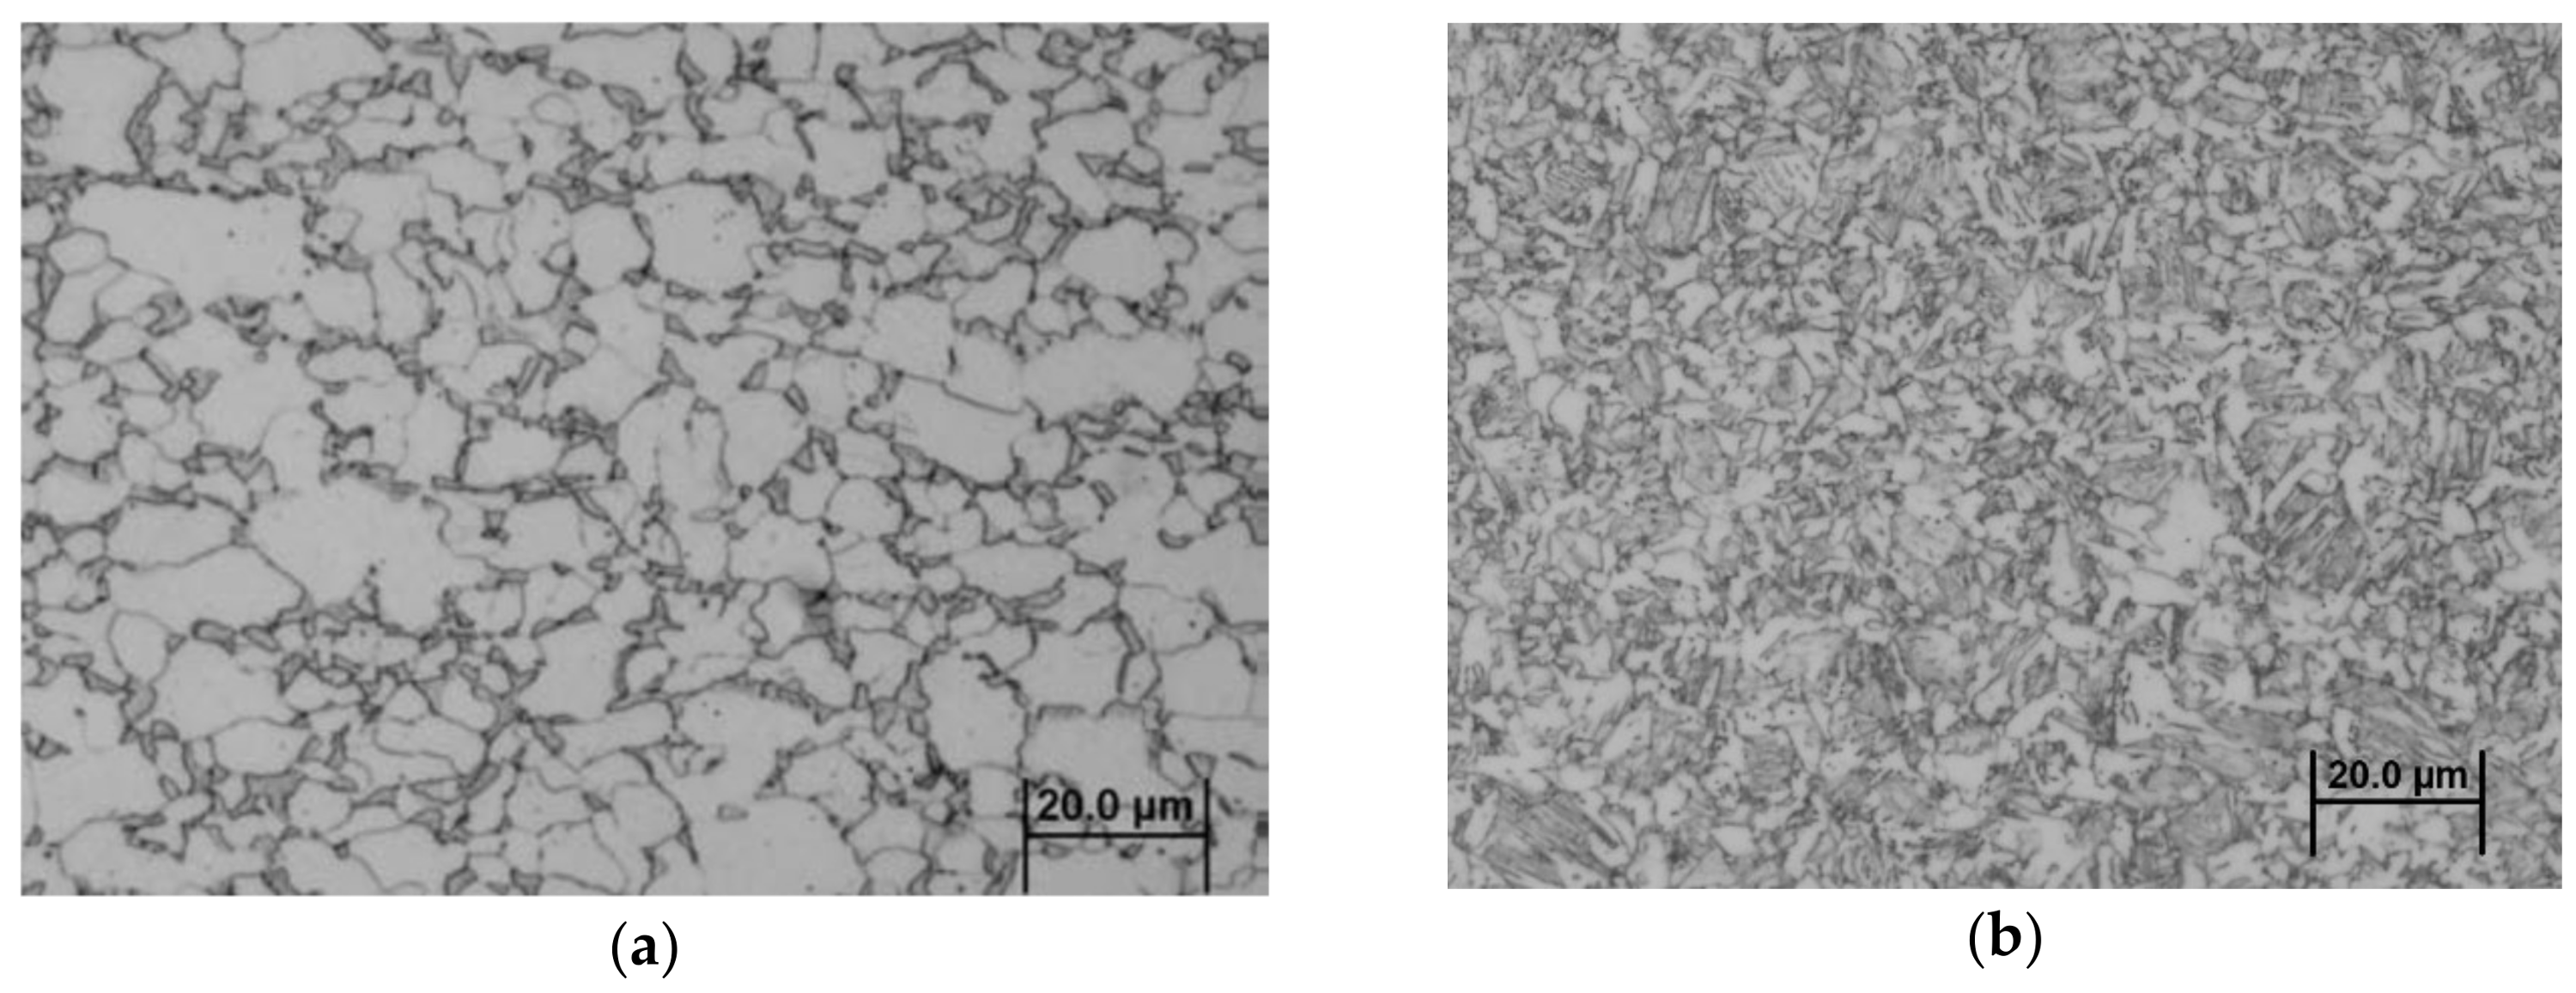
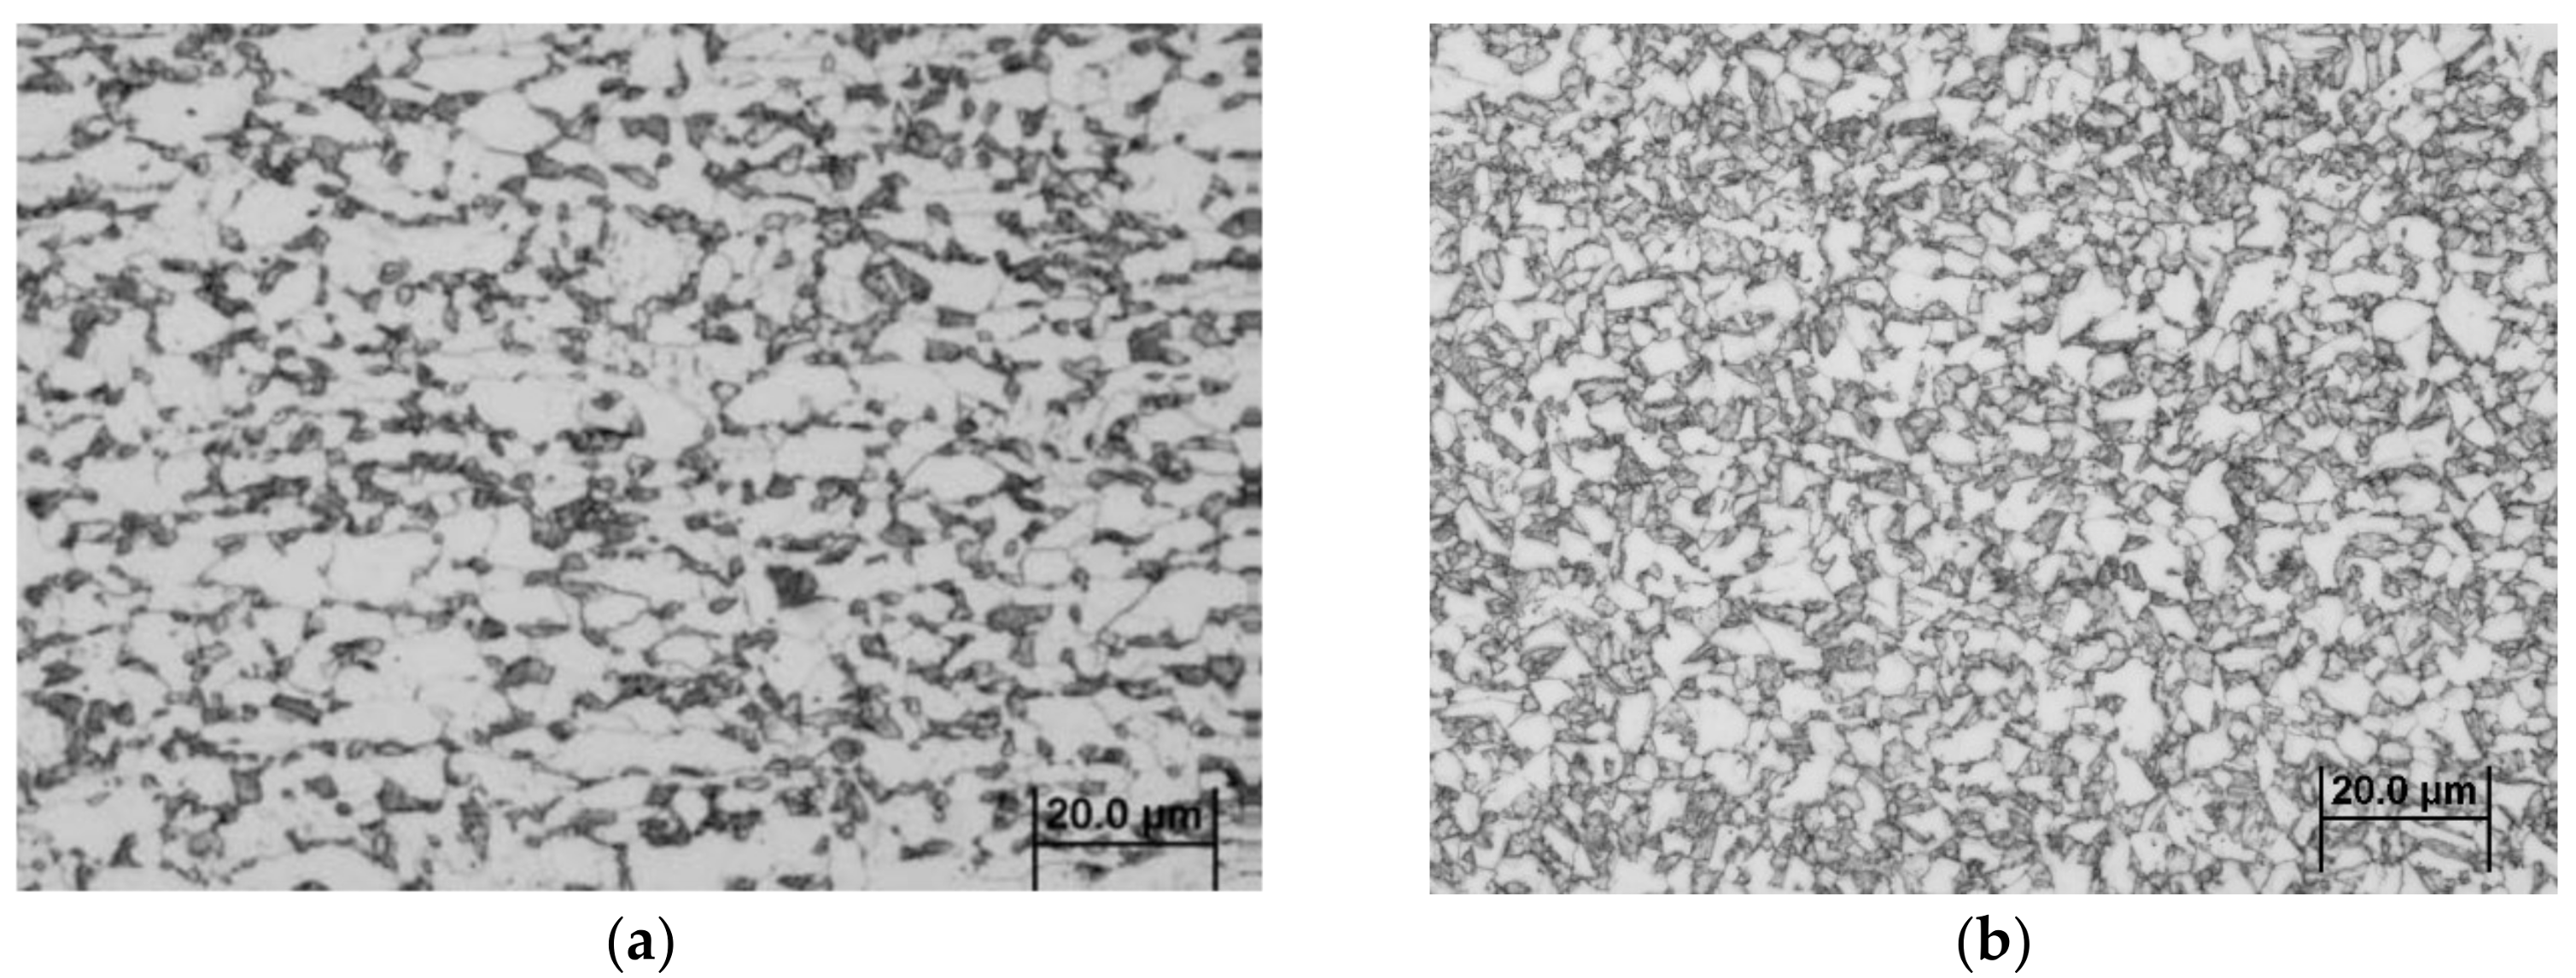
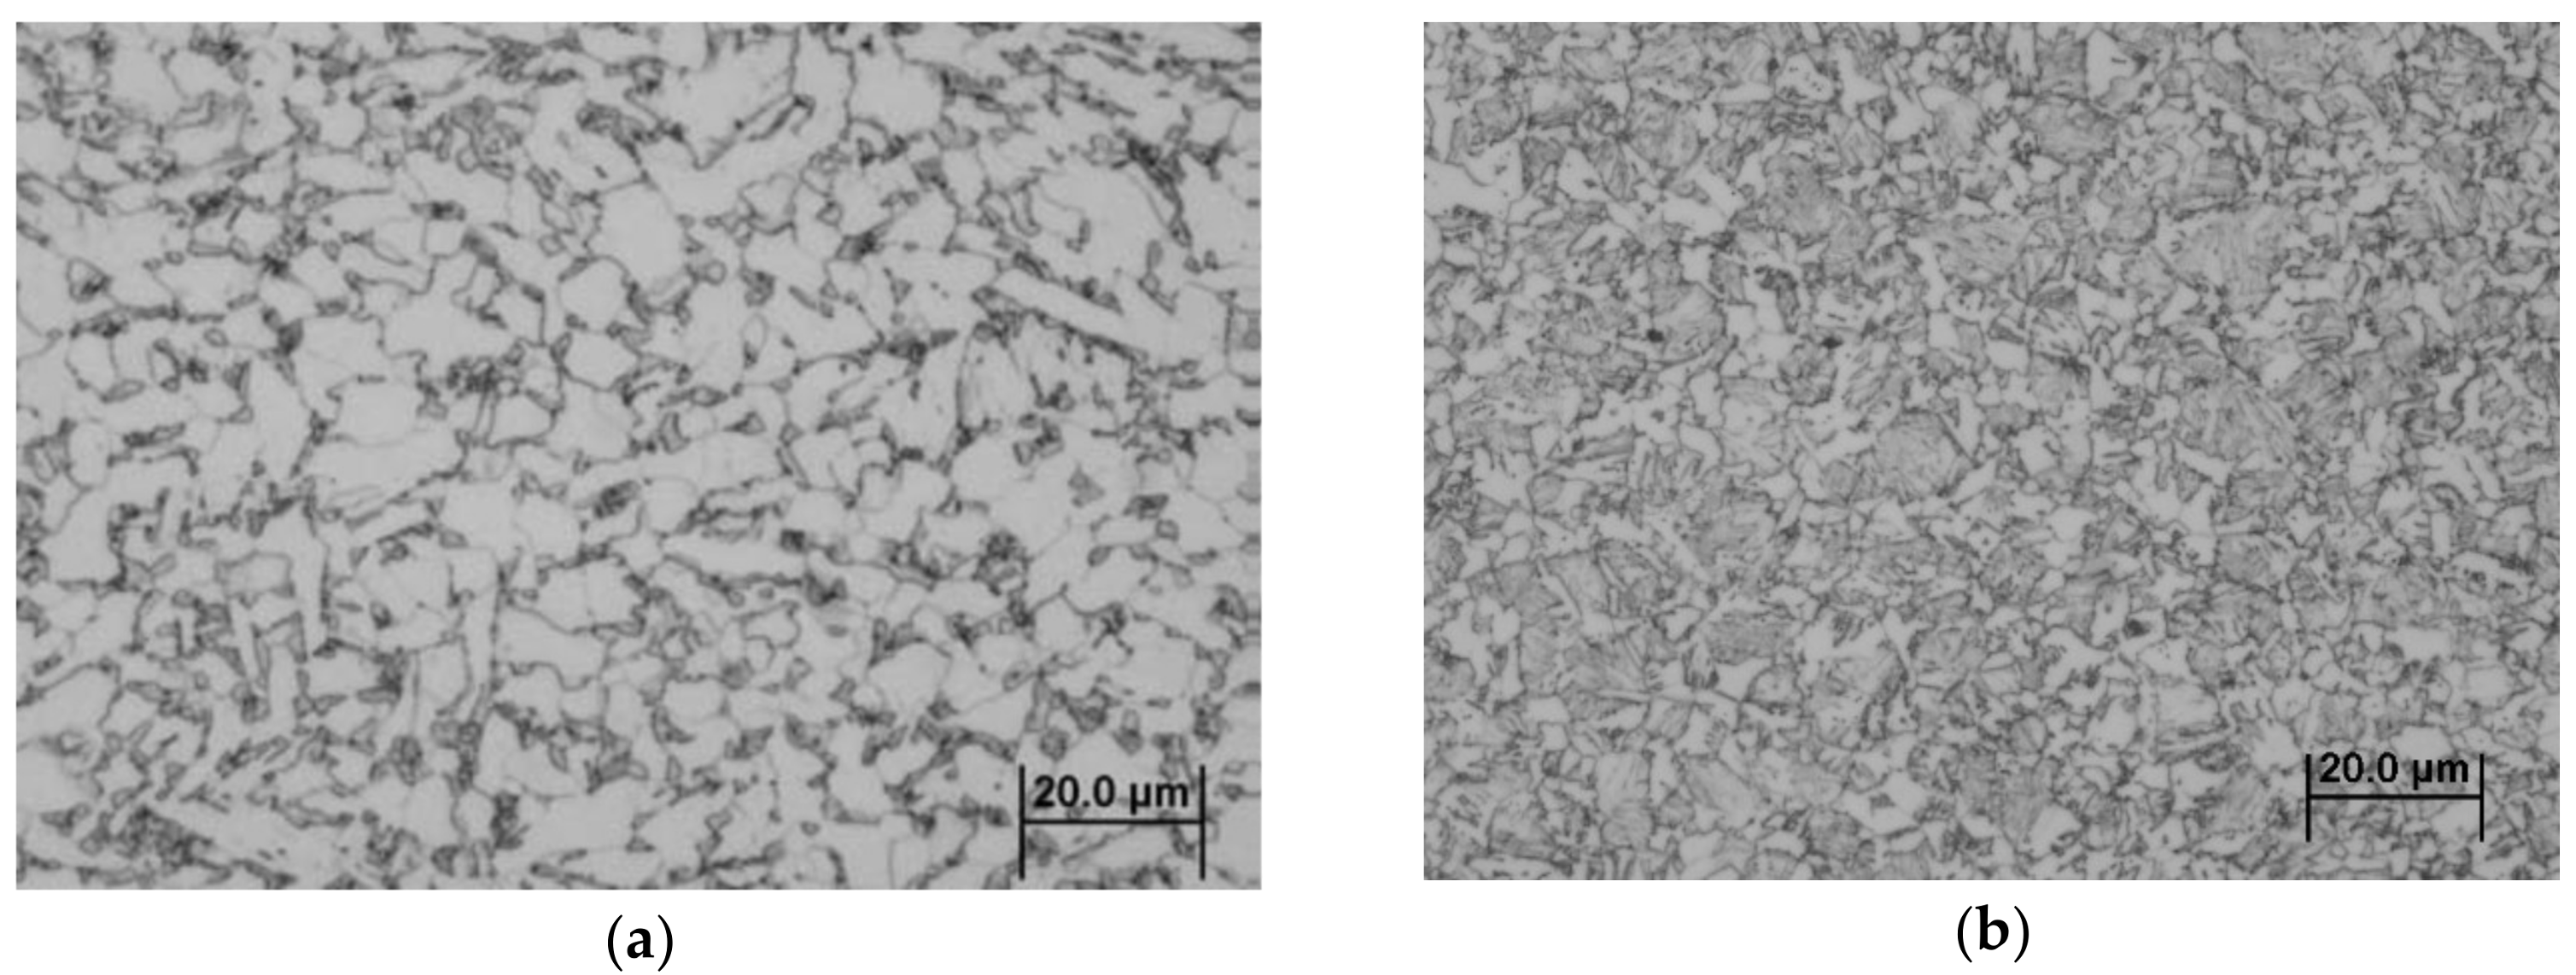
The range of annealing conditions within the temperatures of AC1–AC3 applied to commercially available low carbon steel X60 (A), low-alloyed steel S460MC (B), and dual phase steel DP 600 (C) were allowed to reach a wide range of microstructure states, with a martensite volume between 20.4% and 68.2% and a ferritic grain size between 4.7 and 7.7 µm, as seen in Figure 4, Figure 5 and Figure 6, respectively. Hereinafter, these phases are designated as DPA740, DPA790, DPA820, DPB750, DPB820, DPC750, and DPC820.
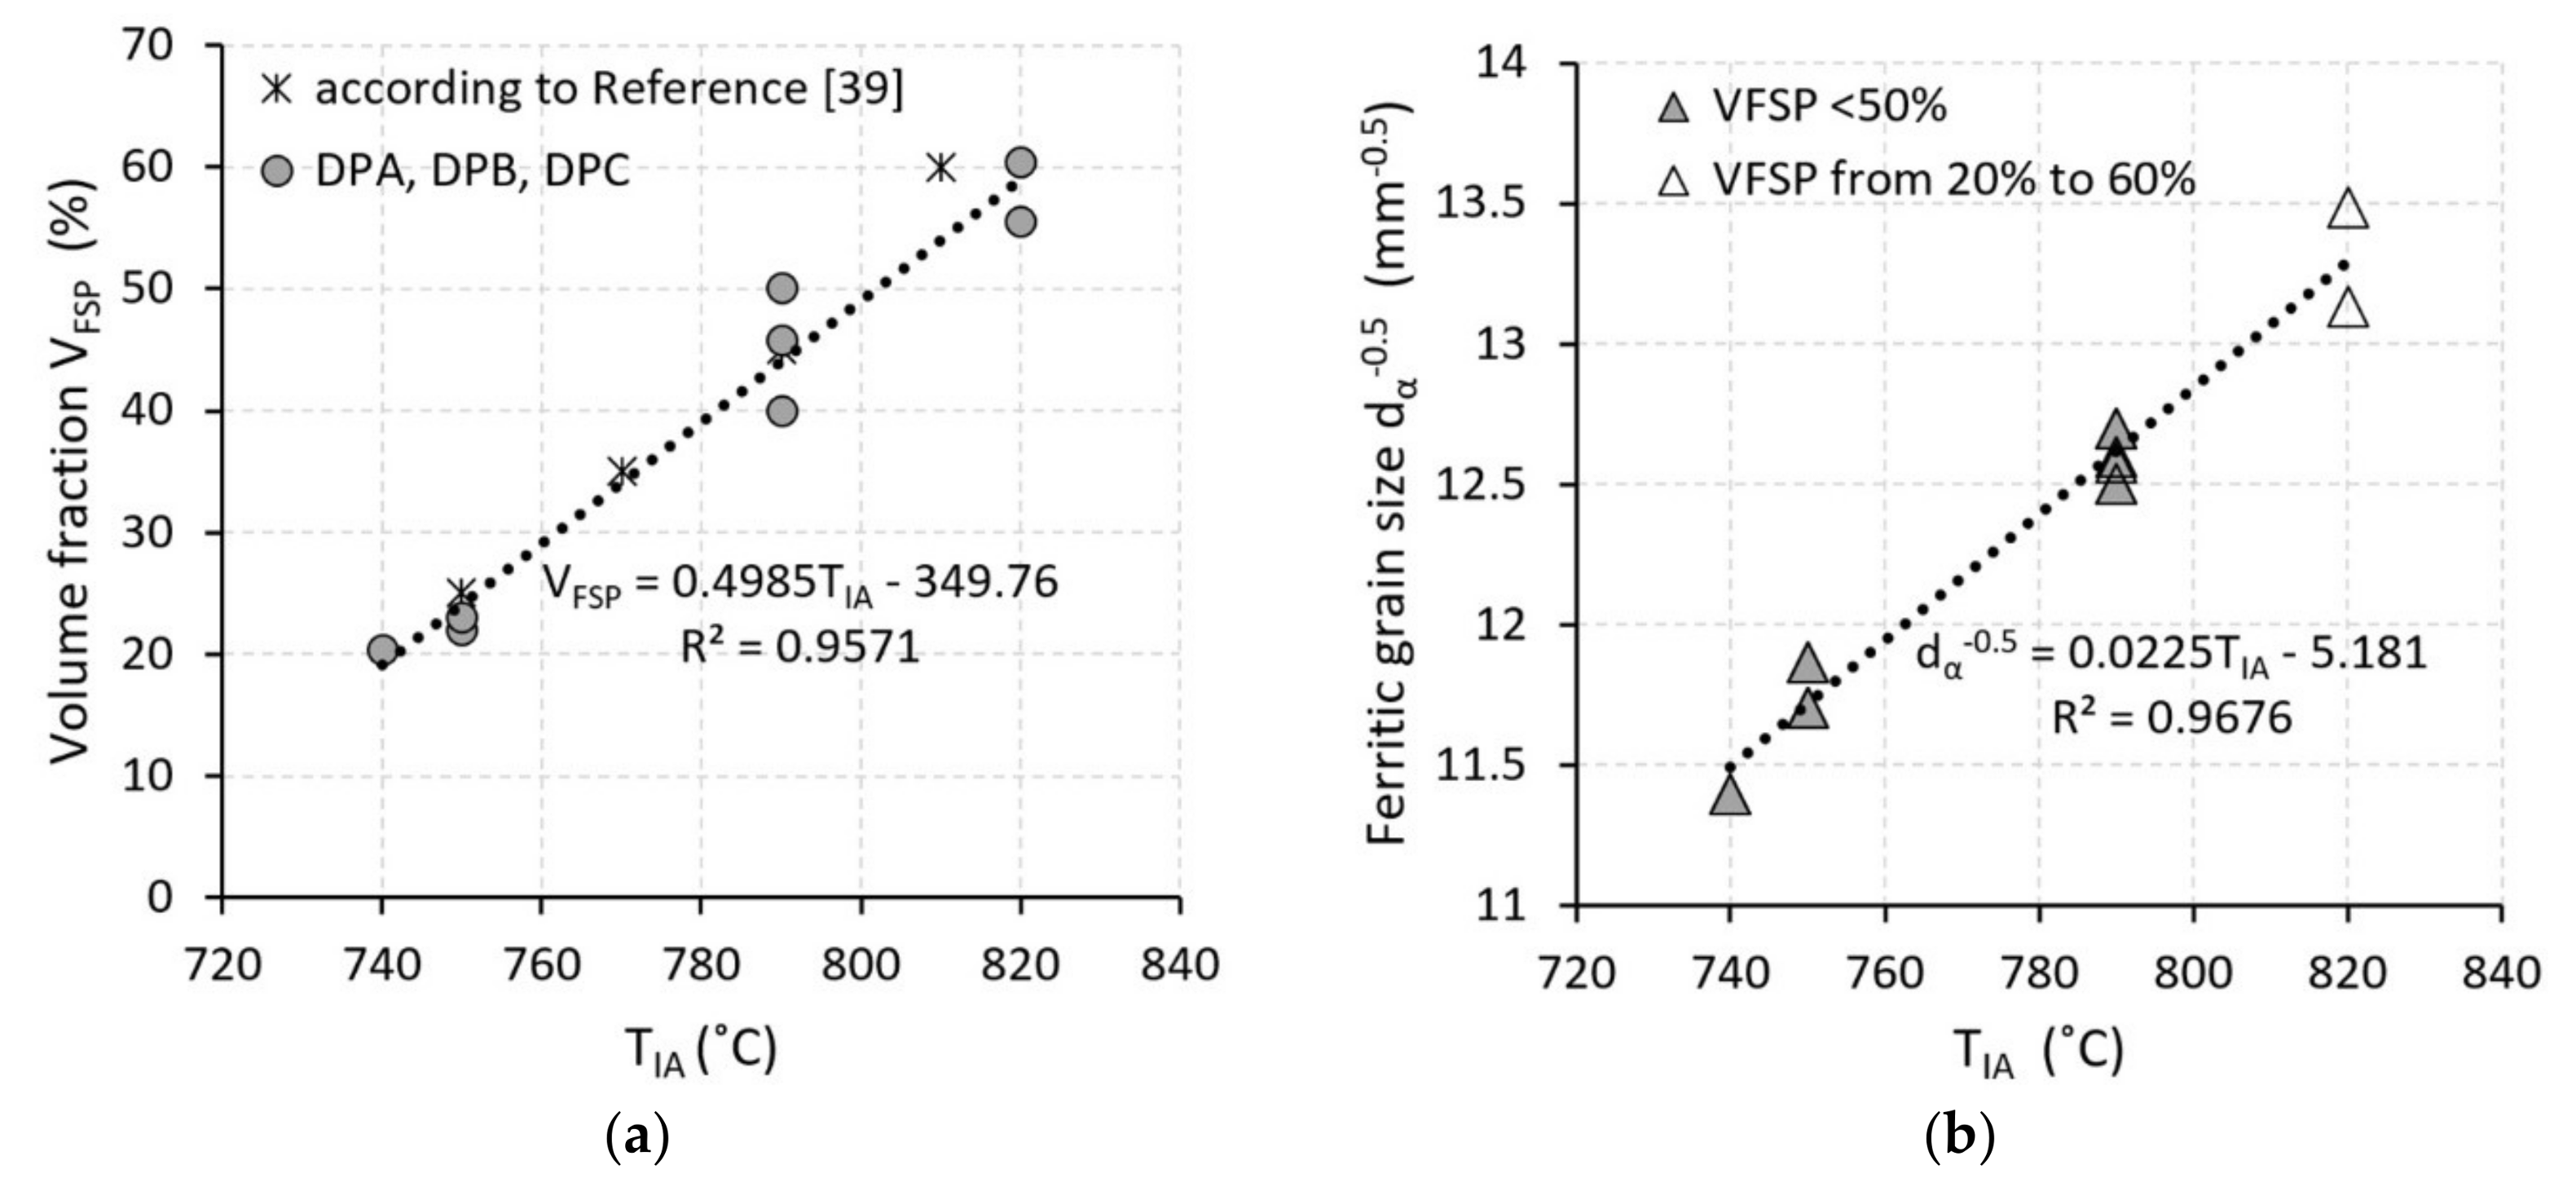
In determining the volume fraction of ferrite and martensite, the ferrite fraction was evaluated as the dominant phase, while the sum of all other phases (martensite, residual austenite, and bainite) represents the fraction of the secondary phase particles (FSP). This means that the fraction of the purely martensitic phase is slightly overestimated. However, the fraction of bainite, cementite, and residual austenite in the analyzed states of DPA, DPB, and DPC was ±3% within the distribution of the volume fraction of martensite. In the samples of the DPA740, DPA790, and DPA840 states obtained by the heat treatment from the initial material A, the volume fraction of the martensite ranged between 23.4% and 68.2% and the ferritic grain size ranged from 4.7 to 7.7 µm; in the samples of the DPB750 and DPB820 states obtained by the heat treatment from the initial material B, the volume fraction of the martensite ranged between 22.4% and 58.6%, the ferritic grain size ranged from 7.7 to 3.1 µm; and in the samples of the DPC750, DPC820 states obtained by the heat treatment from the initial material C, the volume fraction of the martensite ranged between 23.8% and 64.4% and the ferritic grain size ranged from 5.2 to 7.3 µm. Thus, the assumption that the states obtained from the A and C materials with higher values of carbon equivalent would result in greater percentages of the secondary phase fractions—shown in Table 2 and Figure 7a—depending on the annealing temperature in the range between 740 and 820 °C, has been confirmed.
The dependence of the volume fractions of the secondary phase (Figure 7a) can be described by the regression model:
Independent of the observed structural differences, increased annealing temperature TIA resulted in refinement of the mean size of the ferritic grain in examined states—Figure 7b. This tendency of grain size refinement in the annealing temperature interval between 740 and 820 °C has been described by the regression model:
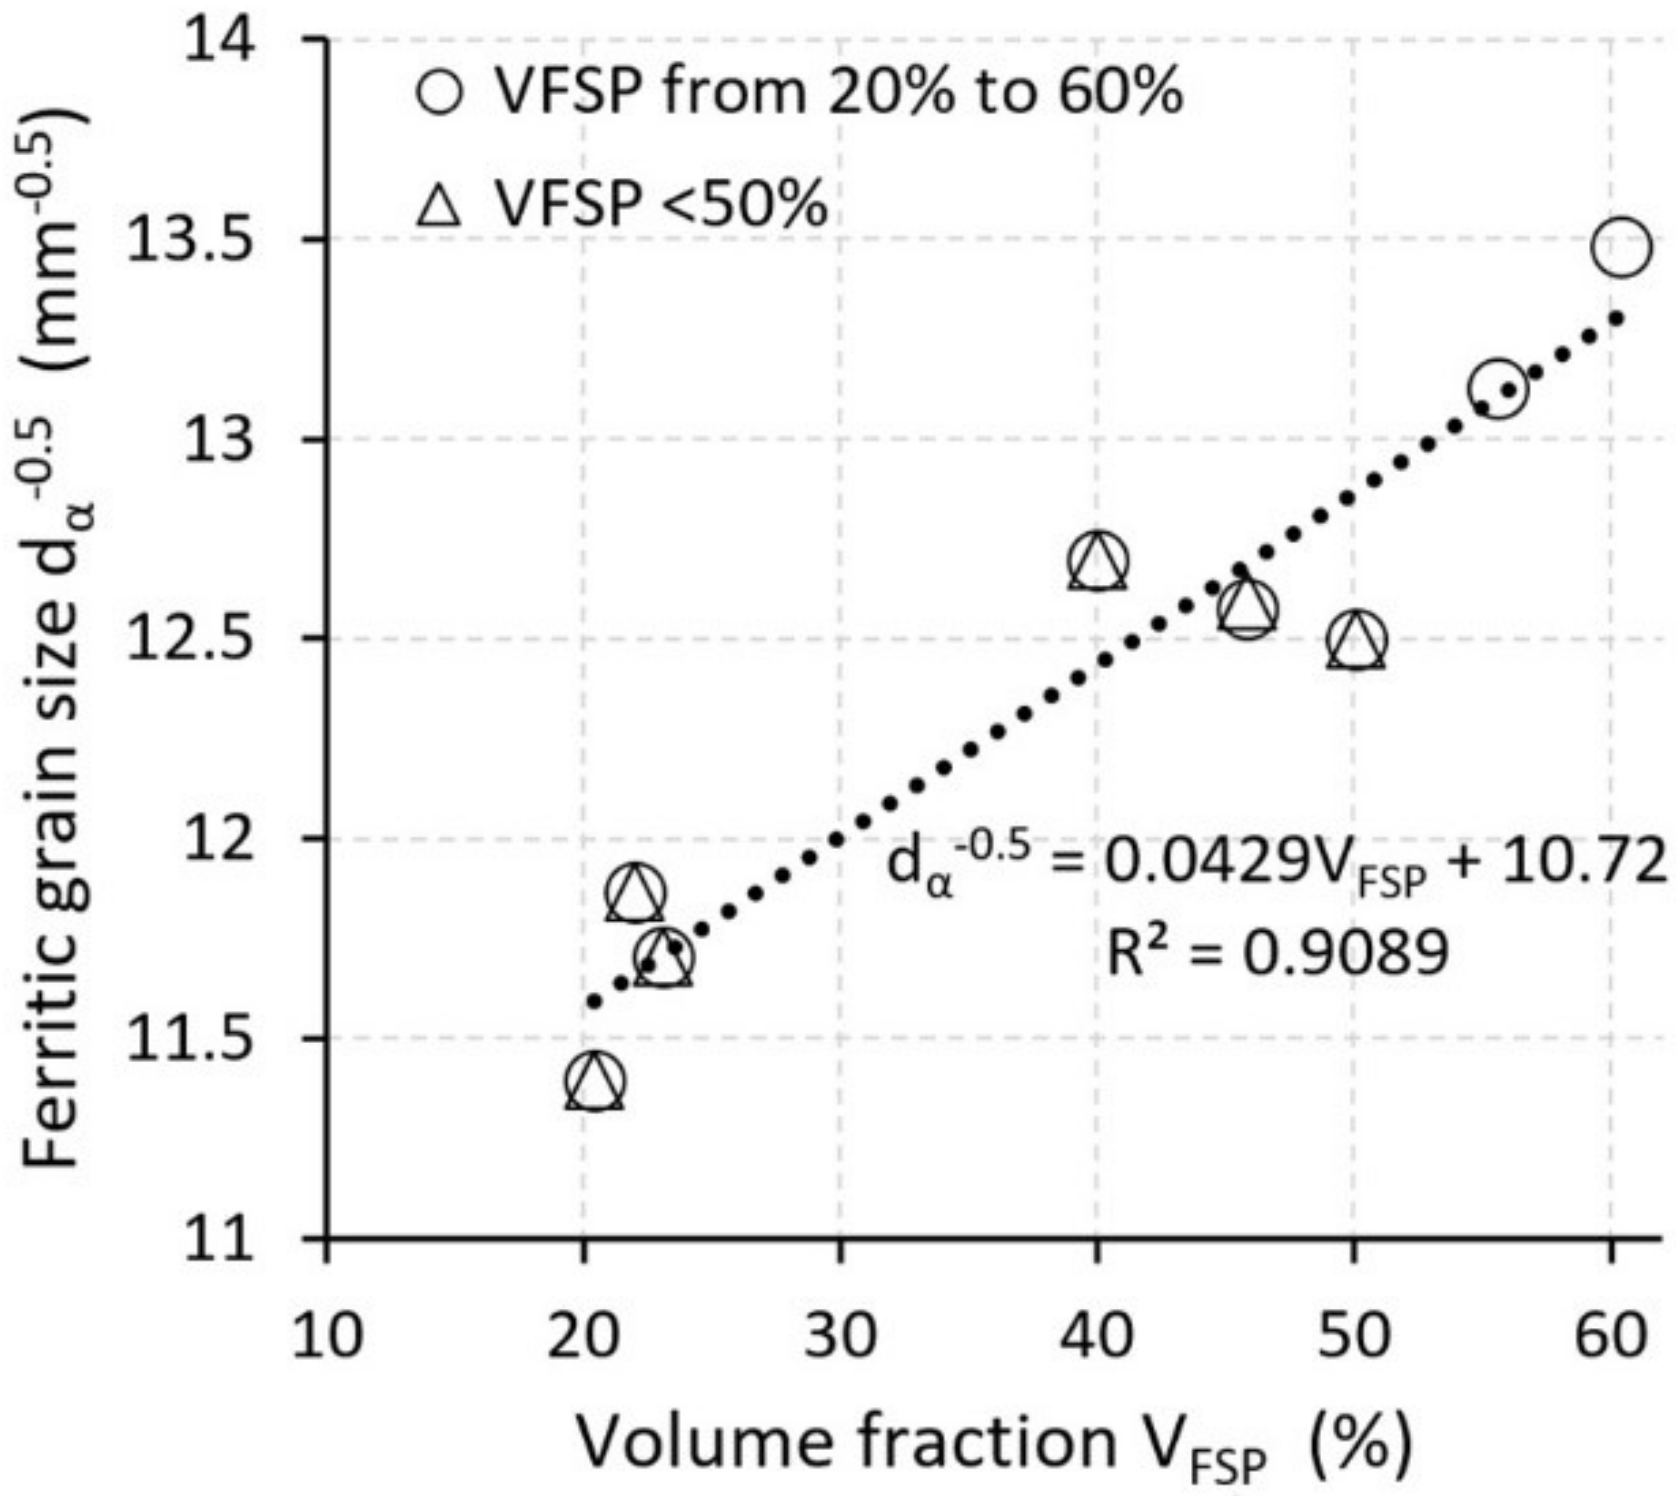
The interaction between the fractions of the secondary phase and the size of the ferrite grains as it is shown in Figure 8 is described by the regression model:
According to References [38,39], the increase in the secondary phase fractions of the dual phase ferritic-martensitic steel grades is mostly due to the number of grains of the secondary phase fractions rather than due to their volume in the structure. Regardless of the annealing temperature, it is possible to further increase the martensite fraction in the volume and the refinement of ferrite grain by increasing the rate of cooling [40].
The decisive criterion for the choice of steel sheets for the structural parts of the deformation zone of the car-body is the deformation work, which expresses the absorption capacity during a crash. The deformation work can be determined with greater uncertainty from the conventional stress-strain diagram as seen in Figure 1.
or with less uncertainty (more precisely) from the true stress–true strain diagram by application of Equation (3).
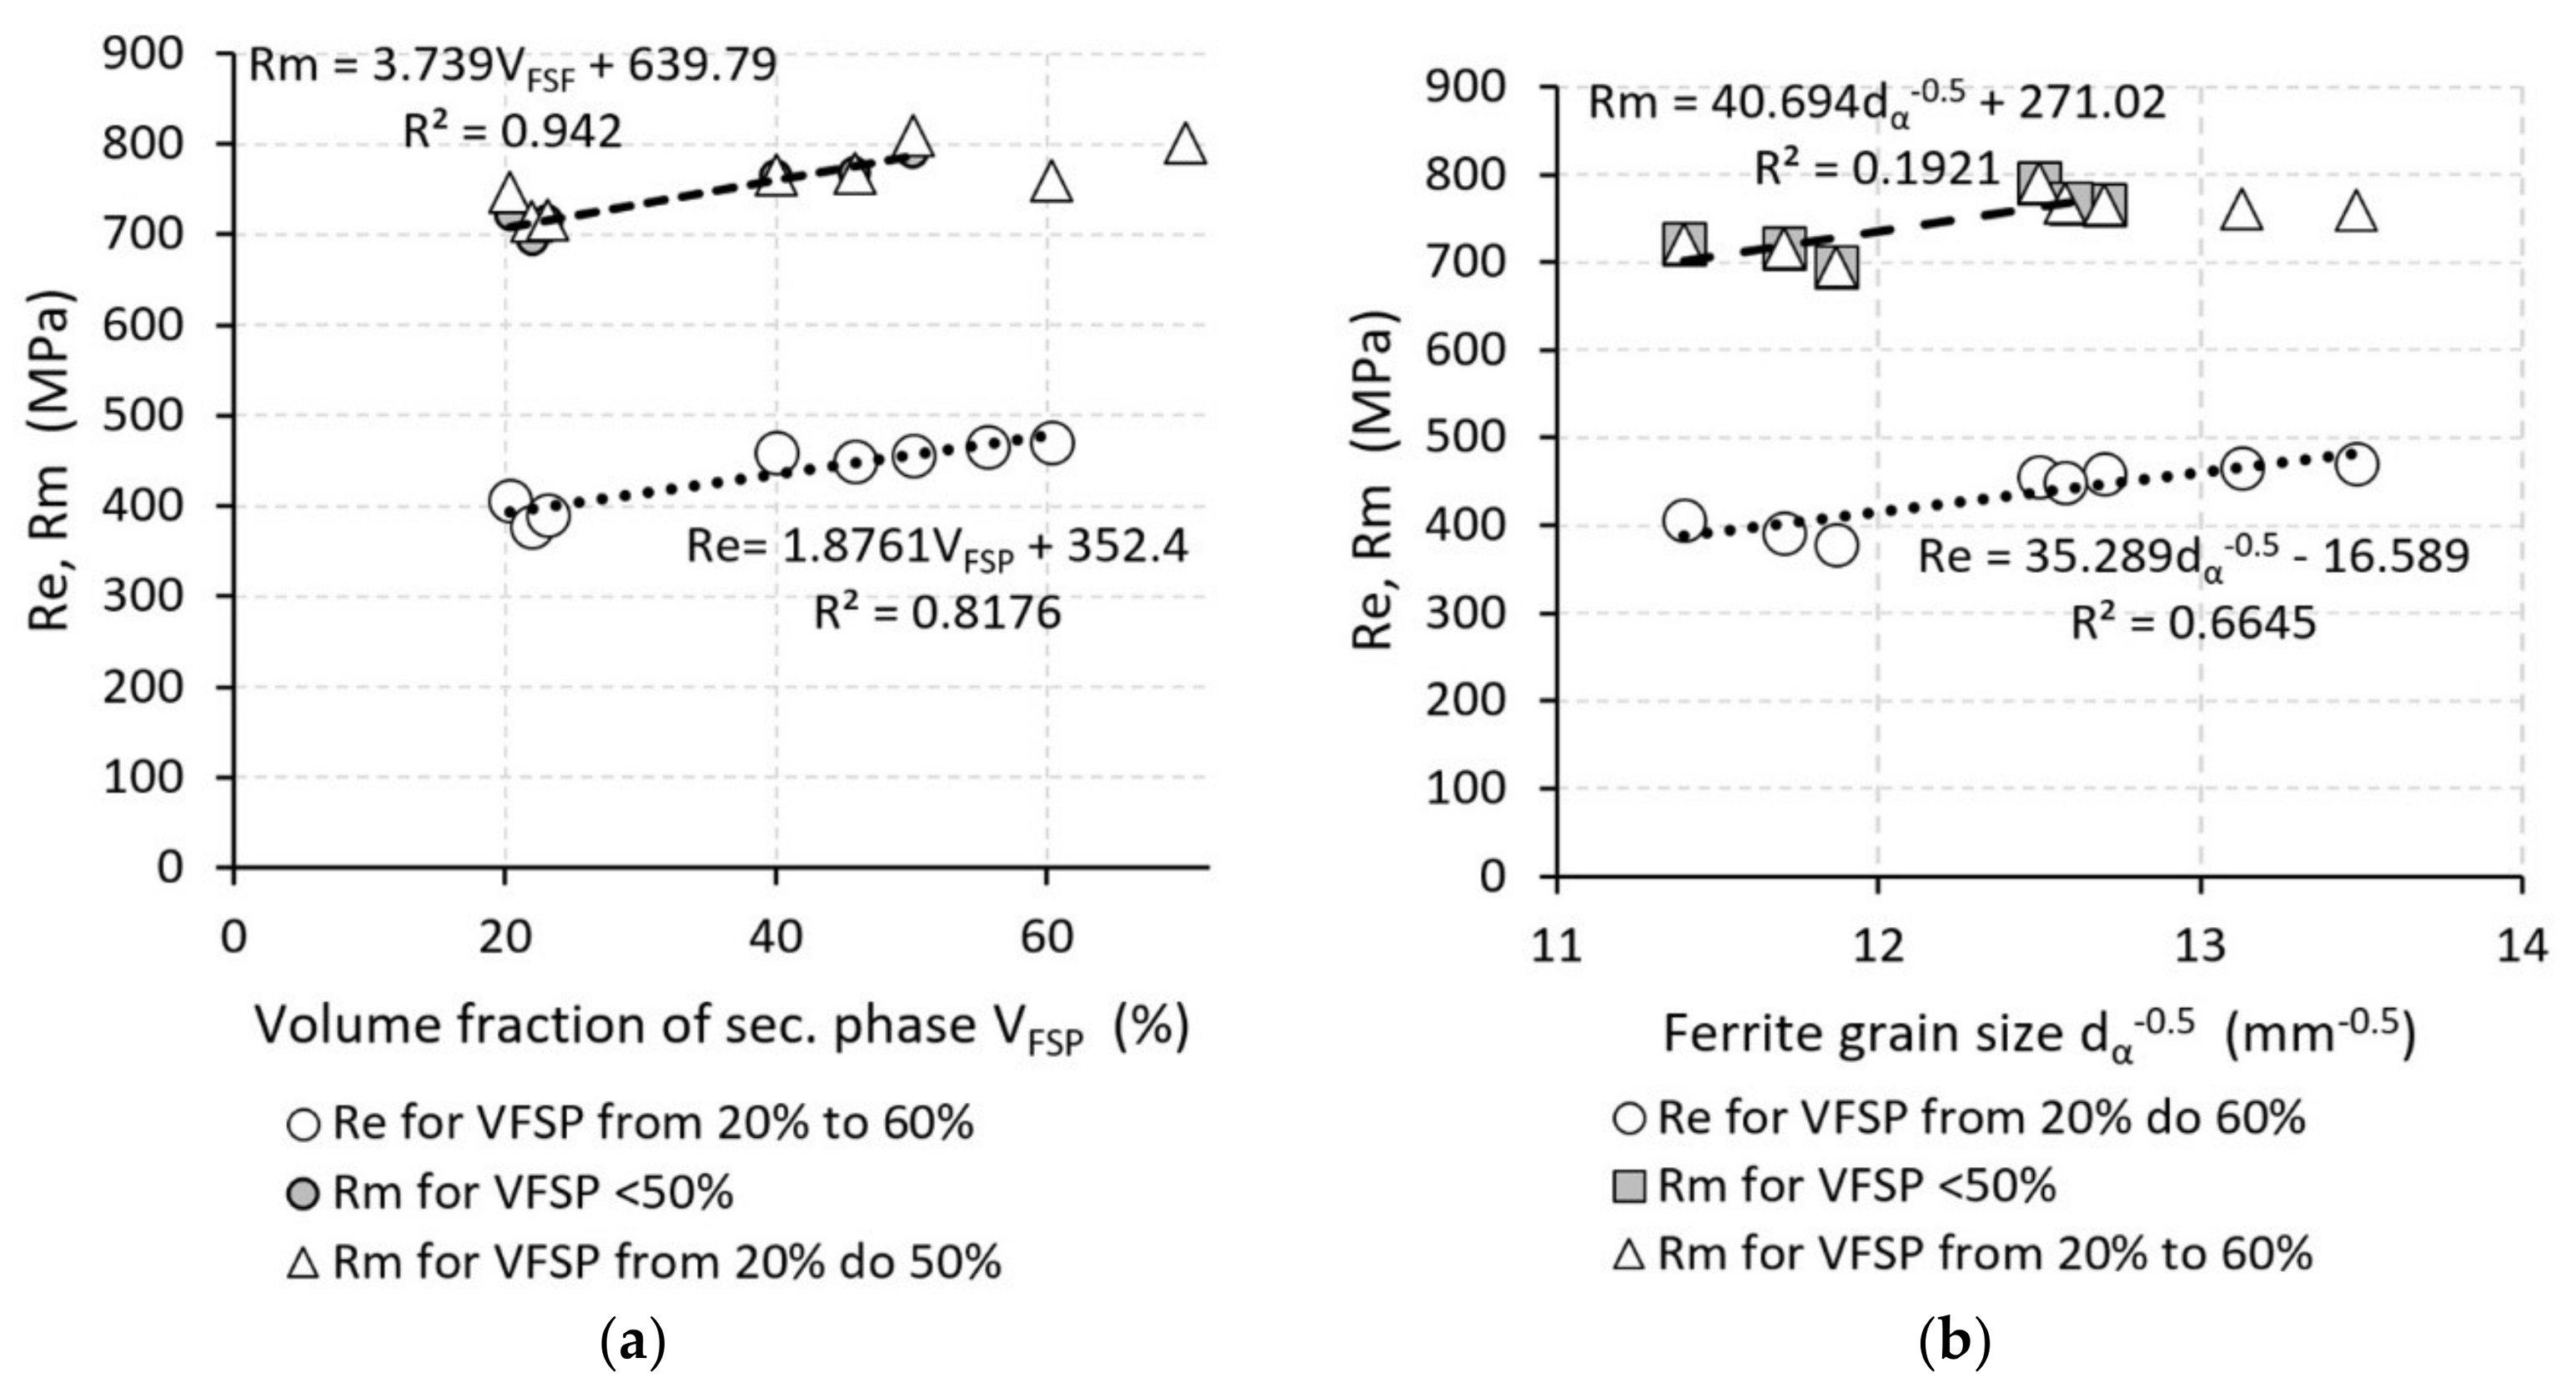
For the obtained states, the attention was focused on the analysis of the relationships between the mechanical properties (the yield strength Re, the tensile strength Rm, the uniform elongation Ag, the total elongation A, the material constant K, and the strain-hardening exponent n) and the parameters of the dual phase ferritic-martensitic steels structure. It follows from the measured results (Table 2 and Figure 9) that the increase in the volume fraction of the secondary phase resulted in the increased yield strength values by about 80 MPa and the increased tensile strength by about 78 MPa in the DPA states. For the DPB states, the yield strength increased by 92 MPa and the tensile strength increased by 81 MPa; for the DPC, the yield strength increased by 85 MPa and the tensile strength increased by 96 MPa. Higher strength properties (yield strength, tensile strength) of the obtained states are mainly related to the volume fraction of the secondary phase. The results obtained indicate a linear dependence of the tensile strength on the volume fraction of the secondary phase, described by the following regression equation:
However, the dependency of the tensile strength on the volume fraction of the secondary phase was found to be a linear, ranging between 20% and 50%, described by the regression equation as follows:
No increase in tensile strength has been observed for the volume fraction of the secondary phase greater than 50%. Rather, a decrease in tensile strength values has been noted. We assume that on the one hand, martensite contributes to an increase in tensile strength due to the increased volume of the harder phase (martensite), on the other hand, the carbon content of martensite decreases with the increasing volume of martensite. As is well known, the strength of martensite is mainly determined by its carbon content. Another reason for the reduced tensile strength values may be due to the size of martensite islands and martensite distributions in the ferrite matrix [11,32,39]. At lower annealing temperatures TIA 740 or 750 °C, martensite was dispersed along the borders of ferritic grains, however, at the annealing temperature of 820 °C, the size of martensitic fractions was greater in comparison to the states obtained under the annealing temperature of 740 or 750 °C (Figure 4, Figure 5 and Figure 6).
It follows, from Figure 9b, that the lower the size of the ferritic grain dα−0.5, the larger the yield strength and tensile strength values that have been observed. These curves have been described by the regression models in Equations (27) and (28).
and similarly, in the 20% to 50% interval for the tensile strength
However, it should be noted that the tensile strength dependency on the size of the ferritic grain dα–0.5 is more of a tendency because the residual dispersion value R2 = 0.192 was low.
The influence of strengthening contributors in terms of the individual structural parameters on the strength properties of dual phase ferritic-martensitic materials cannot be assessed separately. For this reason, attention was focused on expressing the summary influence of the structural parameters on the yield strength according to Equation (13) by the unit sum Sj of the individual parameters of the structure. The unit sum Sj of the parameters of the structure was determined as the ratio of yield strengths expressed by the Equations (25) and (27) with respect to the yield strength value of the reference material DPA750 (Re = 406 MPa) as follows:
where i is the number of parameters of the structure (i = 3), Re,ref is the yield strength value of the reference material, and kyαi is a constant expressing the influence of the ferritic grain size.
The dependence of the yield strength on the unit sum of the parameters of the structure SiRe is given in Figure 10 and expressed through the following regression model:
Then, after inserting Equation (29) into Equation (30), while taking into account the relationships given by Equations (25) and (27) and after the subsequent adjustment, we arrive at the following result:
If we insert Equation (22) into Equation (31) as dα and we insert Equation (21) as VFSP, we obtain the relation from which we can predict the yield strength dependent on the annealing temperature:
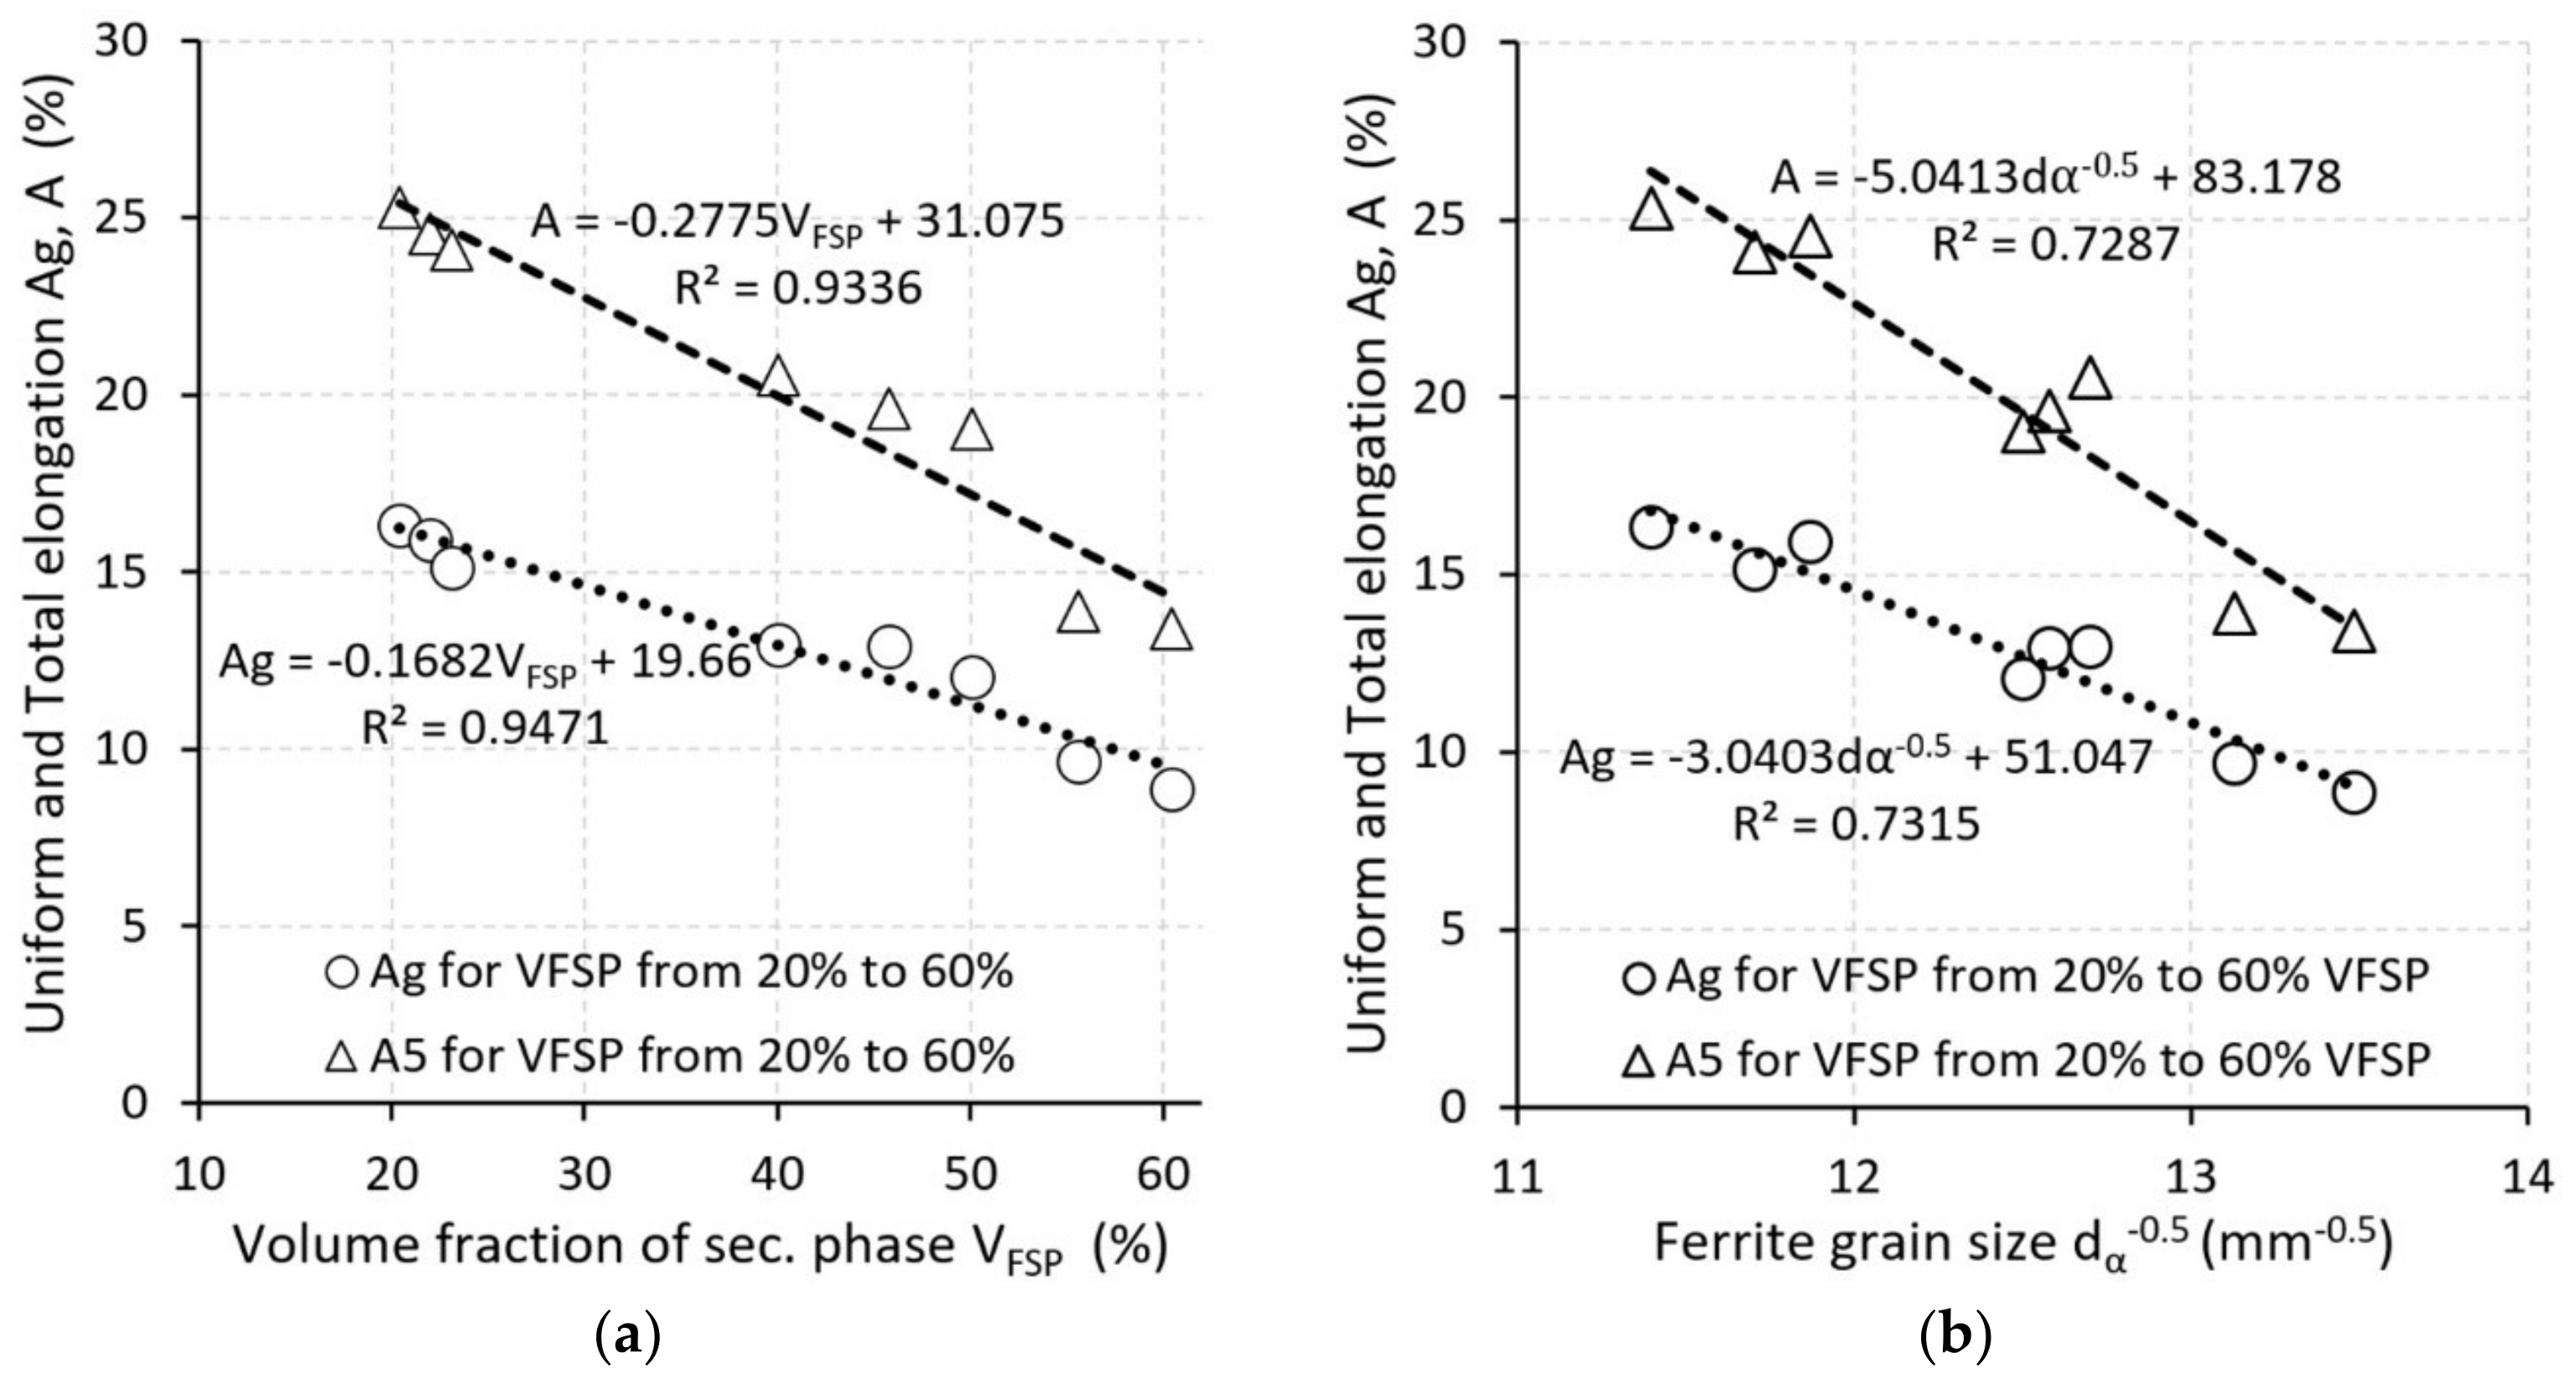
To determine the deformation work, it is necessary to know the value of the uniform elongation Ag. Figure 11 shows that the increasing volume fraction of the secondary phase causes the values of the total elongation and the uniform elongation to drop. A similar trend was found in Reference [32]. The uniform deformation values Ag ranged from 8.8 to 16.3 and total deformation A ranged from 17.1 to 25.3. At the annealing temperature of 840 °C, the lower Ag and A values were recorded compared to the states obtained at 750 °C. We assume that this tendency may be related in particular to the morphology and the distribution of secondary phase fractions.
It should be noted that in most metallic materials, the dependence force on the elongation, or the conventional strength on the deformation, is flat in the area of the maximum uniform elongation Ag. If we determine the elongation ∆Li from the conventional diagram (Figure 1) at the moment when
The Ag value will be determined by the following relation:
Then, the value of the uniform deformation does not allow for the precise deformation work to be determined by Equation (3). The deformation work in the interval from A = 0.2% to the maximum uniform deformation Ag, does not express the overall deformation work of the material, as the material resistance to the deformation increases even with a greater deformation than Ag (Figure 1). For this reason, we recommend using a reduced elongation value Ags, to be determined from the tolerance range as 1/3 of the difference of the total elongation A and the uniform elongation Ag relative to the standard quadratic deviation of the measured values of A and Ag (STDEVA, Ag), according to the six-sigma method:
Then the reduced value of the uniform elongation will be:
and the true strain (or real deformation) will be:
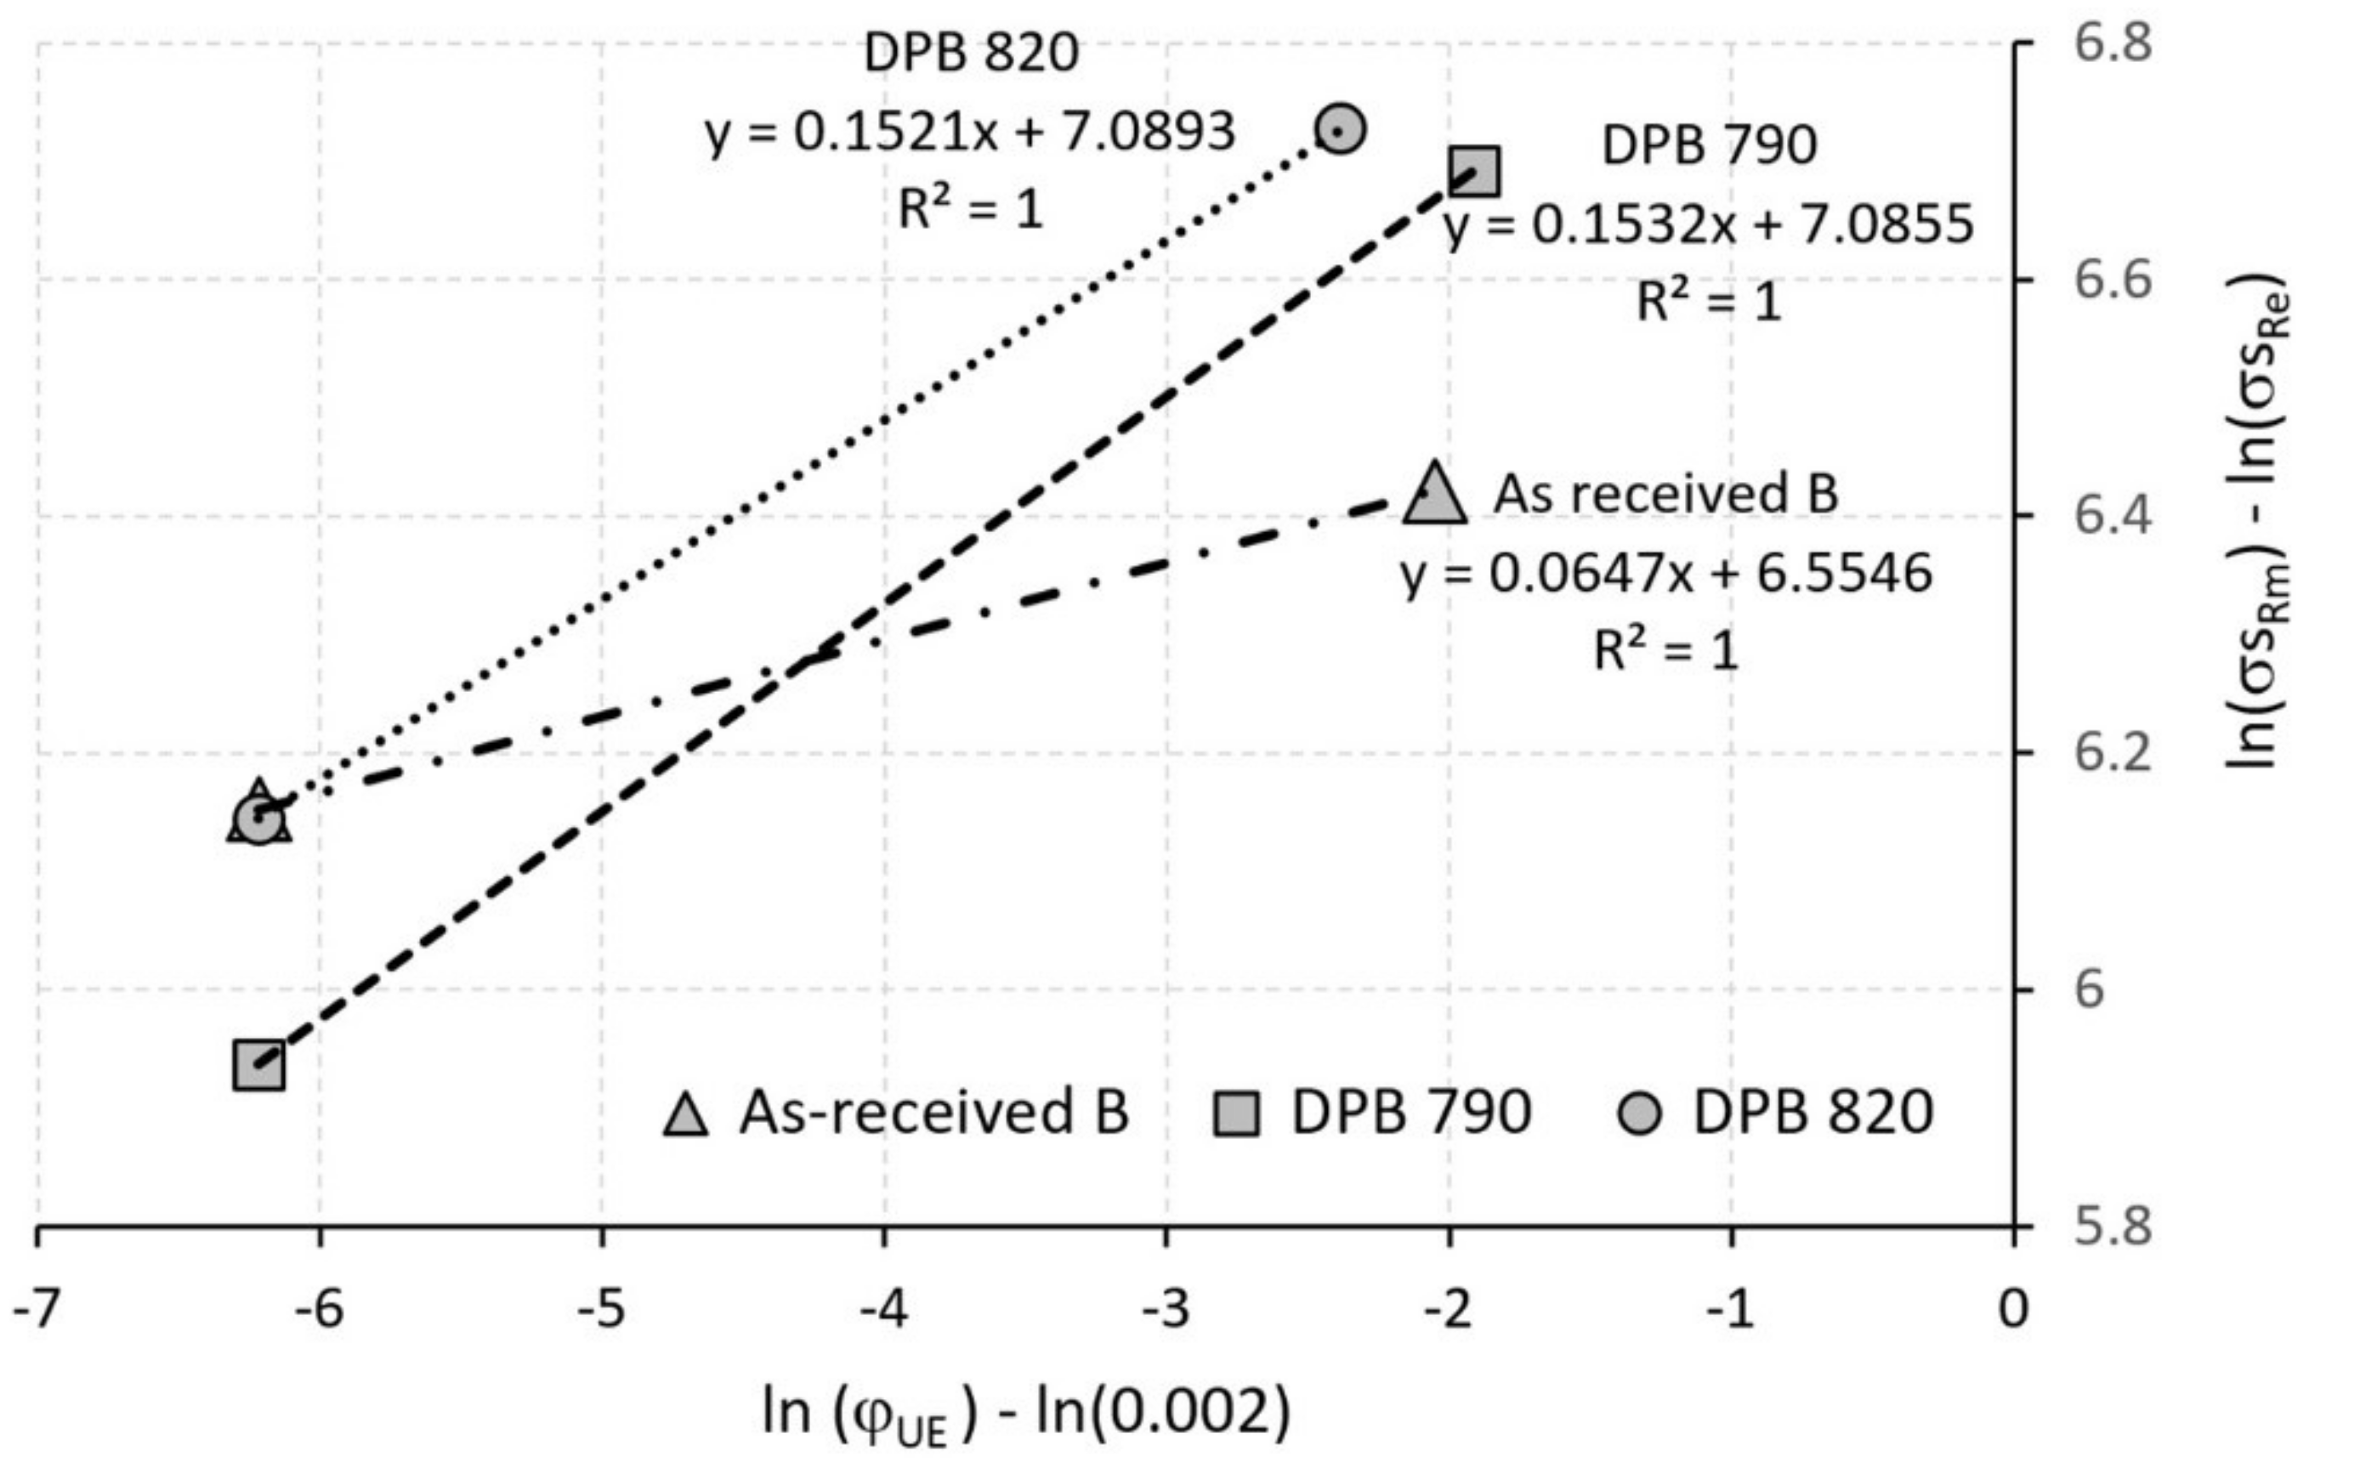
Trend analyses of the dependence of the immediate stress value on deformation in the interval from A = 0.002 to the maximum uniform deformation of Ags (Figure 1) allow the designers in the automotive industry to understand the differences of mechanical behavior in conventional and advanced high-strength steel grades in crashes and it allows designers to optimize the choice of the materials for individual “tailored” parts of deformation zones. When compared to the initial material A, the (gradient) curve directions (Figure 12) under the DPA, DPB, and DPC states show that the obtained states of DPA, DPB and DPC exhibit a more favorable course of material resistance to deformation and thus, the course of the deceleration at a crash in comparison to the curve of the steel A.
The direction or the slope of the curves express the degree of steel deformability and also the intensity of the deformation resistance upon deformation. Figure 12 shows that the states obtained at lower annealing temperatures, whose strain-hardening exponent values are higher than in the states obtained at higher temperatures, exhibit the greatest deformation resistance.
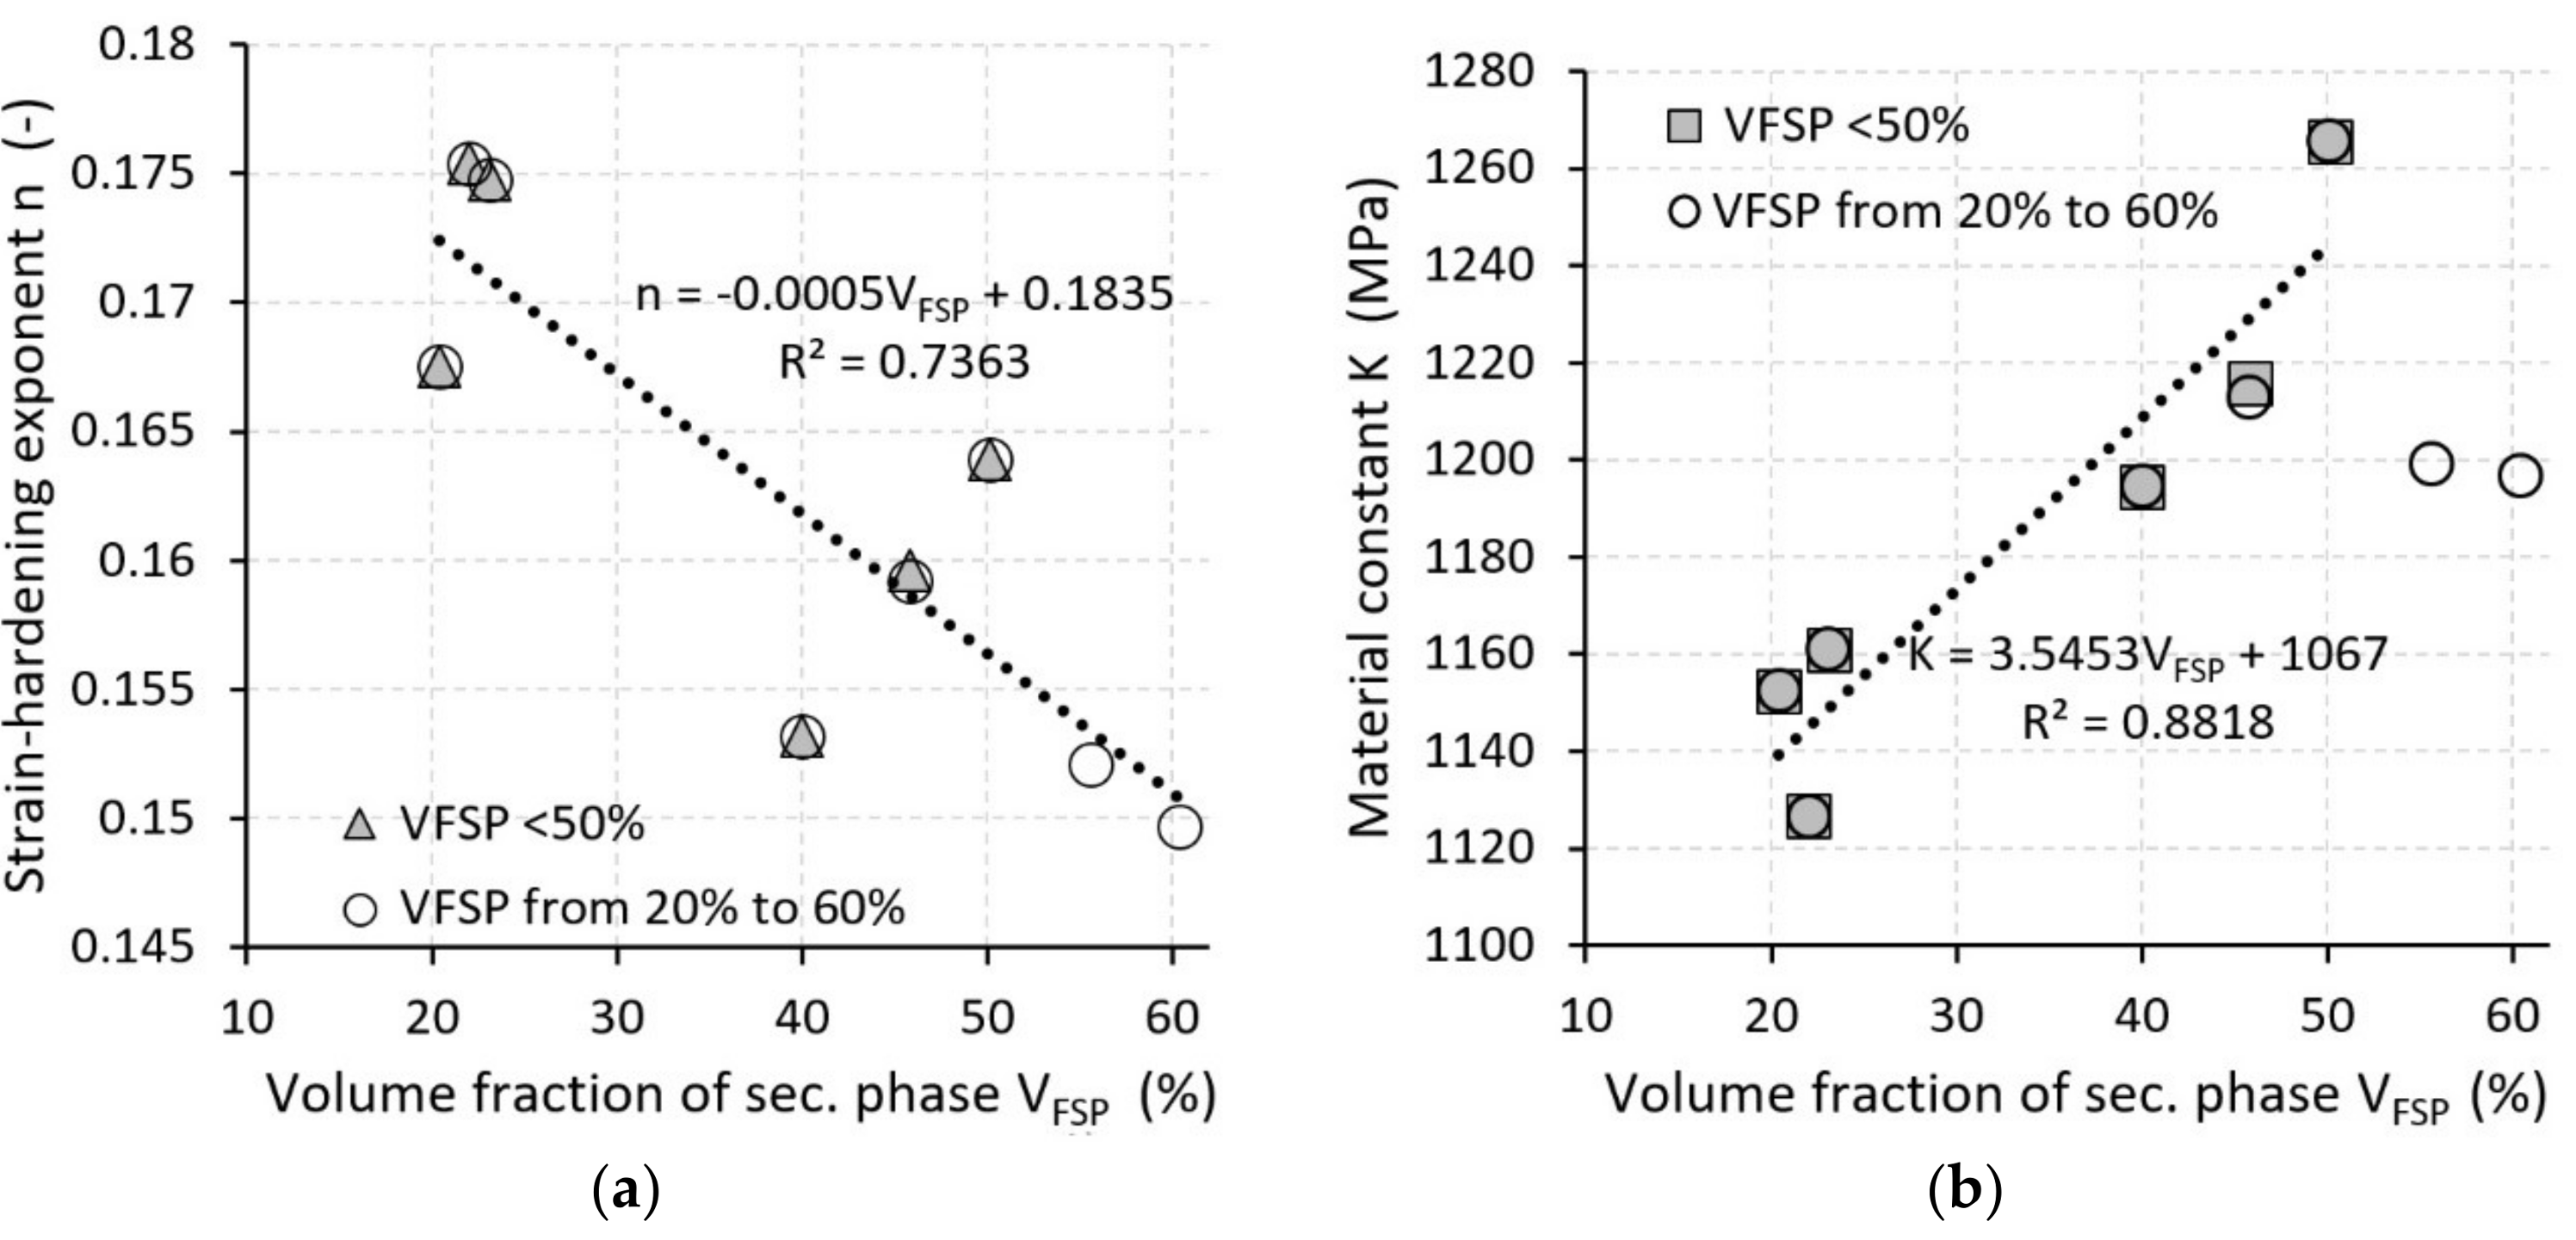
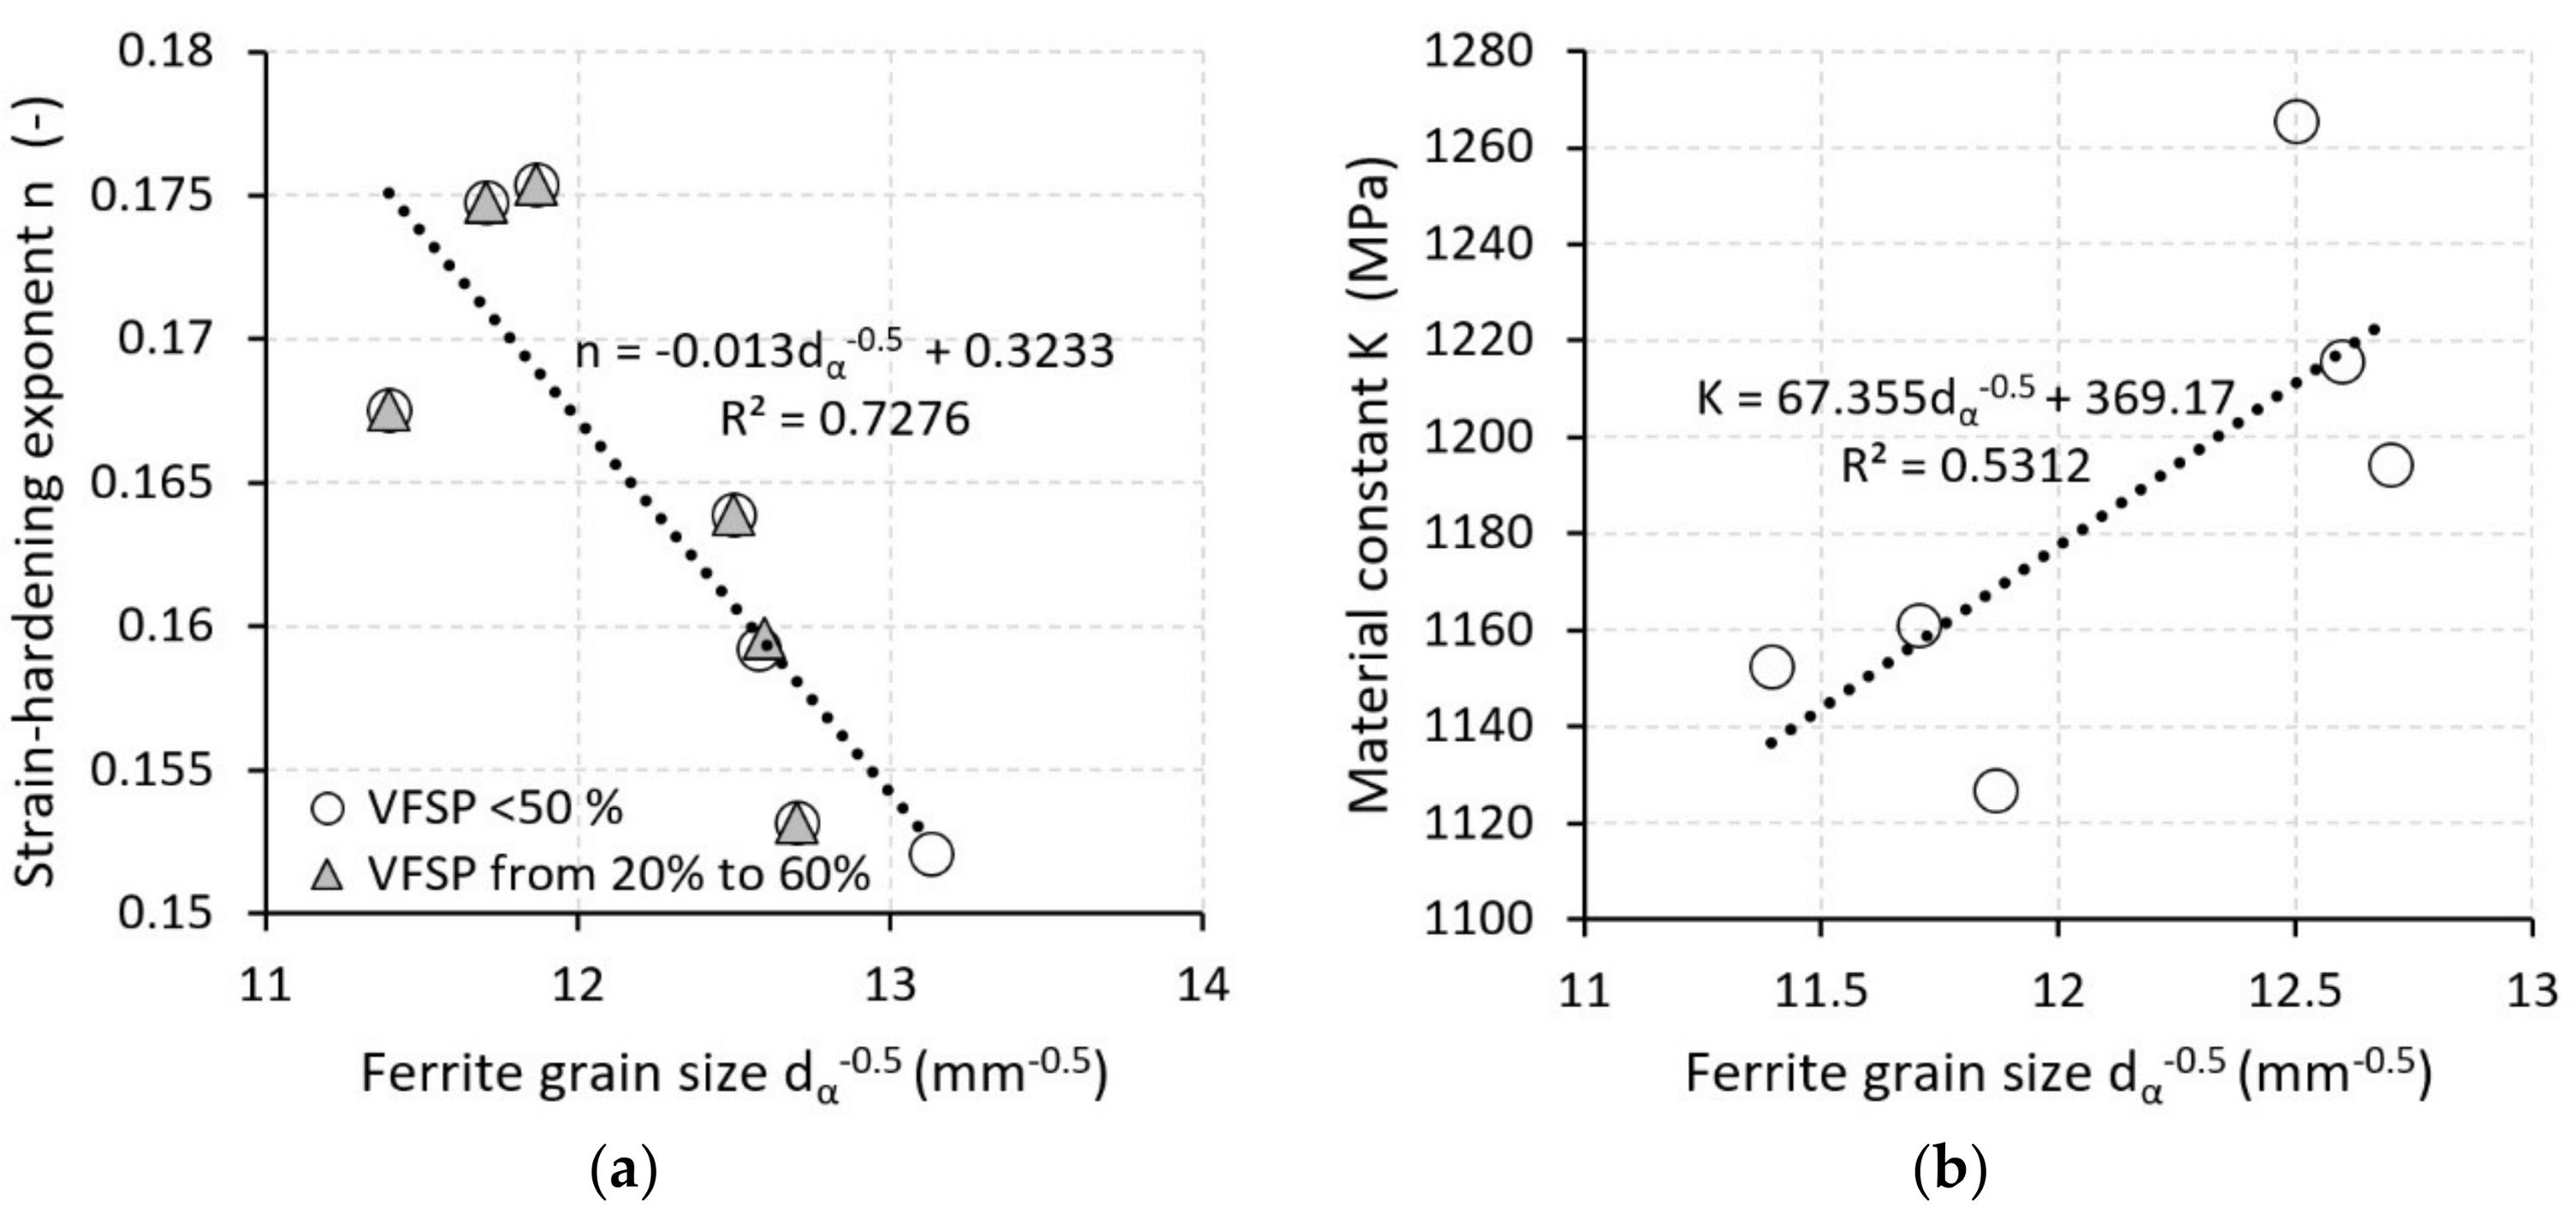
Figure 13 and Figure 14 show that the material constant K and the strain-hardening exponent n depend on the thermomechanical history of steel, with the strain-hardening exponent n being more sensitive to changes in the parameters of the structure than the material constant K. In terms of physics, the strain-hardening exponent n determines the ability of the steel to distribute the stress along the tensile specimen. For low-carbon steel grades, used in the production of complex car-body shapes, the required value of n is >0.22. The higher the n-value, the more uniform the deformation distribution, the greater the steel’s resistance to deformation, and the better its formability [39,40,41].
Equation (13) allows for the estimation of the real strength of the material using empirical models based only on the structural parameters of ferritic-martensitic steel grades. This model describes the deformation behavior dependent on the volume fraction of the secondary phase, the ferrite grain size, and the lattice friction stress required for the dislocation motion. Another important parameter that affects the deformation behavior of metallic materials is the density of dislocations. The density of the dislocations is different for each material. The combined effects of the structural parameters of model (13) differ in the density of dislocations. We can express the density of dislocations from the actual difference in tensile strength:
and the actual strength at the yield strength:
After adjustment, we obtain the contribution coming from the density of dislocations upon deformation at the tensile strength limit:
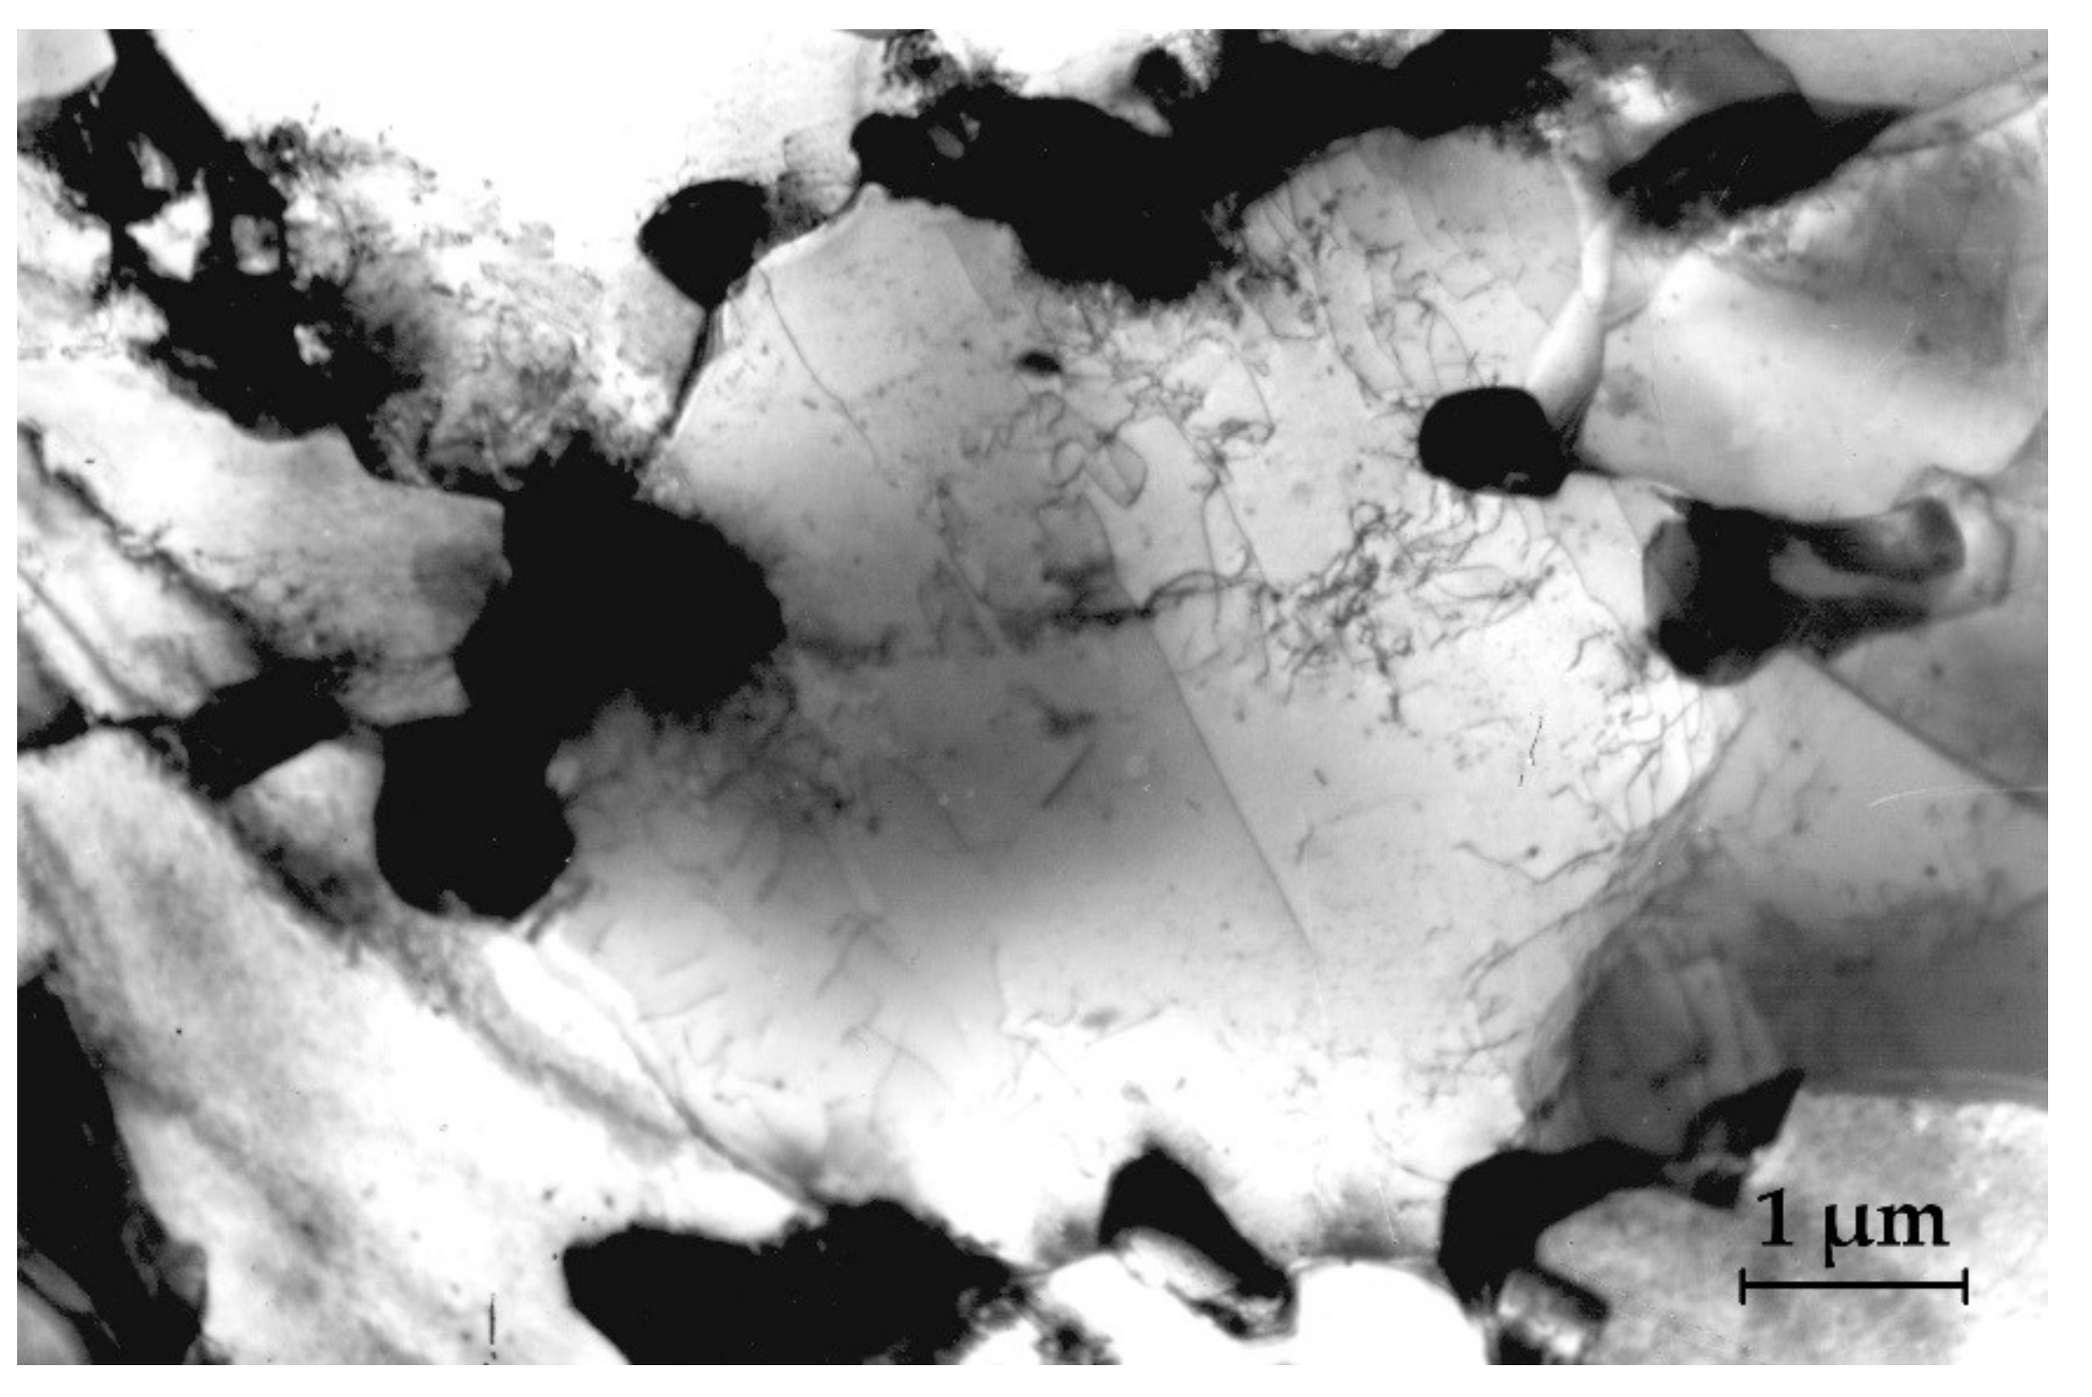
The high values of the dislocation densities in the dual phase steel grades listed in Table 4 are not surprising since the transformation of austenite into martensite is the cause of great stress in ferrites. Near the martensite fractions, the dislocation density may be even higher (Figure 15). For example, Reference [34] states that, depending on the deformation in DP 500, the dislocation density values can range from 1.5 × 10¹⁴ m−2 up to 1.7 × 10¹⁵ m−2.
5. Conclusions
The experimental work in this paper was focused on reaching dual phase steel types with different volume fractions of martensite, within a range of 20–70%. This was done by changing the intercritical annealing temperatures. The reached states were analyzed using optical microscopy and transmission electron microscopy and the mechanical properties were measured by the tensile test. The size of the martensitic islands depended on the volume fraction of martensite. It was found that increasing the volume fraction of martensite increases the strength and lowers the ductility. The mechanical properties are strongly influenced by the morphology of the disperse martensitic phase. The results for the prediction material constant K and the strain-hardening exponent n, reached from constitutive relations, were acceptable in comparison with the results reported in Reference [34].
The volume fraction of the secondary phase grew with the increased temperature of the intercritical annealing and the refinement of the ferritic grain appeared. The dependencies of both the volume fraction of the secondary phase and the ferritic grain size on the intercritical annealing temperature have been described by means of regression equations. Thus, the paper proposes equations predicting the yield strength, the uniform elongation and the true stress (the true strain curve depending on both the volume fraction of the secondary phase VFPS and the mean size of the ferrite grain dα). A complex relationship between the yield strength and the microstructure parameters makes it possible to describe the deformation behavior of dual phase steels during deformation in physical terms.
Based on the relationships obtained, material engineers and designers will be able to design the dual phase steel grades with a wide range of strength-plastic properties, that is, “tailor-made” to the requirements of the automotive industry. The nature of the deformation behavior of the steel resides in the stress increment, expressed by the strain-hardening exponent. The results obtained show that the strain-hardening exponent n depends on the structural parameters (volume fraction of the secondary phase and grain size) and the state of the substructure (dislocation density). The proposed model might be verified and used by the engineers during the selection of material for car-body structural parts of the safety zones, especially to gain compatibility in the crash situations of different classes of cars.
Acknowledgments
The authors are grateful for the support given to the experimental works by the Slovak Research and Development Agency, under project APVV-0273-12 “Supporting innovations of auto body components from the steel sheet blanks oriented to the safety, the ecology and the car weight reduction”, as well as the grant agency for the support of the project VEGA 2/0113/16 “Influence of laser welding parameters on structure and properties of welded joints of advanced steels for the automotive industry”.
Author Contributions
Emil Evin and Ján Kepič conceived and designed the experiments; Katarína Buriková and Miroslav Tomáš performed the experiments; Emil Evin, Ján Kepič, and Miroslav Tomáš analyzed the data; Emil Evin and Miroslav Tomáš wrote the paper.
Conflicts of Interest
The authors declare no conflict of interest.
References
- Jung, J.; Jun, S.; Lee, H.-S.; Kim, B.-M.; Lee, M.-G.; Kim, J.H. Anisotropic Hardening Behaviour and Springback of Advanced High-Strength Steels. Metals 2017, 7, 480. [Google Scholar] [CrossRef]
- Ramazani, A.; Mukherjee, K.; Abdurakhmanov, A.; Abbasi, M.; Prahl, U. Characterization of Microstructure and Mechanical Properties of Resistance Spot Welded DP600 Steel. Metals 2015, 5, 1704–1716. [Google Scholar] [CrossRef] [Green Version]
- Švec, P.; Schrek, A.; Dománková, M. Microstructural characteristics of fibre laser welded joint of dual phase steel with complex phase steel. Kovove Mater. 2018, 56, 29–40. [Google Scholar] [CrossRef]
- Cornette, D.; Hourman, T.; Hudin, O.; Laurent, J.; Reynaert, A. High strength steels for automotive safety parts. SAE Tech. Pap. 2001. [Google Scholar] [CrossRef]
- Mihaliková, M.; Német, M. The Effect of Strain Rate on the Mechanical Properties of Automotive Steel Sheets. Acta Polytech. 2013, 53, 384–387. [Google Scholar]
- Amigo, F.J.; Camacho, A.M. Reduction of Induced Central Damage in Cold Extrusion of Dual-Phase Steel DP800 Using Double-Pass Dies. Metals 2017, 7, 335. [Google Scholar] [CrossRef]
- Wagoner, R.H.; Smith, G.R. Report: Advanced High Strength Steel Workshop; Columbus, OH, USA, 22–23 October 2006. Available online: http://li.mit.edu/Stuff/RHW/Upload/AHSSDRAFTReport10-29-06.pdf (accessed on 5 April 2018).
- Zhao, J.Z.; Mesplont, C.; De Cooman, C. Calculation of the phase transformation kinetics from a dilatation curve. J. Mater. Proc. Technol. 2002, 129, 345. [Google Scholar] [CrossRef]
- Džupon, M.; Parilák, Ľ.; Kollárová, M.; Sinaiová, I. Dual Phase Ferrite-Martensitic Steel Micro-Alloyed with V-Nb. Metalurgija 2007, 46, 15–20. [Google Scholar]
- Sodjit, S.; Uthaisangsuk, V. A micromechanical flow curve model for dual phase steels. J. Met. Mater. Miner. 2012, 22, 87–97. [Google Scholar]
- Evin, E.; Tomáš, M.; Kmec, J.; Németh, S.; Katalinč, B.; Wesellý, E. The Deformation Properties of High Strength Steel Sheets for Auto-Body Components. In Proceedings of the Procedia Engineering-24th DAAAM International Symposium on Intelligent Manufacturing and Automation 2013, Zadar, Croatia, 23–26 October 2013; Volume 69, pp. 758–767. [Google Scholar]
- Bleck, W.; Papaefthymiou, S.; Frehn, A. Microstructure and Tensile Properties in Dual Phase and Trip Steels. Steel Res. Int. 2004, 75, 704–710. [Google Scholar] [CrossRef]
- Tavares, S.S. M.; Pedroza, P.D.; Teodósio, J.R.; Gurova, T. Mechanical properties of a quenched and tempered dual phase steel. Scr. Mater. 1999, 40, 887–892. [Google Scholar] [CrossRef]
- Lis, J.; Lis, A.K.; Kolan, C. Processing and properties of C–Mn steel with dual-phase microstructure. J. Mater. Proc. Technol. 2005, 162–163, 350–354. [Google Scholar] [CrossRef]
- Speich, G.R.; Demarest, V.A.; Miller, R.L. Formation of austenite during intercritical annealing of dual phase steels. Metall. Trans. A 1981, 12, 1419–1428. [Google Scholar] [CrossRef]
- Waterschoot, T.; de Cooman, B.C.; vanderschueren, D. Influence of run-out table cooling patterns on transformation and mechanical properties of high strength dual phase and ferrite–bainite steels. Ironmak. Steelmak. 2013, 28, 185–190. [Google Scholar] [CrossRef]
- Mohaved, P.; Kolahgar, S.; Marashia, S.P.H. The effect of intercritical heat treatment temperature on the tensile properties and work hardening behavior of ferrite-martensite dual phase steels sheets. Mater. Sci. Eng. A 2009, 518, 1–6. [Google Scholar] [CrossRef]
- Maffei, B.; Salvatore, W.; Valentini, R. Dual-phase steels rebars for high-ductile r.c. structures, part I: Microstructural and mechanical characterization of steel rebars. Eng. Struct. 2007, 29, 3325–3332. [Google Scholar] [CrossRef]
- Gerbase, J.; Embury, J.D.; Hobbs, R.M. The mechanical behavior of some dual-phase steels—With emphasis in the initial work hardening rate. Struct. Prop. Dual-Phase Steels 1979, 118–144. [Google Scholar]
- Crawley, A.; Shahata, M.T.; Pussegoda, N. Processing, properties and modeling of experimental batch-annealed dual-phase steels. Fundam. Dual-Phase Steels 1981, 181–197. [Google Scholar]
- Sherman, A.M.; Davies, R.G.; Donlon, W.T. Electron microscopic study of deformed dual-phase steels. Met. Soc. AIME 1981, 85–94. [Google Scholar]
- Kumara, A.; Singh, S.B.; Rayb, K.K. Influence of bainite/martensite content on the tensile properties of low carbón dual-phase steels. Mater. Sci. Eng. A 2008, 474, 270–282. [Google Scholar] [CrossRef]
- Wang, W.; He, C.; Zhao, Z.; Wei, X. The limit drawing ratio and formability prediction of advanced high strength dual-phase steels. Mater. Des. 2011, 32, 3320–3327. [Google Scholar] [CrossRef]
- Colla, V.; De Sanctis, M.; Dimatteo, A.; Lovicu, G.; Solina, A.; Valentini, R. Strain Hardening Behavior of Dual-Phase Steels. Metall. Mater. Trans. 2009, 40, 2557–2567. [Google Scholar] [CrossRef]
- Davis, J.R.; Semiatin, S.L.; American Society for Metals. ASM Handbook Volume 14: Forming and Forging, 9th ed.; ASM International: Geauga County, OH, USA, 1988; ISBN 0-87170-007-7. [Google Scholar]
- Belingardi, G.; Chiandussi, G.; Ibba, A. Identification of strain-rate sensitivity parameters of steel sheet by genetic algorithm optimisation. WIT Trans. Built Environ. 2006, 85, 201–210. [Google Scholar]
- Larour, P.; Rusinek, A.; Klepaczko, J.R.; Bleck, W. Effects of Strain Rate and Identification of Material Constants for Three Automotive Steels. Steel Res. Int. 2007, 78, 348–358. [Google Scholar] [CrossRef]
- Evin, E.; Tomáš, M.; Výrostek, M. Quasistatic strain rates’ effect to the properties of advanced steels for automotive industry. Acta Metall. Slovaca 2016, 22, 14–23. [Google Scholar] [CrossRef]
- Nanda, T.; Kumar, B.R.; Singh, V. A simplified micromechanical modeling approach to predict the tensile flow curve behavior of dual-phase steels. J. Mater. Eng. Perform. 2017, 26, 5180–5187. [Google Scholar] [CrossRef]
- Rodriguez, R.M.; Gutierrez, I. Unified formulation to predict the tensile curves of steels with different microstructures. Mater. Sci. Forum 2003, 426–432, 4525–4530. [Google Scholar] [CrossRef]
- Uthaisangsuk, V.; Prahl, U.; Bleck, W. Micromechanical modelling of damage behaviour of multiphase steels. Comput. Mater. Sci. 2008, 43, 27–35. [Google Scholar] [CrossRef]
- De la Concepción, V.L.; Lorusso, H.N.; Svoboda, H.G. Effect of carbon content on microstructure and mechanical properties of dual phase steels. Procedia Mater. Sci. 2015, 8, 1047–1056. [Google Scholar] [CrossRef]
- Gutierrez, I. AME modelling the mechanical behaviour of steels with mixed microstructures. Metalurgija 2005, 11, 201–214. [Google Scholar]
- Bergström, Y.; Granbom, Y.; Sterkenburg, D. A Dislocation-Based Theory for the Deformation Hardening Behavior of DP Steels: Impact of Martensite Content and Ferrite Grain Size. J. Metall. 2010. [Google Scholar] [CrossRef]
- Yurioka, N.; Kasuya, T. A Chart Method to Determine Necessary Preheat Temperature in Steel Welding. Q. J. Jpn. Weld. Soc. 1995, 13, 347–357. [Google Scholar] [CrossRef]
- Andrews, K.W. Empirical Formulae for the Calculation of Some Transformation Temperatures. J. Iron Steel Inst. 1965, 203, 721–727. [Google Scholar]
- Boratto, F.; Barbosa, R.; Yue, S.; Jonas, J.J. Effect of Chemical Composition on Critical Temperatures of Microalloyed Steels. In Proceedings of the Iron and Steel Institute of Japan, THERMEC ’88, Tokyo, Japan, 6–10 June 1988; pp. 383–390. [Google Scholar]
- Buriková, K. Structural Nature of Multi-Phase Steels. Ph.D. Thesis, Institute of Materials Research-Slovak Academy of Sciences, Košice, Slovakia, 2009. [Google Scholar]
- Evin, E. Formability of Dual Phase Steels; Habilitation Work; Technical University of Košice-Faculty of Mechanical Engineering: Košice, Slovakia, 1996. [Google Scholar]
- Hrivňák, A.; Evin, E. Formability of Steels, 1st ed.; Elfa: Košice, Slovakia, 2004; ISBN 80-89066-93-3. [Google Scholar]
- Tomáš, M.; Hudák, J. Material formability of steel sheets for automotive industry. In Proceedings of the International Scientific Conference of Progressive Technologies and Materials, Bezmiechowa, Poland, 6–8 July 2009; Politechnika Rzeszowska: Rzeszów, Poland, 2009; pp. 299–302. [Google Scholar]
Figure 1.
The record of the tensile test.

Figure 2.
The microstructure of the as-received steels: (a) A—X60; (b) B—S460MC; (c) C—DP600.

Figure 3.
A specimen for the tensile test (unit: mm).

Figure 4.
The microstructure of material A after annealing: (a) DPA740; (b) DPA840.

Figure 5.
The microstructure of material B after annealing: (a) DPB750; (b) DPB820.

Figure 6.
The microstructure of material C after annealing: (a) DPC750; (b) DPC820.

Figure 7.
The dependencies of the structure parameters: (a) the volume fraction of the secondary phases; (b) the ferritic grain size and the annealing temperature.
Figure 7.
The dependencies of the structure parameters: (a) the volume fraction of the secondary phases; (b) the ferritic grain size and the annealing temperature.

Figure 8.
The dependence of the ferritic grain size on the volume fractions of the secondary phase.

Figure 9.
The dependence of the yield strength and tensile strength on (a) the volume fractions of the secondary phase; (b) the size of the ferritic grains.
Figure 9.
The dependence of the yield strength and tensile strength on (a) the volume fractions of the secondary phase; (b) the size of the ferritic grains.

Figure 10.
The dependence of the yield strength on the unit sum of the parameters of the structure.

Figure 11.
The dependence of the uniform and total elongation on (a) the volume fraction of the secondary phase; (b) the ferritic grain size.
Figure 11.
The dependence of the uniform and total elongation on (a) the volume fraction of the secondary phase; (b) the ferritic grain size.

Figure 12.
The dependence of the true stress on the deformation in logarithmic coordinates.

Figure 13.
The dependence of the material parameters on the volume fractions of secondary phases: (a) the strain-hardening exponent n; (b) the material constant K.
Figure 13.
The dependence of the material parameters on the volume fractions of secondary phases: (a) the strain-hardening exponent n; (b) the material constant K.

Figure 14.
The dependence of the material parameters on the ferritic grain size: (a) the strain-hardening exponent n; (b) the material constant K.
Figure 14.
The dependence of the material parameters on the ferritic grain size: (a) the strain-hardening exponent n; (b) the material constant K.

Figure 15.
The dislocation density in the ferrite grain near the martensitic fraction.


Table 1.
The chemical composition of the as-received steels (wt %).
| Material | C | Mn | Si | P | S | Al | N | Cr | V | Nb | CE | dα [µm] |
|---|---|---|---|---|---|---|---|---|---|---|---|---|
| X60 (A) | 0.082 | 1.44 | 0.29 | 0.012 | 0.005 | 0.038 | 0.0063 | 0.017 | 0.048 | 0.046 | 0.244 | 5.7 |
| S460MC (B) | 0.068 | 1.22 | 0.02 | 0.015 | 0.0037 | 0.05 | 0.0063 | 0.019 | 0.041 | 0.049 | 0.194 | 5.3 |
| DP600 (C) | 0.068 | 1.18 | 0.03 | 0.037 | 0.0054 | 0.037 | 0.0075 | 0.542 | 0.004 | 0.002 | 0.239 | 5.2 |
Table 2.
The calculated temperatures of phase transformations (°C).
| Material | AC1 | AC3 | Ar1 | Ar3 | Tnr | Bs | Bf | Ms | Mf |
|---|---|---|---|---|---|---|---|---|---|
| A | 716 | 845 | 508 | 770 | 995 | 677 | 557 | 425 | 259 |
| B | 712 | 860 | 537 | 791 | 1101 | 699 | 557 | 425 | 259 |
| C | 720 | 869 | 544 | 786 | 896 | 669 | 549 | 473 | 266 |
Table 3.
The mechanical properties of as-received steels and annealed states.
| Material | Annealing Temp. (°C) | VFSP ± 4 (%) | dα ± 0.3 (µm) | RP0.2 (MPa) | Rm (MPa) | Ag (%) | A (%) | HV5 ± 3 |
|---|---|---|---|---|---|---|---|---|
| As-received A | - | 5.7 | 540 | 605 | 15.4 | 29.0 | 171 | |
| DPA740 1 | 740 | 23.4 | 7.7 | 406 | 737 | 15.1 | 25.6 | 197 |
| DPA790 | 790 | 50.1 | 6.4 | 439 | 755 | 11.5 | 21.2 | 214 |
| DPA840 | 840 | 68.2 | 4.7 | 486 | 750 | 13.2 | 25.4 | 210 |
| As-received B | - | 5.3 | 469 | 541 | 13.7 | 29.6 | 162 | |
| DPB750 | 750 | 23.1 | 7.3 | 389 | 712 | 15.3 | 25.6 | 187 |
| DPB820 | 820 | 55.6 | 5.2 | 471 | 717 | 12.6 | 18.5 | 201 |
| As-received C | 24.2 | 5.2 | 405 | 639 | 15.5 | 28.0 | 220 | |
| DPC750 | 750 | 23.1 | 7.3 | 396 | 712 | 15.4 | 25.6 | 189 |
| DPC820 | 820 | 64.4 | 5.2 | 479 | 717 | 9.6 | 18.5 | 201 |
1 Reference material.
Table 4.
The calculated values of material constant K, the strain-hardening exponent n, and the dislocation density.
Table 4.
The calculated values of material constant K, the strain-hardening exponent n, and the dislocation density.
| Material | Annealing Temp. (°C) | Material Constant K (-) | Strain-Hardening Exponent n (-) | Dislocation Density (m−2) |
|---|---|---|---|---|
| As-received A | 702 | 0.06 | 4.48 × 10¹⁴ | |
| DPA740 1 | 740 | 1153 | 0.168 | 3.48 × 10¹⁵ |
| DPA790 | 790 | 1266 | 0.164 | 3.42 × 10¹⁵ |
| DPA840 | 840 | 1201 | 0.147 | 2.98 × 10¹⁵ |
| As-received B | 702 | 0.065 | 3.91 × 10¹⁴ | |
| DPB750 | 750 | 1127 | 0.175 | 3.38 × 10¹⁵ |
| DPB820 | 820 | 1255 | 0.152 | 2.52 × 10¹⁵ |
| As-received C | 969 | 0.140 | 2.15 × 10¹⁵ | |
| DPC750 | 750 | 1161 | 0.175 | 3.47 × 10¹⁵ |
| DPC820 | 820 | 1197 | 0.150 | 2.35 × 10¹⁵ |
1 Reference material.
© 2018 by the authors. Licensee MDPI, Basel, Switzerland. This article is an open access article distributed under the terms and conditions of the Creative Commons Attribution (CC BY) license (http://creativecommons.org/licenses/by/4.0/).
Share and Cite
MDPI and ACS Style
Evin, E.; Kepič, J.; Buriková, K.; Tomáš, M. The Prediction of the Mechanical Properties for Dual-Phase High Strength Steel Grades Based on Microstructure Characteristics. Metals 2018, 8, 242. https://doi.org/10.3390/met8040242
AMA Style
Evin E, Kepič J, Buriková K, Tomáš M. The Prediction of the Mechanical Properties for Dual-Phase High Strength Steel Grades Based on Microstructure Characteristics. Metals. 2018; 8(4):242. https://doi.org/10.3390/met8040242
Chicago/Turabian StyleEvin, Emil, Ján Kepič, Katarína Buriková, and Miroslav Tomáš. 2018. "The Prediction of the Mechanical Properties for Dual-Phase High Strength Steel Grades Based on Microstructure Characteristics" Metals 8, no. 4: 242. https://doi.org/10.3390/met8040242
Note that from the first issue of 2016, this journal uses article numbers instead of page numbers. See further details here.