Article

Microstructure and Mechanical Properties of Ultrasonic Spot Welded Mg/Al Alloy Dissimilar Joints

1
College of Engineering and Technology, Southwest University, Tiansheng Road 2, Beibei District, Chongqing 400715, China
2
Department of Mechanical and Industrial Engineering, Ryerson University, 350 Victoria Street, Toronto, ON M5B 2K3, Canada
3
Faculty of Materials and Energy, Southwest University, Tiansheng Road 2, Beibei District, Chongqing 400715, China
4
Advanced Materials Research Center, Chongqing Academy of Science and Technology, Yangliu Road 2, Chongqing 401123, China
5
Department of Chemical and Materials Engineering, University of Alberta, AB T6G 1H9, Canada
*
Authors to whom correspondence should be addressed.
Metals 2018, 8(4), 229; https://doi.org/10.3390/met8040229
Submission received: 17 February 2018 / Revised: 30 March 2018 / Accepted: 30 March 2018 / Published: 2 April 2018

Abstract

:
Lightweight structural applications of magnesium and aluminum alloys inevitably necessitate welding and joining, especially dissimilar welding between these alloys. The objective of this study was to examine the feasibility of joining ZEK100 Mg alloy to Al6022 alloy via ultrasonic spot welding, focusing on effects of welding energy. An interface diffusion layer consisting of α-Mg and Al12Mg17 eutectic structure was observed to form, with its thickness increased from ~0.5 µm to ~30 µm with increasing welding energy from 500 J to 2000 J. The tensile lap shear peak load or strength and critical stress intensity of the welded joints first increased and then decreased with increasing welding energy, with their peak values achieved at 750 J. Fatigue life of the joints made at 750 J and 2000 J was equivalent at the lower cyclic loading levels, while it was longer for the joints made at 750 J at the higher cyclic loading levels. Fatigue fracture mode changed from interfacial failure to mainly transverse-through-thickness crack growth with decreasing cyclic loading level, which corresponded well to the bi-linear characteristic of S-N curves. Crack initiation basically occurred at the weld nugget border and at the interface between the two sheets, which can be understood via a theoretical stress analysis.

Graphical Abstract

1. Introduction

The transportation industry is increasingly adopting lightweight structural materials in the manufacture of auto-body structures, which is deemed as one of the most important strategies to improve fuel efficiency and reduce anthropogenic climate-changing, environment-damaging, human death-causing (According to Science News entitled “Air pollution kills 7 million people a year” on 25 March 2014 at http://www.sciencemag.org/news/2014/03/air-pollution-kills-7-million-people-year “Air pollution isn’t just harming Earth; it’s hurting us, too. Startling new numbers released by the World Health Organization today reveal that one in eight deaths are a result of exposure to air pollution. The data reveal a strong link between the tiny particles that we breathe into our lungs and the illnesses they can lead to, including stroke, heart attack, lung cancer, and chronic obstructive pulmonary disease.”), and costly emissions [1,2,3,4,5,6]. Accordingly, magnesium and aluminum alloys are being considered as excellent candidates for the lightweight structural applications due to their low density, high specific strength, and superior damping capacity [7,8,9,10,11,12,13]. Such applications inevitably entail the welding and joining of Al and Mg alloys. However, due to the rapid formation of brittle intermetallic compounds (IMCs) at the weld interface, caused by the high mutual diffusivities in these two materials even at relatively low temperatures, welding of Al to Mg is tremendously challenging, especially in the fusion welding processes [14,15,16,17].
The fusion welding processes like resistance spot welding (RSW) are well-established traditional joining techniques for steel sheets in auto-body construction [18,19]. However, it is difficult to apply the fusion welding to join lightweight aluminum and magnesium alloys because of the presence of excessive IMCs and other detrimental defects such as gas pores, cracks, contraction cavities, voids, etc. [18]. To increase the bonding strength, the reduction in the IMCs thickness is the key during welding. Three main approaches involving: (1) a lower welding temperature; (2) a shorter welding time; and (3) a filler material addition could be used to reduce the IMC thickness and minimize the defects [20,21,22,23,24]. Hence, solid-state joining methods such as friction stir welding (FSW), friction stir spot welding (FSSW), linear friction welding (LFW) and ultrasonic spot welding (USW) that could avoid liquid phase reactions are increasingly attracting attention because of their lower welding temperature, shorter welding time and lower energy consumption or lower cost, compared with fusion welding techniques, while other solutions like clinching, self-piercing rivets (SPR), and adhesive bonding need additional costs of consumables and surface treatment [16,18,22,23]. USW is more effective than FSSW (where an exit hole is normally present) and is considered to be one of the most interesting and emerging joining techniques for making dissimilar Mg/Al joints [15,21,22,23,24,25,26,27,28].
There are several studies on dissimilar welding of Mg to Al via USW. Panteli et al. [22,23] studied the growth behavior of Mg-Al IMCs and mechanical properties of USWed AZ31/Al6111 dissimilar joints made at different levels of welding energy, and reported that the joint fracture energy was very low. After 100 µm thick Al coating was made on the Mg sheet using a cold-spray process, the thickness of the reaction layer was significantly reduced, leading to doubling of the fracture energy. Patel et al. [15,21,29] studied the microstructure and mechanical properties of USWed AZ31/Al5754 without and with a Sn interlayer. They observed that the strength of AZ31/Al5754 dissimilar joints with a Sn interlayer was higher than that without the Sn interlayer due to the formation of a Mg-Mg2Sn eutectic layer which eliminated IMCs. Macwan et al. [24,30] conducted the USW of a rare-earth containing ZEK100 magnesium alloy to 5754 aluminum alloy, and observed that the strength was obviously higher than that of AZ31/Al5754 with or without a Sn interlayer.
The 6022 aluminum alloy contains a lower level of alloying elements, and has better formability and corrosion resistance than Al6016 and Al6111 alloys. It has been used for auto-body outer or inner panels. ZEK100 magnesium alloy, which contains 0.2 wt. % Nd, is considered to be suitable for structural and closure components in the automotive and aerospace sectors. Several recent studies showed that ZEK100 Mg alloy exhibited superior room temperature formability [31,32,33,34] and fatigue resistance [35,36]. The corrosion resistance of Mg alloys can also be effectively improved by addition of rare earth (RE) elements [37,38,39,40]. Wielage et al. [41] and Ishak et al. [42] studied the corrosion behavior of welded joints, and they observed that the corrosion resistance was mainly determined by the base metals. To the best of the authors’ knowledge, there are no reports on the dissimilar welding of Al6022 to the low RE-containing ZEK100 Mg alloy; it is unclear how the microstructure evolves and the tensile properties and fatigue life of the USWed joints of ZEK100 and Al6022 alloy change with welding energy. The objective of the present study was, therefore, to examine the feasibility of joining ZEK100 Mg alloy to Al6022 alloy via USW, focusing on the effect of welding energy on the microstructural change, tensile lap shear strength, and fatigue resistance of the dissimilar joints.

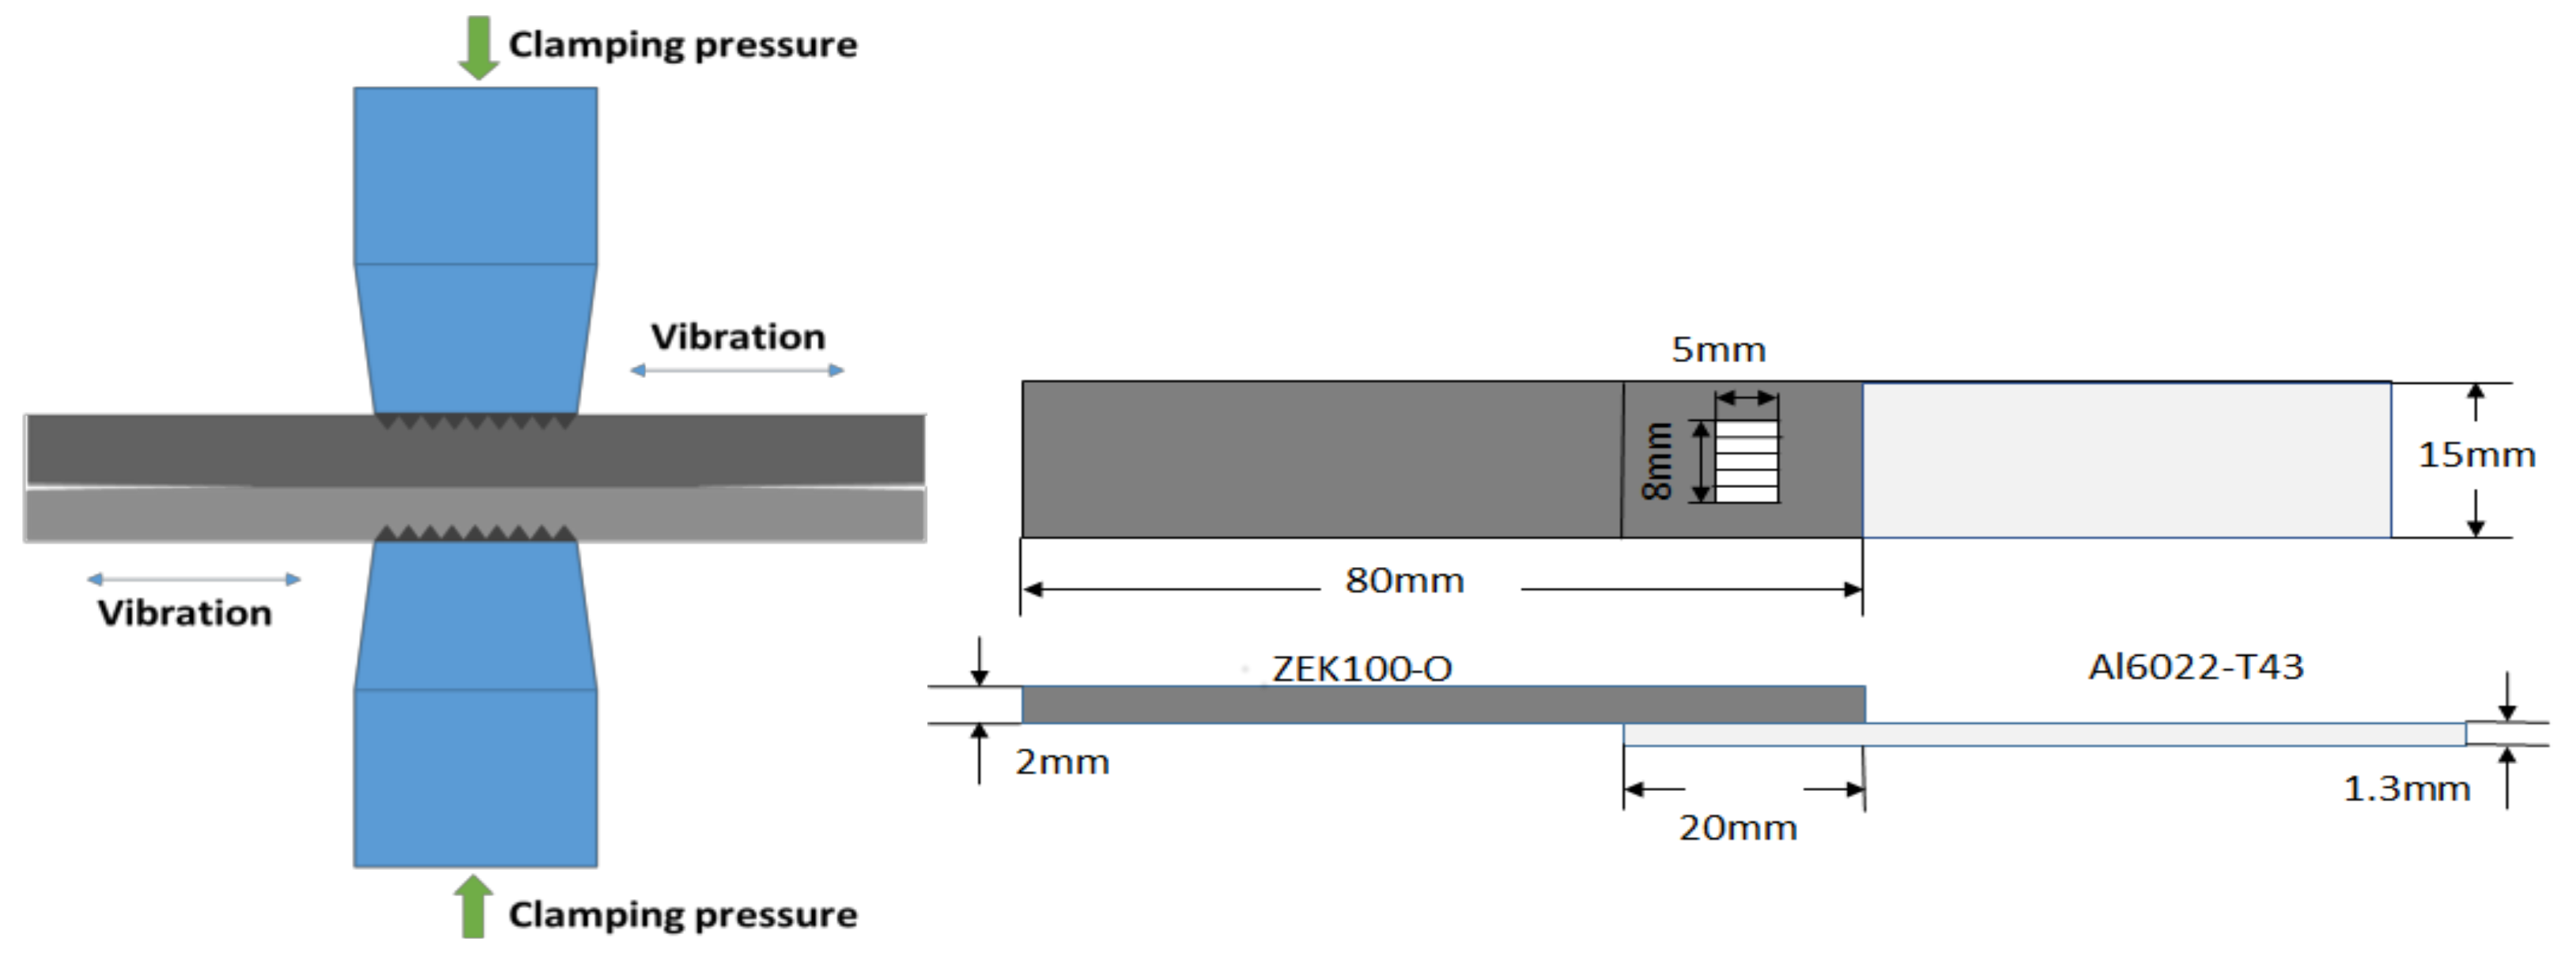
2. Materials and Methods

The materials selected in this study were 1.3 mm thick sheet of Al6022-T43 alloy and 2.0 mm thick sheet of ZEK100-O Mg alloy. Nominal chemical compositions of the alloys are listed in Table 1. Test coupons of 80 mm × 15 mm strips were initially sheared, ground with grit #120 sand paper, and then cleaned with ethanol followed by acetone prior to welding. A 2.5 kW dual wedge reed Sonobond-MH2016 HP-USW system operated at 20 kHz was used to perform welding. The welding tools were 8 mm × 5 mm flat serrated sonotrode tips having nine parallel teeth to warrant good grasping of top and bottom sheets, i.e., prevent the relative motion between the sonotrode tip and sheet. The joints were achieved by a transverse relative motion between the sheets with a 20 mm overlap having vibrational direction perpendicular to the rolling direction. Figure 1 shows a schematic diagram of the lap welded joint with the dimensions indicated. The welding parameters used were shown in Table 2. The welding energy (Q) was determined by the power (P) and weld time (t), where Q ~ P × t. For example, a welding energy of 1500 J at 2 kW was equivalent to ~0.75 s.
Five samples were welded for each welding condition; one of them was used for microstructure, two of them were used for tensile lap shear tests and the other were used for fatigue tests. In order to reduce the scatter, one more sample made at the energy of 750 J and 1000 J was used for the tensile lap shear tests. The cross-section of the samples for scanning electron microscope (SEM) observations was cut from the central area of the weld joint along the vibration direction using a slow diamond cutter, cold-mounted with epoxy, and then mechanically ground with abrasive papers, and finally polished with diamond paste and colloidal silica. A fully computerized United testing machine was used to determine the peak failure load of tensile lap shear tests at a constant crosshead speed of 1 mm/min in air at room temperature. X-ray diffraction (XRD) analysis was carried out on the matching interfaces of both Mg alloy and Al alloy sides after tensile lap shear tests using Cu Kα radiation at 45 kV and 40 mA. The diffraction angle (2θ) at which the X-rays were incident on the samples varied from 20° to 100°, with a step size of 0.05° and 2 s in each step. Load-controlled fatigue tests were performed using a fully computerized Instron 8801 servo-hydraulic testing system at different cyclic loading levels. A load ratio of R (Pmin/Pmax) equal to 0.2, sinusoidal waveform, and frequency of 50 Hz were used for all the tests. In the tensile lap shear testing and fatigue testing, restraining shims or spacers were attached at both ends of the specimen to avoid the bending moment and rotation during the tensile and fatigue tests. The fracture surfaces of selected tensile and fatigue failed samples were examined via a JSM-6380LV SEM equipped with Oxford energy-dispersive X-ray spectroscopy (EDS), electron backscatter diffraction (EBSD) and 3D surface/fractographic analysis capacity to identify fracture mechanisms.

3. Results and Discussion

3.1. Microstructural Characterization

The join mechanisms such as mechanical interlocking, interface diffusion, metallurgical adhesion, and localized melting would happen during welding. In the beginning, the metal to metal would contact and form islands when the oxide film broke locally at the weld interface [22,24]. Then the microweld could occur. With increasing temperature owing to the high frequency rubbing/vibration, the inter-diffusion intensified in the adhesion region, intermetallics would form during a sufficiently rapid kinetic reaction [22,24]. Figure 2 shows typical interfaces or cross-sections of the ZEK100-Al6022 joints at a welding energy of (a) 500 J, (b) 750 J, (c) 2000 J, and (d) the corresponding EDS line scan results at a welding energy of 2000 J. Due to the lower energy (500 J) and the shorter welding time (0.25 s), the temperature at the interface was relatively low with an uneven distribution. The kinetics of interfacial reaction was insufficient, and there was no significant diffusion across the interface except at some localized asperities [24,43]. The non-uniform and isolated diffusion layer or islands marked by arrows could only be seen at a higher magnification in Figure 2a at the initially touched asperities, with an average thickness of about 0.2~0.5 µm. When the welding energy rose to 750 J, a thin continuous but irregular diffusion layer with an average thickness of about 3~5 µm could be seen, as indicated by an arrow in Figure 2b, owning to the increase in temperature and strain rate at the interface caused by longer time friction/rubbing. When the welding energy increased to 2000 J, a thick continuous diffusion layer with a thickness of about 20~30 µm could be observed in Figure 2c. An EDS box analysis performed on the continuous diffusion layer showed a composition of 61.7 at. % Mg, 38 at. % Al, and 0.3 at. % Zn, which reflected the approximate composition of interface diffusion layer of α-Mg + Al12Mg17 eutectic structure. Several researchers have also observed the formation of Al12Mg17 IMC phase during welding of Mg to Al [15,22,23,24,26,44,45,46]. Figure 2d shows the relevant EDS line scan results, revealing the elemental distribution across the interface of the joint at a welding energy of 2000 J. It is seen that there was a big plateau where the Al element and Mg element co-existed in a certain proportion from the concentration profile in Figure 2d, where the ratio of Al element and Mg element changed near the Al side.

3.2. Tensile Lap Shear Load

Figure 3 shows the peak tensile lap shear load and critical stress intensity factor (Kc) of USWed ZEK100/Al6022 dissimilar joints as a function of welding energy at a constant power of 2 kW and clamping pressure of 0.4 MPa. The critical stress intensity (Kc) in Figure 3b, which was used to better normalize the effect of energy input, was calculated based on Zhang’s solution [16,47,48]:
K c = 0.694 F t d t ,
where Ft is the peak tensile load, t is the sheet thickness, and d is the nugget diameter. In the present study, t = (t1 + t2)/2, where t1 and t2 are the thicknesses of ZEK100 and Al6022, respectively. Using the same algorithm as other investigators [15,16,17,18,19,20,21,22,23,24], a nugget zone area of A = 8 × 5 mm2 was used to assess the tensile lap shear strength with an equivalent nugget diameter of d calculated from:
d = 4 A π .
It is seen in Figure 3 that the peak tensile lap shear load and critical stress intensity (Kc) exhibited a similar trend, i.e., they first increased with increasing welding energy up to 750 J, and then decreased. At a relatively low welding energy of 500 J, the interface diffusion layer was discontinuous and thin (0.2~0.5 µm in thickness, Figure 2a) due to the low temperature and strain rate. In this case the material was not softened enough (i.e., the yield strength of the base material still remained high) owning to the relatively low temperature, the flowability of metal was thus limited, leading to a limited coalescence of the bonding surfaces [16,24,25]. As a result, some isolated islands could be formed with the development of microwelds, and a lower extent of diffusion and discontinuous coalescence at the weld interface resulted in poor welding strength [22,24]. As the welding energy increased from 500 J to 750 J, the temperature and strain rate increased, and the flowability of metal was improved, resulting in improved metallurgical bonding and mechanical interlocking; microwelds thus developed quickly, and especially the enhanced diffusion in-between Mg and Al alloys led to the formation of a thin and continuous diffusion layer (Figure 2b) (3~5 µm in thickness). Due to increased plastic deformation, the surface contact of asperities was better established and the diffusion bonding became more robust, which competed with the deterioration effect caused by the presence of IMC at the welding surface [15,24]. Obviously, the diffusion bonding held an advantage, along with a properly thick diffusion layer. Therefore, the peak load and the critical stress intensity reached their highest values of ~2 kN and ~4.7 MPam1/2, respectively. With the welding energy beyond 750 J, the thicker brittle diffusion layer (Figure 2c) occurred because of the higher temperature and higher vacancy concentration caused by stronger ultrasonic rubbing, leading to deterioration of the joint due to the thickening of the diffusion layer. Besides, a higher internal stress in the USWed joint would be produced with a higher welding energy due to the faster cooling rate stemming from the higher temperature based on Newton’s law of cooling, thus lowering the joint strength and critical stress intensity [24]. Based on the above discussion, the peak load and critical stress intensity were mainly associated with the thickness of interface layer, i.e., being neither too thin (becoming discontinuous) nor too thick. It has been reported that the peak load could be achieved when the thickness of interface layer was ~5 µm [15,22,23,24,46]. This was in good agreement with the results obtained in the present study.
Figure 4a,b shows a comparison of the average peak load and average maximum critical stress intensity of the dissimilar ZEK100-Al6022 (Mg-Al) joints with those of the similar Al6022-Al6022 (Al-Al) and ZEK100-ZEK100 (Mg-Mg) joints [16,49]. It is seen that the peak load of ZEK100-Al6022USWed dissimilar joint reached ~68% of ZEK100-ZEK100 similar joint peak load and ~56% of Al6022-Al6022 similar joint peak load, while the critical stress intensity of ZEK100-Al6022 dissimilar joint arrived at ~75% of ZEK100-ZEK100 similar and ~49% of Al6022-Al6022 similar joint critical stress intensity. It was clear that the relatively lower peak load and critical stress intensity of ZEK100-Al6022 dissimilar joints were directly related to the presence of the α-Mg + Al12Mg17 eutectic structure. As for the similar joints, the peak load and critical stress intensity of Al6022-Al6022 joints were higher than those of ZEK100-ZEK100 joints. This would be associated with the difference between Al6022 and ZEK100 alloys in terms of their properties, including ductility and formability, as well as thermophysical properties (thermal conductivity and diffusivity, heat capacity, thermal expansion, etc.). For the sake of comparison with the dissimilar joints made with different Mg and Al alloys via the ultrasonic spot welding, the tensile lap shear strength of dissimilar joints of different Al to Mg alloys was summarized in Figure 4c [15,18,21,22,50]. It should be noted that the surface roughness would affect the strength. Grit #320, #120 or #80 sand paper was used to grind the specimen surface in the references listed in Figure 4c. In addition, the tip area as a unified algorithm was used to assess the tensile lap shear strength of USWed joints. As seen from Figure 4c, the tensile lap shear strength in the present study was higher than that reported in [15,18,21,22,50]. However, the overall tensile lap shear strength of the dissimilar Al/Mg welded joints was relatively low due to the presence of brittle diffusion layer (Figure 2).

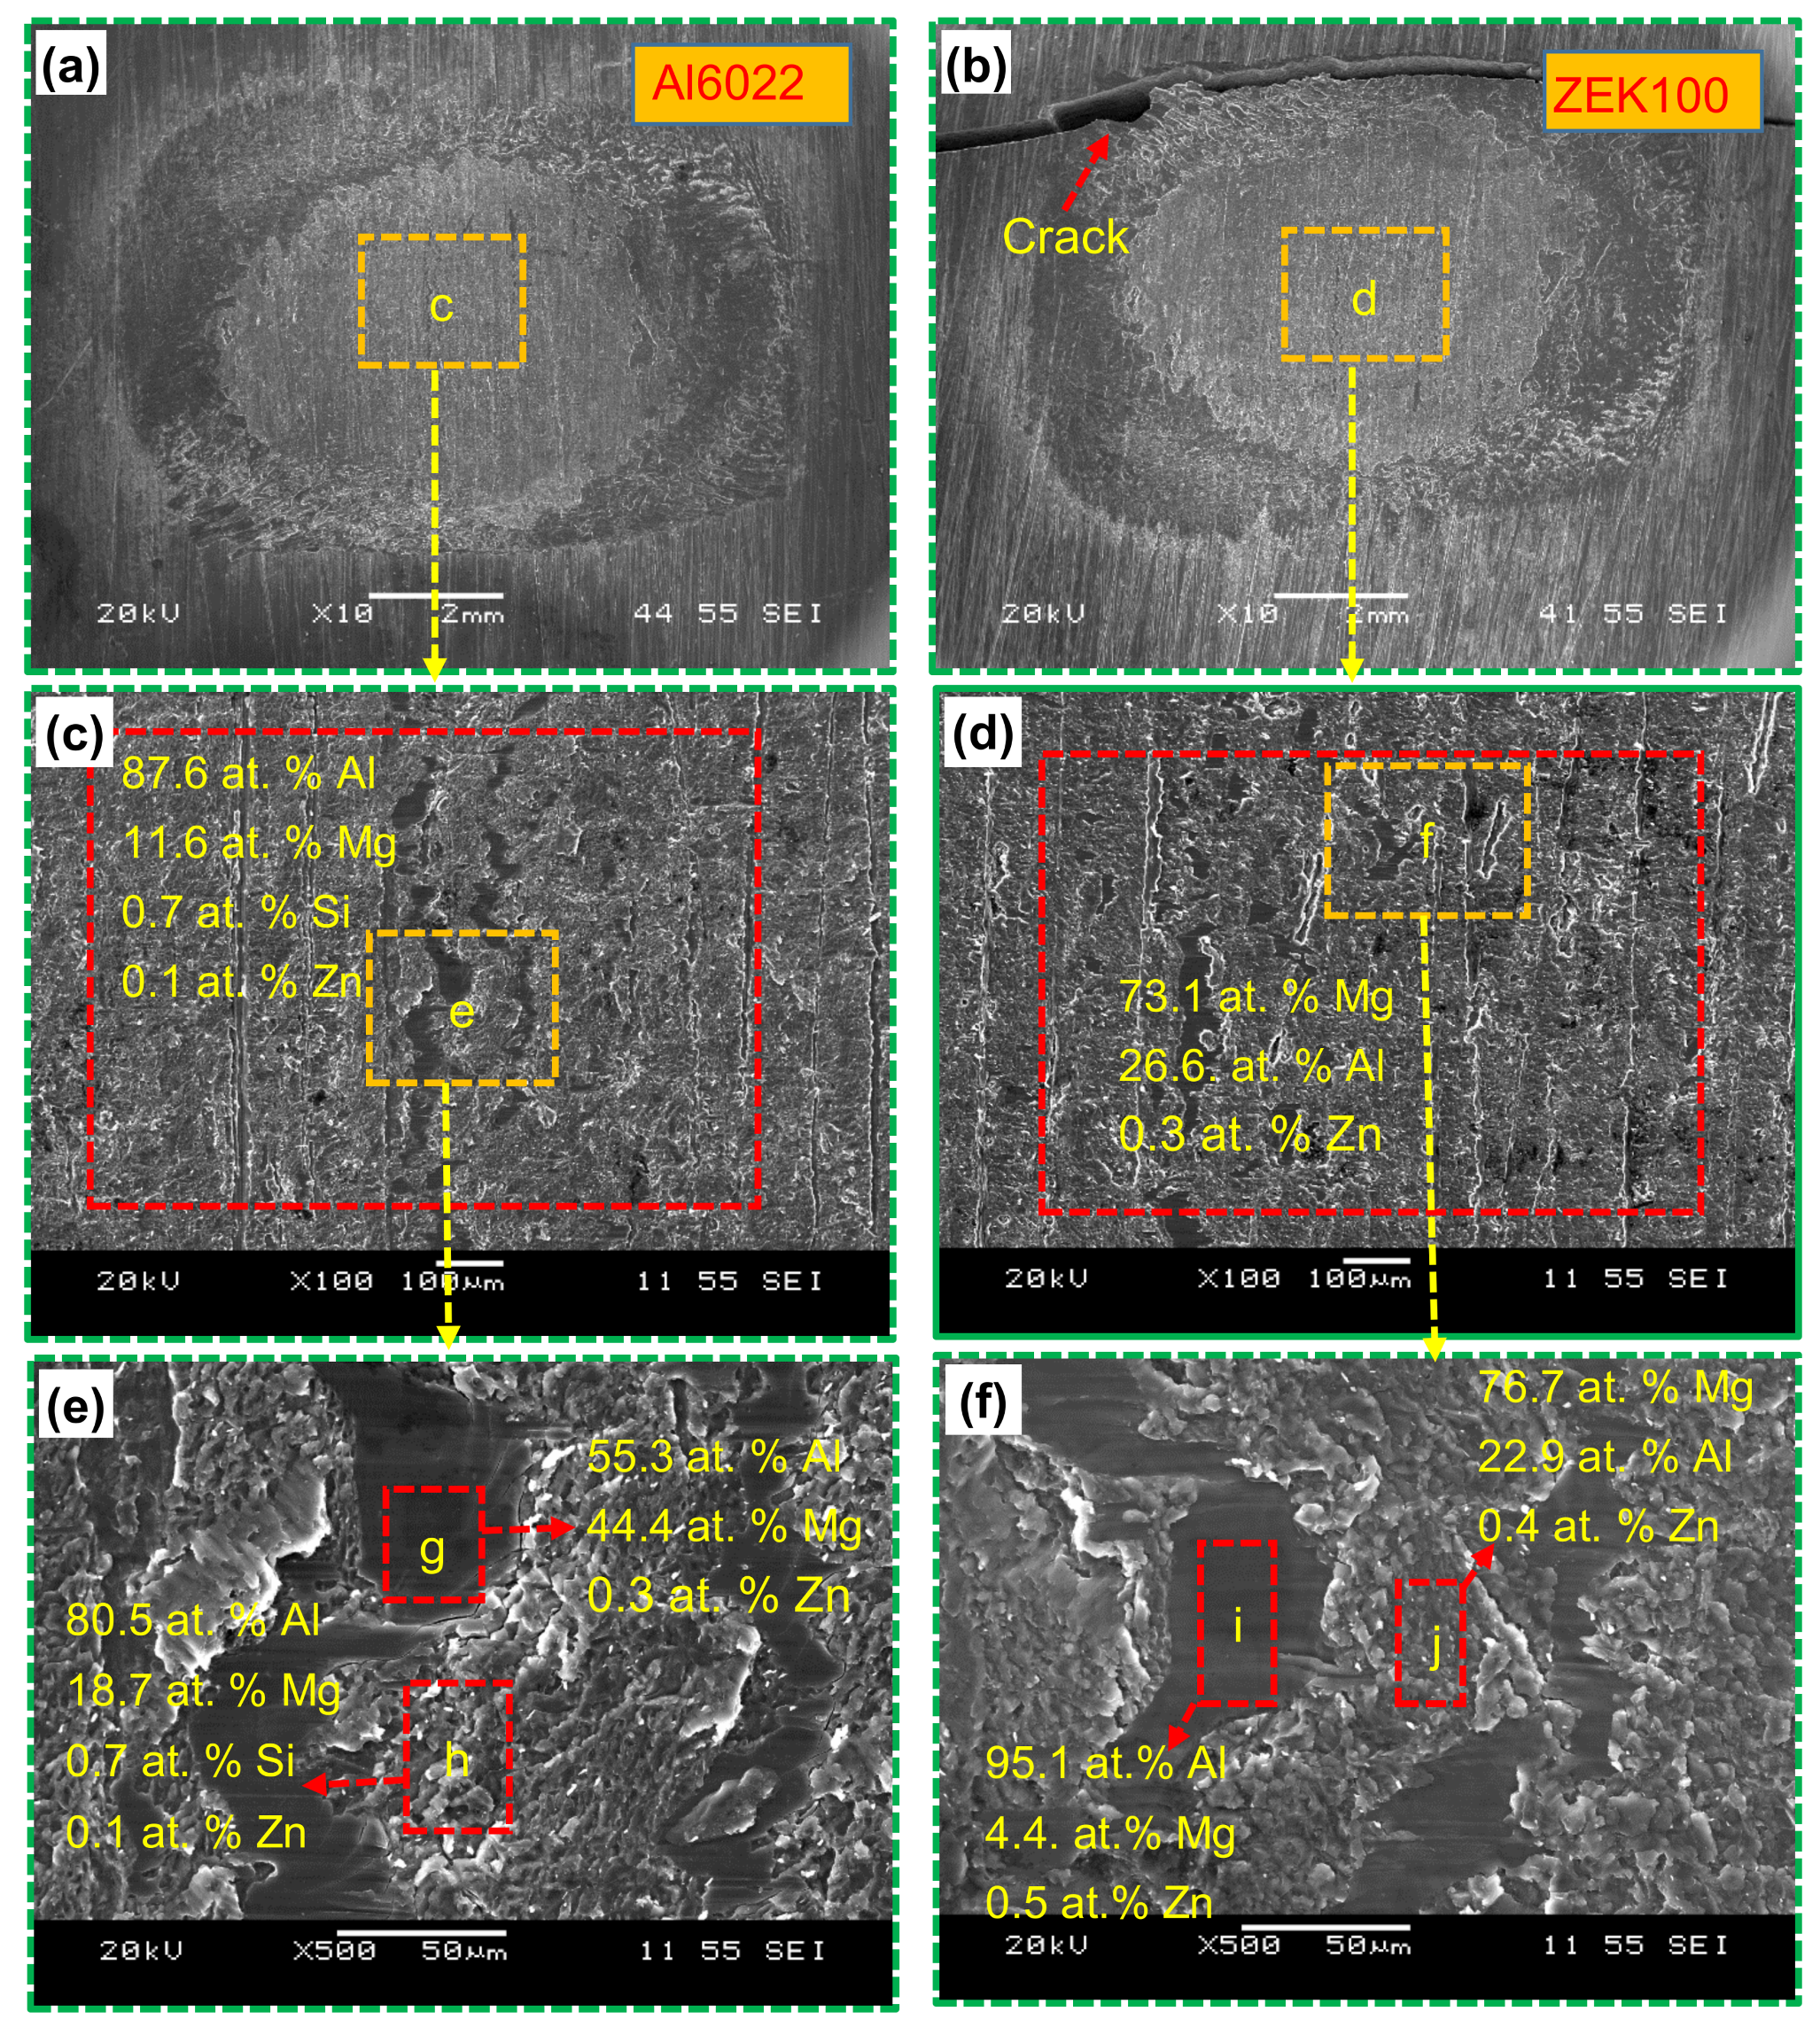
3.3. Fractography: Tensile Lap Shear Fracture Surface Examinations

An interfacial failure mode was observed in the tensile lap shear samples at all levels of welding energy. It is worth noting that the stress concentration was more obvious with an energy increase to 2500 J. The interfacial failure mode was still present. The same phenomenon was reported in [18,21,24,51,52] during the dissimilar welding of Mg/Al alloys using different joining techniques. This was different from the similar welding such as Al/Al and Mg/Mg alloys, where the tensile lap shear failure mode changed from the interfacial fracture to nugget pull-out. This was ascribed to the difference in the mechanisms of interfacial bonding. Figure 5 shows typical fracture surface images of an USWed ZEK100-Al6022 dissimilar joint made with a welding energy of 2000 J, with an overall view of the entire fracture surface on the Al and Mg sides in Figure 5a,b, respectively. The high stress concentration regions around the nugget edge appeared to be present on both Al and Mg sides as well. Similar observations were also reported in the similar and dissimilar welded joints in [16,24]. Regions “c” and “d” marked in Figure 5a,b were magnified in the Figure 5c,d, where EDS box analyses were conducted. The yellow box of Figure 5c shows a composition of 59.3 at. % Al, 39.9 at. % Mg, 0.6 at. % Si, and 0.2 at. % Zn, indicating the sticking of α-Mg + Al12Mg17 on the Al side. The yellow box of Figure 5d shows a composition of 63.8 at. % Mg, 35.8 at. % Al, and 0.4 at. % Zn, which reflected the approximate composition of interface diffusion layer of α-Mg + Al12Mg17. The regions “e” and “f” indicated in Figure 5c,d were further magnified in the Figure 5e,f, where EDS point analyses were performed. Point “g” in Figure 5e showed a composition of 90.2 at. % Al, 8.9 at. % Mg, 0.8 at. % Si, and 0.1 at. % Fe, and point “h” consisted of a composition of 53.9 at. % Mg, 45.8 at. % Al, and 0.3 at. % Zn. They indicated that α-Mg + Al12Mg17 lay non-uniformly on the Al side. Point “i” in Figure 5f included a composition of 99.4 at. % Mg, and 0.6 at. % Zn, which indicated that region “i” was just Mg alloy. Point “j” consisted of a composition of 68.7 at. % Mg, 30.9 at. % Al, and 0.4 at. % Zn, which again reflected the approximate composition of interface diffusion layer of α-Mg + Al12Mg17. To further confirm the existence of eutectic structure of α-Mg + Al12Mg17, both matching fracture surfaces of the welded joint after the tensile lap shear test was analyzed via XRD. It is seen from Figure 6 that Mg and Al12Mg17 were present on both Mg and Al sides. This corresponded well to the above EDS box analyses (Figure 2 and Figure 5) and line analysis (Figure 2), which also indicated the presence of the eutectic structure of α-Mg + Al12Mg17. Accordingly, it could be inferred that the failure occurred through the interfacial diffusion layer due to the existence of Mg and Al12Mg17 on the both sides. Similar results were also reported by Macwan and Chen in their USW of rare-earth containing ZEK100 Mg alloy to 5754 Al alloy [24].

3.4. Fatigue Strength and Failure Mode

Fatigue tests of the USWed Mg-Al joints made with a welding energy of 750 J and 2000 J, respectively, were conducted at a load ratio of R = 0.2, a frequency of 50 Hz and room temperature (RT), and the obtained results were shown in Figure 7a. It is seen that at higher cyclic load levels (Pmax = 2 kN), the fatigue life of the USWed joints made with a welding energy of 750 J was indeed longer than that of the USWed joints made with a welding energy of 2000 J. This corresponded well to the tensile lap shear test results shown in Figure 3, where the 750 J samples had a higher tensile lap shear peak load than the 2000 J samples. Similar results were reported in the USWed similar or dissimilar joints [15,16,21,24,53]. However, the 750 J samples appeared to exhibit a fatigue life equivalent to that of the 2000 J samples at lower maximum loads of 0.5–1.5 kN. In Figure 7b, the cyclic maximum stress vs. the number of reversals to failure (2Nf) on a double-log scale exhibited a bi-linear change, which reflected different fatigue failure mechanisms at the higher and lower stress amplitudes. Four macroscopic images of fatigue failure samples are also presented in Figure 7b, which were made at an energy of 750 J tested at a maximum load of 0.5 kN, and 2000 J tested at a maximum load of 0.5 kN, 1 kN, and 1.5 kN, respectively. Obviously, failure modes well corresponded to the bi-linear behavior. Due to the presence of eutectic Mg + Al12Mg17 in the interface layer, only interfacial failure occurred at the cyclic load levels (1.5–2.0 kN), as shown in Figure 7b, which was similar to the failure mode of the tensile lap shear tests (Figure 5). At the cyclic load levels of 0.5–1 kN, while the interfacial failure mode was still observed the transverse-through-thickness (TTT) crack growth perpendicular to the loading direction could be clearly seen at the edge of nugget zone on the Mg side in both welding conditions, as indicated by the yellow dashed arrows in Figure 7b. Similar bi-linear S-N curve behavior and its corresponding failure modes were reported in the similar and dissimilar welded joints of magnesium and aluminum alloys using different welding processes such as weld-bonded, USW, FSSW [24,42,43,54,55].
The TTT cracking occurred on the Mg side may be understood from the following analysis. Mg alloy was relatively softer than Al alloy during joining since the melting point of Mg alloy is slightly lower than that of Al alloy. A greater extent of surface deformation (or welding tip penetration) caused by the clamping pressure at higher temperatures led to the material at the tip edge or nugget edge to flow outward, thus causing a higher stress concentration and the subsequent formation of micro-level crack produced at the nugget edge of the Mg side [24]. As a result, fracture occurred at the Mg side instead of the Al side. A further stress analysis for such a failure mode is presented in Figure 8. An USWed specimen under tension could be modelled as shown in Figure 8a. To avoid producing the secondary bending moment due to the structural misalignment of sheets during the tensile lap shear tests and/or fatigue tests, two spacers (or dummy plates) were applied at both ends, as indicated by the yellow segments. In Figure 8b, one could easily derive the normal stress (σ) and shear stress (τ):
σ = F A cross ,
τ = F A nugget ,
where Across is the cross-sectional area, and Anugget is the weld nugget area. The observed failure mode would depend on which one, i.e., the normal stress or shear stress, first reaches its critical value. When the shear stress reaches a critical shear stress (τo) in the nugget, the failure mode would be pure shear, leading to interfacial failure, as shown in Figure 5a,b in the tensile tests, and Figure 7b at higher cyclic loading level. However, when the shear stress is lower than the critical shear stress, the failure would occur at the site where the stress concentration occurs and the normal stress becomes the maximum which reaches the critical stress (σo). In addition, the bending moment (M) would be present during the tensile lap shear testing, which may be calculated as:
M = 0 h x σ b d x = b h 2 σ 2 ,
where b is the width of the sheet, and h is the sheet thickness. The maximum shear stress is located on the O1O2 plane, and the shear stress on the BC and AD plane is zero. The maximum tensile stress occurs on the AO1 plane, and the tensile stress on the DO2 is zero. The compressive stress (σ1) resulting from the bending moment (M) becomes:
σ 1 = M y I = M y w l 3 12 ,
where l = O1O2, w is the width of the nugget, I is the moment of inertia, and y is the distance from the center of the nugget. Then:
σ o 1 = 3 b h 2 w l 2 σ ,
where σo1 is the normal stress corresponding to the bending moment (M), as indicated in Figure 8c. If the values of the related stresses are known, one could calculate the principal stress and direction. The total stress (σt) at point O1 becomes the maximum, as shown in Figure 8c, which could be expressed as:
σ t = σ σ 1 2 + σ 2 .
Therefore, the failure would first occur at nugget edge O1 (or O2 since the situation of O2 is equivalent to that of O1).
Figure 9 shows typical SEM images of a fatigue failed sample made at a welding energy of 750 J and tested at a low cyclic loading level with a maximum load of 0.5 kN. Figure 9a,b shows an overall view of the entire fracture surfaces on both Al and Mg sides, respectively. It could be easily observed that a TTT crack propagated along the sample width and thickness directions, which initiated only at the nugget edge on the Mg side as shown in Figure 9b. The regions c and d marked in Figure 9a,b were magnified in the Figure 9c,d, where the EDS box analyses were performed. The red box in Figure 9c,d showed a composition of 87.6 at. % Al, 11.6 at. % Mg, 0.7 at. % Si, and 0.1 at. % Zn, and a composition of 73.1 at. % Mg, 26.6 at. % Al, and 0.3 at. % Zn, respectively. This suggested that the α-Mg + Al12Mg17 eutectic structure was present on both sides like Figure 5c,d, but the amount of the eutectic structure at an energy of 750 J appeared to be less than that at an energy of 2000 J. This corresponded well to Figure 6b,c. These observations also corroborated that a higher strength occurred at a welding energy of 750 J instead of a welding energy of 2000 J (Figure 3). Figure 9e,f shows a further magnified view of the regions of interest indicated in Figure 9c,d, where the EDS box analyses were also conducted. The composition of boxes (g–j) was given in Figure 9e,f, again they all certified that the presence of the eutectic structure α-Mg + Al12Mg17 lay on both Al and Mg sides, indicating the occurrence of cohesive failure via the eutectic layer.

4. Conclusions

The ultrasonic spot welding of ZEK100 to Al6022 dissimilar alloys was successfully performed at different levels of welding energy. The corresponding microstructure, tensile lap shear peak load, and fatigue life were analyzed and evaluated. The following conclusions can be drawn:
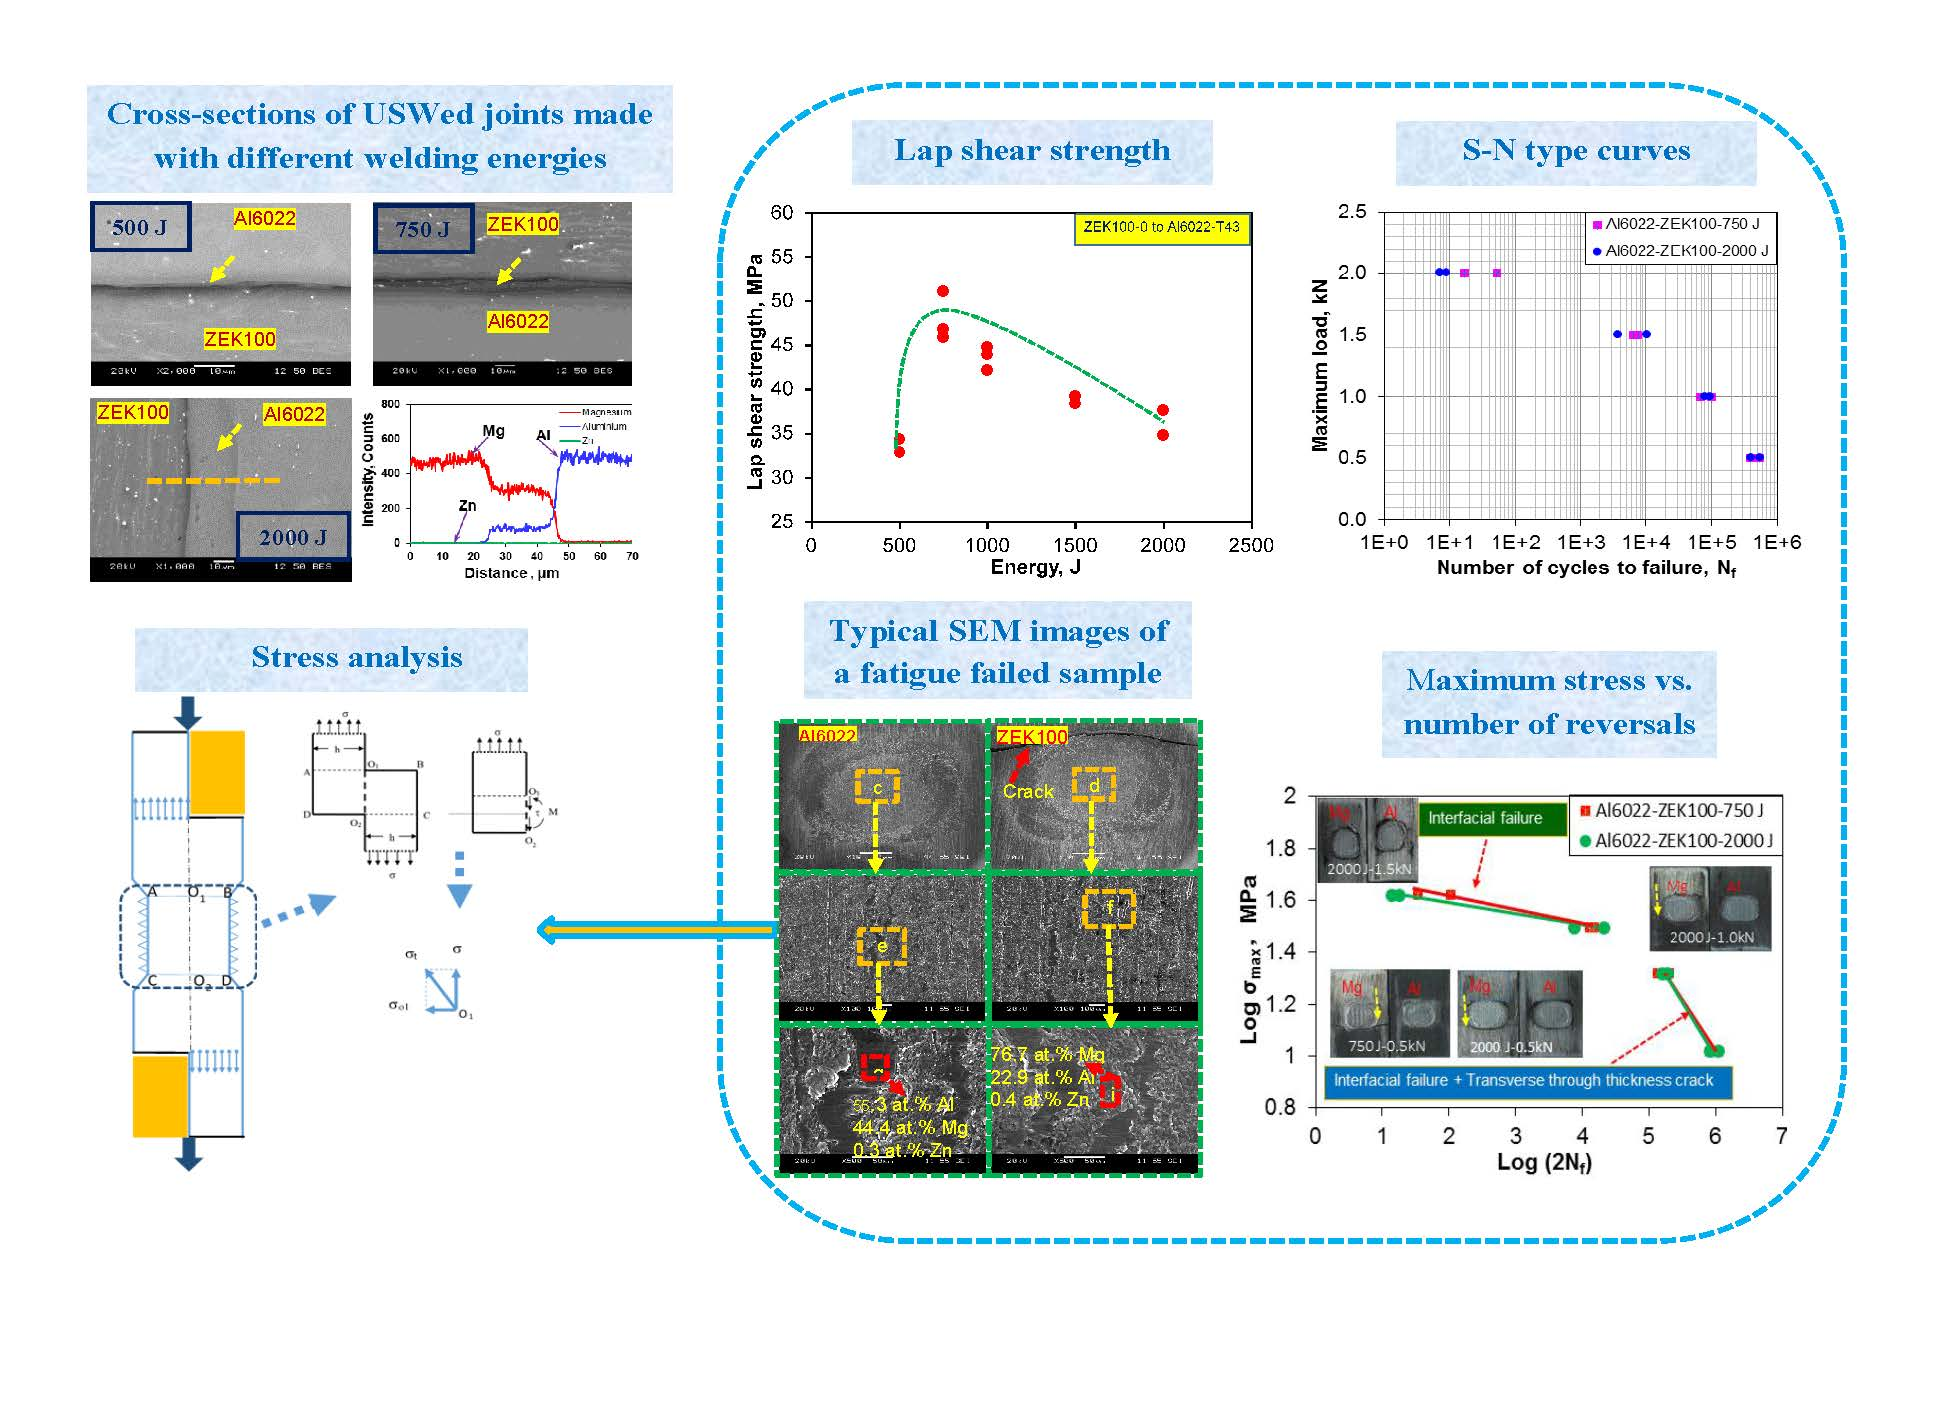
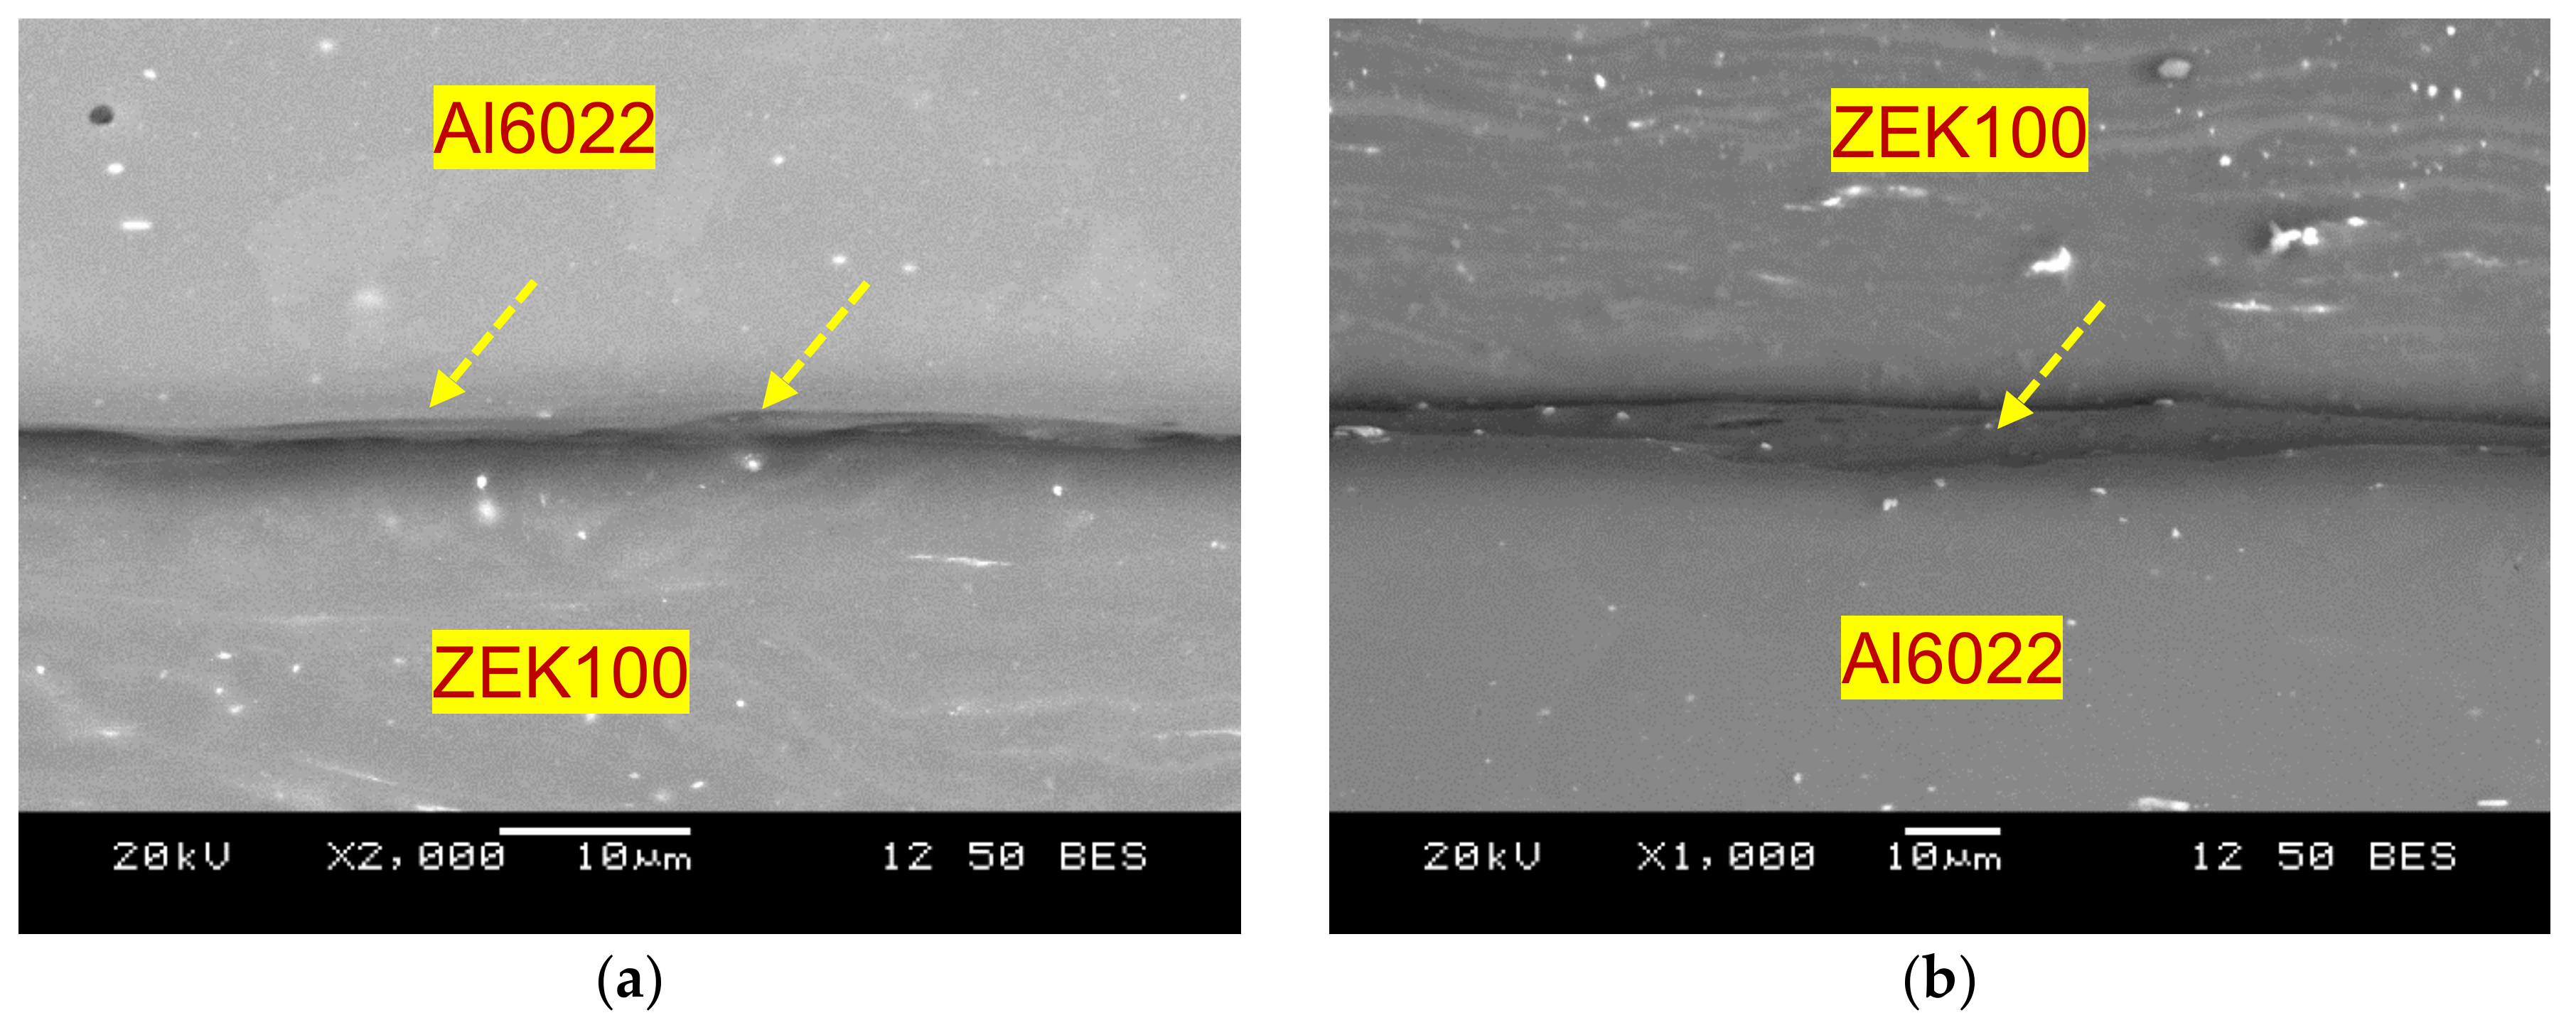
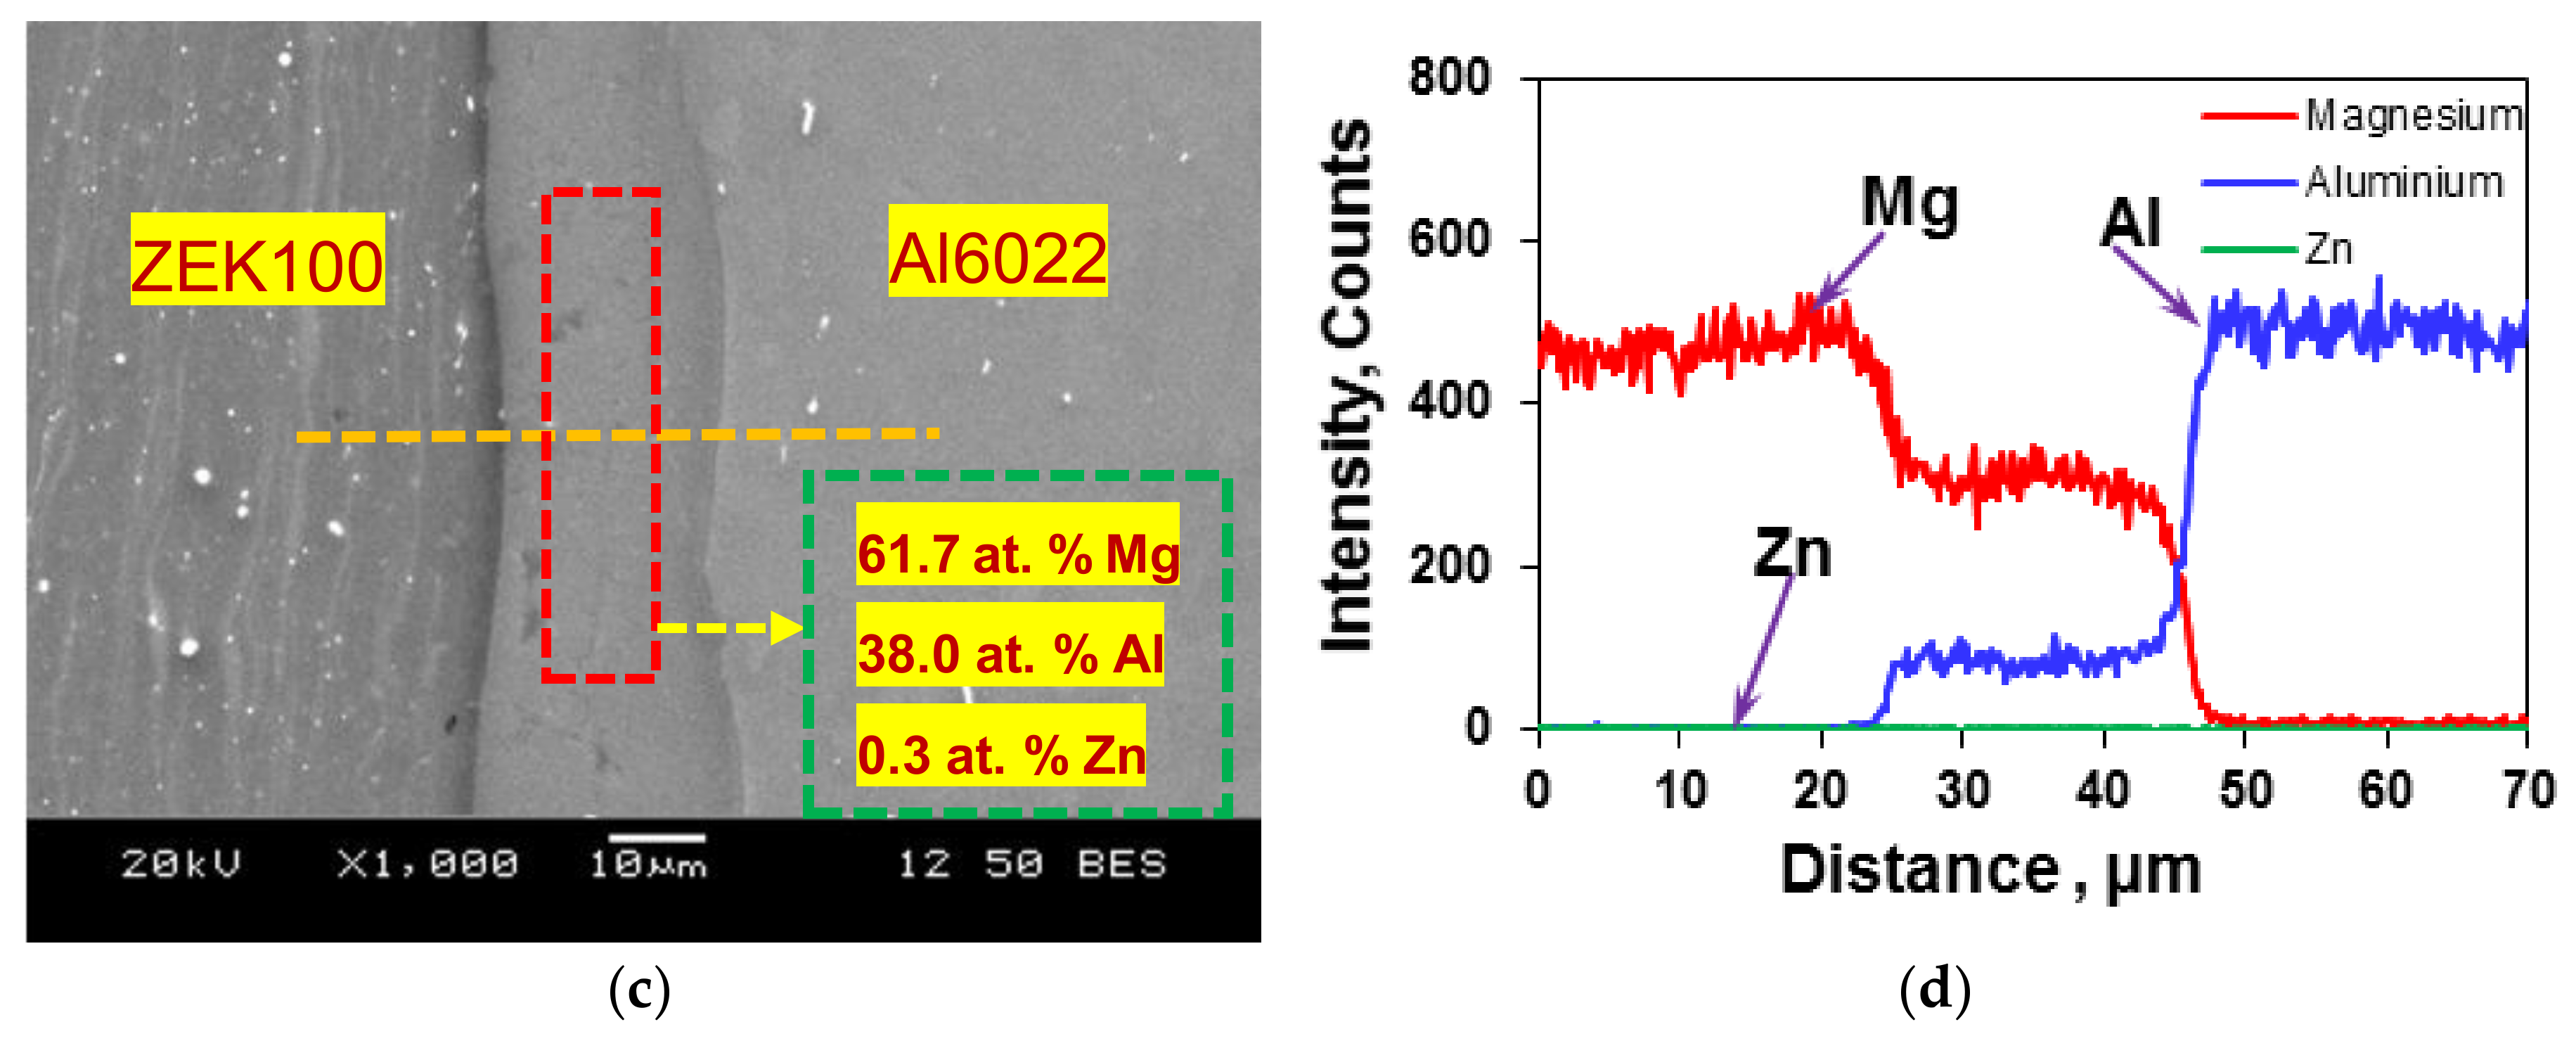
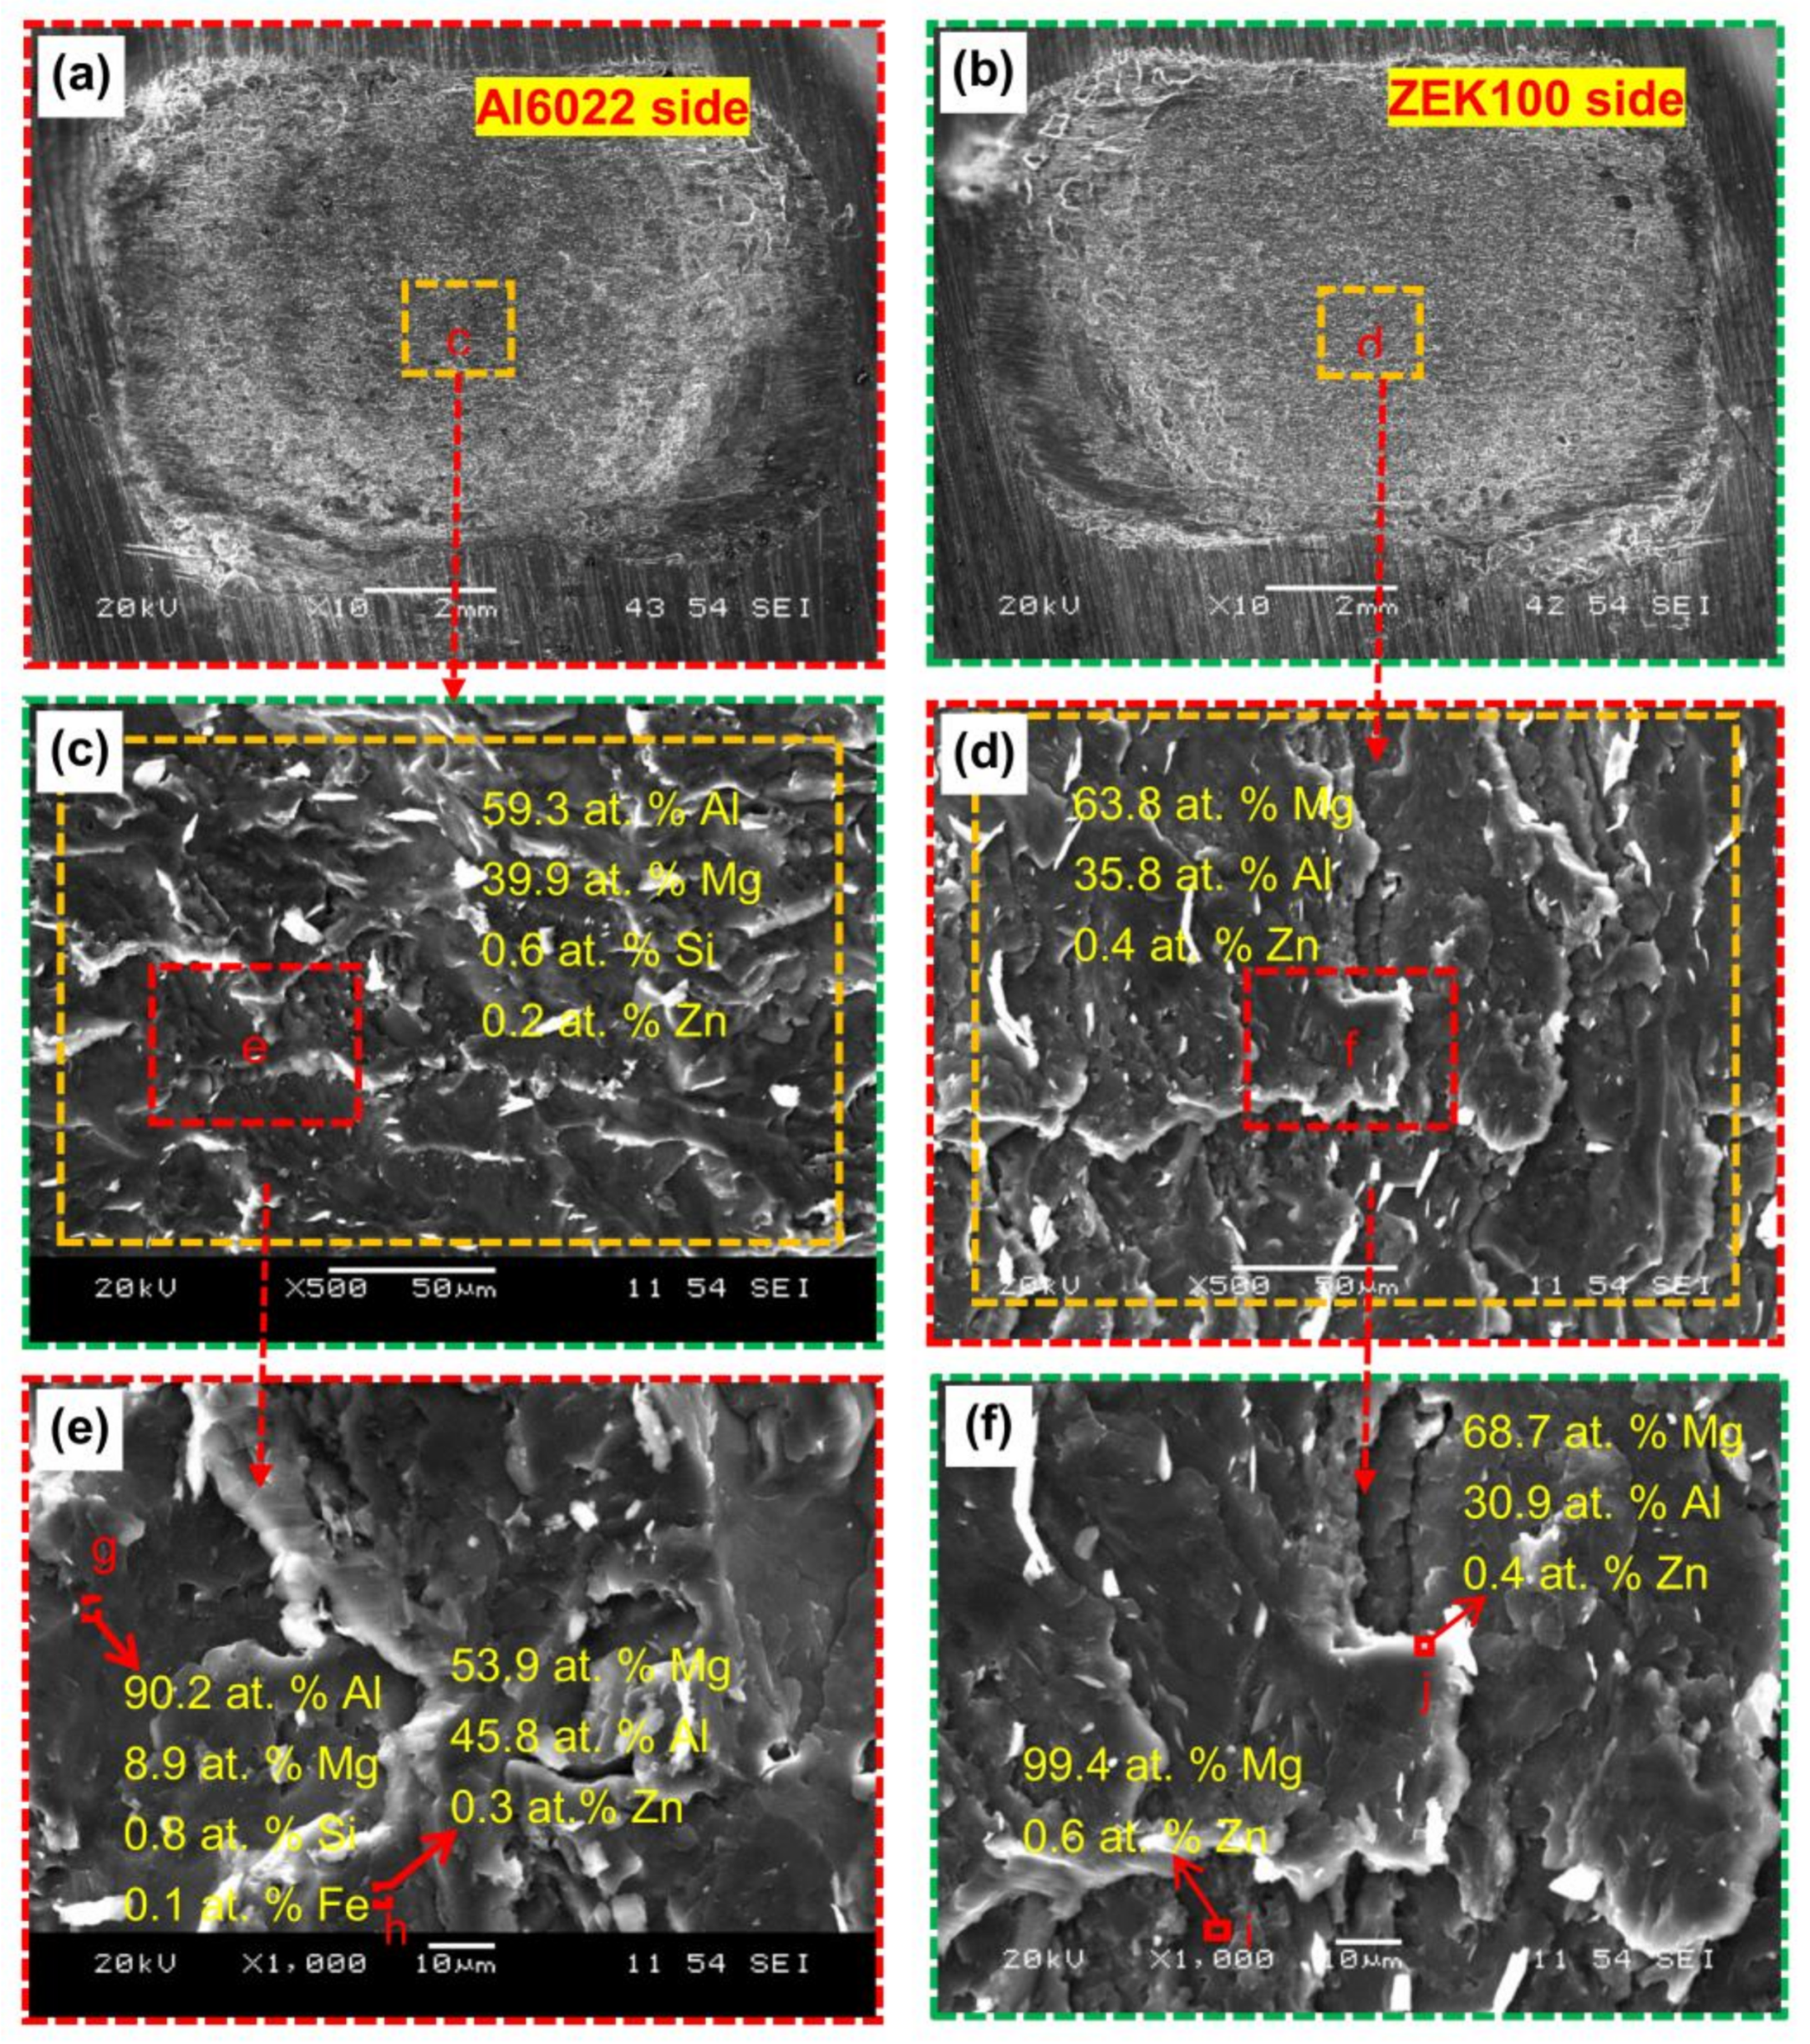
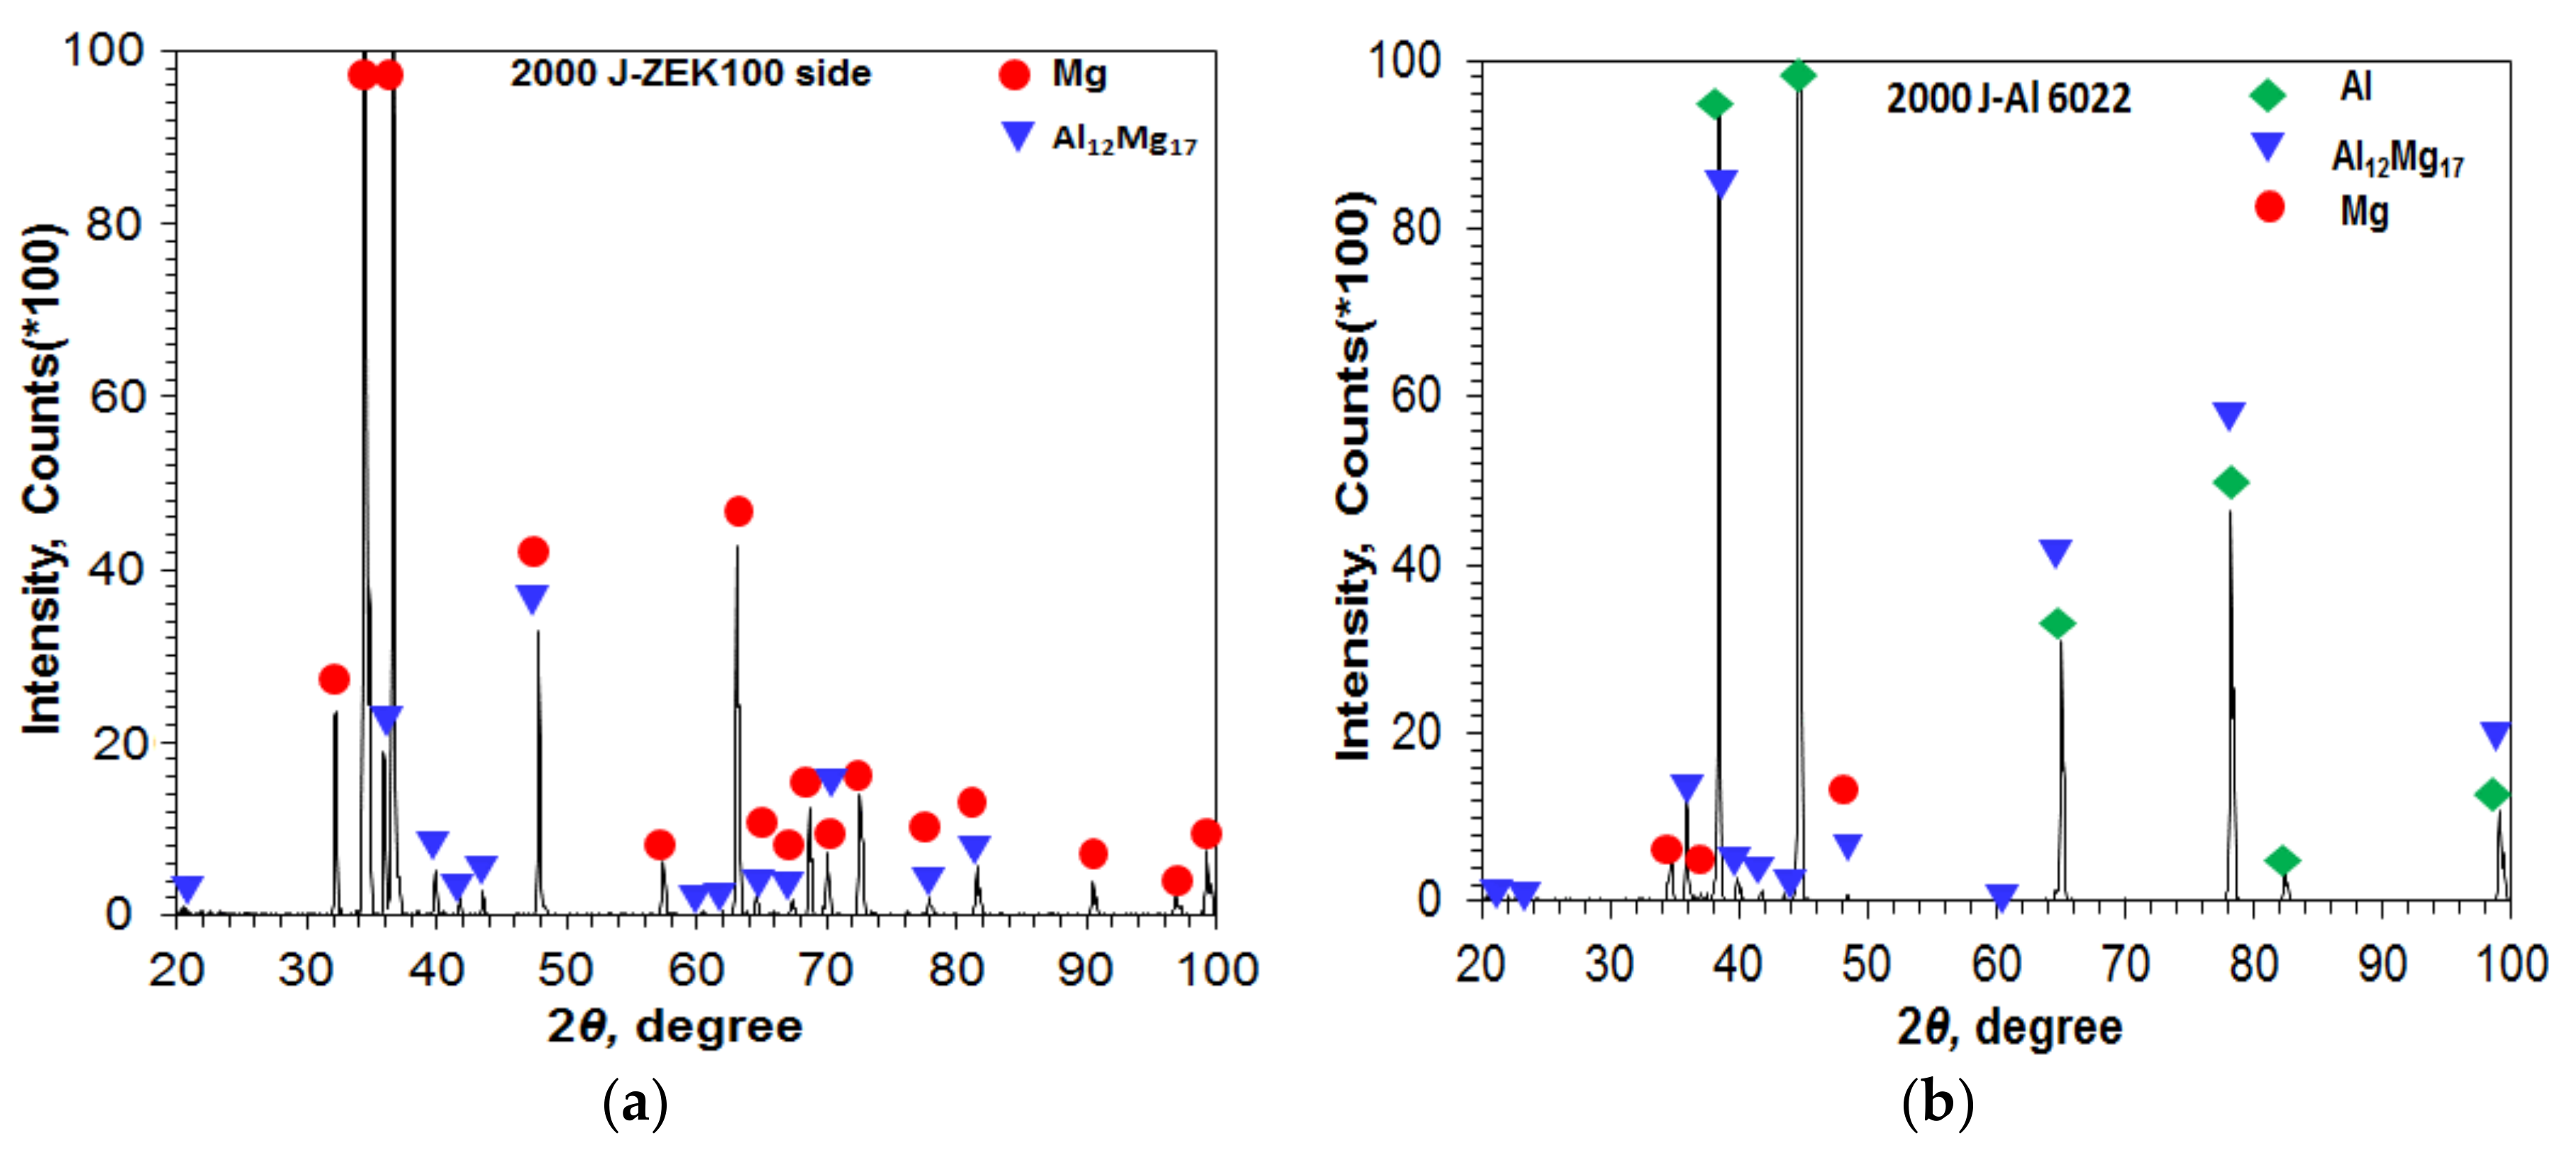
  • An interface diffusion layer consisting of eutectic structure of α-Mg and Al12Mg17 was observed during welding at the energy levels from 500 J to 2000 J. The thickness of the interface diffusion layer increased from 0.5 µm to 30 µm with increasing welding energy.
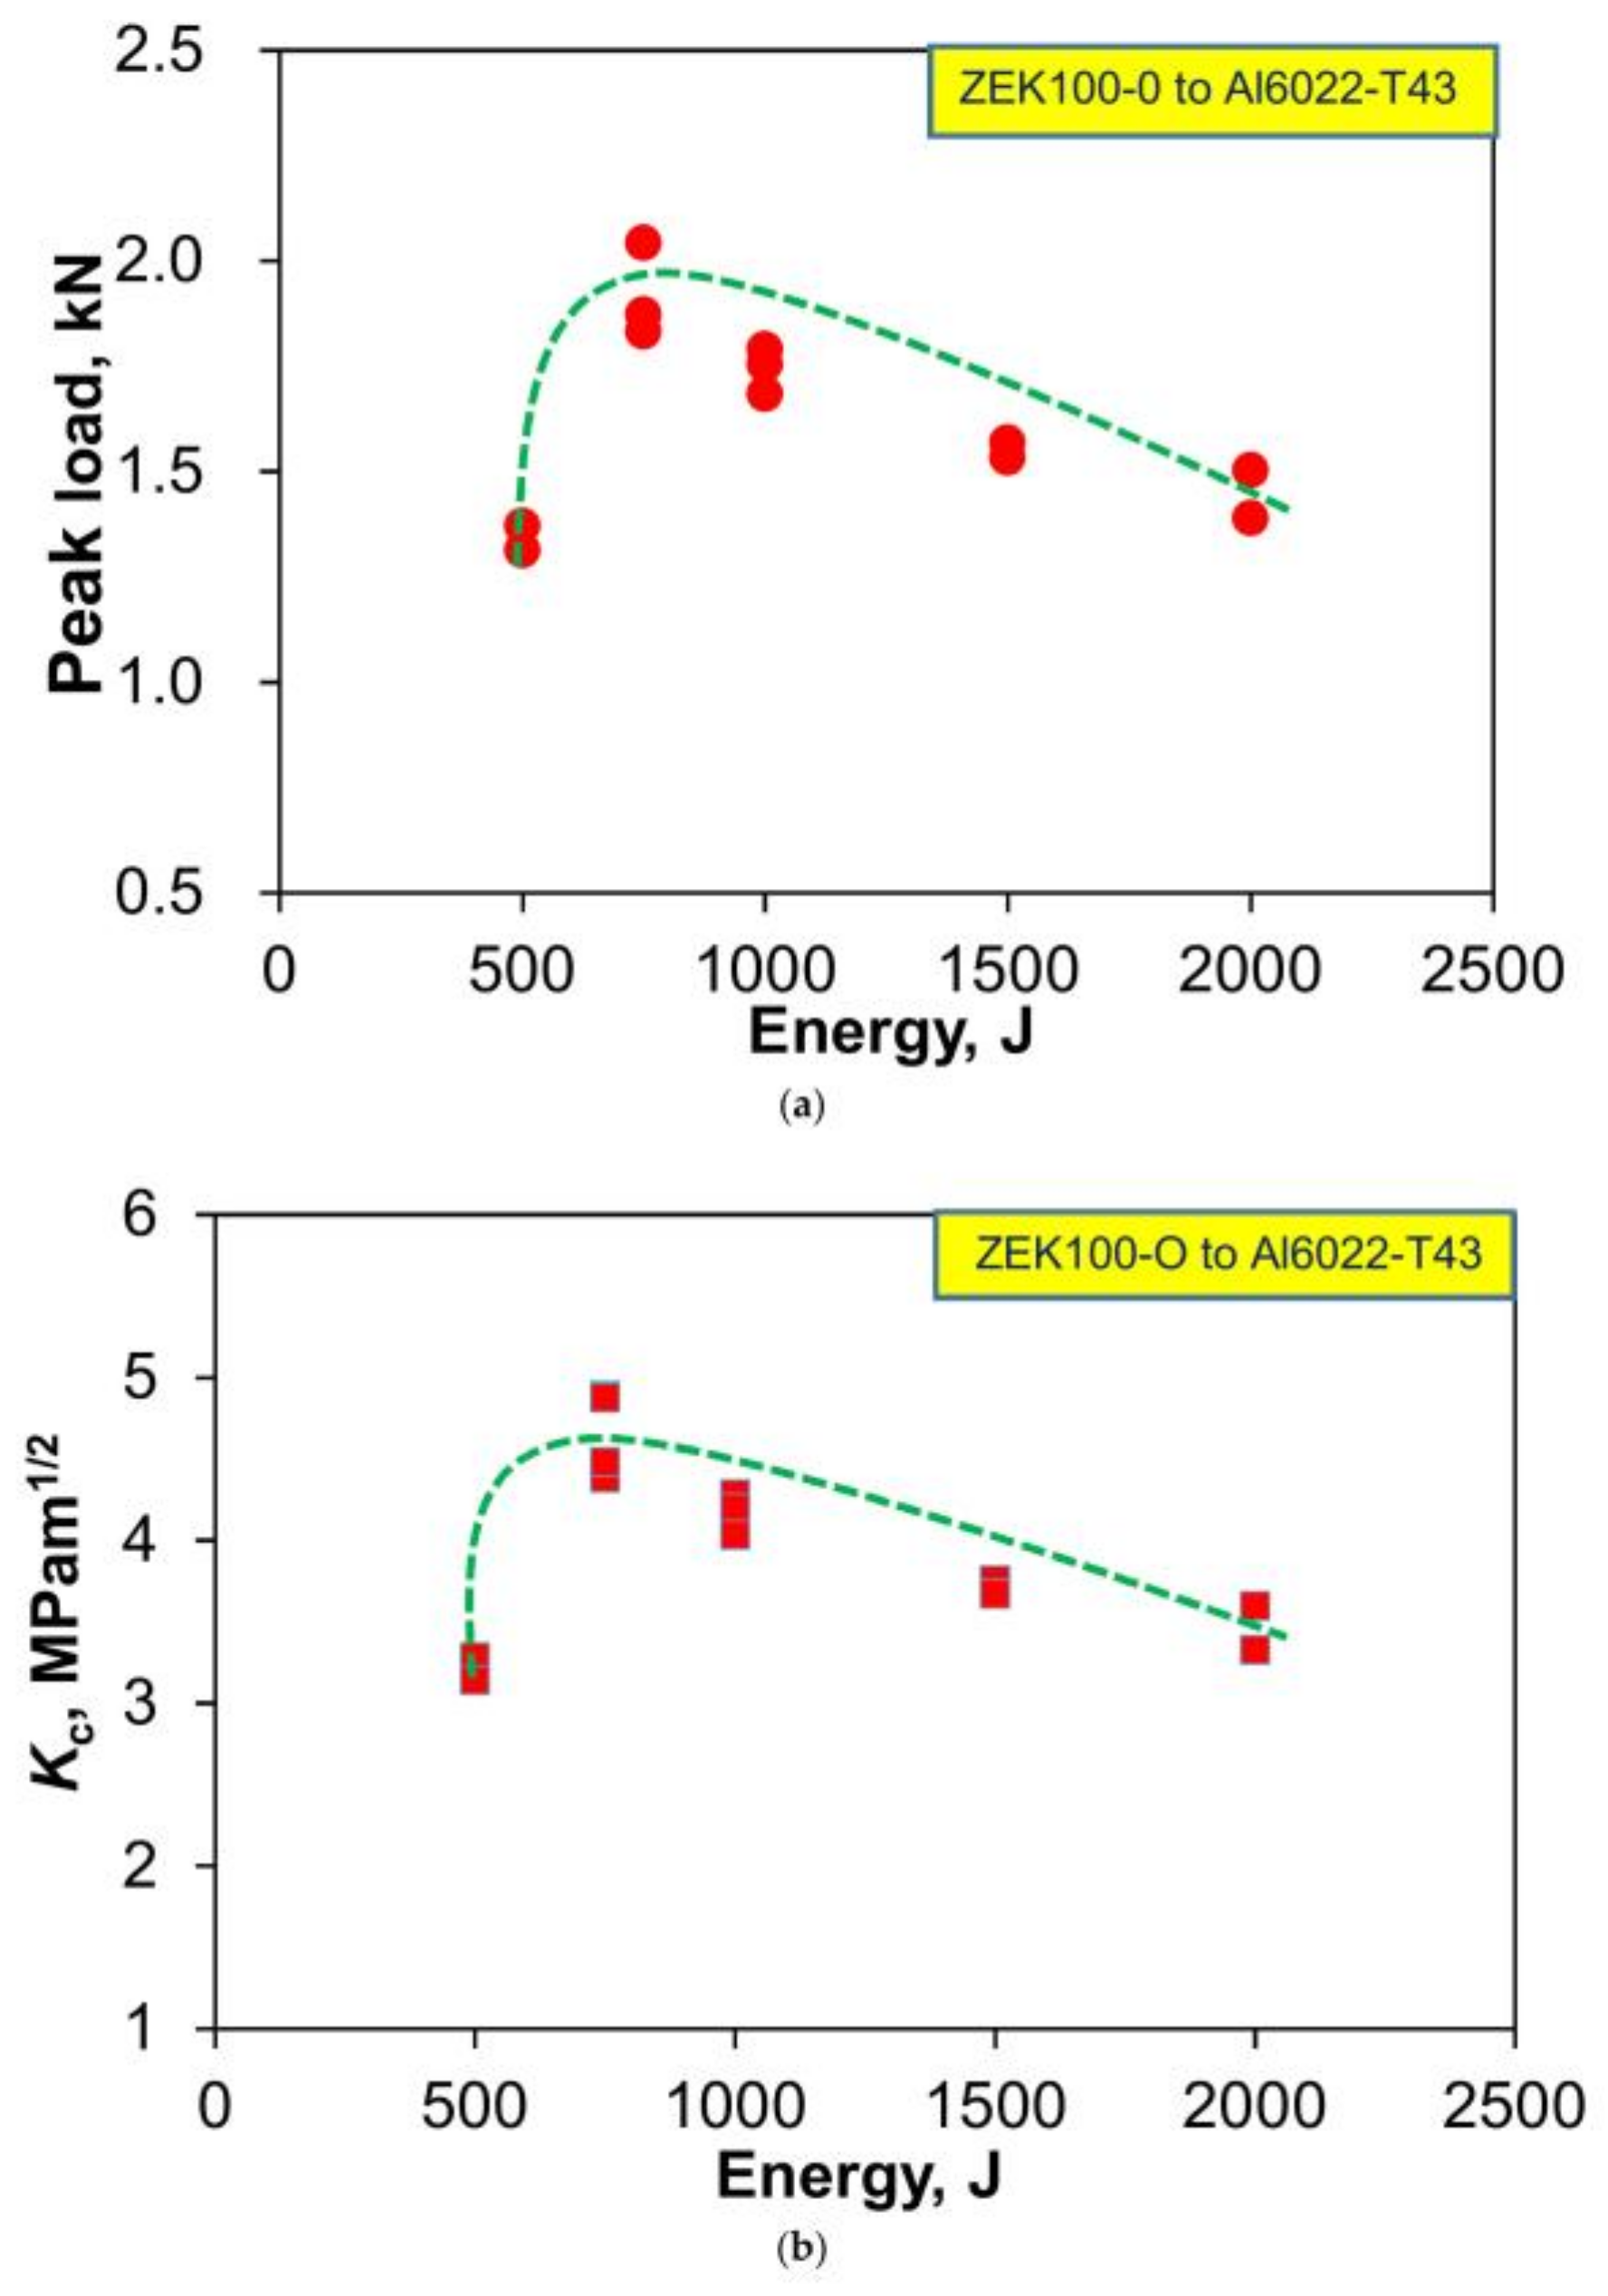
  • As the welding energy increased, the tensile lap shear peak load and critical stress intensity of the USWed joints first increased, reached their maximum values, and then decreased, while the interfacial failure mode occurred in the tensile lap shear tests at all levels of welding energy due to the presence of interface diffusion layer.
  • The desirable interface diffusion layer was observed to be thin (about 3~5 µm in thickness) and continuous, which was achieved at a welding energy of 750 J, corresponding to the highest peak load of ~2 kN and the highest critical stress intensity of ~4.7 MPam1/2, respectively.
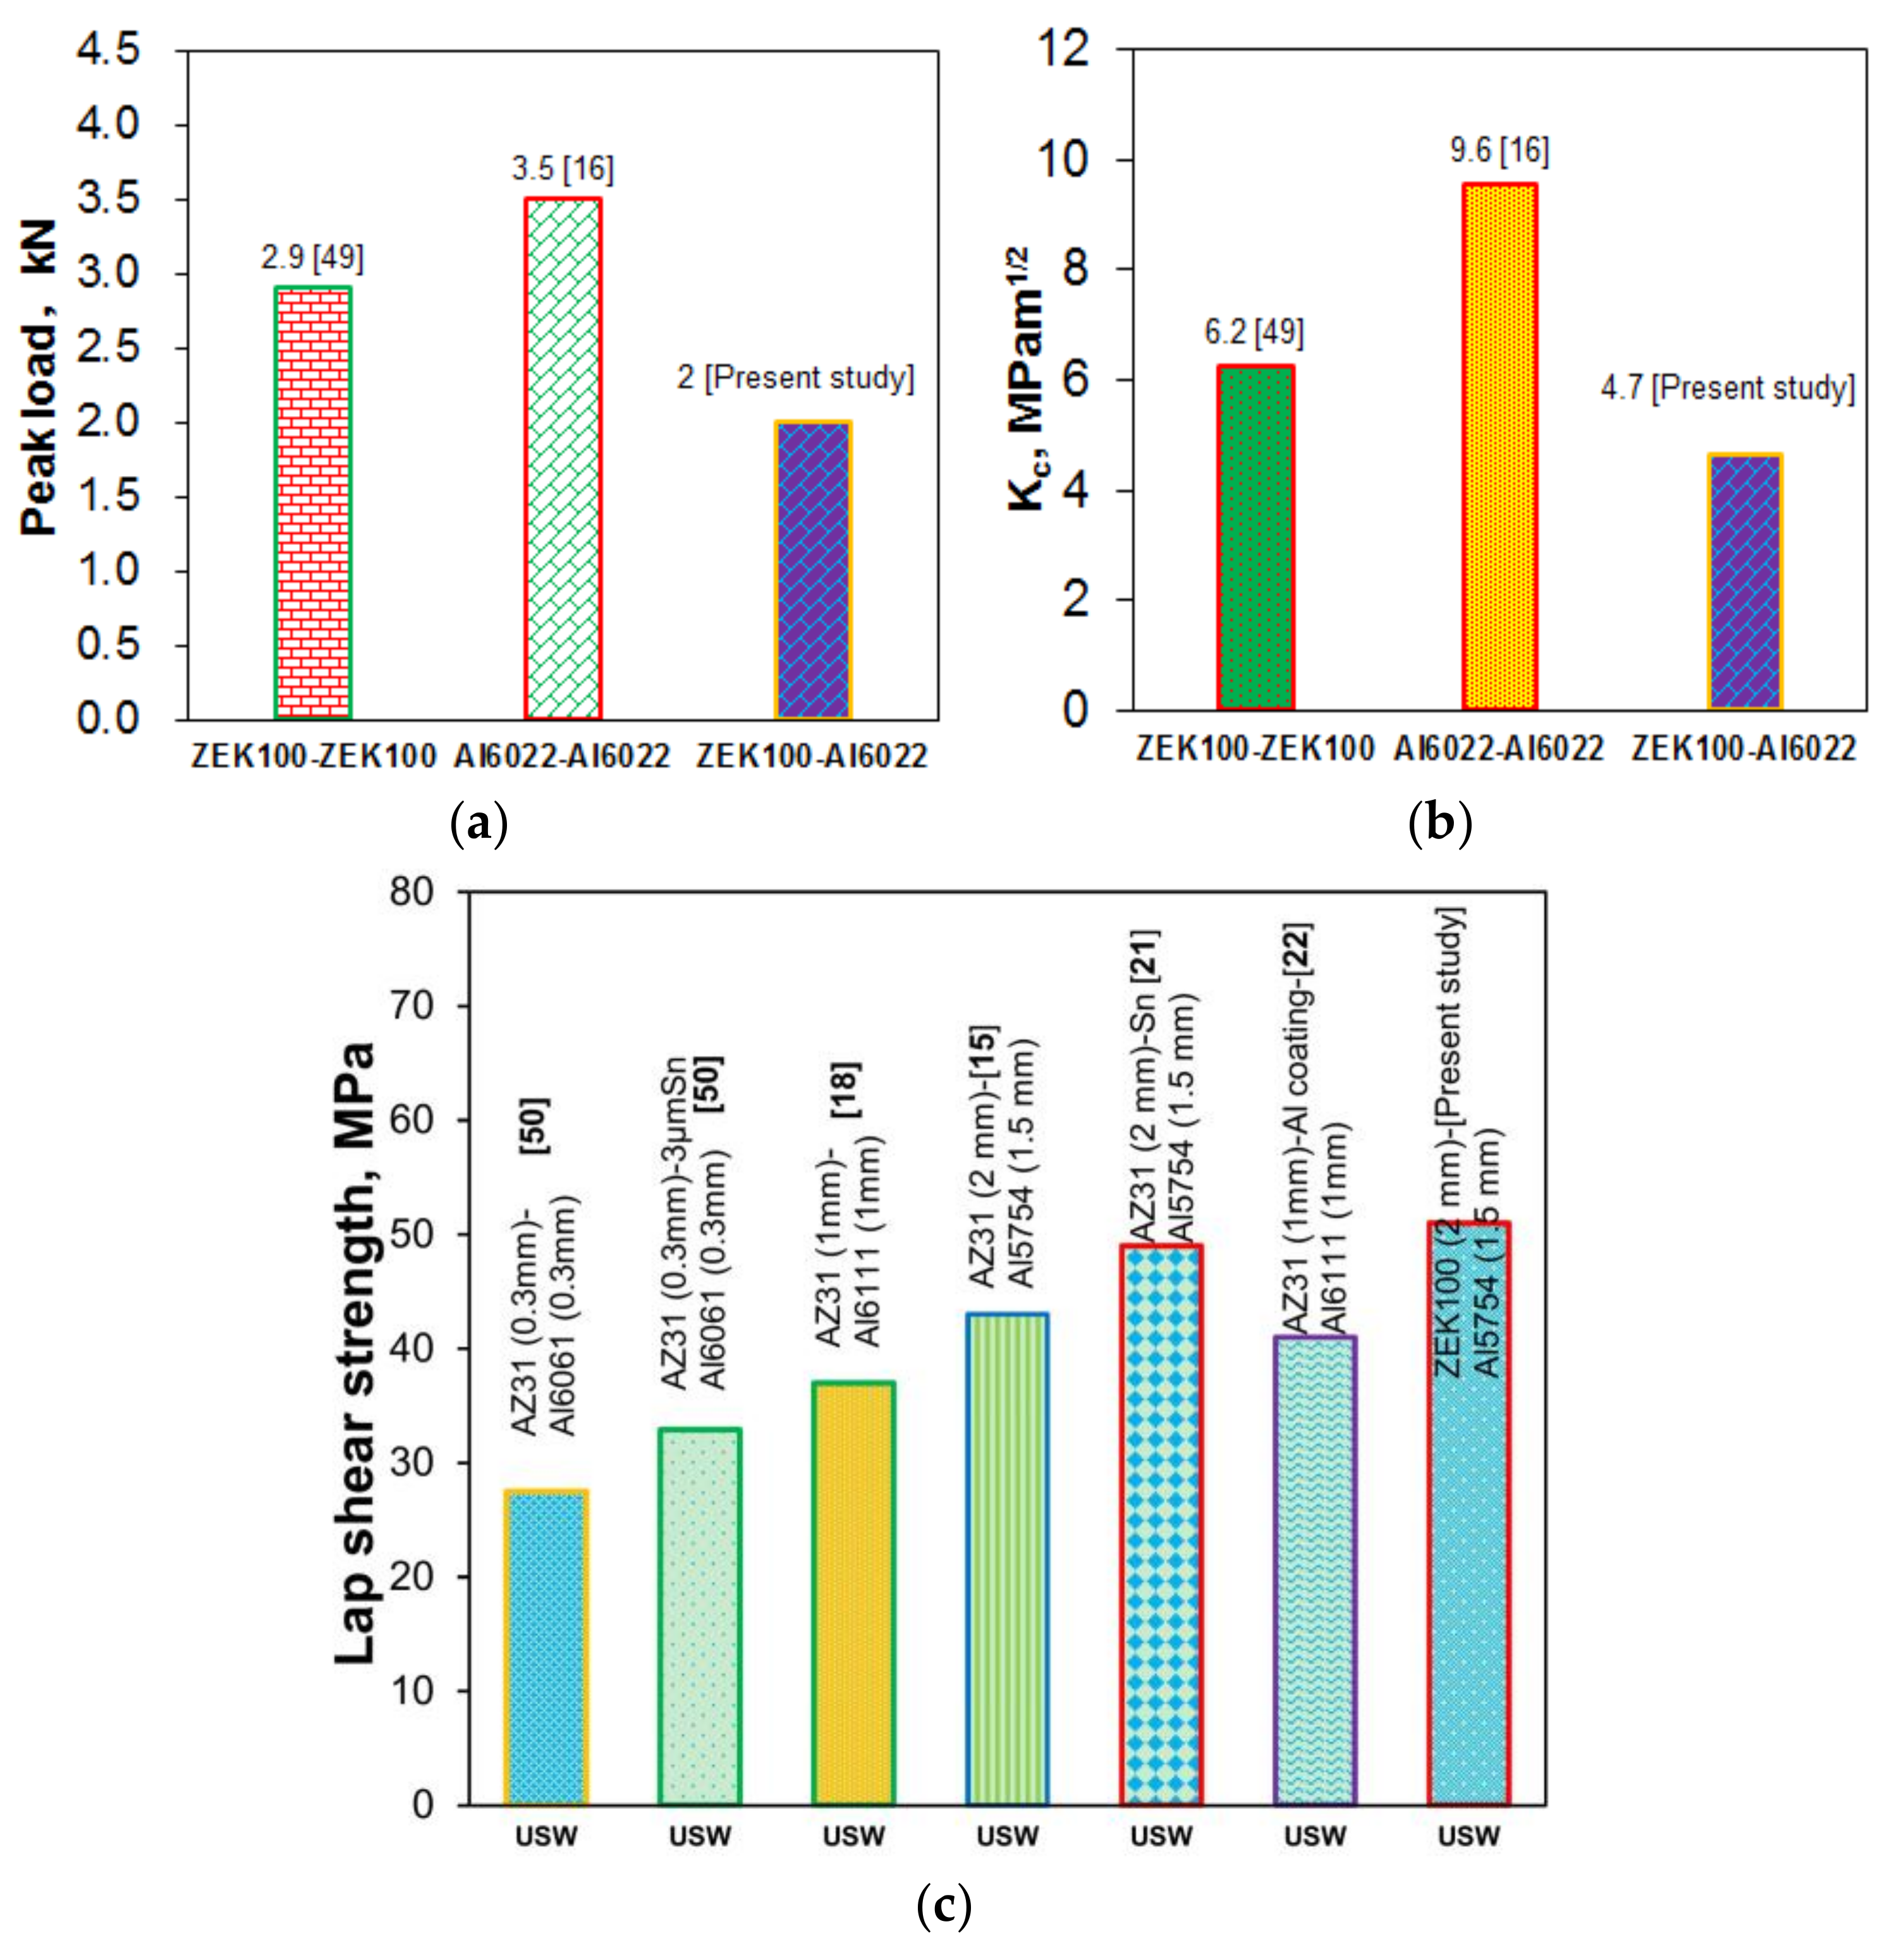
  • The peak load of USWed ZEK100-Al6022 dissimilar joints reached about 68% of that of USWed ZEK100-ZEK100 similar joints and about 56% of that of USWed Al6022-Al6022 similar joints, while the peak critical stress intensity of ZEK100-Al6022 dissimilar joints arrived at about 75% and 49% of that of ZEK100-ZEK100 and Al6022-Al6022 similar joints, respectively. This was mainly related to the existence of interface diffusion layer in the ZEK100-Al6022 dissimilar joints and the difference in the ductility and formability between Al alloy and Mg alloy.
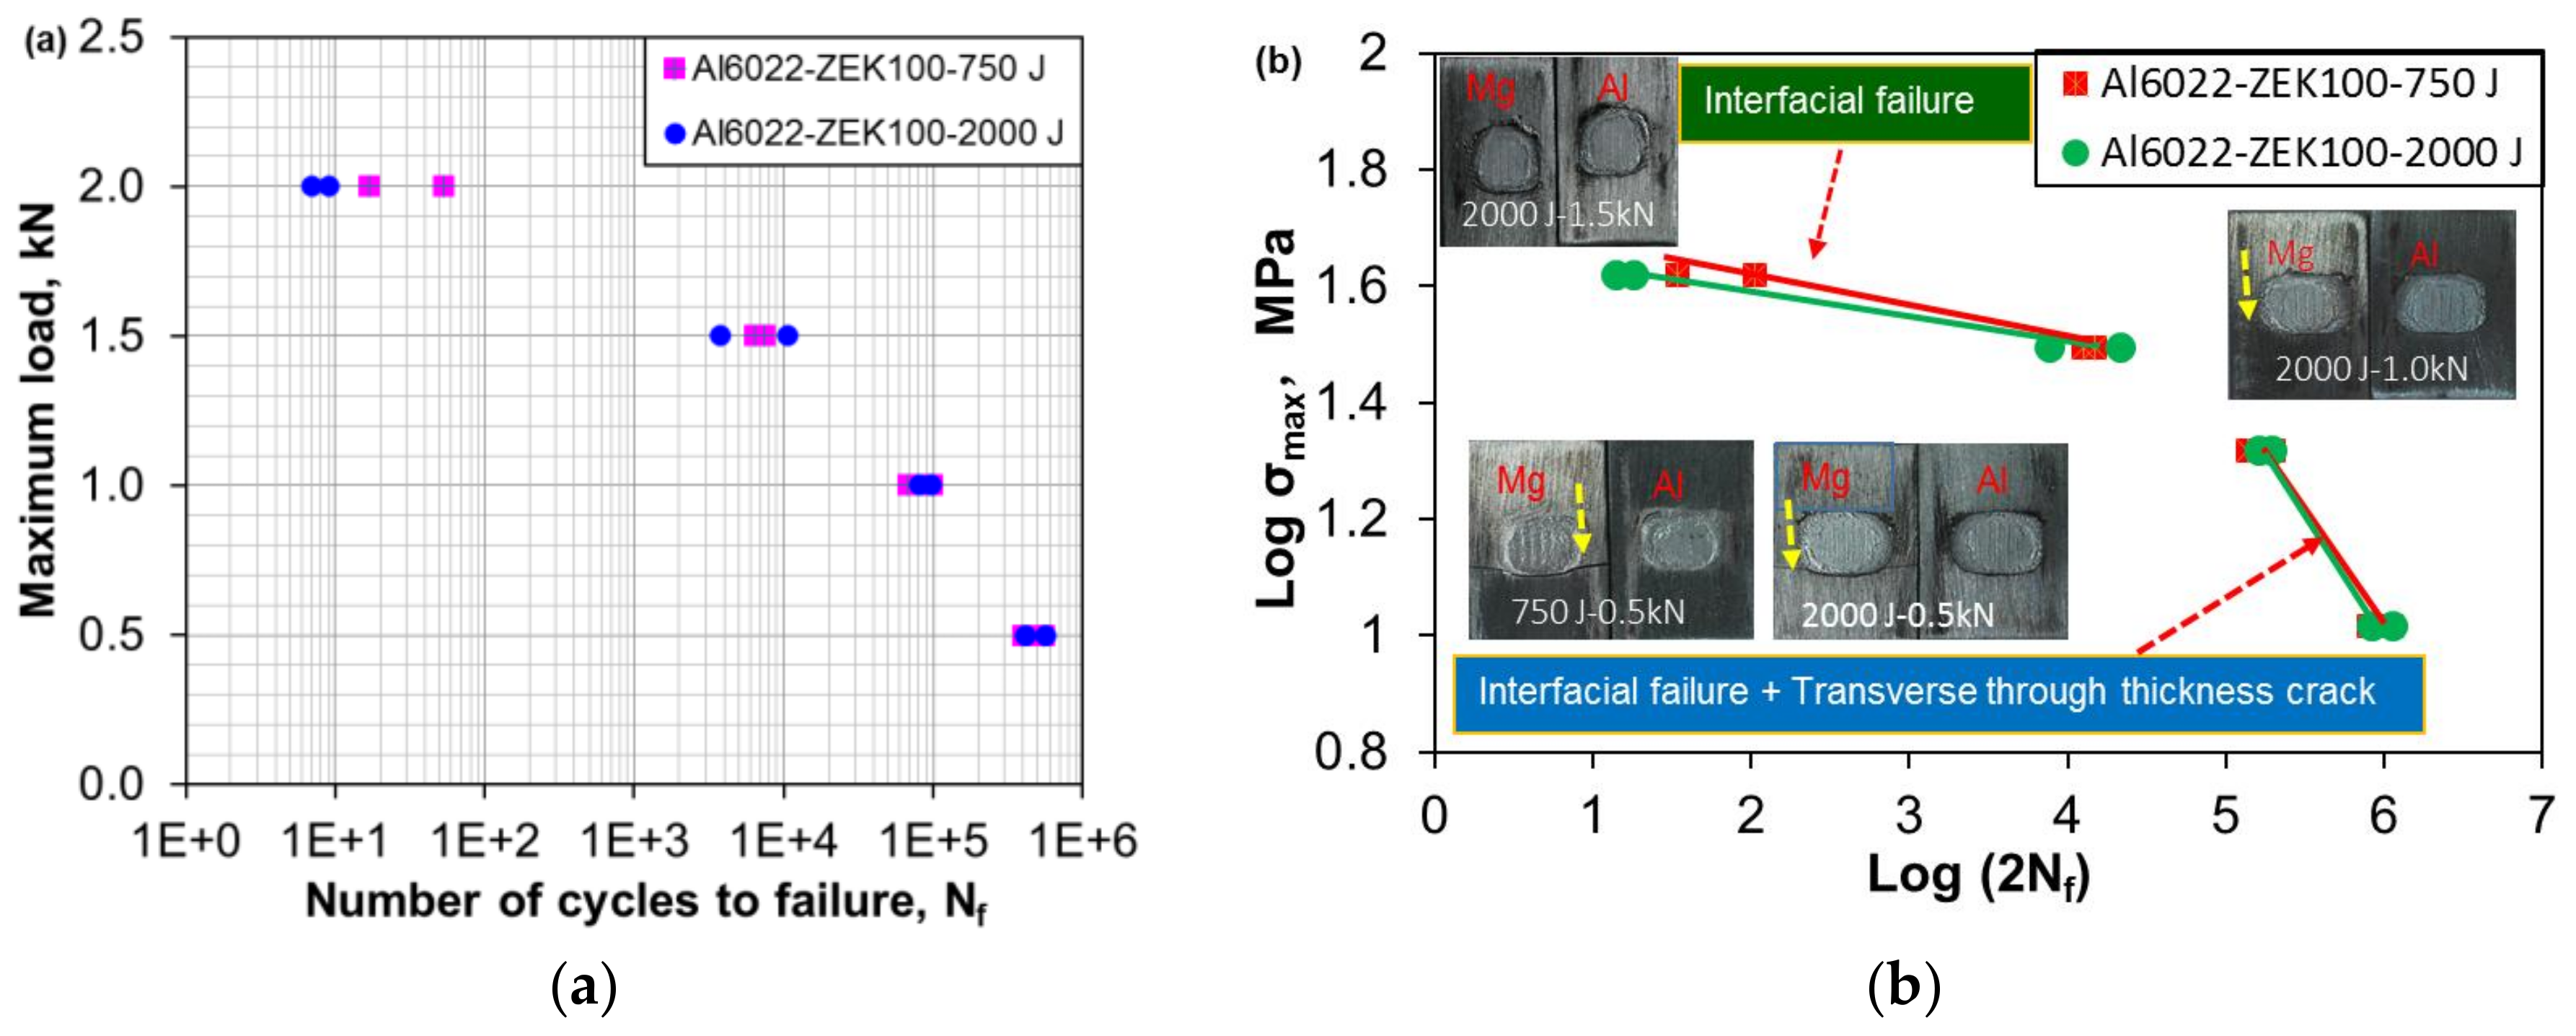
  • Fatigue life of the USWed ZEK100-Al6022 dissimilar joints made at energy levels of 750 J and 2000 J was equivalent at the lower cyclic loads, while the joints made at 750 J exhibited a longer fatigue life at the higher cyclic loading levels. When the cyclic loading levels changed from high to low, the fatigue fracture mode changed from the interfacial failure to a mixed mode of interfacial failure and TTT crack growth that occurred on the Mg side, which corresponded well to the bi-linear characteristic of S-N curves.
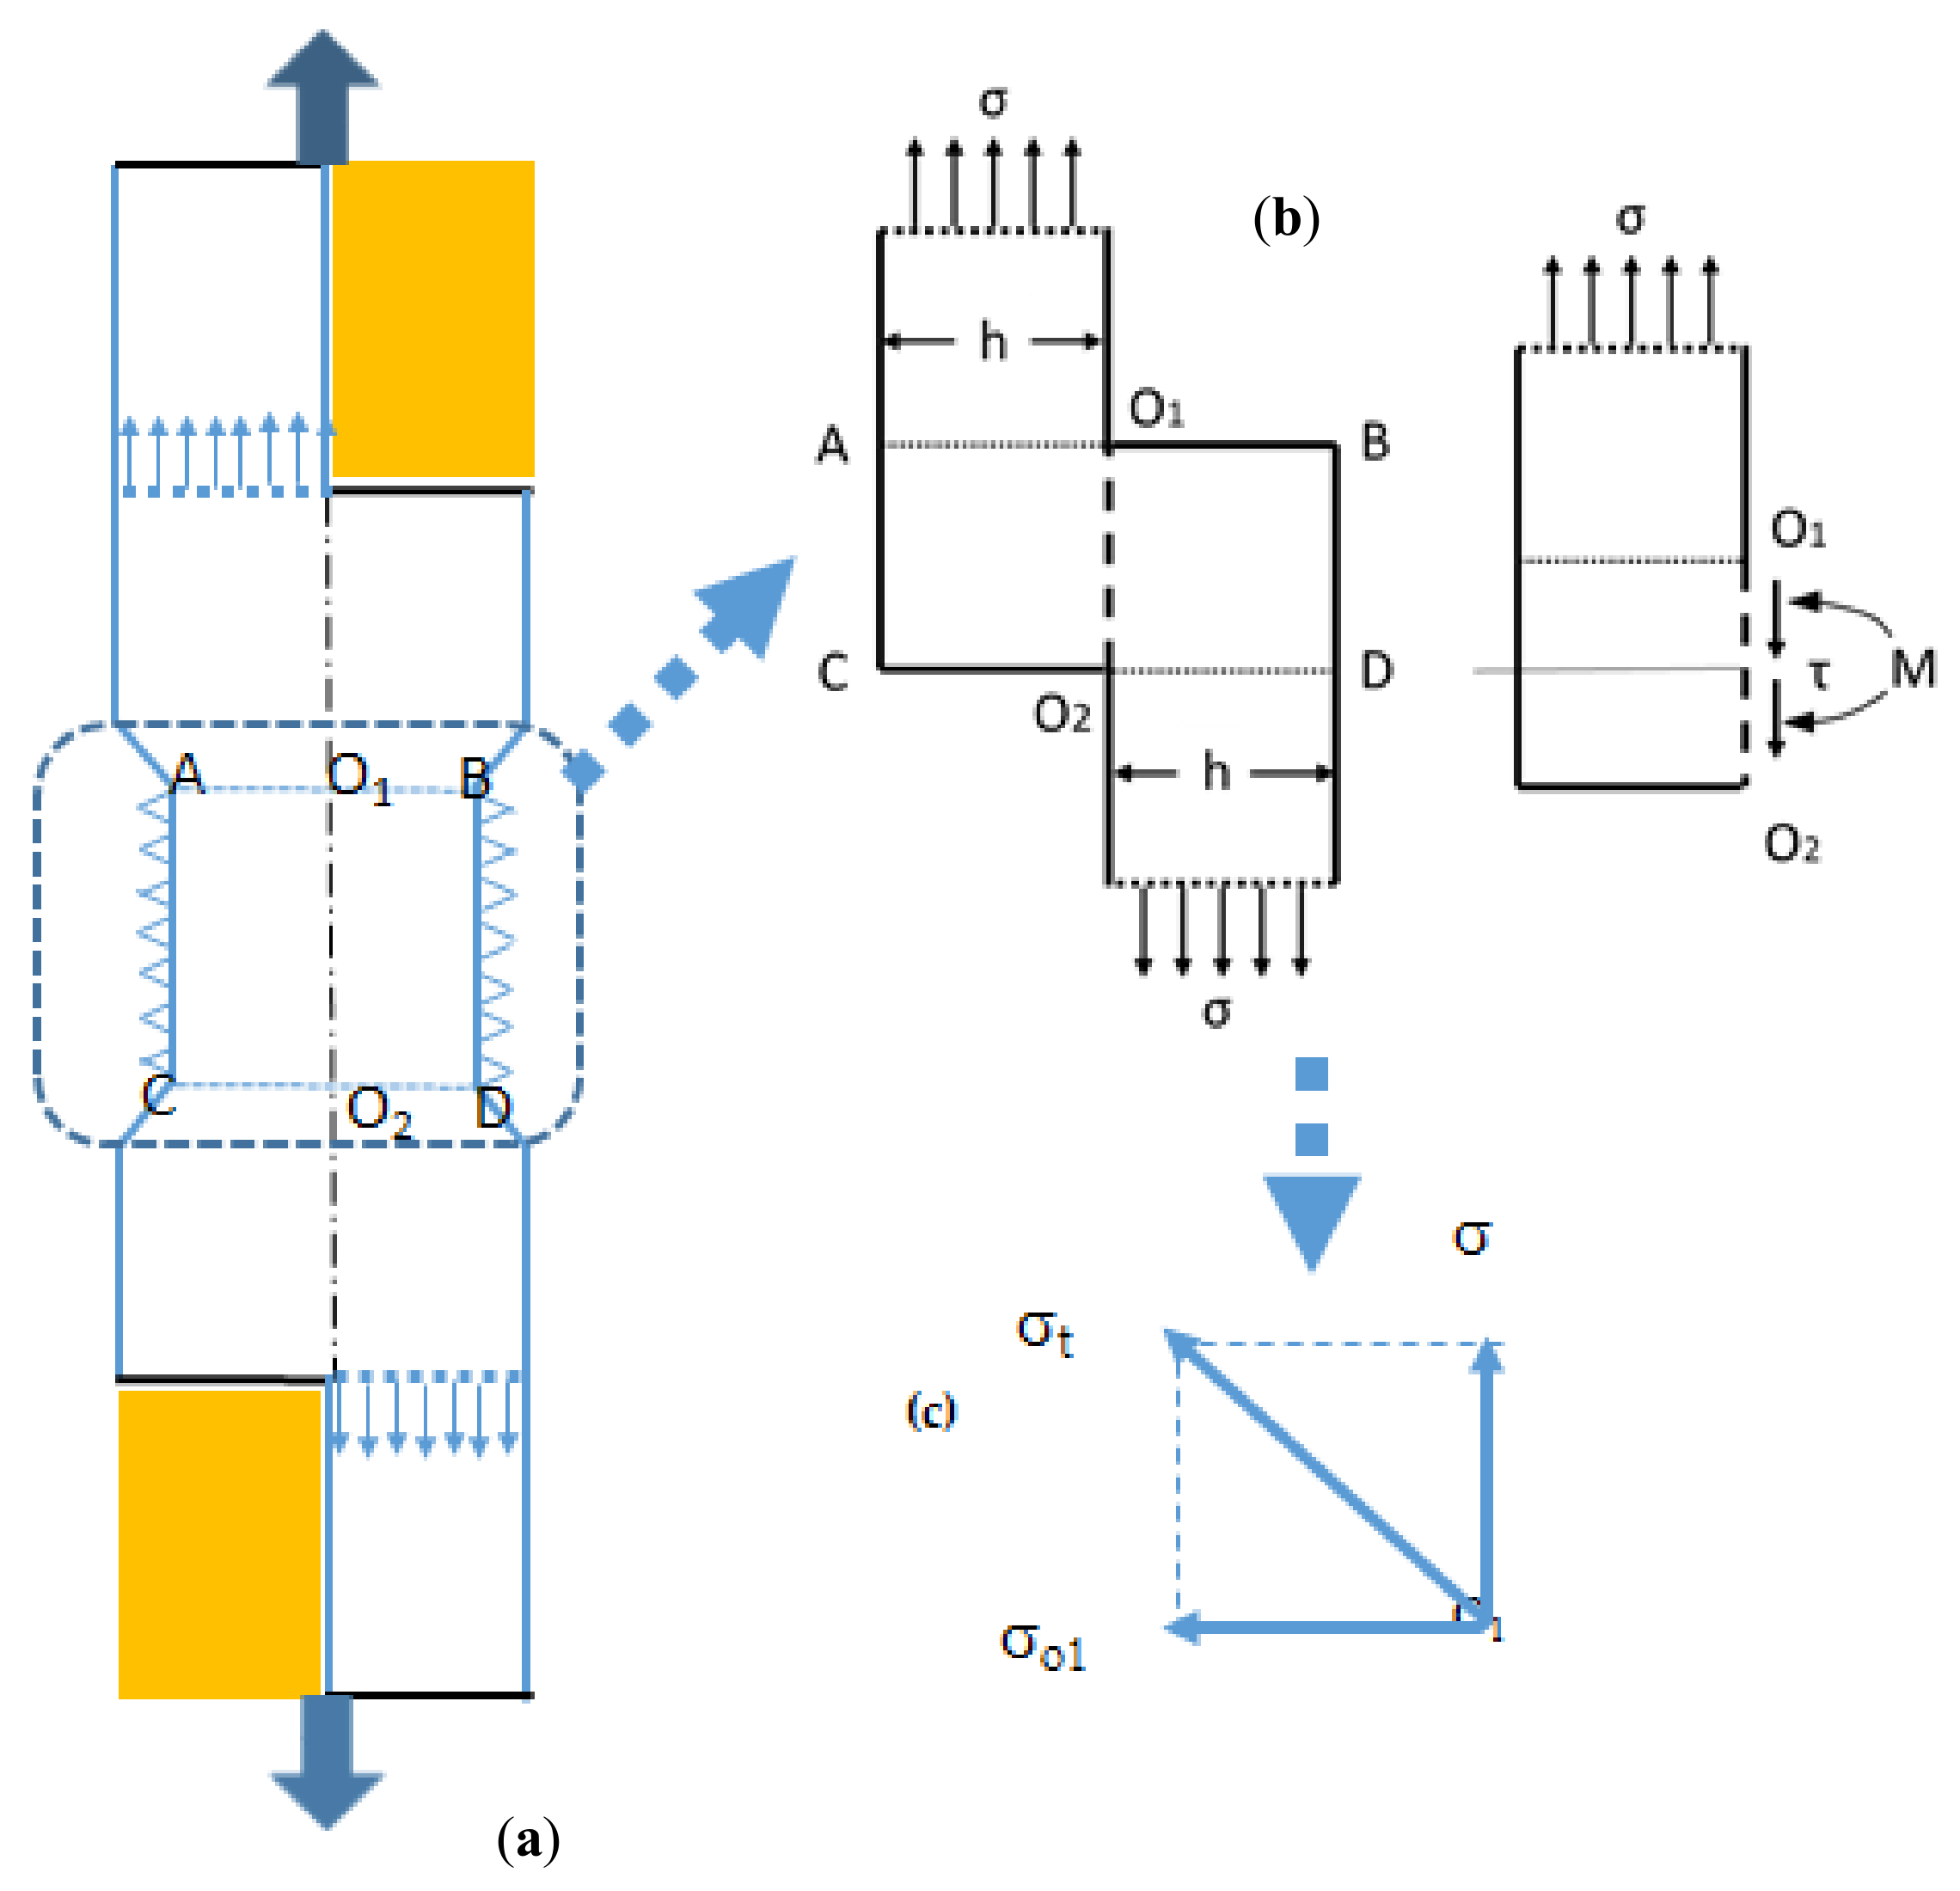
  • In both tensile lap shear and fatigue tests, the crack initiation was observed to occur basically at the weld nugget edge and at the interface between the two sheets. A theoretical stress analysis indicated that this was due to the presence of the maximum triaxial stresses at that location.

Acknowledgments

The authors would like to thank the Natural Sciences and Engineering Research Council of Canada (NSERC), National Natural Science Foundation of China (Grant No. 50771085), and Fundamental Research Funds for the Central Universities (XDJK2016B007, XDJK2015B028) for providing financial support. The authors thank A.A. Luo, Ohio State University (formerly General Motors Research and Development Center) and T. Skszek, Magna International Inc., for the supply of test materials. H. Peng is grateful for China Scholarship Council, and D.L. Chen is grateful for the financial support by the Premier’s Research Excellence Award (PREA), NSERC-Discovery Accelerator Supplement (DAS) Award, Canada Foundation for Innovation (CFI), and Ryerson Research Chair (RRC) program. The authors would also like to thank F. Mokdad, A. Macwan, Q. Li, A. Machin, J. Amankrah, and R. Churaman for easy access to the laboratory facilities of Ryerson University and their assistance in the experiments.

Author Contributions

D.L.C. and X.Q.J. conceived and designed the experiments; H.P. performed the experiments; X.F.B. analyzed the stress; H.P., D.Y.L., and D.L.C. discussed and analyzed the data, and wrote and revised the manuscript. All authors reviewed the final manuscript.

Conflicts of Interest

The authors declare no conflict of interest.

References

  1. Anenberg, S.C.; Miller, J.; Minjares, R.; Du, L.; Henze, D.K.; Lacey, F.; Malley, C.S.; Emberson, L.; Franco, V.; Klimont, Z.; et al. Impacts and mitigation of excess diesel-related NOx emissions in 11 major vehicle markets. Nature 2017, 545, 467–471. [Google Scholar] [CrossRef] [PubMed]
  2. Rockström, J.; Gaffney, O.; Rogelj, J.; Meinshausen, M.; Nakicenovic, N.; Schellnhuber, H.J. A roadmap for rapid decarbonization. Science 2017, 355, 1269–1271. [Google Scholar] [CrossRef] [PubMed]
  3. Rosen, J. After the ice goes. Nature 2017, 542, 152–154. [Google Scholar] [CrossRef] [PubMed]
  4. Gielen, D.; Boshell, F.; Saygin, D. Climate and energy challenges for materials science. Nat. Mater. 2016, 15, 117–120. [Google Scholar] [CrossRef] [PubMed]
  5. Chu, S.; Majumdar, A. Opportunities and challenges for a sustainable energy future. Nature 2012, 488, 294–303. [Google Scholar] [CrossRef] [PubMed]
  6. McNutt, M. Climate change impacts. Science 2013, 341, 435. [Google Scholar] [CrossRef] [PubMed]
  7. Zeng, Z.R.; Nie, J.F.; Xu, S.W.; Davies, C.H.J.; Birbilis, N. Super-formable pure magnesium at room temperature. Nat. Commun. 2017, 8, 972. [Google Scholar] [CrossRef] [PubMed]
  8. Nie, J.F.; Zhu, Y.M.; Liu, J.Z.X.; Fang, Y. Periodic segregation of solute atoms in fully coherent twin boundaries. Science 2013, 340, 957–960. [Google Scholar] [CrossRef] [PubMed]
  9. Wu, Z.X.; Curtin, W.A. The origins of high hardening and low ductility in magnesium. Nature 2015, 526, 62–67. [Google Scholar] [CrossRef] [PubMed]
  10. Frankel, G.S. Magnesium alloys: Ready for the road. Nat. Mater. 2015, 14, 1189–1190. [Google Scholar] [CrossRef] [PubMed]
  11. Xu, W.Q.; Birbilis, G.; Sha, N.; Wang, Y.; Daniels, J.E.; Xiao, Y.; Ferry, M. A high-specific-strength and corrosion-resistant magnesium alloy. Nat. Mater. 2015, 14, 1229–1235. [Google Scholar] [CrossRef] [PubMed]
  12. Hirsch, J. Aluminum in innovative light-weight car design. Mater. Trans. 2011, 52, 818–824. [Google Scholar] [CrossRef]
  13. Taub, A.I.; Luo, A.A. Advanced lightweight materials and manufacturing processes for automotive applications. MRS Bull. 2015, 40, 1045–1053. [Google Scholar] [CrossRef]
  14. Liu, P.; Li, Y.J.; Geng, H.R.; Wang, J. Microstructure characteristics in TIG welded joint of Mg Al dissimilar materials. Mater. Lett. 2007, 61, 1288–1291. [Google Scholar] [CrossRef]
  15. Patel, V.K.; Bhole, S.D.; Chen, D.L. Microstructure and mechanical properties of dissimilar welded Mg-Al joints by ultrasonic spot welding technique. Sci. Technol. Weld. Join. 2012, 17, 202–206. [Google Scholar] [CrossRef]
  16. Peng, H.; Chen, D.L.; Jiang, X.Q. Microstructure and mechanical properties of an ultrasonic spot welded aluminum alloy: The effect of welding energy. Materials 2017, 10, 449. [Google Scholar] [CrossRef] [PubMed]
  17. Chen, Y.C.; Nakata, K. Friction stir lap joining aluminum and magnesium alloys. Scr. Mater. 2008, 58, 433–436. [Google Scholar] [CrossRef]
  18. Panteli, A.; Chen, Y.C.; Strong, D.; Zhang, X.; Prangnell, P.B. Optimization of aluminium-to-magnesium ultrasonic spot welding. JOM 2012, 64, 414–420. [Google Scholar] [CrossRef]
  19. Pouranvari, M. Fracture toughness of martensitic stainless steel resistance spot welds. Mater. Sci. Eng. A 2017, 680, 97–107. [Google Scholar] [CrossRef]
  20. Liu, L.; Ren, D.; Liu, F. A review of dissimilar welding techniques for magnesium alloys to aluminum alloys. Materials 2014, 7, 3735–3757. [Google Scholar] [CrossRef] [PubMed]
  21. Patel, V.K.; Bhole, S.D.; Chen, D.L. Improving weld strength of magnesium to aluminum dissimilar joints via tin interlayer during ultrasonic spot welding. Sci. Technol. Weld. Join. 2012, 17, 342–347. [Google Scholar] [CrossRef]
  22. Panteli, A.; Robson, J.D.; Brough, I.; Prangnell, P.B. The effect of high strain rate deformation on intermetallic reaction during ultrasonic welding aluminum to magnesium. Mater. Sci. Eng. A 2012, 556, 31–42. [Google Scholar] [CrossRef]
  23. Panteli, A.; Robson, J.D.; Chen, Y.C. Prangnell, P.B. The effectiveness of surface coatings on preventing interfacial reaction during ultrasonic welding of aluminum to magnesium. Metall. Mater. Trans. A 2013, 44, 5773–5781. [Google Scholar] [CrossRef]
  24. Macwan, A.; Chen, D.L. Ultrasonic spot welding of rare-earth containing ZEK100 magnesium alloy to 5754 aluminum alloy. Mater. Sci. Eng. A 2016, 666, 139–148. [Google Scholar] [CrossRef]
  25. Macwan, A.; Chen, D.L. Microstructure and mechanical properties of ultrasonic spot welded copper-to-magnesium alloy joints. Mater. Des. 2015, 84, 261–269. [Google Scholar] [CrossRef]
  26. Macwan, A.; Patel, V.K.; Jiang, X.Q.; Li, C.; Bhole, S.D.; Chen, D.L. Ultrasonic spot welding of Al/Mg/Al tri-layered clad sheets. Mater. Des. 2014, 62, 344–351. [Google Scholar] [CrossRef]
  27. Bakavos, D.; Prangnell, P.B. Mechanisms of joint and microstructure formation in high power ultrasonic spot welding 6111 aluminum automotive sheet. Mater. Sci. Eng. A 2010, 527, 6320–6334. [Google Scholar] [CrossRef]
  28. Gould, J.E. Joining aluminum sheet in the automotive industry—A 30 year history. Weld. J. 2012, 91, 23s–34s. [Google Scholar]
  29. Patel, V.K.; Chen, D.L.; Bhole, S.D. Dissimilar ultrasonic spot welding of Mg-Al and Mg-high strength low alloy steel. Theor. Appl. Mech. Lett. 2014, 4, 041005-1–041005-8. [Google Scholar] [CrossRef]
  30. Macwan, A.; Mirza, F.A.; Bhole, S.D.; Chen, D.L. Similar and dissimilar ultrasonic spot welding of 5754 aluminum alloy for automotive applications. Mater. Sci. Forum 2017, 877, 561–568. [Google Scholar] [CrossRef]
  31. Griffiths, D.; Davis, B.; Robson, J.D. The Influence of strain path on rare earth recrystallization textures in a magnesium-zinc-rare earth alloy. Metall. Mater. Trans. A 2018, 49, 321–332. [Google Scholar] [CrossRef]
  32. Boba, M.; Butcher, C.; Panahi, N.; Worswick, M.J.; Mishra, R.K.; Carter, J.T. Warm forming limits of rare earth-magnesium alloy ZEK100 sheet. Int. J. Mater. Form. 2017, 10, 181–191. [Google Scholar] [CrossRef]
  33. Rao, H.M.; Rodriguez, R.I.; Jordon, J.B.; Barkey, M.E.; Guo, Y.B.; Badarinarayan, H.; Yuan, W. Friction stir spot welding of rare-earth containing ZEK100 magnesium alloy sheets. Mater. Des. 2014, 56, 750–754. [Google Scholar] [CrossRef]
  34. Niu, X.P.; Skszek, T.; Fabischek, M.; Zak, A. Low temperature warm forming of magnesium ZEK 100 sheets for automotive applications. Mater. Sci. Forum 2014, 783–786, 431–436. [Google Scholar] [CrossRef]
  35. Mokdad, F.; Chen, D.L. Strain-controlled low cycle fatigue properties of a rare-earth containing ZEK100 magnesium alloy. Mater. Des. 2015, 67, 436–447. [Google Scholar] [CrossRef]
  36. Mokdad, F.; Chen, D.L. Cyclic deformation and anelastic behavior of ZEK100 magnesium alloy: Effect of strain ratio. Mater. Sci. Eng. A 2015, 640, 243–258. [Google Scholar] [CrossRef]
  37. Mirza, F.A.; Chen, D.L.; Li, D.J.; Zeng, X.Q. Effect of rare earth elements on deformation behavior of an extruded Mg-10Gd-3Y-0.5Zr alloy during compression. Mater. Des. 2013, 46, 411–418. [Google Scholar] [CrossRef]
  38. Tahreen, N.; Zhang, D.F.; Pan, F.S.; Jiang, X.Q.; Li, D.Y.; Chen, D.L. Hot deformation and processing map of an as-extruded Mg-Zn-Mn-Y alloy containing I and W phases. Mater. Des. 2015, 87, 245–255. [Google Scholar] [CrossRef]
  39. Gray, J.E.; Luan, B. Protective coatings on magnesium and its alloys—A critical review. J. Alloy. Compd. 2002, 336, 88–113. [Google Scholar] [CrossRef]
  40. Yamasaki, M.; Hayashi, N.; Izumi, S.; Kawamura, Y. Corrosion behavior of rapidly solidified Mg-Zn-rare earth element alloys in NaCl solution. Corros. Sci. 2007, 49, 255–262. [Google Scholar] [CrossRef]
  41. Wielage, B.; Mucklich, S.; Grund, T. Corrosion behavior of soldered joints of magnesium alloys and dissimilar materials. Microchim. Acta 2007, 156, 151–155. [Google Scholar] [CrossRef]
  42. Ishak, M.; Yamasaki, K.; Maekawa, K. Micmstnlcture and Corrosion Behavior of Laser Welded Magnesium Alloys with Silver NaIloparticles. World Acad. Sci. Eng. Technol. 2010, 70, 354–358. [Google Scholar]
  43. Macwan, A.; Jiang, X.Q.; Chen, D.L. Interfacial characterization of dissimilar joints between Al/Mg/Al-trilayered clad sheet to high-strength low-alloy steel. JOM 2015, 67, 1468–1477. [Google Scholar] [CrossRef]
  44. Chowdhury, S.H.; Chen, D.L.; Bhole, S.D.; Cao, X.; Wanjara, P. Lap shear strength and fatigue life of friction stir spot welded AZ31 magnesium and 5754 aluminum alloys. Mater. Sci. Eng. A 2012, 556, 500–509. [Google Scholar] [CrossRef]
  45. Chowdhury, S.H.; Chen, D.L.; Bhole, S.D.; Cao, X.; Wanjara, P. Lap shear strength and fatigue behavior of friction stir spot welded dissimilar magnesium-to-aluminum joints with adhesive. Mater. Sci. Eng. A 2013, 562, 53–60. [Google Scholar] [CrossRef]
  46. Firouzdor, V.; Kou, S. Formation of liquid and intermetallics in Al-to-Mg friction stir welding. Metall. Mater. Trans. A 2010, 41, 3238–3251. [Google Scholar] [CrossRef]
  47. Sun, M.; Niknejad, S.T.; Zhang, G.; Lee, M.K.; Wu, L.; Zhou, Y. Microstructure and mechanical properties of resistance spot welded AZ31/AA5754 using a nickel interlayer. Mater. Des. 2015, 87, 905–913. [Google Scholar] [CrossRef]
  48. Sato, Y.S.; Shiota, A.; Kokawa, H.; Okamoto, K.; Yang, Q.; Kim, C. Effect of interfacial microstructure on lap shear strength of friction stir spot weld of aluminum alloy to magnesium alloy. Sci. Technol. Weld. Join. 2010, 15, 319–324. [Google Scholar] [CrossRef]
  49. Shang, J.; Wang, K.H.; Zhou, Q.; Zhang, D.K.; Huang, J.; Li, G. Microstructure characteristics and mechanical properties of cold metal transfer welding Mg/Al dissimilar metals. Mater. Des. 2012, 34, 559–565. [Google Scholar] [CrossRef]
  50. Cui, Q.B.; Li, Y.L.; Yang, J.; Wang, Y.B.; Xiao, X. Effects of chemical plating Sn coating on the ultrasonic spot welding of Mg/Al dissimilar metals. Mater. Sci. Technol. 2017, 25, 35–38. [Google Scholar] [CrossRef]
  51. Li, X.R.; Liang, W.; Zhao, X.G.; Zhang, Y.; Fu, X.P.; Liu, F.C. Bonding of Mg and Al with Mg–Al eutectic alloy and its application in aluminum coating on magnesium. J. Alloy. Compd. 2009, 471, 408–411. [Google Scholar] [CrossRef]
  52. Choi, D.; Ahn, B.; Lee, C.; Yeon, Y.; Song, K.; Jung, S. Formation of intermetallic compounds in Al and Mg alloy interface during friction stir spot welding. Intermetallics 2011, 19, 125–130. [Google Scholar] [CrossRef]
  53. Carboni, M.; Annoni, M. Ultrasonic metal welding of AA 6022-T4 lap joints: Part II—Fatigue behavior, failure analysis and modelling. Sci. Technol. Weld. Join. 2011, 16, 116–125. [Google Scholar] [CrossRef]
  54. Patel, V.K.; Bhole, S.D.; Chen, D.L. Fatigue life estimation of ultrasonic spot welded Mg alloy joints. Mater. Des. 2014, 62, 124–132. [Google Scholar] [CrossRef]
  55. Xu, W.; Liu, L.; Zhou, Y.; Mori, H.; Chen, D.L. Tensile and fatigue properties of weld-bonded and adhesive-bonded magnesium alloy joints. Mater. Sci. Eng. A 2012, 563, 125–132. [Google Scholar] [CrossRef]
Figure 1. Schematic diagram of the lap welded joints.
Metals 08 00229 g001
Figure 2. Typical cross-sections of the interface of ZEK100-Al6022 joints at a welding energy of (a) 500 J, (b) 750 J, (c) 2000 J, and (d) the relevant energy-dispersive X-ray spectroscopy (EDS) line scan results at a welding energy of 2000 J, along with the EDS box analysis results given in (c).
Metals 08 00229 g002aMetals 08 00229 g002b
Figure 3. (a) Peak load and (b) critical stress intensity (Kc) as a function of welding energy at a welding power of 2 kW and a clamping pressure of 0.4 MPa.
Metals 08 00229 g003
Figure 4. Comparison of (a) peak load and (b) critical stress intensity of ZEK100-Al6022 dissimilar joints with those of ZEK100-ZEK100 and Al6022-Al6022 similar joints; (c) comparison of the tensile lap shear strengths of the dissimilar joints made with different Mg and Al alloys.
Metals 08 00229 g004
Figure 5. Typical scanning electron microscope (SEM) images of tensile lap shear fracture surfaces of an ultrasonic spot welded (USWed) ZEK100-Al6022 dissimilar joint made at a welding energy of 2000 J, (a) overall view on the Al side, (b) overall view on the Mg side, (c,d) at a lower magnification, and (e,f) at a higher magnification.
Metals 08 00229 g005
Figure 6. X-ray diffraction on both matching fracture surfaces of (a) Mg side and (b) Al side after the tensile lap shear test of a welded joint made at a welding energy of 2000 J.
Metals 08 00229 g006
Figure 7. (a) S-N type curves and (b) the cyclic maximum stress vs. the number of reversals to failure on a log-log scale for the USWed ZEK100-Al6022 dissimilar joints made at a welding energy of 750 J and 2000 J, respectively, and tested at RT, R = 0.2, and a frequency of 50 Hz.
Metals 08 00229 g007
Figure 8. (a) Schematic illustration of an USWed fatigue (tensile) test specimen, along with (b,c) stress analysis on the nugget.
Metals 08 00229 g008
Figure 9. Typical SEM images of a fatigue failed sample made at a welding energy of 750 J and tested at a maximum load of 0.5 kN. (a,b) Overall view of the entire fracture surfaces on the side Al and Mg side, respectively, (c,d) magnified view of the regions of interest indicated in (a,b), and (e,f) further magnified view of the regions of interest indicated in (c,d).
Metals 08 00229 g009
Table 1. Chemical composition of the ZEK100-O Mg alloy and 6022-T43 Al alloy.
MaterialZnZrSiNdTiMnFeCrMgCuAl
ZEK100 Mg alloy1.30.250.20.01Bal
6022Al alloy0.21.00.10.70.50.251.00.1Bal
Table 2. Welding parameters selected in the present study.
Ultrasonic PowerClamping PressureWelding EnergyWelding TimeImpedance SettingFrequency
2000 W0.40 MPa500–2000 J0.25–1 s520 kHz

