Study of Semi-Solid Magnesium Alloys (With RE Elements) as a Non-Newtonian Fluid Described by Rheological Models


Department of Ferrous Metallurgy, Faculty of Metals and Industrial Computer Science, AGH University of Science and Technology, Al. Mickiewicza 30, 30-059 Kraków, Poland
Metals 2018, 8(4), 222; https://doi.org/10.3390/met8040222
Submission received: 28 December 2017
/
Revised: 15 March 2018
/
Accepted: 23 March 2018
/
Published: 28 March 2018
(This article belongs to the Special Issue Semi-Solid Processing of Alloys and Composites)
Abstract
:This paper includes the results of high-temperature rheological experiments on semi-solid magnesium alloys and the verification of different models describing the rheological behaviour of semi-solid magnesium alloys. Such information is key from the point of view of designing alloy forming processes in their semi-solid states. Magnesium alloys are a very attractive material, due to their light weight and good plastic properties; on the other hand, this material is very reactive in a liquid (semi-solid) state, which is challenging from a testing and forming perspective. Formulating/finding models for an accurate description of the rheological behaviour of semi-solid magnesium alloys seems to be key from the standpoint of developing and optimising forming processes for semi-solid magnesium alloys.
1. Introduction
Magnesium alloys are currently growing in importance as materials for parts used in the automotive industry. In addition, materials made of magnesium alloys have been accepted by the European Civil Aviation Conference and NASA as materials for the production of parts which are not prone to corrosion. Magnesium, with its specific gravity of 1.8 g/cm3, is the lightest structural material. It is over four times lighter than steel and 1.5 times lighter than aluminium; at the same time it maintains very good mechanical properties, including ductility, which can be modified by the addition of appropriate alloying elements. Magnesium ranks eighth as the most frequently-occurring element in the lithosphere. It is produced from seawater, brines or magnesium rock and, therefore, its resources are enormous. Moreover, it is 100% recyclable. At present, annual magnesium output is estimated at about 500,000 tonnes p.a.
On the other hand magnesium is a very reactive material in a liquid (semi-solid) state, which makes it challenging from a laboratory and industrial perspective.
Viscosity is a property of liquid metals which plays a key role in many effects occurring in high-temperature conditions. It is a very important parameter when controlling manufacturing processes in which liquid metal is present: casting, forming [1,2,3,4,5], also in the semi-solid state. Data from measurements taken at high-temperatures are necessary for engineering new processes, and for the optimisation of those that already exist [6,7]. Many mathematical models that can assist in describing the thermodynamics, kinetics, fluid flow, and heat exchange have been created in recent years [8,9,10]. Obtaining the correct measurement data has been the basis for the creation of accurate models. The above-mentioned models may be helpful in modelling/optimising processes with the participation of the liquid phase. Mathematical modelling and the control of molten metal processing operations require knowledge of the thermophysical properties of liquid metals. The accuracy of the measurements of these properties is the basic precondition for the development of processes in materials engineering.
The issue of the influence of rheological parameters on semi-solid metal forming processes (SSM) has been considered in the subject literature. The beginning of semi-solid metal forming (SSM—so-called thixotropic forming) goes back to 1970 [11]. At the moment, it is believed that knowledge of the rheological properties in the semi-solid metal alloy forming processes plays a key role in process engineering [12,13,14]. Current semi-solid metal forming processes have been applied primarily in light metals processing [15,16]. Viscosity is the main rheological parameter considered in the SSM processes [17,18,19,20,21]; it is an indicator defining the capability of the metal to fill a mould, and it determines the force required to deform a material.
Many authors have taken up the subject of analysing the value of the dynamic viscosity coefficient of magnesium alloys [22,23,24,25,26,27,28]; however, this data did not concern systems in which rare earth elements had been added. Additionally, authors usually make rheological investigations of semi-solid slurries of alloys [22,23,24,25,26,27,28]. At the same time, the most frequently tested magnesium alloy—AZ91—was analysed in a slightly different way: by analysing rest time and subjecting the system to the impact of forces [22,23], instead of gradually changing the shear rate. This paper supplements the research on the rheological characteristics of magnesium alloys containing rare earth metals and include the results of rheological analysis by using models which are often mentioned in papers about aluminum alloys [16,17,18,19,20,21].
This paper contains the selected results of rheological tests of semi-solid magnesium alloys of the Mg-Zn-Al, Mg-Zn-RE groups: three chemical compositions with applied shear rates from 10 to 150 s−1. The results of rheological tests conducted on magnesium alloys have been used to verify rheological models by Herschel-Bulkley, Ostwald, Carreau, and Bingham, which are most often used in the subject literature to describe the rheological behaviour of semi-solid metallic systems (aluminium, magnesium alloys). These models may be used for modelling alloy-forming processes in semi-solid states, and for computing individual rheological parameters (dynamic viscosity coefficient, shear stress, etc.) without the need to conduct expensive, complicated, and time-consuming tests.
The research materials presented in this paper form part of the tests and analyses performed, which, due to the complexity of the topic, constitute a cycle of studies concerning broadly-understood rheological analyses of liquid and semi-solid magnesium alloys (with various shares of the solid and liquid phases).
2. Materials and Methods
The rheological tests were carried out with a high-temperature rheometer [29,30,31,32,33,34] designed by the Anton Paar company (Anton Paar GmbH, Graz, Austria). The FRS1600 rheometer is a very precise instrument, equipped with an air bearing, one of the few instruments of this type that enables measurements to be performed at high temperatures, testing a very broad range of liquids, characterised by both high and low viscosity values (thanks to the measurement range of torque from 0.05 mNm to 200 mNm). Basically, it consists of the head of a rheometer and a furnace which enables a temperature in the range 673–1805 K to be obtained. There is also the possibility of providing measurements at room temperature. One of the main advantages is an operating system based on pneumatic servomotors used to manipulate the crucibles and the rotating rods inside the furnace. Control of the furnace is also possible using the rheometer software (which is called Rheoplus), which allows experiments with changes of temperature to be programmed. It is not only possible to study the rheological properties of materials, in the liquid state in this type of rheometer, but also in the semi-solid state.
The measurement is performed in a fixed crucible into which a sample of the material tested is placed, then a rotating spindle is immersed within the material being tested. The crucible is then placed inside a ceramic shroud, being a component of a heating furnace. The furnace, which is comprised of four electrically-heated SiC-type heating elements, enables the maximum temperature of 1793 K to be obtained within the sample. The whole device is shielded from the outside with an insulating material. The temperature inside the furnace is controlled by a change in feeder power in the measurement and control system. The heating rate, along with maintaining the temperature at a constant level, are set in the control panel of the Rheoplus software of the rheometer. Rotary movements of the spindle are controlled by a motorised measurement head—the spindle being suspended on a ceramic tube placed in an air bearing. The head is cooled with water and air in order to ensure a low temperature.
In this rheometer the torque values are measured by the head and then the software calculates the values of shear stress, viscosity, etc. [34]. The instrument features torque accuracy of 0.001 mNm. The parameters of the geometry of the measurement system used are implemented in the Rheoplus software before starting the experiments. This method of measurement, with adequate equations for viscosity calculation, is fully described in [34].
The measurements were provided in a Searle-type system [18,20,29,30,31,32,33,34]. Concentric cylinder systems are described by the standards ISO 3219 and DIN 53019. Bobs with perforated surfaces, with diameters of 16 mm, and cups with smooth inner surfaces and an internal diameter of 30 mm were used for the tests. Materials were selected for the tools that prevented the tool surface reacting with the sample tested. The measurement system was made of low-carbon steel.
The rheological tests were conducted for three magnesium alloys with different chemical compositions. Table 1 presents the chemical compositions of the magnesium alloys tested.
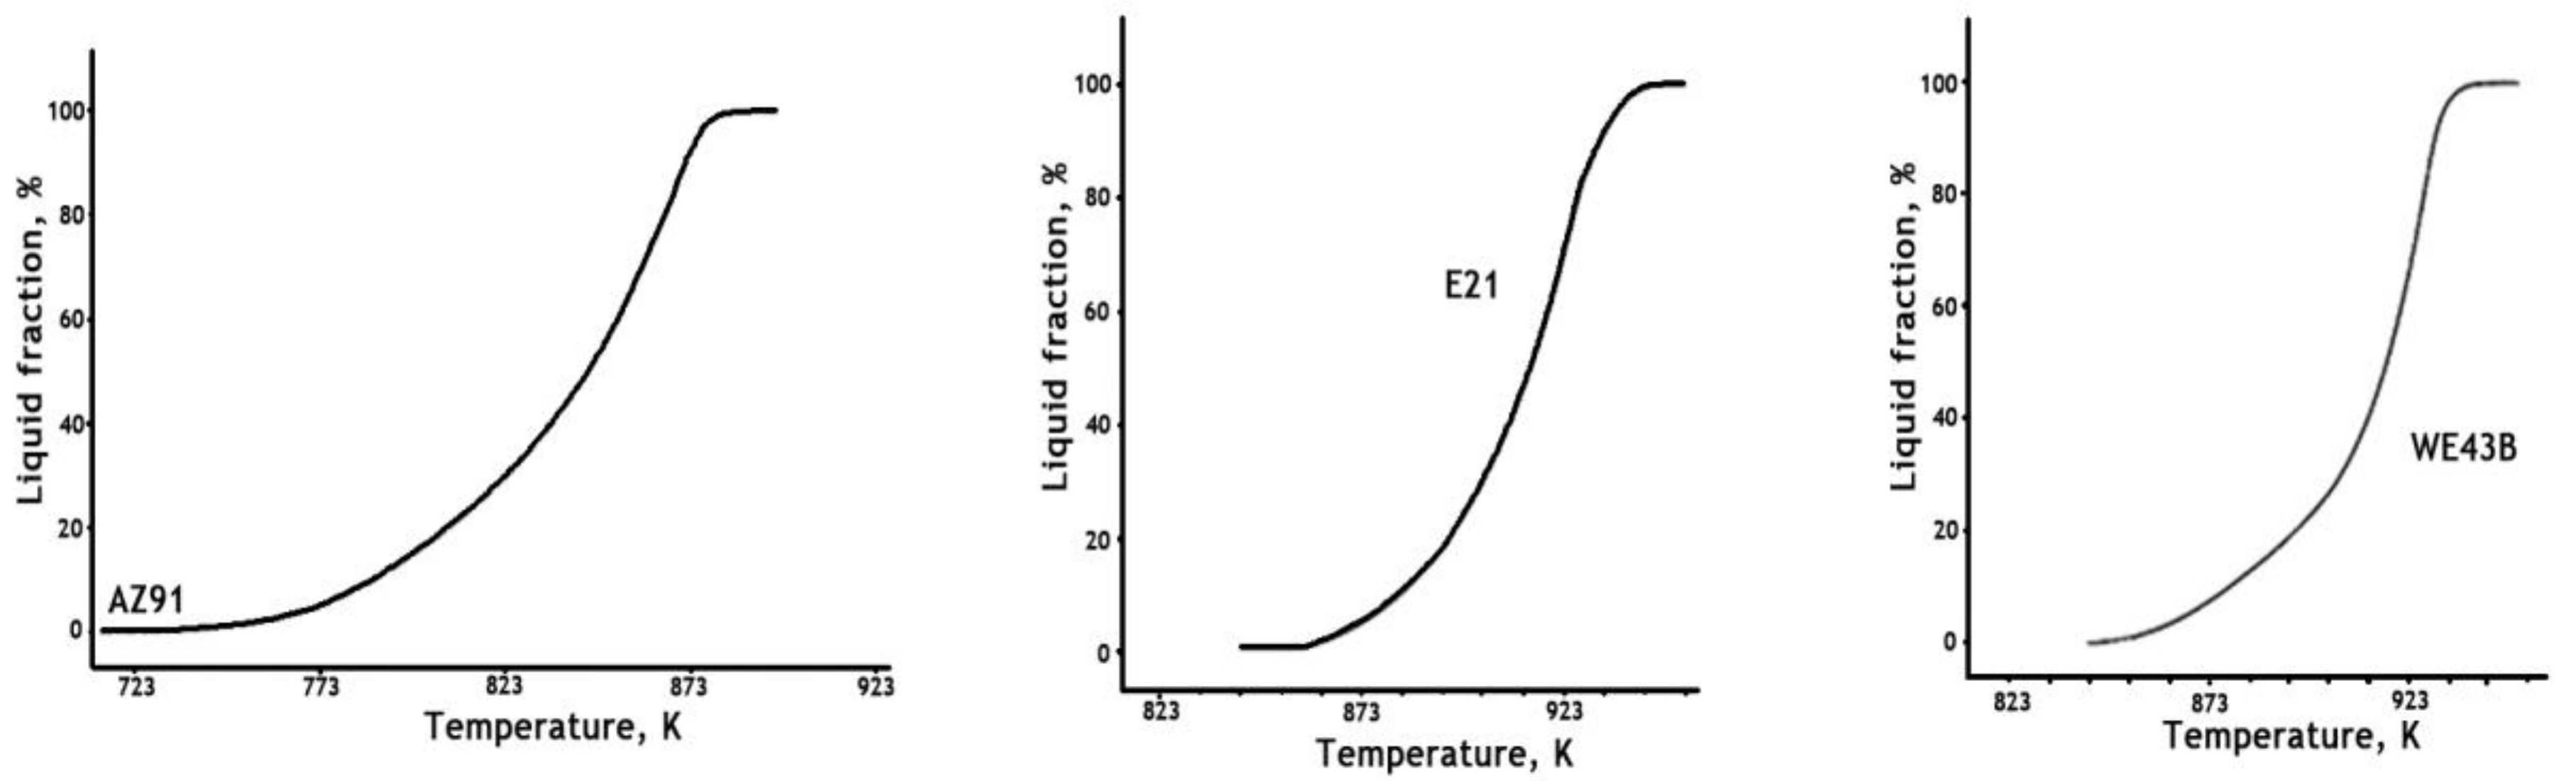
For each of the aforesaid grades (Table 1), the values of the liquidus temperatures and temperatures of the solid phase content of 50% (Table 2) were determined with DSC (Differential Scanning Calorimetry) analysis (Figure 1).
The determination of a fraction of the liquid phase as a function of temperature was calculated using data collected from the differential scanning calorimeter. It was assumed that a fraction of a liquid phase is proportional to the absorbed/released energy during the transformation (melting/solidification). The estimation of the liquid phase fraction changes was carried out by application of a partial peak area integration. Liquid fraction at a given temperature is determined by calculating the ratio of the area corresponding to the partial heat of melting over the total peak area. The former area is limited by the solidus temperature and the temperature range between solidus and liquidus lines (semi-solid range), the latter area is limited by solidus to liquidus temperature. It is expressed in volume percentage.
The amount of liquid phase was also determined as 50% on the basis of the content of eutectic phase in the sample after cooling from semi-solid temperature range. The discrepancy in the volume of liquid phase results from different heating rates, as well as an inhomogeneous chemical composition of the feedstock.
The samples were cylindrically shaped: 40 mm height, 25 mm in a diameter.
The rheological tests were conducted from the liquidus temperature to the temperature of a solid phase share of 50% (cooling rate was 2 K/min) for each alloy tested. The magnesium alloy tests were carried out in conditions of variable rheological parameters: shear rate values varied from 10 to 150 s−1, and the objective of the tests was to find the influence of the aforementioned variables on the value of shear stress and, thus, to attempt to determine the rheological nature of the magnesium alloys tested.
The scheme of measurements (for each Mg alloy) was as follows:
- -
- heating the sample;
- -
- homogenising the temperature value in a whole volume of the sample—wait about 20 min after the assumed temperature value is obtained—while slowly shearing the sample;
- -
- after stabilisation of the viscosity values of totally liquid alloys—decreasing the temperature up to fs = 50% in each of alloys investigated (stirring with a shear rate 10 s−1);
- -
- homogenise the temperature value in a whole volume of the sample;
- -
- measurement with a shear rate 10–150 s−1;
- -
- cooling the sample.
The findings are presented in the form of flow curves.
In the case of research on very reactive magnesium alloys, conducted on a wide range of solid phase shares (the upper range of the nominal torque operation of the measuring head), it was decided to carry out the measurements at the maximum shear rate of 150 s−1. However, the description of data by rheological models was also assessed by paying special attention to the approximation of the shear rate to higher values, referring to thixoforming process conditions.
3. Results
Figure 2 presents a graph of changes in the shear stress value of AZ91 for variable shear rate values.
The values of shear stress of alloy AZ91, for a solid phase share of 50%, grow non-linearly as the shear rate grows, which shows non-Newtonian rheological behaviour of the body tested. The shear stress values grow from about 10 Pa to about 50 Pa, as the shear rate values grow from 10 to 150 s−1.
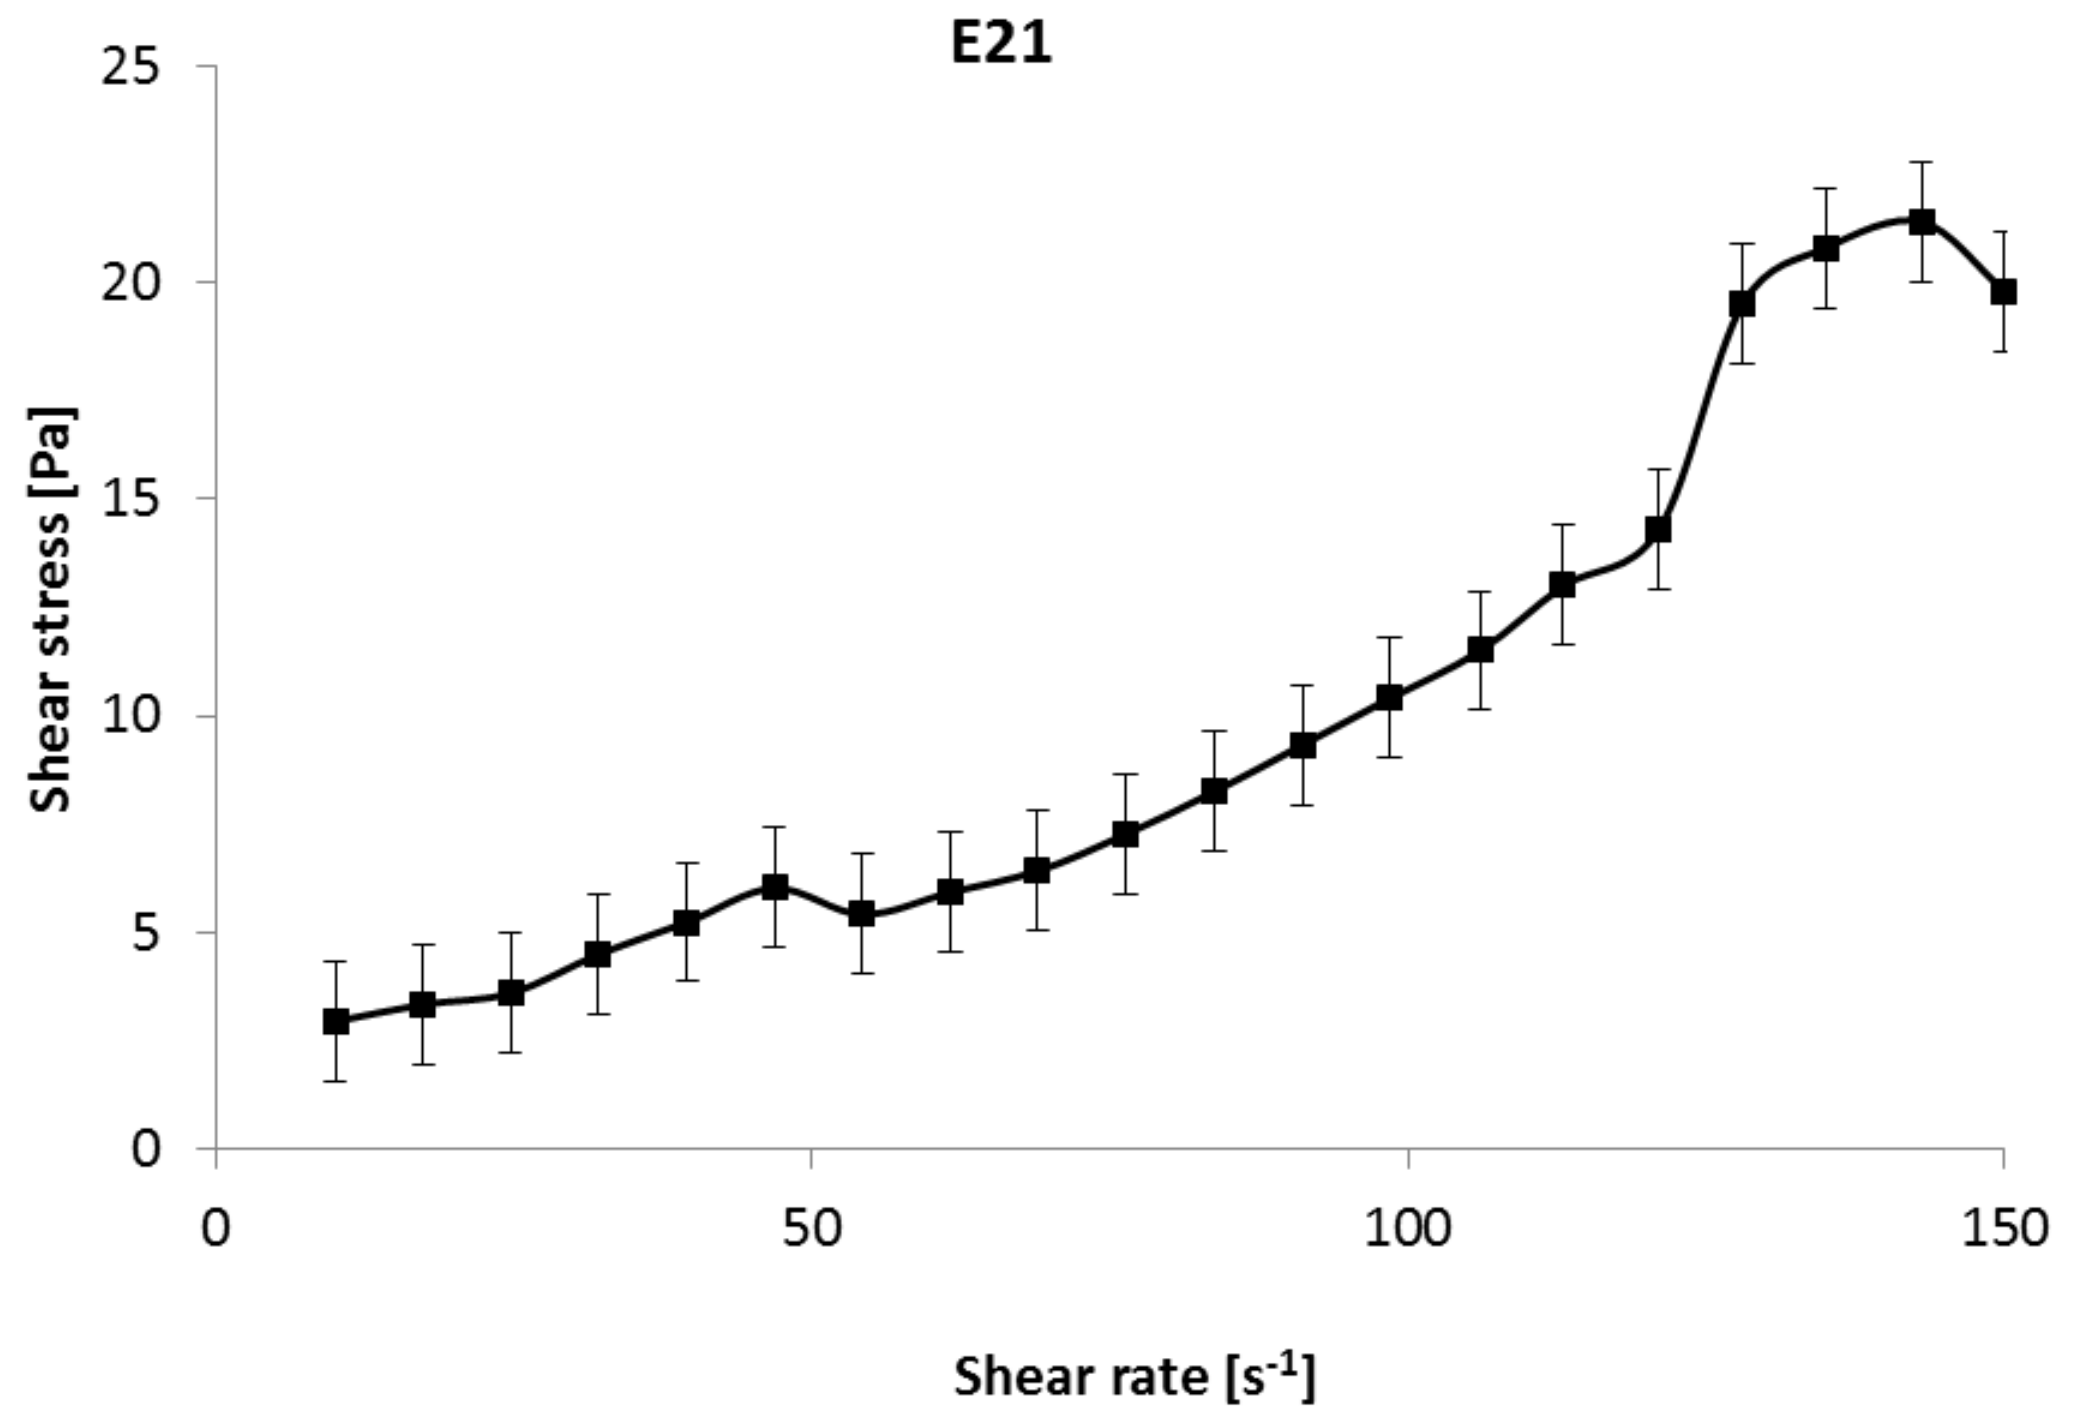
The next figure (Figure 3) presents a graph of changes in the shear stress value of alloy E21 for variable shear rate values.
The values of shear stress of alloy E21, for 50% solid phase share, grow non-linearly as the shear rate grows, in a similar manner to alloy AZ91. However, for alloy E21, the shear stress values grow from about 3 to about 20 Pa.
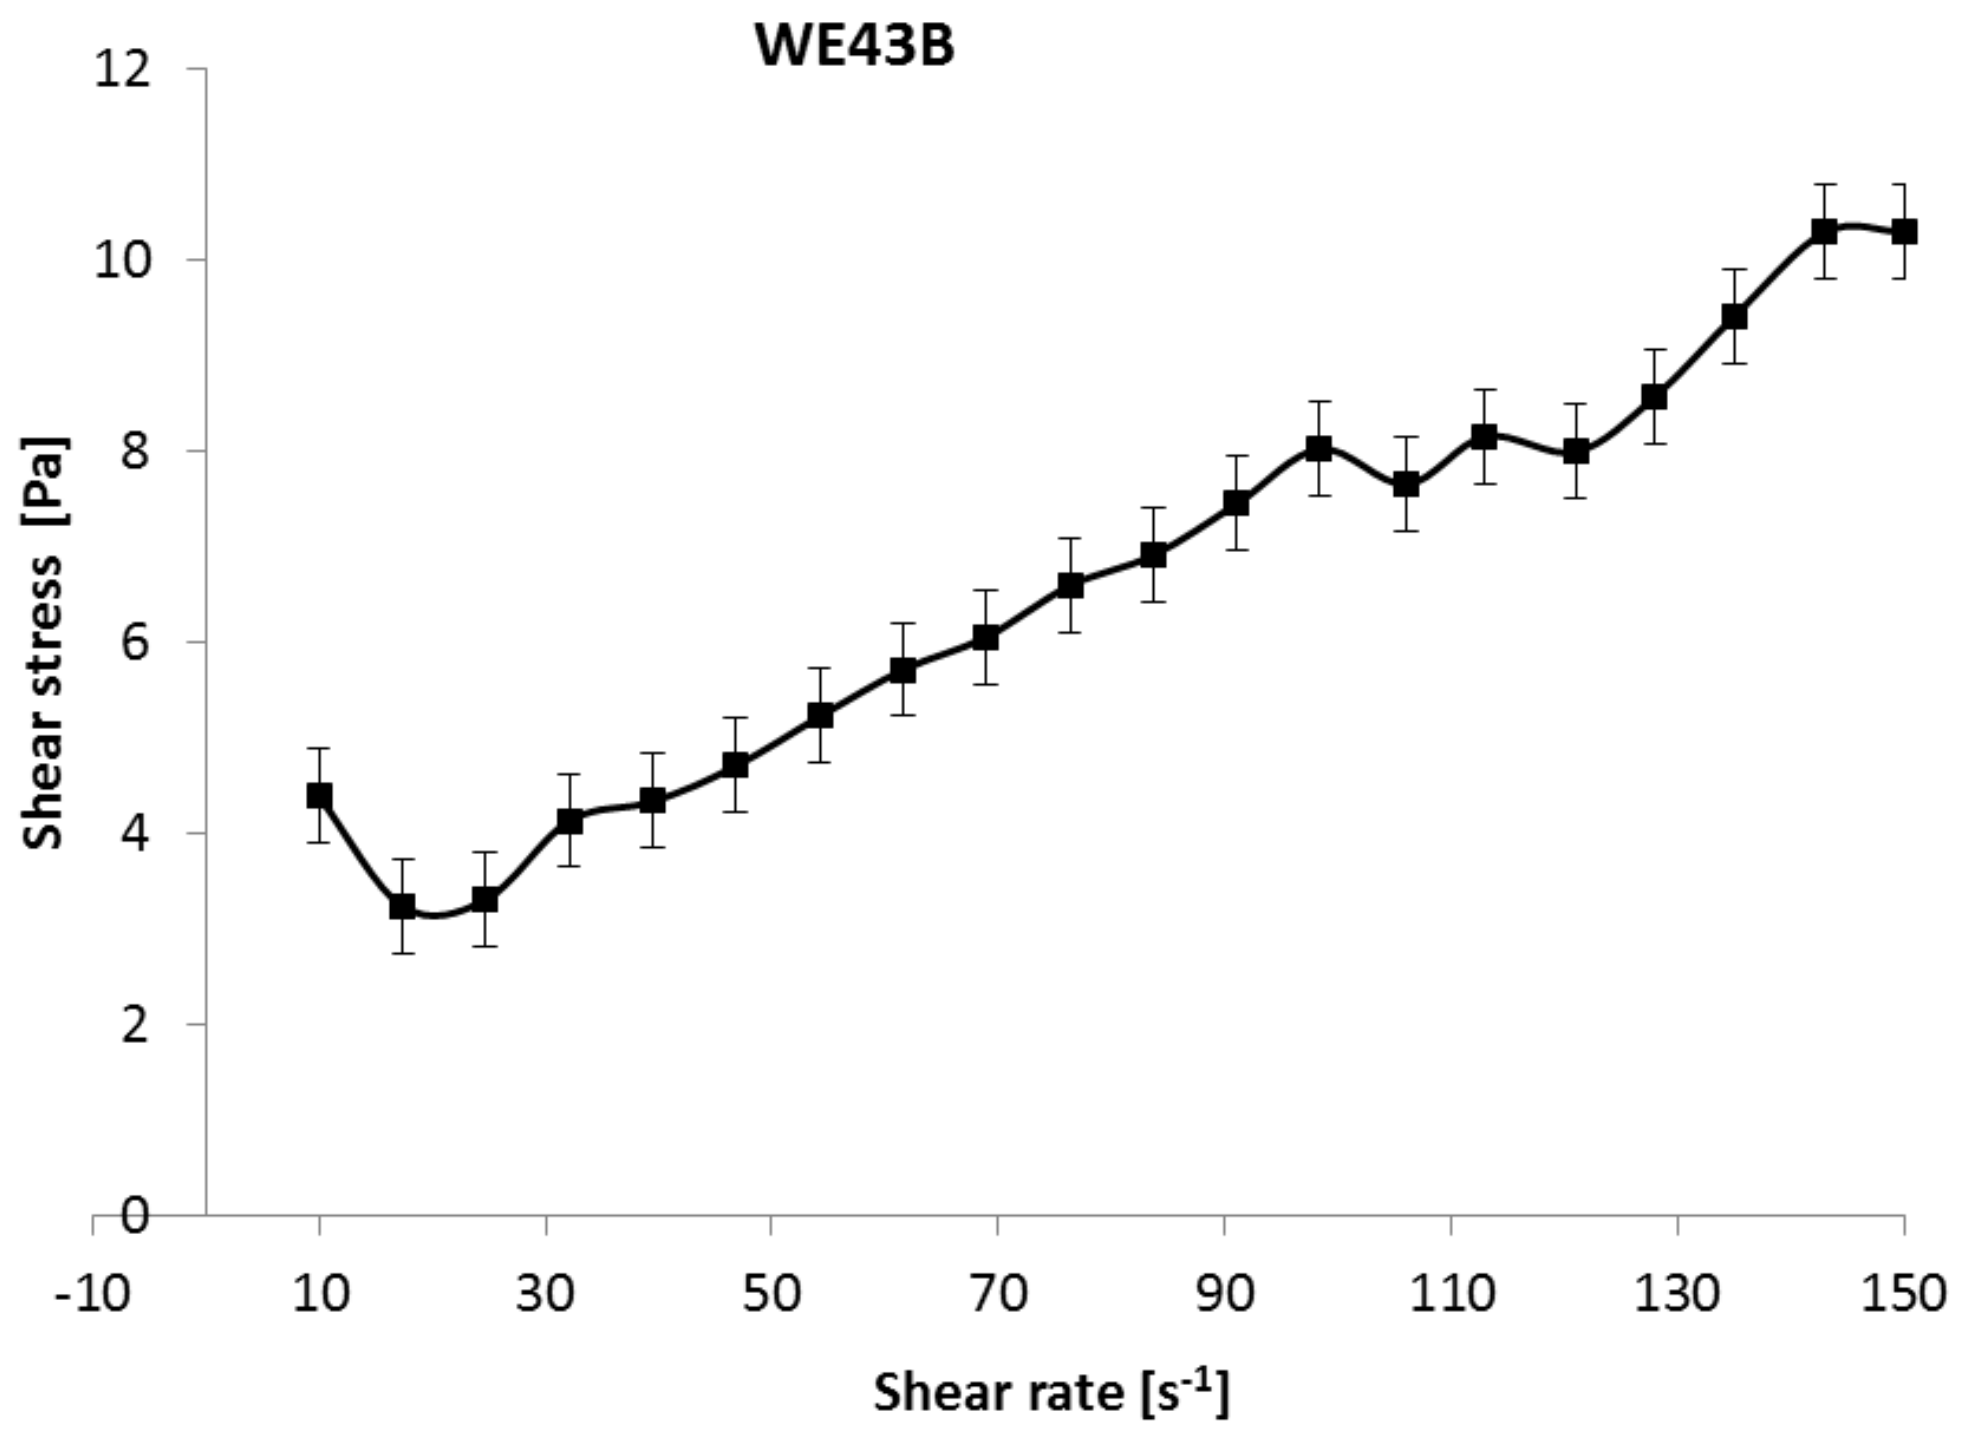
Figure 4 presents a graph of changes in the tangential stress value of alloy WE43B for variable shear rate values.
The values of the shear stress of alloy WE43B, for a share of 50% solid phase, grow non-linearly as the shear rate increases. However, the values of shear stress obtained for alloy WE43B were the lowest, from about 4 to about 10 Pa.
Analysis of the results obtained allowed us to establish that the highest values of shear stress were obtained for alloy AZ91 (50 Pa), while the shear stress values for alloys E21 and WE43B achieved a maximum of 10–20 Pa. It should be borne in mind that alloys E21 and WE43B contain rare earth elements (yttrium, neodymium, gadolinium), which may influence changes in the shear stress values. However, rheological tests of alloys with various contents of the above-mentioned rare earth metals would need to be performed to verify this.
Alloy E21 shows some deviation during the end of the test, it is probably the effect of shearing particles (the high amount of solid fraction). The author provided the wider rheological and microstructure measurements of these Mg alloy and did not observe the deviations of E21 alloy behaviour in comparison to the WE43B alloy (both contain RE elements).
In addition, all of the alloys tested showed a tendency to non-linear increase of the shear stress value as the shear rate increased. This may indicate a tendency towards shear-thinning (a decline in the value of the dynamic viscosity coefficient resulting from the forces applied). This is one of the key examples of non-Newtonian behaviour, characteristic for metals in a semi-solid state.
3.1. Data Description with Rheological Models
The rheological behaviour of a material is described by the relationships between stresses, strains, shear rates, and the time during which the material has been subjected to such strains. Such relationships are called rheological equations of the state of the material, or rheological equations, for short. The main task of rheology is to formulate models for describing the behaviours of bodies that have been subjected to an impact force.
In the subject literature, many attempts have been made to describe the flow curve with an appropriate rheological mathematical model [32,33,34,35,36,37]. The foregoing models are necessary for the analytical solution of problems related to non-Newtonian fluid flow [38,39,40].
Rheological models constitute a group of equations, which, apart from dynamic viscosity, also take into account other rheological parameters—shear rate, shear time, etc. The simplest mathematical rheological model, which describes a non-Newtonian fluid flow curve within a range of intermediate shear rates, is the so-called Ostwald-de Waele power law model in the form [33]:
where k is the empirically-determined constant (), n is the empirically-determined index exponent (-), τ is the shear stress (Pa), and is the shear rate (s−1).
The power law model created by Ostwald and DeWaele is the simplest mathematical rheological model of a generalised Newtonian fluid, containing only two constants that need to be determined.
To better describe experimental data, numerous authors have proposed to use mathematical rheological models with more complex structures. This study attempted to approximate the results obtained with four selected rheological models, which are most often used in the subject literature to compute (approximate and describe) the values of the shear stress of aluminum and magnesium alloys intended to be formed in a semi-solid state [24,28,41,42].
The following models were used to describe the data:
● Ostwald (Equation (1))
● Herschel-Bulkley (Equation (2)):
● Carreau (Equation (3)):
Form of the Carreau model which is used in the Rheoplus calculations:
● Bingham (Equation (4)):
where τ is the shear stress (Pa), τHB is the Herschel-Bulkley shear stress (Pa). is the shear rate (s−1), k is the Bingham constant (Pa·s), n is the empirically-determined index exponent (-), c is the Carreau constant (s), p is the Carreau exponent (-), η is the dynamic viscosity coefficient (Pa·s), η0 is the dynamic viscosity coefficient for shear rates approaching 0 (Pa·s), η∞ is the dynamic viscosity coefficient for shear rates approaching ∞ (Pa·s), τB is the Bingham shear stress (Pa), τ0 is the shear stress for shear rates approaching 0 (Pa), and τ∞ is the shear stress for shear rates approaching ∞ (Pa).
3.2. Rheoplus Calculations
Rheoplus V3.40 (Anton Paar GmbH, Ostfildern, Germany) is the integrated software for Anton Paar rheometers. By using Rheoplus it is possible to control instruments during measurement and analyse measurement data after testing. The different rheological models which were used to describe and fit the results obtained were implemented in the software.
Using Rheoplus software for each of the alloys tested over a range with variable shear rate values from 10 to 150 s−1, an approximation of the results obtained was attempted with the four selected rheological models. The results obtained were presented in the form of a graph (with the calculated correlation coefficient R2—the degree to which the model matched the actual data) with the actual flow curve obtained by measurements and the flow curves obtained from each model marked on the graph. The curves were presented in the shear stress τ—shear rate system (flow curve), as such relationships occur in three of the rheological equations presented. However, the Carreau equation is usually only defined for the dynamic viscosity coefficient η, so to enable models to be compared, the Carreau equation was also presented as shear stress versus shear rate.
Figure 5 presents the graphs of flow curves for alloy AZ91: actual and for three models.
As we can observe, on graphs (Figure 5) the model and actual flow curves largely overlap, with the greatest deviations being seen for the flow curve described by the Ostwald model, which is reflected in the lowest value of the correlation coefficient R2 out of all those computed.
Figure 6 presents the graphs of the flow curves for alloy E21: actual results and for three models.
The graphs (Figure 6) display the large overlap between the model and actual flow curves. The greatest deviations can be seen for the flow curves described by the Ostwald and Bingham models (the lowest values of coefficients R2).
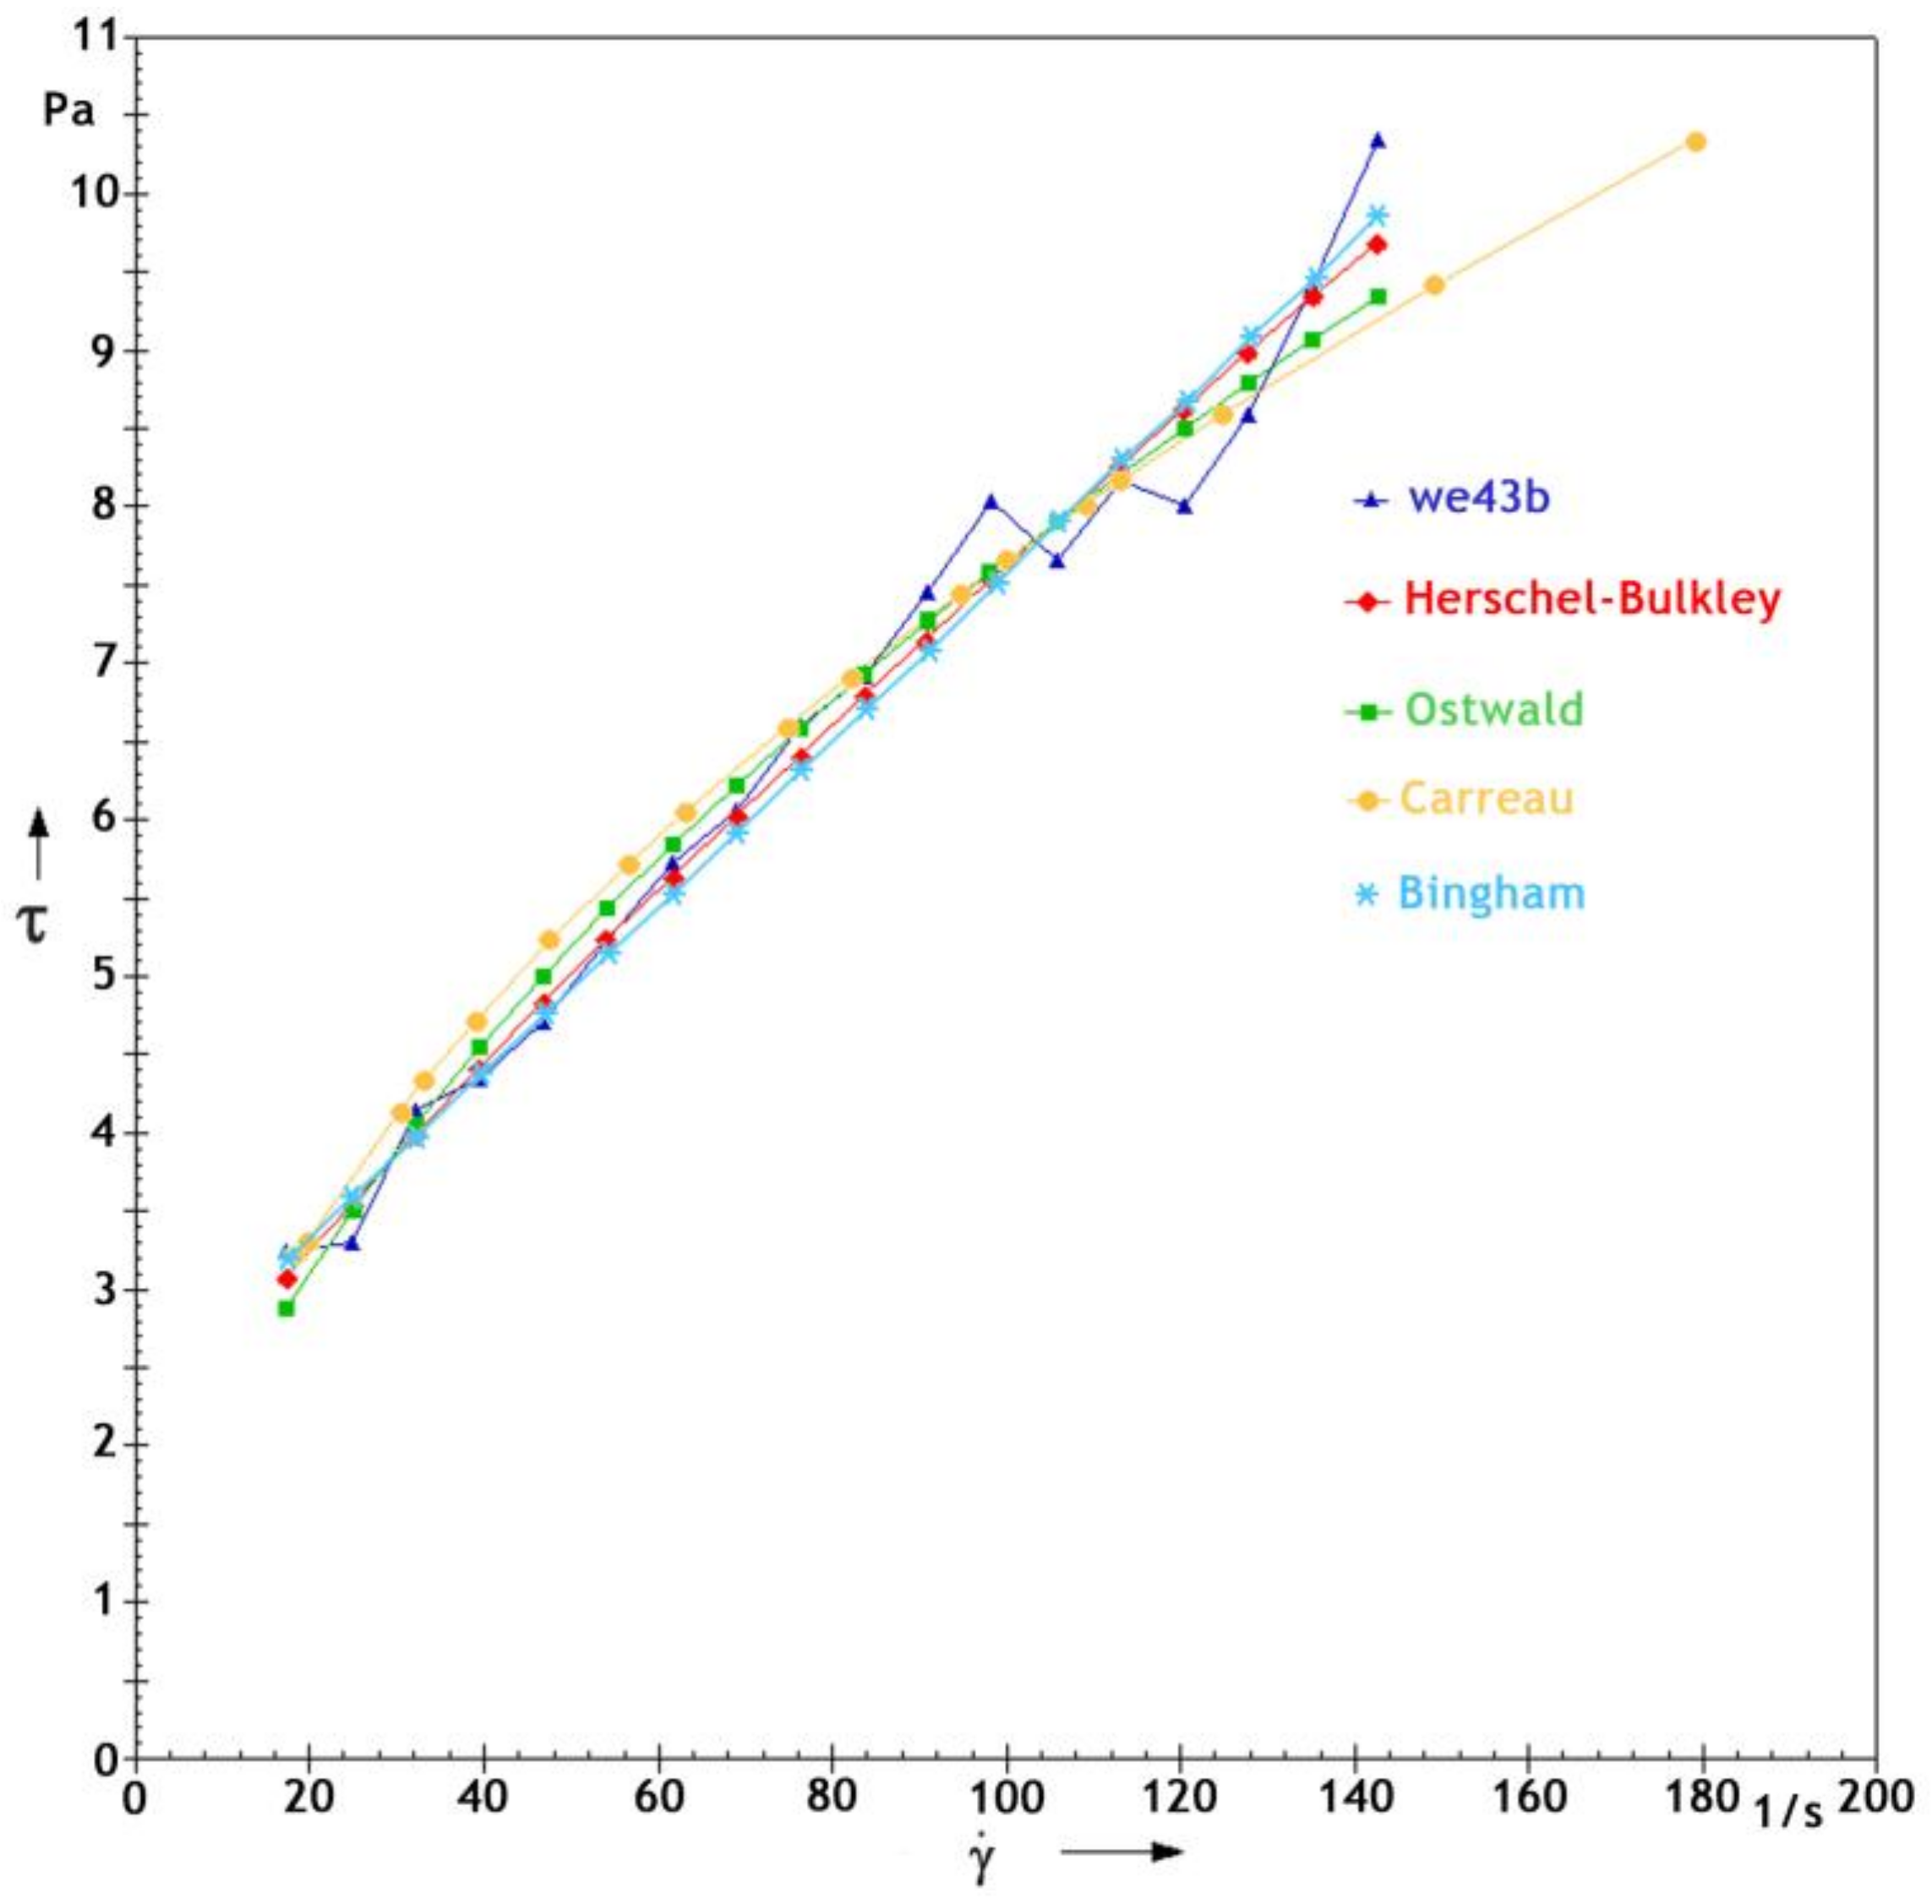
Figure 7 presents graphs of flow curves for alloy WE43B: actual and for three models.
On the basis of the analysis of graphs on Figure 7, one may find that for flow curves describing the rheological behaviour of alloy WE43B, all four models represent the measurement results rather well; correlation coefficients over 0.93 were obtained for all four models.
As the Rheoplus software only enabled the quality of models to be assessed by analysing the correlation coefficient R2, and the models were non-linear, the models were verified in Wolfram Mathematica. This analysis enabled the quality of the data description (mean prediction bands) to be more explicitly assessed by the selected rheological models, and allowed us to determine which non-linear model works best for the description of data from the measurements of semi-solid magnesium alloys with a 50% solid phase share.
3.3. Wolfram Mathematica Calculations
Wolfram Mathematica 11 (developed by The Wolfram Centre, Long Hanborough, United Kingdom) is a mathematical symbolic computation program used in many scientific, engineering, mathematical, and computing fields. The data from measurements where analysed in the Mathematica software implemented four different rheological models (Equations (1)–(4)). The results are presented as graphs and Equations (5)–(16), with calculated factors.
Below (Table 3, Table 4 and Table 5, Equations (5)–(16)), mathematical formulae of rheological models (calculated with Wolfram Mathematica software) are presented for each of the test alloys. In each of the cases the shear stress τ is given in Pa.
On the basis of the analysis of the above graphs and equations, we can conclude that the Herschel-Bulkley and Carreau models describe the results obtained well and, in addition, the mean prediction bands are relatively narrow for both cases. The mean prediction bands are the confidence bands for mean predictions and give functions of the predictor variables. This confirms the good quality of the description of the measurement data for these models. However, the Carreau model is much more complicated mathematically; therefore, the H-B model seems to be more appropriate for describing the rheological data obtained for the aforementioned magnesium alloys. Furthermore, the Carreau model is a function for calculations of flow behaviour including zero-shear and infinite-shear viscosity, thus, it dedicated for systems in which a wide range of shear rates are measured.
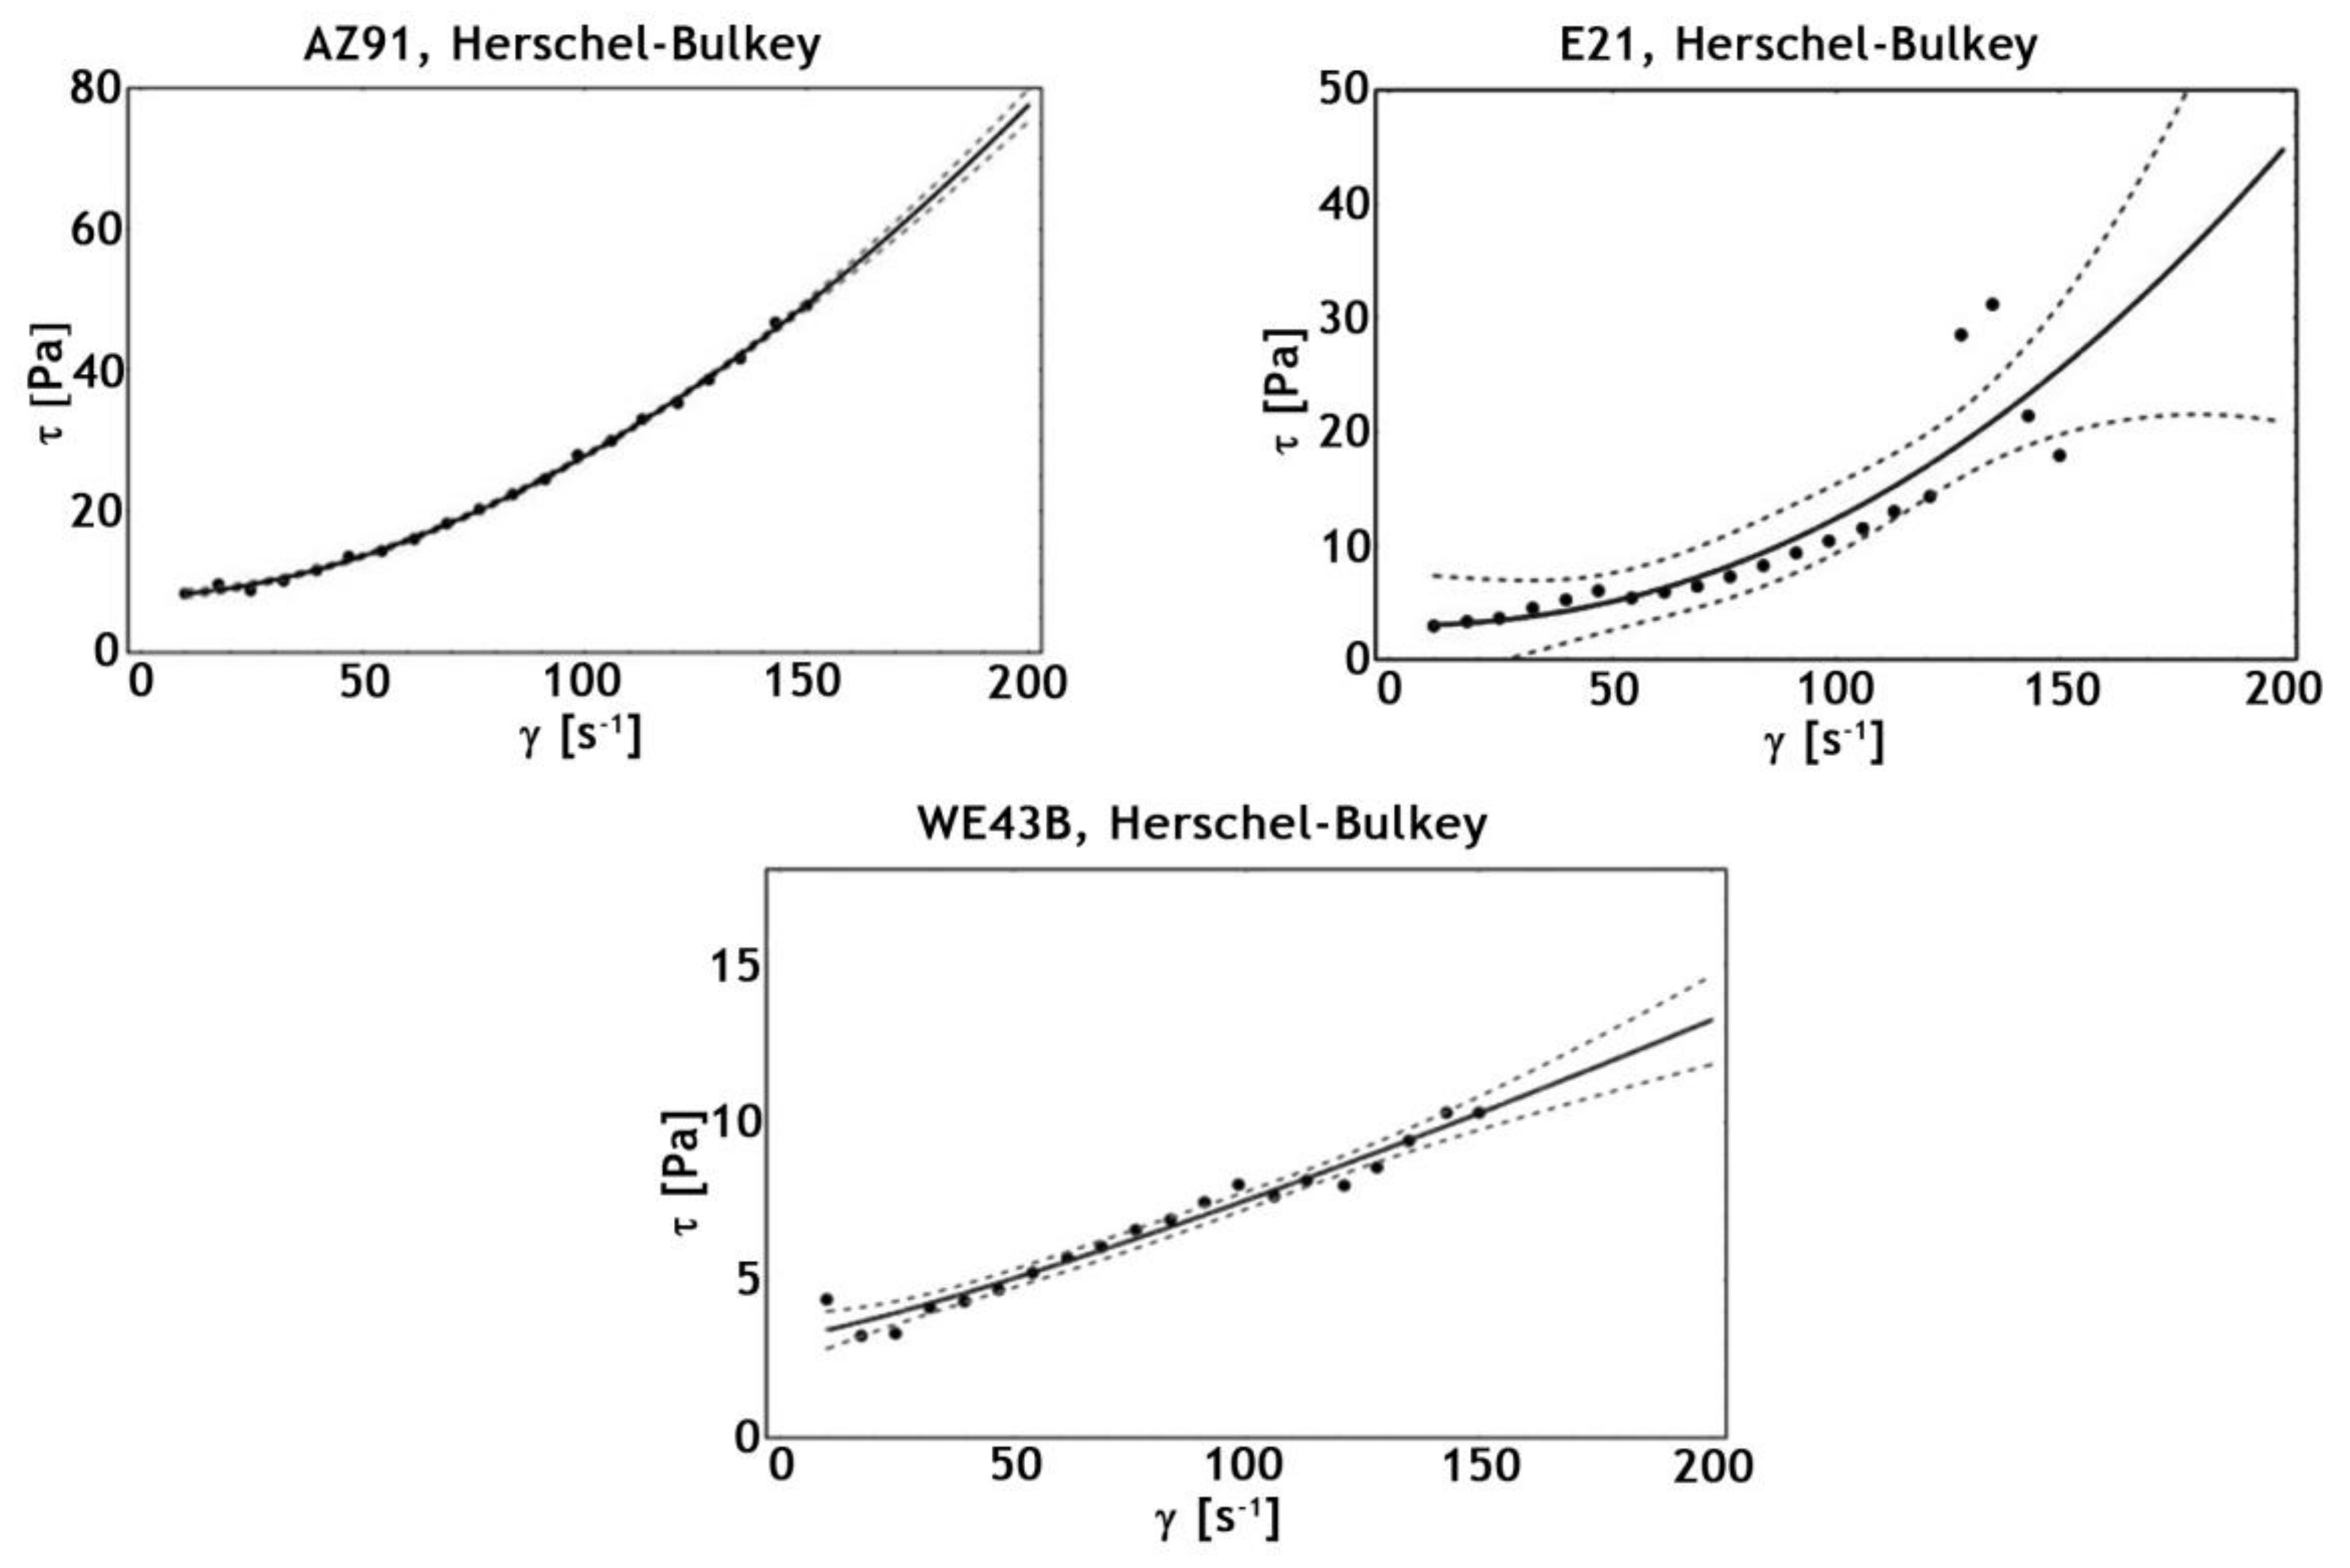
As a result of the analysis of the above models, it was found that the Herschel-Bulkley model best described the rheological behaviour of semi-solid magnesium alloys with a significant solid phase share in the alloy tested. For this model, the shear stress value was approximated for shear rates of 200 s−1. The results obtained are presented in Figure 8.
As a result of the analysis of the approximation of the flow curves described with the Herschel-Bulkley model, one may find that this model is suitable for alloys AZ91, WE43B (large coverage with measurement data, small calculation uncertainty). This model describes data for alloy E21 as being slightly worse and, moreover, there is greater model uncertainty at higher values of the shear rate. However, this is likely to be related to the deviations of recorded measurement points that were not observed for the other two alloys.
4. Discussion
Flow curves obtained from measurements were compared with curves resulting from the use of four different rheological models: Herschel-Bulkley, Ostwald, Carreau, and Bingham. This allowed us to determine that all models provided a good level of accuracy of description, however, the measurement data were most accurately described by the models of Carreau and Herschel-Bulkley. Due to a simpler mathematical form, the model that is the most recommended for the description of data from rheological measurements of semi-solid magnesium alloys (with 50% solid phase share in the alloy) is the Herschel-Bulkley model.
The approximation conducted for higher values of the shear rate, for the Herschel-Bulkley model, showed that the model predicted shear stress values well, in particular for alloys AZ91 and WE43B (narrow mean prediction bands), and that it might be used to calculate shear stress values for Mg alloys under higher values of shear rate (according to the thixoforming process). The model performs slightly worse for alloy E21, but this is likely to be a result of the greater span of measurement points obtained.
5. Conclusions
- Rheological tests of magnesium alloys are challenging due to the high reactivity of the materials tested. They require considerable experience during measurements and analysis of the results obtained.
- Alloys E21 and WE43B contain rare earth elements (yttrium, neodymium, gadolinium), which may influence changes in the shear stress values. However, rheological tests of alloys with various contents of the above-mentioned rare earth metals would need to be performed to verify this.
- All of the alloys tested showed a tendency towards non-linear growth of the shear stress value as the shear rate grew. This is one of the key examples of non-Newtonian behaviour (shear-thinning), characteristic for metals in a semi-solid state.
- Four different rheological models: Herschel-Bulkley, Ostwald, Carreau, and Bingham provided a good level of accuracy of the description, however, the measurement data were most accurately described by the models of Carreau and Herschel-Bulkley.
- Due to a simpler mathematical form (and shear rate “range”), the model that is the most recommended for the description of data from rheological measurements of semi-solid magnesium alloys (with 50% solid phase share in the alloy) is the Herschel-Bulkley model.
- The approximation conducted for higher values of the shear rate, for the Herschel-Bulkley model, showed that the model predicted shear stress values well, in particular for alloys AZ91 and WE43B (narrow mean prediction bands). The model performs slightly worse for alloy E21, but this is likely to be as a result of the greater span of the measurement points obtained.
- The rheological models may be helpful for modelling and optimising the forming process of semi-solid magnesium alloys. Complementing thermodynamic databases with the results of rheological measurements will contribute to the development of the above mentioned processes and will facilitate modelling/engineering these processes without the need for conducting time-consuming and demanding measurements.
- During the thixocasting process the solid fraction might vary a great deal, thus, a wide range of rheological experiments have to be conducted to obtained reliable data for different amounts of liquid/solid fractions of Mg alloys. Authoritative data are also required from the optimal rheological model (for Mg alloys) point of view. The provided test with various shares of the solid and liquid phases show a similar rheological dependency as described in this paper.
Acknowledgments
Research financed through statutory funds of AGH University of Science and Technology in Krakow, No. 11.11.110.502. Special thanks to Bogusz Kania for his help in the execution of the computing.
Conflicts of Interest
The authors declare no conflict of interest.
References
- Bakhtiyarov, S.I.; Overfelt, R.A. Measurement of liquid metal viscosity by rotational technique. Acta Mater. 1999, 47, 4311–4319. [Google Scholar] [CrossRef]
- Budai, I.; Benko, M.; Kaptay, G. Comparison of different theoretical models to experimental data on viscosity of binary liquid alloys. Mat. Sci. Forum 2007, 537, 489–496. [Google Scholar] [CrossRef]
- Miłkowska-Piszczek, K.; Korolczuk-Hejnak, M. An analysis of the influence of viscosity on the numerical simulation of temperature distribution, as demonstrated by the CC process. Arch. Metall. Mater. 2013, 58, 1267–1274. [Google Scholar] [CrossRef]
- Qi, Y.; Cagin, T.; Kimura, Y.; Goddard, W.A. Viscosities of liquid metal alloys from nonequilibrium molecular dynamics. J. Comput. Aided Mater. 2001, 8, 233–243. [Google Scholar] [CrossRef]
- Zhao, P.; Wang, Q.; Liu, L.; Wei, Z.; Zhai, C. Fluidity of Mg-Al-Ca alloys in the high-pressure die casting proces. Int. J. Mater. Res. 2007, 98, 33–38. [Google Scholar] [CrossRef]
- Huppmann, M.; Reimers, W. Microstructure and mechanical properties of differently extruded AZ31 magnesium alloy. Int. J. Mater. Res. 2010, 101, 1264–1271. [Google Scholar] [CrossRef]
- Braszczyńska-Malik, K.N.; Froyen, L. Microstructure of AZ91 alloy deformed by equal channel angular pressing. Int. J. Mater. Res. 2005, 96, 913–917. [Google Scholar] [CrossRef]
- Chen, J.Y.; Fan, Z. Modelling of rheological behaviour of semisolid metal slurries Part 1—Theory. Mater. Sci. Technol. 2002, 18, 237–242. [Google Scholar] [CrossRef]
- Terzieff, P. The viscosity of liquid alloys. J. Alloys Compd. 2008, 453, 233–240. [Google Scholar] [CrossRef]
- Chhabra, R.P. A simple method for estimating the viscosity of molten metallic alloys. J. Alloys Compd. 1995, 221, L1–L3. [Google Scholar] [CrossRef]
- Flemings, M. Solidification processing. Metall. Mater. Trans. B 1974, 5, 2122–2134. [Google Scholar] [CrossRef]
- Atkinson, H.V. Modelling the Semisolid Processing of Metallic Alloys. Prog. Mater. Sci. 2005, 50, 341–412. [Google Scholar] [CrossRef]
- Kapranos, P.; Kirkwood, D.H. Thixoforming M2 tool steel—A study of different feedstock routes. Metal. Ital. 2010, 9, 17–21. [Google Scholar]
- Kapranos, P.; Kirkwood, D.H.; Sellars, C.M. Semi-Solid Processing of Aluminium and High Melting Point Alloys. Proc. Inst. Mech. Eng. Part B J. Eng. Manuf. 1993, 207, 1–8. [Google Scholar] [CrossRef]
- Sołek, K.P.; Rogal, Ł.; Kapranos, P. Evolution of Globular Microstructure and Rheological Properties of Stellite 21 Alloy after Heating to Semisolid State. J. Mater. Eng. Perform. 2017, 26, 115–123. [Google Scholar] [CrossRef]
- Rogal, Ł.; Dutkiewicz, J.; Atkinson, H.V.; Lityńska-Dobrzyńska, L.; Czeppe, T.; Modigell, M. Characterization of semi-solid processing of aluminium alloy 7075 with Sc and Zr additions. Mat. Sci. Eng. A Struct. 2013, 580, 362–373. [Google Scholar] [CrossRef]
- Brabazon, D.; Browne, D.J.; Carr, A.J. Experimental investigation of the transient and steady state rheological behaviour of Al-Si alloys in the mushy state. Mater. Sci. Eng. A Struct. 2003, 356, 69–80. [Google Scholar] [CrossRef]
- Salleh, M.S.; Omar, M.Z.; Syarif, J.; Mohammed, M.N. An Overview of Semisolid Processing of Aluminium Alloys. ISRN Mater. Sci. 2013, 2013, 1–9. [Google Scholar] [CrossRef]
- Das, P.; Samanta, S.K.; Dutta, P. Rheological Behavior of Al-7Si-0.3Mg Alloy at Mushy State. Metall. Mater. Trans. B 2015, 46, 1302–1313. [Google Scholar] [CrossRef]
- Lashkari, O.; Ajersch, F.; Charette, A.; Chen, X. Microstructure and rheological behavior of hypereutectic semi-solid Al-Si alloy under low shear rates compression test. Mater. Sci. Eng. A Struct. 2008, 492, 377–382. [Google Scholar] [CrossRef]
- Kim, W.Y.; Kang, C.G.; Lee, S.M. Effect of viscosity on microstructure characteristic in rheological behaviour of wrought aluminium alloys by compression and stirring process. Mater. Sci. Techol. 2010, 26, 20–30. [Google Scholar] [CrossRef]
- Chang, D.Y.; Kwang, S.S. Semi-Solid Processing of Magnesium Alloys. Mater. Trans. 2003, 44, 558–561. [Google Scholar] [CrossRef]
- Chen, H.I.; Chen, J.C. Thixotropic Behavior of Semi-Solid Magnesium Alloy. Solid State Phenom. 2006, 116, 648–651. [Google Scholar] [CrossRef]
- Kramer, M.; Jenning, R.; Lohmüller, A.; Hilbinger, M.; Randelzhofer, P.; Singer, R.F. Characterization of magnesium alloys for semi solid processing. In Proceedings of the 8th International Conference on Magnesium Alloys and Their Applications, Weimar, Germany, 26–29 October 2009; Kainer, K.U., Ed.; Wiley-VCH Verlag GmbH & Co. KGaA: Weinheim, Germany, 2009; pp. 376–383. [Google Scholar]
- Chen, H.-I.; Chen, J.-C.; Liao, J.-J. The influence of shearing conditions on the rheology of semi-solid magnesium alloy. Mater. Sci. Eng. A Struct. 2008, 487, 114–119. [Google Scholar] [CrossRef]
- Hu, Y.; He, B.; Yan, H. Rheological behavior of semi-solid Mg2Si/AM60 magnesium matrix composites at steady state. Trans. Nonferr. Metal. SOC 2010, 20, 883–887. [Google Scholar] [CrossRef]
- Li, L.; Zheng, M. Theoretical research on rheological behavior of semisolid slurry of magnesium alloy AZ91D. Comp. Mater. Sci. 2015, 102, 202–207. [Google Scholar] [CrossRef]
- Yan, H.; Rao, Y.; Chen, G. Rheological behavior of semi-solid AZ91D magnesium alloy at steady state. J. Wuhan Univ. Technol. 2015, 30, 162–165. [Google Scholar] [CrossRef]
- Korolczuk-Hejnak, M.; Migas, P. Analysis of Selected Liquid Steel Viscosity. Arch. Metall. Mater. 2012, 57, 963–969. [Google Scholar] [CrossRef]
- Korolczuk-Hejnak, M. Determination of Flow Curves on Selected Steel Grades in their Liquid State. Arch. Metall. Mater. 2014, 59, 1553–1558. [Google Scholar] [CrossRef]
- Ślęzak, W.; Korolczuk-Hejnak, M.; Migas, P. High Temperature Rheometric Measurements of Mould Powders. Arch. Metall. Mater. 2015, 60, 289–294. [Google Scholar] [CrossRef]
- Korolczuk-Hejnak, M. Determination of the Dynamic Viscosity Coefficient Value of Steel Based on the Rheological Measurements; Wydawnictwa AGH: Kraków, Poland, 2014; ISBN 978-83-7464-720-5. [Google Scholar]
- Ostwald, W. Ueber die Geschwindigkeitsfunktion der Viskositat Disperser Systeme. Kolloid Z. 1925, 36, 99–117. [Google Scholar] [CrossRef]
- Mezger, G.T. The Rheology Handbook: For Users of Rotational and Oscillatory Rheometers, 2nd ed.; Vincentz Network: Hannover, Germany, 2006; ISBN 3878701748. [Google Scholar]
- Wiśniowski, R.; Skrzypaszek, K. Analiza modeli reologicznych stosowanych w technologiach inżynierskich. Wiertnictwo Nafta Gaz 2006, 23, 523–532. [Google Scholar]
- Ślęzak, M. Mathematical Models for Calculating the Value of Dynamic Viscosity of a Liquid. Arch. Metall. Mater. 2015, 60, 581–589. [Google Scholar] [CrossRef]
- Korolczuk-Hejnak, M. Empiric Formulas for Dynamic Viscosity of Liquid Steel Based on Rheometric Measurements. High Temp. 2014, 52, 667–674. [Google Scholar] [CrossRef]
- Eskin, D. Modeling non-Newtonian slurry convection in a vertical fracture. Chem. Eng. Sci. 2009, 64, 1591–1599. [Google Scholar] [CrossRef]
- Eskin, D.; Miller, M.J. A model of non-Newtonian slurry flow in a fracture. Powder Technol. 2008, 182, 313–322. [Google Scholar] [CrossRef]
- Eskin, D. Modeling non-Newtonian slurry flow in a flat channel with permeable walls. Chem. Eng. Sci. 2015, 123, 116–124. [Google Scholar] [CrossRef]
- Bührig-Polaczek, A.; Afrath, C.; Modigell, M.; Pape, L. Comparison of rheological measurement techniques for semi-solid aluminium alloys. Solid State Phenom. 2006, 116, 610–613. [Google Scholar] [CrossRef]
- Modigell, M.; Pape, L.; Maier, H.R. Rheology of Semi-Solid Steel Alloys at Temperatures up to 1500 °C. Solid State Phenom. 2006, 116, 606–609. [Google Scholar] [CrossRef]
Figure 1.
Graphs of DSC analysis of the magnesium systems analysed: AZ91, E21 and WE43B.

Figure 2.
Flow curve of alloy AZ91, at a solid phase share of 50%.
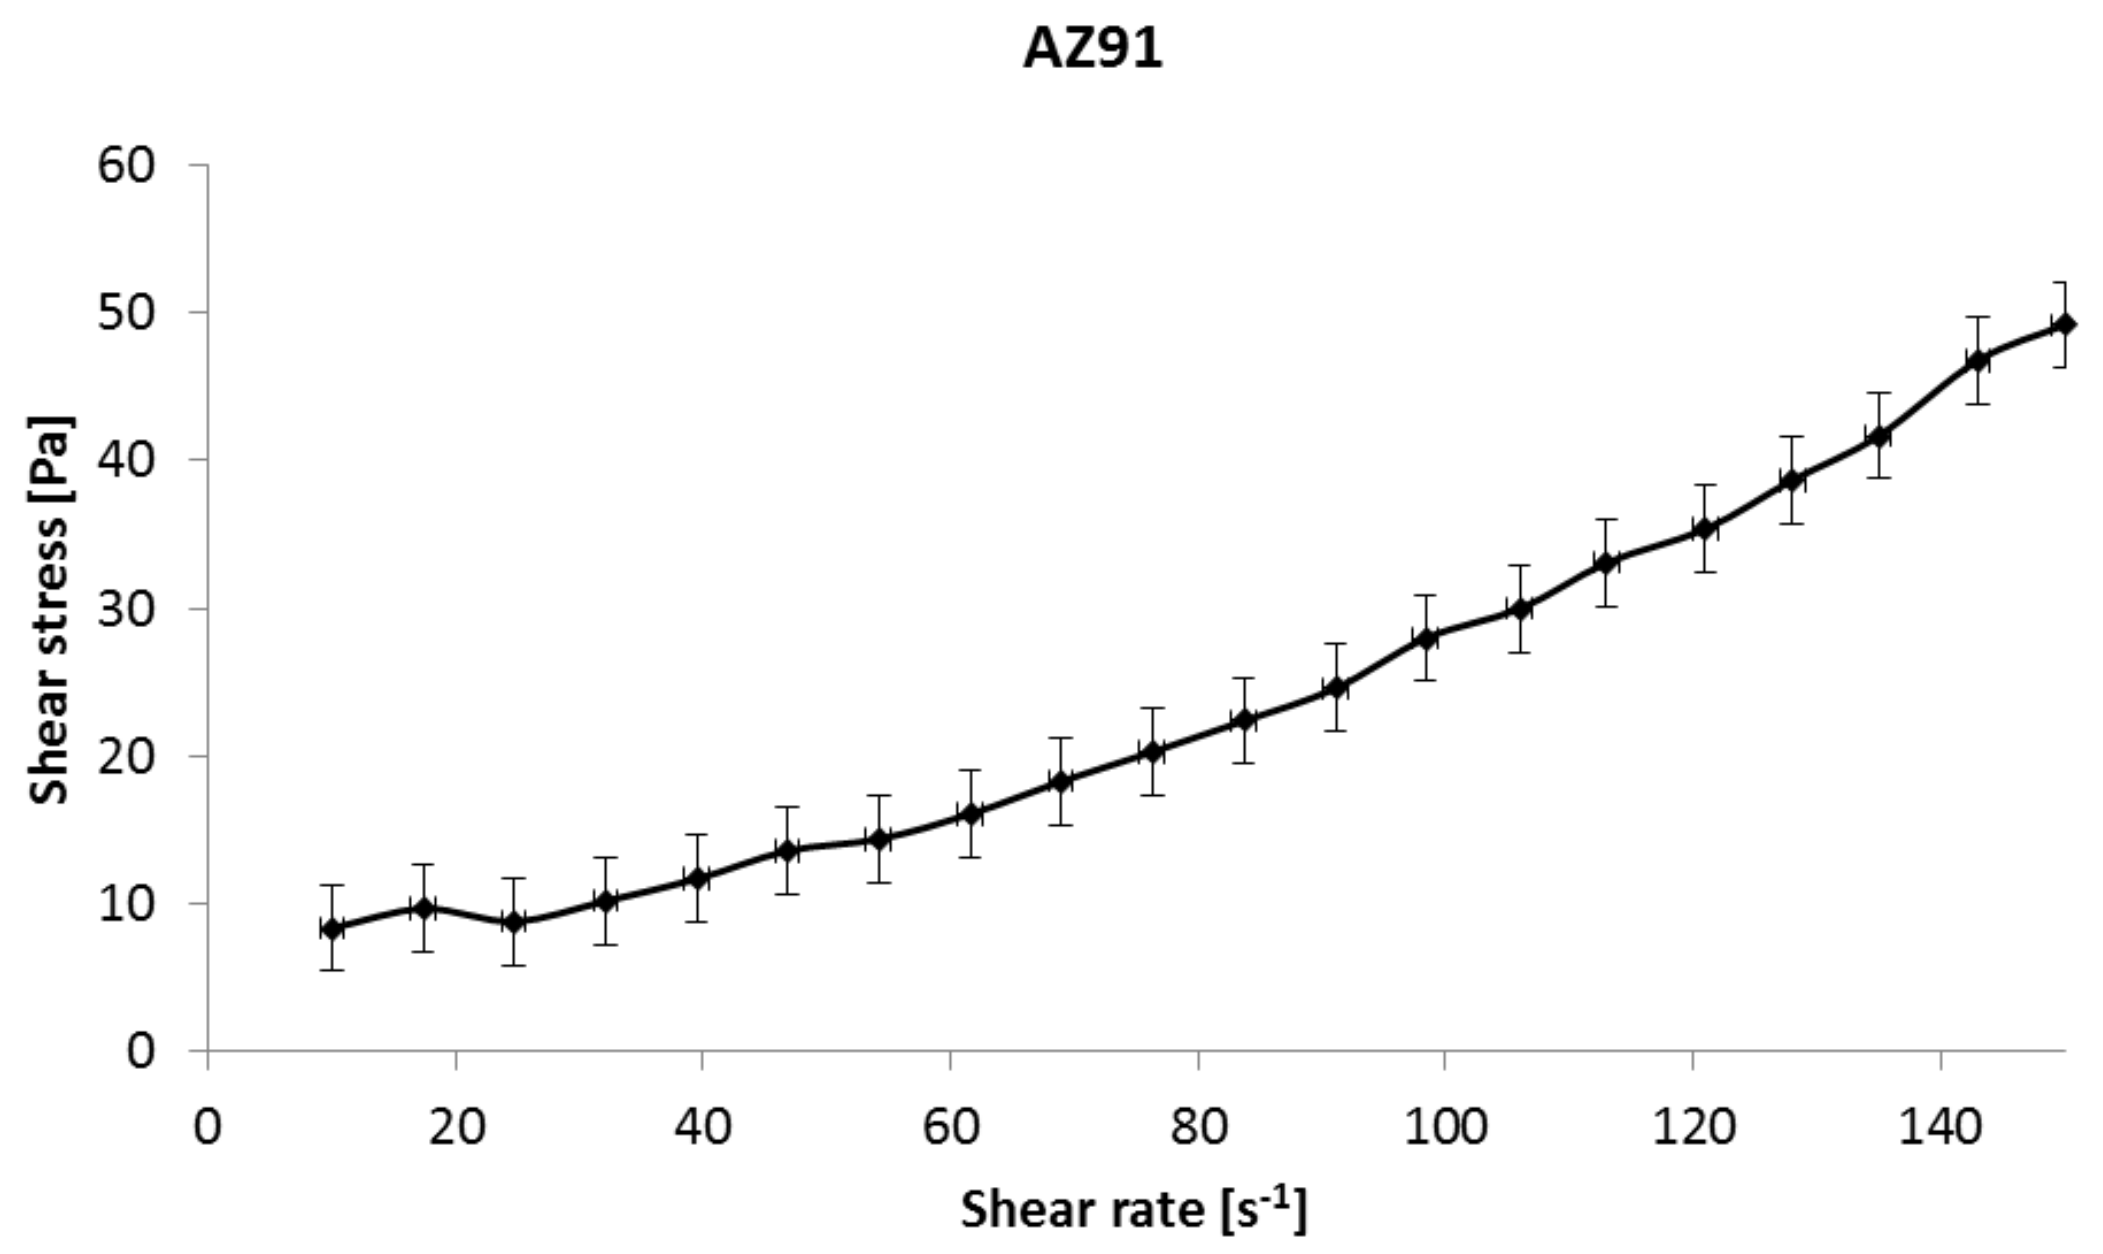
Figure 3.
Flow curve of alloy E21 for 50% of the solid phase.

Figure 4.
Flow curve of alloy WE43B for 50% of the solid phase.

Figure 5.
Flow curves for alloy AZ91: actual and computed from the Hershel-Bulkley (R2 = 0.99873), Ostwald (R2 = 0.87918), Carreau (R2 = 0.99875), and Bingham (R2 = 0.91265) models.
Figure 5.
Flow curves for alloy AZ91: actual and computed from the Hershel-Bulkley (R2 = 0.99873), Ostwald (R2 = 0.87918), Carreau (R2 = 0.99875), and Bingham (R2 = 0.91265) models.
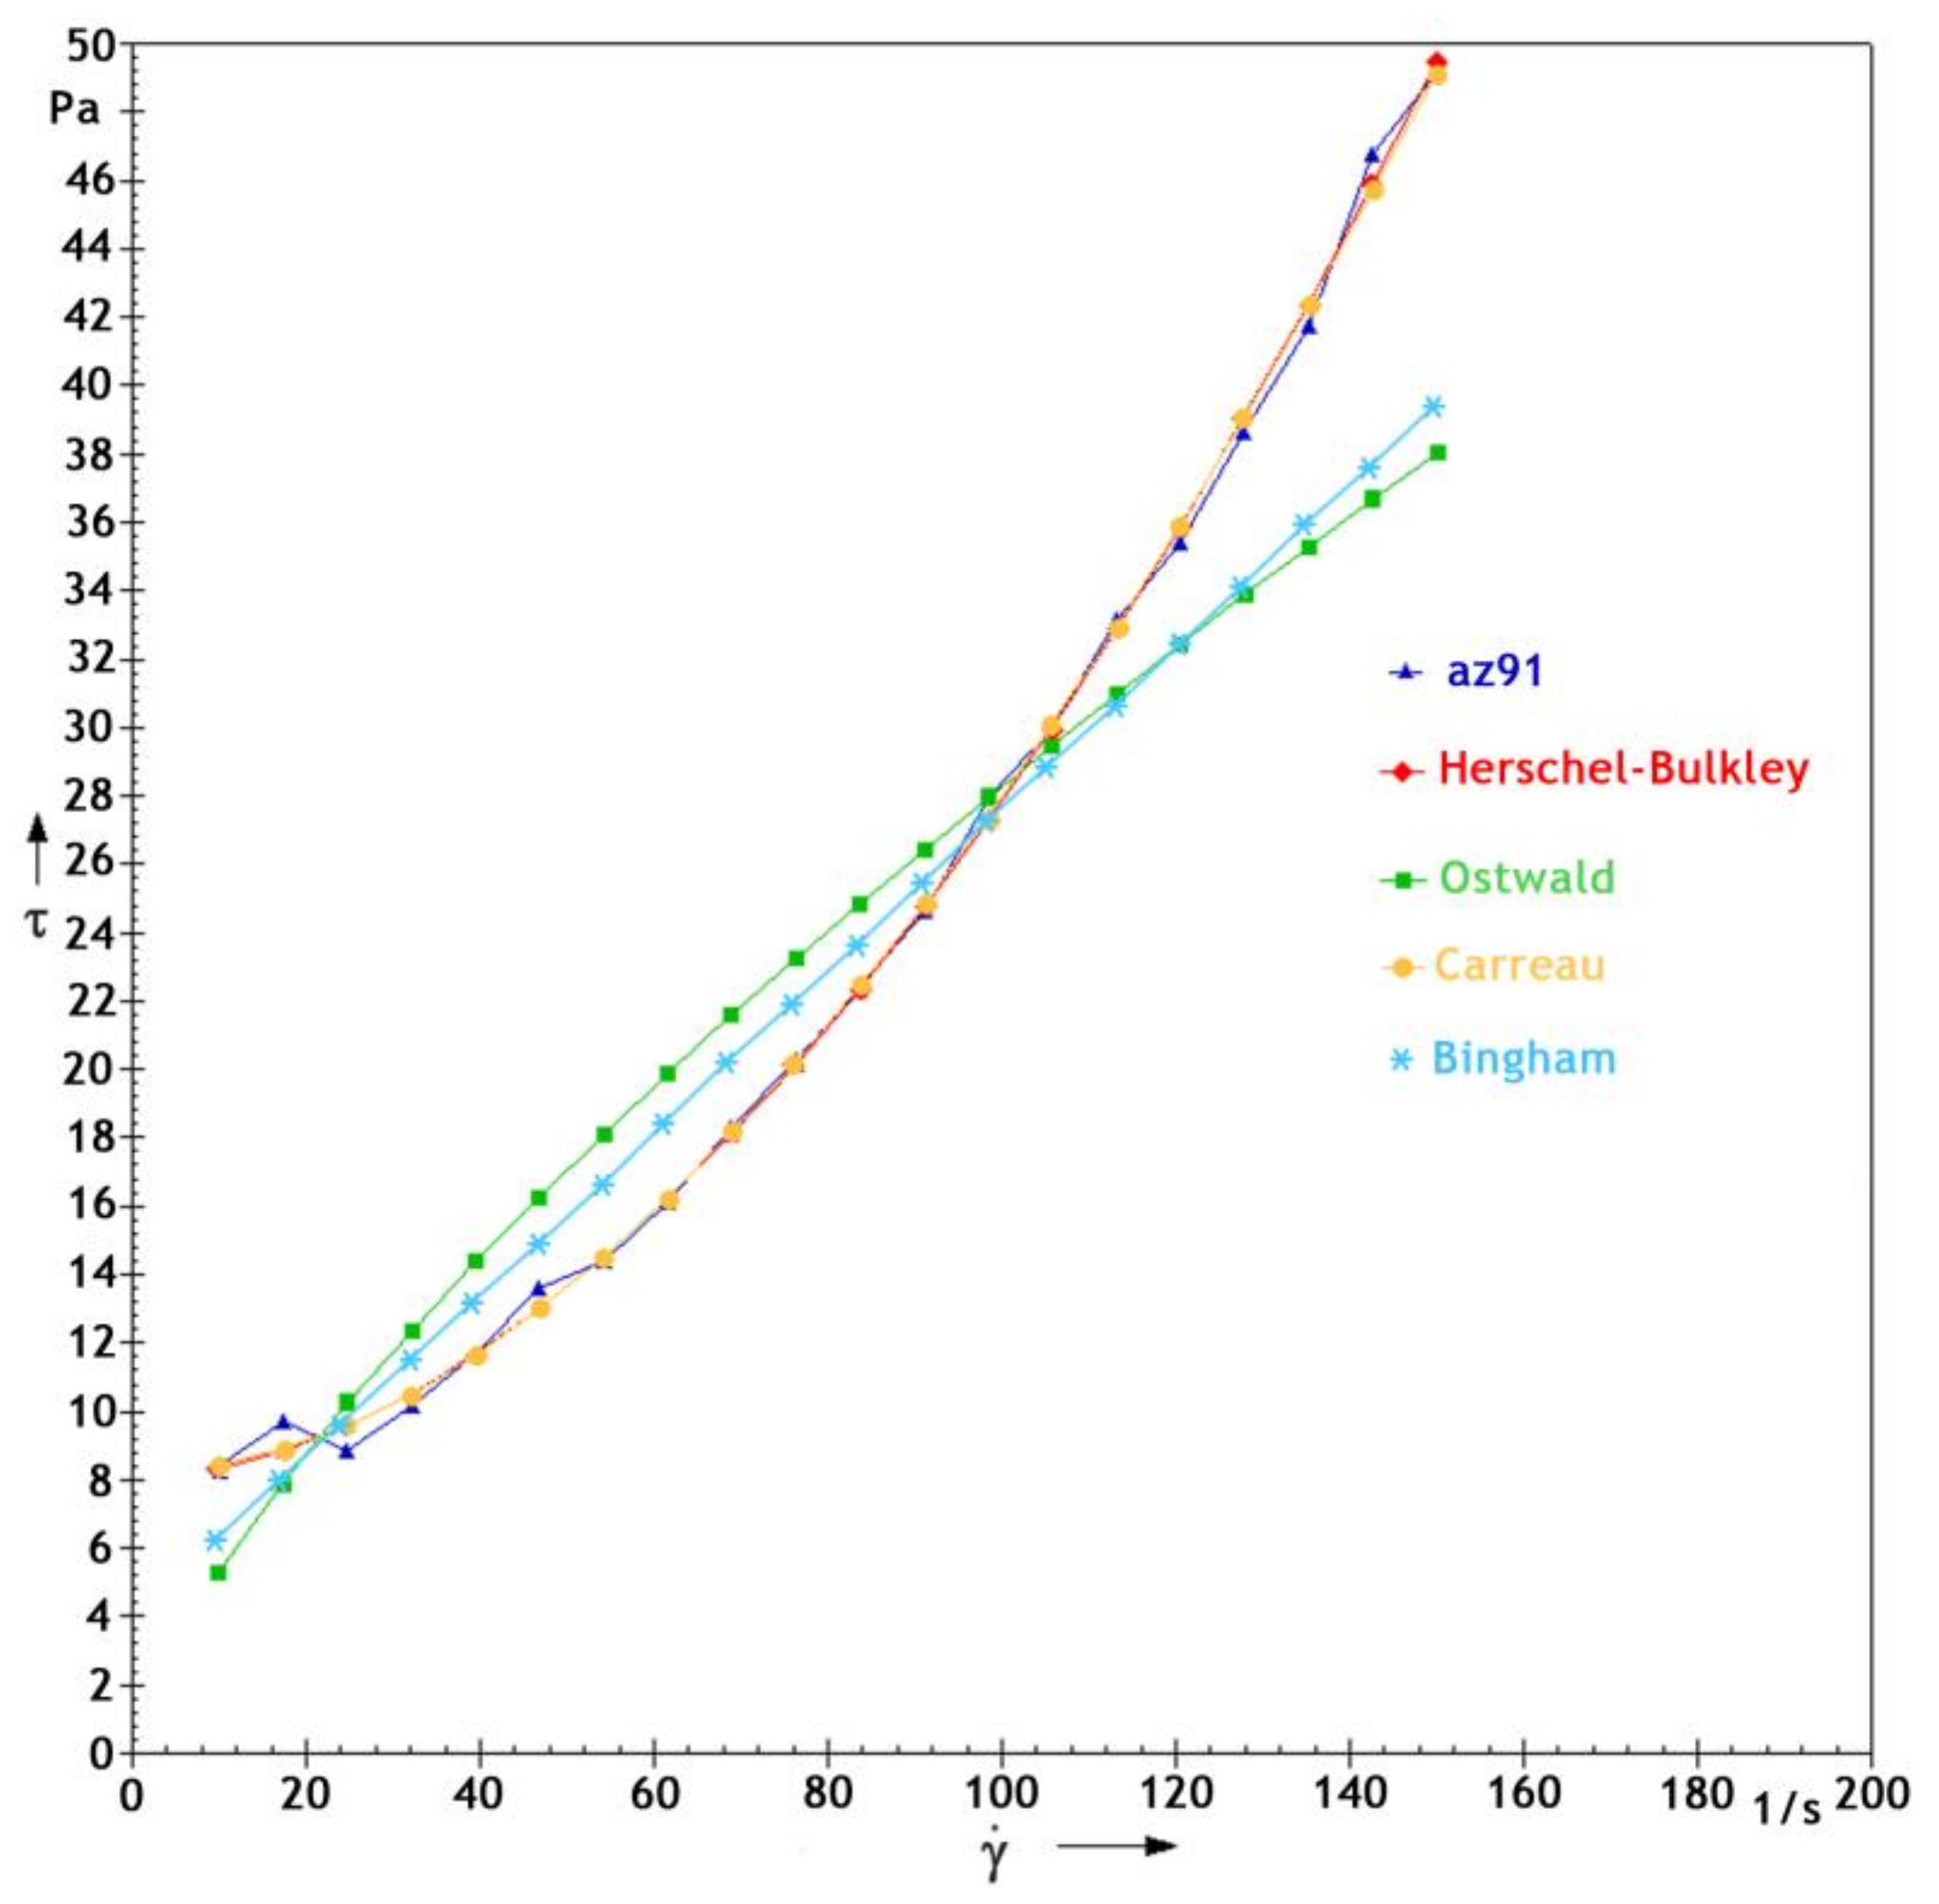
Figure 6.
Flow curves for alloy E21: actual and computed from the Hershel-Bulkley (R2 = 0.9861), Ostwald (R2 = 0.89346), Carreau (R2 = 0.98654), and Bingham (R2 = 0.90697) models.
Figure 6.
Flow curves for alloy E21: actual and computed from the Hershel-Bulkley (R2 = 0.9861), Ostwald (R2 = 0.89346), Carreau (R2 = 0.98654), and Bingham (R2 = 0.90697) models.
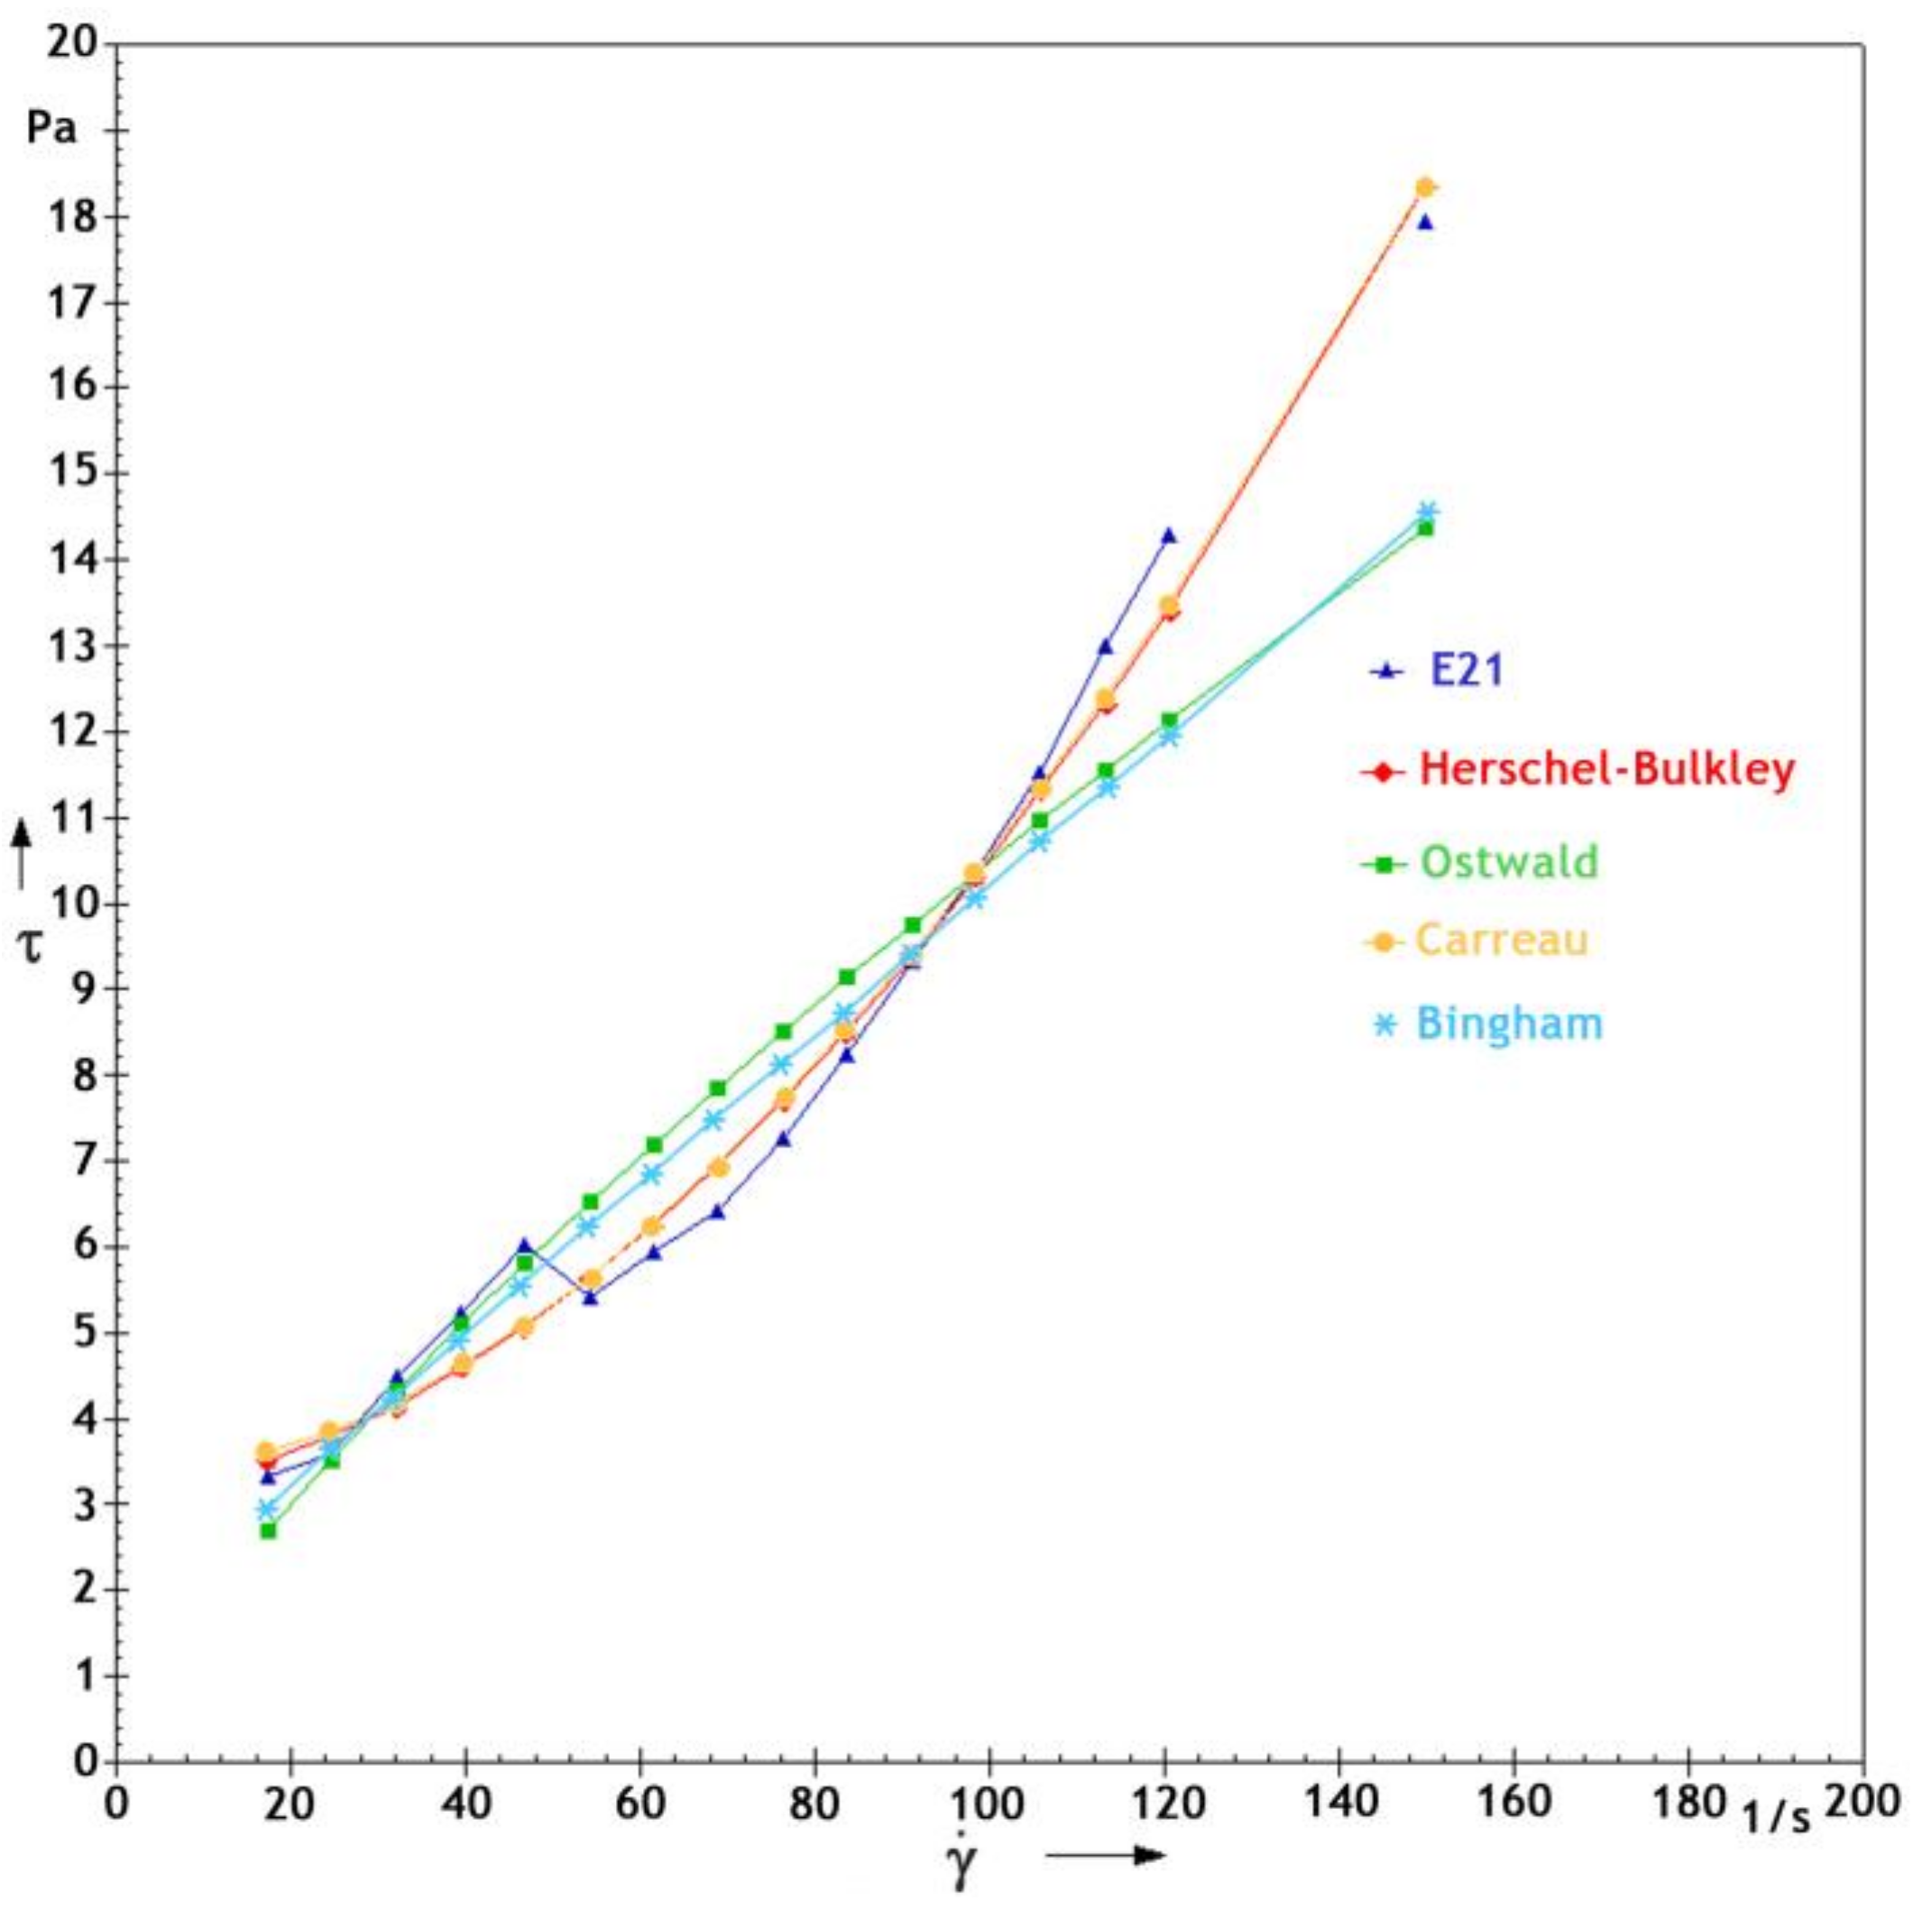
Figure 7.
Flow curves for alloy WE43B: actual and computed from the Hershel-Bulkley (R2 = 0.97892), Ostwald (R2 = 0.97174), Carreau (R2 = 0.93052), and Bingham (R2 = 0.97731) models.
Figure 7.
Flow curves for alloy WE43B: actual and computed from the Hershel-Bulkley (R2 = 0.97892), Ostwald (R2 = 0.97174), Carreau (R2 = 0.93052), and Bingham (R2 = 0.97731) models.

Figure 8.
Approximated flow curves, along with mean prediction bands (functions of the predictor variables) calculated for the Herschel-Bulkley models, for each of the tested alloys: AZ91, E21 and WE43B (black continuous line—flow curve, grey dotted line—mean prediction bands).
Figure 8.
Approximated flow curves, along with mean prediction bands (functions of the predictor variables) calculated for the Herschel-Bulkley models, for each of the tested alloys: AZ91, E21 and WE43B (black continuous line—flow curve, grey dotted line—mean prediction bands).


Table 1.
Magnesium alloys tested.
| Mg Alloy | Composition (wt %) | ||||
|---|---|---|---|---|---|
| AZ91 | Al | Mn | Zn | Mg | - |
| 8.7 | 0.13 | 0.7 | bal. | ||
| WE43B | Nd | Y | TR | Zr | Mg |
| 2.2 | 4.2 | 3.3 | 0.53 | bal. | |
| E21 | Gd | Nd | Zn | Mg | - |
| 1.4 | 3.0 | 0.31 | bal. | ||
Table 2.
The values of the liquidus temperature and the temperature of the solid phase content of 50% for the magnesium alloys analysed according to the DSC analysis.
Table 2.
The values of the liquidus temperature and the temperature of the solid phase content of 50% for the magnesium alloys analysed according to the DSC analysis.
| Mg Alloy | Liquidus Temperature (K) | T50% fs |
|---|---|---|
| AZ91 | 893 | 846 |
| WE43B | 955 | 915 |
| E21 | 947 | 918 |
Table 3.
Mathematical formulas of rheological models for the AZ91 alloy.
| Model | Equation | |
|---|---|---|
| Herschel-Bulkley | (5) | |
| Ostwald | (6) | |
| Carreau | (7) | |
| Bingham | (8) |
Table 4.
Mathematical formulas of rheological models for the E21 alloy.
| Model | Equation | |
|---|---|---|
| Herschel-Bulkley | (9) | |
| Ostwald | (10) | |
| Carreau | (11) | |
| Bingham | (12) |
Table 5.
Mathematical formulas of rheological models for the WE43B alloy.
| Model | Equation | |
|---|---|---|
| Herschel-Bulkley | (13) | |
| Ostwald | (14) | |
| Carreau | (15) | |
| Bingham | (16) |
© 2018 by the author. Licensee MDPI, Basel, Switzerland. This article is an open access article distributed under the terms and conditions of the Creative Commons Attribution (CC BY) license (http://creativecommons.org/licenses/by/4.0/).
Share and Cite
MDPI and ACS Style
Ślęzak, M. Study of Semi-Solid Magnesium Alloys (With RE Elements) as a Non-Newtonian Fluid Described by Rheological Models. Metals 2018, 8, 222. https://doi.org/10.3390/met8040222
AMA Style
Ślęzak M. Study of Semi-Solid Magnesium Alloys (With RE Elements) as a Non-Newtonian Fluid Described by Rheological Models. Metals. 2018; 8(4):222. https://doi.org/10.3390/met8040222
Chicago/Turabian StyleŚlęzak, Marta. 2018. "Study of Semi-Solid Magnesium Alloys (With RE Elements) as a Non-Newtonian Fluid Described by Rheological Models" Metals 8, no. 4: 222. https://doi.org/10.3390/met8040222
Note that from the first issue of 2016, this journal uses article numbers instead of page numbers. See further details here.