Formation Criterion of Hydrogen-Induced Cracking in Steel Based on Fracture Mechanics


State Key Laboratory of Advanced Welding and Joining, Harbin Institute of Technology, Harbin 150001, China
*
Author to whom correspondence should be addressed.
Metals 2018, 8(11), 940; https://doi.org/10.3390/met8110940
Submission received: 11 October 2018
/
Revised: 28 October 2018
/
Accepted: 11 November 2018
/
Published: 13 November 2018
(This article belongs to the Special Issue Hydrogen Embrittlement of Metallic Materials: Past, Present and Future)
Abstract
:A new criterion for hydrogen-induced cracking (HIC) that includes both the embrittlement effect and the loading effect of hydrogen was obtained theoretically. The surface cohesive energy and plastic deformation energy are reduced by hydrogen atoms at the interface; thus, the fracture toughness is reduced according to fracture mechanics theory. Both the pressure effect and the embrittlement effect mitigate the critical condition required for crack instability extension. During the crack instability expansion, the hydrogen in the material can be divided into two categories: hydrogen atoms surrounding the crack and hydrogen molecules in the crack cavity. The loading effect of hydrogen was verified by experiments, and the characterization methods for the stress intensity factor under hydrogen pressure in a linear elastic model and an elastoplastic model were analyzed using the finite-element simulation method. The hydrogen pressure due to the aggregation of hydrogen molecules inside the crack cavity regularly contributed to the stress intensity factor. The embrittlement of hydrogen was verified by electrolytic charging hydrogen experiments. According to the change in the atomic distribution during crack propagation in a molecular dynamics simulation, the transition from ductile to brittle fracture and the reduction in the fracture toughness were due to the formation of crack tip dislocation regions suppressed by hydrogen. The HIC formation mechanism is both the driving force of crack propagation due to the hydrogen gas pressure and the resisting force reduced by hydrogen atoms.
1. Introduction
The formation mechanism of hydrogen-induced cracking (HIC) has been extensively studied in numerous material systems [1,2,3,4,5,6]. Many HIC mechanisms have been proposed, mainly concerning two aspects: (1) the degradation of the mechanical properties of materials by hydrogen atoms and (2) the additional hydrogen gas pressure load promoting the material fracture.
The fracture toughness (KQ) of pipeline steel under simulated sour service conditions was moderately decreased by adding hydrogen, and the crack tip opening displacement (CTOD0) significantly decreased with the increase in the hydrogen concentration [7]. For ultrahigh-strength AerMet100 steel, the threshold stress intensity for critical HIC (KTH) can be as low as 10% of the plane-strain fracture toughness without hydrogen (KIC), with a fracture-mode transition from microvoid coalescence (MVC) to brittle transgranular (TG) cracking, apparently along martensite lath interfaces and cleavage planes [8].
The hydrogen pressure in the crack cavity and on the outer surface significantly affect the crack propagation within the material [9,10,11]. The effect of gaseous hydrogen on the crack growth in structure steels has been analyzed considering the thermal influences and effects of hydrogenation-degasation [9]. An obvious increase in the fatigue crack growth rate was observed in experiments under high pressure gaseous hydrogen action [10,11]. The equation of state for an ideal gas can be used to solve the problem of elasticity theory for the crack opening under gas pressure as well as the theory of gas diffusion into the crack cavity [12]. Due to the stress-strain concentration effect around the crack tip, the process of hydrogen diffusion in the crack is affected [13,14,15].
In previous studies, researchers focused on the effects and laws of certain aspects of hydrogen: either the effect of hydrogen on the properties of materials or the effect of hydrogen pressure on the internal load of defective cavities [16]. However, to fully study the mechanism of HIC propagation, it is necessary to consider both the reduction in the material properties by hydrogen atoms and the loading effect of hydrogen pressure in the cavity. In this paper, a new criteria simultaneously considering the loading effect with embrittlement effect of hydrogen is theoretically obtained and experimentally verified.
2. Loading Effect of Hydrogen Molecules
2.1. HIC Generation Experiment
The purpose of this experiment was to prove that hydrogen forms hydrogen molecules in the defects during the diffusion process, having a non-negligible loading effect on the formation of cracks. This effect is common in steel materials, as long as the hydrogen content is sufficient [9,10,11]. A structural steel with wide range of uses was selected as an illustration.
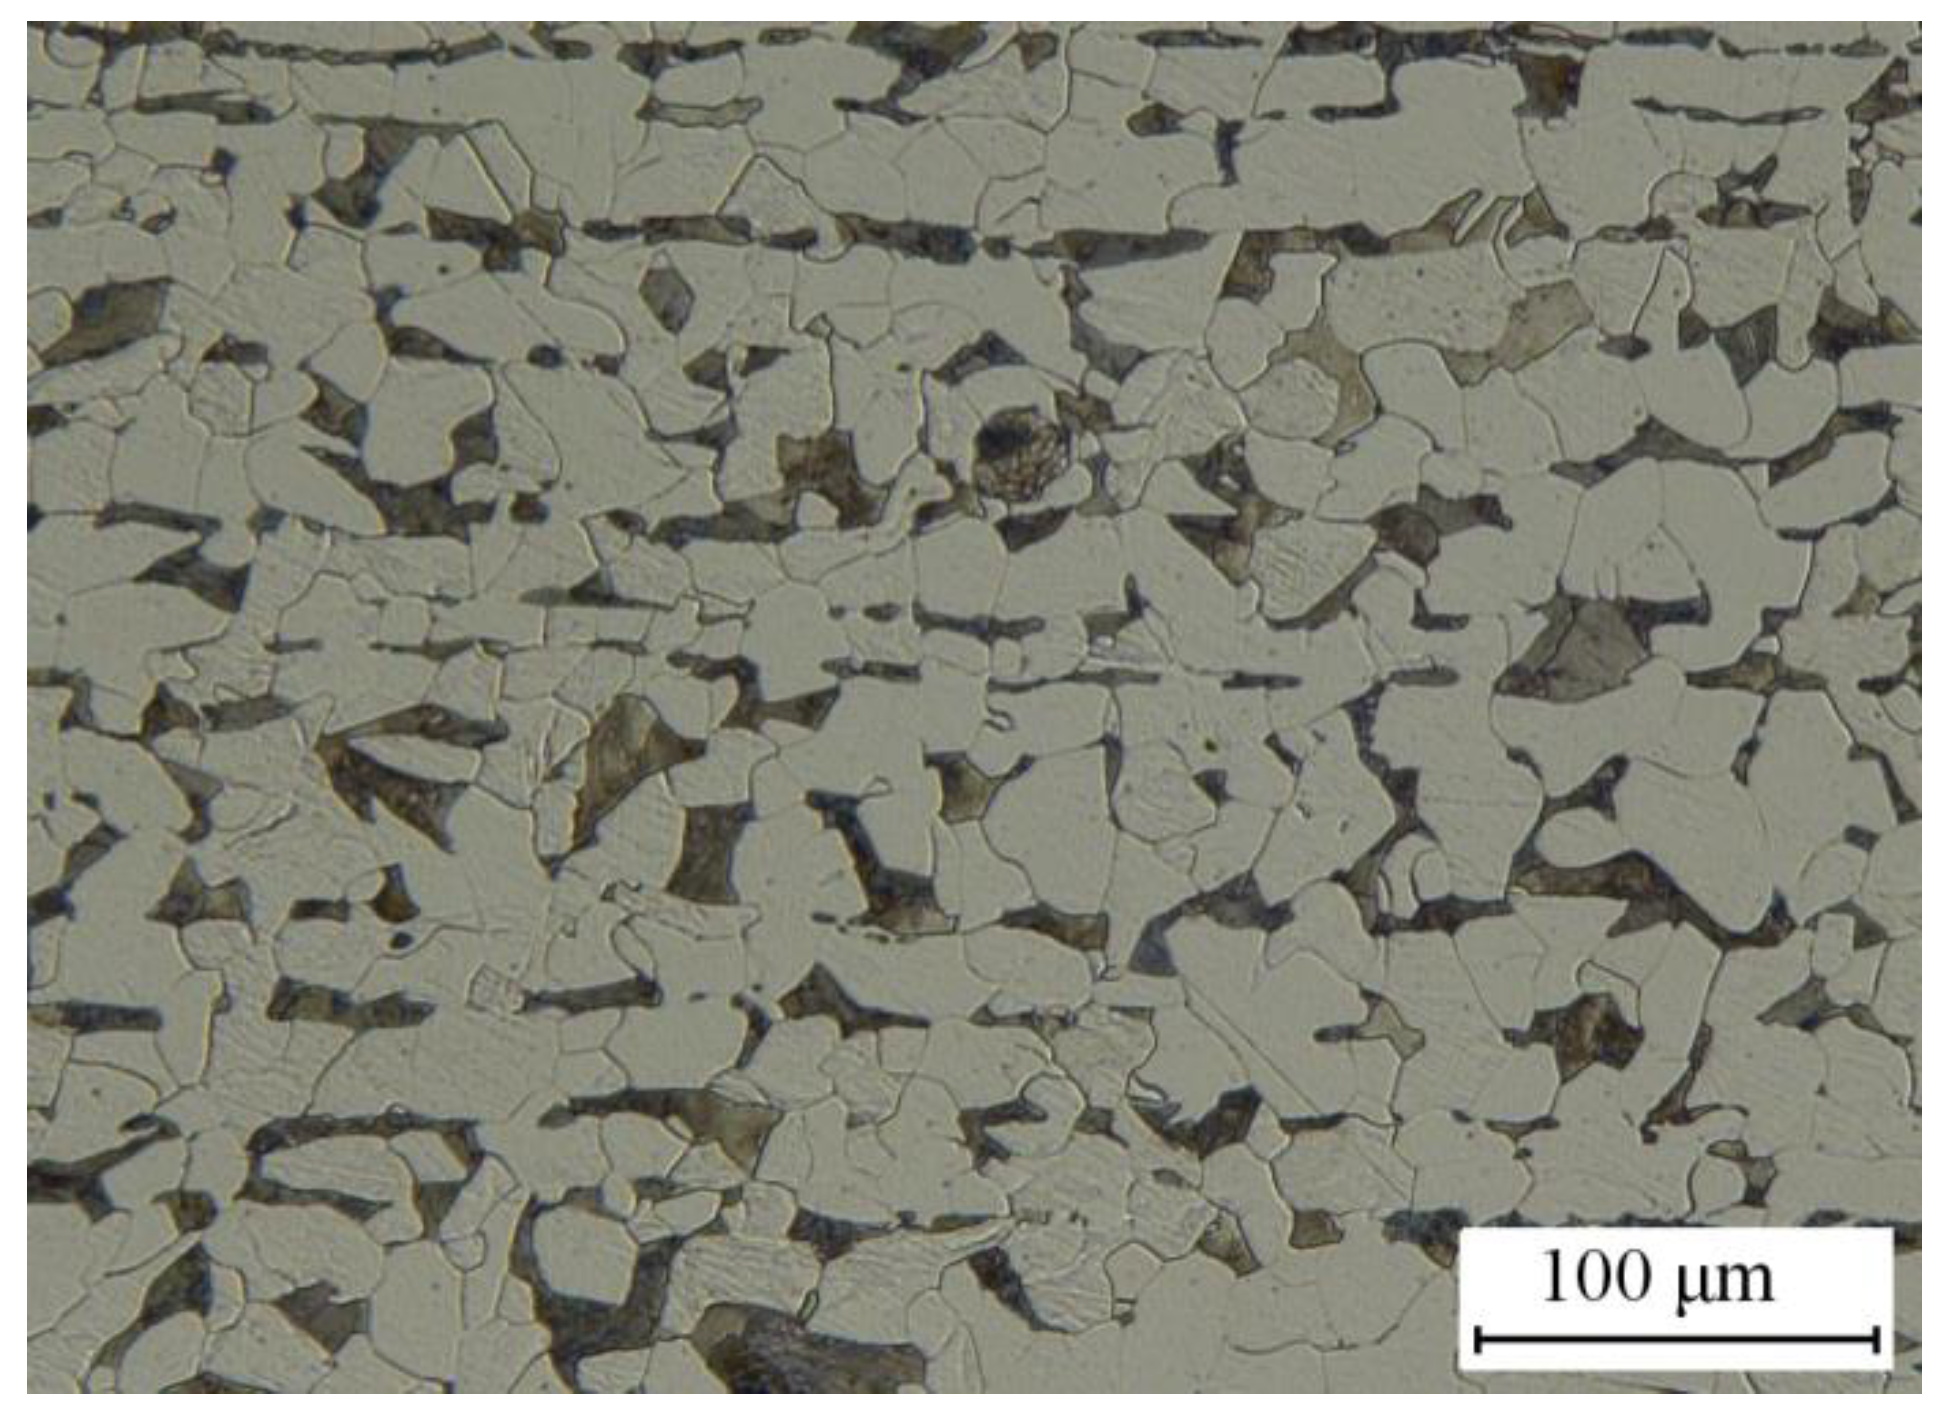
Sheets of 1.2-mm-thick E235B steel, having the chemical composition listed in Table 1, were cut along the direction of rolling into round pieces 30 mm in diameter. The metallographic structure was a mixture of pearlite and ferrite, as shown in the optical microscopy (KEYENCE, Osaka, Japan) image in Figure 1. The major phase in the E235B steel was ferrite (lighter areas in the images). The grain size was between 10 and 15 μm. To obtain a homogeneous distribution of hydrogen in the steel, the sheet surface was refined and polished until it appeared smooth under an optical microscope.
Hydrogen was added to the samples via cathodic electrolysis at 20 °C. Each sample was supported by an H-type electrolytic cell. The samples were formed as the cathode in a 0.5 mol/L H2SO4 + 0.5 g/L NaAsO2 solution, and a platinum electrode was set as the anode. The H-type electrolytic cell (CH Instruments, Shanghai, China) with an ancillary apparatus was used to measure the diffused hydrogen concentration via an electrochemical analyzer.
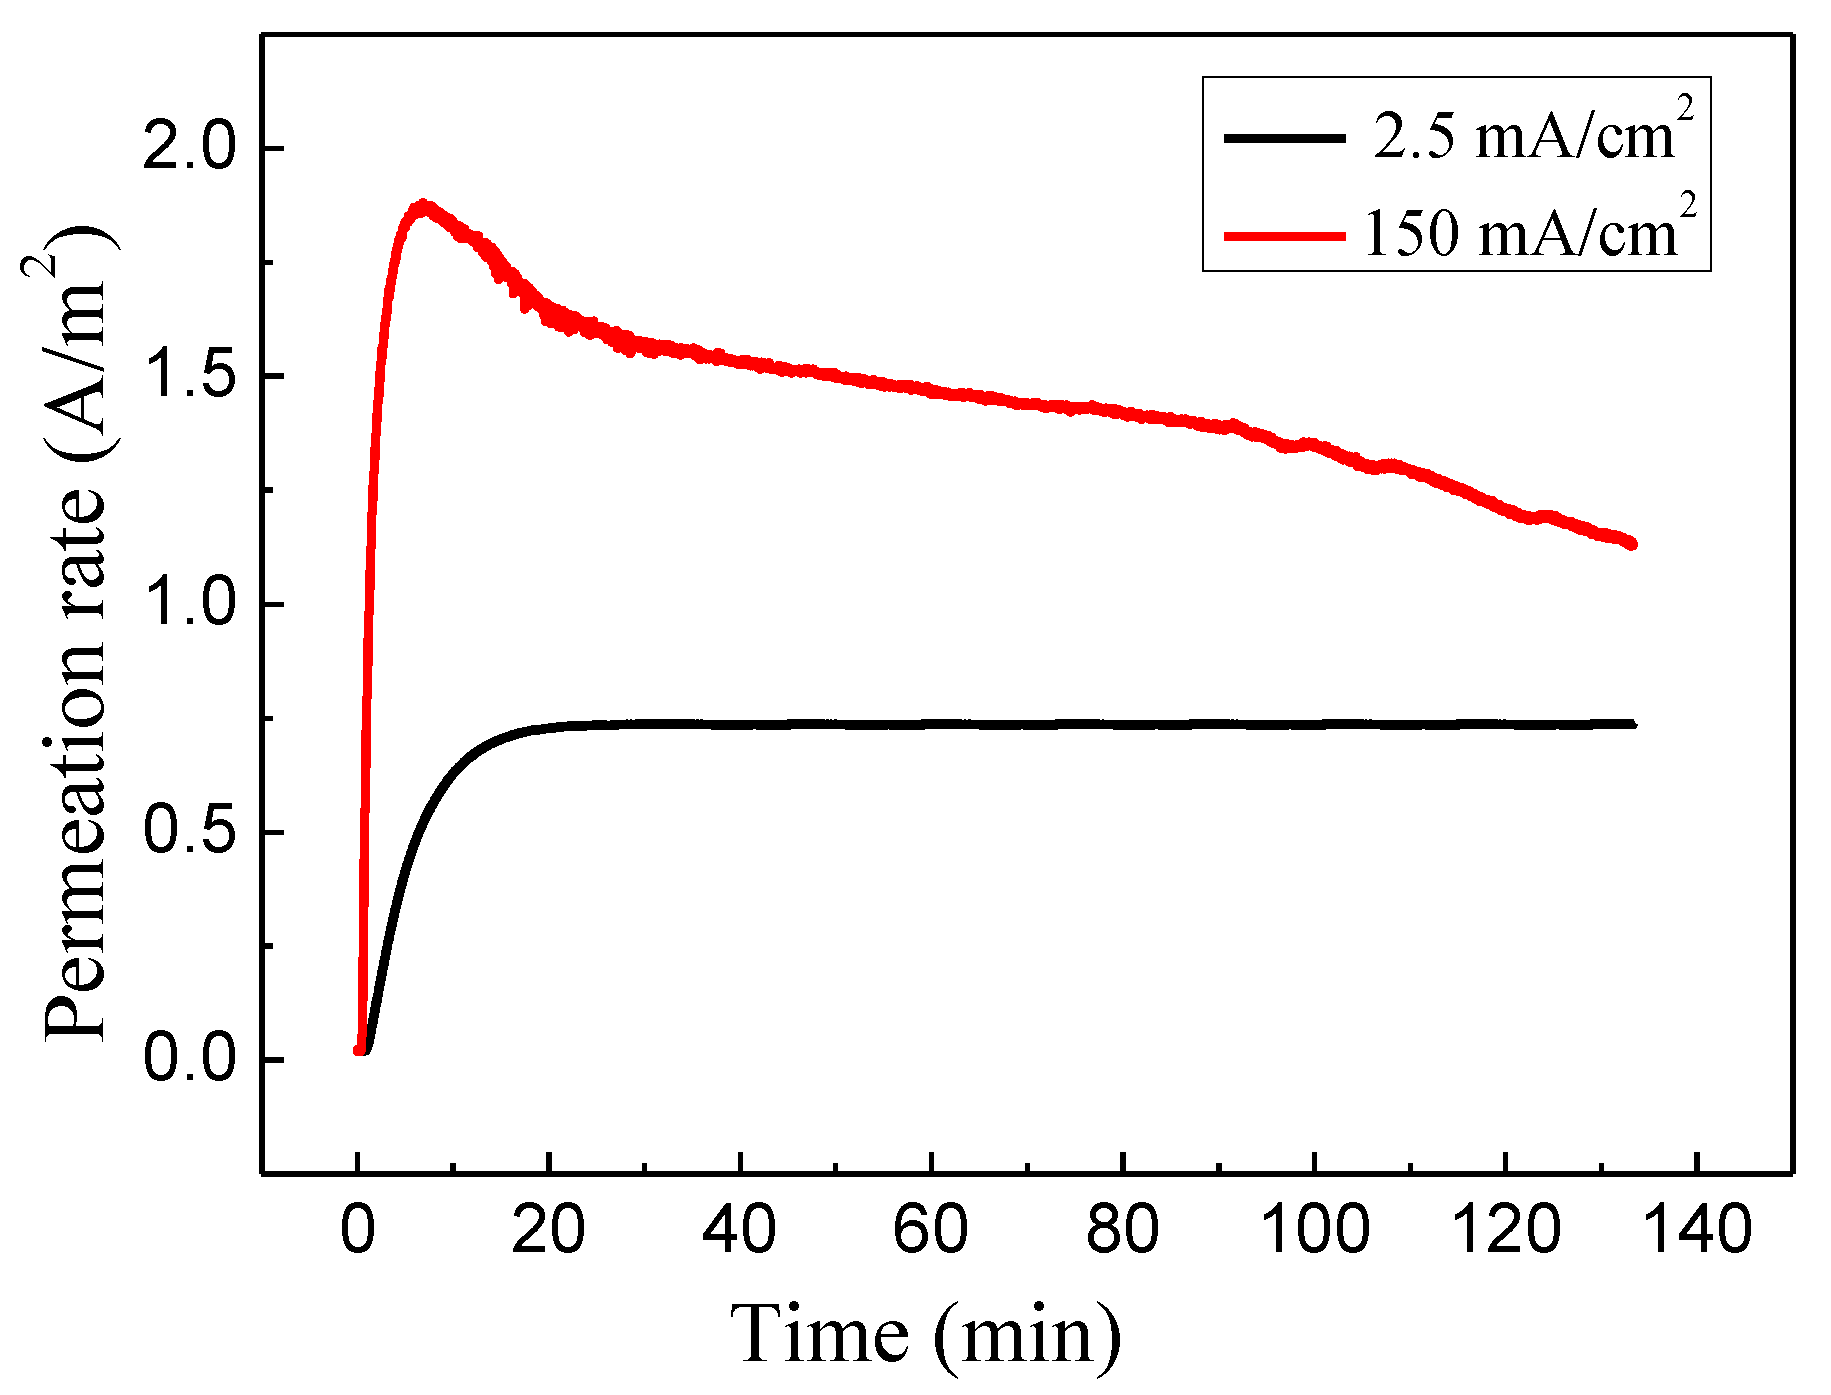
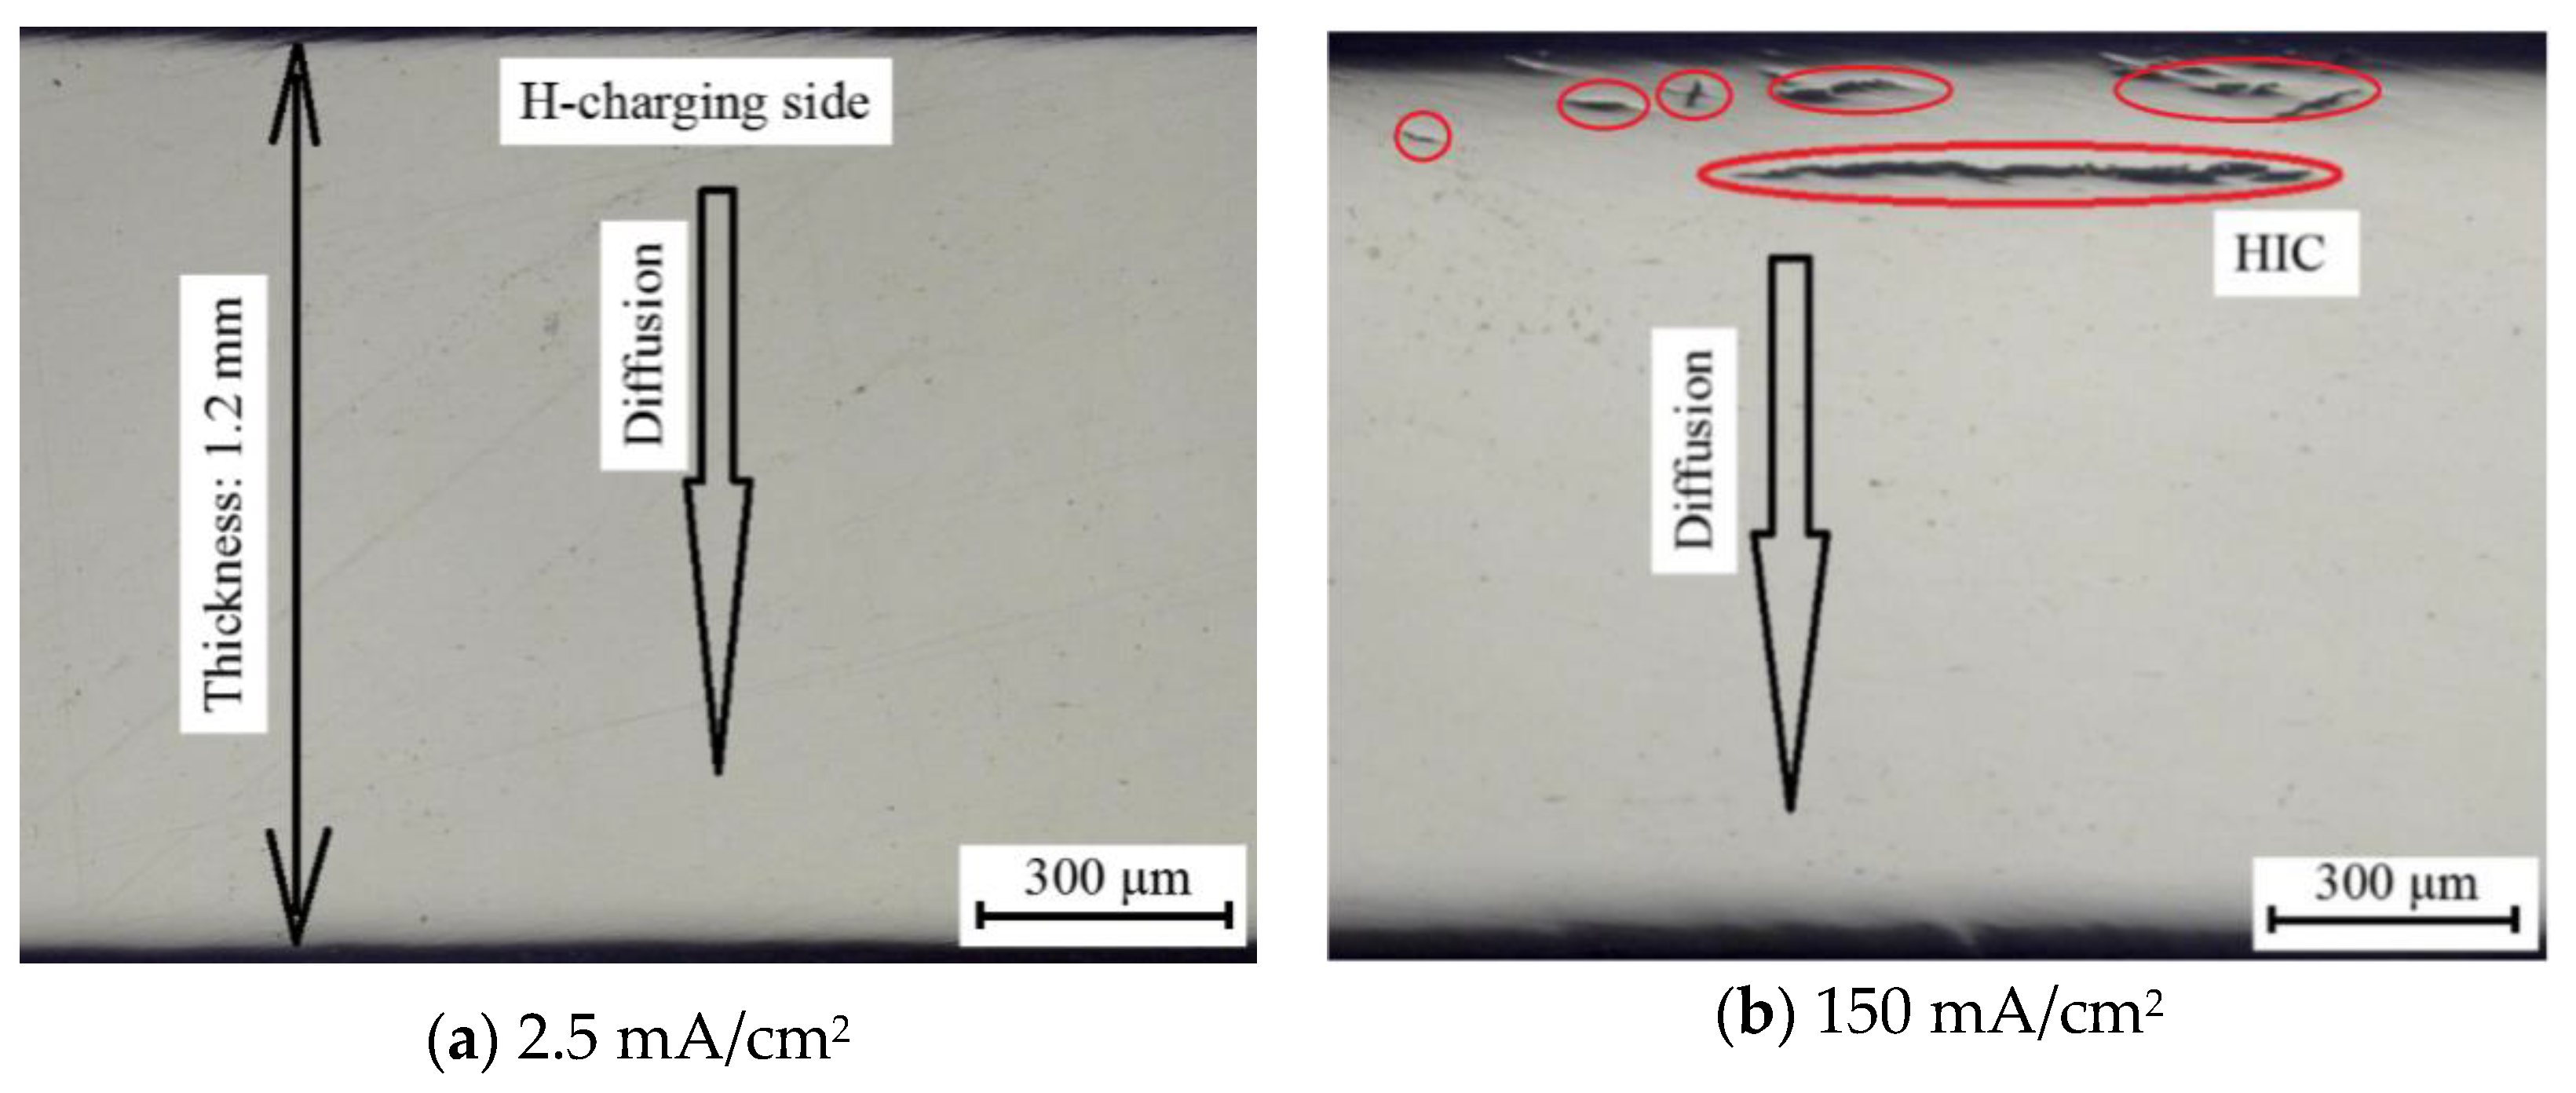
Before the hydrogen was charged, the detection side surface of each sample was coated with a thin layer of nickel. The nickel electroplating was performed in a Watt’s bath aqueous solution [17]. The amount of hydrogen was controlled by changing the applied current density [18], which was 2.5 and 150 mA/cm2. Figure 2 shows the changes in the hydrogen permeation rate with time under different hydrogen charging conditions. The hydrogen diffusion direction was from the hydrogen charged side to the hydrogen detection side, as shown in Figure 3.
When the hydrogen charging current density was relatively low, such as 2.5 mA/cm2, the hydrogen permeation curve reached equilibrium after 20 min of hydrogen charging. This means that the hydrogen concentration and distribution were stable and equilibrium of the hydrogen input and overflow was achieved. This corresponds to the hydrogen permeation curve in Figure 2. However, if the current density was particularly high, for example, 150 mA/cm2, the hydrogen permeation rate decreased with increasing hydrogen charging time after reaching its maximum value.
After the electrochemical hydrogenation experiment, the samples were cut along the direction of hydrogen permeation to take microscope photos of the metal cross section, as shown in Figure 3.
The sample with a low current density was not significantly different from the sample without hydrogen. In contrast, the sample with a current density of 150 mA/cm2 for 120 min had obvious long cracks on the H-charging side. Because hydrogen diffused from the hydrogen charging side to the hydrogen detection side (Figure 3), the hydrogen concentration on the hydrogen charging side was significantly higher than that on the hydrogen detection side in accordance with Fick’s diffusion law. Thus, the cracks in Figure 3 only formed on the side with the higher hydrogen content. These cracks were transverse ladder cracks, which are parallel to the surface and along the direction of tissue flow. Because the cracks formed due to the high hydrogen concentration, they are called hydrogen-induced cracks.
According to fracture mechanics, crack formation and growth require external loads or residual stress [19,20]. However, in this experiment, no external load was applied to the samples. For the samples 30 mm in diameter and 1.2 mm thick, the residual stress was fully released before hydrogen charging experiments. Therefore, we assumed that the hydrogen in the material acted as the external load or residual stress. An additional load was needed to form a stress concentration around the crack tip during the crack propagation [21]. In this experiment, the hydrogen charged into the sample had the effect of a load, promoting the crack propagation [22,23,24].
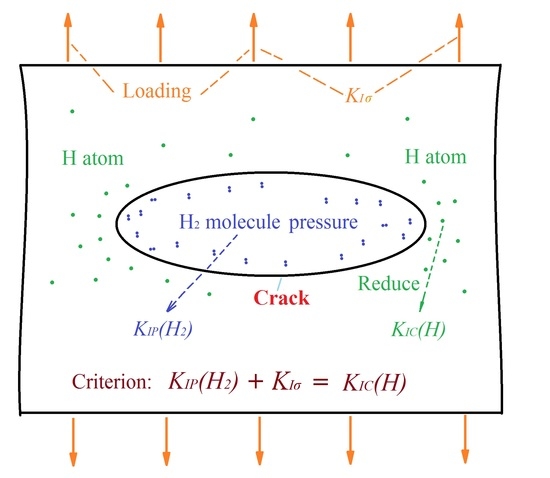
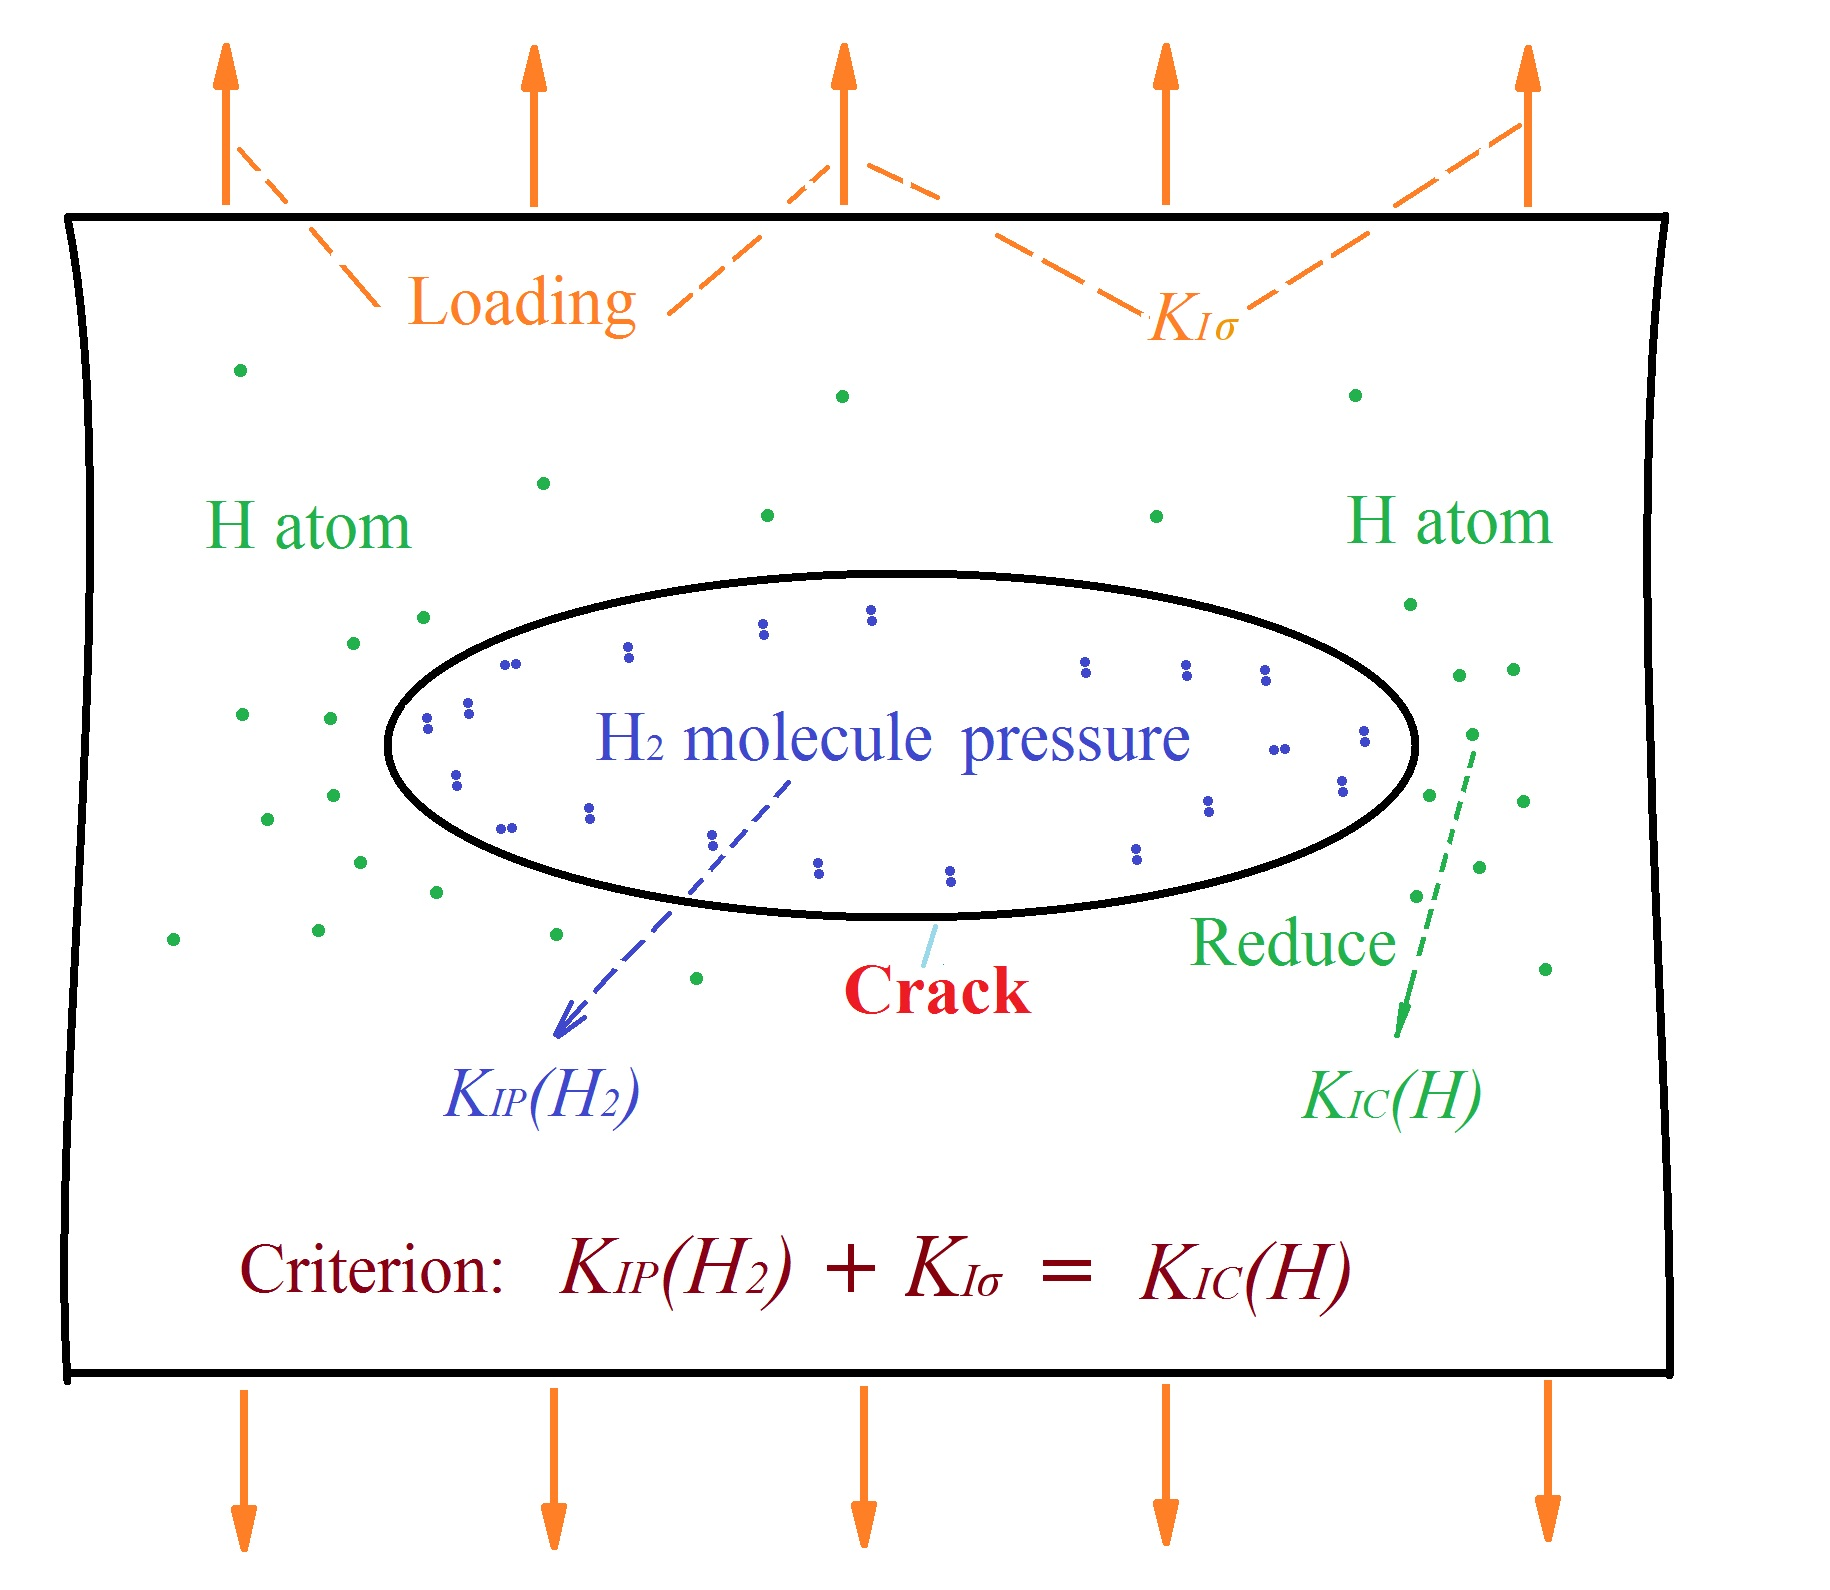
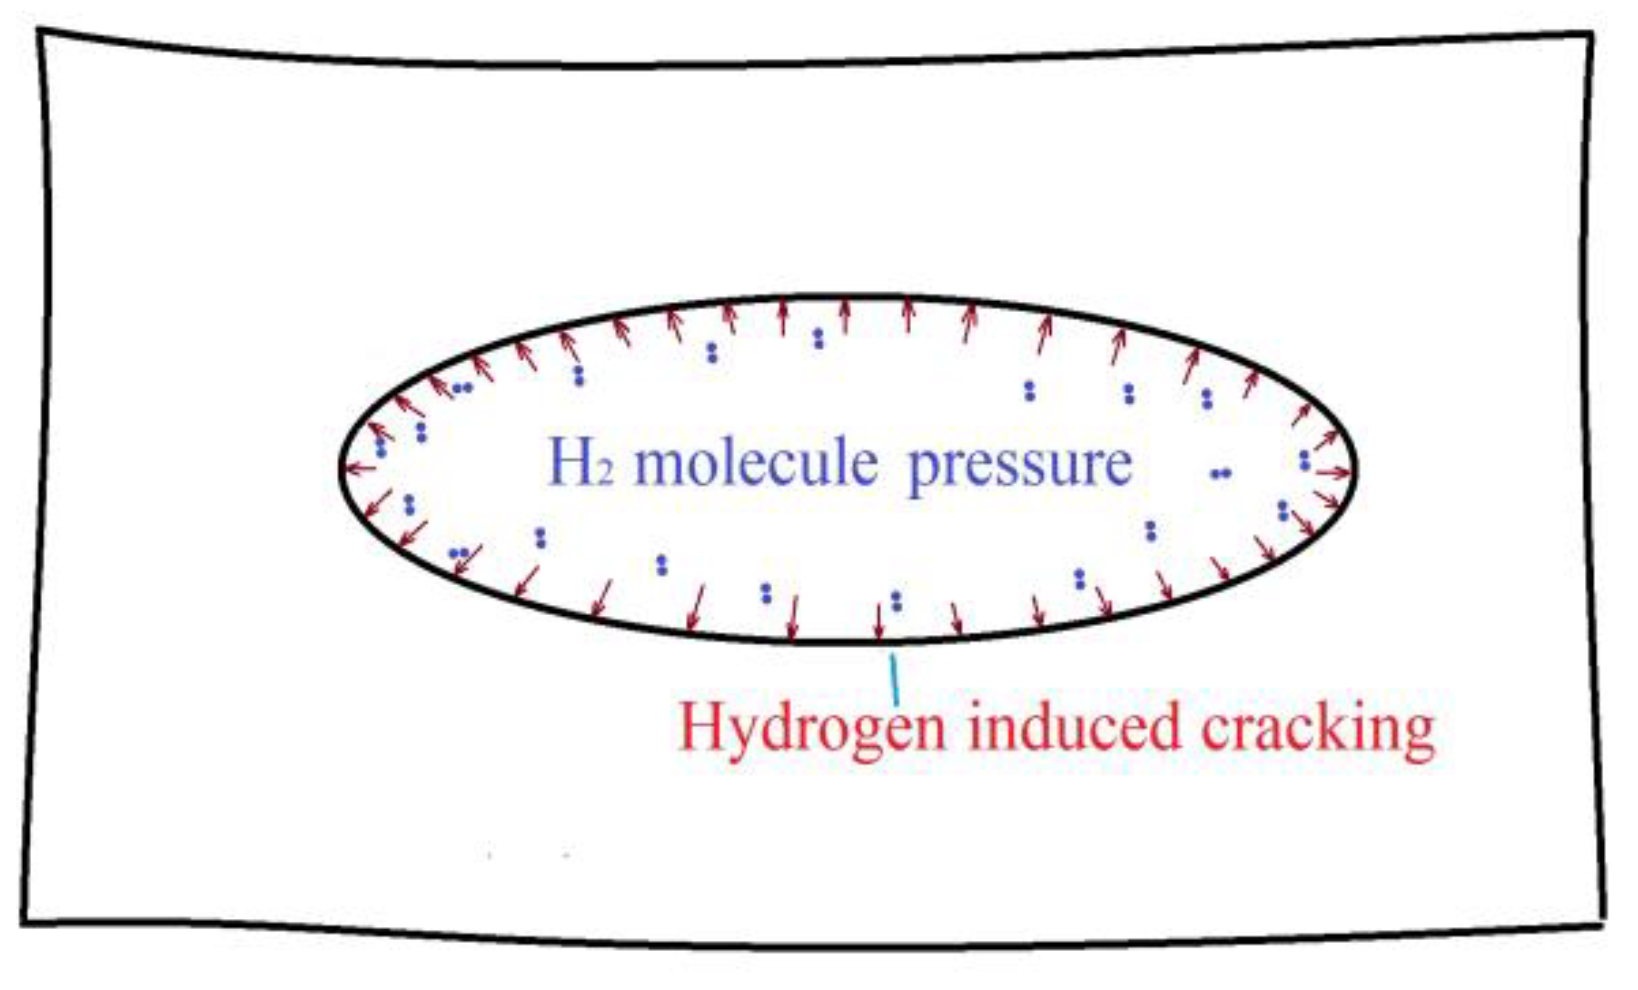
By analyzing the experimental hydrogen thermal desorption results, it was proven that there are two kinds of hydrogen in the material: diffusible hydrogen in the reverse traps and residual hydrogen in the irreversible traps (such as the cracks) [25]. When hydrogen atoms combined in a defect or a tiny crack, they formed hydrogen molecules. The aggregation of hydrogen molecules increased the probability of colliding with the defective cavity [26]; thus, the hydrogen pressure caused by the hydrogen molecules promoted crack formation and expansion [27], as shown in Figure 4.
The direction of the hydrogen pressure in the crack cavity was outward, and hydrogen pressure values were equal everywhere in the crack cavity. We assumed that the load affecting on the outer surface away from the crack is equivalent to the hydrogen pressure affecting on the inner cavity of the crack. As such, the hydrogen in the material has the same effect as the external load.
2.2. Effect of Hydrogen Pressure According to FE Simulation
As the HIC formation criterion proposed in this paper is based on the theory of stress intensity factor, the hydrogen pressure effect was characterized using the stress intensity factor (KIP(H2)) via finite element (FE) simulation.
The hydrogen molecules aggregated from hydrogen atoms accumulated to produce hydrogen pressure in the crack cavity. The direction of the hydrogen pressure in the crack cavity was outward, which promoted the expansion of the crack, as shown in Figure 4. Considering the direction of the hydrogen pressure, mode I crack was selected as the object for inspection.
The two-dimensional (2D) infinite plate model was used in the simulation to eliminate the influence of the model size and shape on the stress intensity factor (KI). In order to accurately calculate the stress distribution around the crack tip, the minimum size of the element was approximately 1/100 of the crack length. As there was no significant difference in the Young’s modulus of the steel at 20 °C, it was set to 200 GPa. The purpose of the FE simulation in this paper was to analyze the characterization method of KIP(H2). Thus, both the applied load and hydrogen pressure were set to 100 MPa for an illustration. When the material was only subjected to external loads without hydrogen, the calculated model was as shown in Figure 5. On the contrary, when the material was only subjected to the hydrogen-pressure load without an external load, the calculation model was as shown in Figure 4.
When the hydrogen content reaches a certain value, the tensile strength of the steel material is lowered to a level lower than the yield strength [27]. In this case, the mechanical model of steel materials changes from elastoplastic to linear elasticity.
According to fracture mechanics [27,28], within the range of linear elasticity, KI was calculated from the stress (σy) field around the crack tip, as indicated by Equation (1). The origin of the coordinate system (r = 0) was the crack tip position.
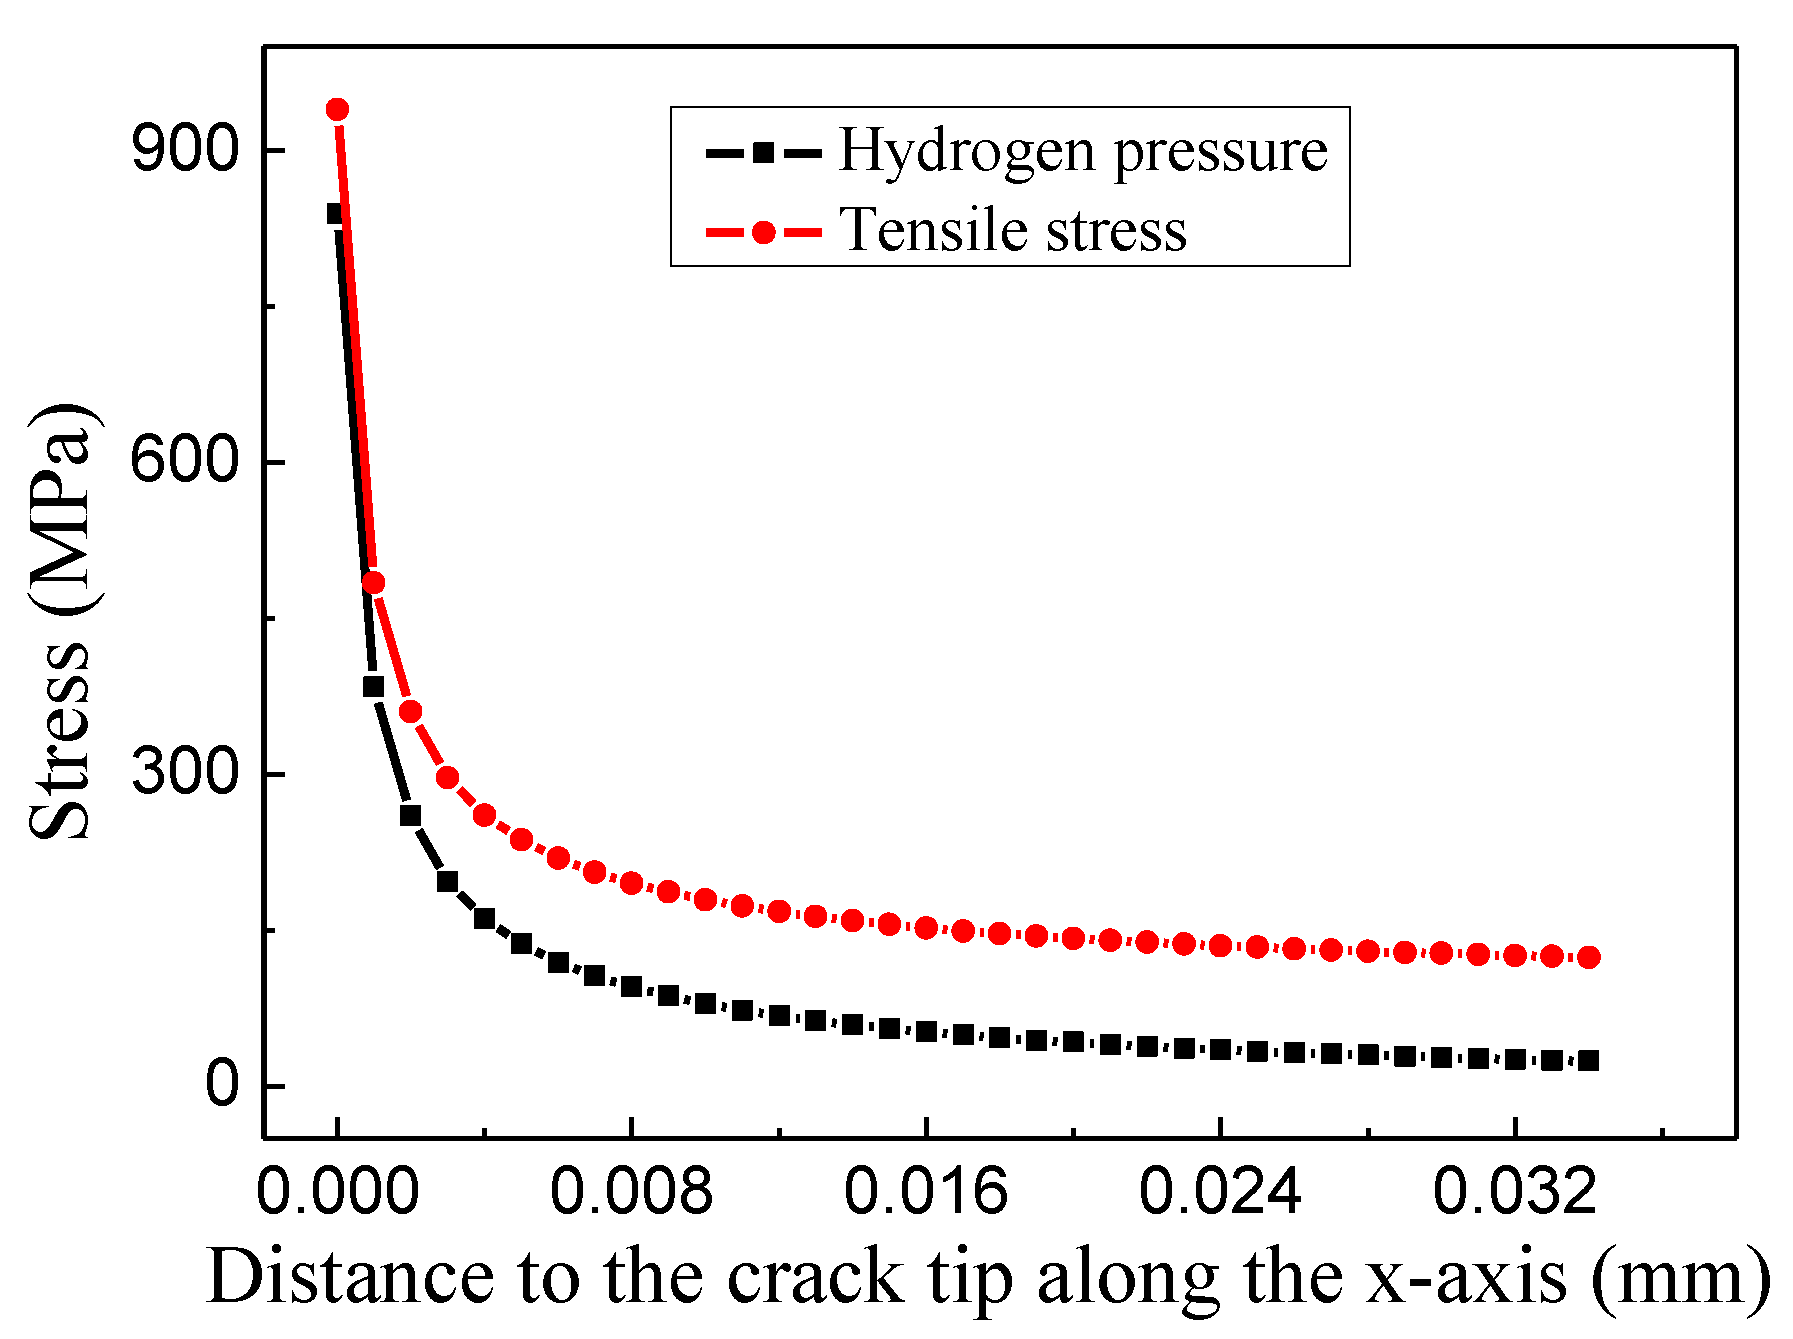
Based on the Equation (1), KI was determined by the stress distribution around the crack. Thus, we calculated the stress distribution around the crack under the influence of hydrogen pressure and external load separately. According to calculations of FE simulation, the effect of the hydrogen pressure on the periphery of the crack was almost the same as the effect of the tensile stress, as shown in Figure 6. Therefore, the KIP(H2) was obtained using the stress intensity factor generated by external load (KIσ).
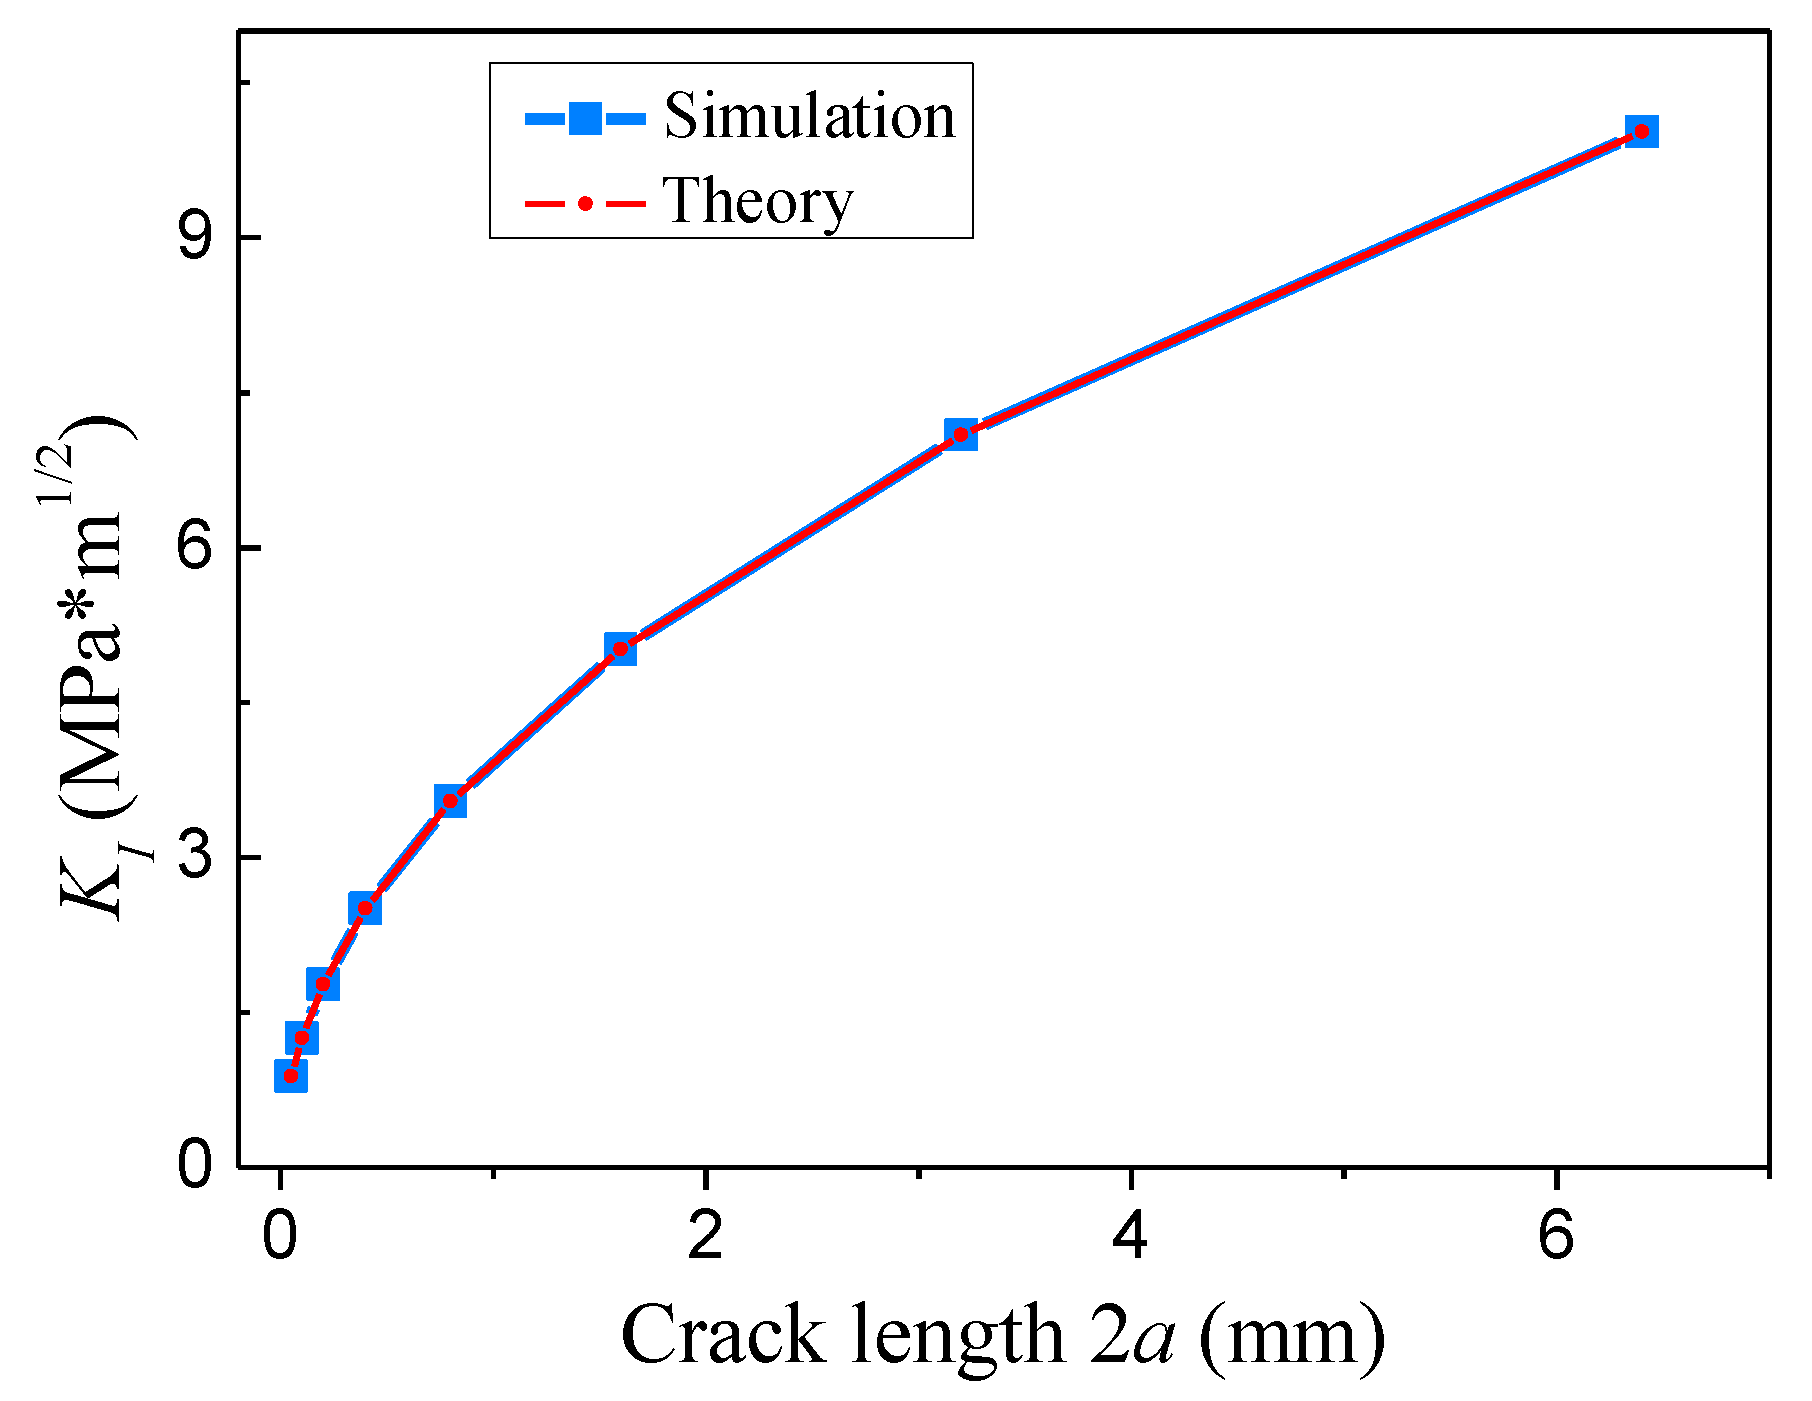
Before calculating the stress intensity factor using the FE simulation method, we needed to verify the accuracy of this method. For the calculation model in this paper, the theoretical calculation equation under the tensile stress was considered to be accurate.
The theoretical calculation equation of KI for an infinite plate was as follows, according to fracture mechanics:
Figure 7 shows the KIσ values calculated using FE simulation and theory at the tensile stress of 100 MPa within the range of linear elasticity under different crack lengths (2a). The stress intensity factor obtained via FE simulation was in good agreement with the theoretical results, indicating that the FE simulation method was effective for calculating the stress intensity factor [28].
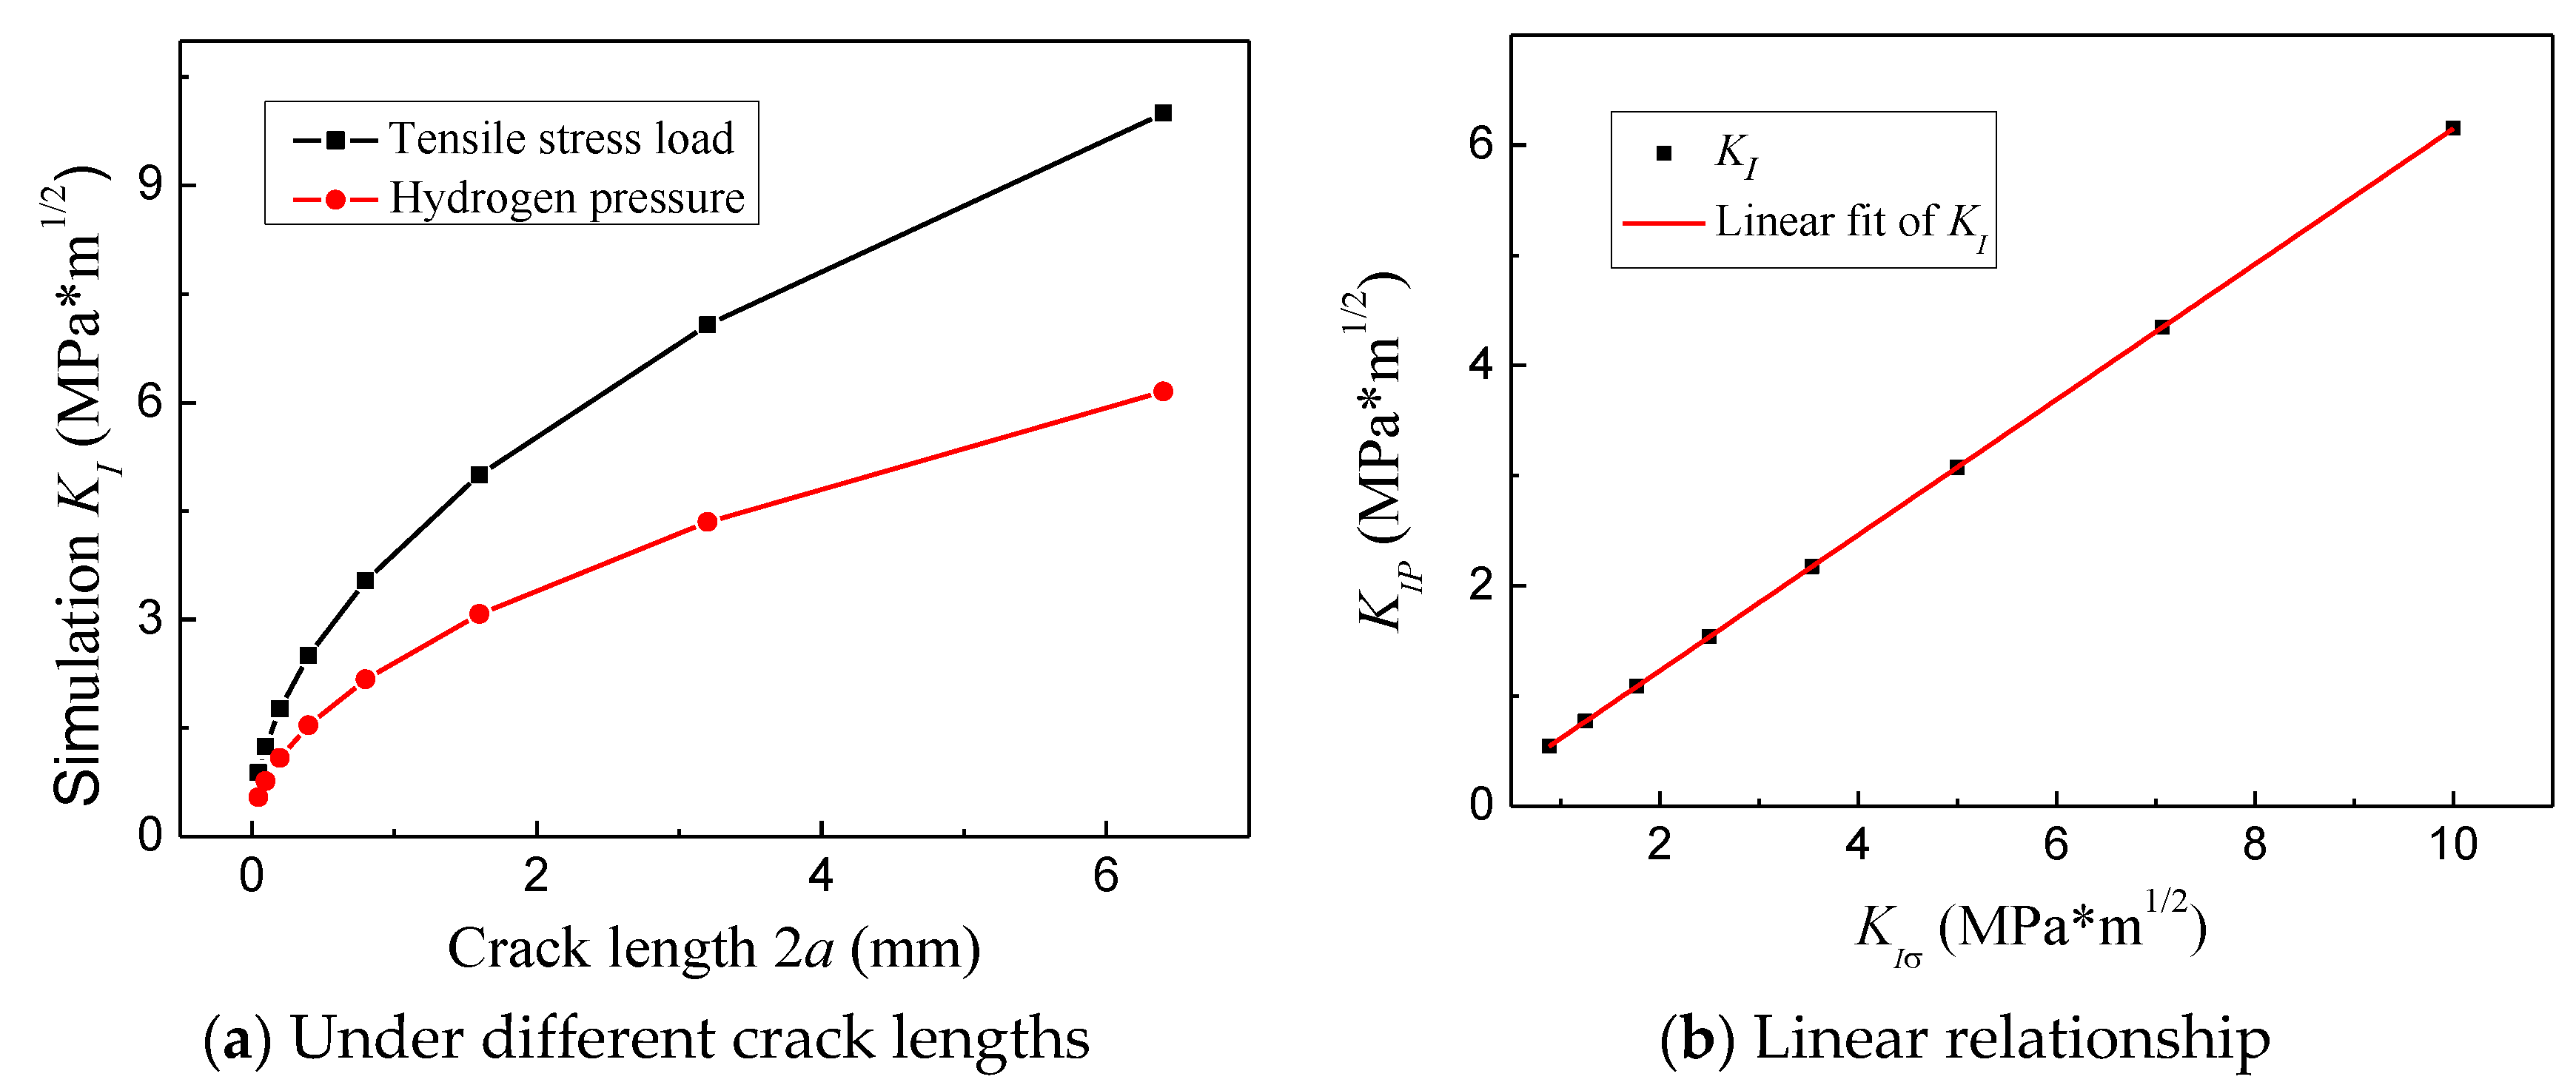
The stress intensity factor produced by the hydrogen pressure, KIP(H2), was also calculated using the FE method, as shown in Figure 8a. With the increase in crack length (2a), KIP(H2) was similar to KIσ, but the growth rate was different. In the range of linear elasticity, there was a good linear relationship between KIP(H2) and KIσ, as shown in Figure 8b and Equation (3).
As the FE calculation method for characterizing hydrogen pressure was complicated, an analytical solution for KIP(H2) using the relevant approximation and correction was necessary for omitting the process of FE simulation. According to Equation (2), there is a linear proportional relationship between KIσ and σ0 in the linear elastic range; thus, Equation (3) could be transformed into Equation (4). The stress intensity factor (KI) produced in the linear elastic range could be directly calculated using Equation (4) without the need for a complex FE simulation.
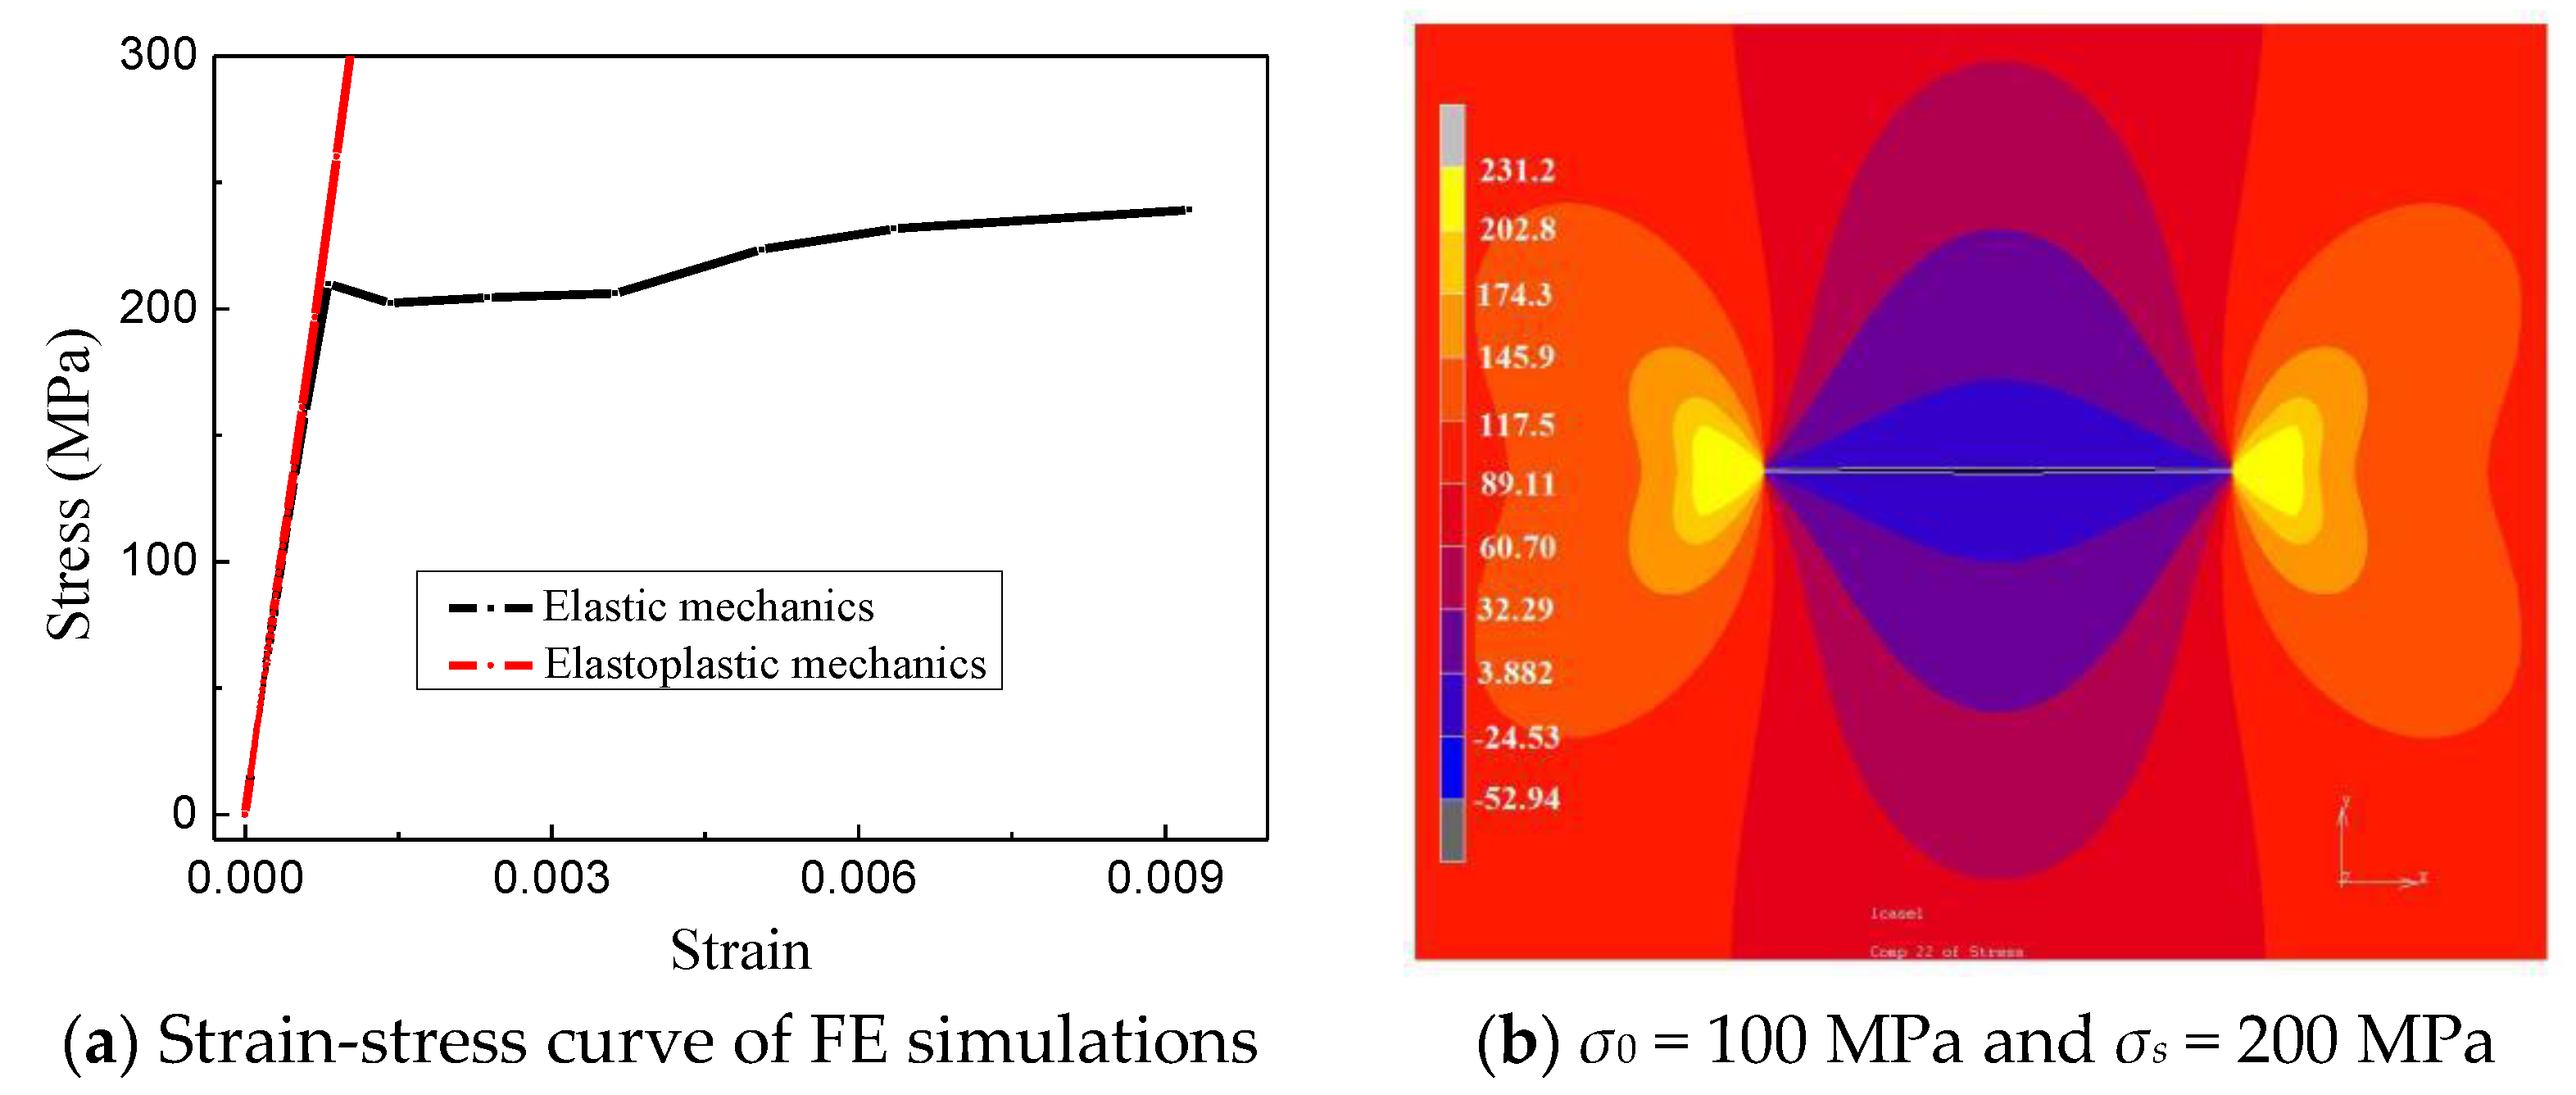
Considering the characteristics of plastic metal materials, when the crack tip stress value was higher than the yield strength (σs), for example, σs = 200 MPa, a plastic zone usually existed at the crack tip, as shown in Figure 9. The plastic zone was the “small range of the yield zone”, as the yield radius was less than 1/10 of the length of the crack. Therefore, the KI expression under the linear elastic model could be modified using the equivalent crack method to apply to the elastoplastic model.
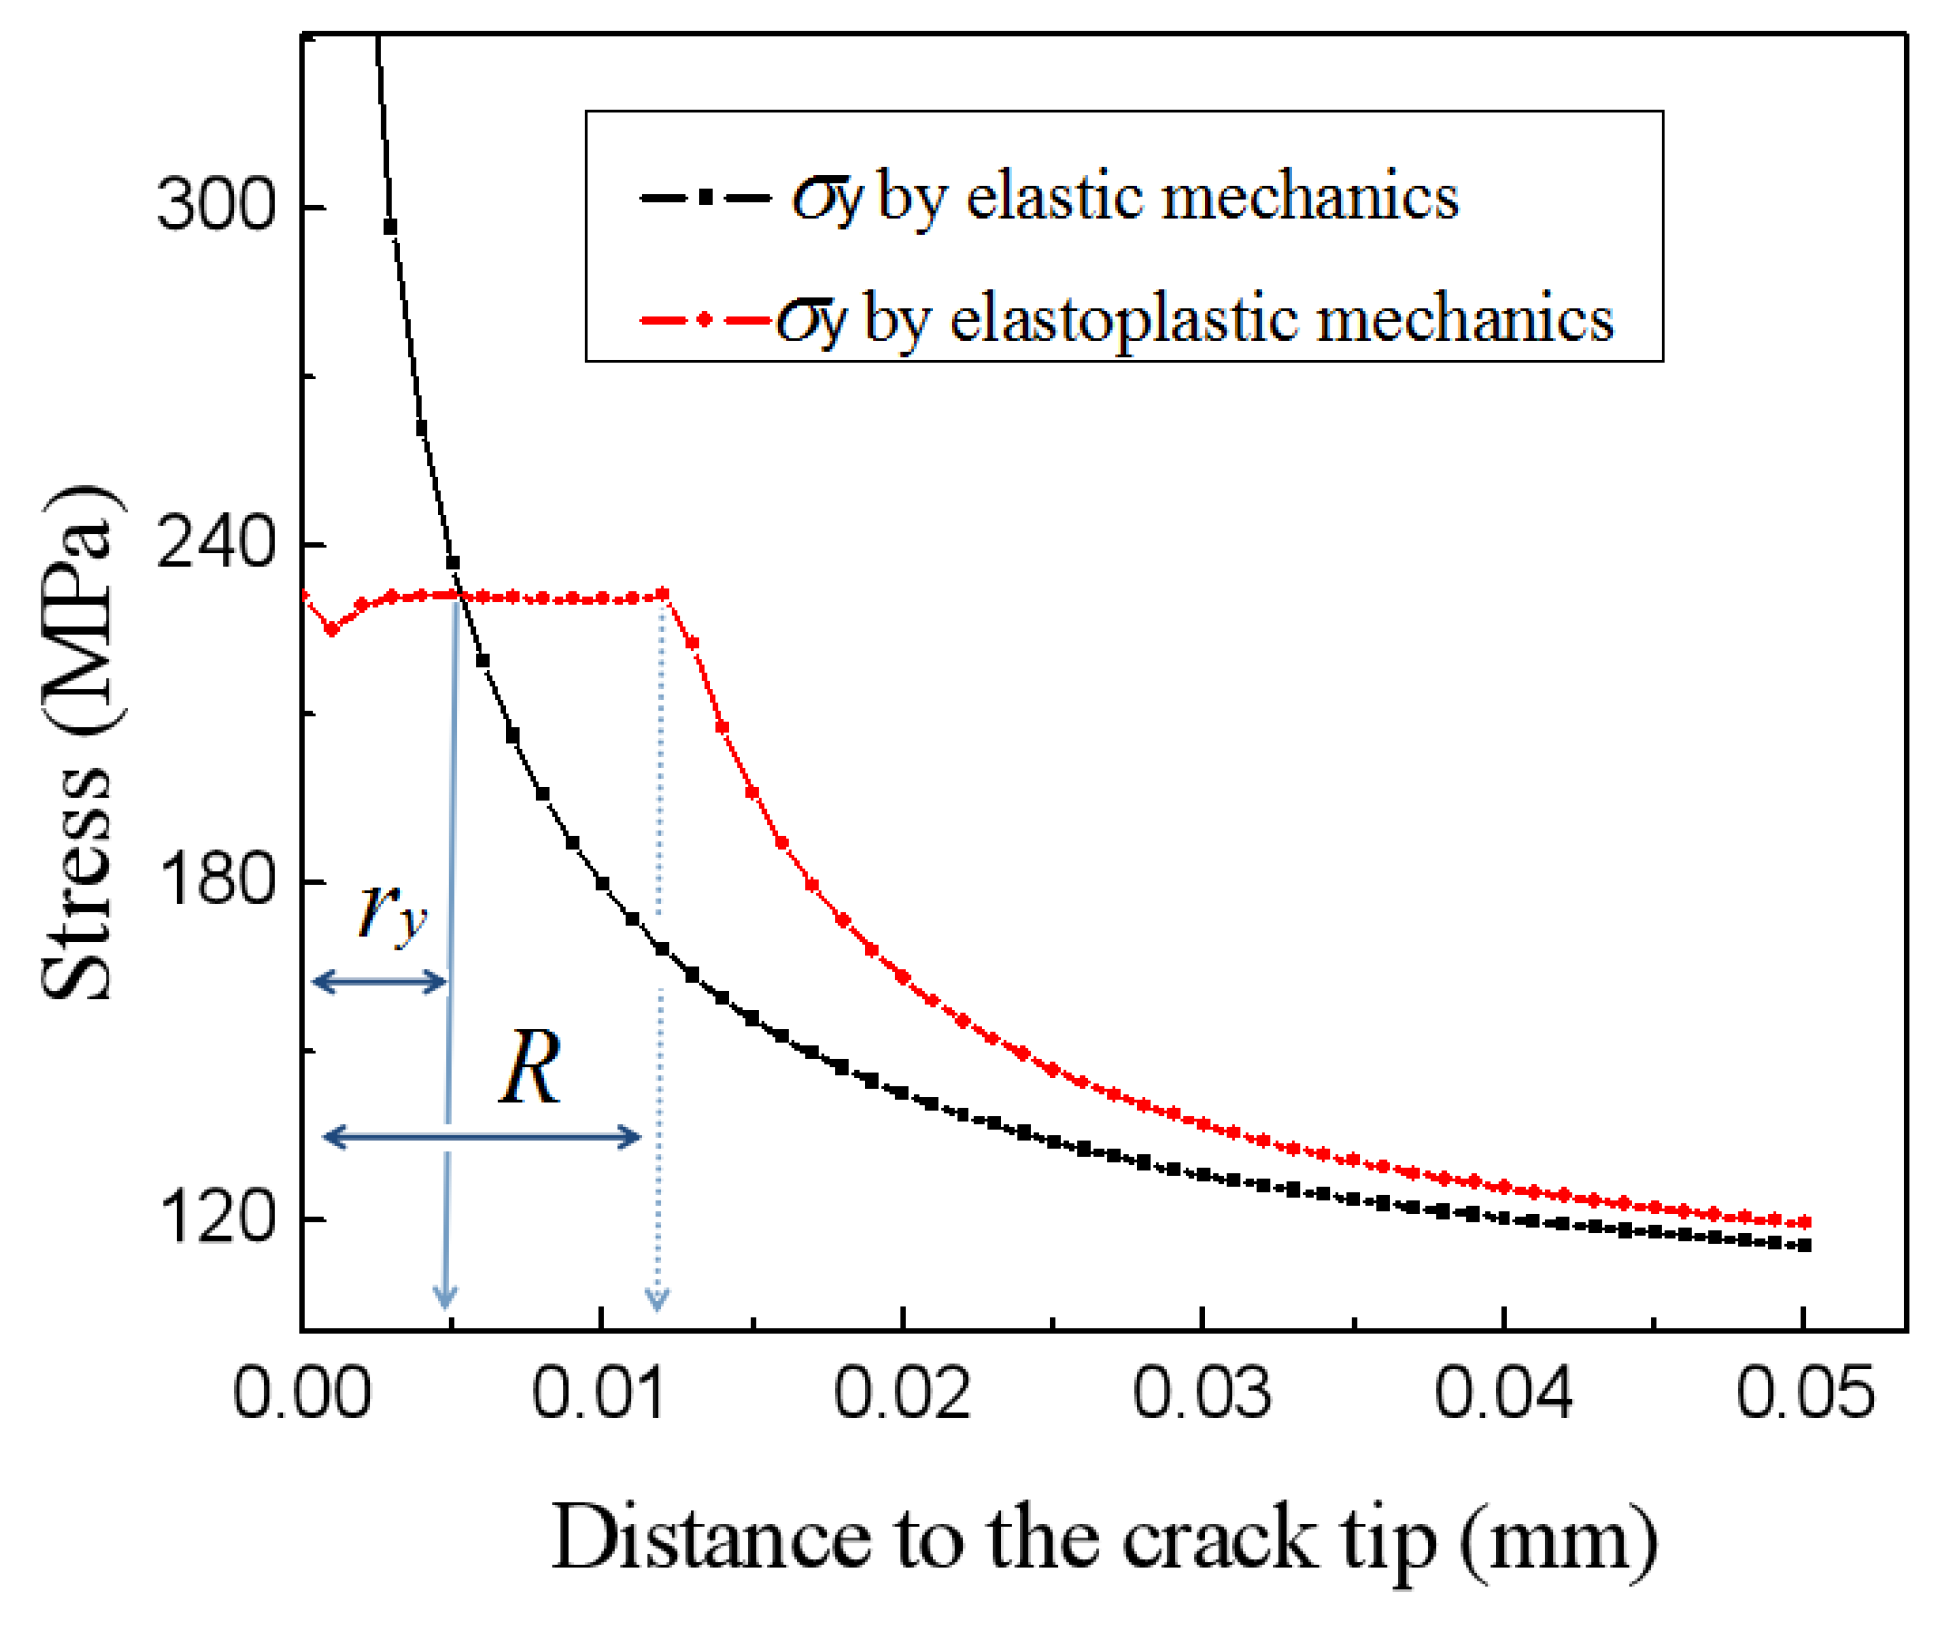
The yield zone radius (ry) was the distance between the intersection point of the elastoplastic stress curve and the elastic stress curve and the crack tip, as shown in Figure 10. According to the equivalent crack method, the KI within the range of elastoplastic mechanics was calculated using Equation (1), so the origin coordinates needed to be moved forward by a distance of ry due to the presence of the plastic zone.
Before calculating KI within the range of elastoplastic mechanics using the FE simulation method, we also needed to verify its accuracy using the theoretical calculation value.
According to fracture mechanics, KI in the elastoplastic range can be calculated using Equations (5) and (6). The length of the real crack in Equation (2) was replaced by the equivalent crack length in Equation (5).
When the yield strength of the material changed, the stress intensity factor also changed. For example, when σ0 was 100 MPa and σs was 200 and 500 MPa, the corresponding KIσ values calculated using the FE simulation method were 1.351 and 1.242 MPa·m1/2, respectively, but those theoretically calculated were 1.329 and 1.266 MPa·m1/2, respectively. The corresponding calculated errors between the calculated and simulated results were 1.64% and 1.87%, respectively, which are within acceptable limits. Therefore, in the plastic stage, the FE simulation method was equivalent to the theoretical method. The errors were caused by the different post-yield work-hardening processes. In the theoretical method, the yield platform was assumed not to increase after the yield, i.e., there was no work-hardening process. However, in the simulation method, the work of the hardening process was considered, and the stress increased after the yield.
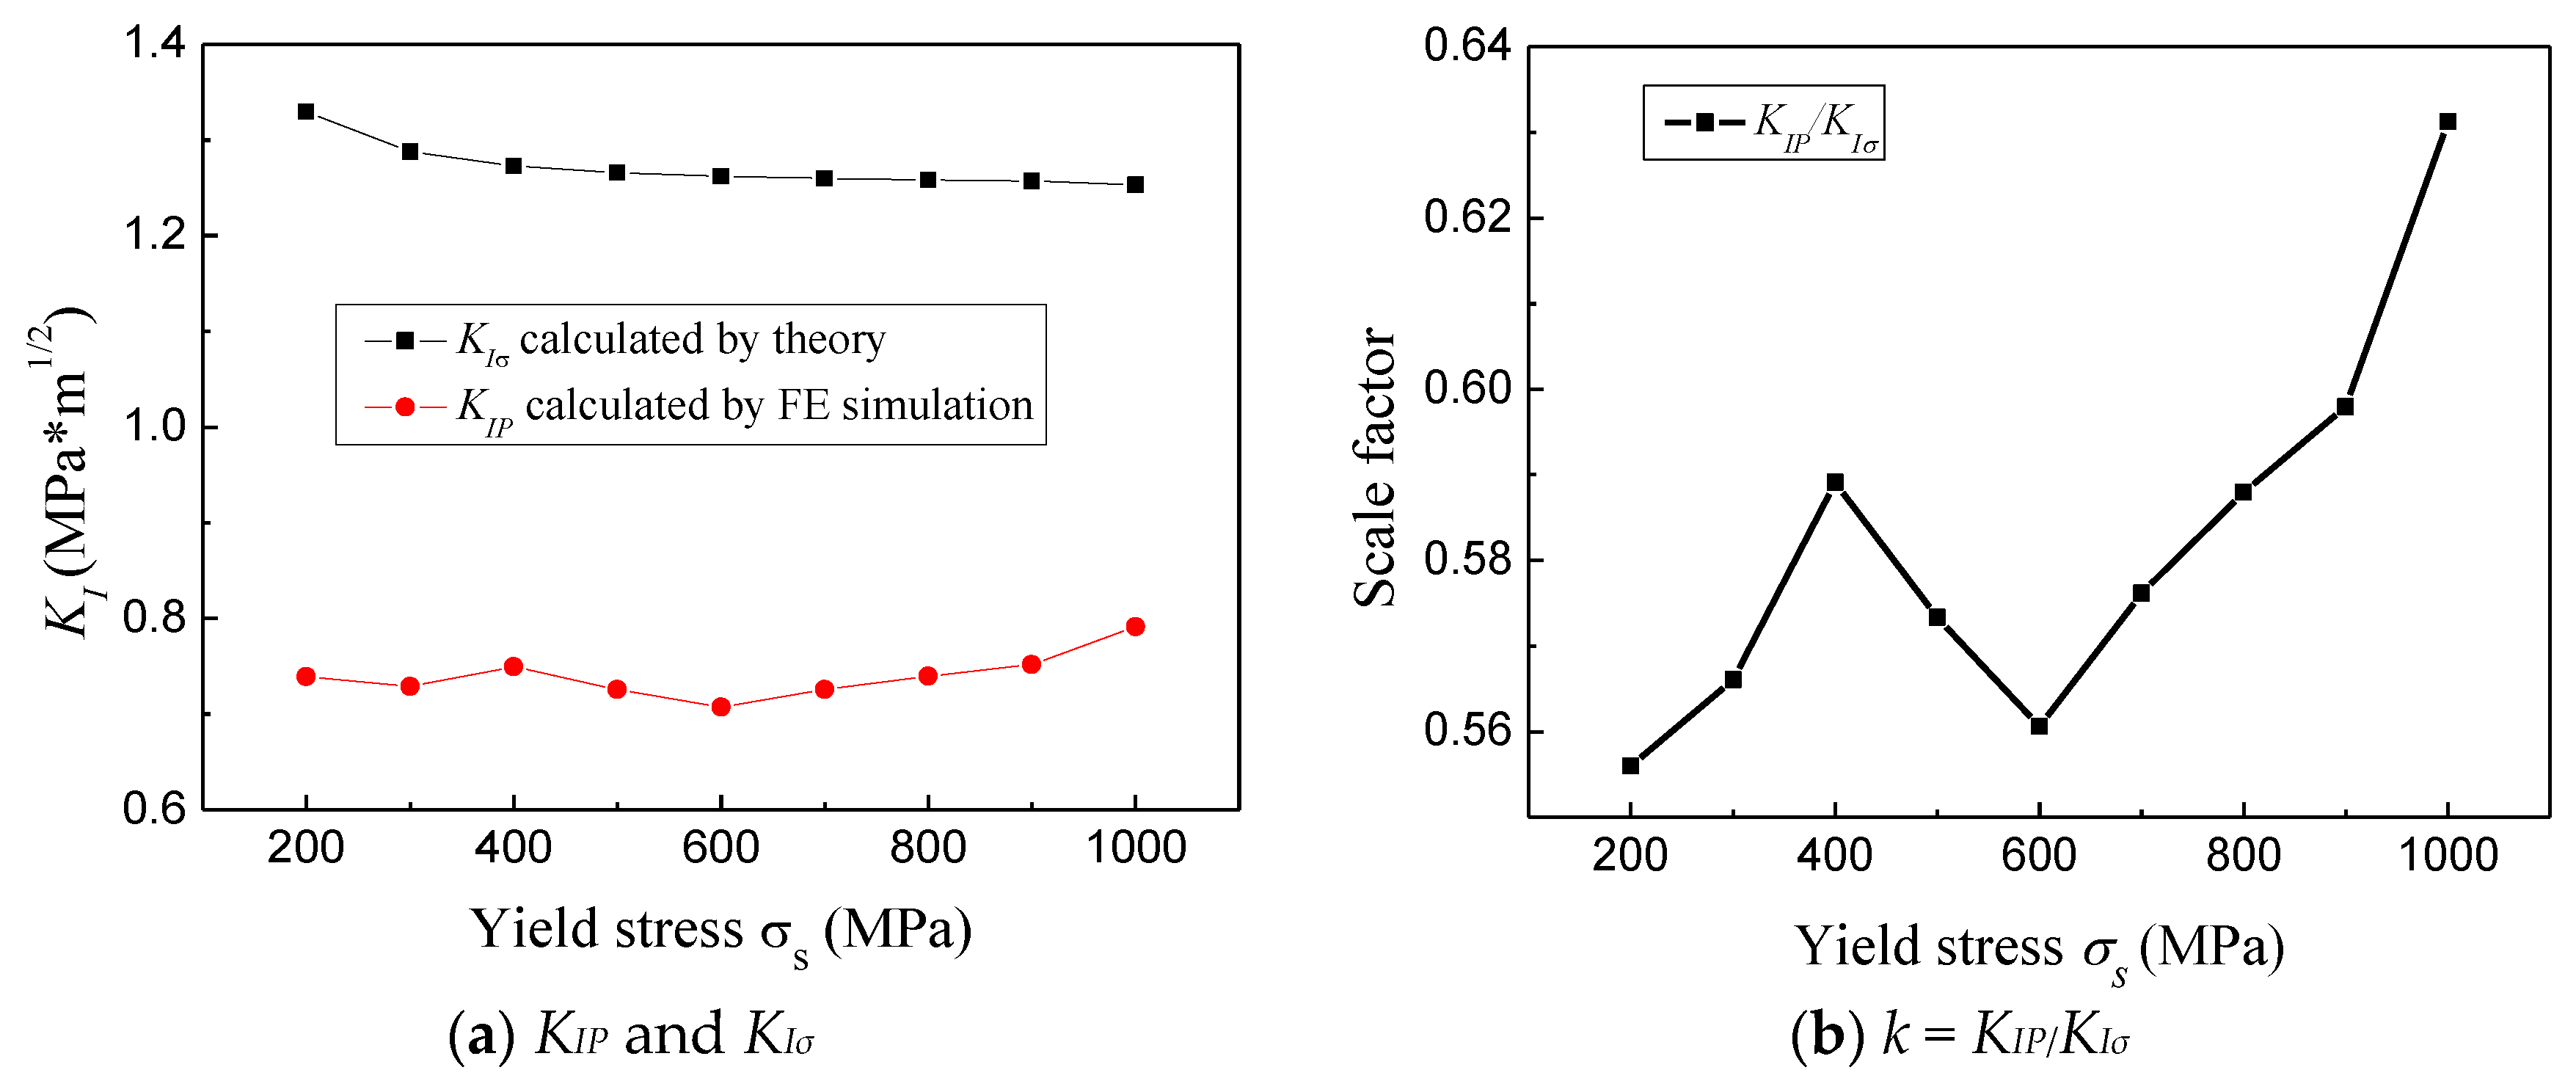
Figure 11a shows the KIσ calculated using the theoretical method and the KIP(H2) obtained via the simulated method in the yield-strength range of 200 to 1000 MPa. The ratio between KIP(H2) and KIσ in Equation (8) was approximately 0.6, and the error was within 7%, as shown in Figure 11b. In the elastoplastic condition, calculating the theoretical KI in Equation (7) required a few approximations, as indicated by Equations (8) and (9), where the hydrogen pressure and tensile stress are combined.
3. Embrittlement Effect of Hydrogen Atom
3.1. Embrittlement Experiment
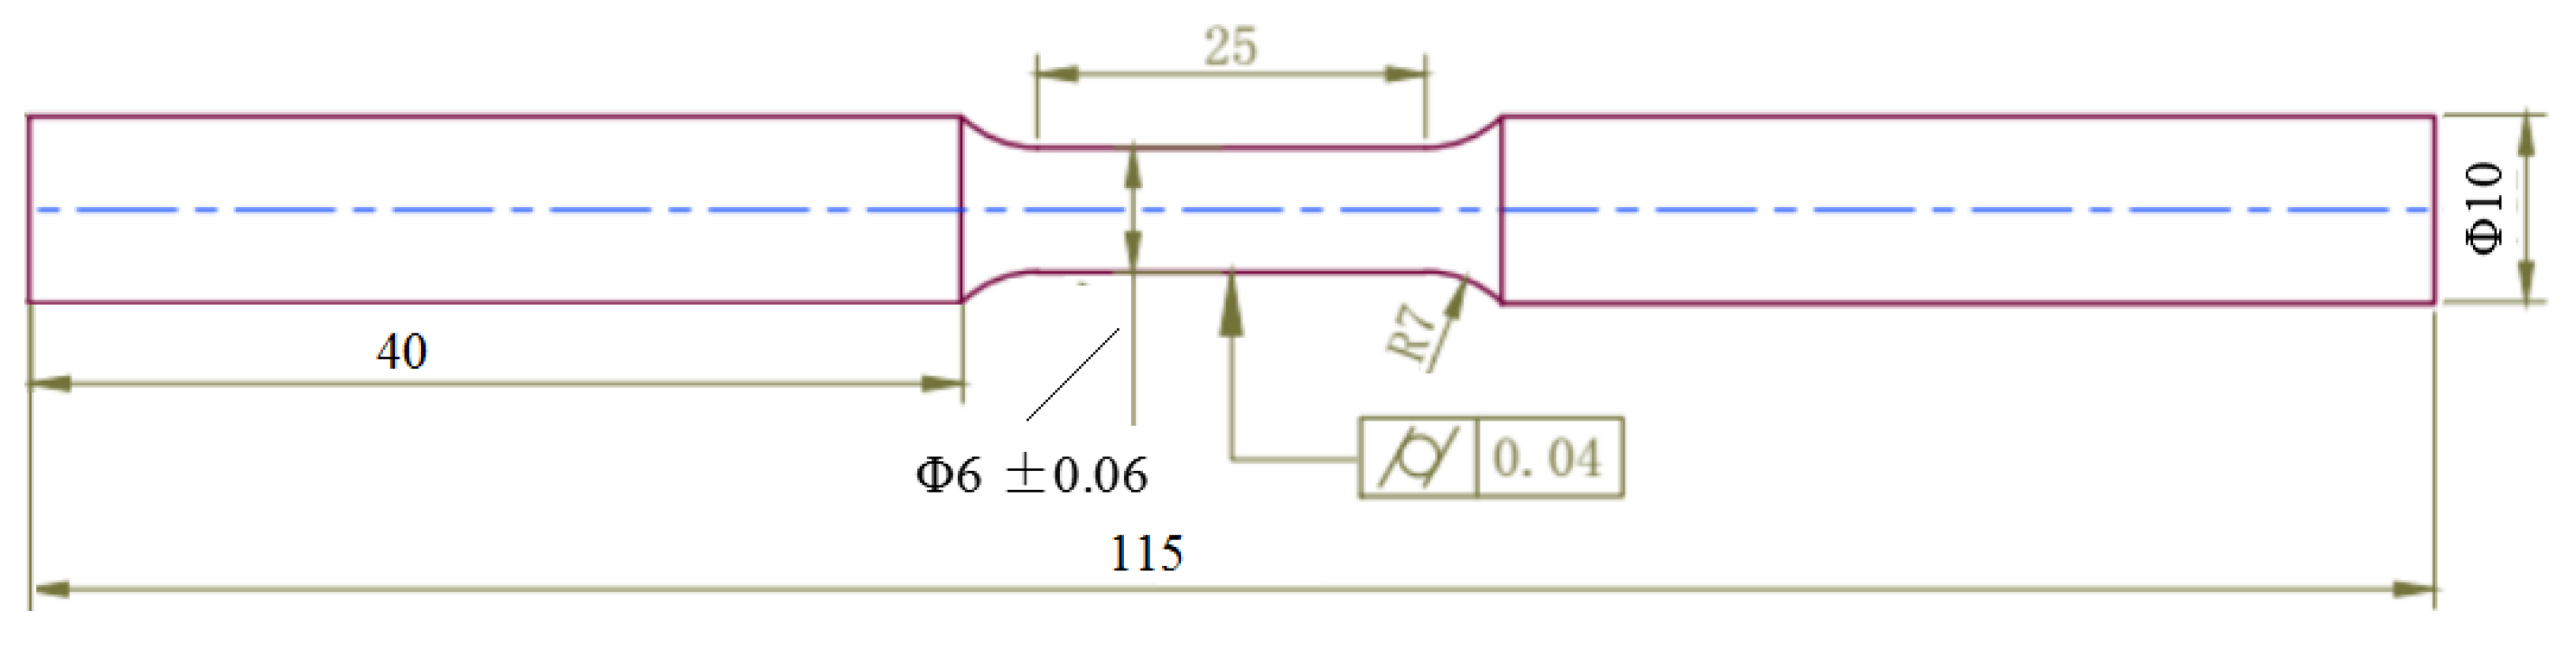
The HIC formation criterion in this paper demonstrated that fracture toughness is the indicator of the material resistance to crack propagation. According to fracture mechanics theory, the plastic properties of materials are closely related to the magnitude of the fracture toughness [8]. The material embrittlement, due to the presence of hydrogen, determines the effect of hydrogen on the fracture toughness. The purpose of this experiment was to confirm the embrittlement effect of hydrogen, which is universal in steel materials. Sheets of cold-rolled E235B steel were electrolytically charged with hydrogen and prepared for tensile testing. Typical tensile specimen geometries with a circular cross-section were used for the tensile tests based on the ISO 6892:1998 standard, as shown in Figure 12. The specimens were hydrogenated in a 0.5 mol/L H2SO4 + 0.5 g/L NaAsO2 solution. The hydrogen was charged at an applied current density of 5 mA/cm2. A glycerol diffusion hydrogen analyzer was used to measure the diffused hydrogen content in the specimens based on the ISO 3690:2000 standard. Tensile tests were performed at rates of 2.8 × 10⁻³ s−1 at 20 °C.
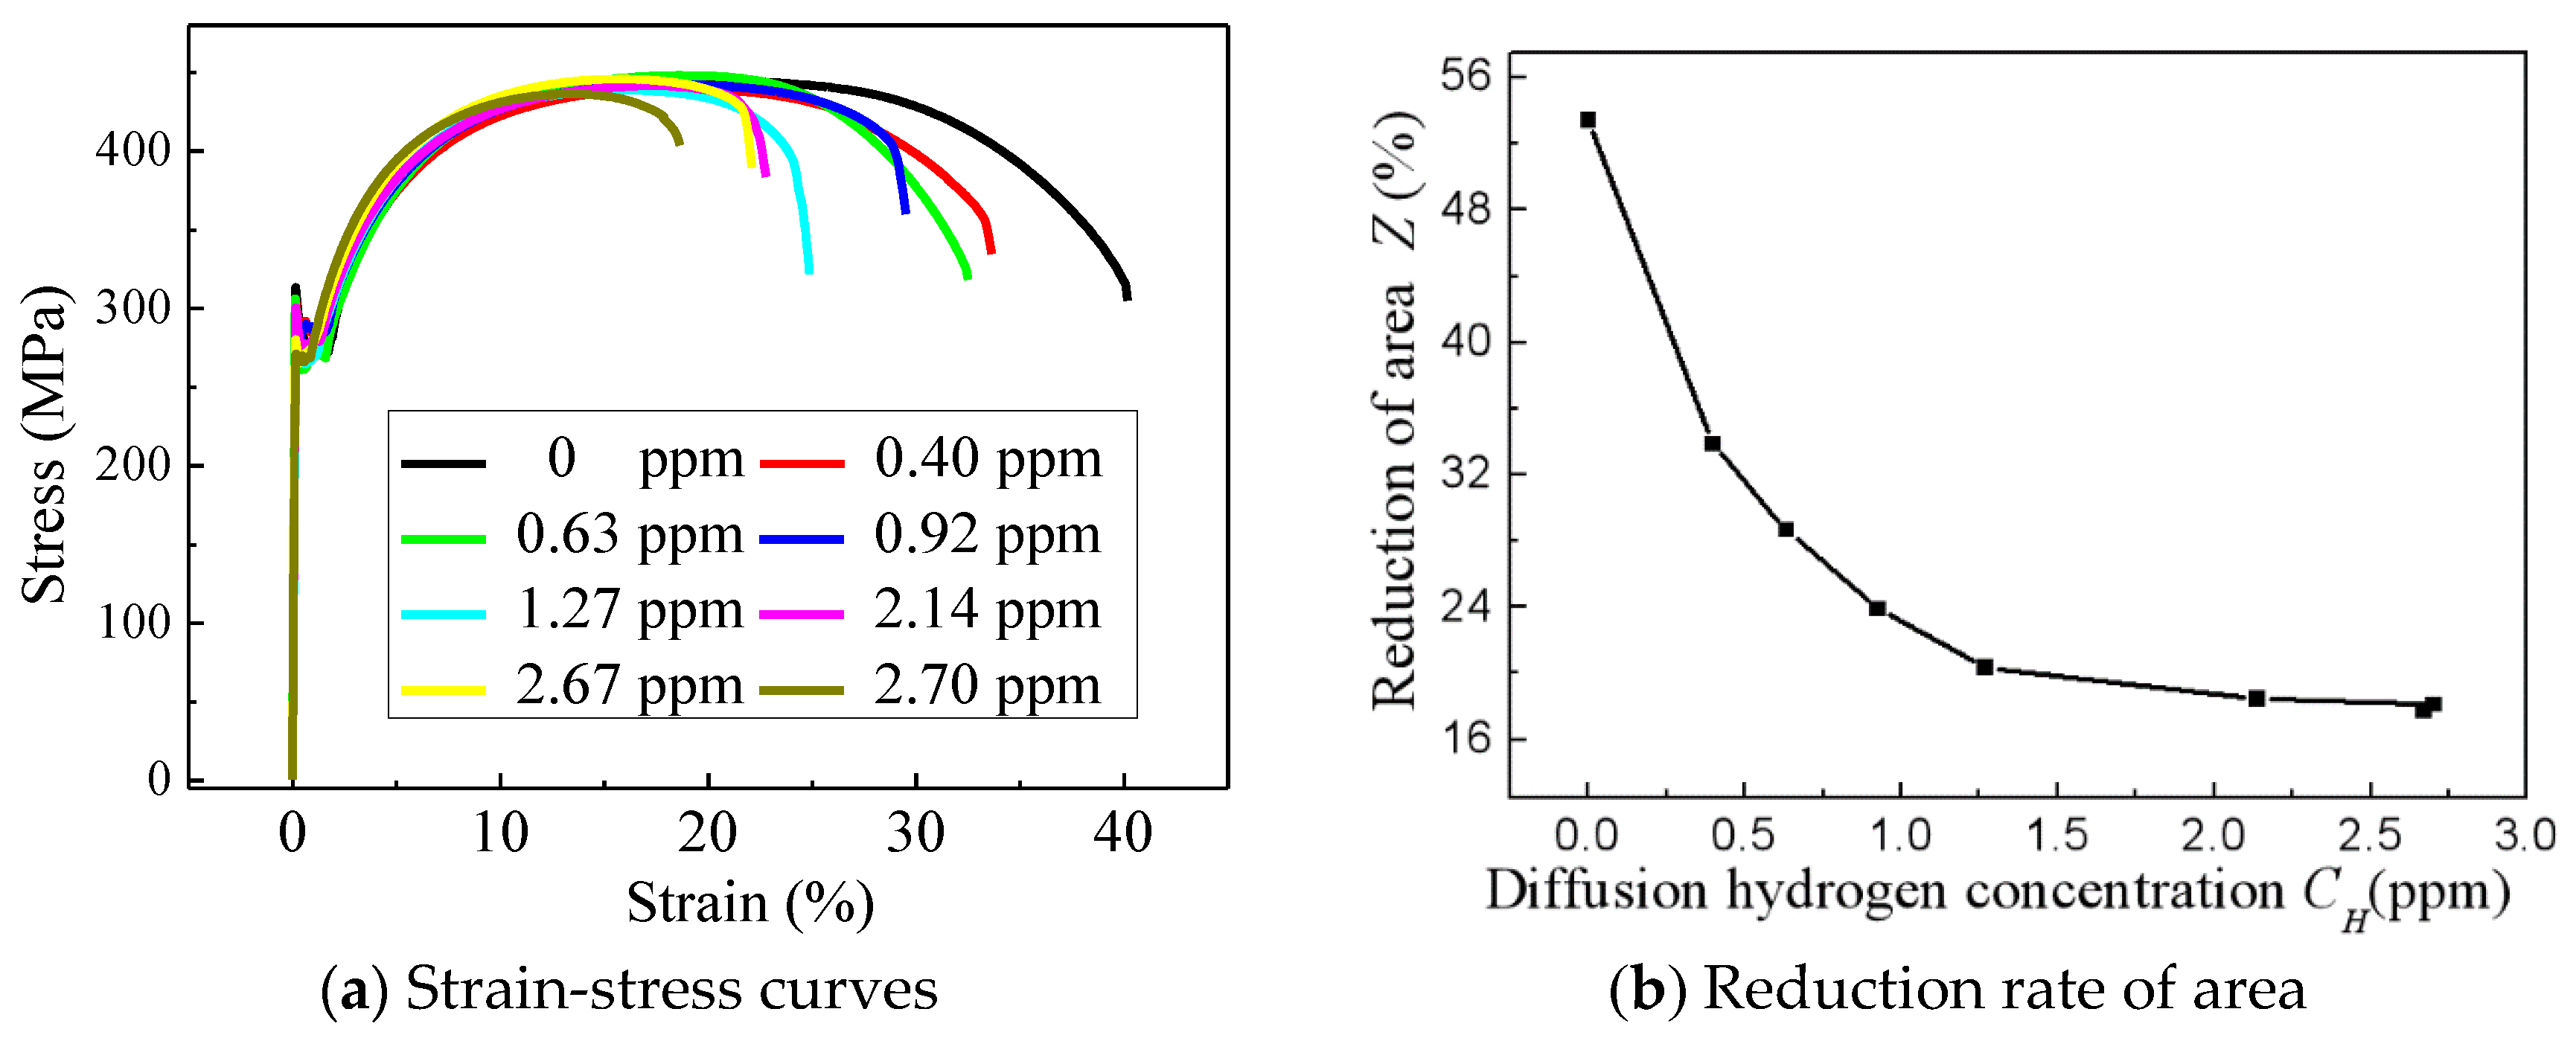
The necking phenomenon near the fracture of the specimen is an important reference to judge the plasticity of the material. Thus, the reduction rate in area was selected as the indicator of the plastic deformation ability. It decreased with the increase in the diffusion hydrogen concentration, as shown in Figure 13. When the diffusion hydrogen concentration was higher than 1.5 ppm, the reduction rate in area changed slowly and tended to be stable. This means that the effect of hydrogen on the plastic deformation energy declined rapidly and then stabilized.
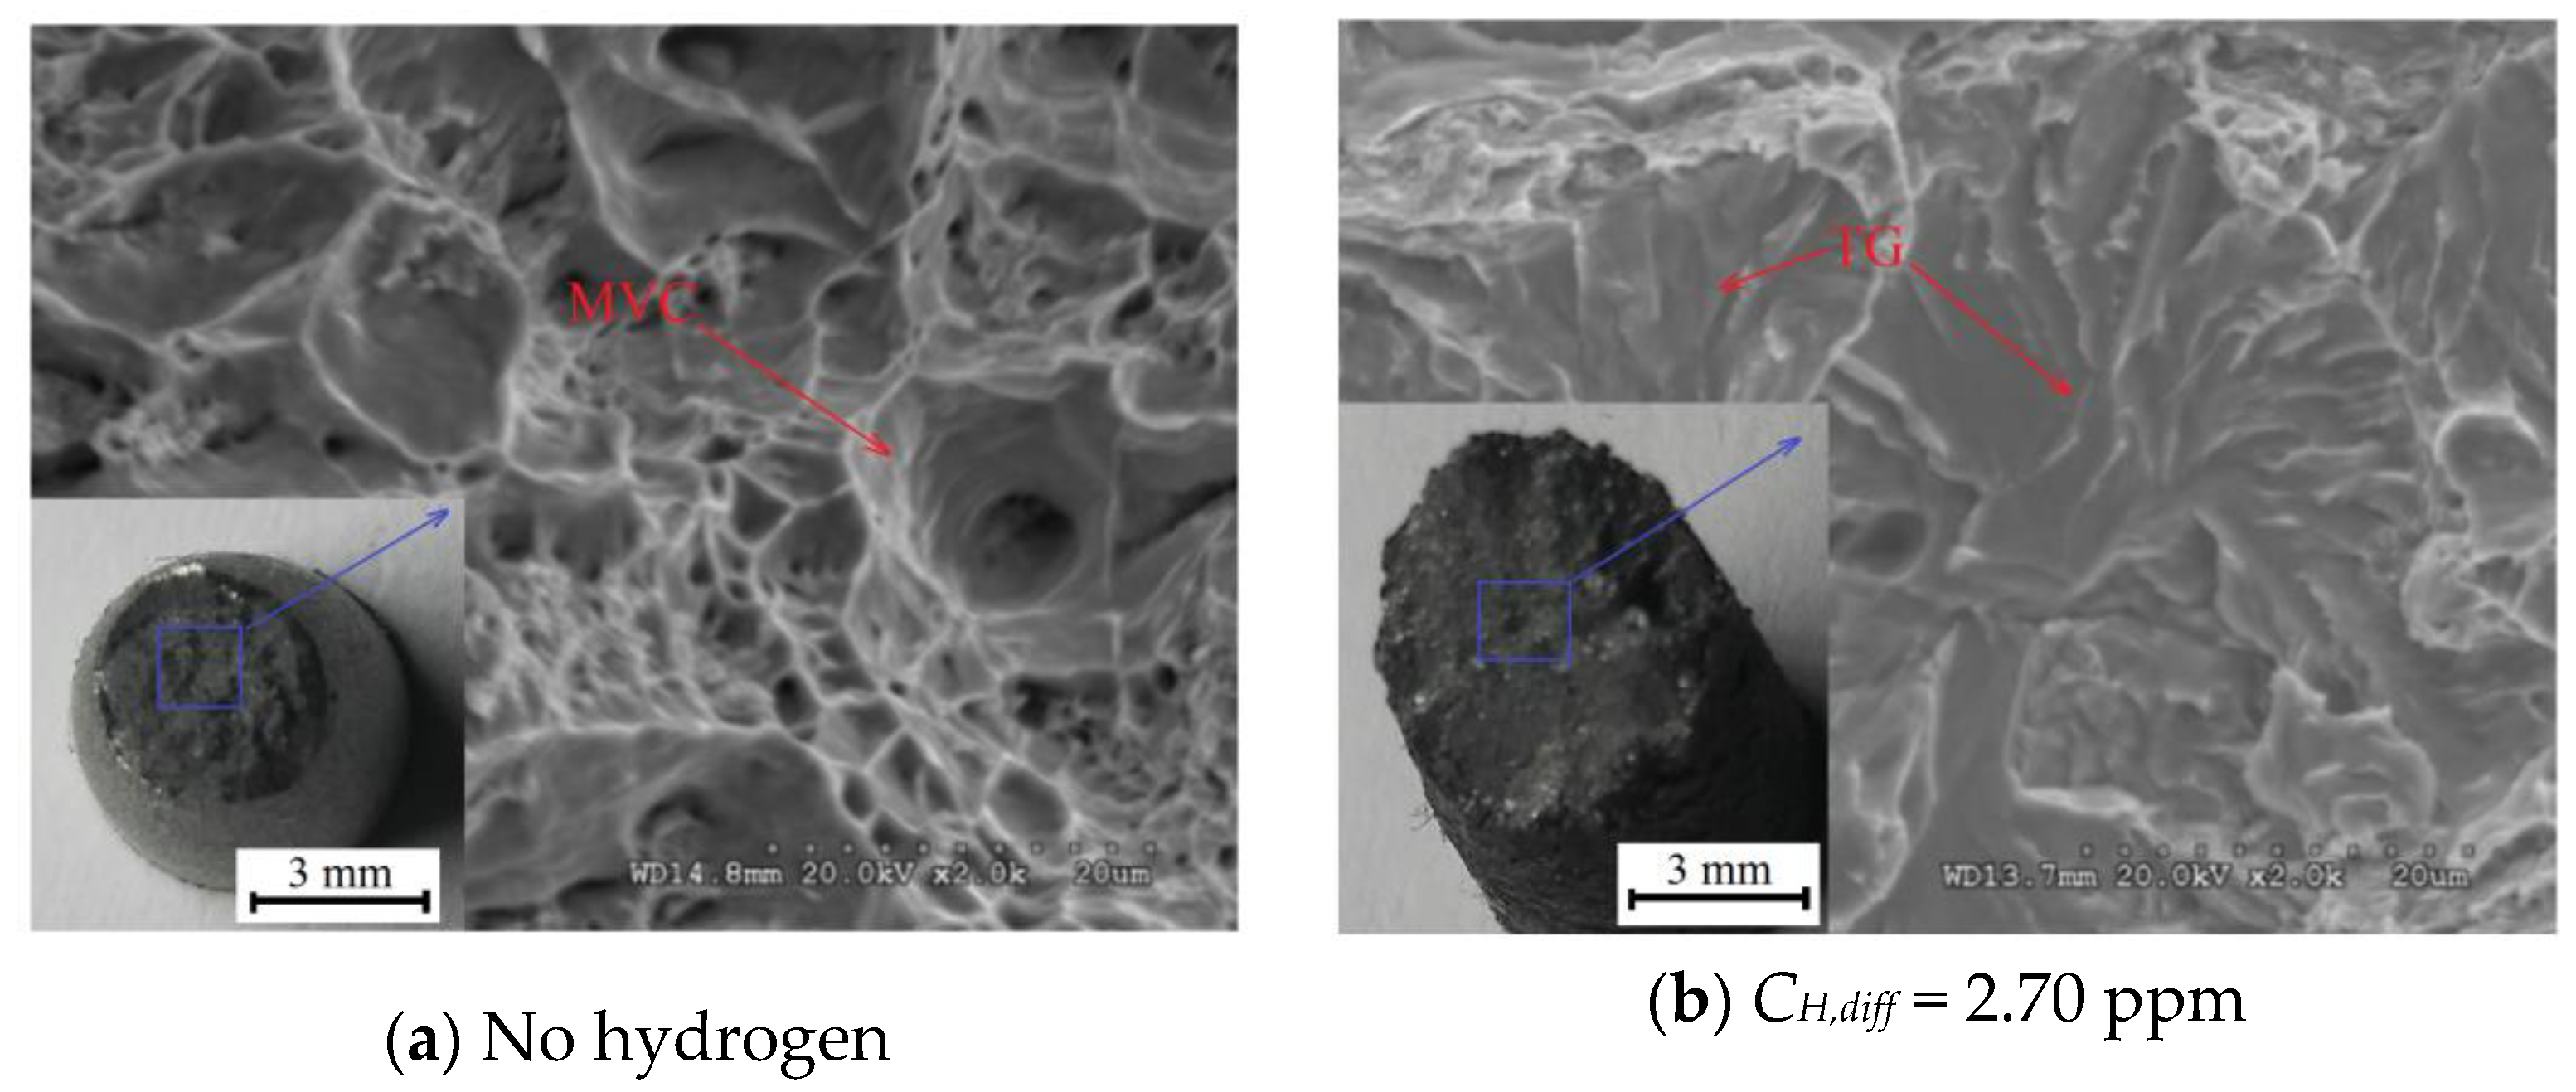
The fracture surfaces of the mechanical specimens were then observed under a scanning electron microscope (SEM) to examine the differences in the brittleness behavior between the hydrogenated and hydrogen-free specimens. SEM images of the fracture surfaces with hydrogen (Figure 14) exhibited TG cleaved failure characteristics corresponding to the curve in Figure 13. The fracture of the specimen without hydrogen occurred via MVC over the entire surface.
The changes in the material properties and fracture morphology confirmed the embrittlement effect of the hydrogen atoms in the materials. These changes also elucidated the dislocation behavior during molecular dynamics (MD) simulations.
3.2. Embrittlement Mechanism According to MD Simulation
One method for observing the changes in the distribution of atoms at the crack tip in the process of crack expansion in order to study the causes of embrittlement and HIC formation is MD simulation, as shown in Figure 15 and Figure 16. Although Song et al. obtained similar results using MD simulation [29], the 2D models were more likely to observe the formation process of crack tip dislocation zone, so the results in this paper are more intuitive.
The crack models used were 2D models at a low temperature (‒243 °C), for easily observing the movement of atoms. The system without hydrogen contained 3867 iron atoms, and the system with hydrogen contained 5761 atoms, including 1894 hydrogen atoms. Hydrogen atoms were located at the center of the tetrahedral gap in the body-centered cubic lattice. The lengths of the unit cell in the [1 0 0], [0 1 0], and [0 0 1] directions were 14.3, 14.3, and 0.286 nm, respectively, with a 3.0 × 10⁻¹⁵ s−1 time increment for a total of 20,000 steps. The crystallographic orientation was parallel to the axis, allowing observation of the production of the edge dislocations. The arc transition mode was used to describe the shape of the crack tip. The crack tip radius was 1.144 nm, and the half-length (a) was 3.432 nm. The uniaxial tensile velocity applied for the model was 30 m/s along the [0 1 0] direction. An energy minimization operation was required before stretching.
According to fracture mechanics, for a model with a cracked structure subjected to load, the solution of the stress intensity factor (KI) is given by Equation (10) [30]. The fracture toughness value can be obtained by recording the critical stress intensity factor when the crack propagates.
where α is the correction factor. In the case of this model, α = 1.12.
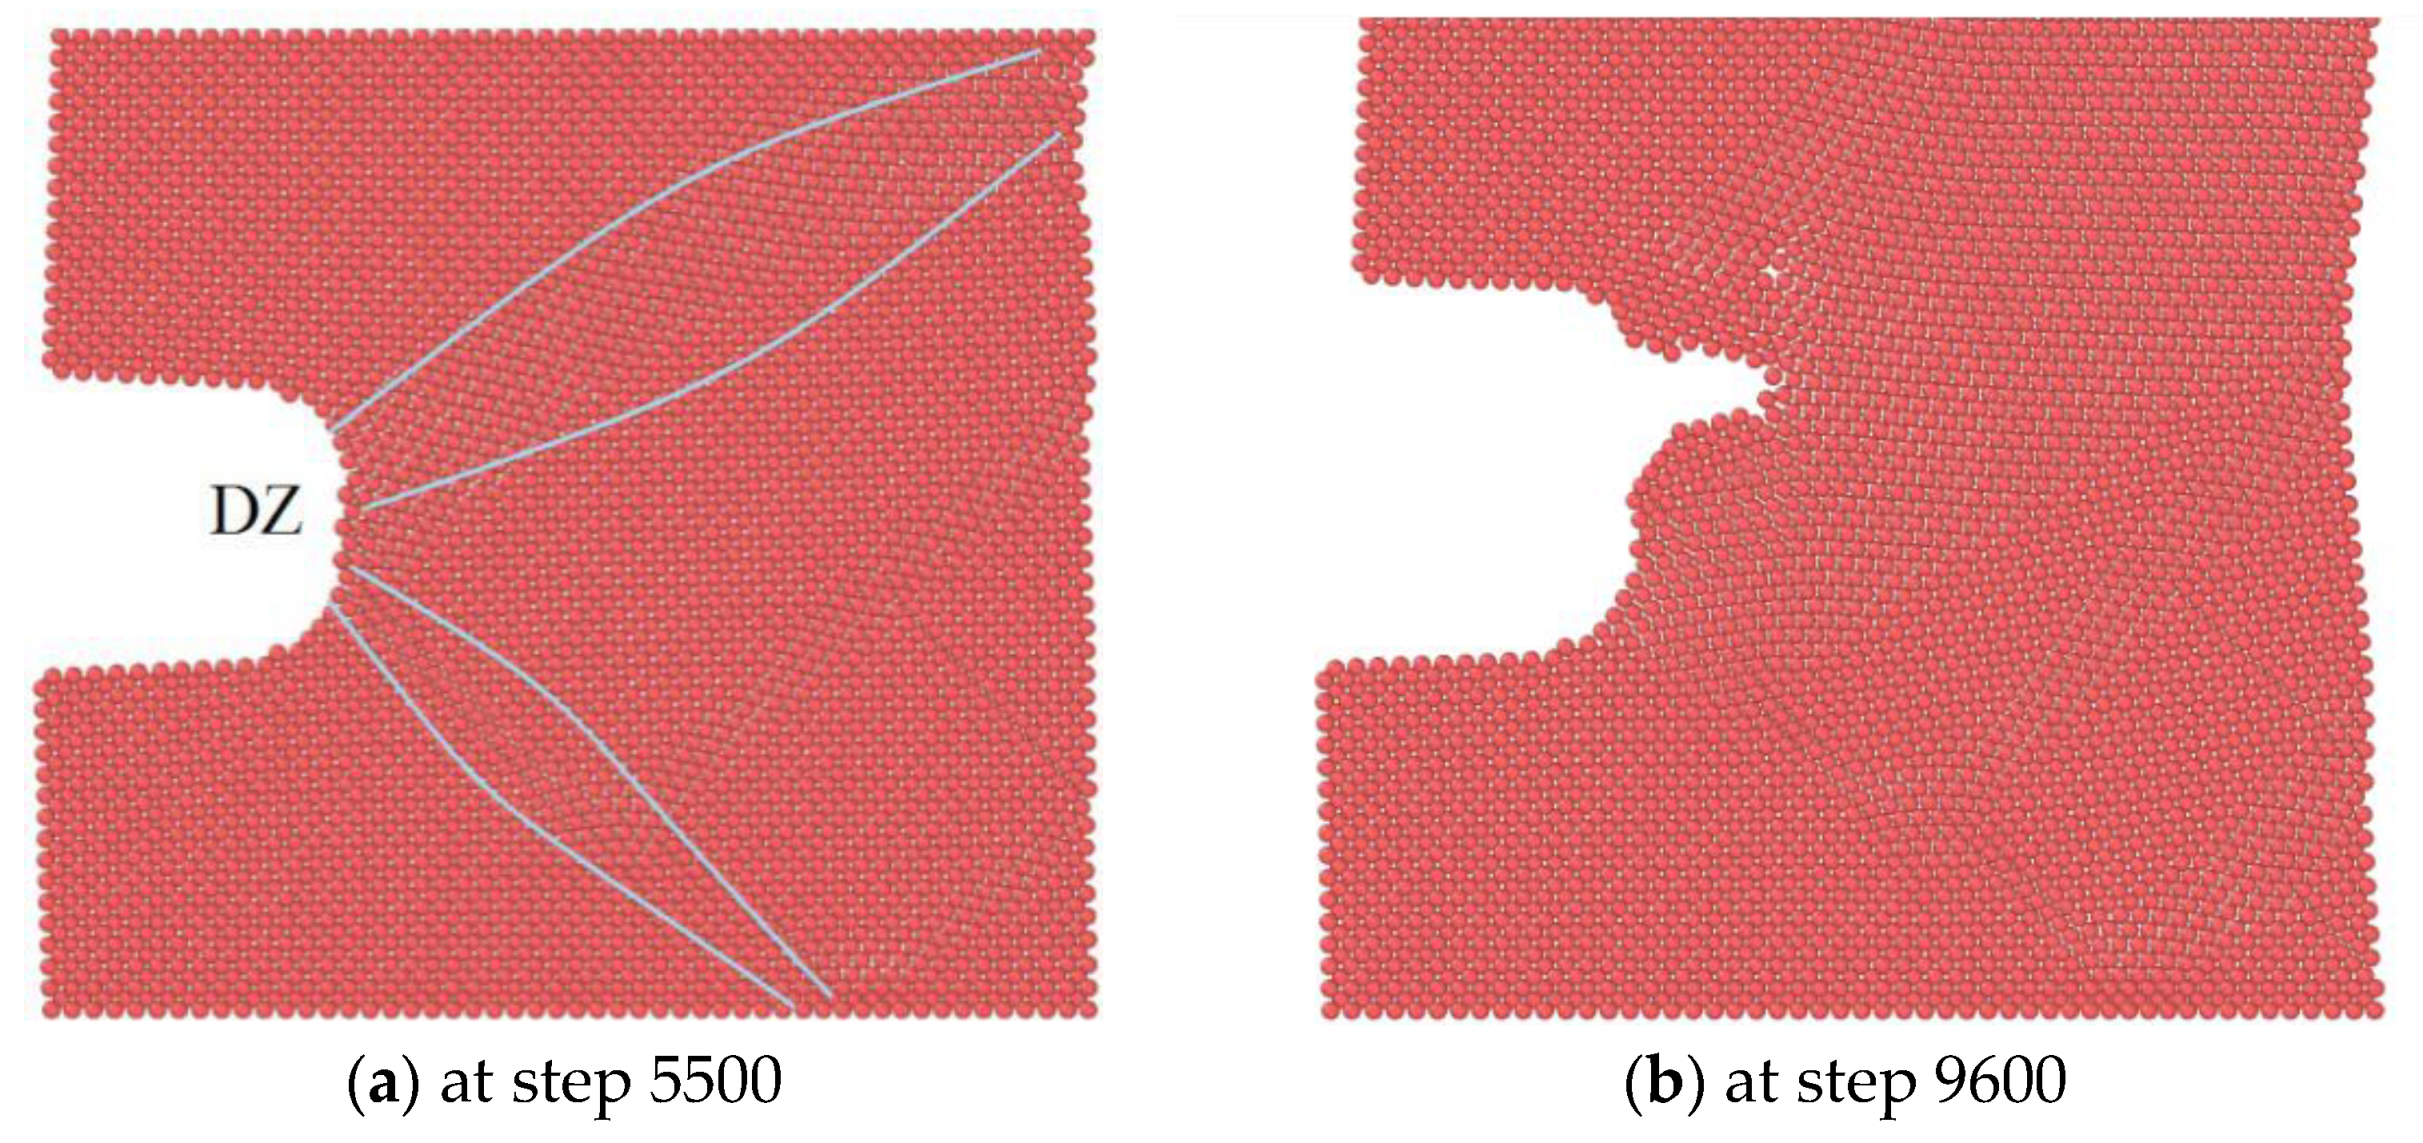
The atomic distributions of the hydrogen-free specimen according to the MD simulation during stretching are shown in Figure 15. During the expansion of the crack, the atoms in the upper right and the lower right of the crack tip were first misplaced and formed dislocations. The atoms slipped along the dense surface of the crystal, forming narrow dislocation zones, where the stress and strain concentration regions at the crack tip occurred.
As the plastic deformation of the crack tip reached the cracking critical value, the crack exhibited unstable expansion. Thus, the starting position of the crack expansion occurred in the dislocation zones. The result of the cross-section analysis was thought to be a dimple-shaped ductile fracture, according to theory. The fracture toughness of the specimen without hydrogen was 0.41 MPa·m1/2 according to Equation (10). This simulation results were in agreement with the cracking theory for tough materials.
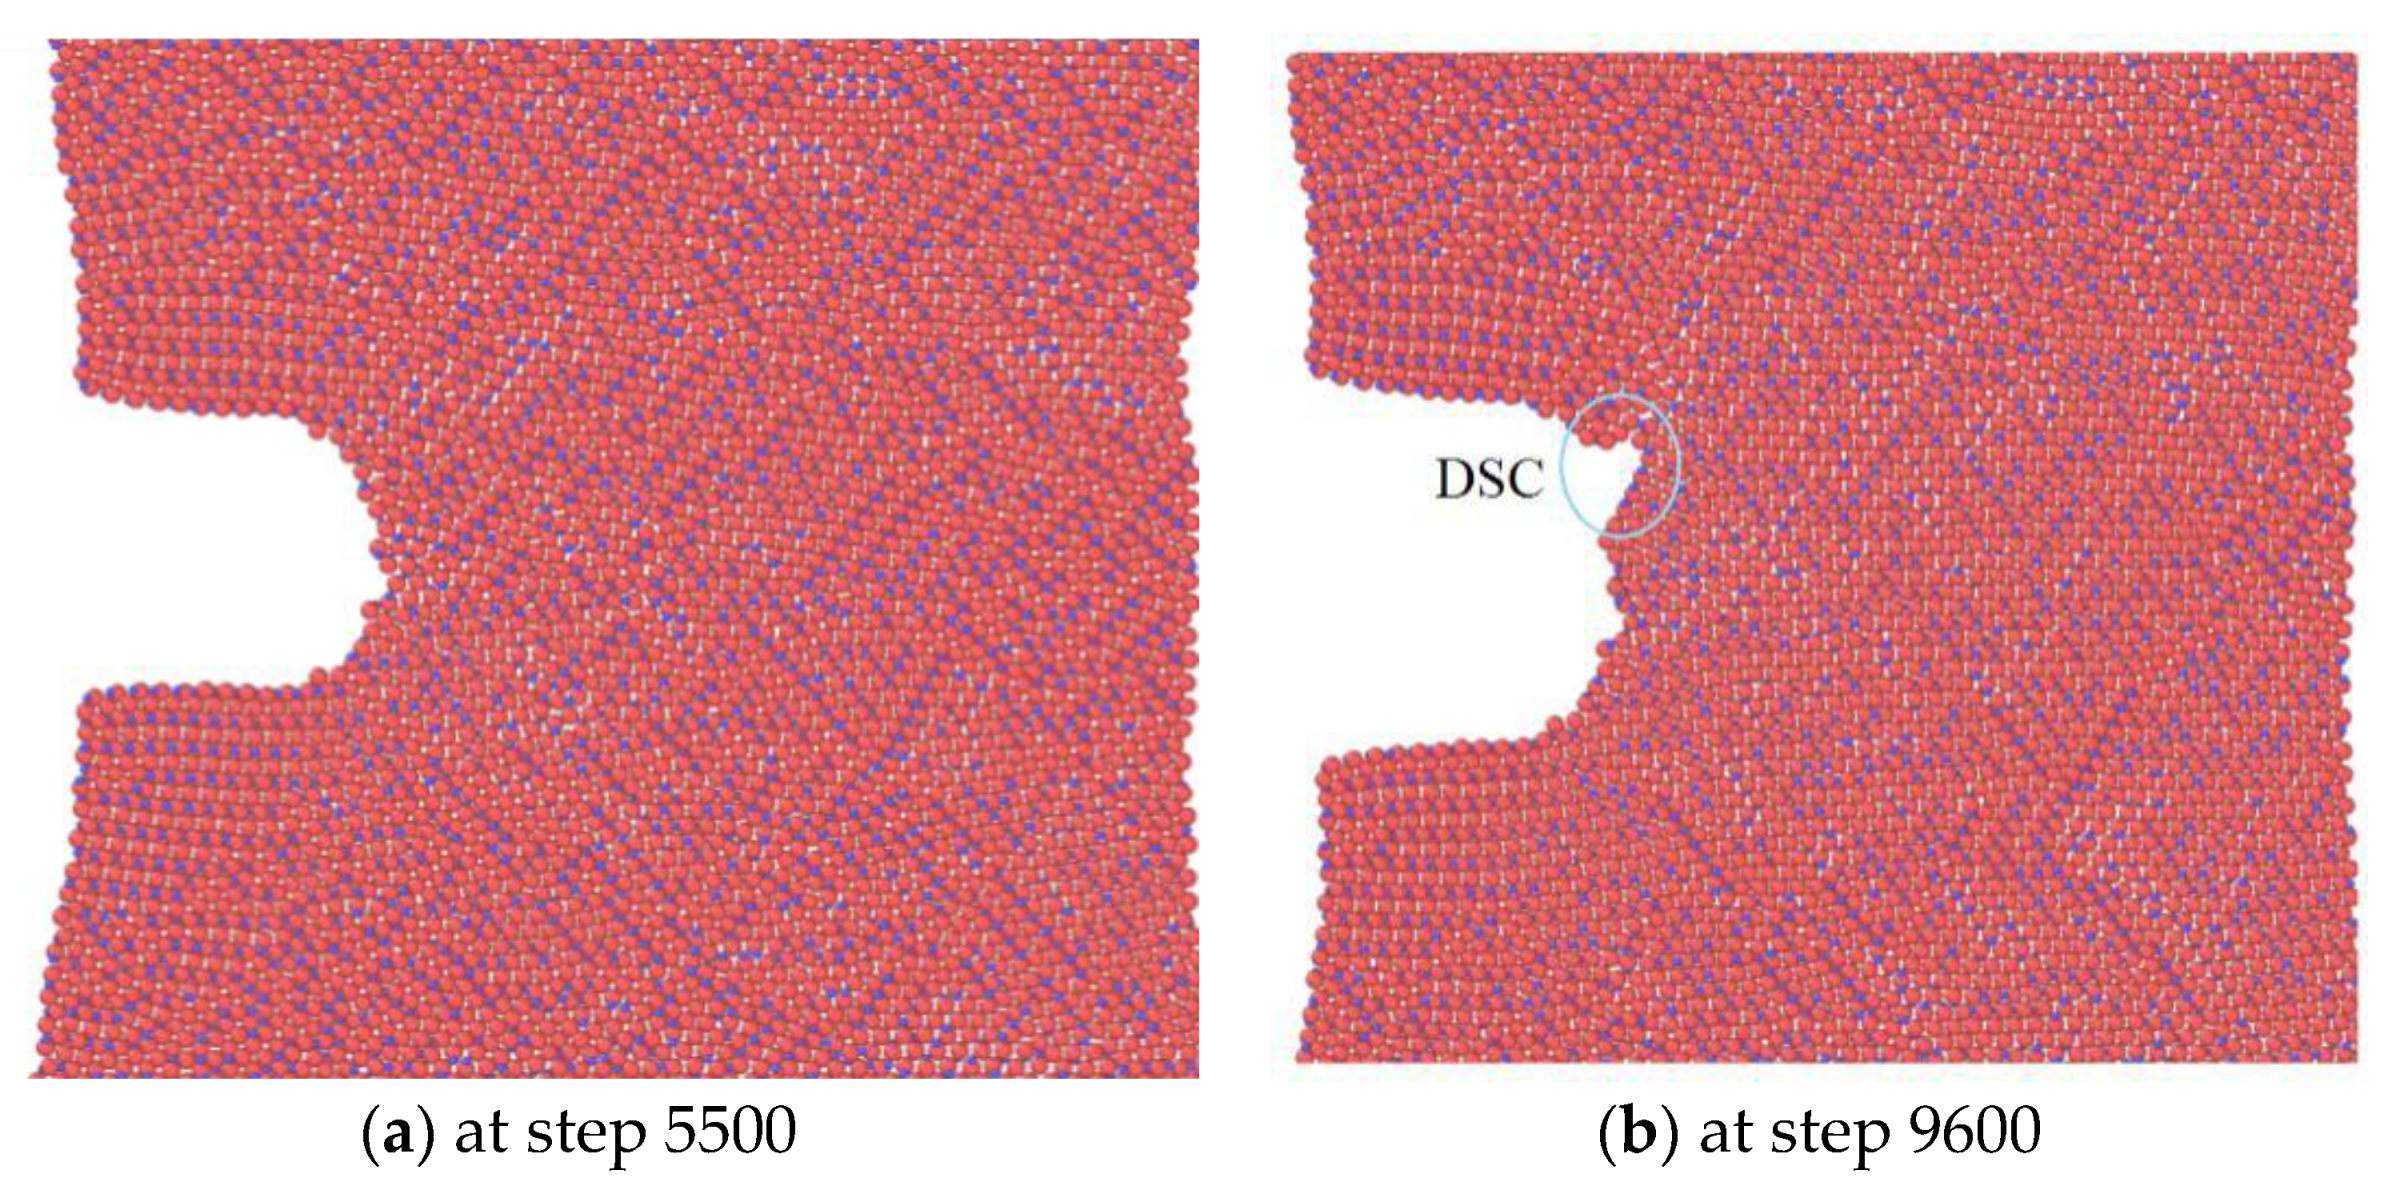
Energy minimization was performed for the hydrogen-charged specimen. In the process of crack expansion, we did not find a significant dislocation region in the crack tip with hydrogen, indicating that the presence of hydrogen inhibited the emission of dislocations. The initial mechanism of crack propagation slipped along the dense surface of the crystal. Therefore, the crack surface was thought to be a cleavage fracture surface. As the emission of dislocations was inhibited by hydrogen, the crack propagation changed from tearing at the dislocation zone to slipping along the densely-packed surface. The fracture toughness of the specimen with hydrogen was 0.37 MPa·m1/2 according to Equation (10), which was lower than that of the specimen without hydrogen.
If hydrogen atoms diffuse into the reversible trap at the front of the crack tip, the dislocation emission is suppressed, and the material toughness worsens. The energy consumed for crack propagation was reduced along with the fracture toughness. The fracture changed from toughness dimple fracture to brittleness cleavage fracture, as shown in Figure 16.
4. Theory of HIC Formation Criterion
4.1. Criterion of HIC Formation
The loading and embrittlement of hydrogen was systematically studied through experiments and simulations in this paper. However, until now, there has been no criterion of HIC formation that considered the two effects of hydrogen.
In this paper, we proposed a new criteria through modifying the classic stress intensity factor criteria in the theory of fracture mechanics. We used hydrogen pressure as a new load, together with the applied load acting as a driving force for crack propagation. When the driving force was higher than the material resistance, the crack exhibited unstable expansion.
The hydrogen in the material had two functions: increasing the load and reducing the resistance, as indicated by the following equation:
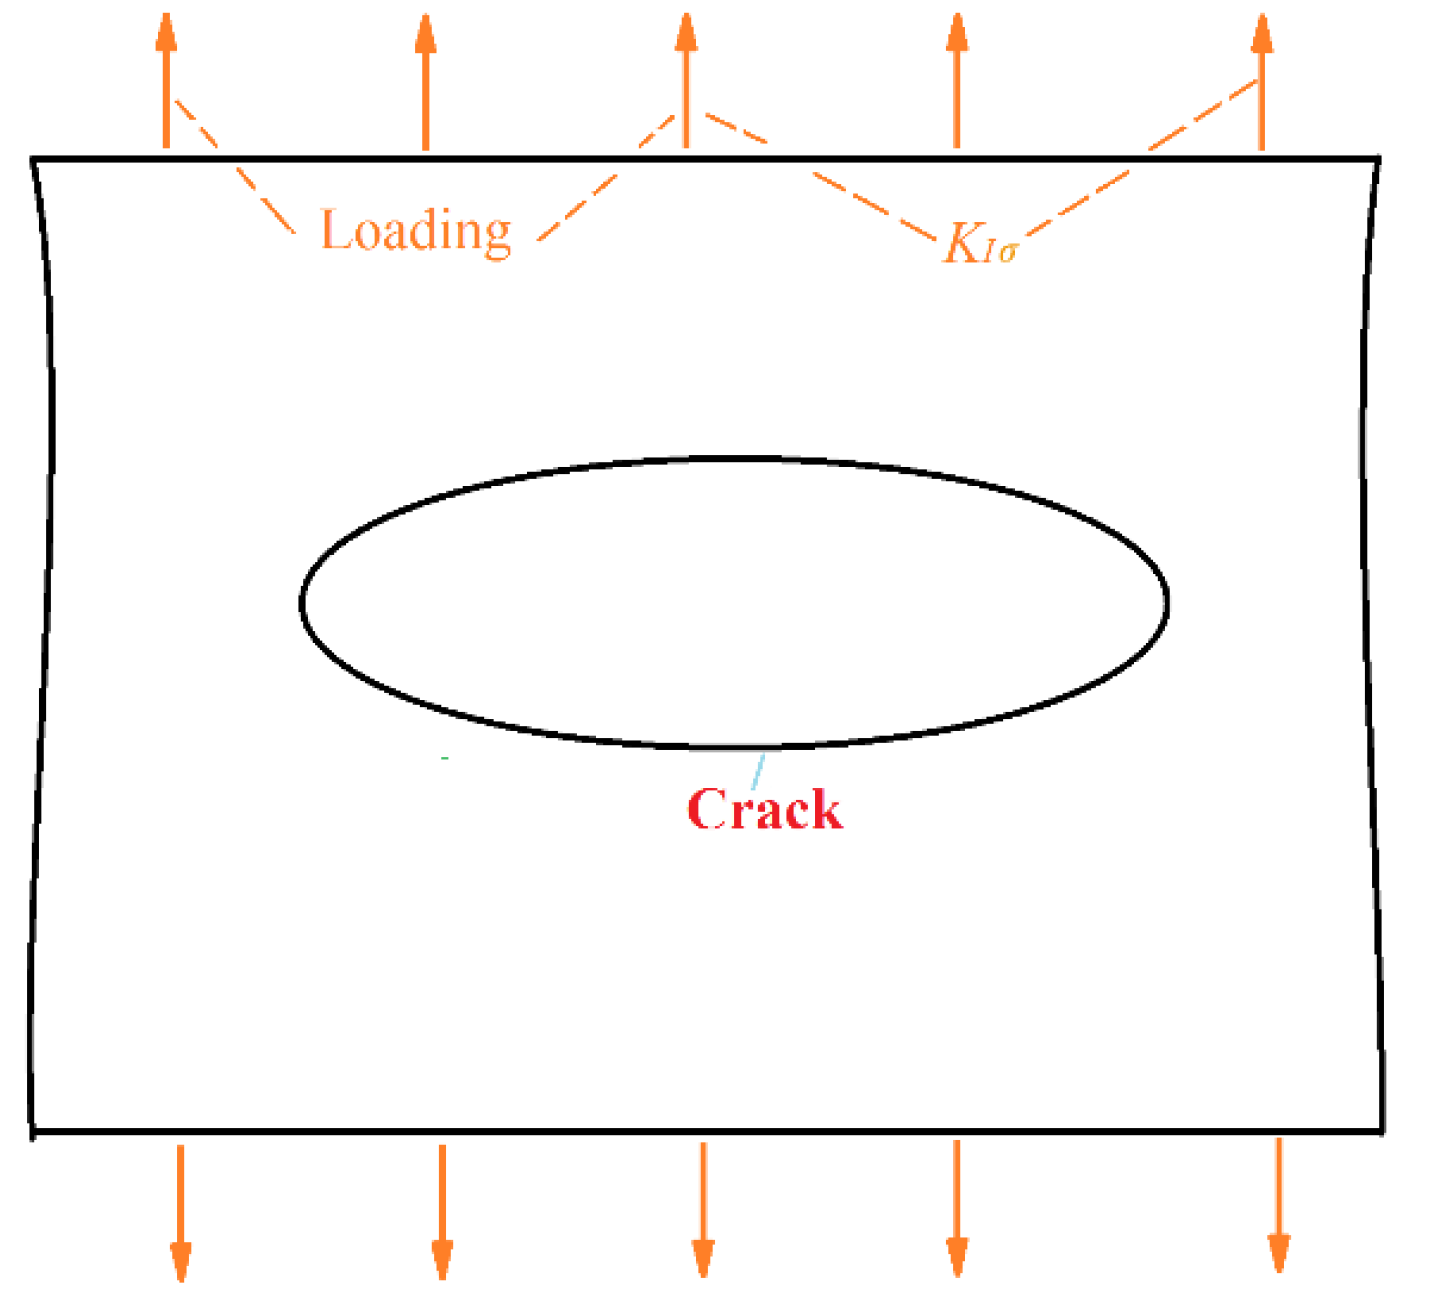
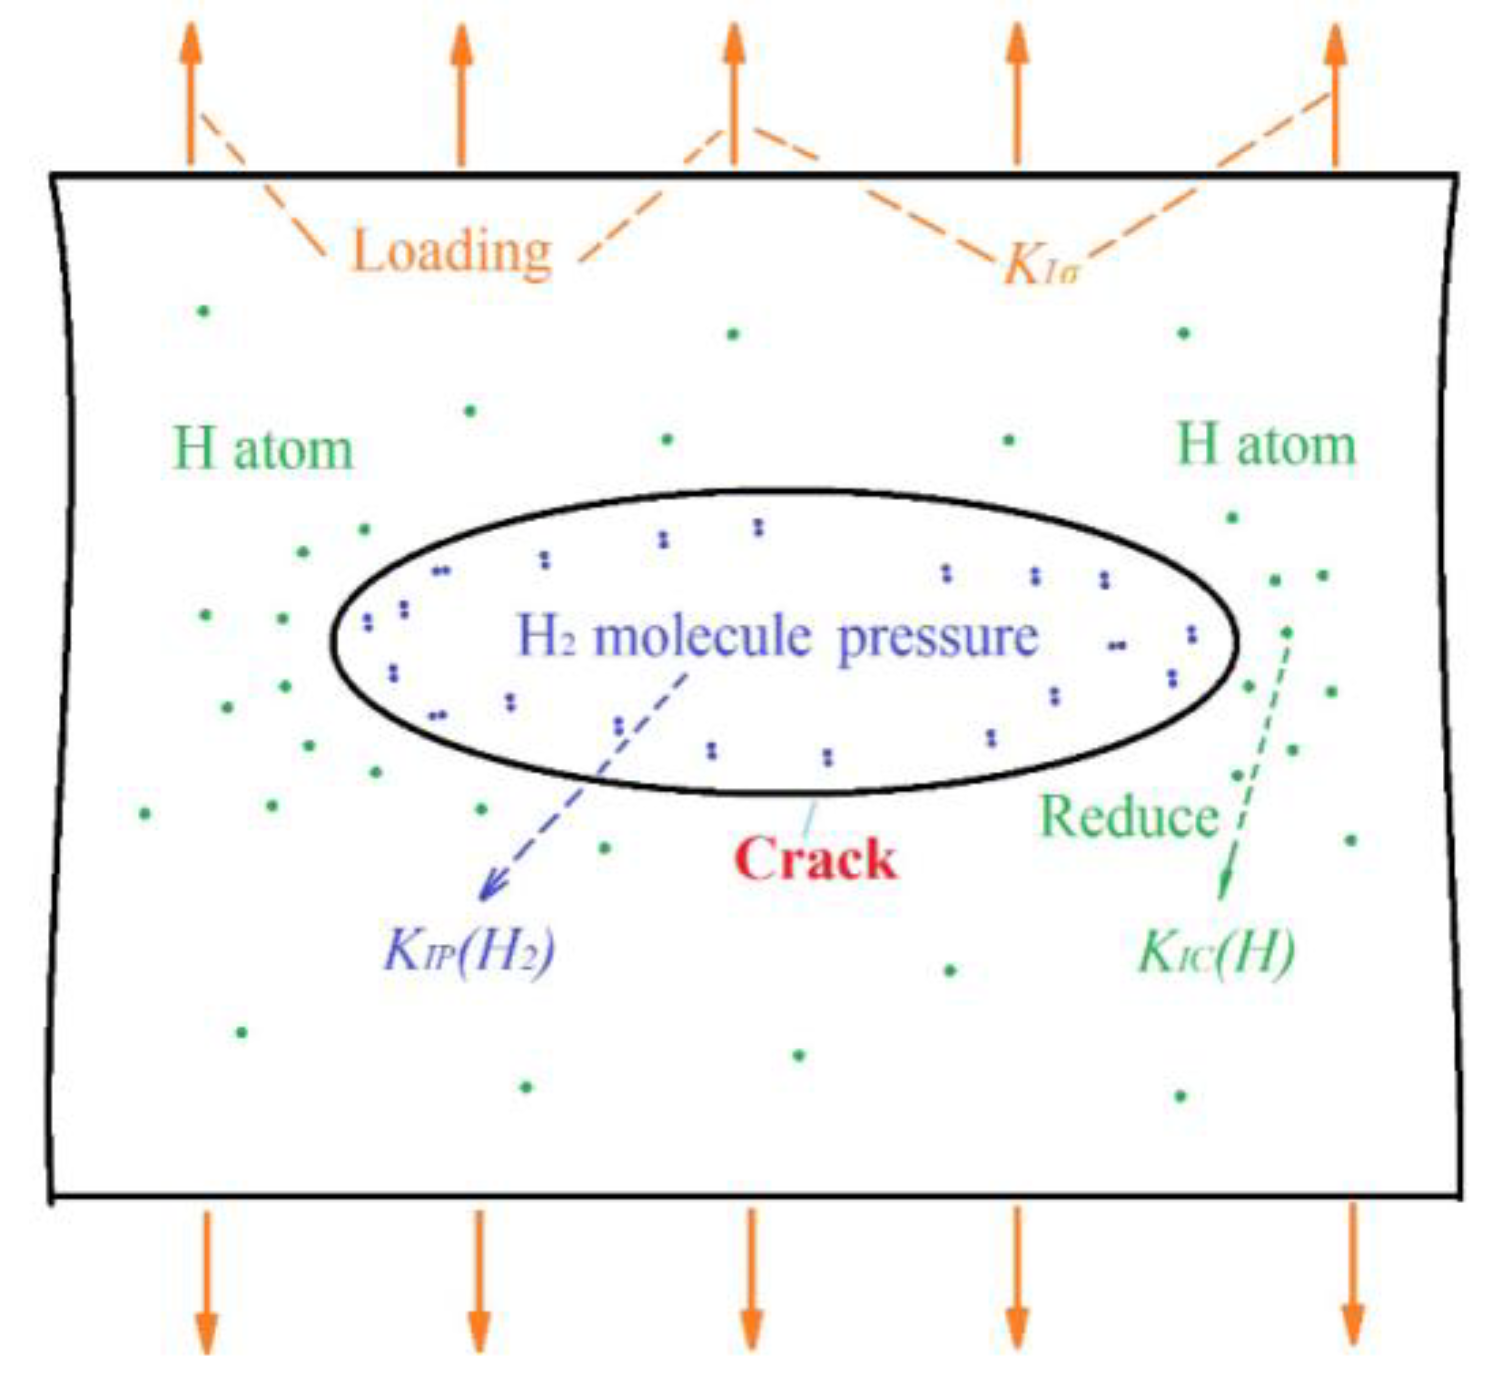
Equation (11) is the critical condition for the crack propagation in materials with hydrogen. The left side of Equation (11) indicates the driving force to promote crack growth, which was provided by the pressure induced by hydrogen molecules PH, together with the applied load σ, as shown in Figure 17. Both hydrogen pressure and external load were characterized by stress intensity factors. For the linear elasticity model, the driving force can be expressed by Equation (4), and the elastoplastic model can be expressed by Equation (7).
4.2. Fracture Toughness with Hydrogen
Now, we theoretically prove that the fracture toughness (KIC) can be reduced in the presence of hydrogen. First, according to the modification of the Griffith criterion from Orowan’s assumption, as indicated by Equation (12), the fracture toughness is determined by the surface energy and plastic properties:
where E is the Young’s modulus, γs is the surface energy, and γp is a constant plastic term similar to γs and is a material parameter. In addition, as for grain boundary structures, the surface energy (γs) is replaced by the grain boundary cohesive energy (γint) [31].
According to Jokl et al. [32], γp depends on γs. Their analysis is based on the assumption that the bond breaking and dislocation emission at the microcrack tip are concomitant processes according to the Dugdale-Billy–Cottrell-Swinden model, as indicated by the following equations:
where b is the Burgers vector, m is the mass of iron atoms, ν is the Poisson’s ratio, G is the shear modulus, n is an empirical parameter representing the experimentally measured dislocation velocities and plastic strain rates, ϕc is the critical microcrack opening displacement for instability expansion, KIe is the critical stress intensity factor of crack tip emission dislocation, δ is the critical displacement of the metal bond fracture, and wD is the Debye frequency.
According to the Dugdale-Barrenblett model under the elastoplastic condition [33], the relationship between ϕc and γs is:
where σs is the yield strength. For most metal materials, γp is at least one order of magnitude larger than γs; therefore, γs can be ignored in Equation (15).
The critical stress intensity factor of crack tip emission dislocation (KIe) can be expressed by the surface energy (γs) as follows:
Substituting Equations (14)–(16) into Equation (13) yields the following:
where:
According to Equation (17), γp is a monotonically increasing function of γs. The crack growth condition is controlled by the surface energy (γs).
The interfacial embrittlement caused by hydrogen atom segregation was analyzed by Rice and Wang using the Langmuir-McLean model [34]. When the interface is a dense crystal surface, the modified work of the separation of the hydrogen atoms is given by Equation (18). When the interface is a grain boundary, the corresponding modified separation work is given by Equation (19).
where γs(H) and γs(0) are the surface energies with and without hydrogen, respectively; γint(H) and γint(0) are the cohesive energies with and without hydrogen, respectively; ΔgIF, ΔgFS, and ΔgGB are the segregation energies of the hydrogen atoms at the inner plane of the lattice, free surface, and grain boundary, respectively; and Γ is the areal coverage of hydrogen atoms with a unit of atoms/nm2.
According to Equations (18) and (19), the interface energy (γs or γint) is linearly reduced by the hydrogen atoms around the interface. As Equation (17) is a power exponential function, with the increase in the diffusion hydrogen concentration, γp initially decreases rapidly and then decreases slowly. This conclusion corresponds to the tendency of the reduction in area with hydrogen, as shown in Figure 12.
Substituting Equations (17)–(19) into Equation (12) yields Equation (20).
where EGW is the defined Griffith work, i.e., the energy for crack growth, and A is the linear scale factor for hydrogen atoms to reduce the EGW value.
In the case where the interface is a dense crystal surface:
In the case where the interface is a grain boundary:
Equation (20) suggests that a large decrease in KIC is induced by a small increase in Γ. This indicates that the crack growth condition can be reduced by hydrogen atoms around the crack tip. The decrease in KIC due to hydrogen atoms was verified by MD simulations, as shown in Figure 14 and Figure 15. Moreover, the hydrogen atoms can be driven to the crack tip by stress [35], as indicated by Equation (21), as the location of the crack tip is the place with the highest stress value around the crack:
where σm is the hydrostatic pressure at the crack tip, which equals the average principal stress; VH is the partial molar volume of hydrogen, which is 2.0 mm3/mol for steel materials [36]; R is the gas constant; T is the temperature in Kelvin; C is the hydrogen concentration at the crack tip with stress; and C0 is the hydrogen concentration without stress, which equals the average hydrogen concentration around the crack.
Assuming that the distribution of hydrogen atoms is uniform in the micro-region of the crack tip, there is a linear relationship between the hydrogen areal coverage at the interface (Γ) and the hydrogen concentration at the crack tip (C), as indicated by Equation (22).
where a is the lattice constant.
For plastic metal materials, substituting Equations (7) and (20)–(22) into Equation (11) yields a new critical condition for the crack propagation:
4.3. Application Method of HIC Formation Criterion
Here, we provide a simple application method of this new criterion. Firstly, this information can be obtained easily: crack location, crack shape, crack size, applied load and average hydrogen concentration around the crack (C0). Thus, the stress intensity factor characterizing the applied load (KIσ) can be determined using FE simulation or theory. Moreover, based on this information, Equation (21) can be used to calculate the hydrogen concentration around the crack tip (C). Then the value of fracture toughness (KIC(H)) with hydrogen content of C can be obtained using compact tensile tests according to the ISO 12135:2002 standard.
The value of hydrogen pressure in the crack cavity is not easily obtained using direct measurement. However, the process of hydrogen diffusion in material is generally hydrogen atoms diffusing into the crack cavity to form hydrogen molecules until reaching the adsorption and desorption equilibrium, rather than the opposite process.
For the adsorption and desorption at the crack, the thermodynamic equilibrium of hydrogen can be expressed by the adequate fugacity using Sievert’s law and the Abel-Noble real gas equation of state [16], as follows:
where S is the solubility of hydrogen in the considered alloy, fP is the fugacity of hydrogen, and B is the molar co-volume of hydrogen, which is equal to 1.584 × 10⁻⁵ m3/mol.
According to Equation (24) and the average hydrogen concentration around the crack (C0), we can obtain the hydrogen pressure at the equilibrium state, which is the highest value of hydrogen pressure in practice. In this situation, the stress intensity factor characterizing hydrogen pressure KIP(H2) is also the highest. Thus, we can obtain KIσ, KIP(H2), and KIC(H).
If the relationship between the stress intensity factors, KIσ and KIP(H2), and the fracture toughness with hydrogen KIC(H) satisfies Equation (25), the crack does not expand or grow.
Otherwise, if the relationship between the stress intensity factors, KIσ and KIP(H2), and the fracture toughness with hydrogen KIC(H) satisfies Equation (26), it is not certain that the crack will expand, as we used the hydrogen pressure at the equilibrium state.
Therefore, this application method is useful for structures with high safety requirements.
5. Conclusions
A new criterion for crack propagation was theoretically obtained. The criterion includes the embrittlement and loading effects of hydrogen. Electrolytic charging hydrogen tests verified that the hydrogen in the material had two functions: increasing the load to promote crack growth and reducing the resistance of crack propagation.
The effect of hydrogen pressure on the crack was similar to the effect of the applied load according to FE simulation. The method used for calculating KIσ could also be used to calculate KIP(H2) for both the linear elastic model and the elastoplastic model.
The embrittlement mechanism involved the suppression of the dislocation emission by hydrogen atoms and the reduction in the plastic deformation ability, which is why the fracture mode changed from tearing at the dislocation zone to slipping along the densely packed surface. This was proven by MD simulations.
The theory of HIC formation is that both the surface energy (γs) and cohesive energy (γint) are reduced by hydrogen atoms at the interface. As γp is a monotonically increasing function of γs, γp and KIC also decrease in the presence of hydrogen.
Author Contributions
L.F. performed the experiments, analyzed and interpreted the data and theory; L.F. and H.F. wrote and edited the manuscript.
Funding
This research received no external funding.
Acknowledgments
We thank the state key laboratory of advanced welding and joining for experimental equipment.
Conflicts of Interest
The authors declare no conflict of interest.
References
- Koyama, M.; Tasan, C.T.; Akiyama, E.; Tsuzaki, K.; Raabe, D. Hydrogen-assisted decohesion and localized plasticity in dual-phase steel. Acta Mater. 2014, 70, 174–187. [Google Scholar] [CrossRef]
- Geng, W.T.; Wang, V.; Li, J.X.; Ishikawa, N.; Kimizuka, H.; Tsuzaki, K.; Ogata, S. Hydrogen trapping in carbon supersaturated α-iron and its decohesion effect in martensitic steel. Scr. Mater. 2018, 149, 79–83. [Google Scholar] [CrossRef]
- Jambon, F.; Marchetti, L.; Sennour, M.; Jomard, F.; Chêne, J. SIMS and TEM investigation of hydrogen trapping on implantation defects in a nickel-based superalloy. J. Nucl. Mater. 2015, 466, 120–133. [Google Scholar] [CrossRef]
- Depover, T.; Verbeken, K. The detrimental effect of hydrogen at dislocations on the hydrogen embrittlement susceptibility of Fe-C-X alloys: An experimental proof of the HELP mechanism. Int. J. Hydrogen Energy 2018, 43, 3050–3061. [Google Scholar] [CrossRef]
- Pezold, J.V.; Lymerakis, L.; Neugebeauer, J. Hydrogen-enhanced local plasticity at dilute bulk H concentrations: The role of H-H interactions and the formation of local hydrides. Acta Mater. 2011, 59, 2969–2980. [Google Scholar] [CrossRef]
- Nagao, A.; Dadfarnia, M.; Somerday, B.P.; Sofronis, P.; Ritchie, R.O. Hydrogen-enhanced-plasticity mediated decohesion for hydrogen-induced intergranular and “quasi-cleavage” fracture of lath martensitic steels. J. Mech. Phys. Solids 2018, 112, 403–430. [Google Scholar] [CrossRef]
- Chatzidouros, E.V.; Traidia, A.; Devarapalli, R.S.; Pantelis, D.I.; Steriotis, T.A.; Jouiad, M. Effect of hydrogen on fracture toughness properties of a pipeline steel under simulated sour service conditions. Int. J. Hydrogen Energy 2018, 43, 5747–5759. [Google Scholar] [CrossRef]
- Thomas, R.L.S.; Scully, J.R.; Gangloff, P.G. Internal Hydrogen embrittlement of ultrahigh-strength AERMET 100 steel. Metall. Mater. Trans. A 2003, 34, 327–344. [Google Scholar] [CrossRef]
- Panasyuk, V.V.; Andreykiv, O.Y.; Gembara, O.V. Hydrogen degradation of materials under long-term operation of technological equipment. Int. J. Hydrogen Energy 2000, 25, 67–74. [Google Scholar] [CrossRef]
- Bilotta, G.; Henaff, G.; Halm, D.; Arzaghi, M. Experimental measurement of out-of-plane displacement in crack propagation under gaseous hydrogen. Int. J. Hydrogen Energy 2017, 42, 10568–10578. [Google Scholar] [CrossRef]
- Ronevich, J.A.; Somerday, B.P.; Feng, Z. Hydrogen accelerated fatigue crack growth of friction stir welded X52 steel pipe. Int. J. Hydrogen Energy 2017, 42, 4259–4268. [Google Scholar] [CrossRef]
- Skalskyi, V.; Andreikiv, O.; Dolinska, I. Assessment of subcritical crack growth in hydrogen-containing environment by the parameters of acoustic emission signals. Int. J. Hydrogen Energy 2018, 43, 5217–5224. [Google Scholar] [CrossRef]
- Toribio, J.; Kharin, V.; Vergara, D.; Lorenzo, M. Optimization of the simulation of stress-assisted hydrogen diffusion for studies of hydrogen embrittlement of notched bars. Mater. Sci. 2011, 46, 819–833. [Google Scholar] [CrossRef]
- Dadfarnia, M.; Somerday, B.P.; Schembri, P.E.; Sofronis, P.; Foulk, J.W., III; Nibur, K.A.; Balch, D.K. On modeling hydrogen-induced crack propagation under sustained load. Miner. Met. Mater. Soc. 2014, 66, 1390–1398. [Google Scholar] [CrossRef]
- Panasyuk, V.V.; Ivanyts’kyi, Y.L.; Hembara, O.V.; Boiko, V.M. Influence of the stress-strain state on the distribution of hydrogen concentration in the process zone. Mater. Sci. 2014, 50, 315–323. [Google Scholar] [CrossRef]
- Sezgin, J.G.; Yamabe, J. Simulation of the impact of internal pressure on the integrity of a hydrogen-charged Type-316L stainless steel during slow strain rate tensile test. Int. J. Hydrogen Energy 2018, 43, 8558–8568. [Google Scholar] [CrossRef]
- Serra, E.; Benamati, G.; Ogorodnikova, O.V. Hydrogen isotopes transport parameters in fusion reactor materials. J. Nucl. Mater. 1998, 255, 105–115. [Google Scholar] [CrossRef]
- Zhang, L.; Shen, H.; Lu, K.; Cao, W.; Sun, Y.; Fang, Y.; Xing, Y.; Du, Y.; Lu, M. Investigation of hydrogen concentration and hydrogen damage on API X80 steel surface under cathodic overprotection. Int. J. Hydrogen Energy 2017, 42, 29888–29896. [Google Scholar] [CrossRef]
- Toribio, J.; Lorenzo, M.; Vergara, D.; Kharin, V. Effects of manufacturing-induced residual stresses and strains on hydrogen embrittlement of cold drawn steels. Procedia Eng. 2011, 10, 3540–3545. [Google Scholar] [CrossRef]
- Dabah, E.; Kannengiesser, T.; Eliezer, D.; Boellinghaus, T. Hydrogen interaction with residual stresses in steel studied by synchrotron X-ray diffraction. Mater. Sci. Forum 2014, 772, 91–95. [Google Scholar] [CrossRef]
- Kamaludin, M.A.; Patel, Y.; Williams, J.G.; Blackman, B.R.K. A fracture mechanics approach to characterising the environmental stress cracking behaviour of thermoplastics. Theor. Appl. Fract. Mech. 2017, 92, 373–380. [Google Scholar] [CrossRef]
- Geng, W.T.; Wan, L.; Du, J.P.; Ishii, A.; Ishikawa, N.; Kimizuka, H.; Ogata, S. Hydrogen bubble nucleation in α-iron. Scr. Mater. 2017, 134, 105–109. [Google Scholar] [CrossRef]
- Chandran, P.; Bakshi, S.; Chatterjee, D. Study on the characteristics of hydrogen bubble formation and its transport during electrolysis of water. Chem. Eng. Sci. 2015, 138, 99–109. [Google Scholar] [CrossRef]
- Zhao, J.; Meng, X.; Guan, X.; Wang, Q.; Fang, K.; Xu, X.; Lu, Y.; Gao, J.; Liu, Z.; Wang, T. Investigation of hydrogen bubbles behavior in tungsten by high-flux hydrogen implantation. J. Nucl. Mater. 2018, 503, 198–204. [Google Scholar] [CrossRef]
- Silverstein, R.; Eliezer, D.; Tal-Gutelmacher, E. Hydrogen trapping in alloys studied by thermal desorption spectrometry. J. Alloys Compd. 2018, 747, 511–522. [Google Scholar] [CrossRef]
- Sezgin, J.G.; Bosch, C.; Montouchet, A.; Perrin, G.; Wolski, K. Modelling of hydrogen induced pressurization of internal cavities. Int. J. Hydrogen Energy 2017, 42, 15403–15414. [Google Scholar] [CrossRef]
- Zhou, Q.J.; Qiao, L.J.; Qi, H.B.; Li, J.X.; He, J.Y.; Chu, W.Y. Hydrogen blistering and Hydrogen-induced cracking in amorphous Nickel phosphorus Coating. J. Non-Cryst. Solids 2007, 353, 4011–4014. [Google Scholar] [CrossRef]
- Zerbst, U.; Ainsworth, R.A.; Beier, H.T.; Pisarski, H.; Zhang, Z.L.; Nikbin, K.; Nitschke-Pagel, T.; Münstermann, S.; Kucharczyk, P.; Klingbeil, D. Review on fracture and crack propagation in weldments—A fracture mechanics perspective. Eng. Fract. Mech. 2014, 132, 200–276. [Google Scholar] [CrossRef]
- Song, J.; Curtin, W.A. Atomic mechanism and prediction of hydrogen embrittlement in iron. Nat. Mater. 2012, 12, 145–151. [Google Scholar] [CrossRef] [PubMed]
- Song, C.; Ooi, E.T.; Natarajan, S. A review of the scaled boundary finite element method for two-dimensional linear elastic fracture mechanics. Eng. Fract. Mech. 2018, 187, 45–73. [Google Scholar] [CrossRef]
- Kulkov, S.S.; Bakulin, A.V.; Kulkvoa, S.E. Effect of boron on the hydrogen-induced grain boundary embrittlement in α-Fe. Int. J. Hydrogen Energy 2018, 43, 1909–1925. [Google Scholar] [CrossRef]
- Jokl, M.L.; Vitek, V.; McMahon, C.J., Jr. A microscopic theory of brittle fracture in deformable solids: A relation between ideal work to fracture and plastic work. Acta Metall. 1980, 28, 1479–1488. [Google Scholar] [CrossRef]
- Serebrinsky, S.; Carter, E.A.; Ortiz, M. A quantum-mechanically informed continuum model of hydrogen embrittlement. J. Mech. Phys. Solids 2004, 52, 2403–2430. [Google Scholar] [CrossRef]
- Rice, J.R.; Wang, J.S. Embrittlement of interfaces by solute segregation. Mater. Sci. Eng. A 1989, 107, 23–40. [Google Scholar] [CrossRef]
- Solanki, K.N.; Tschopp, M.A.; Bhatia, M.A.; Rhodes, N.R. Atomistic investigation of the role of grain boundary structure on hydrogen segregation and embrittlement in α-Fe. Metall. Mater. Trans. A 2013, 44A, 1365–1375. [Google Scholar] [CrossRef]
- Hirth, J.P. Effects of hydrogen on the properties of iron and steel. Metall. Mater. Trans. A 1980, 11, 861–890. [Google Scholar] [CrossRef]
Figure 1.
Optical microscopy image after etching for 10 s in a 2% HNO3 + C2H5OH mixture.

Figure 2.
Changes in the hydrogen permeation rate with time.

Figure 3.
Optical micrography images of the cross sections after two hours of hydrogen charging, (a) with applied current density of 2.5 mA/cm2, (b) with applied current density of 150 mA/cm2.
Figure 3.
Optical micrography images of the cross sections after two hours of hydrogen charging, (a) with applied current density of 2.5 mA/cm2, (b) with applied current density of 150 mA/cm2.

Figure 4.
Schematic of hydrogen-induced cracking (HIC) mechanism without an external load.

Figure 5.
Crack model under external applied load.

Figure 6.
Stress distribution around the 0.1-mm-long crack under a load of 100 MPa within the range of linear elasticity.
Figure 6.
Stress distribution around the 0.1-mm-long crack under a load of 100 MPa within the range of linear elasticity.

Figure 7.
Stress intensity factor (KIσ) at the load of tensile stress (100 MPa) obtained using finite element (FE) simulation and theory with different crack lengths.
Figure 7.
Stress intensity factor (KIσ) at the load of tensile stress (100 MPa) obtained using finite element (FE) simulation and theory with different crack lengths.

Figure 8.
Stress intensity factor at the load of tensile stress and hydrogen pressure obtained using the FE simulation method with different crack lengths, (a) KI under different crack lengths, (b) linear relationship between KIσ and KIP.
Figure 8.
Stress intensity factor at the load of tensile stress and hydrogen pressure obtained using the FE simulation method with different crack lengths, (a) KI under different crack lengths, (b) linear relationship between KIσ and KIP.

Figure 9.
Stress distribution around the 0.1-mm-long crack at the tensile stress of 100 MPa within the range of elastoplastic mechanics, (a) strain-stress curves using FE simulations, (b) distribution of stress σy with loading of 100 MPa and yield stress of 200 MPa.
Figure 9.
Stress distribution around the 0.1-mm-long crack at the tensile stress of 100 MPa within the range of elastoplastic mechanics, (a) strain-stress curves using FE simulations, (b) distribution of stress σy with loading of 100 MPa and yield stress of 200 MPa.

Figure 10.
Stress values along the x-axis before the crack tip (σs = 200 MPa).

Figure 11.
Stress intensity factor produced by hydrogen pressure and tensile stress with different yield stresses under the load of 100 MPa, (a) KIP and KIσ under different yield stresses, (b) k = KIP/KIσ for different yield stresses.
Figure 11.
Stress intensity factor produced by hydrogen pressure and tensile stress with different yield stresses under the load of 100 MPa, (a) KIP and KIσ under different yield stresses, (b) k = KIP/KIσ for different yield stresses.

Figure 12.
Shape and size of the tensile specimen (mm).

Figure 13.
Material properties with the increase of the diffusion hydrogen concentration, (a) strain-stress curves for different hydrogen contents, (b) reduction rate of area under different hydrogen concentrations.
Figure 13.
Material properties with the increase of the diffusion hydrogen concentration, (a) strain-stress curves for different hydrogen contents, (b) reduction rate of area under different hydrogen concentrations.

Figure 14.
Scanning electron microscopy (SEM) images of the fracture surfaces of the specimens, (a) fracture without hydrogen, (b) fracture with hydrogen of 2.70 ppm.
Figure 14.
Scanning electron microscopy (SEM) images of the fracture surfaces of the specimens, (a) fracture without hydrogen, (b) fracture with hydrogen of 2.70 ppm.

Figure 15.
Atomic configurations of the region near the crack tip without hydrogen, shown along the crack line. The velocity was 30 m/s along the [0 1 0] direction, (a) configuration at step 5500, (b) configuration at step 9600. The red balls represent iron atoms, and “DZ” indicates the dislocation zone.

Figure 16.
Atomic configurations of the region near the crack tip with hydrogen, shown along the crack line, at various applied loads, (a) configuration at step 5500, (b) configuration at step 9600. The blue balls represent hydrogen atoms, the red balls represent iron atoms, and “DSC” indicates the dense surface of the crystal.

Figure 17.
Hydrogen pressure together with the applied load.


Table 1.
Chemical composition of E235B steel (wt %).
| C | Mn | Si | Cr | Al | S | P | Cu | Fe |
|---|---|---|---|---|---|---|---|---|
| 0.2 | 0.6 | 0.35 | 0.02 | 0.1 | 0.1 | 0.04 | 0.02 | Bal |
© 2018 by the authors. Licensee MDPI, Basel, Switzerland. This article is an open access article distributed under the terms and conditions of the Creative Commons Attribution (CC BY) license (http://creativecommons.org/licenses/by/4.0/).
Share and Cite
MDPI and ACS Style
Fu, L.; Fang, H. Formation Criterion of Hydrogen-Induced Cracking in Steel Based on Fracture Mechanics. Metals 2018, 8, 940. https://doi.org/10.3390/met8110940
AMA Style
Fu L, Fang H. Formation Criterion of Hydrogen-Induced Cracking in Steel Based on Fracture Mechanics. Metals. 2018; 8(11):940. https://doi.org/10.3390/met8110940
Chicago/Turabian StyleFu, Lei, and Hongyuan Fang. 2018. "Formation Criterion of Hydrogen-Induced Cracking in Steel Based on Fracture Mechanics" Metals 8, no. 11: 940. https://doi.org/10.3390/met8110940
Note that from the first issue of 2016, this journal uses article numbers instead of page numbers. See further details here.