Ferrite-to-Austenite and Austenite-to-Martensite Phase Transformations in the Vicinity of a Cementite Particle: A Molecular Dynamics Approach


Physics Department and Research Center OPTIMAS, University Kaiserslautern, Erwin-Schrödinger-Straße, D-67663 Kaiserslautern, Germany
*
Author to whom correspondence should be addressed.
Metals 2018, 8(10), 837; https://doi.org/10.3390/met8100837
Submission received: 27 September 2018
/
Revised: 12 October 2018
/
Accepted: 15 October 2018
/
Published: 17 October 2018
Abstract
:We used classical molecular dynamics simulation to study the ferrite–austenite phase transformation of iron in the vicinity of a phase boundary to cementite. When heating a ferrite–cementite bicrystal, we found that the austenitic transformation starts to nucleate at the phase boundary. Due to the variants nucleated, an extended poly-crystalline microstructure is established in the transformed phase. When cooling a high-temperature austenite–cementite bicrystal, the martensitic transformation is induced; the new phase again nucleates at the phase boundary obeying the Kurdjumov–Sachs orientation relations, resulting in a twinned microstructure.
1. Introduction
The – phase transition in iron, iron-based alloys, and steels is of considerable technological importance. However, on an atomistic scale, still many features are poorly understood, such as the influence of defects—grain and phase boundaries, surfaces, or dislocations—on the transition. In recent years, molecular dynamics (MD) simulation has contributed to unraveling details of this transformation [1,2,3,4,5,6].
In such simulations, it could be shown that—besides external stresses—defects play an important role in starting the transformation. Often, they serve as nucleation centers where the new phase can develop; this occurs for instance for free surfaces or grain boundaries [7,8,9,10]. This heterogeneous nucleation pathway is only rarely supplemented by homogeneous nucleation in the new phase [11], in particular in cases of strong overcooling or -heating, as it may occur in atomistic simulations.
In real materials, carbides may often form and accompany iron-based phases. It therefore appears relevant to investigate to what extent carbide phases may induce (or inhibit) the phase transformation in Fe. In this study, we focus on cementite (FeC), and study the martensitic and austenitic transformations of an adjacent iron phase. Since previous studies demonstrated that the phase transformation behavior of Fe is only little influence by small alloying elements—such as C, Ni, or Cr [12,13,14,15]—the restriction to pure Fe appears justifiable.
Carbides play an important role in the development of modern steels. The microstructure development of medium-carbon low-alloy steels containing Cr and Mo under ultrafast heat treatment conditions (rapid heating, peak austenitization followed by quenching) considers the role of undissolved carbides, such as cementite, which influence the austenite formation. Thus, the role of the cementite interface on the microstructure formation in quench-partitioning (QP) and also in ultrafast heating (UFH) steel are under intense discussion [16,17,18,19,20,21,22,23,24,25].
Experimental work using TEM and HRTEM microscopy investigated the lamellar structure of cementite precipitations in ferrite and discussed the orientation relationships between cementite and bcc iron in pearlite [26,27,28]. The most important orientation relationships [29] have been identified as the Bagaryatsky [30] and the Pitsch–Petch [31,32] orientation relationship.
Besides experiments, computer simulations based on DFT calculations and MD simulations have been used to study the elastic properties [33,34,35] and the structure of the interface between cementite precipitations and bcc iron [36,37,38].
In this paper, we describe a simulational framework with which to simulate an iron–cementite bicrystal which is able to undergo both austenitic and martensitic phase transformations. The properties of the interfaces between cementite and the ferrite and the austenite phase of Fe are discussed. The phase transformation behavior was studied by a simulated heating and cooling process, respectively. Our results show to what extent the cementite interface helps to nucleate the new phase in iron, and what the crystallographic orientation relationships of the new phase are.
2. Simulation Method
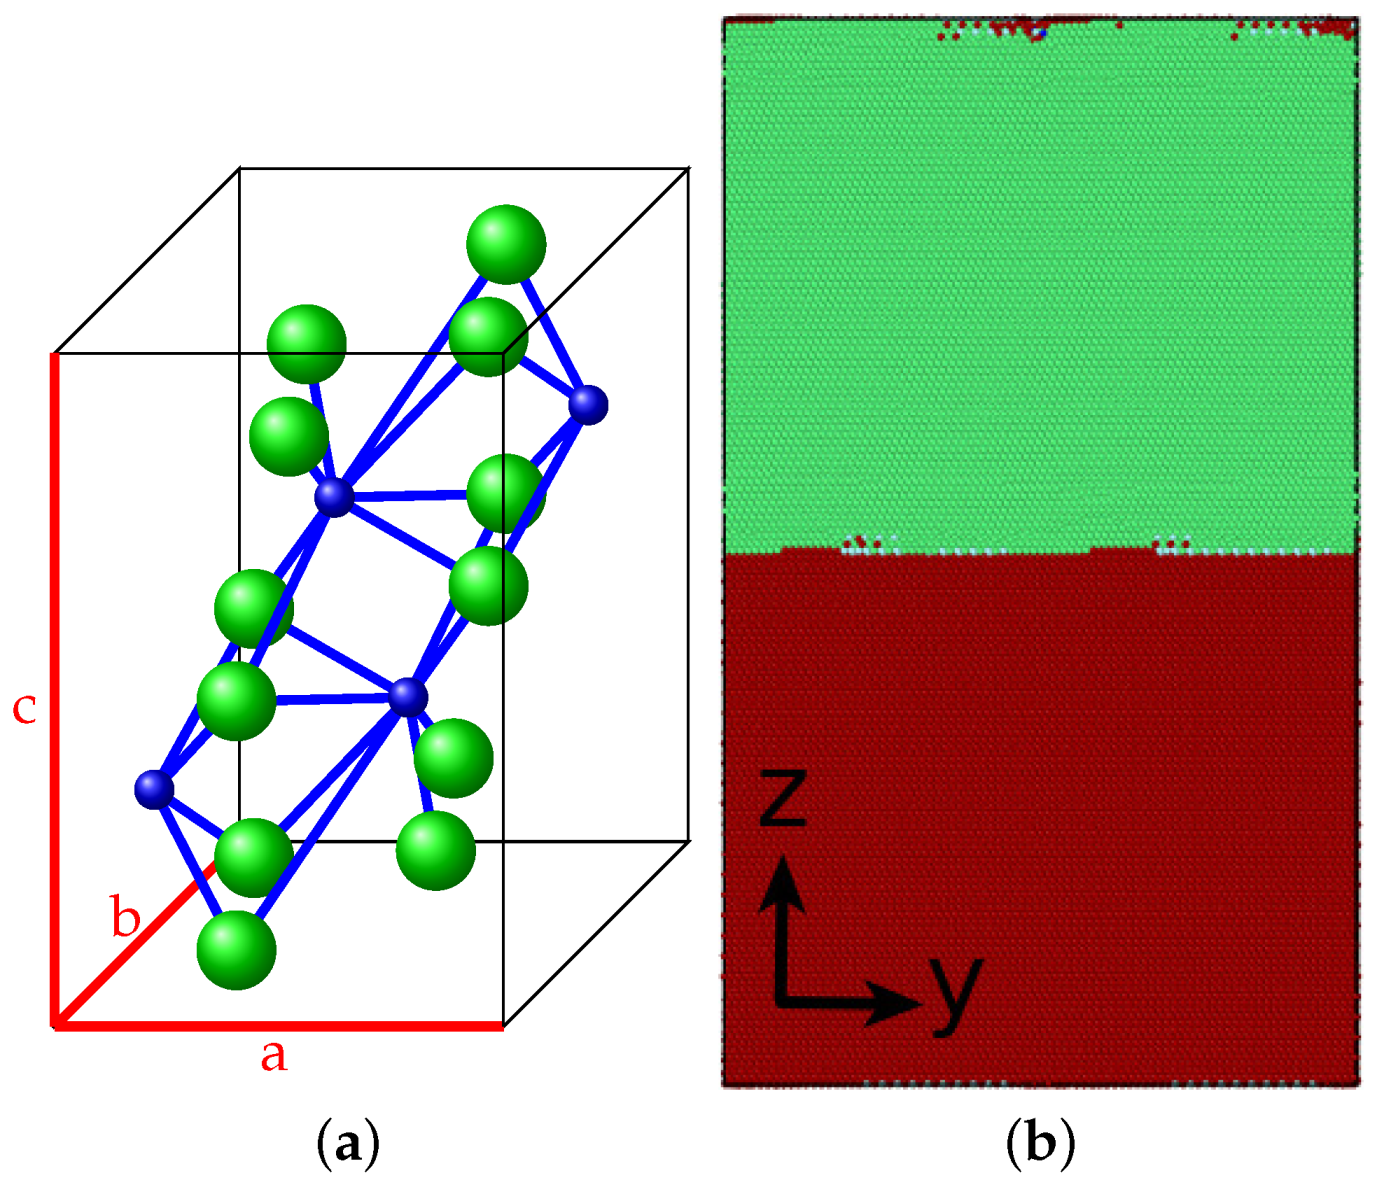
The coordinates of the atoms in the orthorhombic cementite unit cell (cf. Figure 1a) are provided in Refs. [39,40]. We constructed a ferrite–cementite and an austenite–cementite bicrystal, in which both phases occupy approximately the same space (see Figure 1b). Details of the construction are described in Section 2.2. By using periodic boundary conditions in all cartesian directions, an effectively infinite interface was modeled; perpendicular to the interface, the system was actually a multilayer iron–cementite array. For investigating the austenitic phase transition, the ferrite–cementite system was heated up to 2000 K with a heating rate of 1 K/ps, while the martensitic phase transformation was investigated by setting an austenite–cementite system up at 1000 K and cooling it down to 1 K with a cooling rate of 0.2 K/ps. During these simulations, the temperature was controlled by a Nose–Hoover thermostat [41,42], while the components of the pressure tensor in all cartesian directions were kept at zero by a barostat.
All simulations were performed with the open-source LAMMPS code [43]. For the atomistic analysis, we used the free software tool OVITO [44]. The local crystal structure of the atoms was monitored using the common neighbor analysis (CNA) [45,46].
2.1. Interatomic Interaction Potentials
For the Fe–Fe interaction, we used Meyer–Entel interaction [12], which implements the bcc–fcc transition. To describe the Fe–C interaction, we used the pair potential developed by Johnson et al. [47], as it was used in previous computational work on cementite [39,40]. As we demonstrated previously, the combination of the Meyer–Entel and the Johnson potential allows to model the – phase transformation in dilute Fe–C alloys satisfactorily [48,49]. The Johnson potential was also used in combination with several Fe–Fe potentials to describe the elastic properties of -martensite reliably [50,51].
For the C–C interaction, we followed previous work on cementite modeling [39,40] and used the purely repulsive Born–Meyer potential [52],
We used the parameters eV and Å with a cut-off radius of 1.5 Å as proposed in [53]; note that this cut-off is substantially smaller than the distance between the nearest-neighbor carbon atoms, 3.02 Å. Elmer and Levchenko [39,40] justified the use of a purely repulsive C–C potential by noting that, during the simulation, C atoms will never come closer to each other than the cut-off radius; we verified that this is the case also in our study.
2.2. Cementite–Fe Interface
In Figure 1b, the sample containing a ferrite/austenite interface is shown. In all simulations, the interface lies in the x–y plane, such that the z axis is oriented perpendicular to the interface. For constructing the iron–cementite interface and preparing the simulations, we used the most common orientation relationships.
Note that we used pure Fe, rather than an Fe–C alloy, both for the ferrite and the austenite model. Besides the ease of modeling, this is justified by the fact that the motion of C in the Fe matrix will occur on diffusive time scales that are beyond our MD simulation approach.
For the ferrite–cementite interface, we used the orientation relationship determined by Bagaryatsky [29,30]:
We used as x direction the ; as y direction the ; and as z direction the direction.
For the austenite–cementite interface, we used the orientation relationship by Pitsch–Petch [27]:
We used as x direction the ; as y direction the ; and as z direction the direction.
The size of the interface system was governed by the request that the iron and cementite crystallites must have identical lengths in x and y direction. The bicrystal containing the ferrite–cementite interface contains 559,008 atoms with extensions of 81 Å × 208 Å × 351 Å in x, y, and z directions. The upper half of the 351 Å is pure iron and the lower half cementite. The cementite block here contained 307,008 atoms and the iron block 252,000 atoms. For the austenite–cementite interface, we used 377,568 atoms extending over 207 Å× 234 Å× 83 Å. Here, the cementite block contained 207,552 atoms and the iron block 170,016 atoms.
Before starting the investigation of the phase transformation process, the interface structures need to be well relaxed. For a good result of the interface structure of the Bagaryatsky, we followed the method proposed in [38]: First, we applied energy minimization by the conjugate-gradient method [54] at 0 K. Thereafter, we relaxed and equilibrated the system for 10 ps at a temperature of 10 K. Subsequently, the system was annealed by heating it up to 500 K with a heating rate of 1 K/ps, equilibrating at 500 K for 100 ps and cooling back to 0 K with a cooling rate of 0.333 K/ps. Then, the potential energy was minimized again with the conjugate-gradient algorithm. The transformation simulations hence start at a temperature of 0 K.
The equilibration of the austenite–cementite interface was more subtle, since the austenite must be hindered to transform to the lower-energy ferrite phase. After a first conjugate-gradient energy minimization, we heated the sample up to 1000 K and equilibrated it for 1000 ps. At this temperature, the cooling process started, which eventually induced the martensitic transformation. Note that we calculated the interface properties at 400 K, which is still above the martensitic transformation temperature.
3. Results
3.1. Pure Cementite Properties
We verified that our cementite is thermodynamically stable in the temperature range considered here; when heating a pure cementite structure up to 2000 K—slightly below its melting temperature of 2110 K—it neither decomposes nor changes its structure, even after holding for 2000 ps.
The lattice constants are tabulated in Table 1 (a). They feature similar values as in experiment [55]. Note that the model by Evteev et al. [40] and Levchenko et al. [39] describes the experimental data better; they used instead of the Meyer–Entel potential the pair potential by Johnson–Dienes–Damask [47]. Unfortunately, we could not use that model, since it does not implement the bcc–fcc transformation in Fe.
For the elastic constants, no experimental data appear to be available. We therefore compared our results to the DFT data by Ghosh [33], Henriksson and Nordlund [56] and Mookherjee [57], as well as to the MD simulation data by Liyanage et al. [35], obtained using their own MEAM potential. Given the considerable spread in the literature data, our results are not unreasonable. Our moduli appear somewhat too stiff, in particular the longitudinal moduli , and , while the tetragonal and rhombohedral shear moduli are closer to the average of the literature data. We assume, however, that these discrepancies will have minor influence on the transformation behavior, since cementite was modeled to be considerably stiffer than pure Fe; here, it is GPa, GPa and GPa in bcc Fe for the Meyer–Entel potential.
3.2. Cementite–Iron Interface
We characterized the interface by the (specific) interface energy, which is calculated as
Here, is the potential energy of the bicrystal, is the energy of one cementite unit cell, is the number of cementite unit cells, is the cohesive energy of bcc iron, is the number of Fe atoms in the bcc Fe phase, and A is the area of the interface plane. The values of and for the pure materials are (4.23881) eV for bcc (fcc) Fe and eV.
3.2.1. Cementite–Ferrite Interface
For this interface, we obtained an interface energy of 2.15 J/m after the first conjugate-gradient minimization (cf. Section 2.2). The annealing procedure, followed by the second conjugate-gradient minimization reduces this value to only 0.6155 J/m; this shows that a careful anneal is necessary to produce well equilibrated cementite interfaces. We note that Kim et al. [38] reported a value of 0.6282 J/m for this interface, which nicely agrees with ours. The small deviation may be caused by their using a different interaction potential.
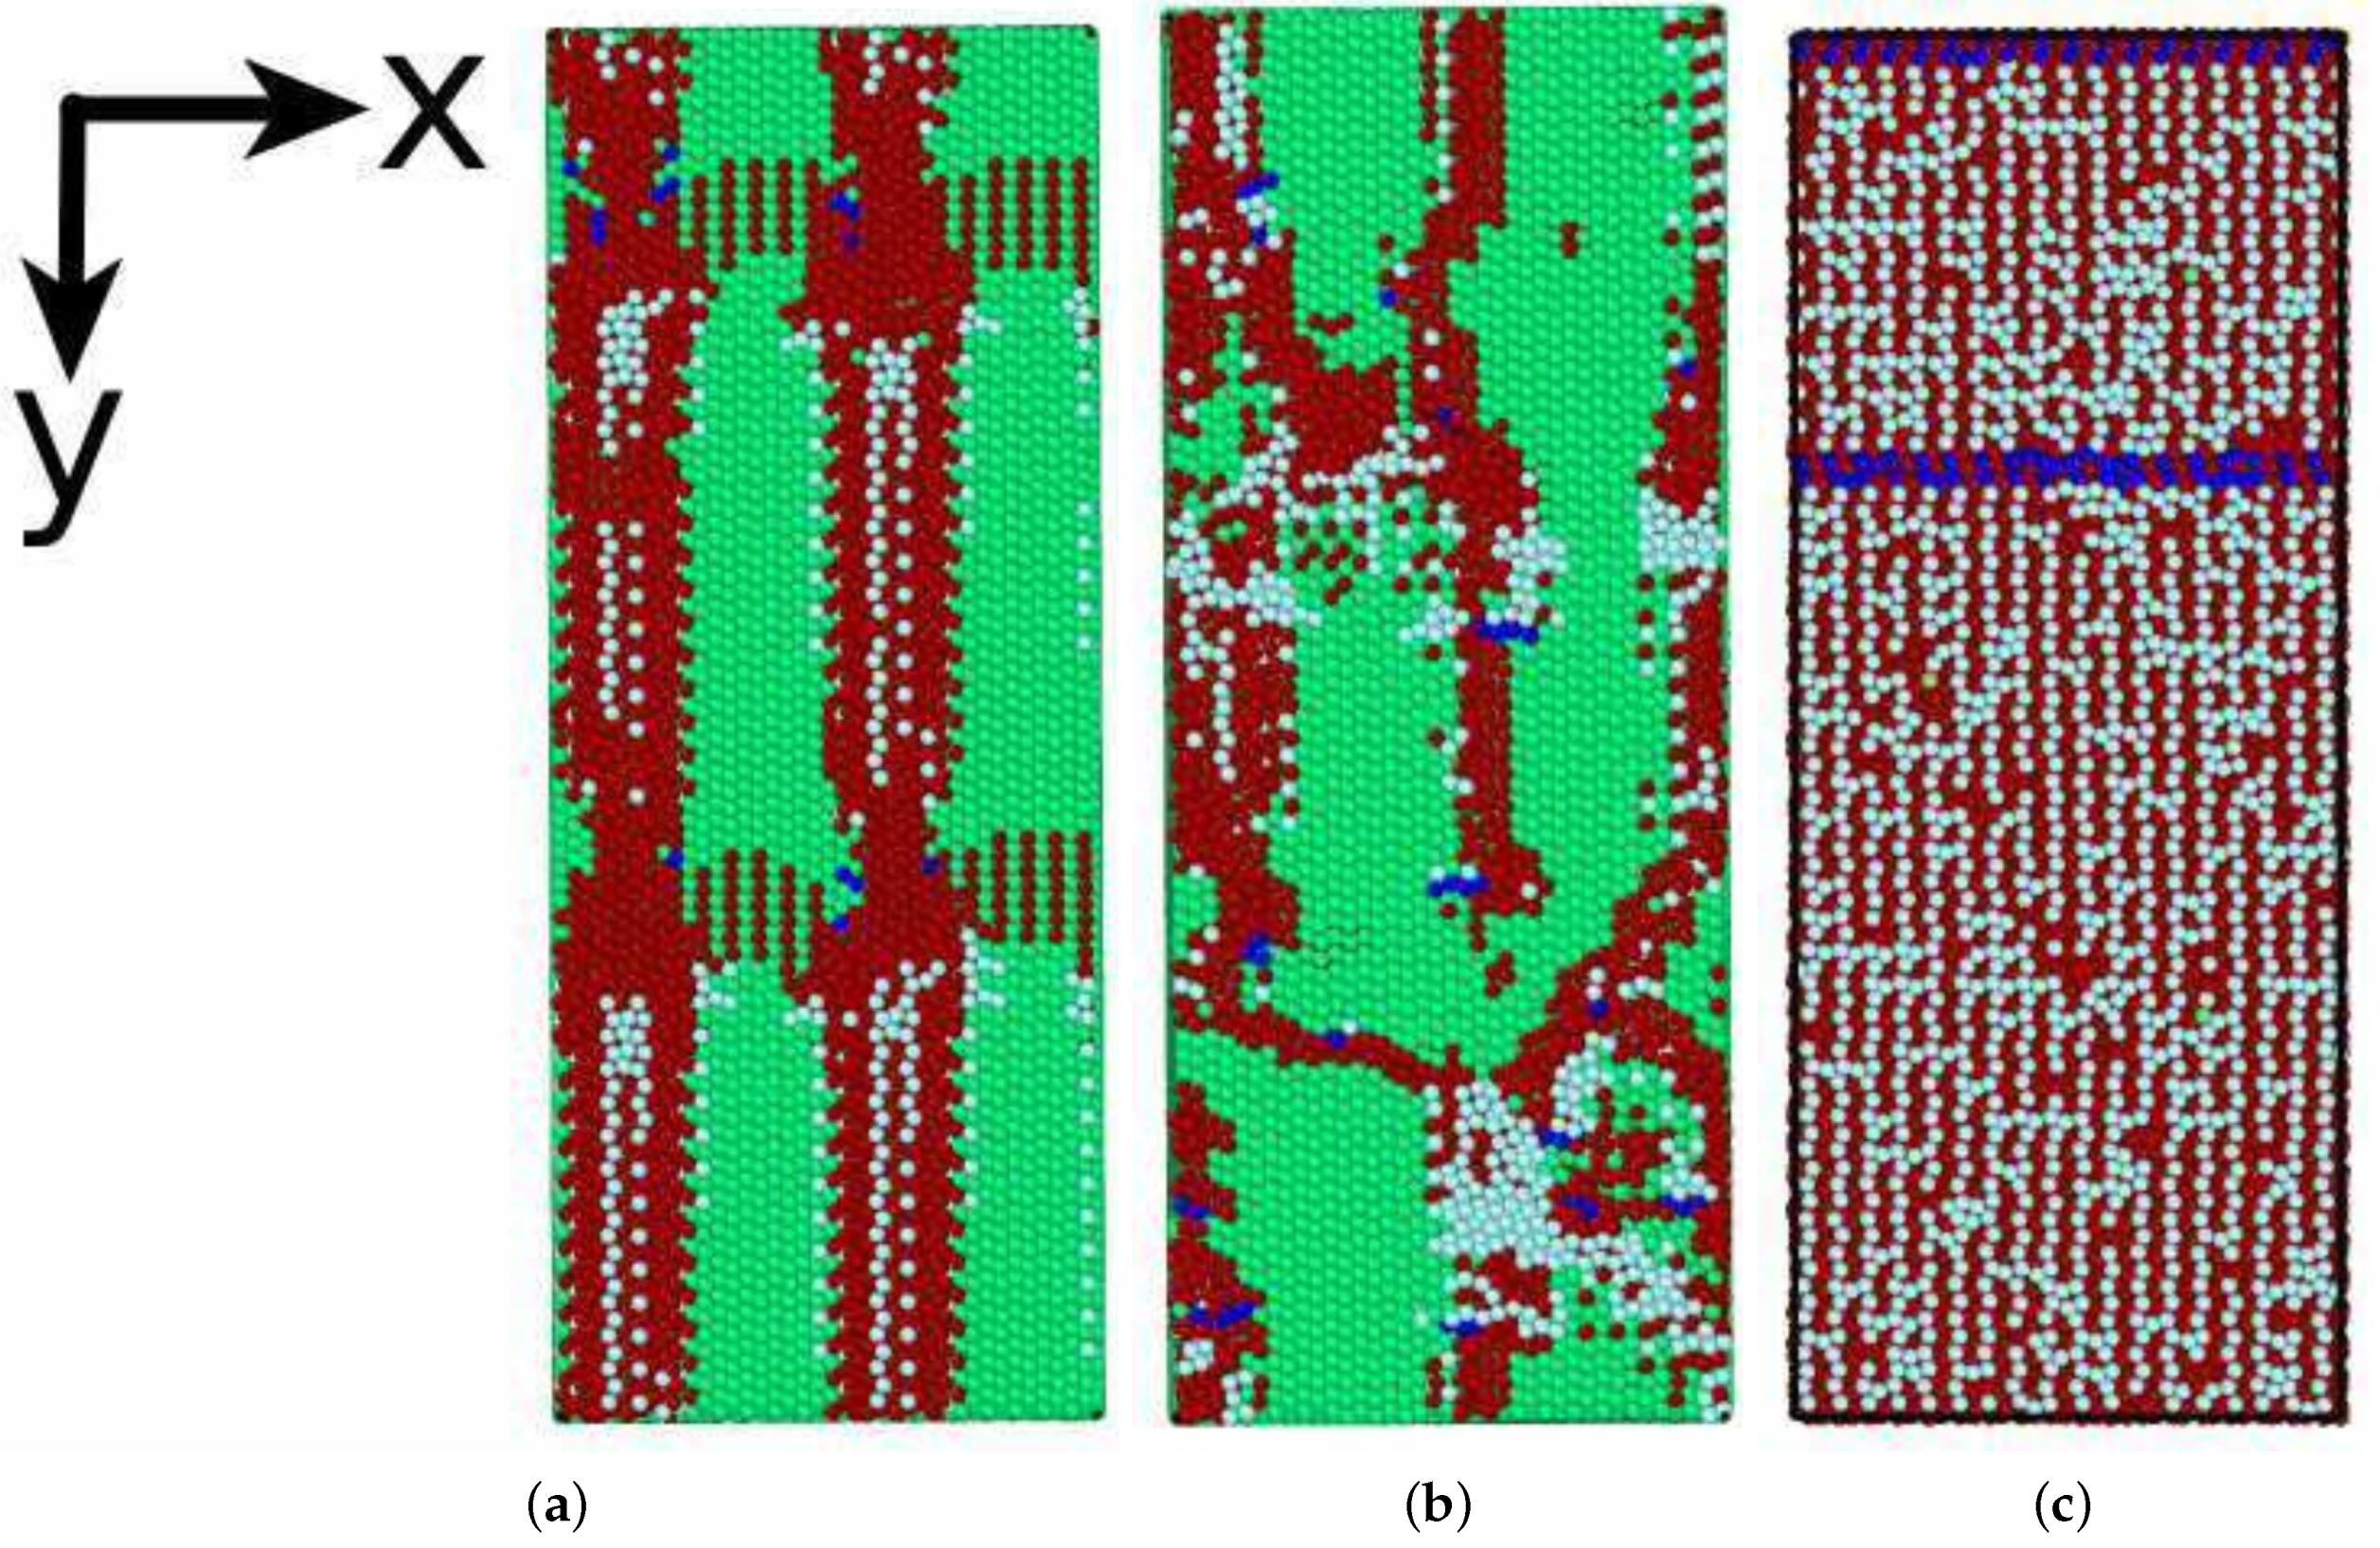
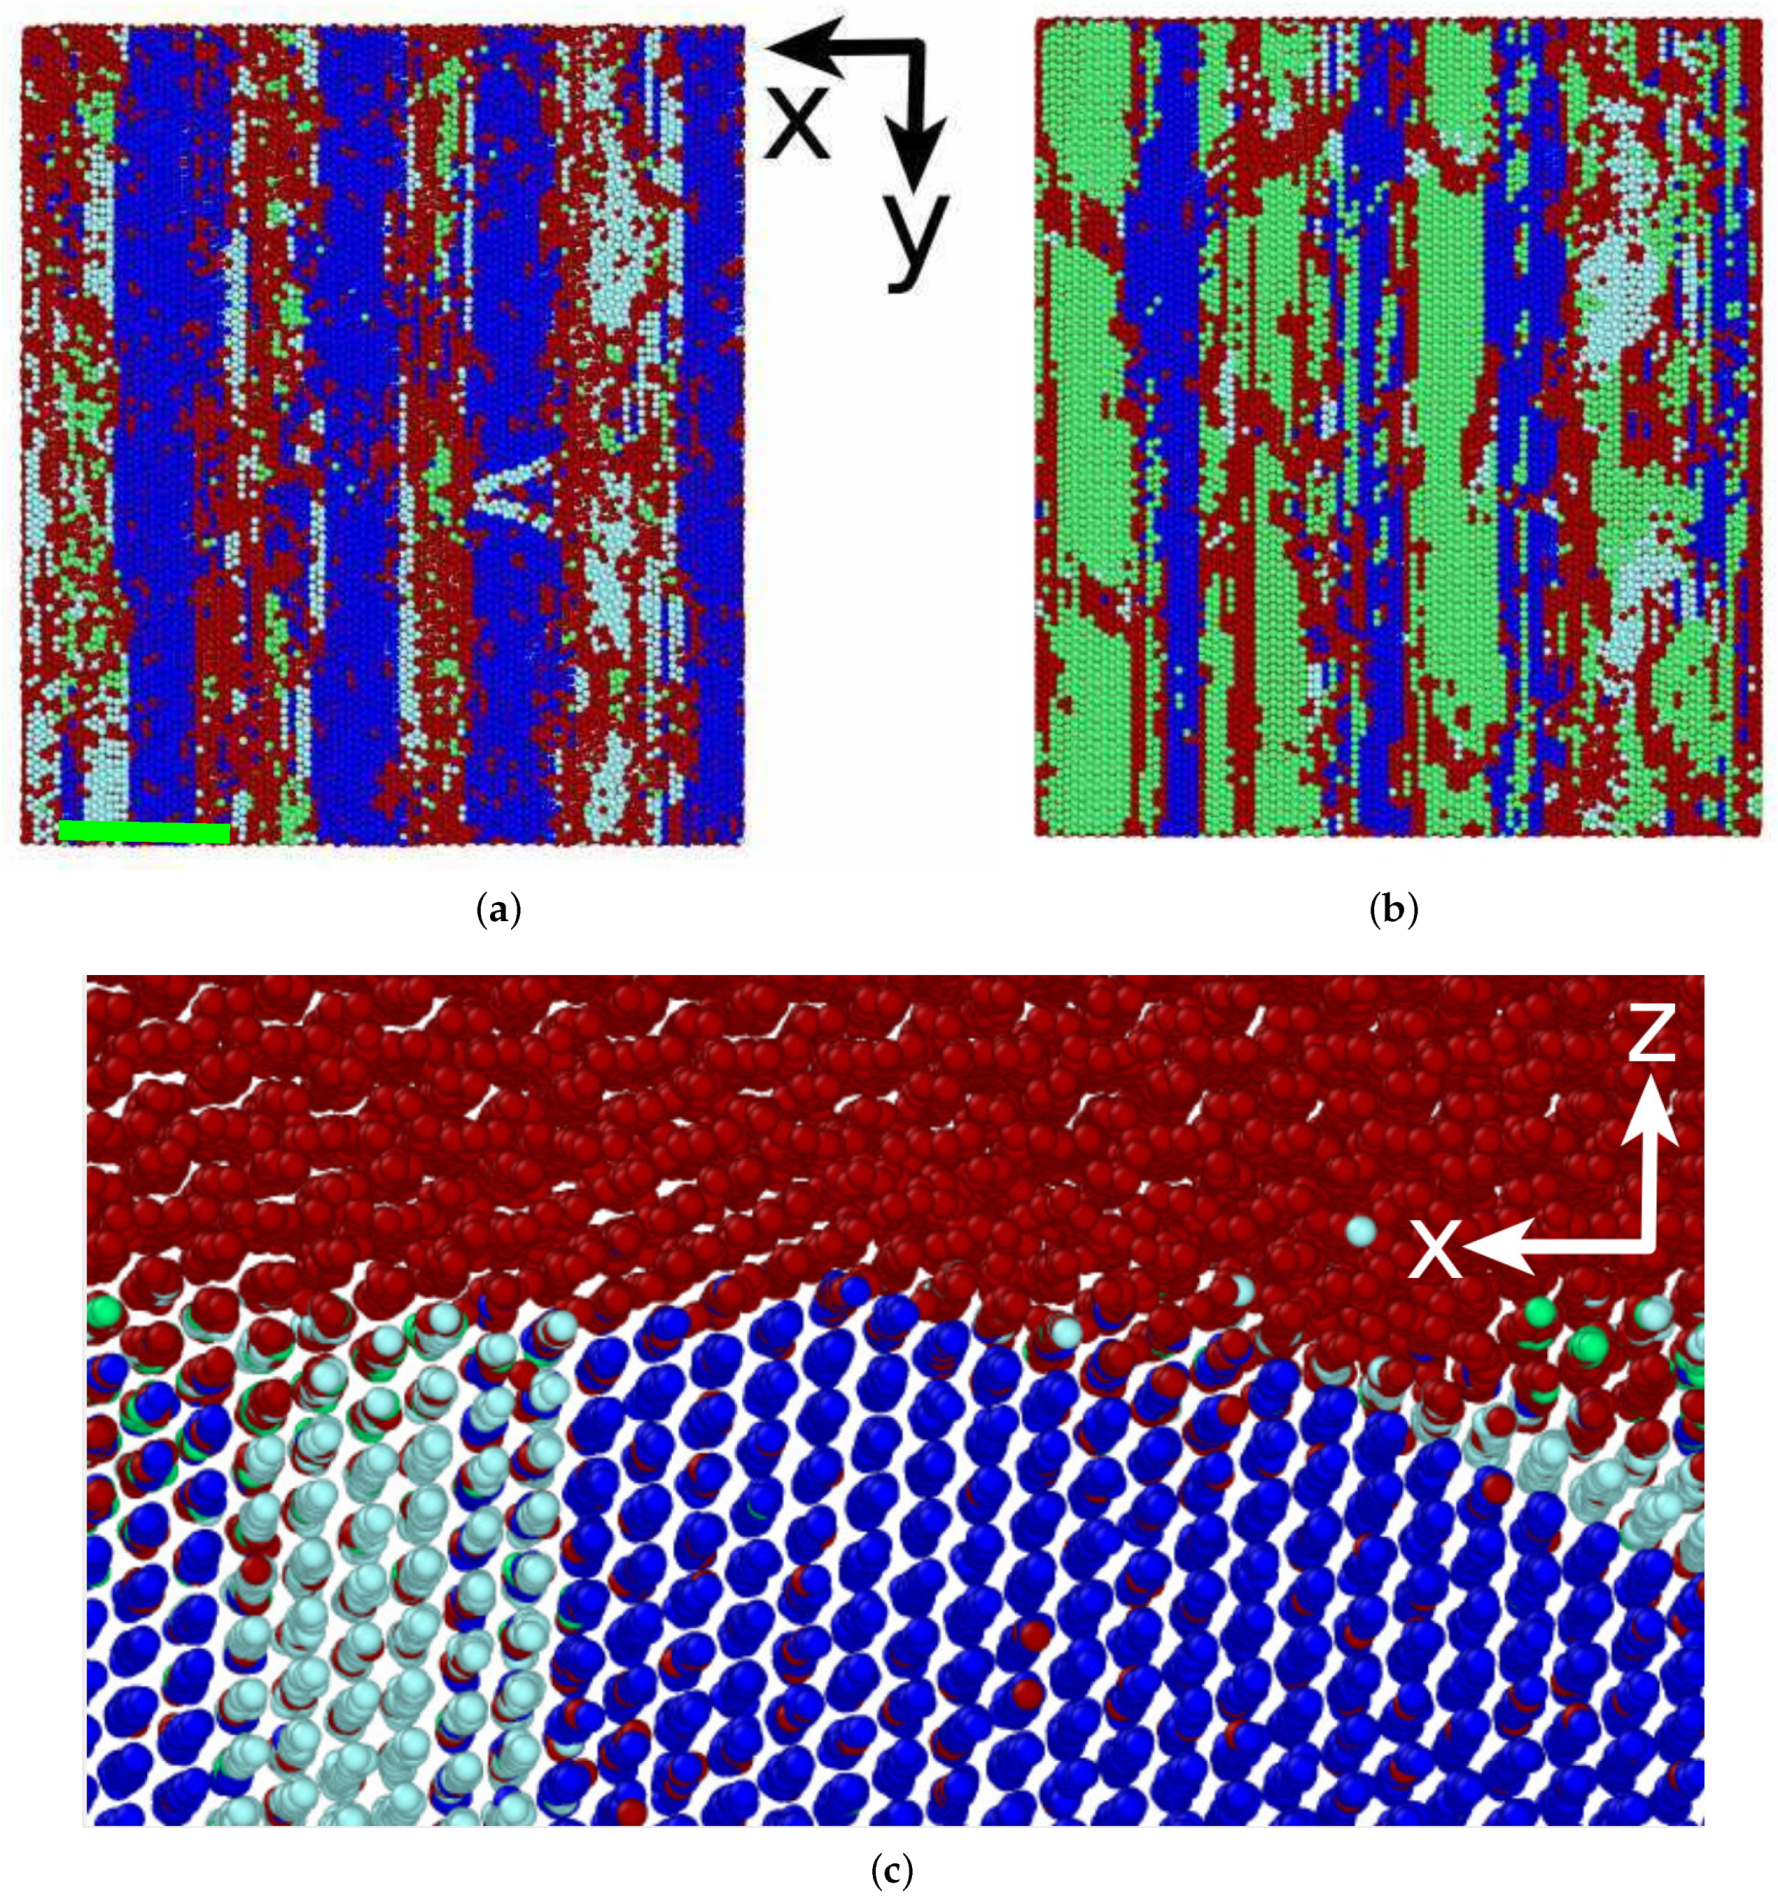
The interface structure is shown in Figure 2. After the first energy-minimization step, a regular defect structure builds up in the ferrite (Figure 2a). However, after the annealing and second energy-minimization step, the defect structure has considerably disordered. In addition, a larger fraction of hcp atoms has been generated. Note that, in the Meyer–Entel potential, the energy difference between the hcp and fcc phases is small, such that the creation of hcp spots is not energetically expensive. In the cementite, no defects could be observed; this is plausible since cementite is considerable stiffer than Fe.
Figure 2c visualizes the interface after the phase transformation. This is now an interface between cementite and austenite. It is characterized by an array of defect lines running in y direction. This strongly defective character of the interface is not astonishing, since the phase transformation changed the lattice matching between the cementite and the iron crystals. The blue stripes in Figure 2c are stacking faults (SFs) that start at the interface and extend in oblique direction into the Fe crystal (cf. Figure 6d).
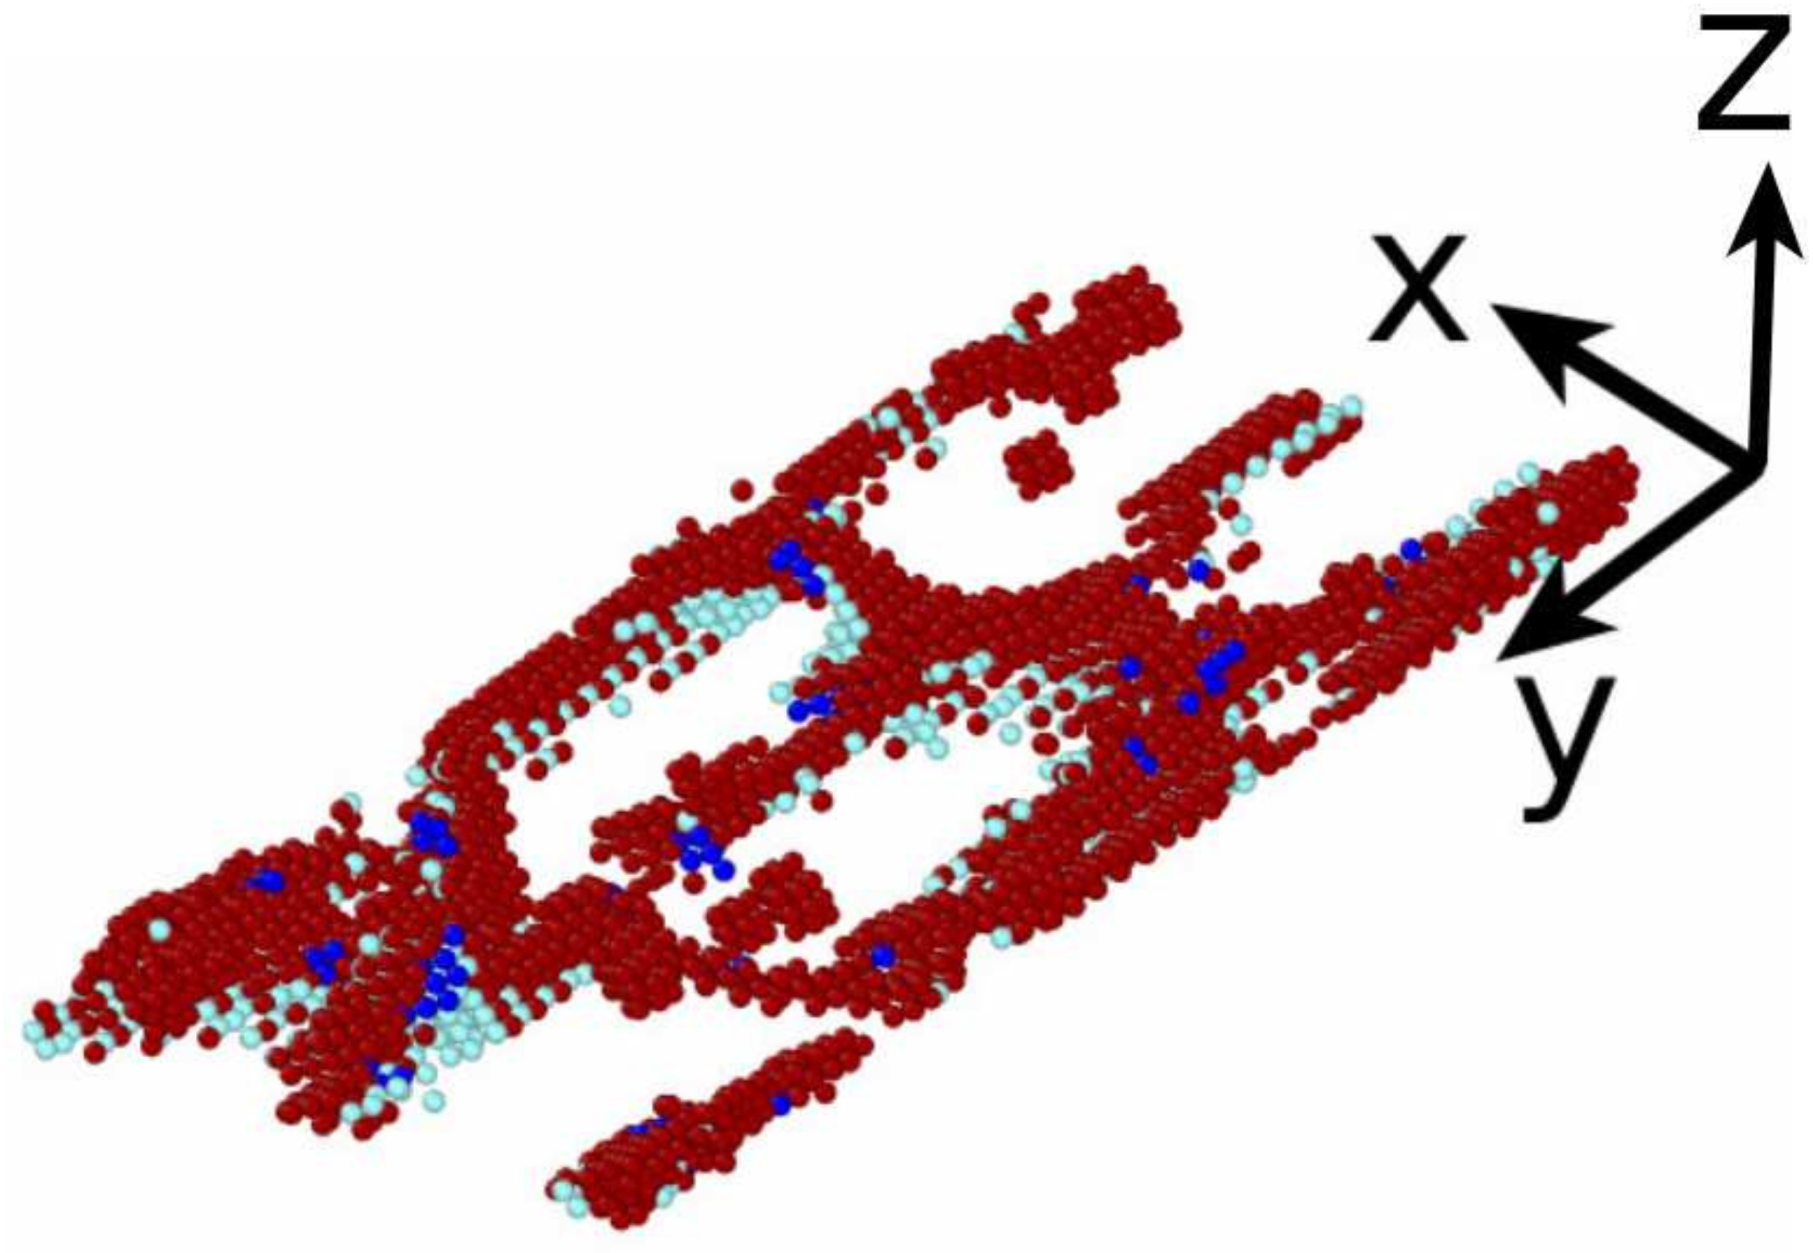
Kim et al. [38] reported about rectangular misfit dislocations in the ferrite–cementite interface. We show the defect structure on the pure iron side of the interface in Figure 3. In this plot, not only the cementite, but also all bcc Fe atoms are deleted so that we see only the defect structure in Fe; note that, in Figure 2b, part of the defect structure is hidden behind bcc atoms, demonstrating that the defect network extends away from the interface plane into the Fe. Thus, Figure 3 gives evidence of a regular two-dimensional defect pattern developing at the cementite–ferrite interface.
3.2.2. Cementite–Austenite Interface
The Pitsch–Petch interface, Equation (3), when minimized by conjugate gradients has an energy of 2.01 J/m; this value considerably drops after annealing at 1000 K to 0.3892 J/m (measured at 400 K, above the martensite start temperature). Note that the interface energy is even smaller than that of the Bagaryatsky interface described above. Unfortunately, no literature values appear to be available with which we could compare.
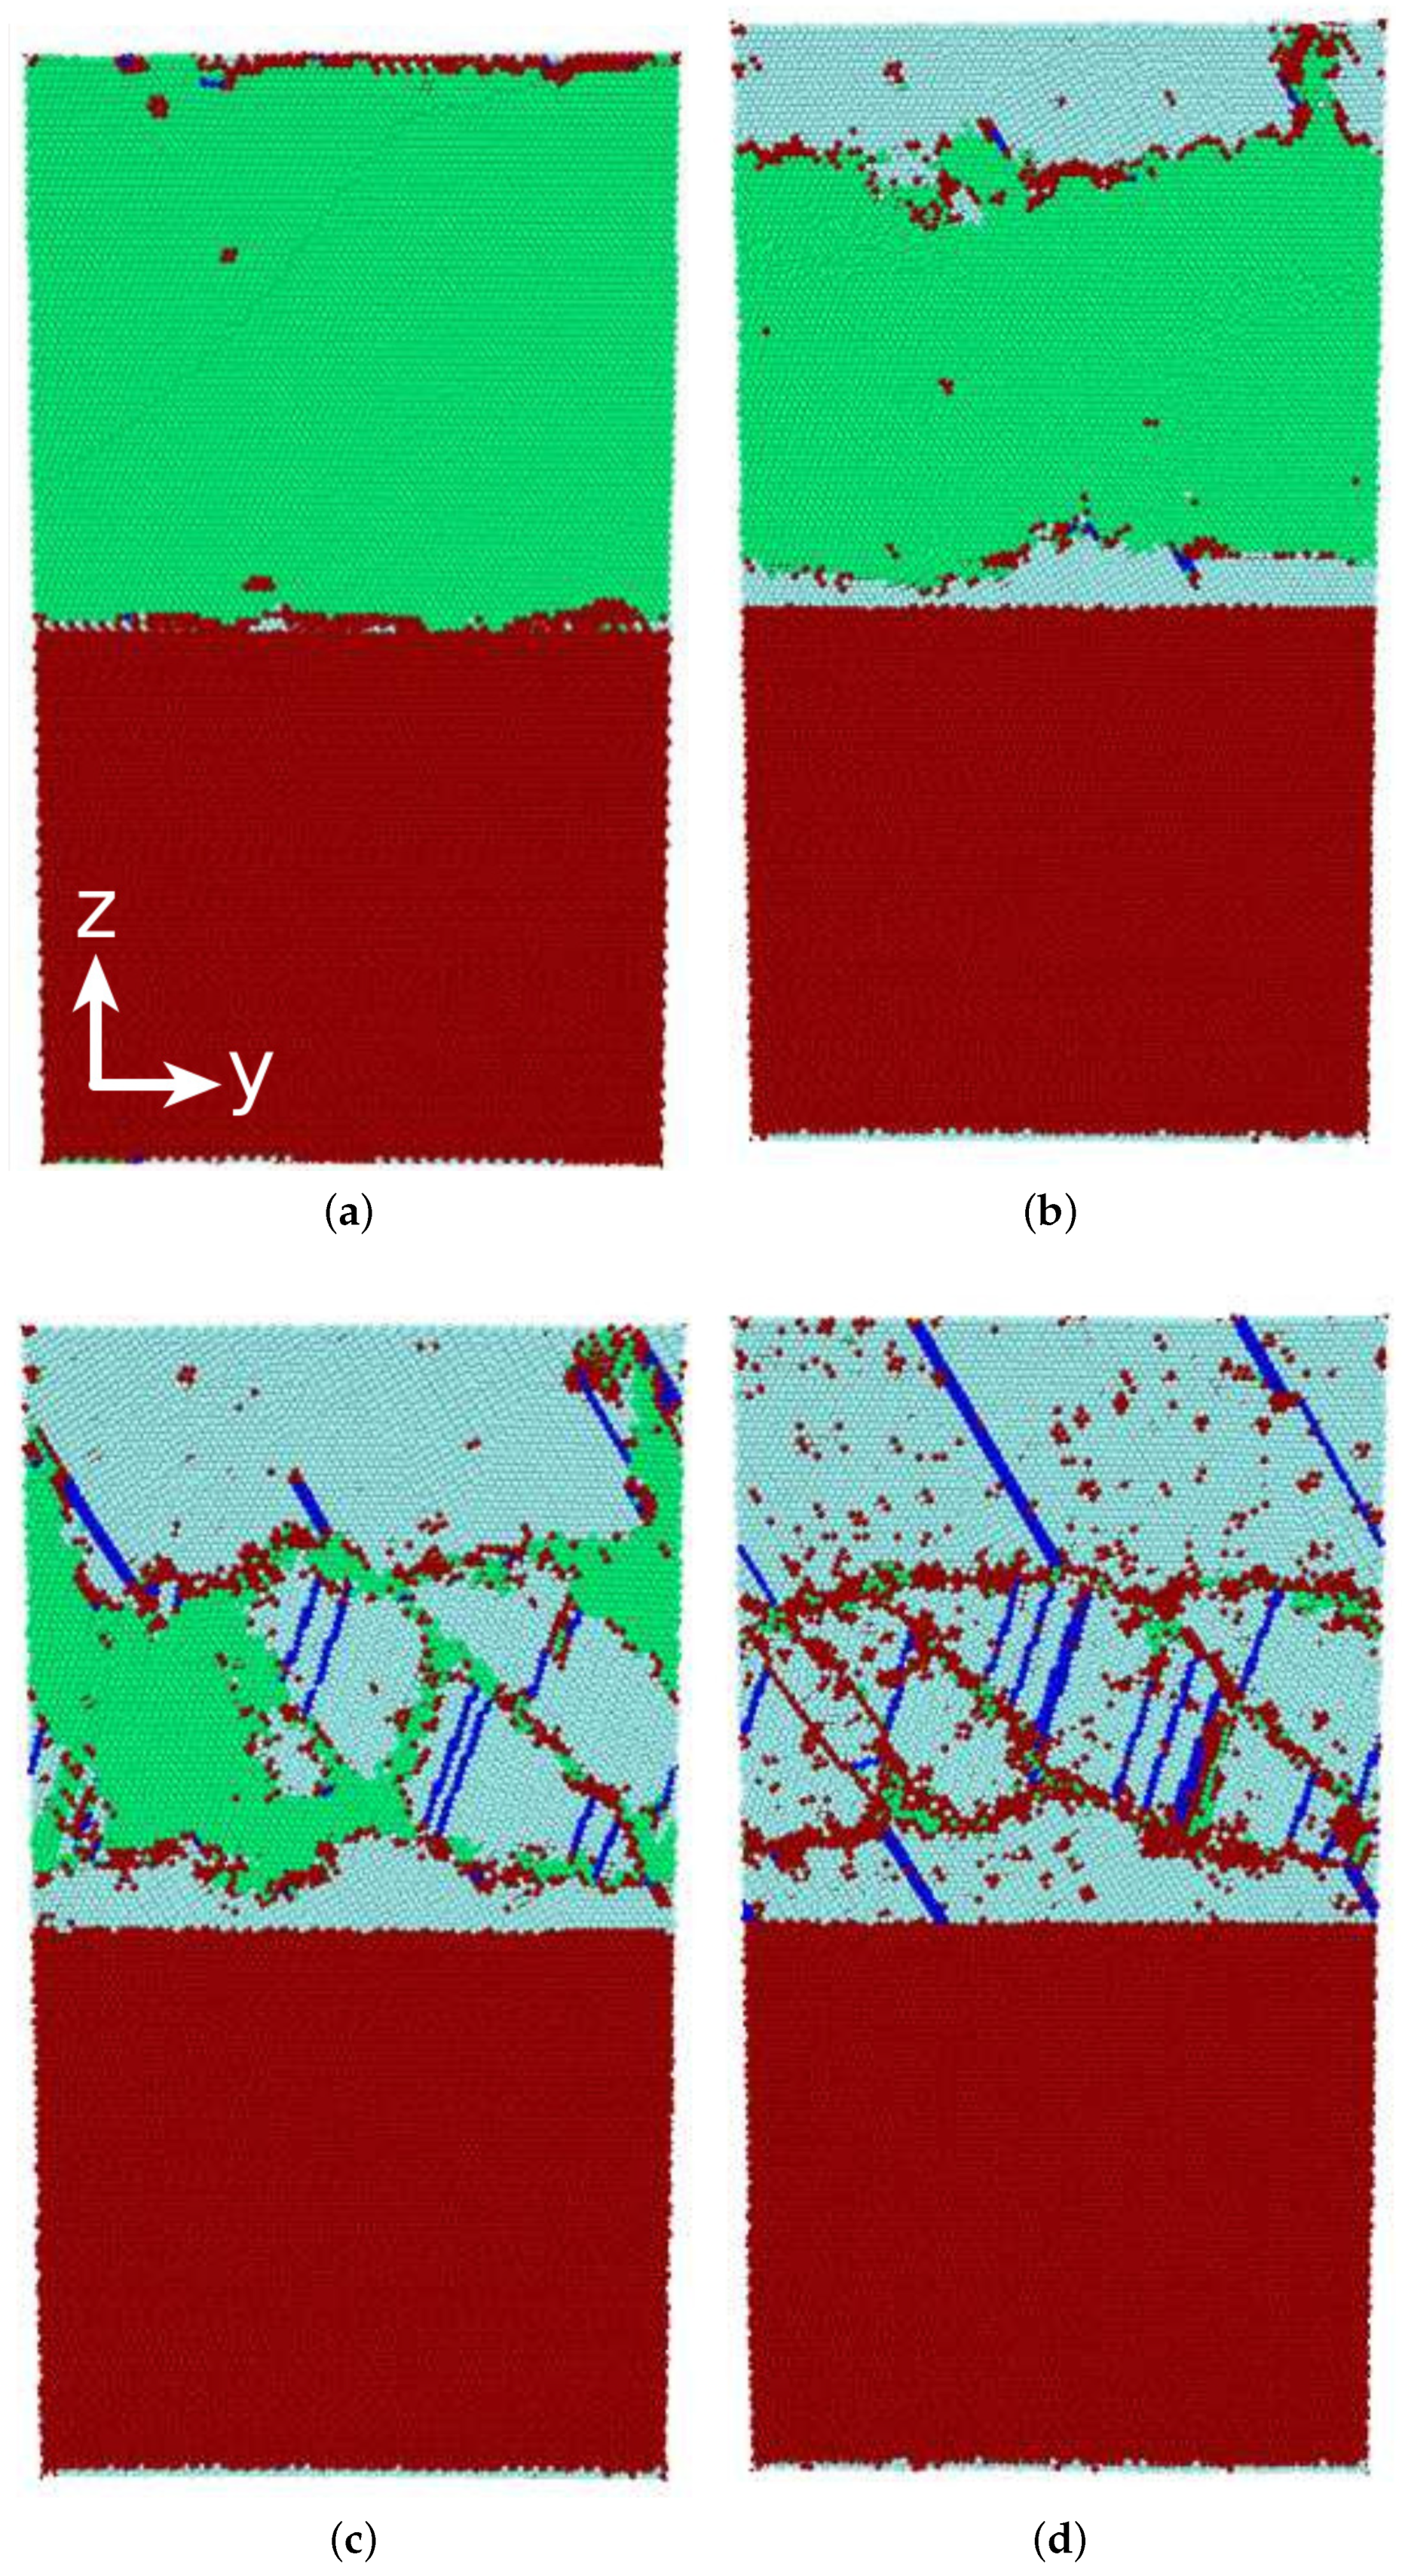
At 400 K, the interface has developed a stripe pattern (Figure 4a). These stripes have their origin in a faceting of the interface structure which has lost its planar geometry. This is shown in a side view in Figure 4c, which gives an atomistic view on one period of the stripe structure. In the austenite, SF planes—and even several-atom-layer thick hcp plates—have been created which extend away from the interface. In addition, some small nests of locally bcc-ordered atoms are seen close to the interface. All these features point at a severely defected interface on the Fe side. However, defects can also be observed on the cementite side. While the atom rows in the uppermost cementite layers in Figure 4c show their crystalline order, towards the interface strong local disorder sets in.
Figure 4b shows the state of the interface after completion of the phase transformation. In the stripes observed in Figure 4a, the fcc phase has survived; from the side view shown in Figure 4c, these fcc patches are stabilized in the concave parts (“valleys”) of the facetted interface. The hcp phase that existed in the form of platelets in the austenite, has survived to a lesser degree. In summary, the Pitsch–Petch interface shows faceting in the austenite phase; after the transformation, these facets help part of the close-packed phase to survive the transition.
3.3. Phase Transformation
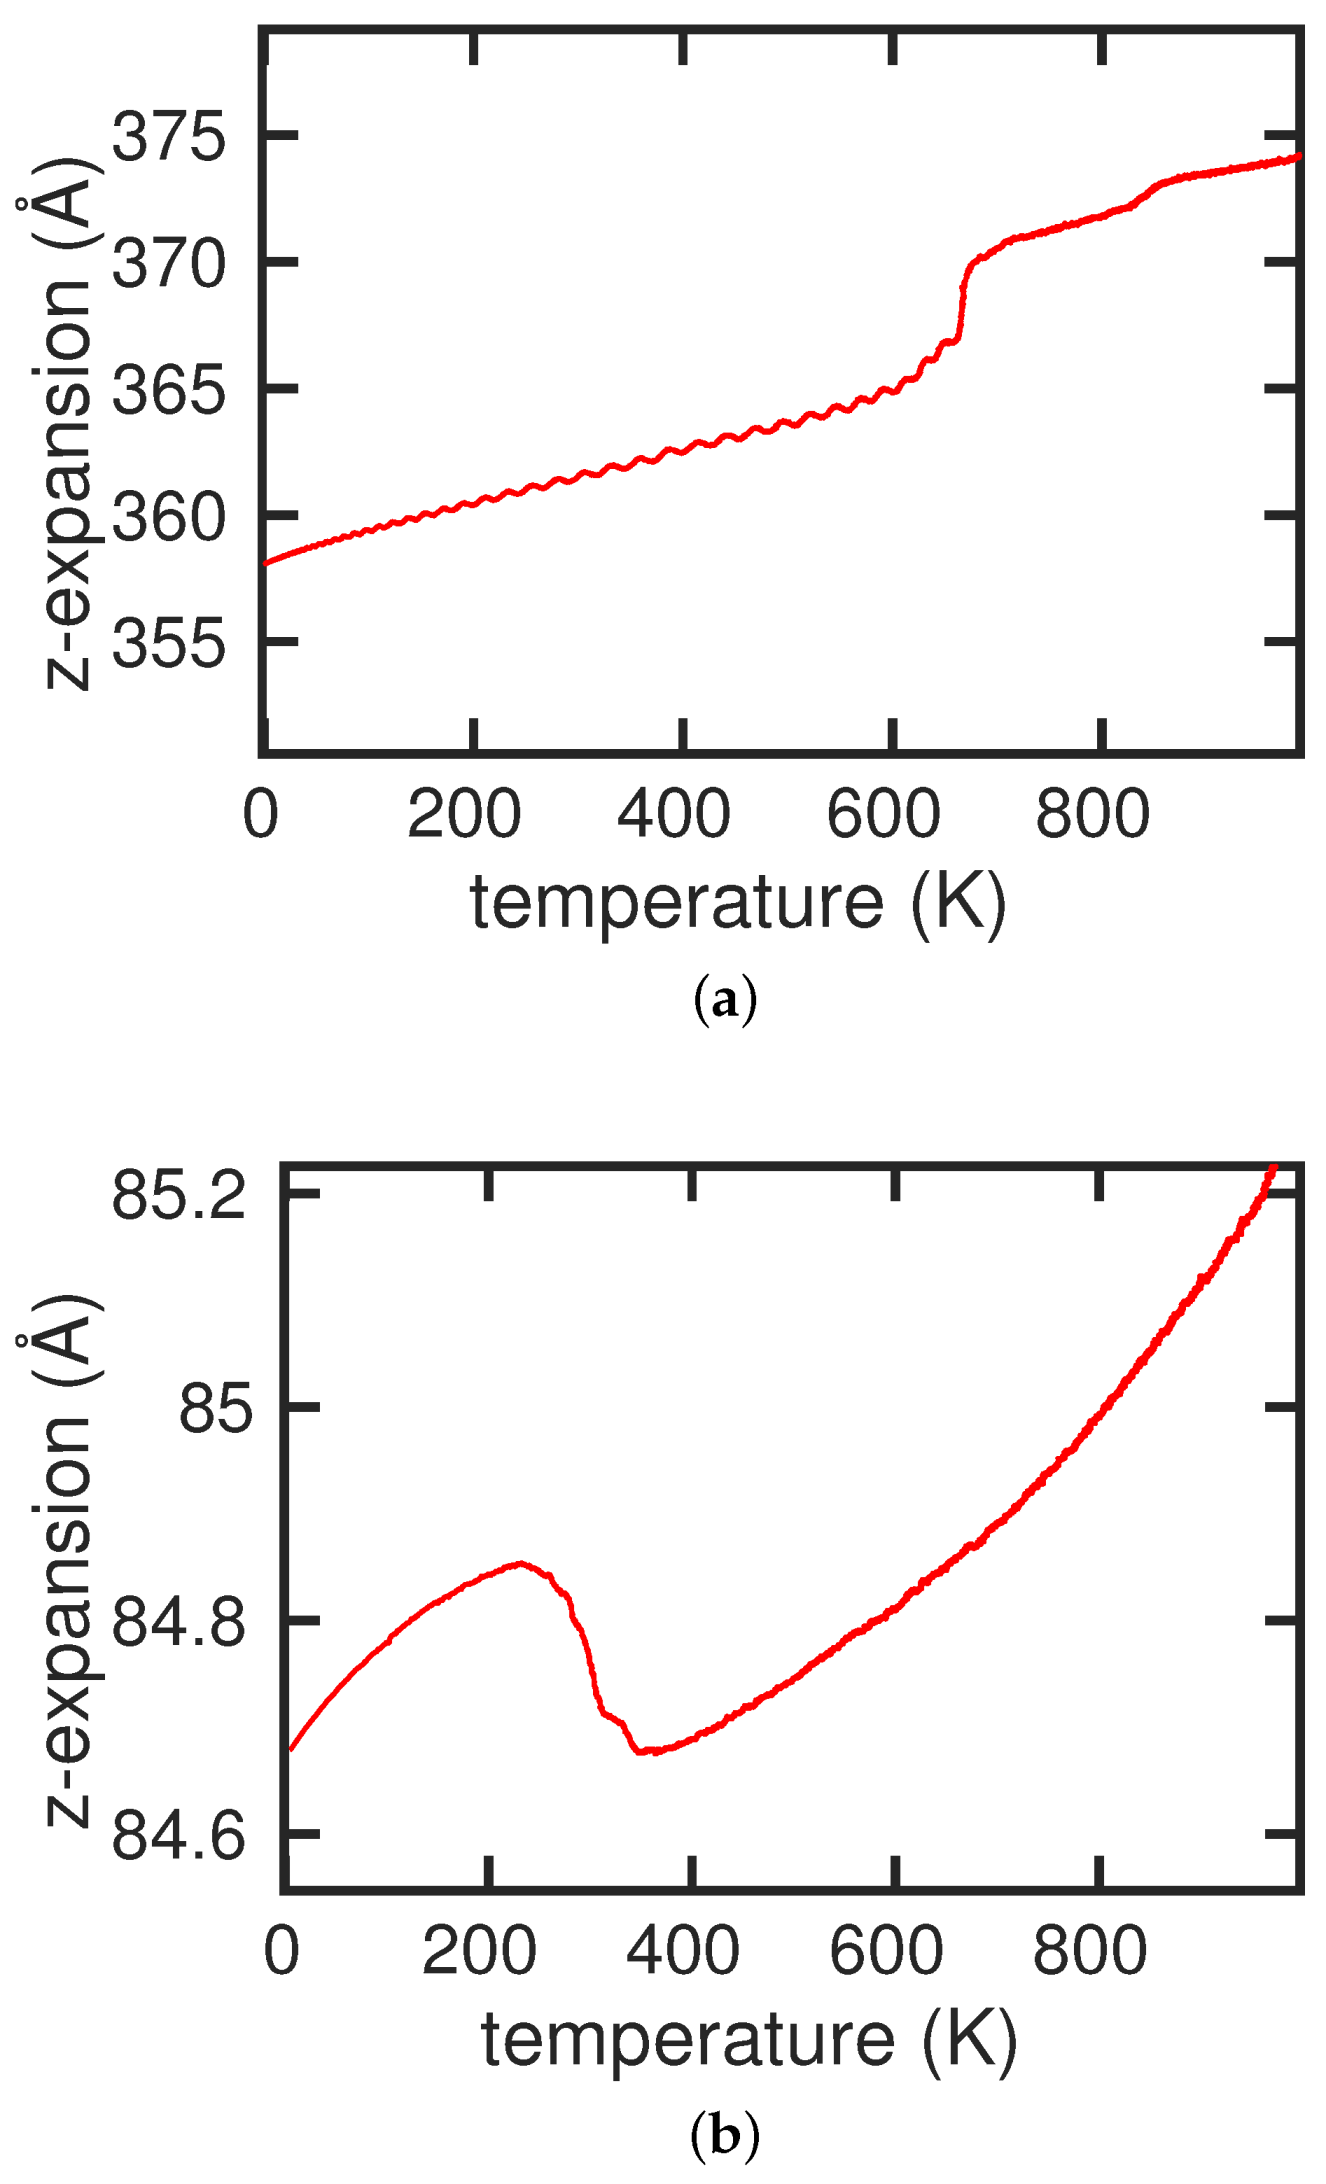
We studied the phase transformation by heating the ferrite–cementite interface up from 0 K, and cooling the austenite–cementite interface down from 1000 K, as described in Section 2. The phase transformation can be studied by monitoring the dimensions of the Fe crystal during the heating/cooling process; here, we used the length of the Fe part in z direction, perpendicular to the interface plane (see Figure 5). Besides the obvious thermal expansion, we observed a jump in the crystal extension, which we used to determine the transition temperature. In the case of the austenitic transformation, the jump is well localized at 665–670 K (Figure 5a). For the martensitic transformation, the temperature interval during which the transformation happens, is wider, 310–260 K.
We note that samples of pure Fe, without an interface to pure cementite, do not phase transform, for the number of atoms used in our simulations [58]. This gives evidence that the transformation is induced by the presence of the cementite.
3.3.1. Austenitic Transformation
Figure 6 displays snapshots of the austenitic transition process. The initially pure bcc phase (Figure 6a) starts transforming at 631 K (Figure 6b); the new phase nucleates at the interface—note that because of the periodic boundary conditions, the Fe is bounded by two interfaces to cementite. At 671 K (Figure 6c), the close-packed phase has covered the majority of the Fe slab; grain boundaries have formed where the crystallites meet. At 1104 K (Figure 6d), the entire Fe has transformed. Note that—due to the almost vanishing free-energy difference between the two close-packed phases, fcc and hcp, in the Meyer–Entel potential [5,59]—the material actually transforms to hcp. This behavior is well known from simulational studies of the austenitic transformation in Fe [8,60,61]. Embedded fcc planes are SFs in this structure.
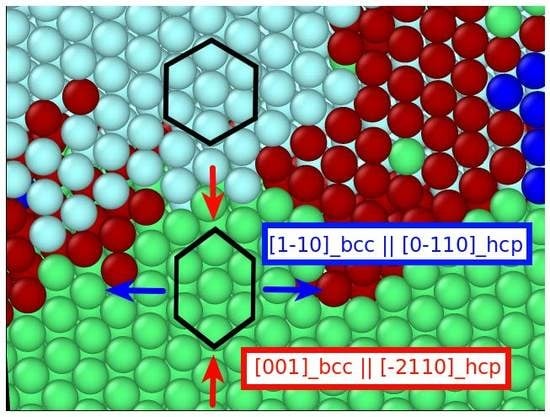
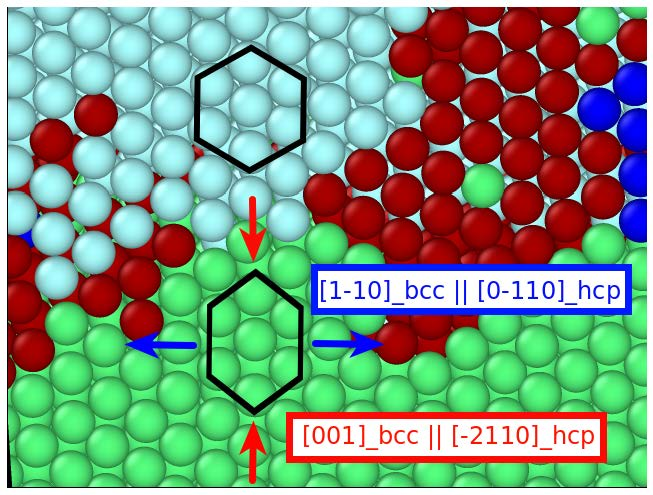
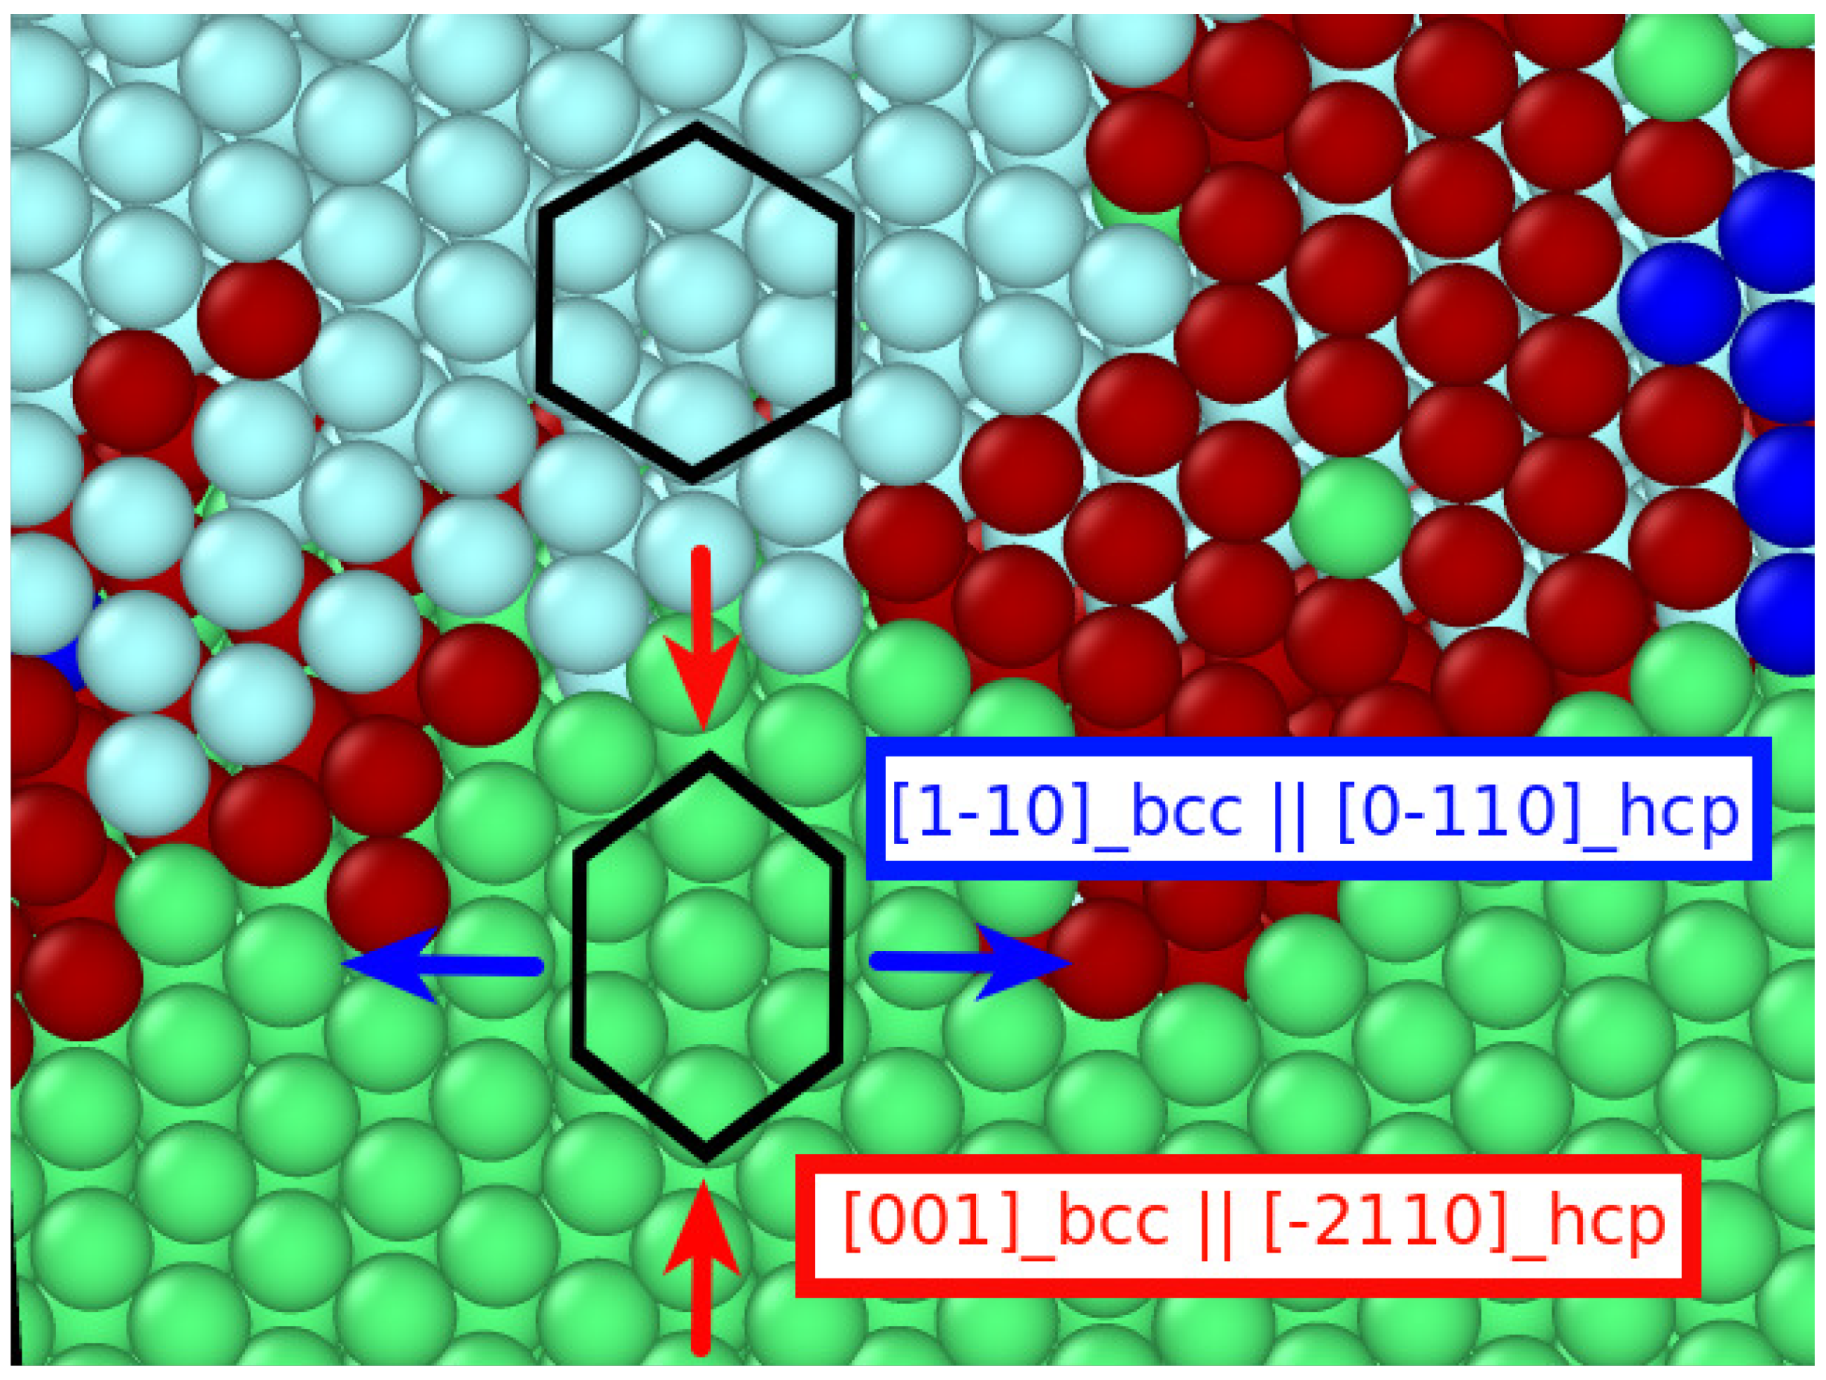
The close-packed grains produced by the transformation are variants obeying the same orientation relationships with respect to the cementite phase. These are demonstrated in Figure 7. It gives a view on the plane. In this plane, the direction transforms into the direction by an expansion, and the direction transforms into the direction by a compression. These operations transform the bcc crystal into an hcp crystal. We also note that every second plane is shifted in the direction. This process leads to the stacking sequence typical of the hcp structure.
The transition conserves the close-packed planes, but not the close-packed directions in the two phases. It is the bcc–hcp analog to the Nishiyama–Wassermann pathway [64,65] governing the bcc–fcc phase transition; in analogy to that transition, the Mao et al. [62] orientation relationships do not allow establishing a twin structure in the transformed material.
3.3.2. Martensitic Transformation
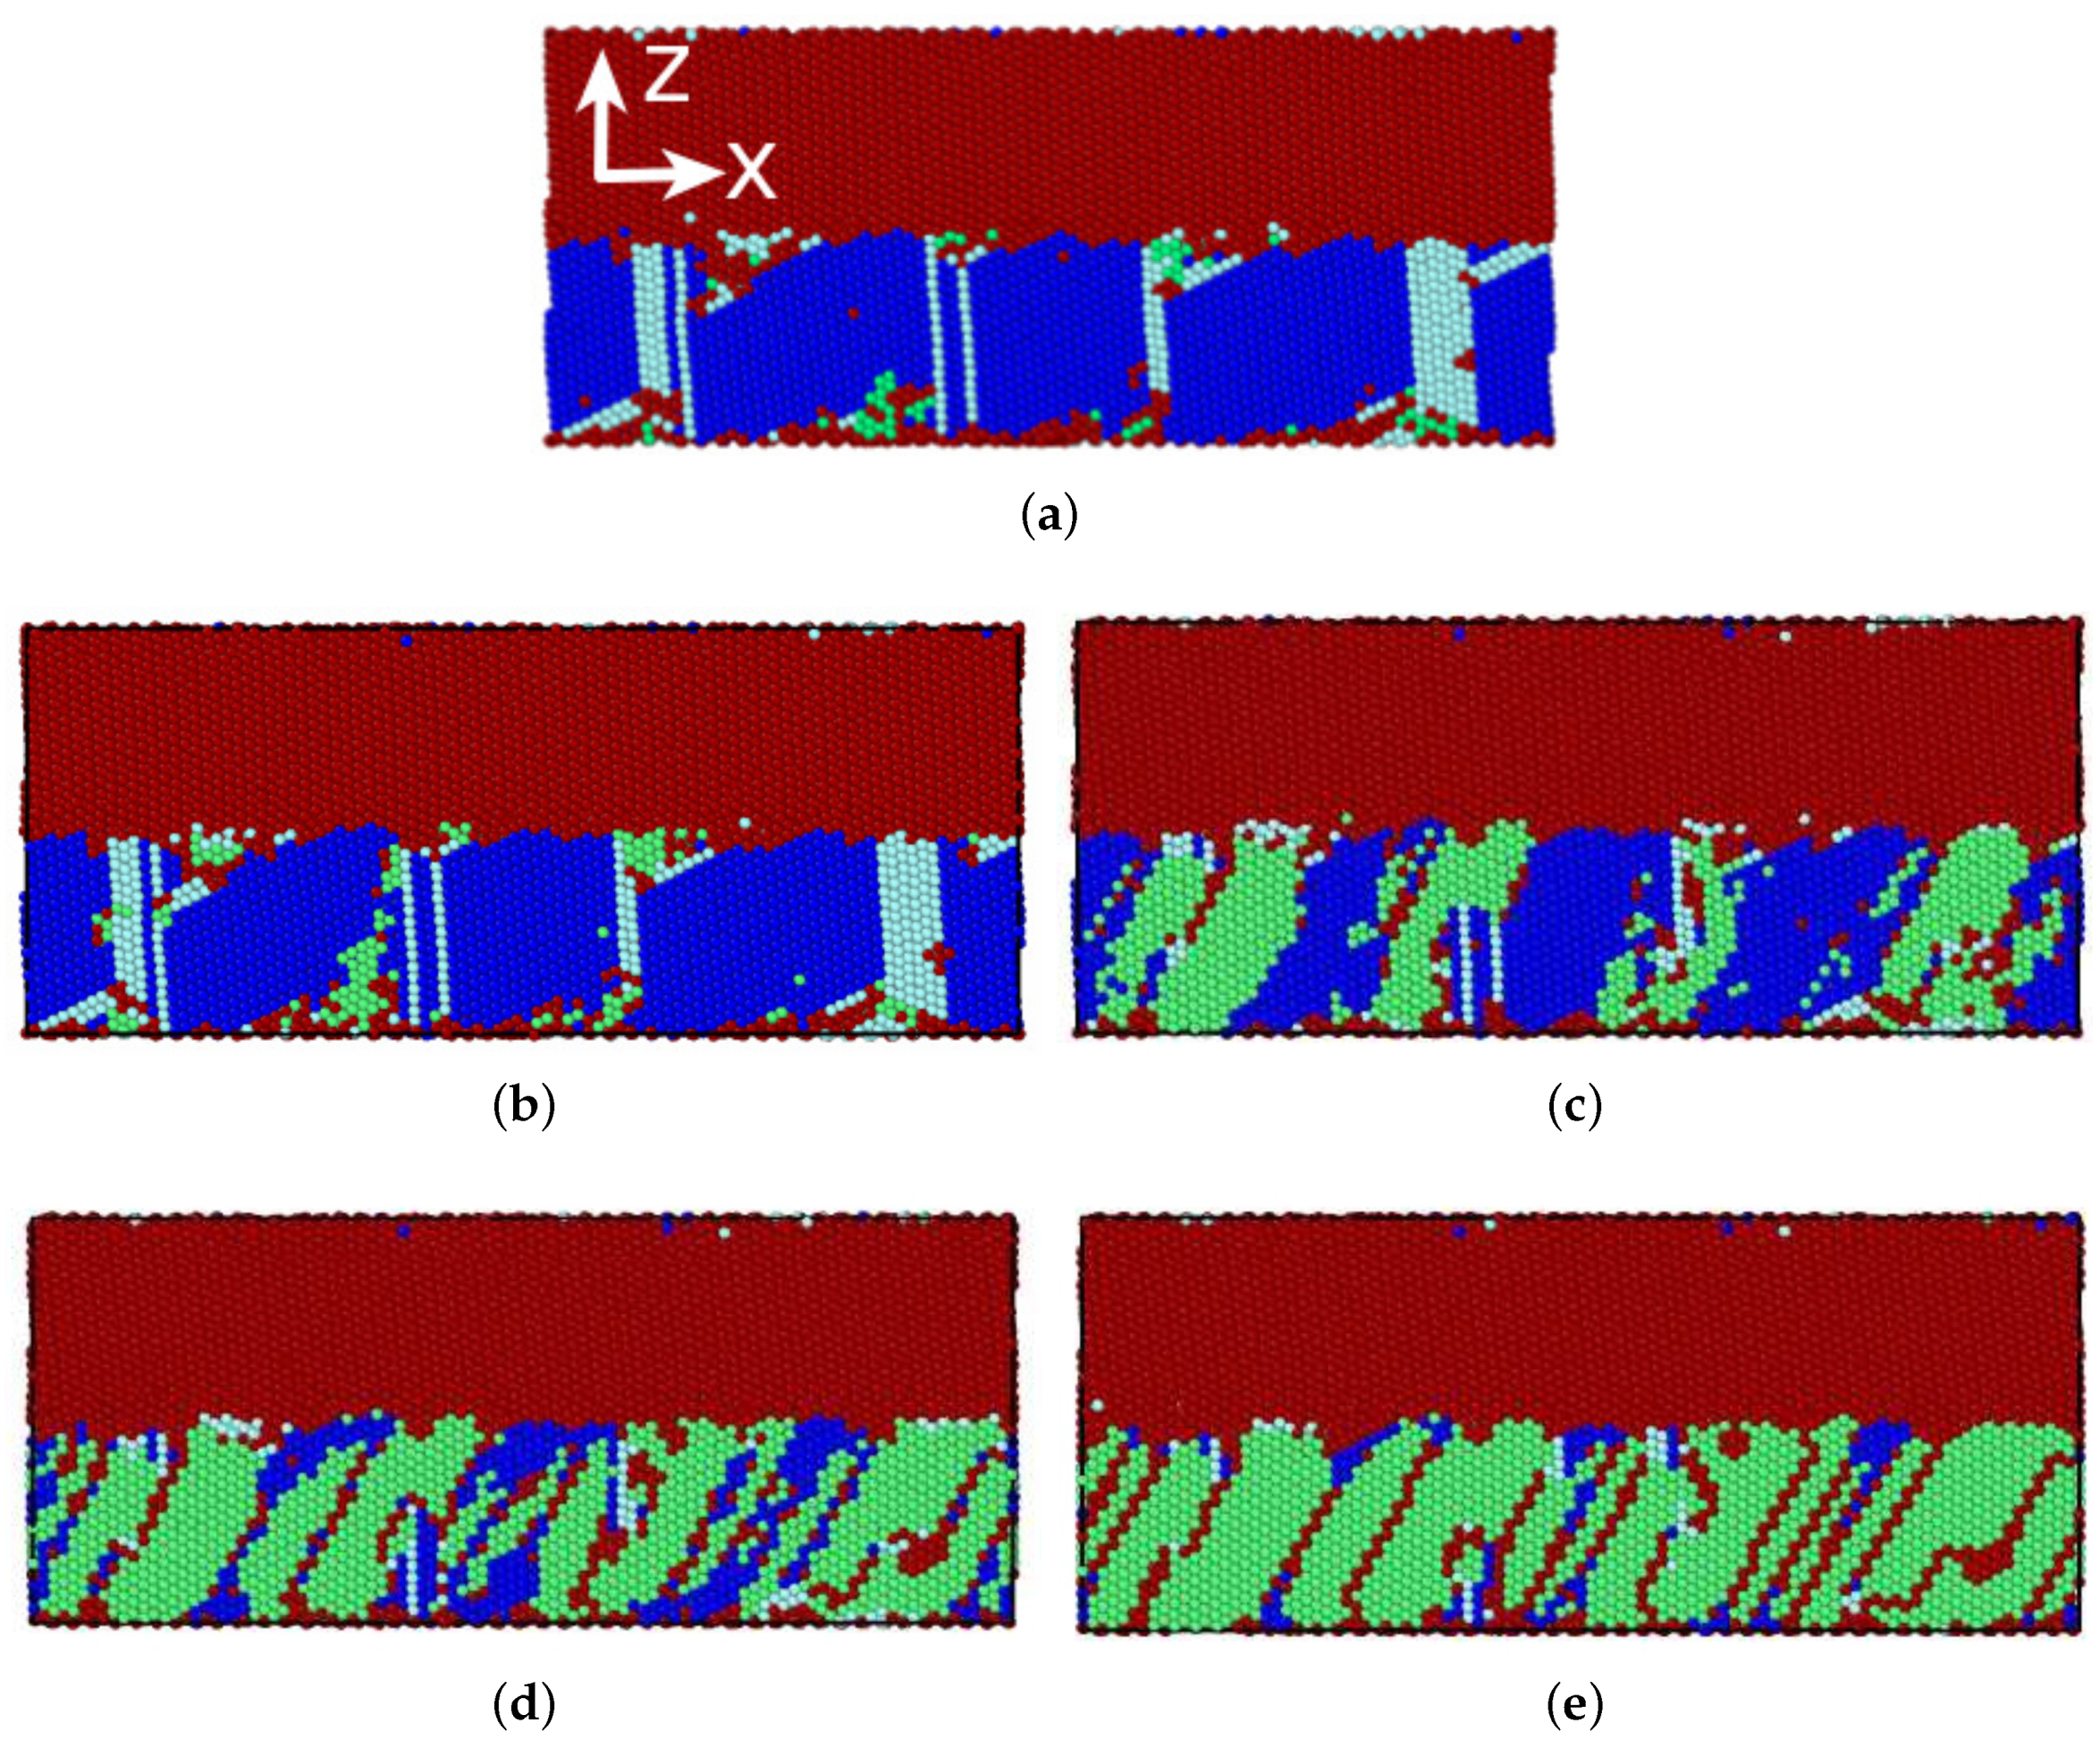
Figure 8 displays several snapshots illustrating the martensitic transformation. The initial structure of the austenite–cementite system—considerably above the martensitic transformation temperature—is displayed in Figure 8a. Due to the interface, the fcc Fe phase is crossed by hcp planes which span the entire phase from the top to the bottom interface. After cooling to 328 K (Figure 8b), the transformation process has barely started. The new phase nucleates at the interface, in the vicinity of these planar defect structures. Upon further cooling, the nucleated bcc phase spreads through the entire crystallite (cf. Figure 8c) at 288 K. Since the bcc phase can nucleate in several variants, grain boundaries develop between them. Upon further cooling, the new phase grows laterally (Figure 8d). Note that here, even after complete coolingm some fcc spots survive (Figure 8e), in particular in the vicinity of the interface.
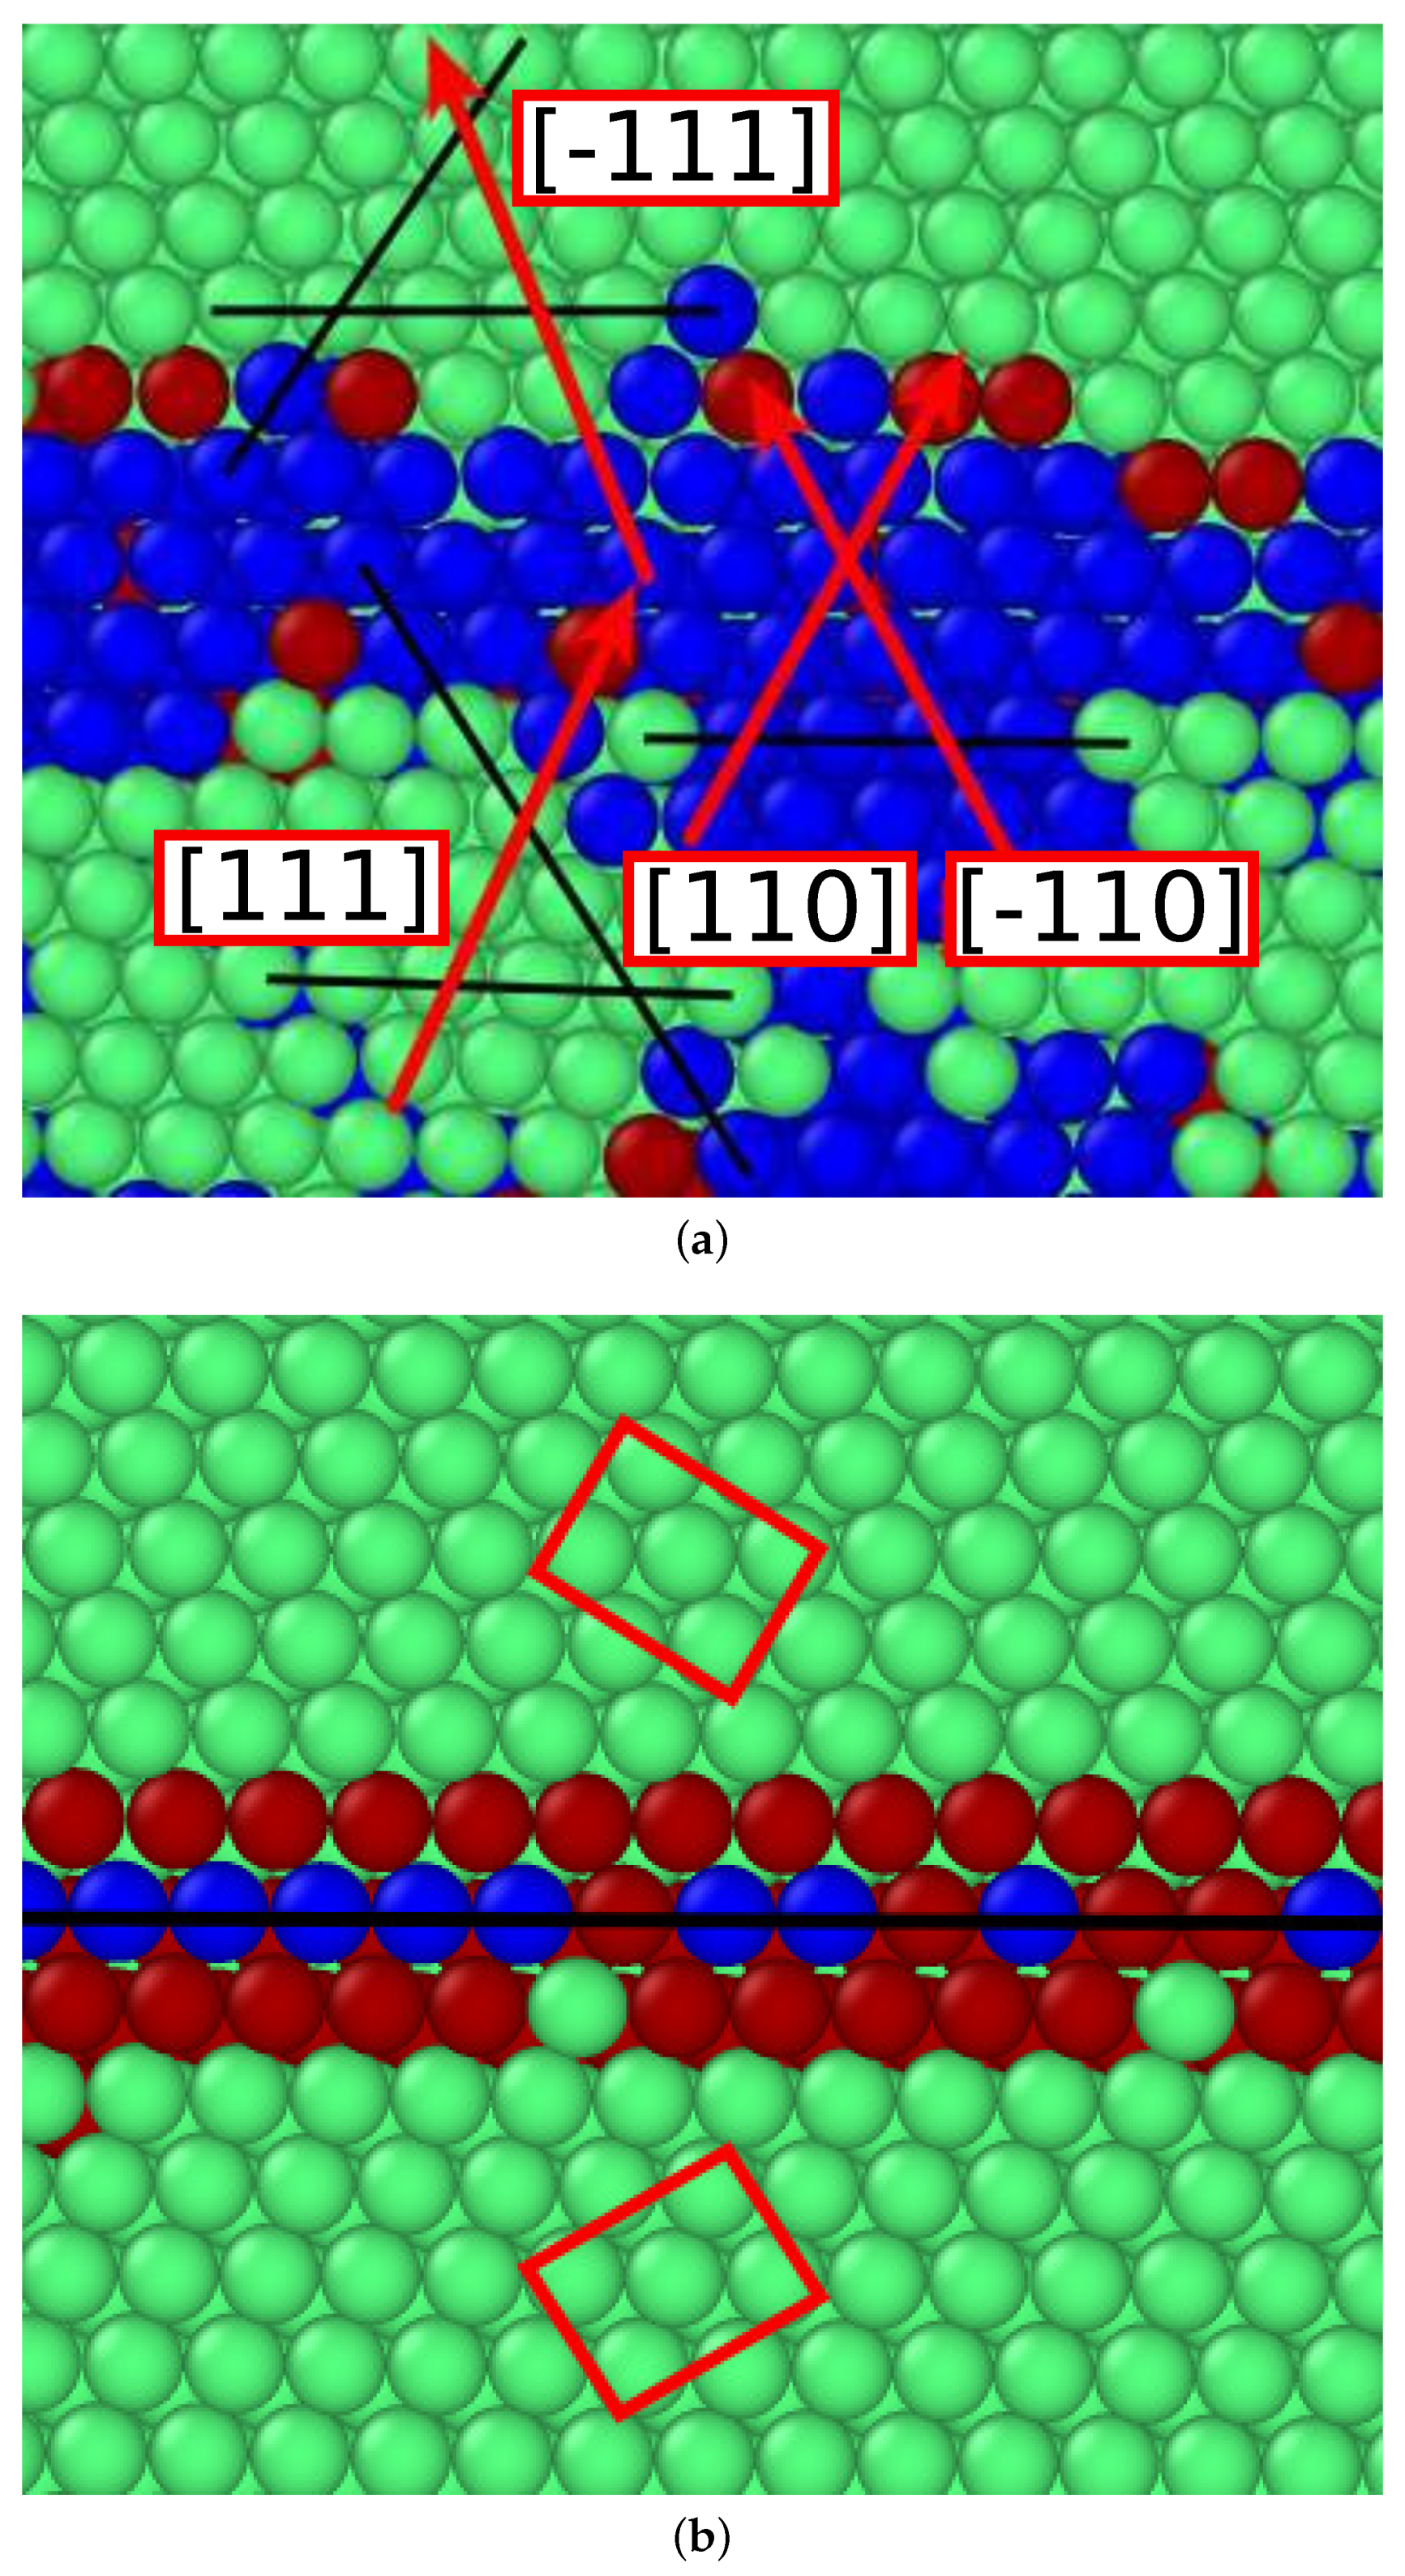
The transformation can be further discussed by following the transformation in detail; see Figure 9, which gives a view on the close-packed plane in the original fcc crystallite. The red arrows in Figure 9a mark the conserved directions in the close-packed plane, i.e., the plane or the plane, respectively. The fcc crystal has two variants to transform to: the directions transforms into the direction, and the direction transforms into the direction. This corresponds to the classical Kurdjumov–Sachs orientation relationship [66]
with the two variants of the direction conservation:
or
After the transition, a twin structure is built between these two variants, as shown in Figure 9b. The twin boundary is a plane.
4. Conclusions
Using classical MD simulation, we studied how the presence of a cementite phase modifies the – phase transformation behavior of iron. The Fe interaction is based on the Meyer–Entel potential which is known to incorporate the transformation in pure Fe. For modeling the C–Fe and the C–C interaction, we follow previous work and use a pair-potential approach; this is justified, since C does not diffuse from its sites in the time scales (ns) used in the simulation. We found that indeed our cementite model is stable in the temperature range investigated here, and its crystallographic and elastic properties are appropriately modeled.
The ferrite–cementite phase boundary is modeled according to the Bagaryatsky model; the interface is planar and the interface energy (0.6282 J/m) is in good agreement with literature values. Upon heating, the transformation of the Fe crystal sets in at 665–670 K. Note that, without a phase boundary, no transformation occurs up to the melting temperature, since defects (surfaces, grain boundaries, point defects, etc.) are needed for the new phase to nucleate. As the free energy of the two close-packed Fe phases (fcc and hcp) are nearly identical in the Meyer–Entel potential, and at high energies the hcp phase is slightly preferred, the resulting phase is mostly hcp. The orientation relationships at the interface obey the Mao et al. [62] rules. Due to the different variants nucleated at the interface, the resulting microstructure is characterized by a polycrystalline network, with some embedded SFs.
We also modeled an austenite–cementite interface based on the Pitsch–Petch model. Since the fcc phase is not stable at 0 K, the interface properties were determined at 400 K, above the martensitic transformation temperature. Here, no comparison to literature values is possible; however, our interface energy of 0.3892 J/m is low enough and comparable to that of the ferrite–cementite interface. Most notably, the interface did not remain planar under high-temperature anneal but developed a faceted structure; in addition, planar defects (SFs and thin hcp plates) started at the facet edges and spanned the entire austenite film. The new phase nucleates at the interface, in the vicinity of these planar defect structures. It obeys the Kurdjumov–Sachs orientation relationships resulting in a twinned microstructure of the transformed phase.
Author Contributions
J.M. performed the simulations and analyzed the results. J.M. and H.M.U. designed the work, discussed the results and wrote the manuscript.
Funding
This research was funded by the Deutsche Forschungsgemeinschaft via the Sonderforschungsbereich 926.
Acknowledgments
Access to the computational resources provided by the compute cluster “Elwetritsch” of the University of Kaiserslautern is appreciated.
Conflicts of Interest
The authors declare no conflict of interest.
References
- Yang, Z.; Johnson, R.A. An eam simulation of the α–γ iron interface. Model. Simul. Mater. Sci. Eng. 1993, 1, 707. [Google Scholar] [CrossRef]
- Bos, C.; Sietsma, J.; Thijsse, B.J. Molecular dynamics simulation of interface dynamics during the fcc-bcc transformation of a martensitic nature. Phys. Rev. B 2006, 73, 104117. [Google Scholar] [CrossRef]
- Sandoval, L.; Urbassek, H.M.; Entel, P. Solid-solid phase transitions and phonon softening in an embedded-atom method model for iron. Phys. Rev. B 2009, 80, 214108. [Google Scholar] [CrossRef]
- Sandoval, L.; Urbassek, H.M. Transformation pathways in the solid-solid phase transitions of iron nanowires. Appl. Phys. Lett. 2009, 95, 191909. [Google Scholar] [CrossRef]
- Sandoval, L.; Urbassek, H.M.; Entel, P. The Bain versus Nishiyama-Wassermann path in the martensitic transformation of Fe. New J. Phys. 2009, 11, 103027. [Google Scholar] [CrossRef]
- Urbassek, H.M.; Sandoval, L. Molecular dynamics modeling of martensitic transformations in steels. Phase Transformations in Steels; Pereloma, E., Edmonds, D.V., Eds.; Woodhead Publishing Limited: Cambridge, UK, 2012; Volume 2, pp. 433–463. [Google Scholar]
- Wang, B.; Urbassek, H.M. Phase transitions in an Fe system containing a bcc/fcc phase boundary: An atomistic study. Phys. Rev. B 2013, 87, 104108. [Google Scholar] [CrossRef]
- Wang, B.; Urbassek, H.M. Role of the Surface in Solid–Solid Phase Transitions: Molecular Dynamics Study of the α–γ Transition in Fe. Metall. Mater. Trans. A 2016, 47, 2471–2480. [Google Scholar] [CrossRef]
- Meiser, J.; Urbassek, H.M. Martensitic transformation of pure iron at a grain boundary: Atomistic evidence for a two-step Kurdjumov–Sachs-Pitsch pathway. AIP Adv. 2016, 6, 085017. [Google Scholar] [CrossRef]
- Karewar, S.; Sietsma, J.; Santofimia, M.J. Effect of pre-existing defects in the parent fcc phase on atomistic mechanisms during the martensitic transformation in pure Fe: A molecular dynamics study. Acta Mater. 2018, 142, 71–81. [Google Scholar] [CrossRef]
- Wang, B.; Urbassek, H.M. Atomistic dynamics of the bcc ↔ fcc phase transition in iron: Competition of homo- and heterogeneous phase growth. Comput. Mater. Sci. 2014, 81, 170–177. [Google Scholar] [CrossRef]
- Meyer, R.; Entel, P. Martensite-austenite transition and phonon dispersion curves of Fe1 − xNix studied by molecular-dynamics simulations. Phys. Rev. B 1998, 57, 5140. [Google Scholar] [CrossRef]
- Wang, B.; Sak-Saracino, E.; Gunkelmann, N.; Urbassek, H.M. Molecular-dynamics study of the α↔γ phase transition in Fe-C. Comput. Mater. Sci. 2014, 82, 399–404. [Google Scholar] [CrossRef]
- Wang, B.; Sak-Saracino, E.; Sandoval, L.; Urbassek, H.M. Martensitic and austenitic phase transformations in Fe-C nanowires. Model. Simul. Mater. Sci. Eng. 2014, 22, 045003. [Google Scholar] [CrossRef]
- Sak-Saracino, E.; Urbassek, H.M. Temperature-induced phase transformation of Fe1 − xNix alloys: Molecular-dynamics approach. Eur. Phys. J. B 2015, 88, 169. [Google Scholar] [CrossRef]
- Toji, Y.; Matsuda, H.; Herbig, M.; Choi, P.P.; Raabe, D. Atomic-scale analysis of carbon partitioning between martensite and austenite by atom probe tomography and correlative transmission electron microscopy. Acta Mater. 2014, 65, 215–228. [Google Scholar] [CrossRef]
- Toji, Y.; Miyamoto, G.; Raabe, D. Carbon partitioning during quenching and partitioning heat treatment accompanied by carbide precipitation. Acta Mater. 2015, 86, 137–147. [Google Scholar] [CrossRef]
- Castro Cerda, F.M.; Goulas, C.; Sabirov, I.; Papaefthymiou, S.; Monsalve, A.; Petrov, R.H. Microstructure, texture and mechanical properties in a low carbon steel after ultrafast heating. Mater. Sci. Eng. A 2016, 672, 108–120. [Google Scholar] [CrossRef]
- Castro Cerda, F.M.; Schulz, B.; Papaefthymiou, S.; Artigas, A.; Monsalve, A.; Petrov, R.H. The Effect of Ultrafast Heating on Cold-Rolled Low Carbon Steel: Formation and Decomposition of Austenite. Metals 2016, 6, 321. [Google Scholar] [CrossRef]
- Bouzouni, M.; Papaefthymiou, S. Preliminary Study of Carbide Dissolution during an Ultra-Fast Heat Treatment in Chromium Molybdenum Steel. Int. J. Metall. Met. Phys. 2017, 2, 005. [Google Scholar]
- Bouzouni, M.; Papaefthymiou, S. Modeling of the Steel Microstructure Gained after the Application of an Ultra-Fast Heat Treatment. J. Nanosci. Adv. Tech. 2017, 2, 15–19. [Google Scholar] [CrossRef]
- Papaefthymiou, S.; Goulas, C.; Cerda, F.M.C.; Geerlofs, N.; Petrov, R. The Effect of Heating Rate on the Microstructure of a Soft-Annealed Medium Carbon Steel. Steel Res. Int. 2017, 88, 1700158. [Google Scholar] [CrossRef]
- Cerda, F.M.C.; Vercruysse, F.; Goulas, C.; Schulz, B.; Petrov, R.H. ‘Flash’ Annealing in a Cold-Rolled Low Carbon Steel Alloyed With Cr, Mn, Mo, and Nb: Part I—Continuous Phase Transformations. Steel Res. Int. 2018. [Google Scholar] [CrossRef]
- Ghaemifar, S.; Mirzadeh, H. Refinement of Banded Structure via Thermal Cycling and Its Effects on Mechanical Properties of Dual Phase Steel. Steel Res. Int. 2018, 89, 1700531. [Google Scholar] [CrossRef]
- Papaefthymiou, S.; Bouzouni, M.; Petrov, R.H. Study of Carbide Dissolution and Austenite Formation during Ultra—Fast Heating in Medium Carbon Chromium Molybdenum Steel, Metals. Metals 2018, 8, 646. [Google Scholar] [CrossRef]
- Howe, J.M.; Spanos, G. Atomic structure of the austenite-cementite interface of proeutectoid cementite plates. Philos. Mag. A 1999, 79, 9. [Google Scholar] [CrossRef]
- Shtansky, D.V.; Nakai, K.; Ohmori, Y. Mechanism and crystallography of ferrite precipitation from cementite in an Fe-Cr-C alloy during austenitization. Philos. Mag. A 1999, 79, 1655. [Google Scholar]
- Gerstein, G.; Nürnberger, F.; Dudzinski, W.; Grygier, D.; Schaper, M.; Milenin, A. Structural evolution of thin lamellar cementite during cold drawing of eutectoid steels. Procedia Eng. 2014, 81, 694–699. [Google Scholar] [CrossRef]
- Zhou, D.S.; Shiflet, G.J. Ferrite: cementite crystallography in pearlite. Metall. Mater. Trans. A 1992, 23, 1259–1269. [Google Scholar] [CrossRef]
- Bagaryatsky, Y.A. Possible mechanism of martensite decomposition. Dokl. Akad. Nauk. SSSR 1950, 73, 1161–1164. [Google Scholar]
- Petch, N.J. The orientation relationships between cementite and α-iron. Acta Cryst. 1953, 6, 96. [Google Scholar] [CrossRef]
- Pitsch, W. Der Orientierungszusammenhang zwischen Zementit und Ferrit im Perlit. Acta Metall. 1962, 10, 79–80. [Google Scholar] [CrossRef]
- Ghosh, G. A first-principles study of cementite (Fe3C) and its alloyed counterparts: Elastic constants, elastic anisotropies, and isotropic elastic moduli. AIP Adv. 2015, 5, 087102. [Google Scholar] [CrossRef]
- Ledbetter, H. Polycrystalline elastic constants of in situ cementite (Fe3C). Mat. Sci. Eng. A 2010, 527, 2657. [Google Scholar] [CrossRef]
- Liyanage, L.S.I.; Kim, S.G.; Houze, J.; Kim, S.; Tschopp, M.A.; Baskes, M.I.; Horstemeyer, M.F. Structural, elastic, and thermal properties of cementite (Fe3C) calculated using a modified embedded atom method. Phys. Rev. B 2014, 89, 094102. [Google Scholar] [CrossRef]
- Ghaffarian, H.; Taheri, A.K.; Ryu, S.; Kang, K. Nanoindentation study of cementite size and temperature effects in nanocomposite pearlite: A molecular dynamics simulation. Curr. Appl. Phys. 2016, 16, 1015–1025. [Google Scholar] [CrossRef] [Green Version]
- Nematollahi, G.A.; von Pezold, J.; Neugebauer, J.; Raabe, D. Thermodynamics of carbon solubility in ferrite and vacancy formation in cementite in strained pearlite. Acta Mater. 2013, 61, 1773–1784. [Google Scholar] [CrossRef]
- Kim, J.; Kang, K.; Ryu, S. Characterization of the misfit dislocations at the ferrite/cementite interface in pearlitic steel: An atomistic simulation study. Int. J. Plast. 2016, 83, 302–312. [Google Scholar] [CrossRef]
- Levchenko, E.V.; Evteev, A.V.; Belova, I.V.; Murch, G.E. Molecular dynamics simulation and theoretical analysis of carbon diffusion in cementite. Acta Mater. 2009, 57, 846. [Google Scholar] [CrossRef]
- Evteev, A.; Levchenko, E.; Belova, I.; Murch, G. Atomic Mechanism of Carbon Diffusion in Cementite. Defect Diffus. Forum 2008, 277, 101. [Google Scholar] [CrossRef]
- Nose, S. A unified formulation of the constant temperature molecular dynamics methods. J. Chem. Phys. 1984, 81, 511. [Google Scholar] [CrossRef]
- Hoover, W.G. Canonical dynamics: equilibrium phase-space distribution. Phys. Rev. A 1985, 31, 1695. [Google Scholar] [CrossRef]
- Plimpton, S. Fast Parallel Algorithms for Short-Range Molecular Dynamics. J. Comput. Phys. 1995, 117, 1–19. [Google Scholar] [CrossRef] [Green Version]
- Stukowski, A. Visualization and analysis of atomistic simulation data with OVITO—The Open Visualization Tool. Model. Simul. Mater. Sci. Eng. 2010, 18, 015012. [Google Scholar] [CrossRef]
- Faken, D.; Jonsson, H. Systematic analysis of local atomic structure combined with 3D computer graphics. Comput. Mater. Sci. 1994, 2, 279–286. [Google Scholar] [CrossRef]
- Honeycutt, J.D.; Andersen, H.C. Molecular dynamics study of melting and freezing of small Lennard-Jones clusters. J. Phys. Chem. 1987, 91, 4950–4963. [Google Scholar] [CrossRef]
- Johnson, R.A.; Dienes, G.J.; Damask, A.C. Calculations of the energy and migration characteristics of carbon and nitrogen in alpha-iron and vanadium. Acta Metall. 1964, 12, 1215. [Google Scholar] [CrossRef]
- Sak-Saracino, E.; Urbassek, H.M. Free energies of austenite and martensite Fe-C alloys: an atomistic study. Philos. Mag. 2014, 94, 933–945. [Google Scholar] [CrossRef]
- Sak-Saracino, E.; Urbassek, H.M. The α↔γ transformation of an Fe1 − xCrx alloy: A molecular-dynamics approach. Int. J. Mod. Phys. C 2016, 27, 1650124. [Google Scholar] [CrossRef]
- Gunkelmann, N.; Ledbetter, H.; Urbassek, H.M. Experimental and atomistic study of the elastic properties of α′ Fe-C martensite. Acta Mater. 2012, 60, 4901–4907. [Google Scholar] [CrossRef]
- Janßen, J.; Gunkelmann, N.; Urbassek, H.M. Influence of C concentration on elastic moduli of α′-Fe1 − xCx alloys. Philos. Mag. 2016, 96, 1448–1462. [Google Scholar] [CrossRef]
- Eckstein, W. Computer Simulation of Ion-Solid Interactions; Springer: Berlin, Germany, 1991. [Google Scholar]
- Andersen, H.H.; Sigmund, P. Defect distributions in channeling experiments. Nucl. Instr. Meth. 1965, 38, 238. [Google Scholar] [CrossRef]
- Hestenes, M.R.; Stiefel, E. Methods of Conjugate Gradients for Solving Linear Systems. J. Res. Natl. Bur. Stand. 1952, 49, 409. [Google Scholar] [CrossRef]
- Wood, I.G.; Vocadlo, L.; Knight, K.S.; Dobson, D.P.; Marshall, W.G.; Price, G.D.; Brodholt, J. Thermal expansion and crystal structure of cementite, Fe3C, between 4 and 600 K determined by time-of-flight neutron powder diffraction. J. Appl. Crystallogr. 2004, 37, 82–90. [Google Scholar] [CrossRef]
- Henriksson, K.O.E.; Nordlund, K. Simulations of cementite: An analytical potential for the Fe-C system. Phys. Rev. B 2009, 79, 144107. [Google Scholar] [CrossRef]
- Mookherjee, M. Elasticity and anisotropy of Fe3C at high pressures. Am. Mineral. 2011, 96, 1530–1536. [Google Scholar] [CrossRef]
- Meyer, R. Computersimulationen Martensitischer Phasenübergänge in Eisen-Nickel- und Nickel-Aluminium- Legierungen. Ph.D. Thesis, University Duisburg, Duisburg, Germany, 1995. [Google Scholar]
- Freitas, R.; Asta, M.; de Koning, M. Nonequilibrium free-energy calculation of solids using LAMMPS. Comput. Mater. Sci. 2016, 112, 333. [Google Scholar] [CrossRef]
- Wang, B.; Urbassek, H.M. Computer simulation of strain-induced phase transformations in thin Fe films. Model. Simul. Mater. Sci. Eng. 2013, 21, 085007. [Google Scholar] [CrossRef]
- Sak-Saracino, E.; Urbassek, H.M. Effect of uni- and biaxial strain on phase transformations in Fe thin films. Int. J. Comp. Mat. Sci. Eng. 2016, 5, 1650001. [Google Scholar] [CrossRef]
- Mao, H.K.; Bassett, W.A.; Takahashi, T. Effect of pressure on crystal structure and lattice parameters of iron up to 300 kbar. J. Appl. Phys. 1967, 38, 272. [Google Scholar] [CrossRef]
- Wang, F.M.; Ingalls, R. Iron bcc-hcp transition: Local structure from x-ray-absorption fine structure. Phys. Rev. B 1998, 57, 5647. [Google Scholar] [CrossRef]
- Nishiyama, Z. Mechanism of transformation from face-centred to body-centred cubic lattice. Sci. Rep. Tohoku Imp. Univ. 1934, 23, 637. [Google Scholar]
- Wassermann, G. Einfluß der α–γ-Umwandlung eines irreversiblen Nickelstahls auf Kristallorientierung und Zugfestigkeit. Arch. Eisenhüttenwes 1933, 6, 347. [Google Scholar] [CrossRef]
- Kurdjumov, G.V.; Sachs, G. Über den Mechanismus der Stahlhärtung. Z. Phys. 1930, 64, 325–343. [Google Scholar] [CrossRef]
Figure 1.
(a) Orthorhombic cementite unit cell (Green: Fe; blue: C). (b) Setup of simulation system for a ferrite (green)/cementite (red) bicrystal. The interface lies in a x–z plane.
Figure 1.
(a) Orthorhombic cementite unit cell (Green: Fe; blue: C). (b) Setup of simulation system for a ferrite (green)/cementite (red) bicrystal. The interface lies in a x–z plane.
Figure 2.
Top view—from the cementite side—of the Bagaryatsky interface: (a) after the first conjugate-gradient minimization; (b) after the second conjugate-gradient minimization; and (c) after the phase transition, at 1104 K (cf. Figure 6d). Only the Fe atoms on the iron side of the interface are shown. They are colored by their local lattice structure as determined by CNA: bcc (green); fcc (dark blue); hcp (light blue); and unidentified (red).
Figure 3.
Perspective view—from the iron side—of the Bagaryatsky interface after the second conjugate-gradient minimization (cf. Figure 2b). To highlight the defect structure, all bcc and cementite atoms are deleted. Atoms are colored as in Figure 2.
Figure 4.
Top view—from the cementite side—of the Pitsch–Petch interface (a) before (at 400 K) and (b) after (at 1 K) the martensitic transformation. Only the Fe atoms on the iron side of the interface are shown. (c) A side view of the interface at 400 K, before the martensitic transformation. The cross section is located at the green line in (a) and has a width of 7 nm. Atoms are colored as in Figure 2.
Figure 5.
Variation in the length of the simulation volume in z direction (perpendicular to the interface plane) with temperature for: (a) the austenitic transformation; and (b) the martensitic transformation.
Figure 5.
Variation in the length of the simulation volume in z direction (perpendicular to the interface plane) with temperature for: (a) the austenitic transformation; and (b) the martensitic transformation.
Figure 6.
Cross-sectional views (in the z–y plane) of the transforming system during the austenitic transformation at: 1 K (a); 631 K (b); 671 K (c); and 1104 K (d). Atoms are colored as in Figure 2; in particular, the cementite crystallite is red.
Figure 6.
Cross-sectional views (in the z–y plane) of the transforming system during the austenitic transformation at: 1 K (a); 631 K (b); 671 K (c); and 1104 K (d). Atoms are colored as in Figure 2; in particular, the cementite crystallite is red.
Figure 7.
View on the transforming system at a temperature of 671 K, corresponding to Figure 6c. The view direction is perpendicular on a plane. In this plane, the direction transforms into the direction by an expansion (blue arrows) The direction transforms into the direction by a compression (red arrows). The black hexagons show the transformation from the relevant atoms in the bcc crystal into the hcp unit cell. Atoms are colored as in Figure 2.

Figure 8.
Cross-sectional views (in the z–x plane) of the transforming system during the martensitic transformation at: 400 K (a); 328 K (b); 288 K (c); 208 K (d); and 4 K (e). Atoms are colored as in Figure 2; in particular, the cementite crystallite is red.
Figure 8.
Cross-sectional views (in the z–x plane) of the transforming system during the martensitic transformation at: 400 K (a); 328 K (b); 288 K (c); 208 K (d); and 4 K (e). Atoms are colored as in Figure 2; in particular, the cementite crystallite is red.

Figure 9.
View on the transforming system at a temperature of: (a) 208 K, corresponding to Figure 8d; and (b) 4 K, corresponding to Figure 8e. The view direction is perpendicular on a plane. Red arrows mark the conserved directions, and . After finishing the transformation, a twin boundary has been formed; red rectangles mark the twin structure in (b).
Table 1.
Lattice constants (a) and elastic constants (b) of cementite: present results compared with literature data.

© 2018 by the authors. Licensee MDPI, Basel, Switzerland. This article is an open access article distributed under the terms and conditions of the Creative Commons Attribution (CC BY) license (http://creativecommons.org/licenses/by/4.0/).
Share and Cite
MDPI and ACS Style
Meiser, J.; Urbassek, H.M. Ferrite-to-Austenite and Austenite-to-Martensite Phase Transformations in the Vicinity of a Cementite Particle: A Molecular Dynamics Approach. Metals 2018, 8, 837. https://doi.org/10.3390/met8100837
AMA Style
Meiser J, Urbassek HM. Ferrite-to-Austenite and Austenite-to-Martensite Phase Transformations in the Vicinity of a Cementite Particle: A Molecular Dynamics Approach. Metals. 2018; 8(10):837. https://doi.org/10.3390/met8100837
Chicago/Turabian StyleMeiser, Jerome, and Herbert M. Urbassek. 2018. "Ferrite-to-Austenite and Austenite-to-Martensite Phase Transformations in the Vicinity of a Cementite Particle: A Molecular Dynamics Approach" Metals 8, no. 10: 837. https://doi.org/10.3390/met8100837
Note that from the first issue of 2016, this journal uses article numbers instead of page numbers. See further details here.