Surface Morphology and Its Influence on Cyclic Deformation Behavior of High-Mn TWIP Steel

Institute of Materials Science and Engineering, University of Kaiserslautern, 67663 Kaiserslautern, Germany
*
Author to whom correspondence should be addressed.
Metals 2018, 8(10), 832; https://doi.org/10.3390/met8100832
Submission received: 13 September 2018
/
Revised: 2 October 2018
/
Accepted: 12 October 2018
/
Published: 16 October 2018
Abstract
:In this study, the dependence of the cyclic deformation behavior on the surface morphology of metastable austenitic HSD® 600 TWinning Induced Plasticity (TWIP) steel was investigated. This steel—with the alloying concept Mn-Al-Si—shows a fully austenitic microstructure with deformation-induced twinning at ambient temperature. Four different surface morphologies were analyzed: as-received with a so-called rolling skin, after up milling, after down milling, and a reference morphology achieved by polishing. The morphologies were characterized by X-Ray Diffraction (XRD), Focused Ion Beam (FIB), Scanning Electron Microscopy (SEM) as well as confocal microscopy methods and show significant differences in initial residual stresses, phase fractions, topographies and microstructures. For specimens with all variants of the morphologies, fatigue tests were performed in the Low Cycle Fatigue (LCF) and High Cycle Fatigue (HCF) regime to characterize the cyclic deformation behavior and fatigue life. Moreover, this study focused on the frequency-dependent self-heating of the specimens caused by cyclic plasticity in the HCF regime. The results show that both surface morphology and specimen temperature have a significant influence on the cyclic deformation behavior of HSD® 600 TWIP steel in the HCF regime.
1. Introduction
High-manganese fully metastable austenitic steels with the alloying concept Mn-Al-Si offer an outstanding combination of formability and strength due to deformation-induced mechanisms like twinning (TWinning Induced Plasticity, TWIP) and phase transformation from γ-austenite to ε-martensite and/or α’-martensite (TRansformation Induced Plasticity, TRIP) [1,2]. While the strain-induced martensite formation increases the tensile strength by progressive phase transformation, the deformation-induced twinning enhances formability and work hardening [3,4,5]. Two different paths of deformation-induced phase transformations have been reported, namely γ → α’ and γ → ε → α’ [6]. The deformation-induced twins appear as bundles of closely spaced twins with a thickness of a few nanometers which spread across the original grains [7]. They retard the strain localization by acting as strong barriers for dislocation motion, thereby increasing the dislocation density. This process is often called dynamic Hall-Petch effect [7,8,9]. Because of the extraordinary mechanical properties of TRIP and TWIP steels, they are suitable e.g., for high energy absorption, components produced by deep drawing and offer new possibilities in lightweight applications [4].
Besides the TRIP and TWIP effects, there are further microstructural mechanisms, such as dislocation formation and motion as well as the formation of stacking faults, which are responsible for the behavior of the material [10]. The occurrence of the aforementioned deformation-induced effects is strongly dependent on the Stacking Fault Energy (SFE). At lower values <20 mJ/m2 the TRIP effect occurs preferably, while at medium values from 20 to 60 mJ/m2 the TWIP effect can be observed. At values >60 mJ/m2 dislocation motion is the dominating microstructural mechanism during plastic deformation. It should be noted that the exact thresholds of the SFE vary in literature and the effects can occur simultaneously [6,11,12]. In this context, Galindo-Nava et al. [13] made detailed investigations about the formation of ε-martensite as nuclei for α’-martensite and twin formation. They reported that the evolution of micrometer scale ε-martensite and twins was obtained by overlapping stacking faults. Thus, ε-martensite is formed by the arrangement of intrinsic stacking faults on every second {111} plane, whereas twins are formed by overlapping three stacking faults on successive planes [14]. Dumay et al. [15] reported that ε-martensite as well as twinning contributed to the dynamic Hall–Petch effect by reducing the mean free path of dislocations and therefore led to a higher hardening rate in Fe-Mn steels. The SFE of high manganese steels strongly increases with increasing carbon and aluminum content [15,16,17,18]. The effect of manganese as well as silicon is more complex. Lu et al. [17] calculated an increasing SFE at ambient temperature as manganese content was risen but reported a strong interaction with other alloying elements, especially nickel. Pierce et al. [19] reported a decrease of the SFE with increasing manganese content but pointed out a strong interrelation to the free energies of the fcc and hcp phase. Silicon is reported to increase the SFE for small quantities <4 wt. % and decreasing it for higher quantities [15]. Furthermore, the SFE is dependent on temperature and therefore a change in temperature leads to a change in microstructural mechanisms. Martin et al. [20] investigated the deformation behavior and the occurring microstructural mechanisms of a low SFE TRIP/TWIP steel at different temperatures from −60 °C to 200 °C and observed a tremendous change in transformation behavior above ambient temperature. Increasing the temperature to 100 °C suppressed the deformation induced phase transformation and only dislocation motion and twinning were observed. A further increase of the temperature to 200 °C completely suppressed twinning and only dislocation motion was observable. Baeumer et al. [21] studied the effect of temperatures between −160 °C and 140 °C on the mechanical properties of three Fe-Mn austenitic steels. They found a strong decrease of the strain hardening rate, the volume fraction of deformation induced martensite and the amount of deformation induced twins with increasing temperatures. Both studies proved a high sensitivity of the main microstructural mechanisms even to temperature increases of a few degree centigrade (°C) above ambient temperature which affected strongly the materials behavior.
According to Kim et al. [22] and Bintu et al. [23], high manganese TWIP steels show a negative strain rate sensitivity in monotonic tensile tests. At higher strain rates of 10−1 s−1, after 15% total strain, the stress-strain curves lie below those obtained at lower strain rates of 10−3 s−1 and, consequently, lower tensile strengths occurred. These changes in stress strain behavior occurred significantly above the yield strength of the material (130% Rp0.2). Furthermore, the authors reported that, below the mentioned values of strain and stress, the materials behavior was nearly independent from the applied strain rate.
Wu et al. [24] investigated the cyclic deformation behavior of a high-Mn TWIP steel in the LCF regime. They reported an initial cyclic hardening followed by cyclic softening. They reported further, that the initial cyclic hardening was more pronounced with increasing total strain amplitude. Comparable results were found by Schilke et al. [25] who investigated austenitic steels with 12–13 wt. % manganese. Shao et al. [26,27] investigated the LCF behavior of three different high-Mn TWIP steels with varying content of carbon and observed increasing initial cyclic hardening with increasing total strain amplitude in the LCF regime. In addition, this study revealed a second cyclic hardening before the specimens failed. The initial cyclic hardening was due to dislocation multiplication and their interactions. Cyclic softening was caused by dislocation rearrangement into stable structures, introducing favorable dislocation paths. The second cyclic hardening was related to a change in dislocation structures and further dislocation pile-up. In References [26,27] investigations of the cyclic deformation behavior at very high strain amplitudes up to 8% are also shown. At strain amplitudes above 3% the initial cyclic softening is very pronounced and no cyclic softening occurred but cyclic saturation until failure. Moreover, the cyclic hardening ability at high strain amplitudes can be improved by increasing carbon content. Nikulin et al. [28] investigated the change in LCF properties of austenitic TRIP/TWIP steels with different aluminum and silicon contents and correlated the fatigue behavior with the monotonic behavior. In general, all investigated chemical compositions led to an initial cyclic hardening for a strain amplitude of 2%. Continuous secondary cyclic hardening was observed for alloys with Al contents ≥4 wt. %. For Al contents ≤3 wt. % a steady-state behavior was observed after initial hardening and secondary cyclic hardening occurred for an Al content of 2 wt. %. The authors concluded that improved fatigue properties can be obtained in high-Mn TRIP/TWIP steels with high proof strength. Concerning the fatigue crack propagation behavior, they observed a crack propagation path along ε-martensite and hence assumed that formation of ε-martensite influences fatigue crack growth. A second study of the same authors [29] focused on austenitic Fe-Mn-Cr-Ni-Si alloys with different Si contents, which developed ε-martensite fractions up to 80 vol % during loading in the LCF regime. It is assumed that whether the formation of ε-martensite has a beneficial or an adverse impact on fatigue life depends on the content of Si and consequently on the individual characteristics of the ε-martensite. Furthermore, twins were found in the γ-phase which were co-directional to the ε-martensite and provide a preferred crack propagation path along the {0001}ε plane. Ju et al. [30] confirmed these observations and reported that, depending on the alloy composition, ε-martensite can either promote brittle-like fatigue cracking along the γ/ε-interface, or inhibit fatigue damage accumulation due to geometrical constraints at a fatigue crack tip.
The available studies on HCF behavior of TRIP/TWIP steels mainly focus on fatigue lifetime of these materials [31]. Hamada et al. [32,33,34] investigated the HCF properties of four different high-Mn TWIP steels. They determined a fatigue limit of approximately 400 MPa. They further showed that the fatigue limit/ultimate tensile strength ratio is between 0.4 and 0.6 for the investigated materials. The cyclic deformation behavior is characterized by a short period of initial cyclic hardening followed by cyclic softening and saturation state. Furthermore, during cyclic straining of the investigated TWIP steels, planar slip bands are formed at early stages of fatigue loading, which intersected with grain boundaries and twins, inducing microcracks.
Numerous studies investigated the influence of pre-deformation [35,36] on the fatigue stress limit and how fatigue lifetimes of high-manganese TWIP steels can be extended by increasing the tensile strength, e.g., by an ultra-fine-grained microstructure or by plastic deformation before testing [37,38].
The surface morphology, consisting of residual stresses, phase fractions, roughness and the microstructure near the surface, has a significant influence on the fatigue behavior [39,40]. In the literature there are investigations about the influence of several surface treatments [41], like cryogenic turning [42], ultrasonic surface mechanical attrition treatments [43] or shot peening and deep rolling [44] to optimize the mechanical properties of metastable austenitic stainless steels. These efforts consist of modifying the surface layer of metastable austenitic stainless steels by compressive residual stresses, increasing the dislocation density, formation of nanostructures, formation of twins and phase transformation from γ-austenite to ε-martensite and/or α’-martensite. In this context, Smaga et al. [45] and Boemke et al. [42] reported that a martensitic nanocrystalline surface layer, induced by cryogenic turning of metastable austenitic stainless steel AISI 347, significantly improves the fatigue life due to reduced plastic strain and delayed fatigue crack initiation. Roland et al. [43] reported a beneficial influence of shot peening on the fatigue strength and cyclic deformation behavior of the low SFE metastable austenitic stainless steel AISI 316L. The surface treatment led to high compressive residual stresses up to −1000 MPa in the surface and a nanocrystalline surface layer, including twins and α’-martensite which significantly improved the fatigue strength. Altenberger et al. [44] reported a decreased plastic strain amplitude in HCF tests in shot peened and deep rolled specimens of metastable austenitic stainless steel AISI 304. They showed that surface treatment led to compressive residual stresses and deformation-induced α’-martensite which significantly delayed fatigue crack initiation. In the case of high-Mn TWIP steels, Shao et al. [27] induced a graded distribution of grain sizes by torsion, resulting in a fine-grained microstructure near the surface which became coarser with increasing distance to the surface of the specimen. This modified surface microstructure led to higher number of cycles to failure due to dislocation pile-up at grain boundaries. Kalsar et al. [46] reported an enhanced monotonic deformation behavior after introducing a gradient microstructure by mechanical attrition treatment at the surface of a high-Mn TWIP steel. The graded microstructure contained deformation-induced twins and showed a higher dislocation density.
Besides the surface morphology, self-heating of specimens due to cyclic plasticity during fatigue at medium to high frequency strongly influences the cyclic deformation behavior of metastable austenitic steels. Nikitin et al. [47] performed fatigue tests with varying test frequencies between 0.05 and 5 Hz and compared the resulting deformation behavior of the metastable austenitic stainless steel AISI 304. They reported a significantly lower number of cycles to failure when higher test frequencies were applied. The largest differences occurred between 2 Hz and 5 Hz, while the number of cycles to failure was similar when applying frequencies between 0.2 and 2 Hz. Due to self-heating effects, the temperature of the specimens tested with 5 Hz rose up to 100 °C and higher plastic strain amplitudes were observed due to an inhibited martensitic transformation. Pessoa et al. [48] made a detailed investigation about the influence of the test frequency in the range 1 Hz ≤ f ≤ 1000 Hz on the cyclic deformation behavior of AISI 304 in the HCF and VHCF (Very High Cycle Fatigue) regime. They demonstrated a clear influence of the test frequency due to self-heating of specimens for load increase tests as well as for single step tests. The authors pointed out that even active cooling of the specimens led to different temperatures depending on the test frequency, which influenced the cyclic deformation behavior in the same way as described in Reference [47]. Smaga et al. [49] carried out fatigue tests on AISI 347a with different strain rates of 0.01% s−1 < dε/dt < 10% s−1. When the strain rate was increased from 0.01% s−1 to 0.1% s−1 no difference in the specimen temperatures were measured. A further increase of the strain rate to 1% s−1 led to self-heating of the specimen of ΔT > 14 K which already delayed the formation of α’-martensite. At a strain rate of 10% s−1, changes in temperature of ΔT > 100 K were achieved, which led to a different cyclic deformation behavior due to complete suppression of the deformation-induced α’-martensite formation. Concerning the influence of self-heating depending on test frequency, in literature there are only investigations of stainless steels but not for high-Mn TWIP steels.
On this foreground, the present study investigates the cyclic deformation behavior of a high-Mn TWIP steel in the LCF and HCF regime and how different surface morphologies affect this. Specimens with four different surface morphologies were analyzed. In addition, the influence of plasticity induced self-heating during fatigue tests was investigated by applying different test frequencies and analyzing the temperature evolution and the resulting cyclic deformation behavior.
2. Experimental Setup and Investigated Material
2.1. Experimental Setup
For quantitative phase analyzes and to determine the residual stresses, a diffractometer “Empyrean” (Malvern Panalytical B. V., Almelo, the Netherlands) was used. The diffractometer was operated with CuKα radiation at 40 kV source voltage, 40 mA source current and a spot size of 2 mm × 2 mm (for 2θ = 40°). The quantitative phase analyzes were done using the Rietveld method [50]. The residual stresses were analyzed by the sin2ψ method with the peak of the (022)γ plane at 2θ = 74.6°. Scanning Electron Microscope (SEM) and Focused Ion Beam (FIB) analyses were carried out with a “GAIA3” dual beam FIB (Tescan s.r.o., Brno, Czech Republic) with a Ga-Ion beam equipped with an Electron Backscatter Diffraction (EBSD) module “Hikari Plus” (Ametek Inc., Berwyn, PA, USA). For EBSD measurements a beam voltage of 20 kV and a working distance of 7 mm was used. The scanning window was 250 µm × 250 µm and the step size was 0.25 µm. The specimens for SEM and XRD investigations to characterize the investigated material were ground up to 1200 grit and afterwards electrolytically polished for 60 s with methanol (CH3OH) + 2-butoxy-ethanol (C6H14O2) + perchloric acid (60%, HClO4). Surface topographies were characterized by confocal microscopy using “µSoft explorer” (NanoFocus AG, Oberhausen, Germany) and using tactile measurements with a “Perthometer M2” Mahr (Mahr GmbH, Göttingen, Germany). For confocal microscopy the measured area was 250 µm × 250 µm and for tactile measurement the measuring length was 1.75 mm.
For hardness measurements (HV10) a hardness testing system “ZHU 250 TOP”, (ZwickRoell GmbH & Co. KG, Ulm, Germany) was used. The applied testing force of 10 kp was held for 10 s.
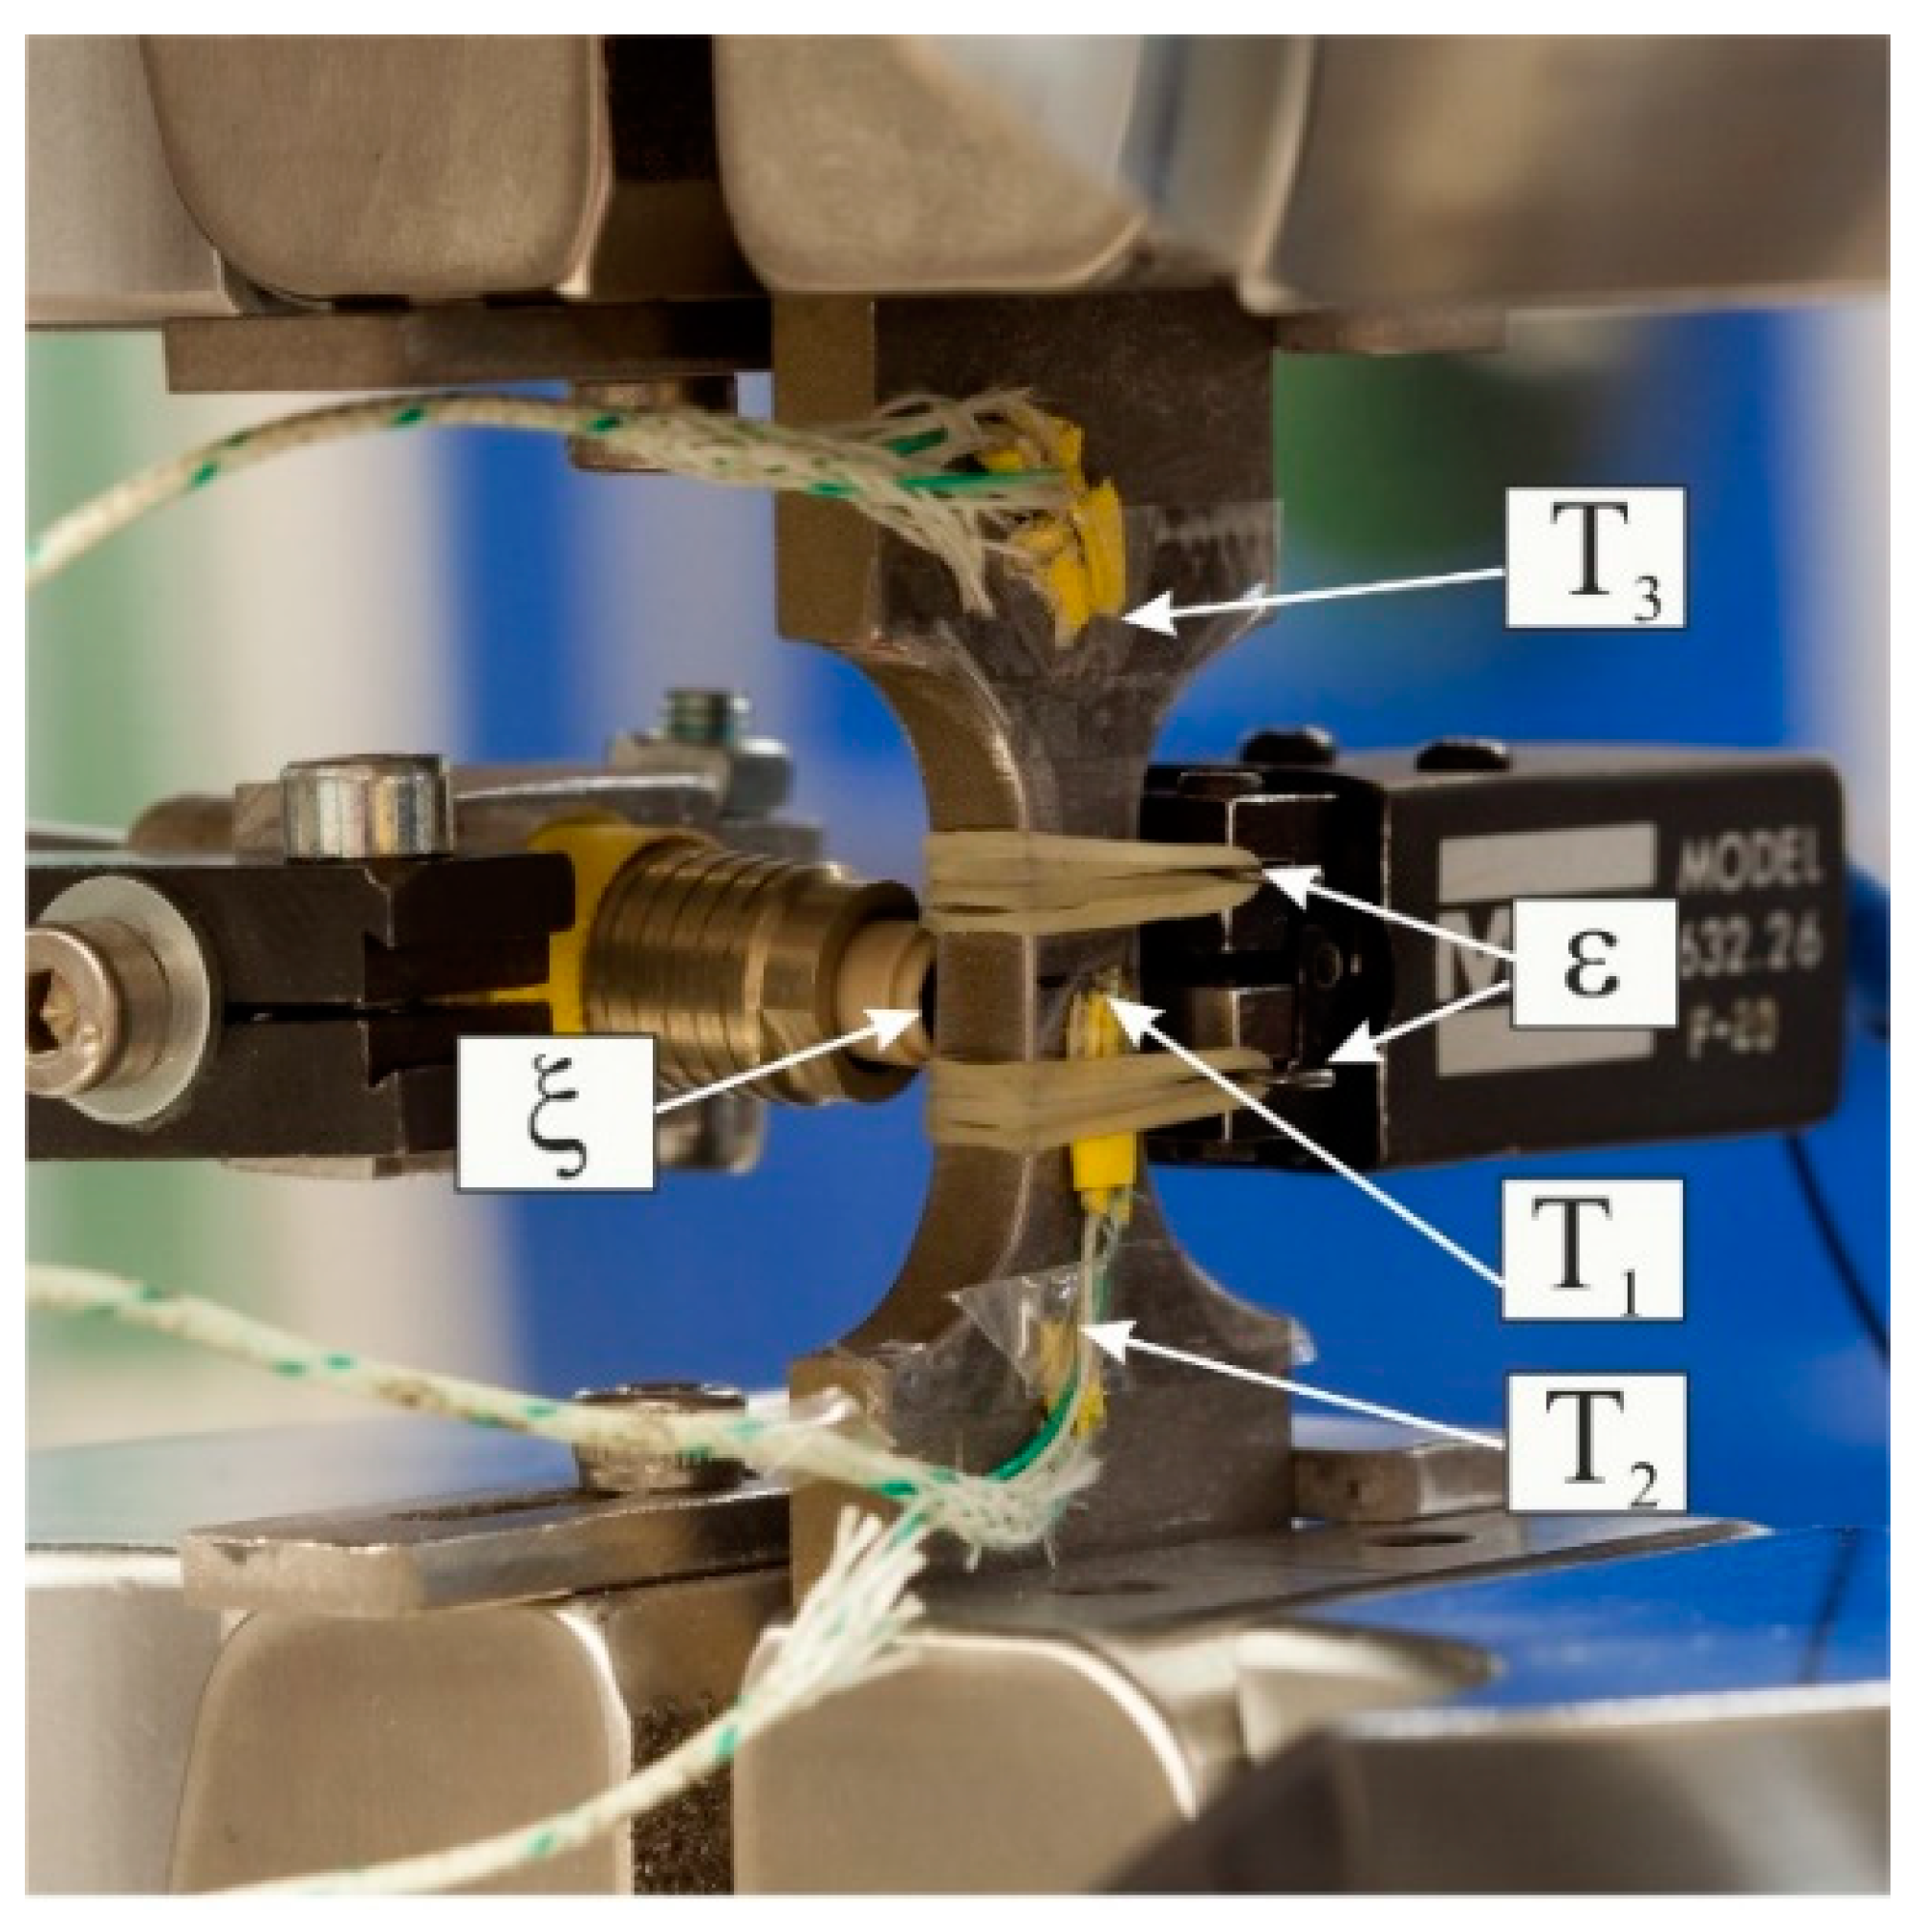
To characterize the cyclic deformation behavior, single step tests in the LCF and HCF regime were performed on flat fatigue specimens with a gage length of 8 mm at ambient temperature (AT) on a servohydraulic test system “MTS 810” (MTS, Eden Prairie, MN, USA) with a maximum force of ±100 kN (Figure 1). To characterize the cyclic deformation behavior in the LCF regime, total strain-controlled single step tests with a load ratio of Rε = −1 and a test frequency of f = 0.2 Hz were performed. In the HCF regime, stress controlled fatigue tests with a load ratio of R = −1 and test frequencies of f = 5 Hz, 2 Hz, 0.2 Hz were conducted. Besides stress-strain hysteresis, the temperatures of the specimen were measured by three thermocouples, and temperature change ΔT, for characterization of cyclic deformation behavior, were calculated using Equation (1).
ΔT = T1 − 0.5·(T2 + T3)
To consider possible temperature drift of the setup, the thermocouples T2 and T3 were applied above the radii of the fatigue specimen where only elastic deformation occurs from test set up. T1 was applied in the middle of the gage length, where elastic and plastic deformation occurs (Figure 1). The area of each hysteresis loop describes the cyclic plastic strain energy dissipated per unit volume during a given loading cycle, which is mainly dissipated into heat and, hence, results in a change in specimen temperature. Thus, an increase or decrease in ΔT correspond to cyclic softening or hardening, respectively [51,52].
The temperature distribution during fatigue testing was measured using an infrared camera “TIM 160” (Micro-Epsilon Messtechnik GmbH & Co. KG, Ortenburg, Germany). Additionally, the magnetic properties were measured in situ with a Feritscope® “MP30E” Helmut Fischer (Helmut Fischer GmbH, Sindelfingen, Germany) for specimens with the as-received morphology, i.e., with a so-called rolling skin, because this rolling skin showed phase transformation from γ-austenite to α’-martensite during fatigue tests while the austenitic microstructure of the bulk material was stable against phase transformation. The rolling skin was removed in case of the other investigated morphologies, see Reference [53] for further details.
2.2. Investigated Material
The HSD® 600 TWIP steel, a high-manganese fully austenitic TWIP steel with the chemical composition given in Table 1 and the mechanical properties given in Table 2, was investigated. The steel was strip casted in flat sheets with a thickness of 5 mm and delivered in hot rolled state.
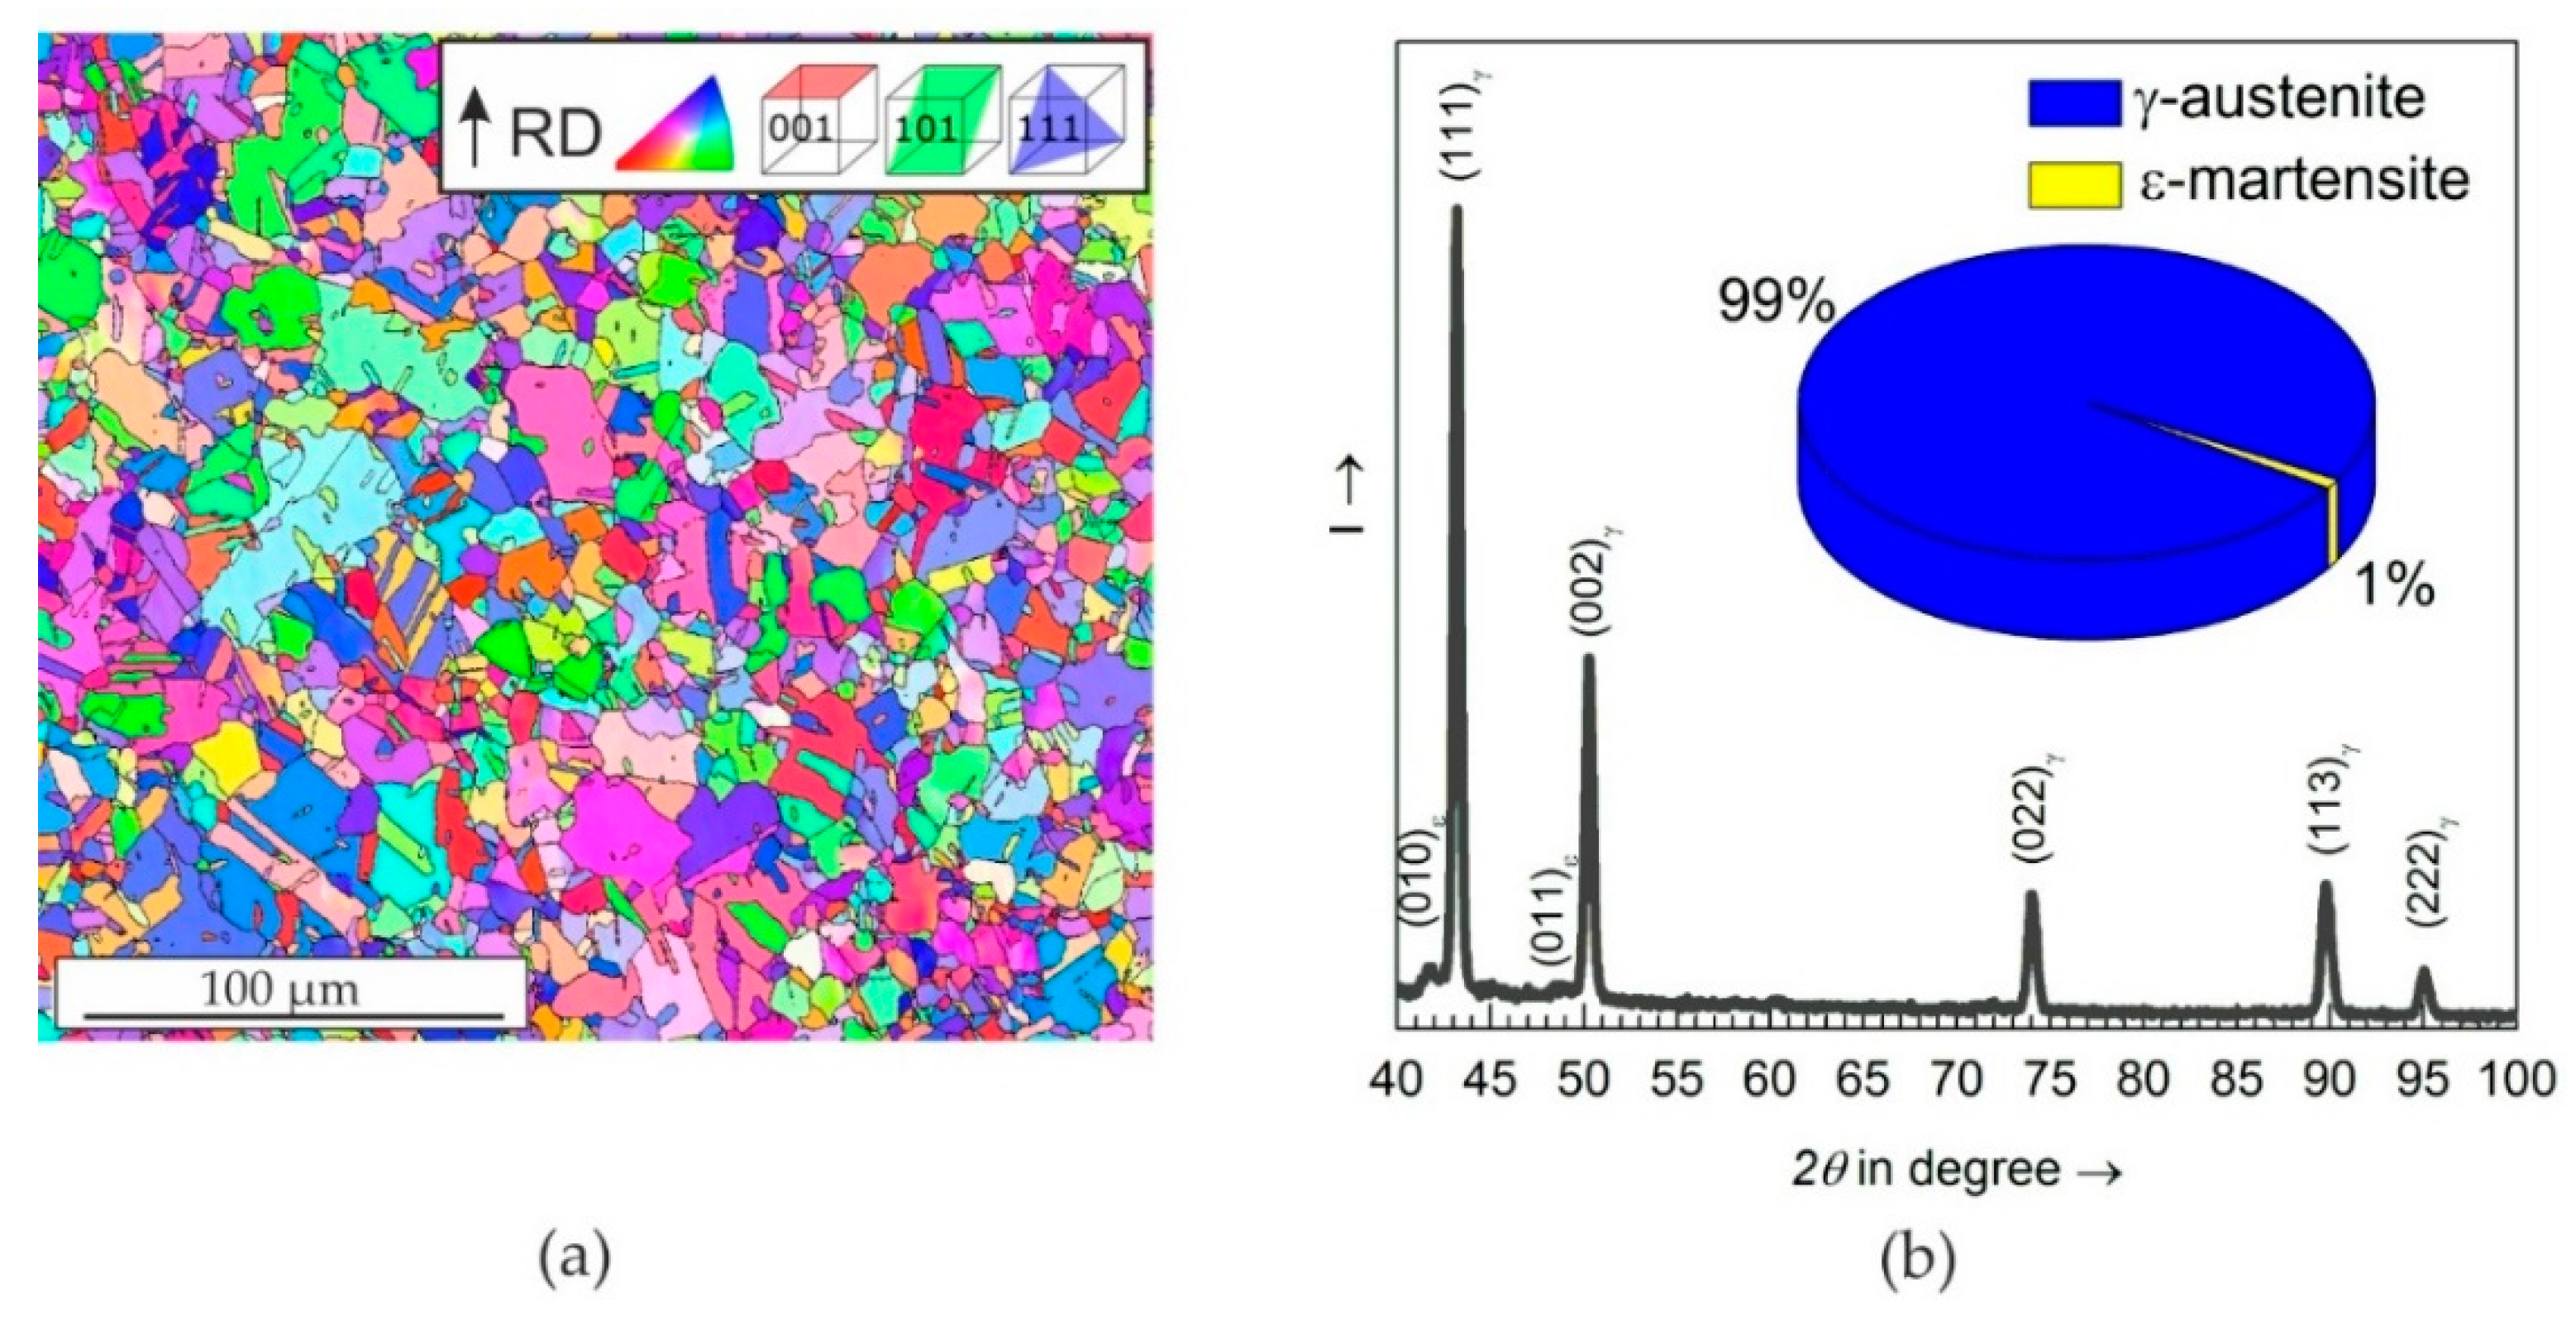
As shown by EBSD analysis perpendicular to rolling direction (RD), the material has a mean grain size of about 20 µm, determined considering annealing twins as grain boundaries (Figure 2a). Note that the equivalent grain diameter ranges from about 10 µm up to 40 µm. The material shows no preferred grain orientation and the microstructure is nearly fully austenitic. Only a small volume fraction of 1 vol. % ε-martensite can be found in XRD analyzes (Figure 2b). This microstructure is typical for the alloying concept Mn-Al-Si [12].
2.3. Specimen Manufacturing with Different Surface Morphologies
Flat specimens with longitudinal axis transverse to rolling direction were taken by water-jet cutting. Note that the monotonic properties given in Reference [53] do not differ between longitudinal and transverse direction. To achieve different surface morphologies, the gage length surfaces were milled with the vectors of feed and cutting speed against each other (up milling) and with both vectors in the same direction (down milling), respectively. Further milling parameters, i.e., feed per tooth (fz), rotational speed (n) and number of teeth (nz) were identical for both morphologies (see Table 3). Furthermore, to obtain a reference state, some of the down milled specimens were electrolytically polished after the milling process until the milling induced residual stresses were removed and a smooth surface was achieved.
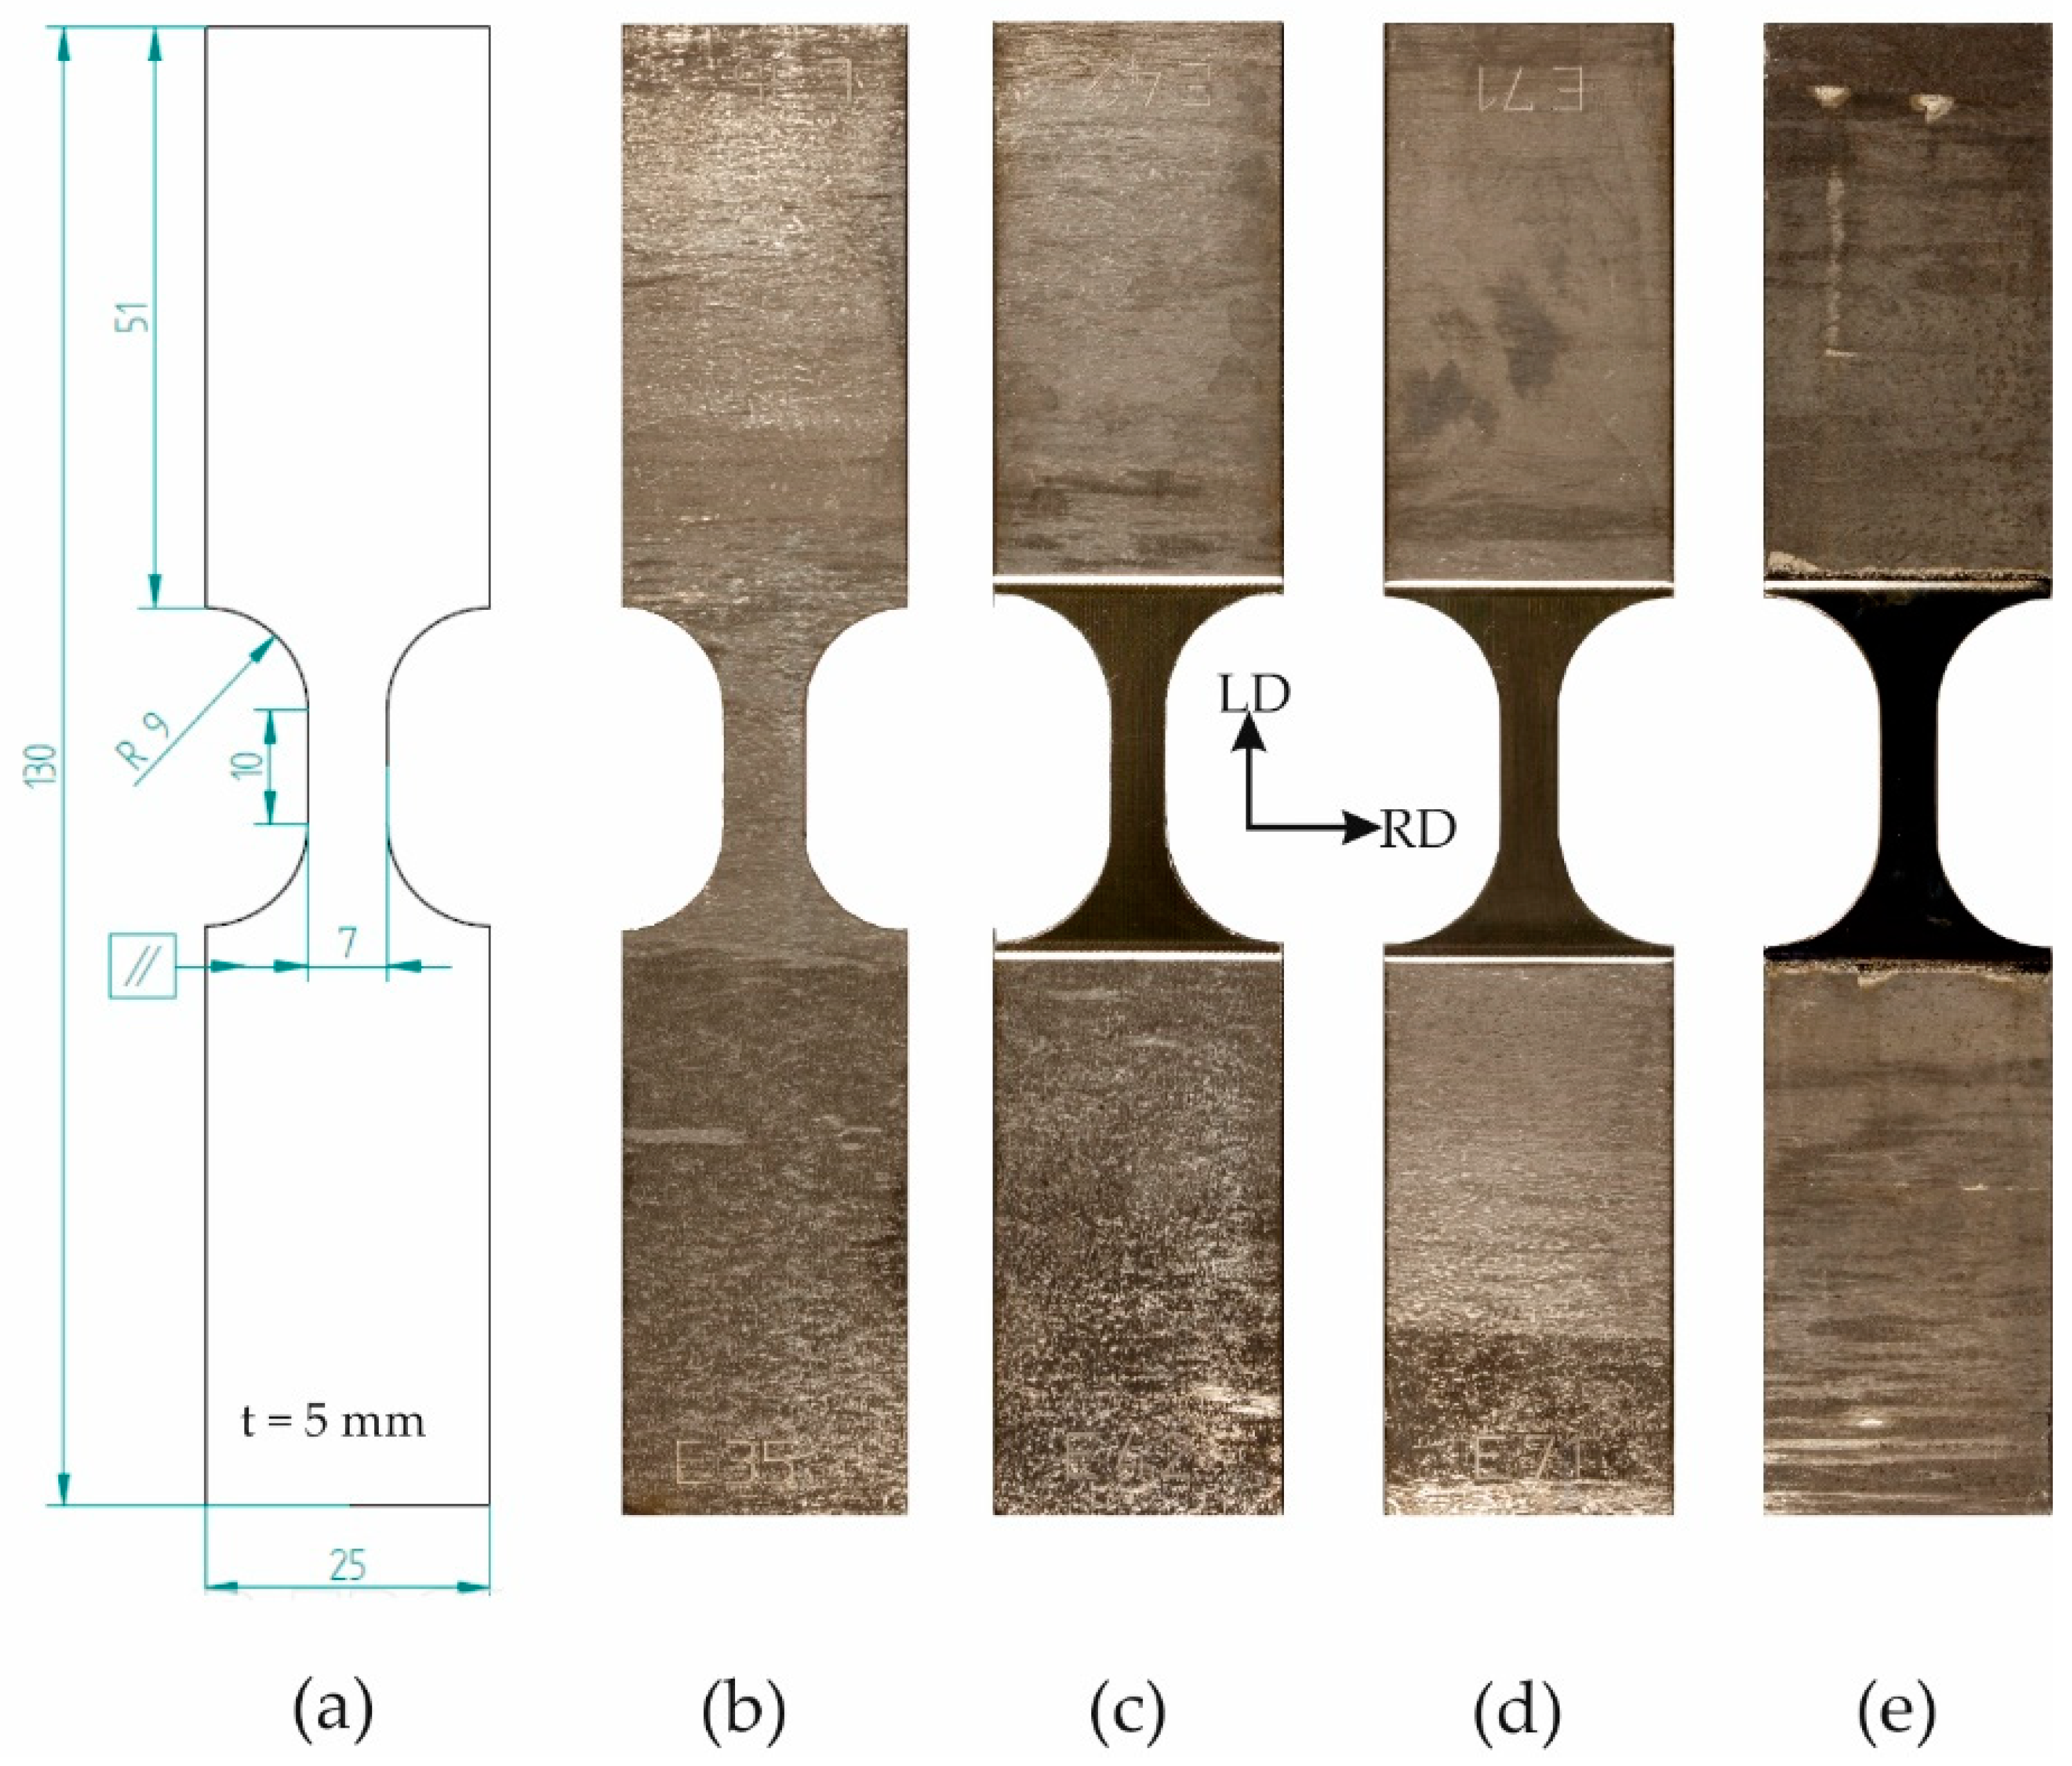
Including the two machined surfaces, in this study four surface morphologies were investigated: unmachined with a so-called rolling skin of about 30–40 µm [53] (MRS), after up milling (MUM), after down milling (MDM) and as a reference state after polishing (MPO) (Figure 3). These four morphologies have different properties concerning topography and roughness, initial residual stresses and initial phase fractions.
3. Results and Discussion
3.1. Investigated Surface Morphologies
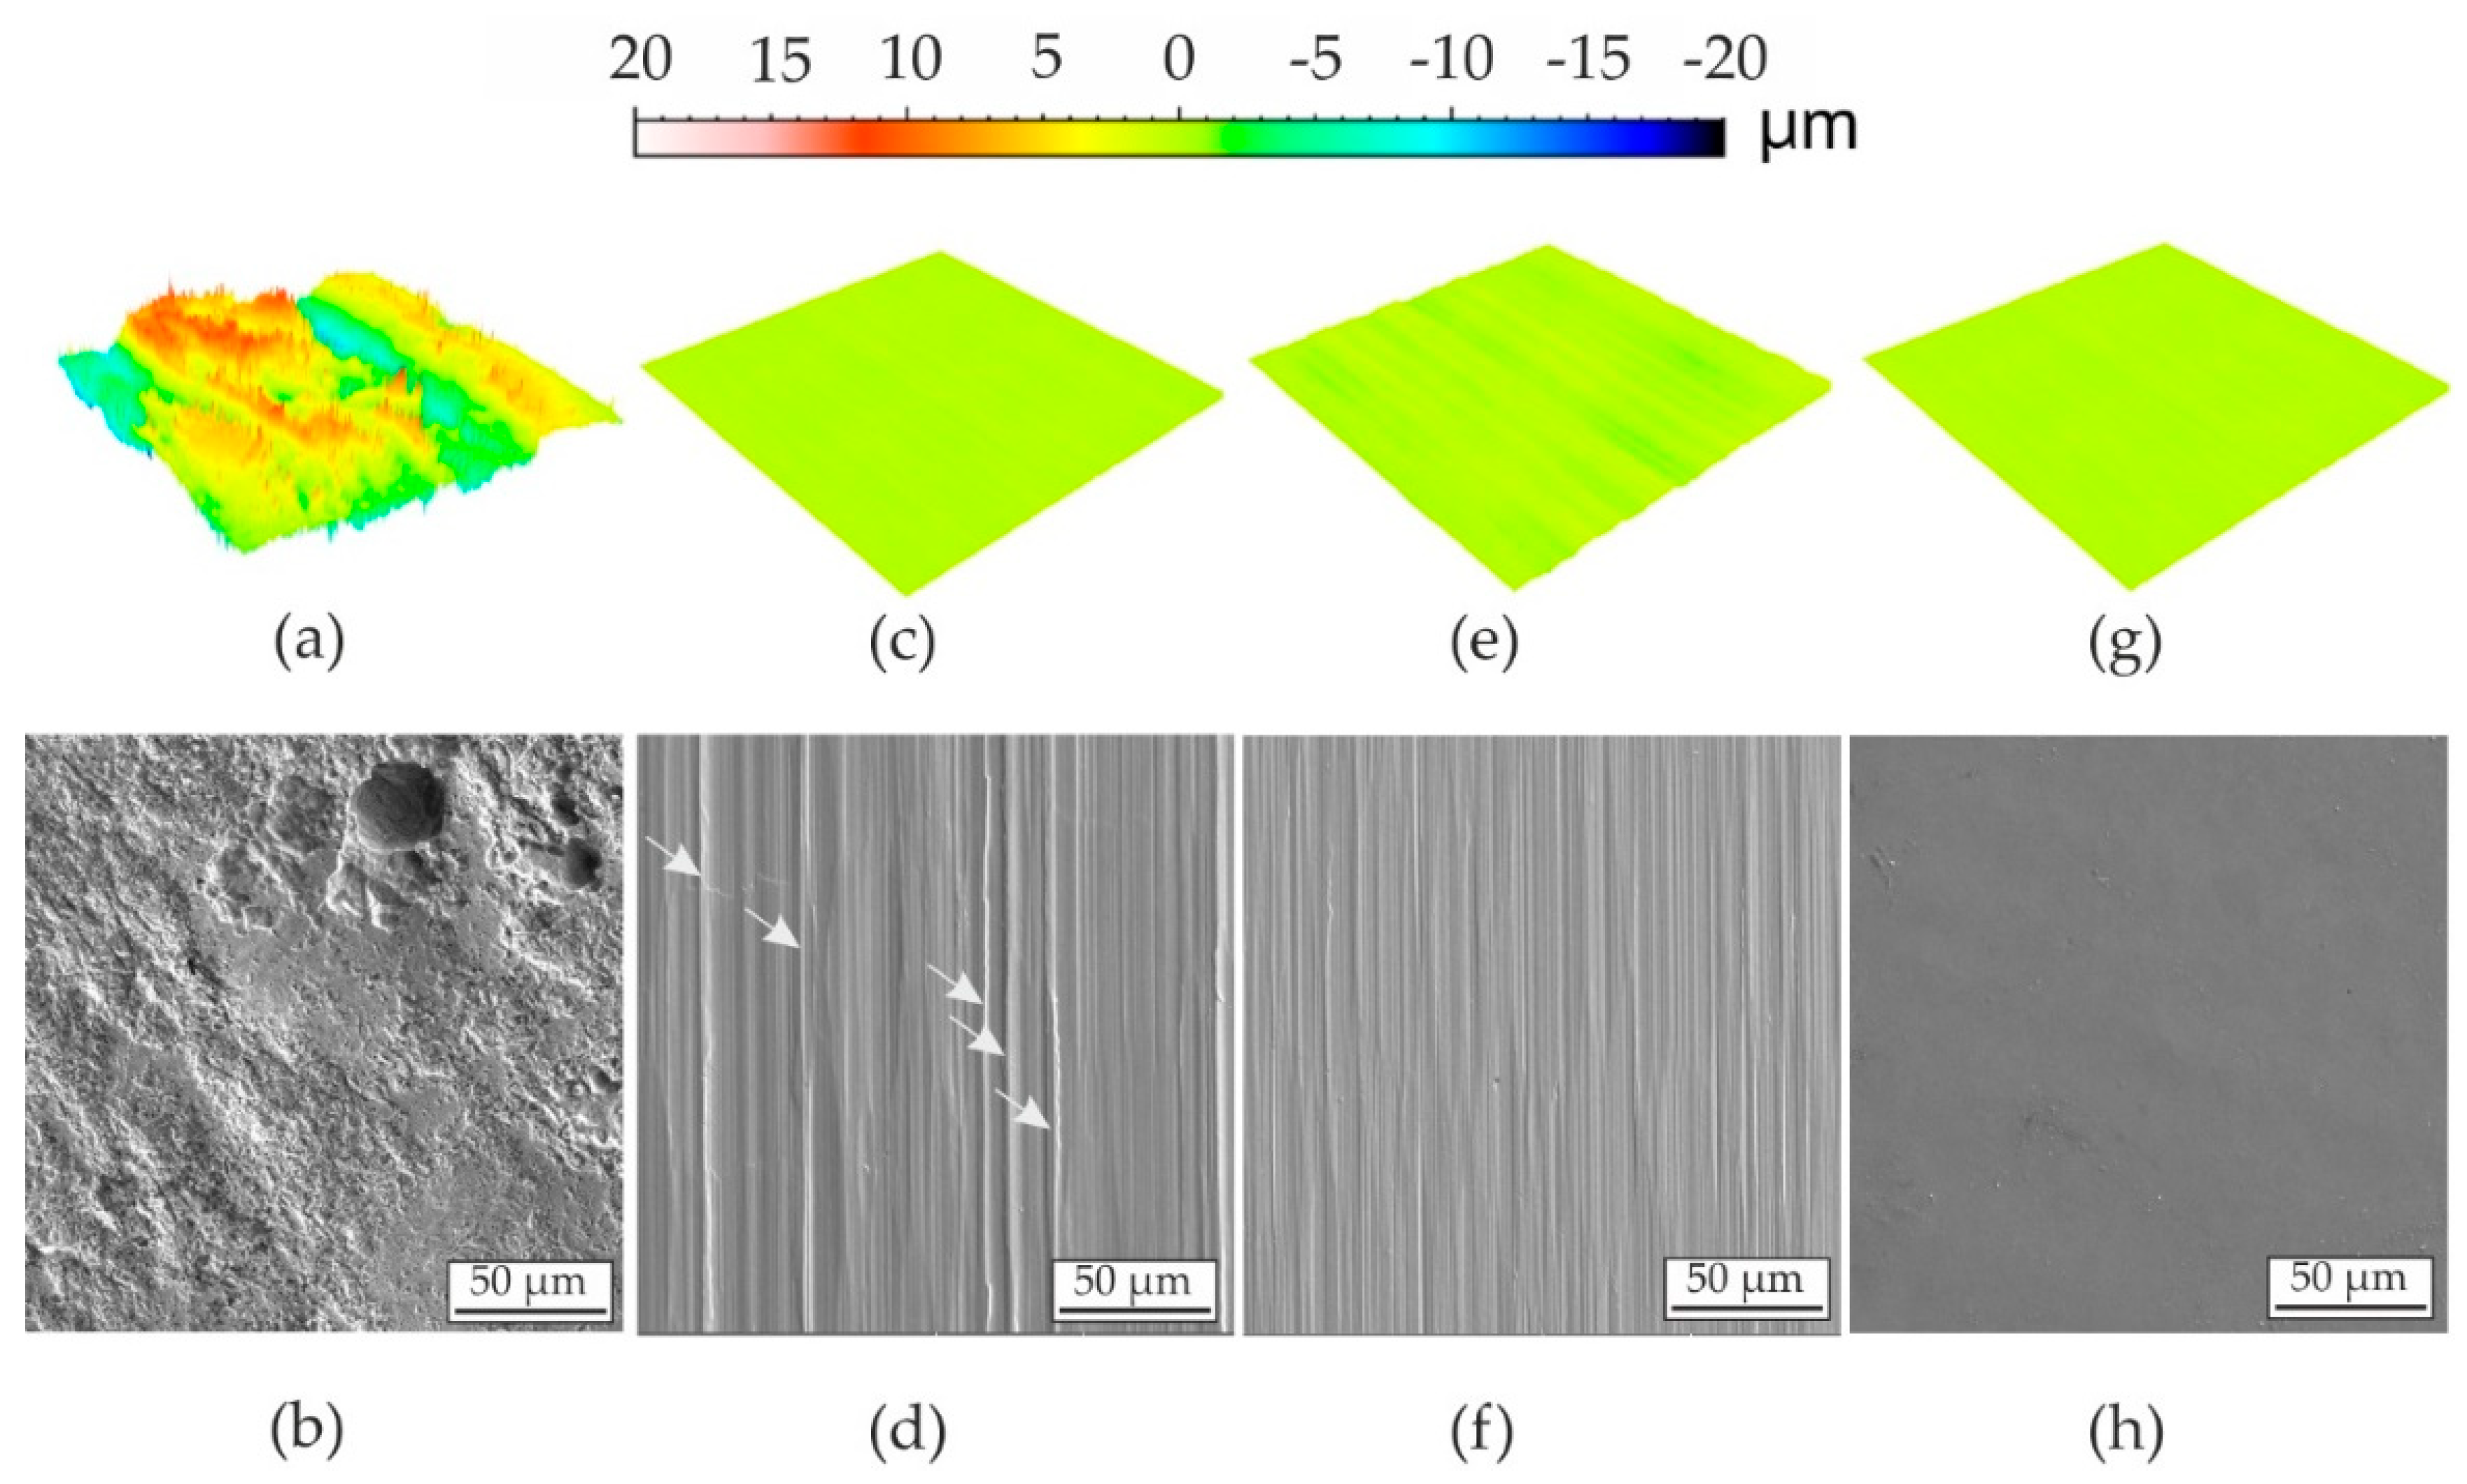
The topographies of the four surface morphologies were investigated by confocal microscopy, SEM imaging (Figure 4) and tactile measurements. The values of the mean roughness Rz are given in Table 4. Due to no further machining, the morphology MRS shows by far the highest roughness as well as a non-periodic surface topography. The milled surfaces are smoother and periodic traces of the milling tool are visible. The Rz values of the morphologies MUM and MDM are similar and significantly lower than Rz of MRS. Note that the topography MDM displays sporadic pronounced traces of the milling tool (highlighted in Figure 4d), which do not influence Rz. The polished surface morphology has the smoothest surface, characterized by the lowest Rz. Nevertheless, the surface appears in a wavy manner due to electrolytic polishing. The values obtained from the tactile measurement differ slightly to the optical measurements, but show the same tendencies.
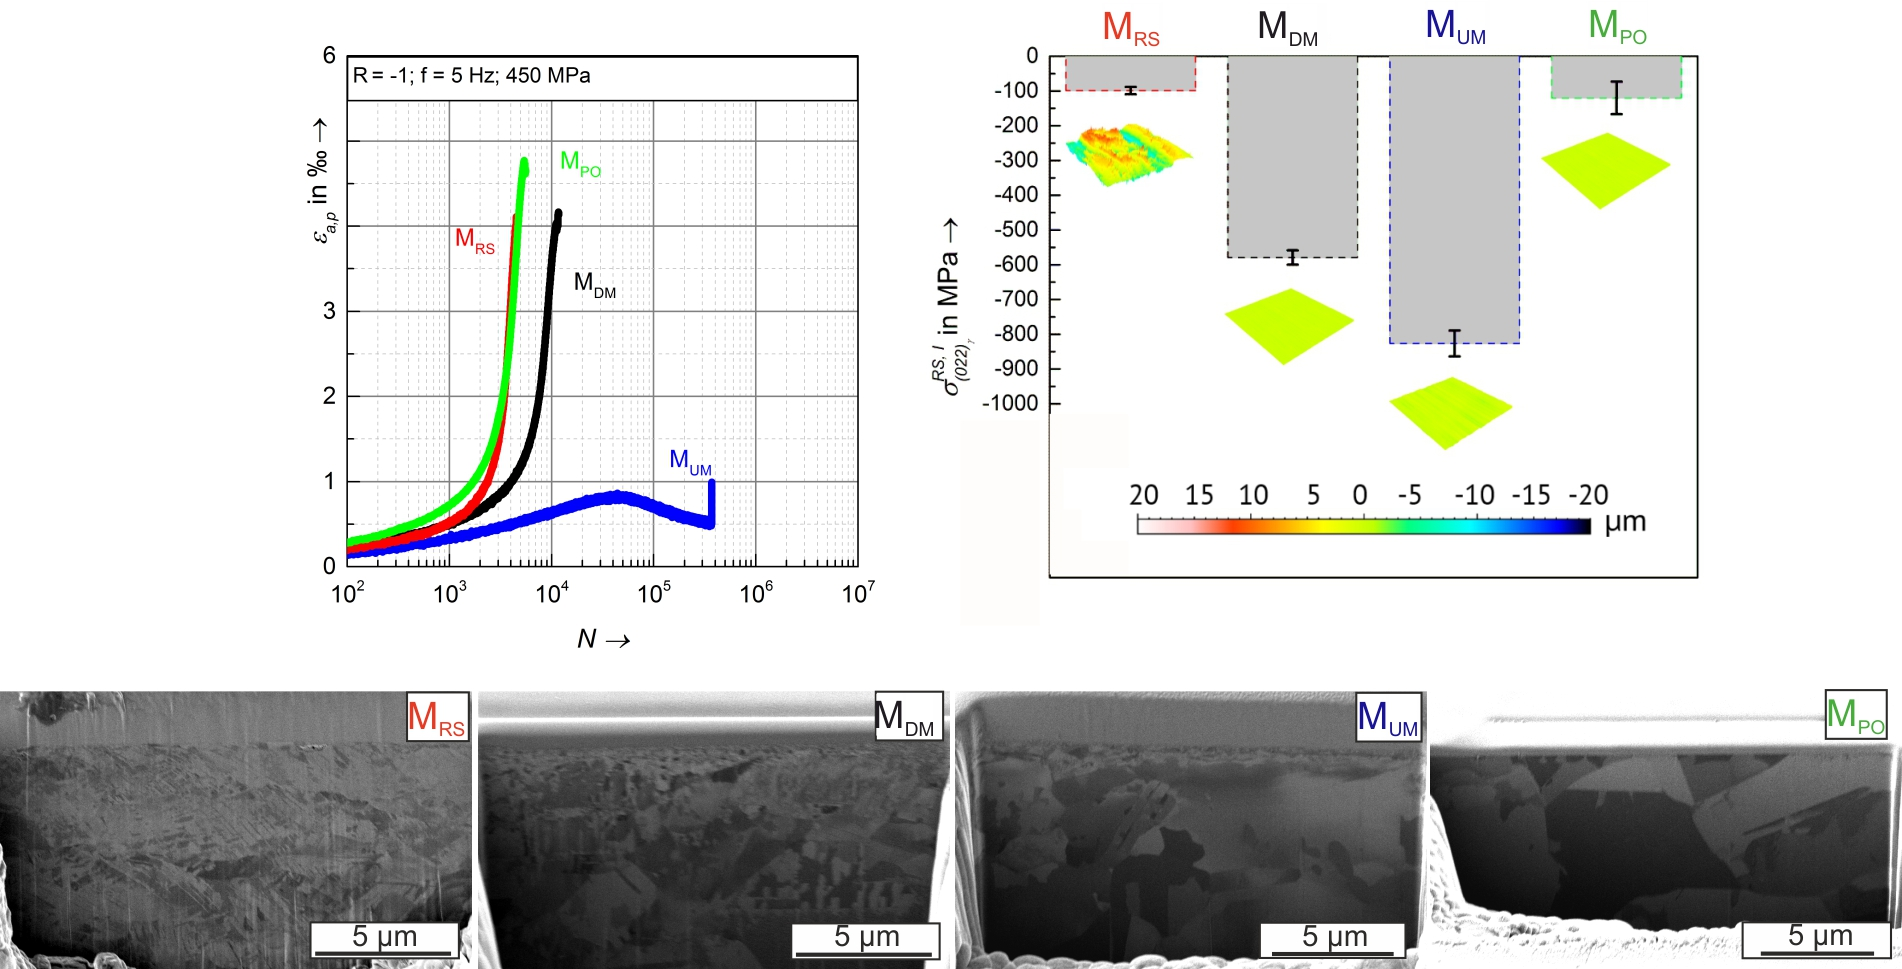
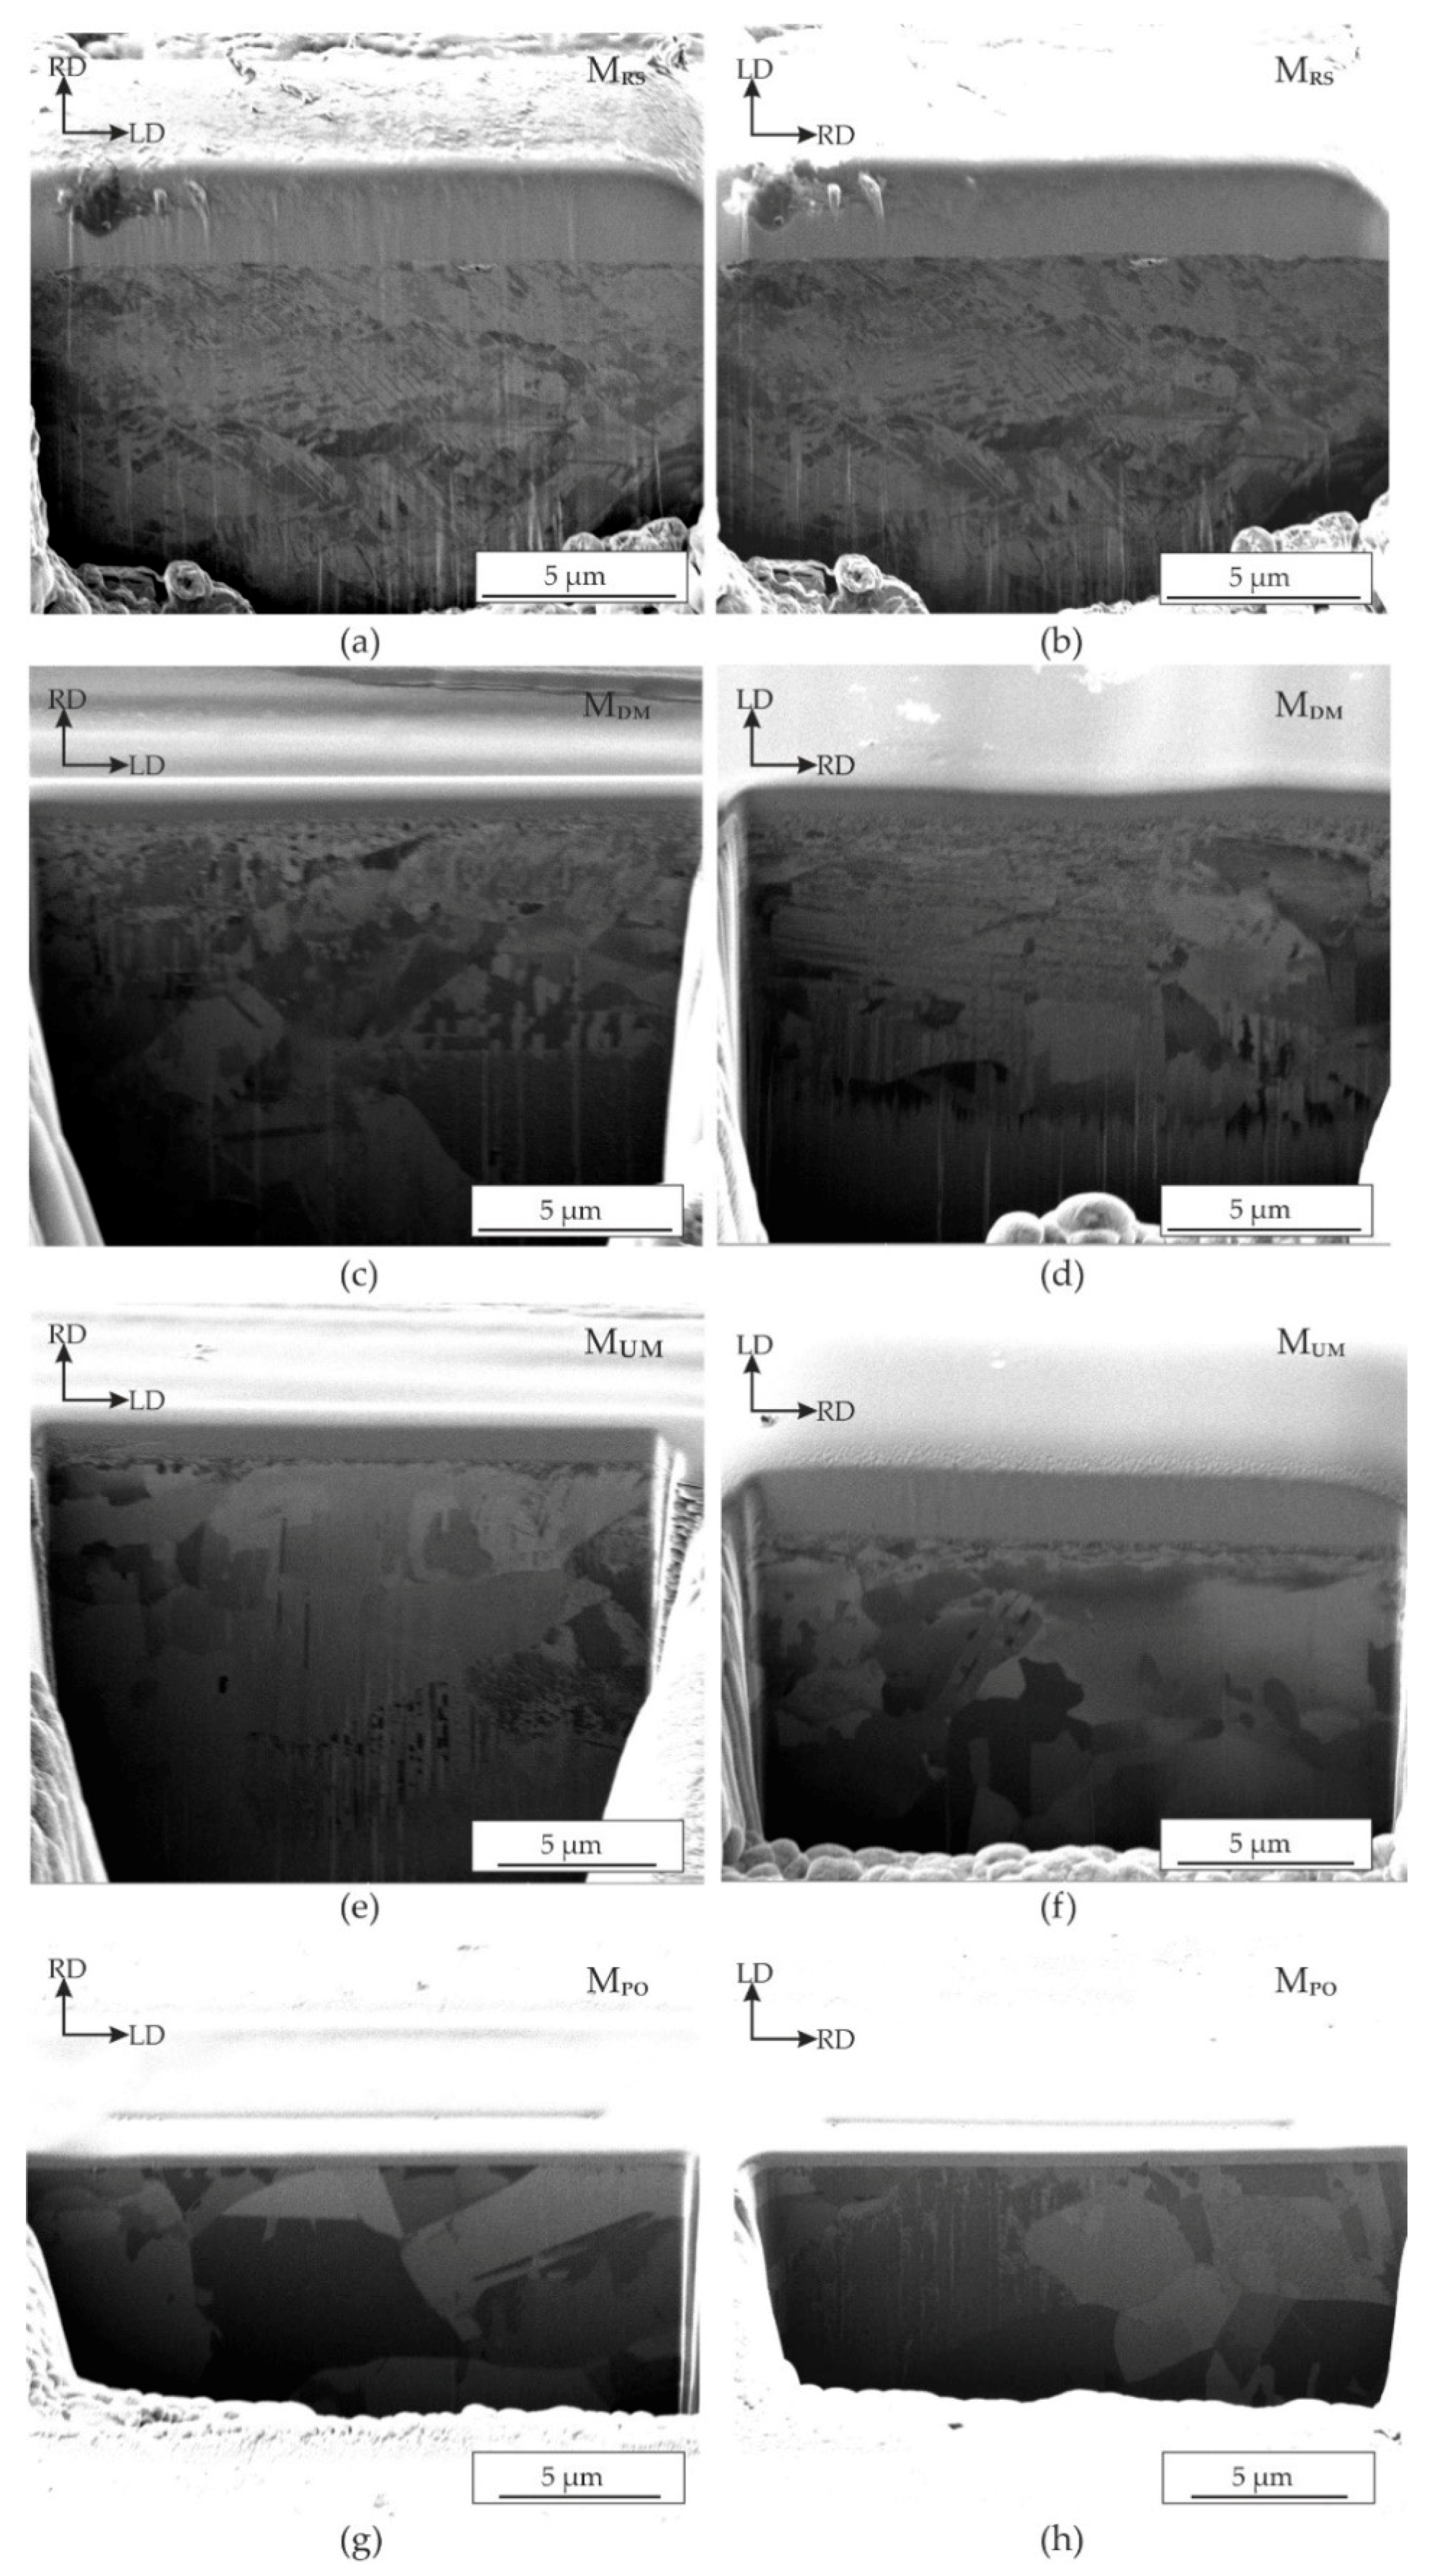
For further characterization of the investigated surface morphologies, FIB cuts were made perpendicular to the surface of the fatigue specimens and images of the sub-surface microstructure were taken with ion beam imaging (Figure 5). Each surface morphology was investigated longitudinal and transverse to rolling direction. Note that the rolling direction of the material was perpendicular to the loading direction of the fatigue specimens. In general, the microstructures of the morphologies longitudinal and transverse to rolling direction are comparable (comp. Figure 5a–f). The MRS morphology shows a distinctly different near surface microstructure than the bulk material, i.e., line shaped structures, which are typical of martensitic microstructures [45] (comp. Figure 5a,b,g,h). Both milled surfaces MDM (Figure 5c,d) and MUM (Figure 5e,f) show a nanocrystalline microstructure directly underneath the surface in both directions. This nanocrystalline layer has a thickness of 1–2 µm and is slightly more pronounced for the morphology MDM. For both morphologies (MDM and MUM), the microstructure merge into the coarseness of the microstructure of the unloaded bulk material with increasing distance from the surface. For the polished morphology MPO (Figure 5g,h), the nanocrystalline layer is completely removed by electrolytic polishing and only the microstructure of the bulk material is present.
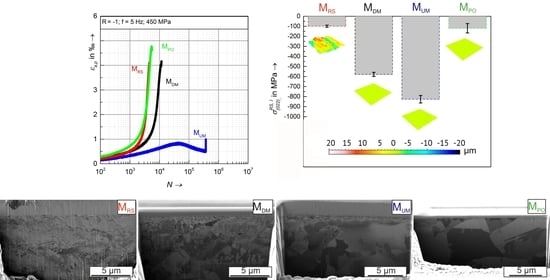
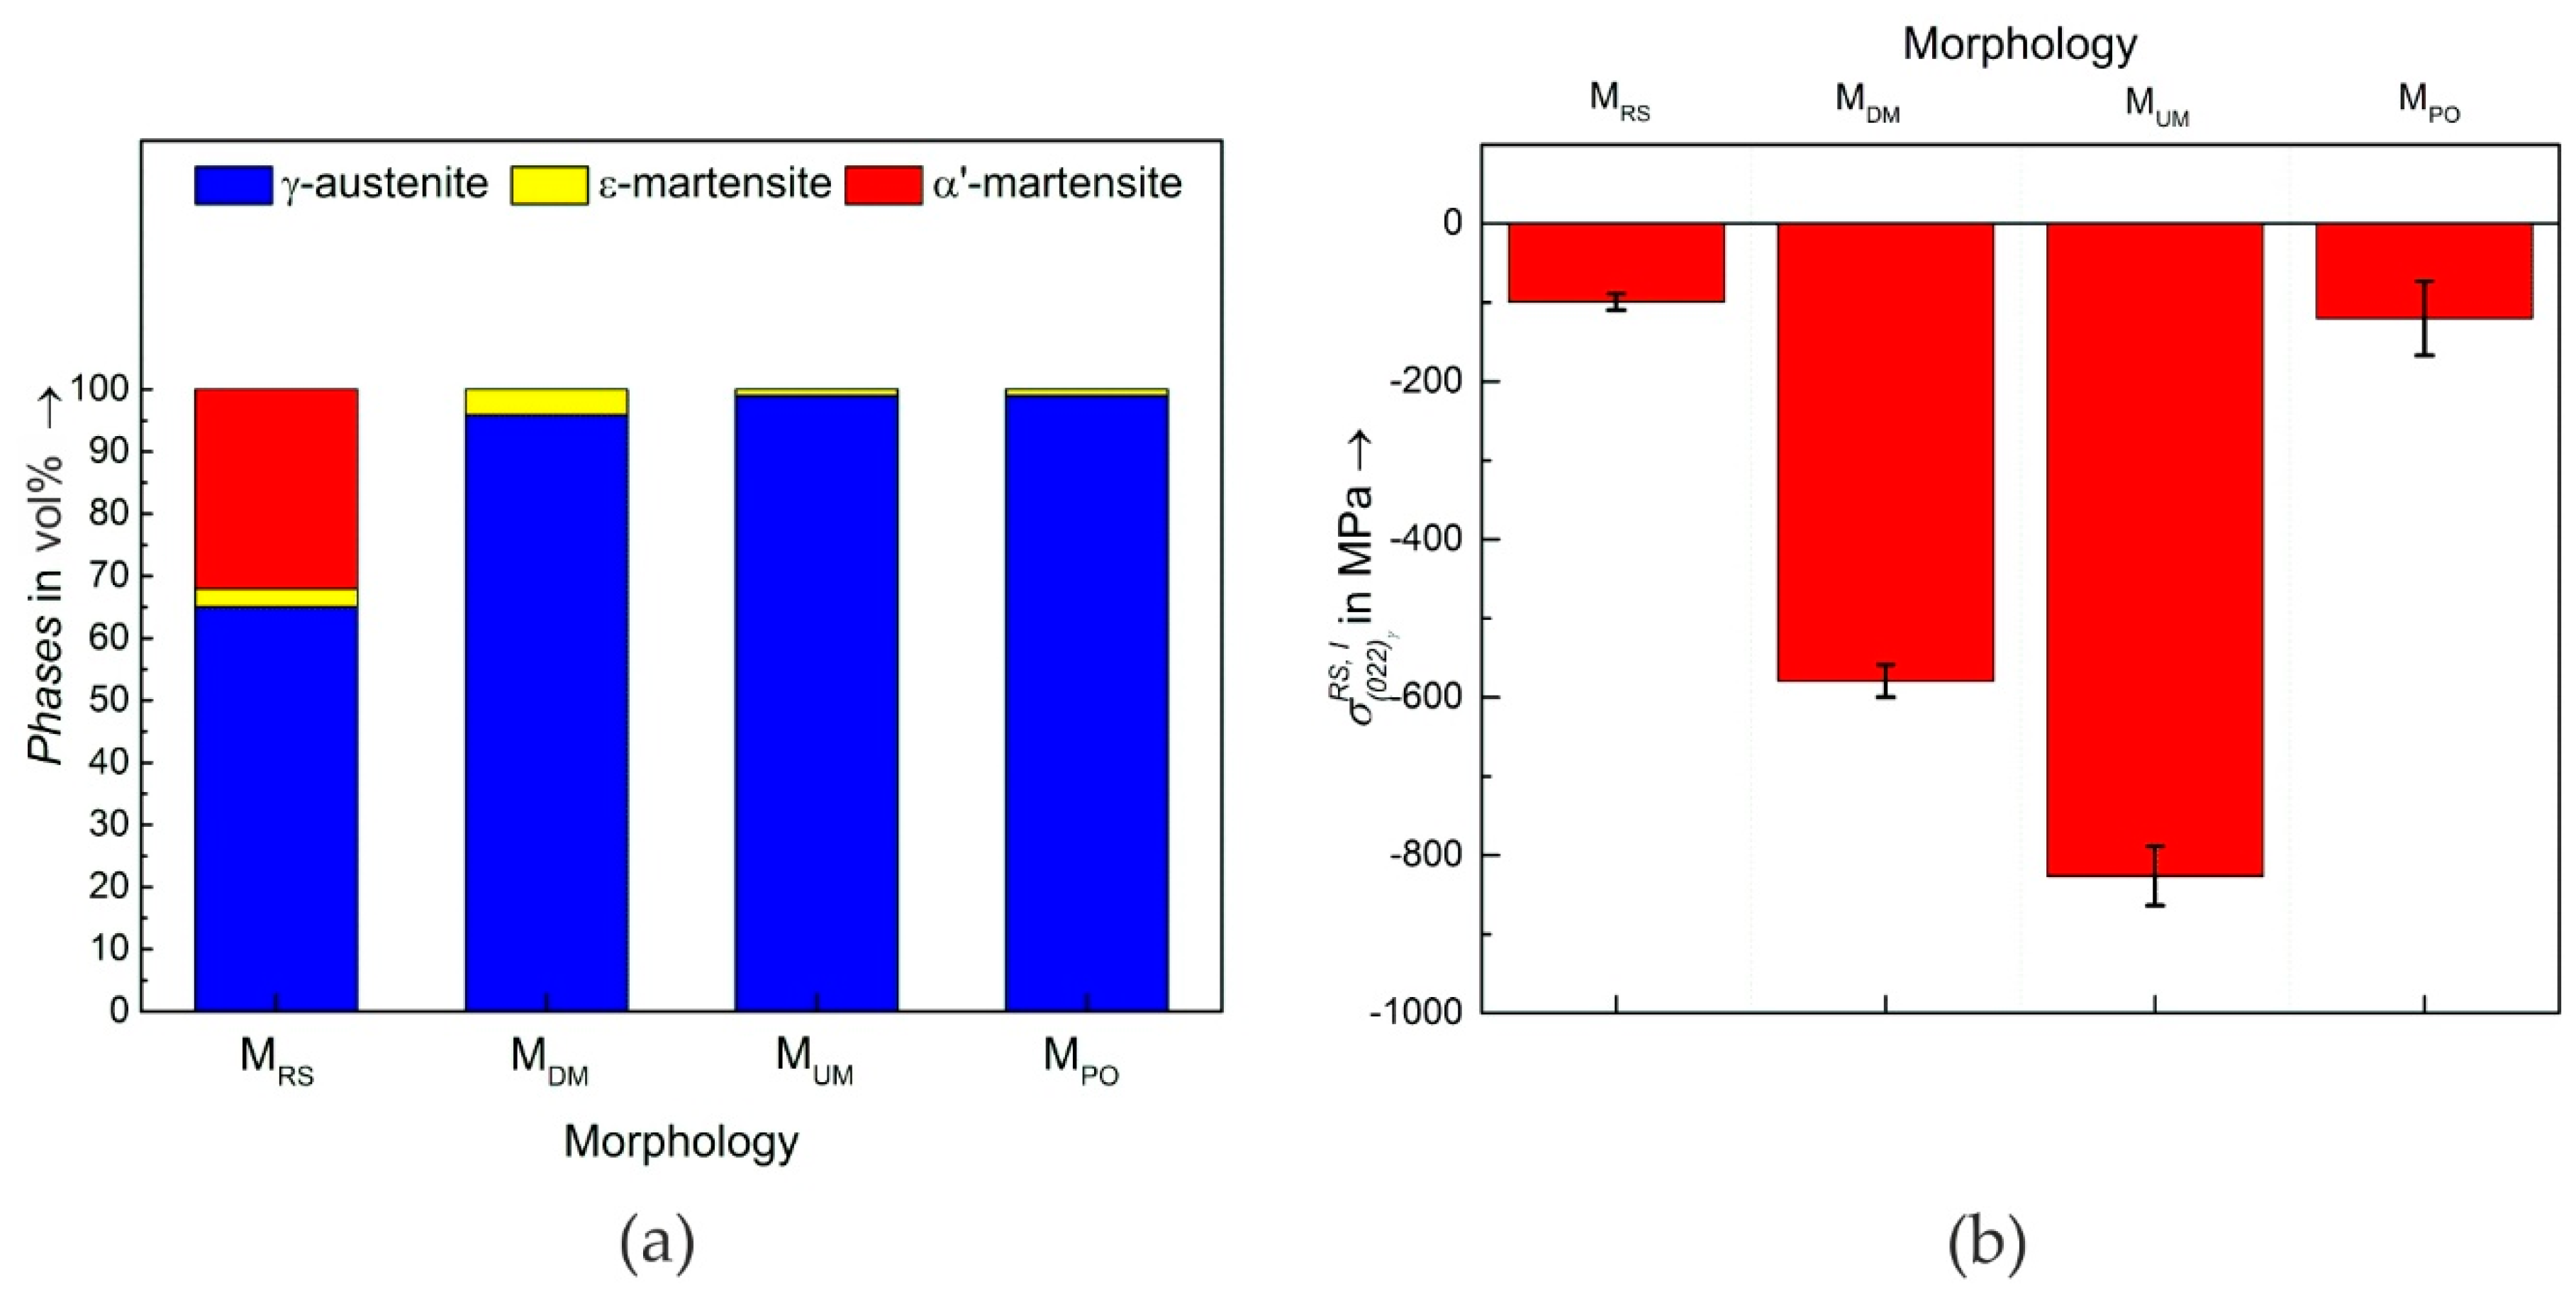
Beside the topographies, the surface morphologies vary significantly in their initial phase fractions (Figure 6a) and residual stresses (Figure 6b): A significant fraction of α’-martensite of 32 vol. % is present in the rolling skin in the unloaded state. This phase is found in the rolling skin. Its absence in the other surface morphologies is due to removal of the rolling skin by milling and/or polishing. The large α’-martensite fraction in the rolling skin could be caused by higher metastability due to changes in chemical composition induced by diffusion processes during hot rolling and/or large plastic deformation in the manufacturing process. The penetration depth of the CuKα-radiation of few µm ensures that the phase fractions were analyzed in the rolling skin and not in the bulk material. The other surface morphologies are nearly fully austenitic with a small volume fraction of ε-martensite of 4 vol. % in the down milled (MDM) and 1 vol. % in the up milled (MUM) and polished surface (MPO), respectively. Because the amount of ε-martensite is comparable for the polished (MPO) and the up milled surface (MUM), it can be assumed, the up milling process did not induce a phase transformation from γ-austenite to ε-martensite while the down milling process induced a slight increase of the fraction of ε-martensite. Note, that the accuracy of the used Rietveld method is between 1–3 vol. % [50] and therefore a quantitative comparison between MDM and MUM is limited. The ε-martensite contents observed in the present work are distinctly below the values of 56 vol. % up to 80 vol. % for which an influence of ε-martensite on cyclic deformation behavior is reported in literature [28,29,30].
Moreover, every surface morphology shows compressive residual stresses which differ significantly between the investigated variants. While the up milled surface morphology MUM has the highest value of −800 MPa, a value of −600 MPa was measured in the down milled surface. Because no machining induced residual stresses are present in the morphology MRS, a lower value of −100 MPa was measured in this surface state. The value of −120 MPa in the electrolytically polished surface MPO can be explained by the thermomechanical loadings during manufacturing the HSD® 600 steel sheets by hot rolling.
3.2. Cyclic Deformation Behavior
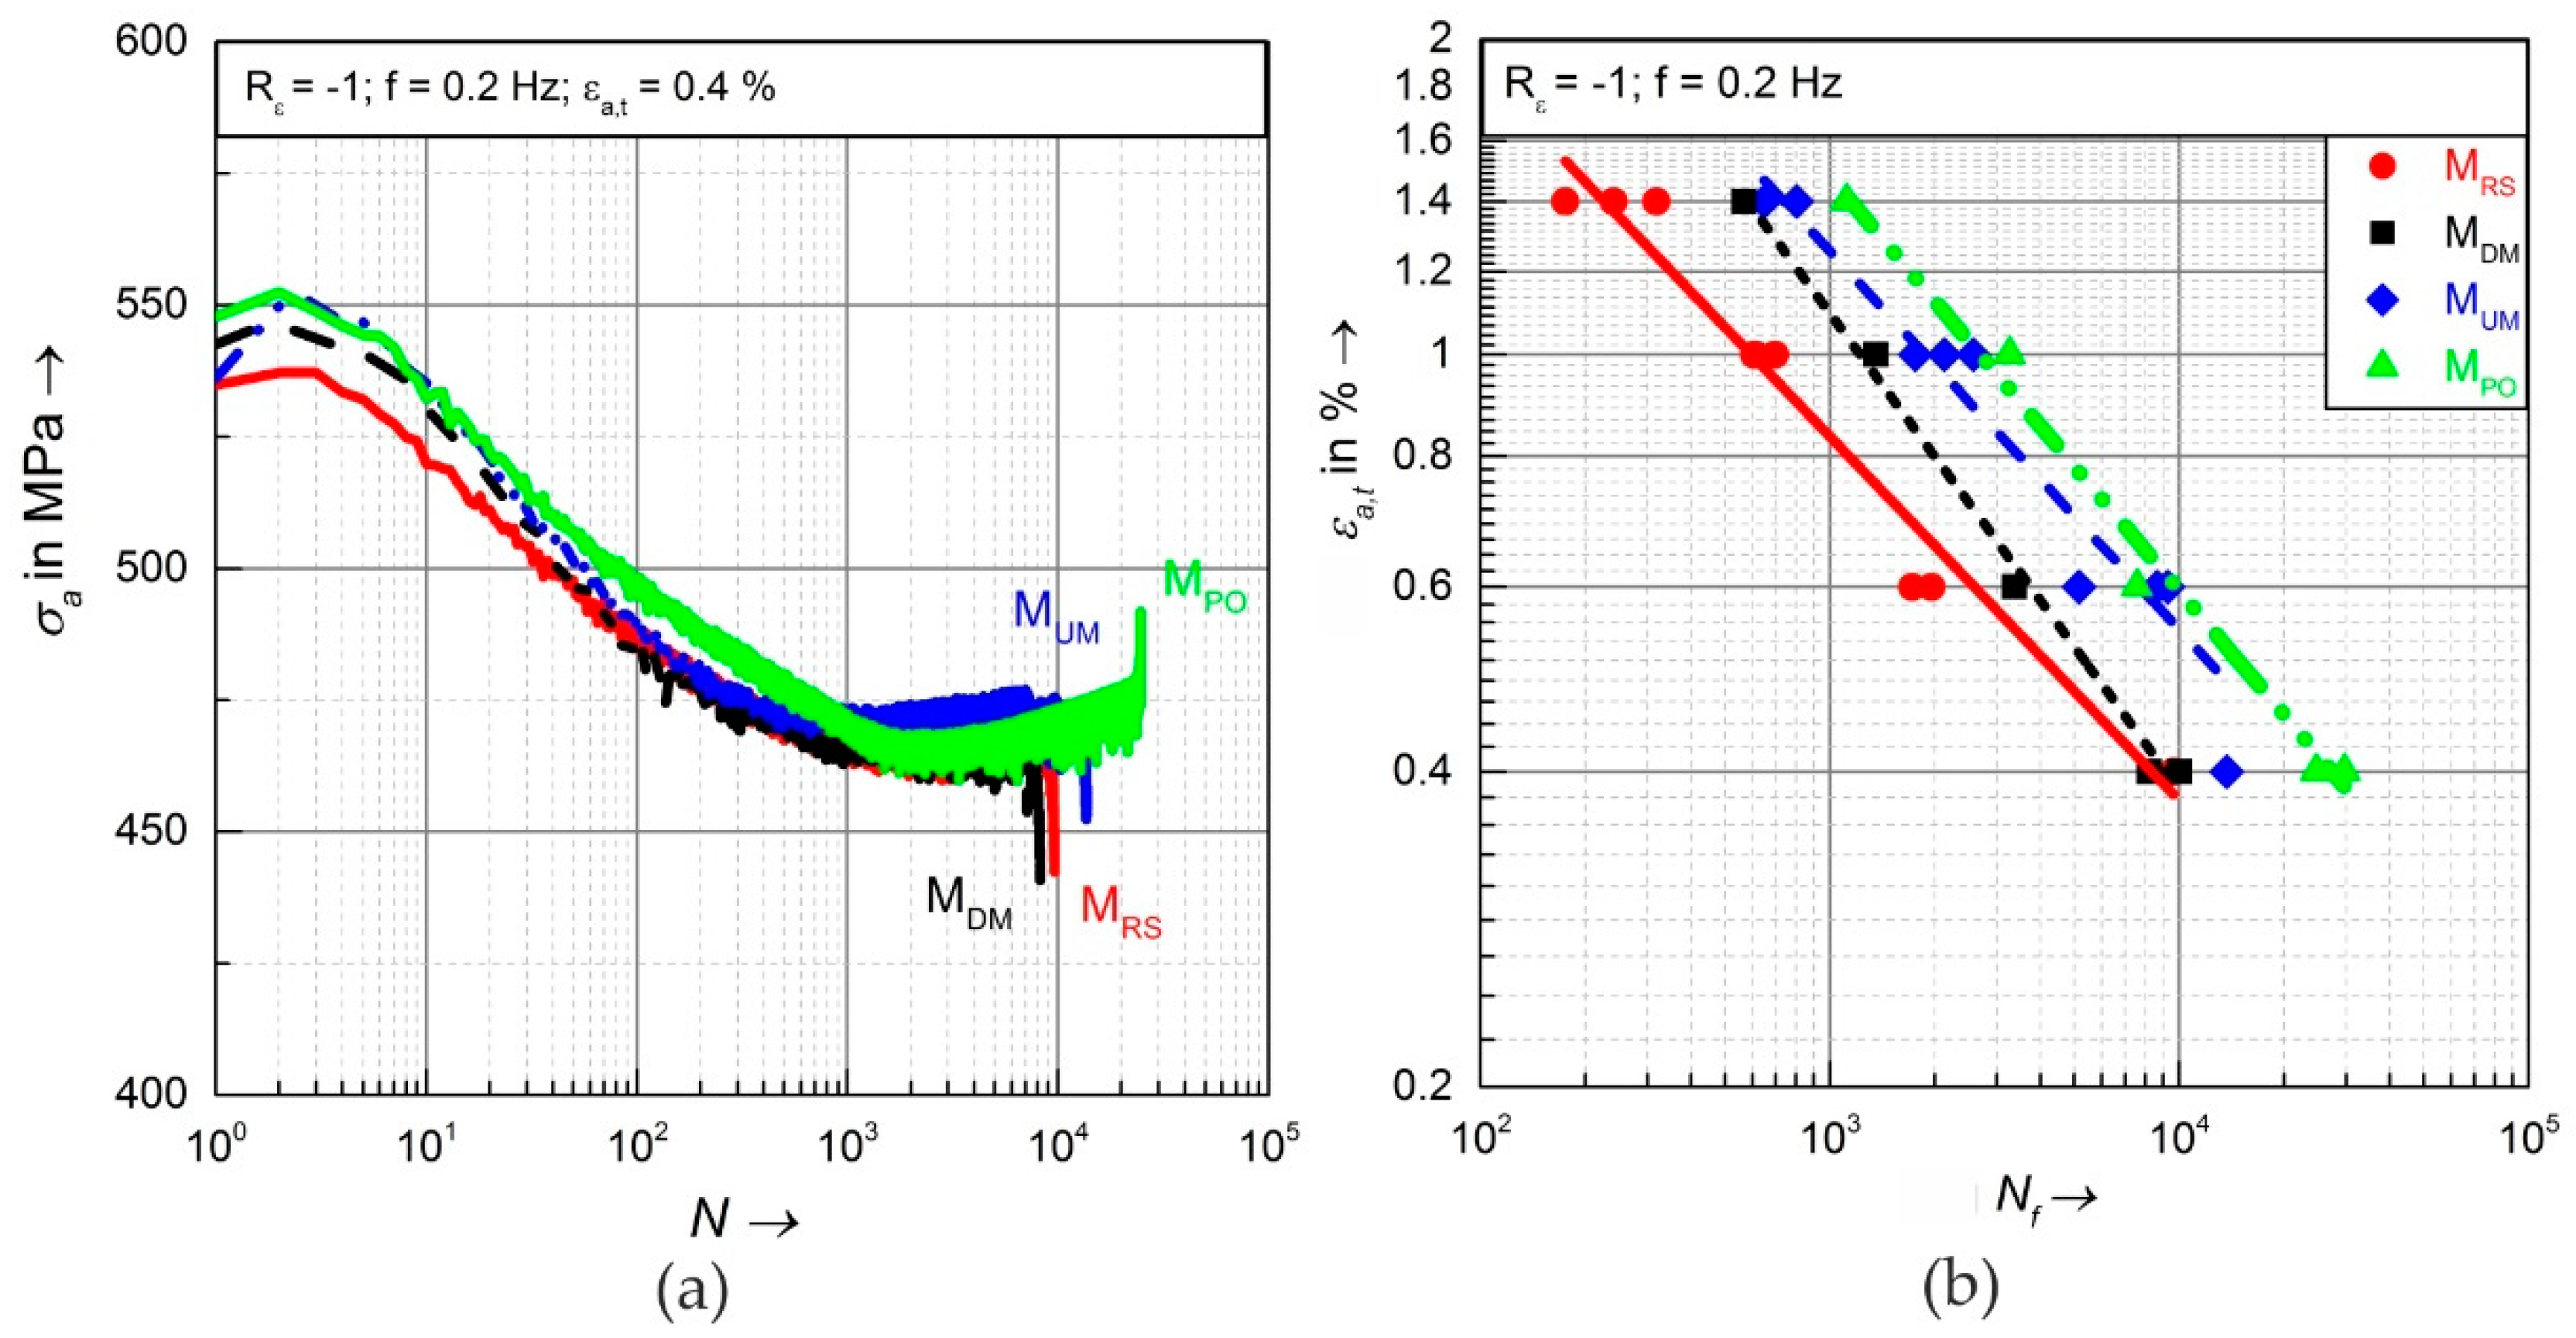
The monotonic deformation behavior of the HSD® 600 TWIP steel in comparison to total strain-controlled strain increase tests is shown in Reference [53]. In the present work, total strain-controlled fatigue tests were performed at specimens with all four investigated surface morphologies to characterize the cyclic deformation behavior in the LCF regime. The absolute temperatures of the specimen due to self-heating was below T1 < 30 °C. In general, the HSD® 600 TWIP steel shows initial cyclic hardening within the first few load cycles, followed by cyclic softening. After approximately 1000 cycles, a second cyclic hardening occurs (Figure 7a). According to the literature [26,27] the initial cyclic hardening is mainly caused by primary dislocation multiplication and their interactions with each other, twin boundaries and stacking faults. The following cyclic softening is related to the rearrangement of the generated dislocations to more stable structures, resulting in higher dislocation mobility. The second cyclic hardening is again caused by changes in dislocation structure and increased further dislocation pile-up and continues until specimen failure. Even though the cyclic deformation behavior is qualitatively similar for all investigated morphologies, the specimens with polished surfaces reach the highest number of cycles to failure, as seen in the S-N curve (Figure 7b). The lowest number of cycles to failure are observed for specimens with rolling skin (MRS) due to their high roughness and uneven surface condition, as presented in the SE images and confocal microscopy above (Figure 4). The specimens with the milled surfaces (MDM and MUM) achieve lifetimes between the morphologies MRS and MPO. Nevertheless, specimens with the up milled surfaces MUM result in higher lifetimes than observed for down milled surfaces MDM.
The cyclic deformation behavior in the HCF regime was characterized by stress controlled fatigue tests. To investigate the frequency influence on self-heating and its consequences on the cyclic deformation behavior the specimens were loaded with constant stress amplitude σa = 450 MPa at three different frequencies of f = 5 Hz, 2 Hz and 0.2 Hz. As mentioned in the introduction, varying temperatures significantly influences the SFE and therefore the dominant microstructural mechanisms of high-Mn TWIP steels.
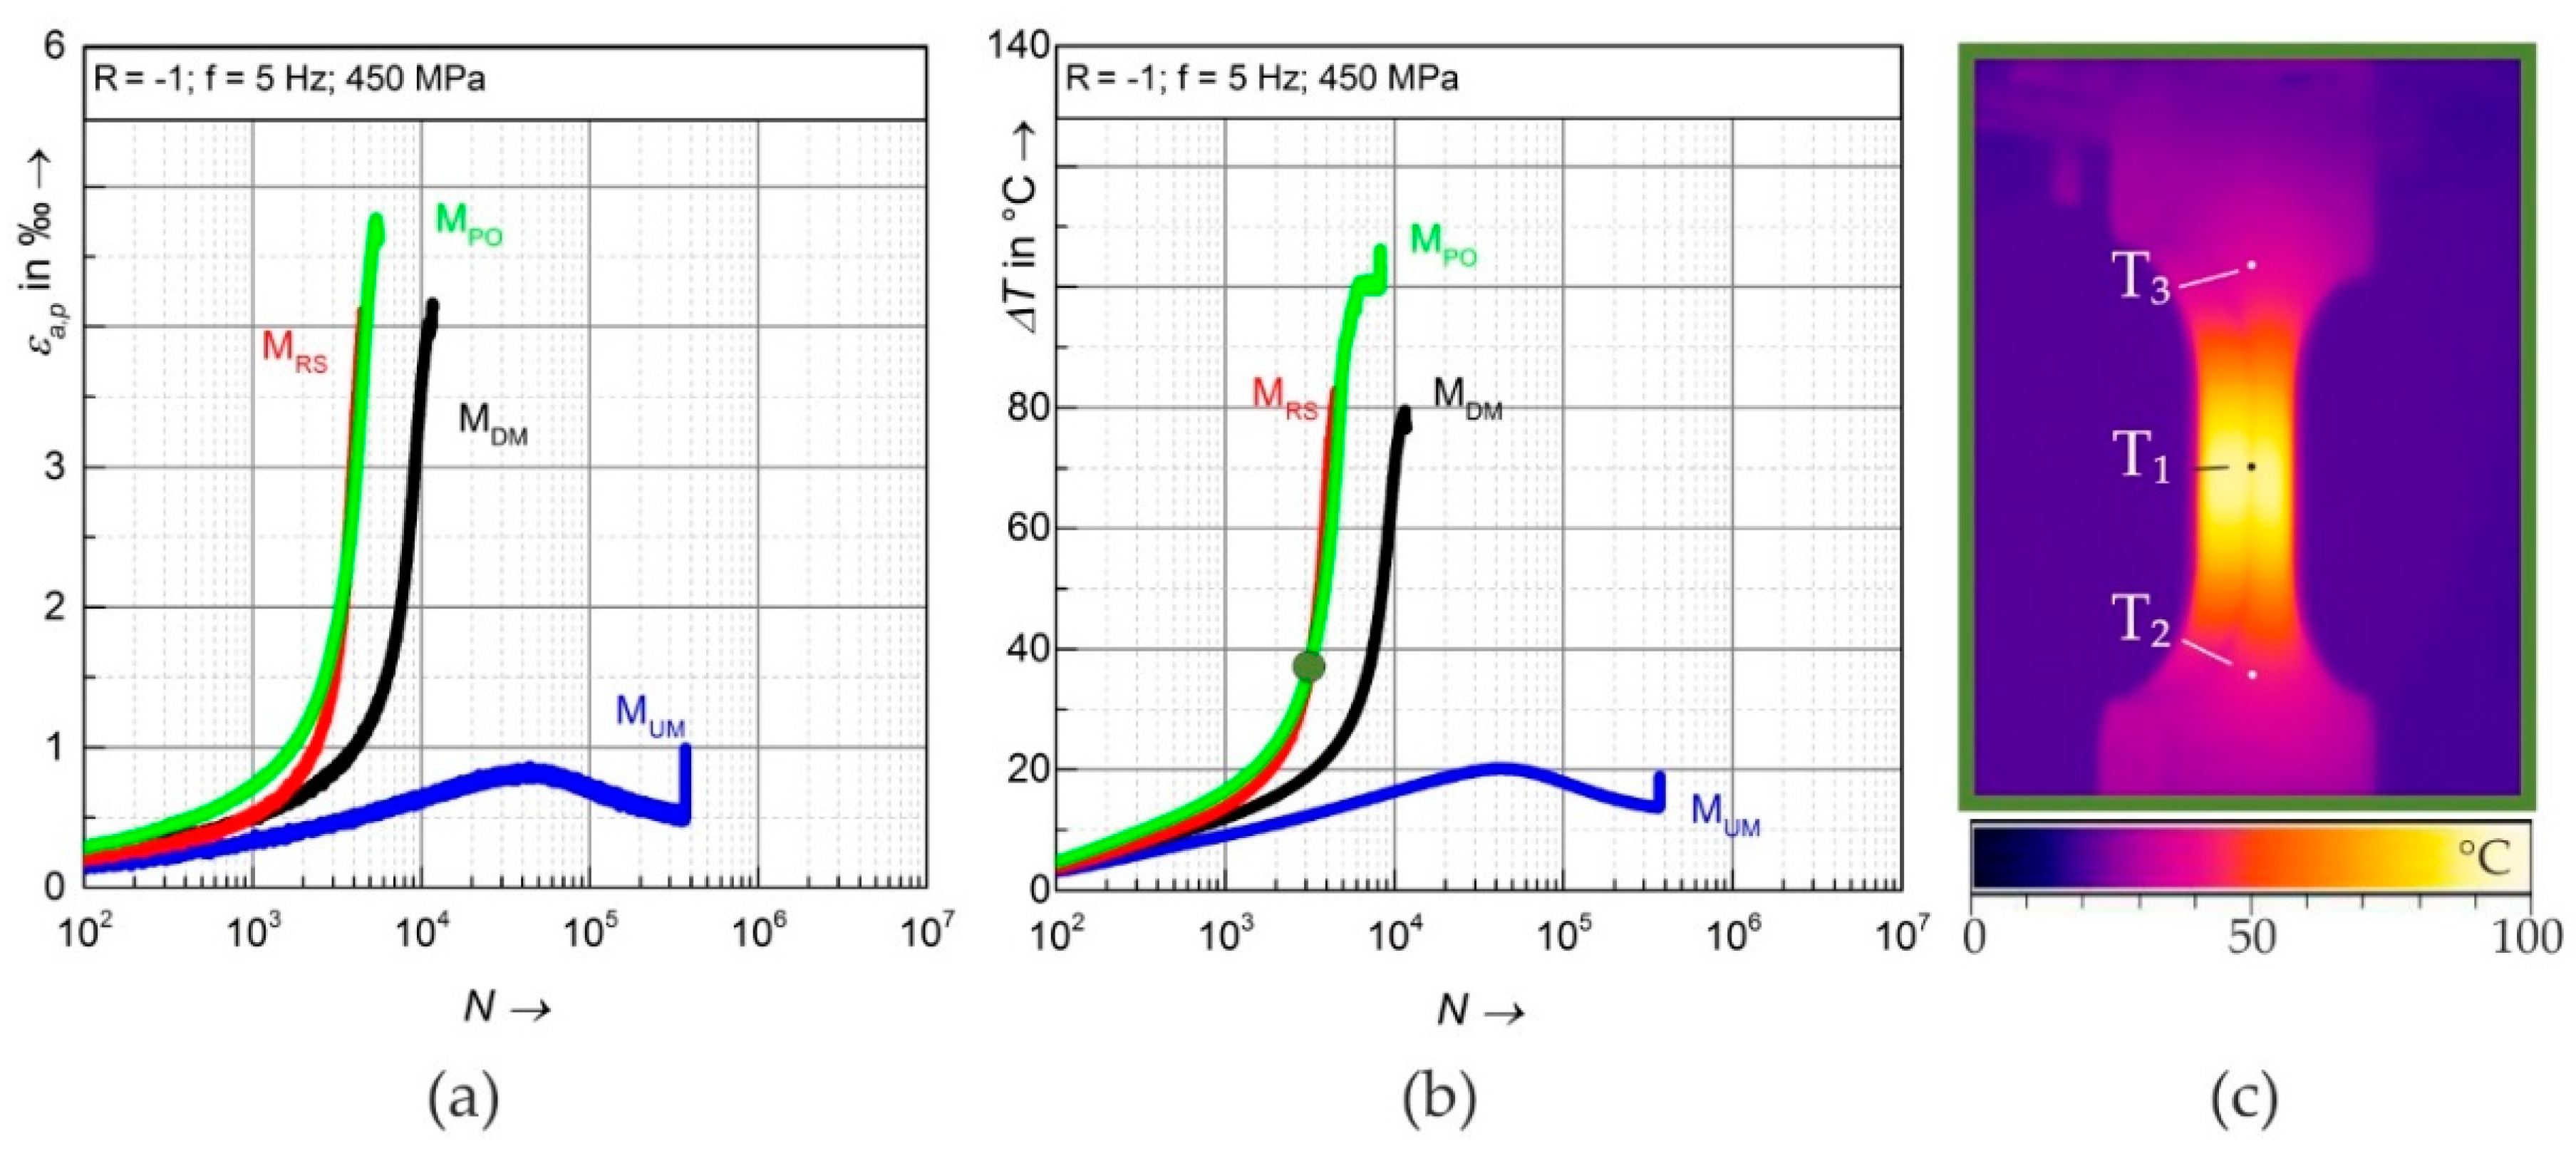
For f = 5 Hz, a considerable influence of the surface morphology on cyclic deformation behavior and fatigue life is observed (Figure 8). The plastic strain amplitude εa,p is nearly unaffected by the morphology until N ≈ 500 cycles. Afterwards, the MRS, MDM and MPO specimens show continuous cyclic softening which gets increasingly pronounced until failure. However, the morphology MDM achieves, compared with the morphologies MRS and MPO a higher number of cycles to failure and the progressive increase of εa,p and ΔT starts later (Figure 8a,b). Due to this considerable softening the temperature change ΔT calculated by Equation (1) is very pronounced and follows the plastic strain amplitude εa,p.
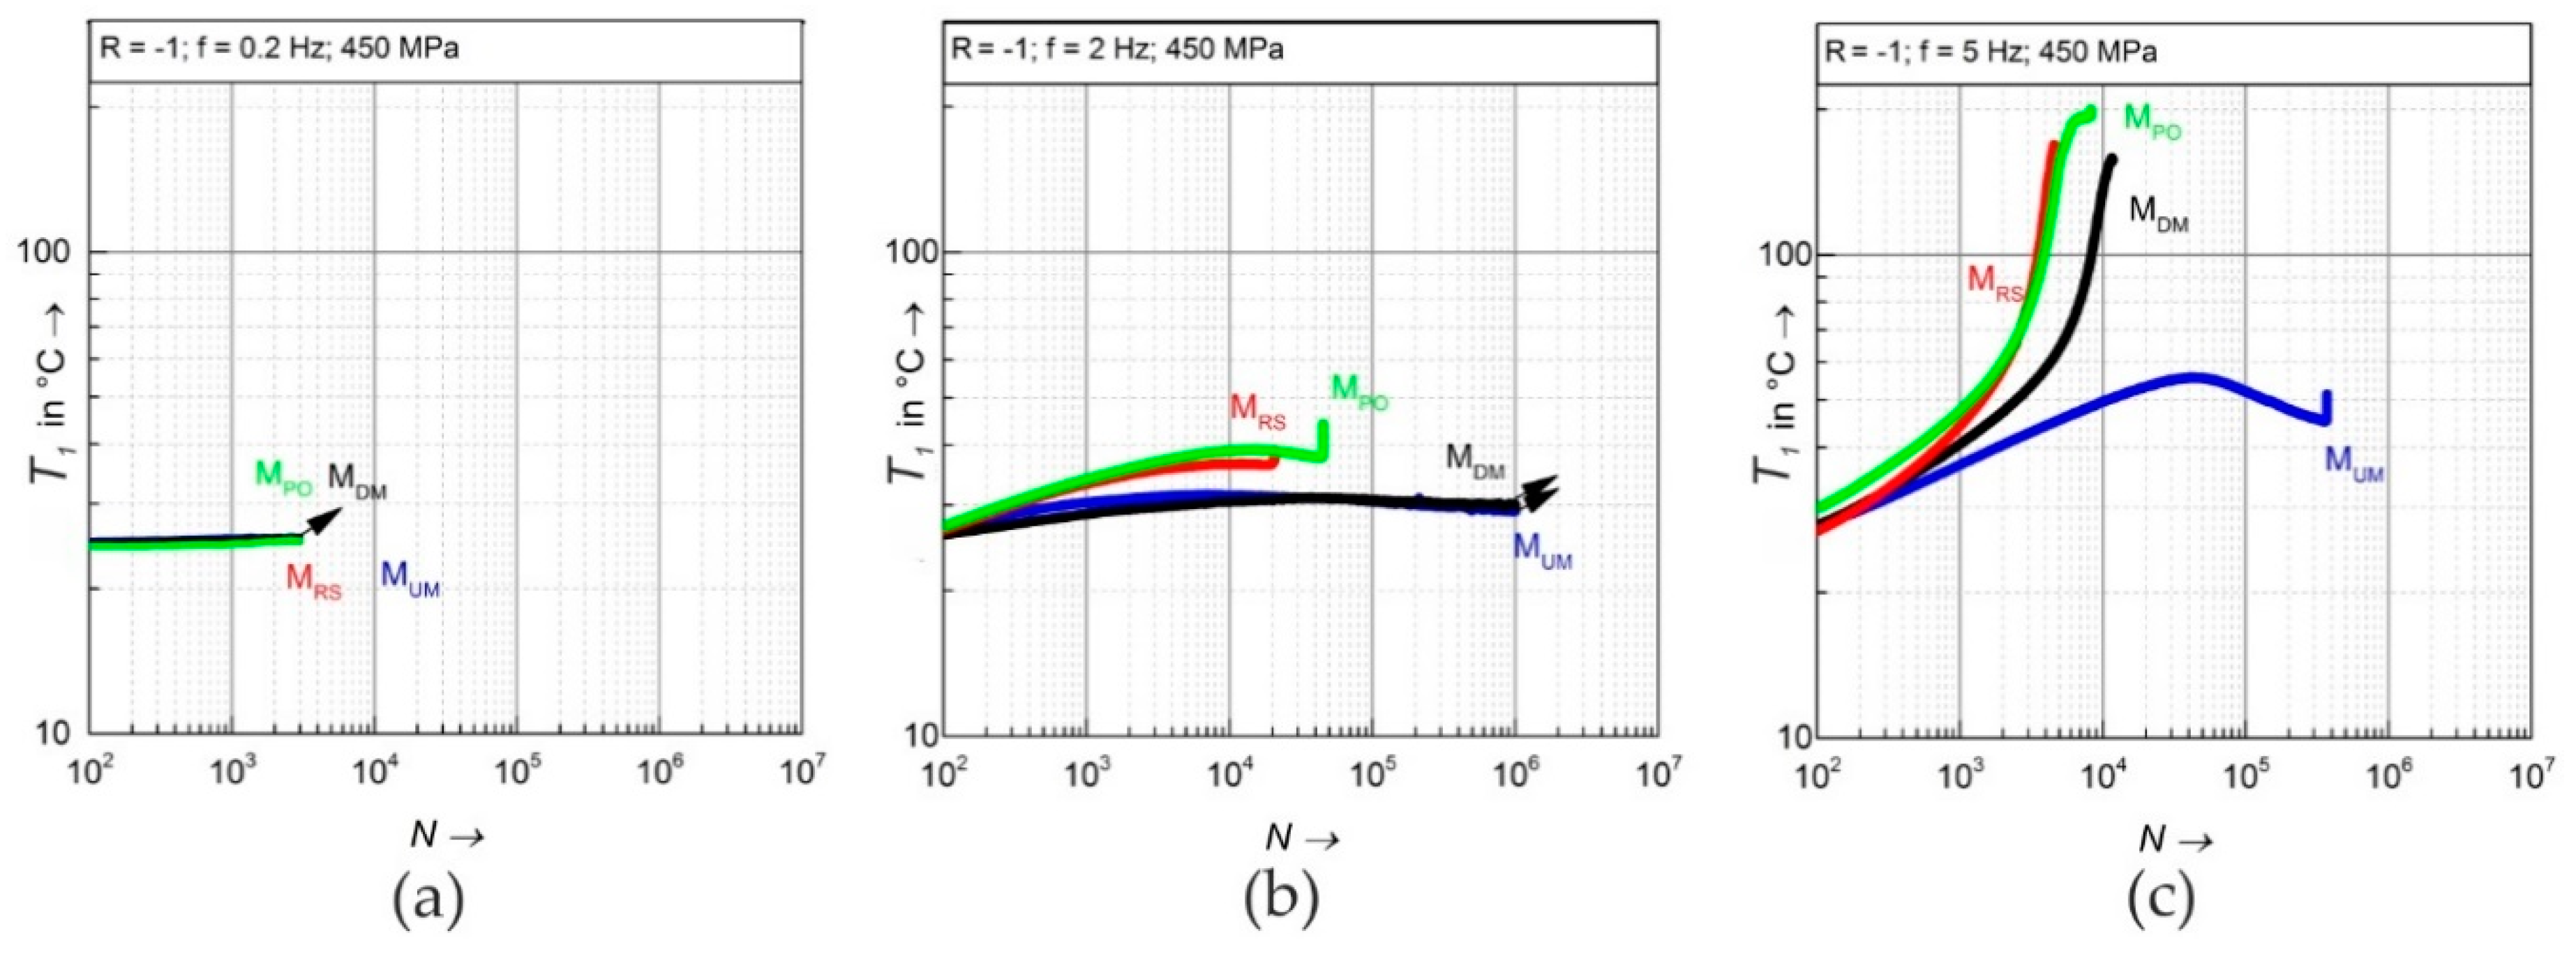
Opposed to the other variants, the specimen with surface morphology MUM shows a different cyclic deformation behavior because of the significantly high compressive residual surface stresses and the nanocrystalline layer underneath the surface, which both hinder progressive cyclic softening [45]. After initial cyclic softening up to approximately N ≈ 40,000 cycles, cyclic hardening is observed until failure at Nf = 400,000. The temperature change reaches its maximum of ΔT = 20 °C after N = 40,000 cycles (Figure 8b). As mentioned in the introduction, temperature has a significant impact on the deformation-induced microstructural mechanisms in metastable austenitic TWIP steels. In this context, the occurring absolute temperature T1 in the gage length is far more decisive than the temperature change ΔT, which is typically used for the characterization of cyclic deformation behavior [51,52]. The distribution of the temperatures of the specimen with the surface morphology MPO at N = 3000 cycles is represented in Figure 8c. The absolute temperature in the middle of the gage length is T1 = 84.1 °C while due to heat conduction the temperatures at the clamping sections reach T2 = 46.5 °C and T3 = 44.2 °C, respectively. The temperature change according to Equation (1) is only ΔT = 38.7 °C. The specimens with the morphologies MRS and MDM, reach similar temperatures revealed during the fatigue test with f = 5 Hz. In these variants, absolute temperatures T1 up to 200 °C are reached which strongly promote cyclic softening due to suppression of deformation-induced twinning. The absolute temperature of the MUM specimen did not exceed T1 = 50 °C (Figure 9c). Therefore, the specimen reaches a number of cycles where cyclic hardening occurs, associated with a decrease in absolute temperature until specimen failure.
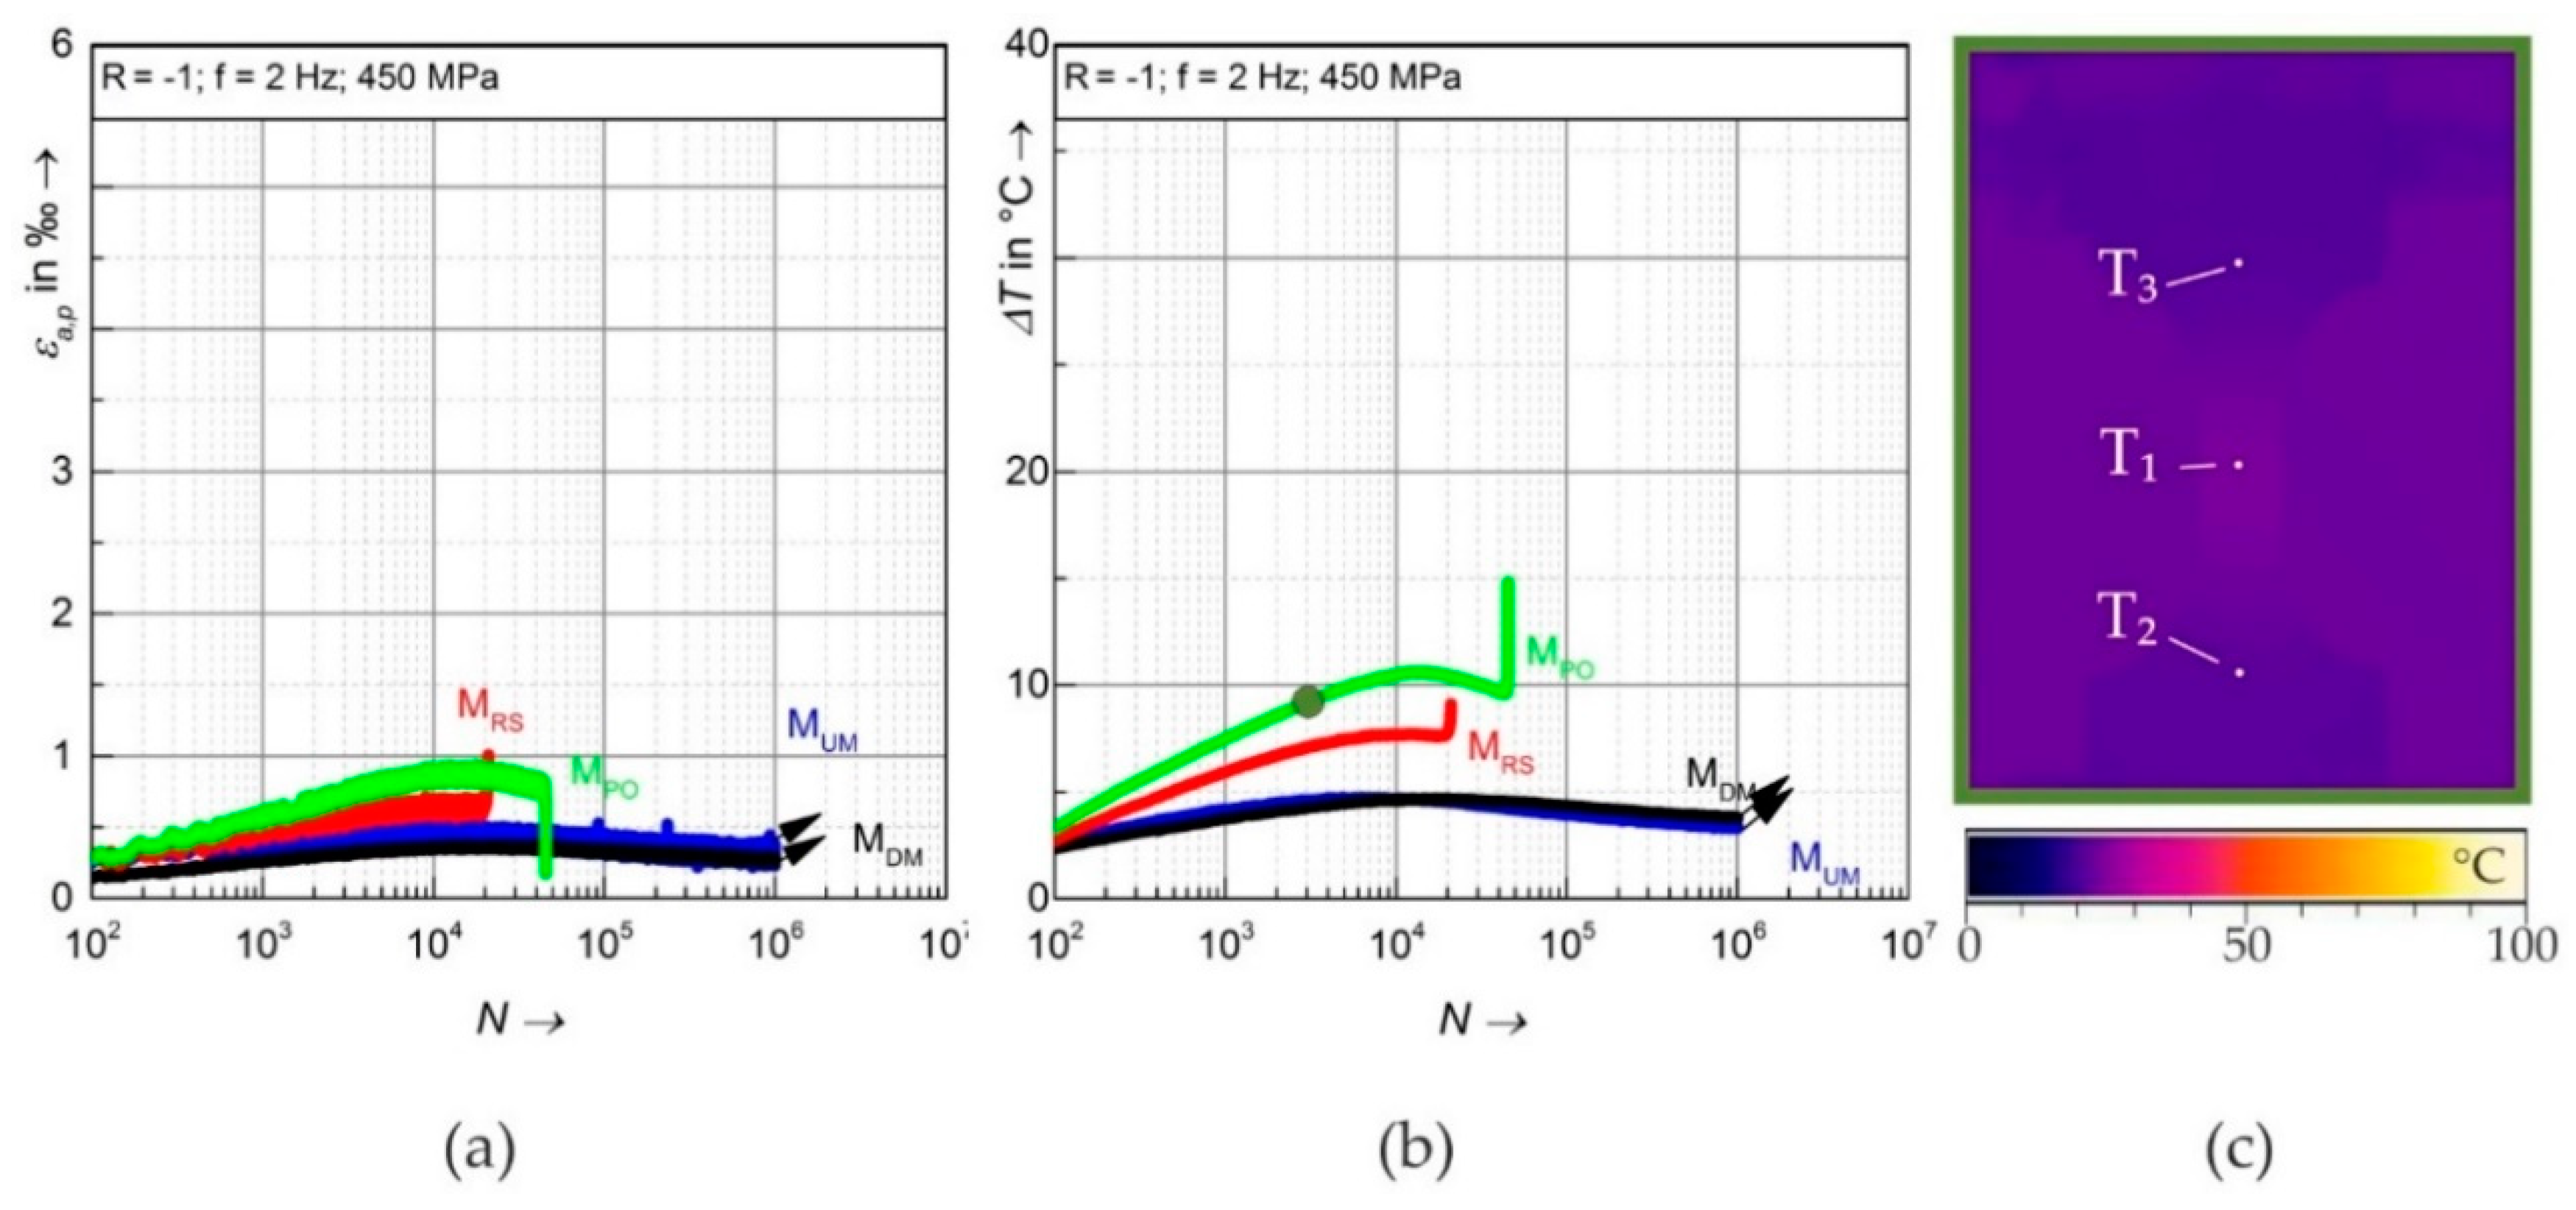
For f = 2 Hz, the cyclic deformation behavior of specimens with the surface morphology MRS, MDM and MPO is significantly different to the fatigue tests performed at f = 5 Hz. However, for all specimens the plastic strain amplitudes at N = 100 cycles are similar (εa,p ≈ 0.5‰) to f = 5 Hz (comp. Figure 8a and Figure 10a). The specimen with the morphology MRS shows cyclic softening up to 10,000 cycles, followed by cyclic saturation until failure at Nf = 20,000 cycles. The specimen with the morphology MPO also shows initial cyclic softening, but up from N = 10,000 cyclic hardening occurs. While the specimens with the morphologies MPO and MRS have similar compressive residual stresses, the specimen with the surface morphology MRS fails earlier due to its significant higher roughness, despite its potentially beneficial partially martensitic surface [45], which obviously does not compensate the detrimental influence of surface roughness.
To achieve an acceptable testing time, the ultimate number of cycles for f = 2 Hz was defined as 106 cycles. The specimens with the morphologies MUM and MDM both reach this run out criterion, and show nearly the same cyclic deformation behavior at f = 2 Hz while at f = 5 Hz the MDM and MUM specimen failed after 10,000 cycles and 400,000 cycles, respectively. For the specimen with the morphology MUM at f = 5 Hz, the amount of initial cyclic softening and following cyclic hardening changed: While at f = 5 Hz the MUM specimen achieved a maximum plastic strain amplitude of εa,p = 1‰, at f = 2 Hz a value of εa,p = 0.6‰ is not exceeded. The progressive cyclic softening of variant MDM observed at f = 5 Hz is at f = 2 Hz changed to weak cyclic softening followed by cyclic hardening, i.e., a similar behavior as observed for the MUM samples. Related to that, the absolute temperatures of specimens with the morphologies MUM and especially MDM were with T1 < 30 °C significantly lower for f = 2 Hz (Figure 9b) than for f = 5 Hz (Figure 9a) and the temperature gradients along the specimens were much less pronounced at f = 2 Hz (Figure 10c). In addition, the absolute temperatures due to self-heating of specimens with the morphologies MDM and MUM were approximately up to 10 °C lower than the temperatures of specimens with the morphologies MRS and MPO. The lower absolute temperatures of f = 2 Hz in comparison to those at f = 5 Hz (comp. Figure 9b,c) reduce the SFE of the material and therefore promote deformation-induced twinning. This led to significant increases in lifetimes of all investigated specimen variants. The still pronounced difference between the specimen variants is caused by their surface morphologies: The high compressive residual stresses (Figure 6b) in combination with the nanocrystalline layers underneath the surface (Figure 5b–e) and the sufficiently smooth topographies (Figure 4c–f) of the specimens with the morphologies MUM and MDM avoid specimen failure until the fatigue limit is reached. Nevertheless, the cyclic deformation behavior differs from that reported in the literature [32,33,34] for stress-controlled bending fatigue tests with f = 23 Hz and a load ratio R = −1, where a short initial cyclic hardening followed by cyclic softening and saturation state was seen for high-Mn TWIP steels in the HCF regime.
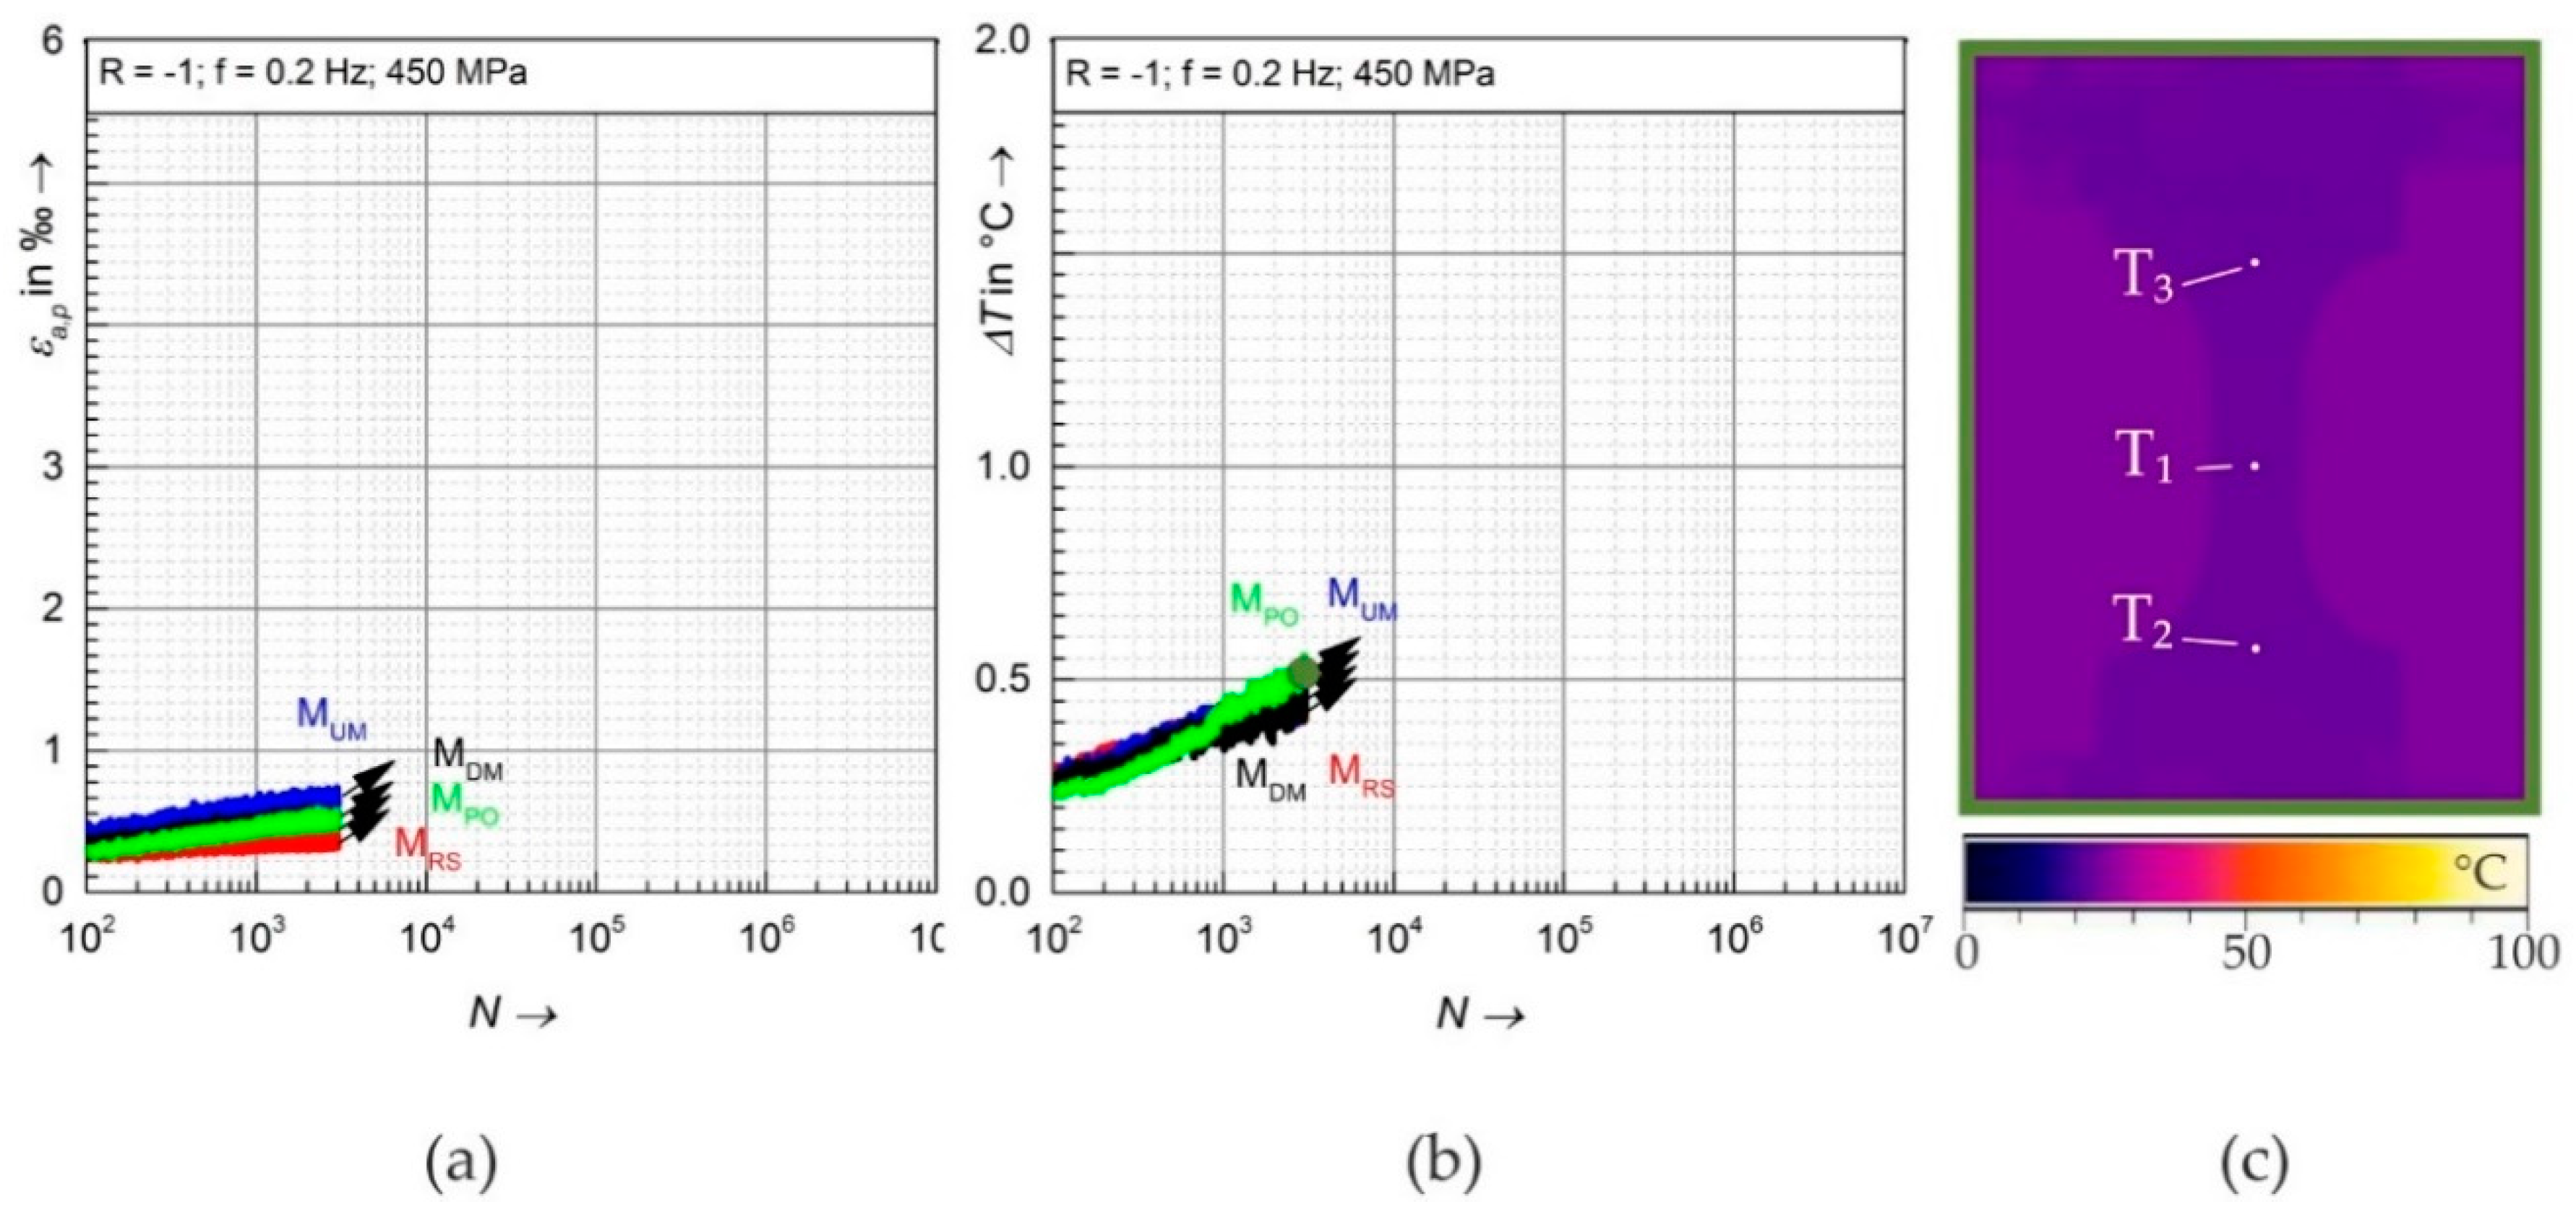
To eliminate the influence of temperature changes induced by plasticity induced self-heating on the cyclic deformation behavior, fatigue tests with a frequency of f = 0.2 Hz were performed until N = 3000 cycles. The temperature changes were below ΔT < 1 °C (Figure 11b) and the absolute temperatures remained very close to ambient temperature throughout the fatigue tests (Figure 9a). Accordingly, the temperature distribution on the surfaces was homogeneous (Figure 11c).
For all three test frequencies of f = 5 Hz, 2 Hz and 0.2 Hz, the plastic strain amplitude εa,p remains in the same range of εa,p ≈ 0.5‰ up to N = 300 cycles, even up to N = 1000 cycles for f = 2 Hz and f = 0.2 Hz (compare Figure 8a with Figure 10a and Figure 11a). Hence, a change in frequency and therewith in strain rate by a factor of 25 (5 Hz to 0.2 Hz) has no significant influence on the initial cyclic deformation behavior of the material. As reported in References [22,23], strain rates in the range of 10−1 s−1, which is about twice the highest strain rate of 5.5 × 10² s−1 applied in the present work, lead to a change in monotonic deformation behavior of a high-Mn TWIP steel only, however, for stress values >130% Rp0.2. Because in the present study only stress amplitudes up to 75% Rp0.2 were applied, the changes in cyclic deformation behavior as described above, are caused by significant differences in specimen temperatures due to plasticity induced self-heating (see Figure 9).
For f = 0.2 Hz, all specimen variants undergo cyclic softening throughout the 3000 tested cycles. The less pronounced increase of plastic strain amplitude compared to f = 2 Hz, and especially to f = 5 Hz, is again assumed to be caused by the less pronounced self-heating with decreasing test frequency (see Figure 9).
4. Summary and Conclusions
The cyclic deformation behavior of the metastable austenitic HSD® 600 TWIP steel with four surface morphologies, i.e., as-received with rolling skin (MRS), down milled (MDM), up milled (MUM) and polished (MPO) was investigated in strain-controlled LCF at f = 0.2 Hz and in stress-controlled HCF tests at f = 0.2 Hz, 2 Hz and 5 Hz, respectively. The test results can be summarized as follows:
- The morphology MRS was by far the roughest and showed an uneven surface. Both of the milled morphologies MDM and MUM had significantly smoother surfaces, but showed periodic traces of the milling tool, which were more pronounced on the morphology MDM. The morphology MPO showed the smoothest surface. A fraction of 32 vol. % of α’-martensite was present in MRS while the other morphologies MDM, MUM and MPO were mostly austenitic with a small fraction of ε-martensite. In the milled morphologies compressive residual stresses of −600 MPa (MUM) and −800 MPa (MDM) were measured while the morphologies MRS and MPO showed significantly smaller residual stresses of −100 MPa and −120 MPa, respectively. FIB cuts revealed a machining induced nanocrystalline sub-surface layer in the milled morphologies MUM and MDM.
- In the LCF regime mainly the surface topography influenced fatigue lifetime. In the HCF regime, the influence of the other surface morphology features, i.e., residual stress and nanocrystalline sub-surface layers became significant. At f = 5 Hz, specimens with the morphology MUM showed initial cyclic softening followed cyclic hardening while for all other morphologies progressive cyclic softening and early failure was observed. For f = 2 Hz, only specimens with the milled surfaces reached the fatigue limit of 106 cycles due to their nanocrystalline surface layer and high compressive residual stresses.
- When applying a testing frequency of f = 5 Hz in HCF tests, the specimen temperature increased up to 200 °C due to plasticity induced self-heating. This promoted progressive cyclic softening as well as early failure of the specimens with the morphologies MRS, MUM and MPO. For f = 2 Hz, the self-heating of the specimens was significantly less pronounced and the specimen temperatures remained below 50 °C for all investigated surface morphologies. The temperature change ΔT in the gage length with respect to the clamping sections was significantly lower than the absolute temperatures and hence not suitable to explain the temperature influence on cyclic deformation, but to be an efficient means to characterize the cyclic deformation behavior, i.e., softening, hardening or saturation.
- To achieve comparable results for different loading amplitudes and surface morphologies, it is hence essential to choose appropriate test frequencies at which specimen self-heating does not influence the cyclic deformation behavior.
Author Contributions
Conceptualization, M.W.K. and M.S.; Methodology, M.W.K. and M.S.; Validation, M.S. and T.B.; Formal Analysis, M.W.K.; Investigation, M.W.K. and M.S.; Resources, M.S. and T.B.; Data Curation, M.W.K.; Writing-Original Draft Preparation, M.W.K.; Writing-Review & Editing, M.S. and T.B.; Visualization, M.W.K. and M.S.; Supervision, T.B.; Project Administration, M.S. and T.B.; Funding Acquisition, M.S. and T.B.
Funding
This research was funded by Deutsche Forschungsgemeinschaft (DFG) within the CRC 926.
Acknowledgments
The authors are grateful for the financial support of the German Research Foundation (Deutsche Forschungsgemeinschaft, DFG) as part of the Collaborative Research Center 926. The authors also wish to thank Jörg Seewig, Department of Mechanical and Process Engineering, University of Kaiserslautern for use of the confocal microscope, and Salzgitter AG for providing the HSD® 600 steel.
Conflicts of Interest
The funders had no role in the design of the study; in the collection, analyses, or interpretation of data; in the writing of the manuscript, or in the decision to publish the results.
References
- De Cooman, B.C.; Estrin, Y.; Kim, S.K. Twinning-induced plasticity (TWIP) steels. Acta Mater. 2018, 142, 283–362. [Google Scholar] [CrossRef]
- Gutierrez-Urrutia, I.; Raabe, D. Multistage strain hardening through dislocation substructure and twinning in a high strength and ductile weight-reduced Fe–Mn–Al–C steel. Acta Mater. 2012, 60, 5791–5802. [Google Scholar] [CrossRef]
- Saeed-Akbari, A.; Schwedt, A.; Bleck, W. Low stacking fault energy steels in the context of manganese-rich iron-based alloys. Scr. Mater. 2012, 66, 1024–1029. [Google Scholar] [CrossRef]
- Frommeyer, G.; Brüx, U.; Neumann, P. Supra-Ductile and High-Strength Manganese-TRIP/TWIP Steels for High Energy Absorption Purposes. ISIJ Int. 2003, 43, 438–446. [Google Scholar] [CrossRef]
- Saeed-Akbari, A.; Mosecker, L.; Schwedt, A.; Bleck, W. Characterization and Prediction of Flow Behavior in High-Manganese Twinning Induced Plasticity Steels. Metall. Mater. Trans. A 2012, 43, 1688–1704. [Google Scholar] [CrossRef]
- Grässel, O.; Krüger, L.; Frommeyer, G.; Meyer, L. High strength Fe–Mn–(Al, Si) TRIP/TWIP steels development–properties–application. Int. J. Plast. 2000, 16, 1391–1409. [Google Scholar] [CrossRef]
- Torganchuk, V.; Glezer, A.M.; Belyakov, A.; Kaibyshev, R. Deformation Behavior of High-Mn TWIP Steels Processed by Warm-to-Hot Working. Metals 2018, 8, 415. [Google Scholar] [CrossRef]
- Klein, M.W.; Skorupski, R.; Smaga, M.; Beck, T. Phase Transformation and Deformation Behavior of Steels with Different Content of Metastable Austenite. Eng. Trans. 2016, 64, 69–75. [Google Scholar]
- Gutierrez-Urrutia, I.; Raabe, D. Grain size effect on strain hardening in twinning-induced plasticity steels. Scr. Mater. 2012, 66, 992–996. [Google Scholar] [CrossRef]
- Linderov, M.; Segel, C.; Weidner, A.; Biermann, H.; Vinogradov, A. Deformation mechanisms in austenitic TRIP/TWIP steels at room and elevated temperature investigated by acoustic emission and scanning electron microscopy. Mater. Sci. Eng. A 2014, 597, 183–193. [Google Scholar] [CrossRef]
- Martin, S.; Fabrichnaya, O.; Rafaja, D. Prediction of the local deformation mechanisms in metastable austenitic steels from the local concentration of the main alloying elements. Mater. Lett. 2015, 159, 484–488. [Google Scholar] [CrossRef]
- Bouaziz, O.; Allain, S.; Scott, C.P.; Cugy, P.; Barbier, D. High manganese austenitic twinning induced plasticity steels. Curr. Opin. Solid State Mater. Sci. 2011, 15, 141–168. [Google Scholar] [CrossRef]
- Galindo-Nava, E.I.; Rivera-Díaz-del-Castillo, P. Understanding martensite and twin formation in austenitic steels. Acta Mater. 2017, 128, 120–134. [Google Scholar] [CrossRef]
- Herrera, C.; Ponge, D.; Raabe, D. Design of a novel Mn-based 1GPa duplex stainless TRIP steel with 60% ductility by a reduction of austenite stability. Acta Mater. 2011, 59, 4653–4664. [Google Scholar] [CrossRef]
- Dumay, A.; Chateau, J.-P.; Allain, S.; Migot, S.; Bouaziz, O. Influence of addition elements on the stacking-fault energy and mechanical properties of an austenitic Fe–Mn–C steel. Mater. Sci. Eng. A 2008, 483–484, 184–187. [Google Scholar] [CrossRef]
- Saeed-Akbari, A.; Imlau, J.; Prahl, U.; Bleck, W. Derivation and Variation in Composition-Dependent Stacking Fault Energy Maps Based on Subregular Solution Model in High-Manganese Steels. Metall. Mater. Trans. A 2009, 40, 3076–3090. [Google Scholar] [CrossRef]
- Lu, S.; Hu, Q.-M.; Johansson, B.; Vitos, L. Stacking fault energies of Mn, Co and Nb alloyed austenitic stainless steels. Acta Mater. 2011, 59, 5728–5734. [Google Scholar] [CrossRef]
- Abbasi, A.; Dick, A.; Hickel, T.; Neugebauer, J. First-principles investigation of the effect of carbon on the stacking fault energy of Fe–C alloys. Acta Mater. 2011, 59, 3041–3048. [Google Scholar] [CrossRef]
- Pierce, D.T.; Jiménez, J.A.; Bentley, J.; Raabe, D.; Oskay, C.; Wittig, J.E. The influence of manganese content on the stacking fault and austenite/ε-martensite interfacial energies in Fe–Mn–(Al–Si) steels investigated by experiment and theory. Acta Mater. 2014, 68, 238–253. [Google Scholar] [CrossRef]
- Martin, S.; Wolf, S.; Martin, U.; Krüger, L.; Rafaja, D. Deformation Mechanisms in Austenitic TRIP/TWIP Steel as a Function of Temperature. Metall. Mater. Trans. A 2016, 47, 49–58. [Google Scholar] [CrossRef]
- Baeumer, A.; Antonio Jimenez, J.; Bleck, W. Effect of temperature and strain rate on strain hardening and deformation mechanisms of high manganese austenitic steels. Int. J. Mater. Res. 2010, 101, 705–714. [Google Scholar] [CrossRef]
- Kim, J.-K.; Chen, L.; Kim, H.-S.; Kim, S.-K.; Estrin, Y.; de Cooman, B.C. On the Tensile Behavior of High-Manganese Twinning-Induced Plasticity Steel. Metall. Mater. Trans. A 2009, 40, 3147–3158. [Google Scholar] [CrossRef] [Green Version]
- Bintu, A.; Vincze, G.; Picu, C.R.; Lopes, A.B.; Grácio, J.J.; Barlat, F. Strain hardening rate sensitivity and strain rate sensitivity in TWIP steels. Mater. Sci. Eng. A 2015, 629, 54–59. [Google Scholar] [CrossRef]
- Wu, Y.-X.; Tang, D.; Jiang, H.-T.; Mi, Z.-L.; Xue, Y.; Wu, H.-P. Low Cycle Fatigue Behavior and Deformation Mechanism of TWIP Steel. J. Iron Steel Res. Int. 2014, 21, 352–358. [Google Scholar] [CrossRef]
- Schilke, M.; Ahlström, J.; Karlsson, B. Low cycle fatigue and deformation behaviour of austenitic manganese steel in rolled and in as-cast conditions. Procedia Eng. 2010, 2, 623–628. [Google Scholar] [CrossRef]
- Shao, C.W.; Zhang, P.; Liu, R.; Zhang, Z.J.; Pang, J.C.; Zhang, Z.F. Low-cycle and extremely-low-cycle fatigue behaviors of high-Mn austenitic TRIP/TWIP alloys. Acta Mater. 2016, 103, 781–795. [Google Scholar] [CrossRef]
- Shao, C.W.; Zhang, P.; Zhu, Y.K.; Zhang, Z.J.; Pang, J.C.; Zhang, Z.F. Improvement of low-cycle fatigue resistance in TWIP steel by regulating the grain size and distribution. Acta Mater. 2017, 134, 128–142. [Google Scholar] [CrossRef]
- Nikulin, I.; Sawaguchi, T.; Tsuzaki, K. Effect of alloying composition on low-cycle fatigue properties and microstructure of Fe–30Mn–(6−x)Si–xAl TRIP/TWIP alloys. Mater. Sci. Eng. A 2013, 587, 192–200. [Google Scholar] [CrossRef]
- Nikulin, I.; Sawaguchi, T.; Ogawa, K.; Tsuzaki, K. Effect of γ to ε martensitic transformation on low-cycle fatigue behaviour and fatigue microstructure of Fe–15Mn–10Cr–8Ni–xSi austenitic alloys. Acta Mater. 2016, 105, 207–218. [Google Scholar] [CrossRef]
- Ju, Y.-B.; Koyama, M.; Sawaguchi, T.; Tsuzaki, K.; Noguchi, H. Effects of ε-martensitic transformation on crack tip deformation, plastic damage accumulation, and slip plane cracking associated with low-cycle fatigue crack growth. Int. J. Fatigue 2017, 103, 533–545. [Google Scholar] [CrossRef]
- Song, S.W.; Lee, J.H.; Lee, H.J.; Bae, C.M.; Lee, C.S. Enhancing high-cycle fatigue properties of cold-drawn Fe–Mn–C TWIP steels. Int. J. Fatigue 2016, 85, 57–64. [Google Scholar] [CrossRef]
- Hamada, A.S.; Karjalainen, L.P.; Puustinen, J. Fatigue behavior of high-Mn TWIP steels. Mater. Sci. Eng. A 2009, 517, 68–77. [Google Scholar] [CrossRef]
- Hamada, A.S.; Karjalainen, L.P.; Ferraiuolo, A.; Gil Sevillano, J.; de las Cuevas, F.; Pratolongo, G.; Reis, M. Fatigue Behavior of Four High-Mn Twinning Induced Plasticity Effect Steels. Metall. Mater. Trans. A 2010, 41, 1102–1108. [Google Scholar] [CrossRef]
- Hamada, A.S.; Karjalainen, L.P. High-cycle fatigue behavior of ultrafine-grained austenitic stainless and TWIP steels. Mater. Sci. Eng. A 2010, 527, 5715–5722. [Google Scholar] [CrossRef]
- Niendorf, T.; Lotze, C.; Canadinc, D.; Frehn, A.; Maier, H.J. The role of monotonic pre-deformation on the fatigue performance of a high-manganese austenitic TWIP steel. Mater. Sci. Eng. A 2009, 499, 518–524. [Google Scholar] [CrossRef]
- Wang, B.; Zhang, P.; Duan, Q.Q.; Zhang, Z.J.; Yang, H.J.; Pang, J.C.; Tian, Y.Z.; Li, X.W.; Zhang, Z.F. High-cycle fatigue properties and damage mechanisms of pre-strained Fe-30Mn-09C twinning-induced plasticity steel. Mater. Sci. Eng. A 2017, 679, 258–271. [Google Scholar] [CrossRef]
- Rüsing, C.J.; Lambers, H.-G.; Lackmann, J.; Frehn, A.; Nagel, M.; Schaper, M.; Maier, H.J.; Niendorf, T. Property Optimization for TWIP Steels—Effect of Pre-deformation Temperature on Fatigue Properties. Mater. Today Proc. 2014, 2, 681–685. [Google Scholar] [CrossRef]
- Wang, B.; Zhang, P.; Duan, Q.Q.; Zhang, Z.J.; Yang, H.J.; Pang, J.C.; Tian, Y.Z.; Li, X.W.; Zhang, Z.F. Synchronously improved fatigue strength and fatigue crack growth resistance in twinning-induced plasticity steels. Mater. Sci. Eng. A 2018, 711, 533–542. [Google Scholar] [CrossRef]
- Skorupski, R.; Smaga, M.; Eifler, D. Influence of Surface Morphology on the Fatigue Behavior of Metastable Austenitic Steel. Adv. Mater. Res. 2014, 891–892, 464–469. [Google Scholar] [CrossRef]
- Mughrabi, H. Cyclic Slip Irreversibilities and the Evolution of Fatigue Damage. Metall. Mater. Trans. B 2009, 40, 431–453. [Google Scholar] [CrossRef]
- Zhang, H.; Hei, Z.; Liu, G.; Lu, J.; Lu, K. Formation of nanostructured surface layer on AISI 304 stainless steel by means of surface mechanical attrition treatment. Acta Mater. 2003, 51, 1871–1881. [Google Scholar] [CrossRef]
- Boemke, A.; Smaga, M.; Beck, T. Influence of surface morphology on the very high cycle fatigue behavior of metastable and stable austenitic Cr-Ni steels. In MATEC Web of Conferences; EDP Sciences: Les Ulis, France, 2018; Volume 165. [Google Scholar] [CrossRef]
- Roland, T.; Retraint, D.; Lu, K.; Lu, J. Fatigue life improvement through surface nanostructuring of stainless steel by means of surface mechanical attrition treatment. Scr. Mater. 2006, 54, 1949–1954. [Google Scholar] [CrossRef]
- Altenberger, I.; Scholtes, B.; Martin, U.; Oettel, H. Cyclic deformation and near surface microstructures of shot peened or deep rolled austenitic stainless steel AISI 304. Mater. Sci. Eng. A 1999, 264, 1–16. [Google Scholar] [CrossRef]
- Smaga, M.; Skorupski, R.; Eifler, D.; Beck, T. Microstructural characterization of cyclic deformation behavior of metastable austenitic stainless steel AISI 347 with different surface morphology. J. Mater. Res. 2017, 32, 4452–4460. [Google Scholar] [CrossRef] [Green Version]
- Kalsar, R.; Suwas, S. A novel way to enhance the strength of twinning induced plasticity (TWIP) steels. Scr. Mater. 2018, 154, 207–211. [Google Scholar] [CrossRef]
- Nikitin, B.; Besel, M. Effect of low-frequency on fatigue behaviour of austenitic steel AISI 304 at room temperature and 25 °C. Int. J. Fatigue 2008, 30, 2044–2049. [Google Scholar] [CrossRef]
- Pessoa, D.F.; Kirchhoff, G.; Zimmermann, M. Influence of loading frequency and role of surface micro-defects on fatigue behavior of metastable austenitic stainless steel AISI 304. Int. J. Fatigue 2017, 103, 48–59. [Google Scholar] [CrossRef]
- Smaga, M.; Boemke, A.; Daniel, T.; Klein, M.W. Metastability and fatigue behavior of austenitic stainless steels. In MATEC Web of Conferences; EDP Sciences: Les Ulis, France, 2018; Volume 165, p. 4010. [Google Scholar] [CrossRef]
- Bish, D.L.; Howard, S.A. Quantitative phase analysis using the Rietveld method. J. Appl. Crystallogr. 1988, 21, 86–91. [Google Scholar] [CrossRef] [Green Version]
- Biallas, G.; Piotrowski, A.; Eifler, D. Cyclic Stress-Strain, Stress-Temperature and Stress-Electrical Resistance Response of NiCuMo alloyed sintered steel. Fatigue Fract. Eng. Mat. Struct. 1995, 18, 605–615. [Google Scholar] [CrossRef]
- Piotrowski, A.; Eifler, D. Characterization of cyclic deformation behaviour by mechanical, thermometrical and electrical methods. Materialwiss. Werkstofftech. 1995, 26, 121–127. [Google Scholar]
- Klein, M.W.; Smaga, M.; Beck, T. Influence of the surface morphology on the cyclic deformation behavior of HSD® 600 steel. In MATEC Web of Conferences; EDP Sciences: Les Ulis, France, 2018; Volume 165, p. 6010. [Google Scholar] [CrossRef]
Figure 1.
Experimental setup for fatigue testing with extensometer (ε), Feritscope® (ξ) and thermocouples (T1–T3).
Figure 1.
Experimental setup for fatigue testing with extensometer (ε), Feritscope® (ξ) and thermocouples (T1–T3).
Figure 2.
Microstructure of HSD® 600 TWIP steel in polished state: (a) inverse pole figure of Electron Backscatter Diffraction (EBSD) (RD: rolling direction); (b) X-Ray Diffraction (XRD) and phase fractions in vol. %.
Figure 2.
Microstructure of HSD® 600 TWIP steel in polished state: (a) inverse pole figure of Electron Backscatter Diffraction (EBSD) (RD: rolling direction); (b) X-Ray Diffraction (XRD) and phase fractions in vol. %.
Figure 3.
Fatigue specimen geometry (a) and photo of specimens with four surface morphologies: (b) MRS; (c) MDM; (d) MUM; (e) MPO; LD: loading direction; RD: rolling direction.
Figure 3.
Fatigue specimen geometry (a) and photo of specimens with four surface morphologies: (b) MRS; (c) MDM; (d) MUM; (e) MPO; LD: loading direction; RD: rolling direction.
Figure 4.
Topographies of the investigated morphologies: (a) confocal image MRS; (b) Secondary electron (SE)image MRS; (c) confocal image MDM; (d) SE image MDM with traces of the down milling process; (e) confocal image MUM; (f) SE image MUM; (g) confocal image MPO; (h) SE image MPO.
Figure 4.
Topographies of the investigated morphologies: (a) confocal image MRS; (b) Secondary electron (SE)image MRS; (c) confocal image MDM; (d) SE image MDM with traces of the down milling process; (e) confocal image MUM; (f) SE image MUM; (g) confocal image MPO; (h) SE image MPO.
Figure 5.
Focused Ion Beam (FIB) images of the investigated surface morphologies transverse and longitudinal to loading direction (LD) and rolling direction (RD): (a) MRS longitudinal to loading direction; (b) MRS transverse to loading direction; (c) MDM longitudinal to loading direction; (d) MDM transverse to rolling direction; (e) MUM longitudinal to rolling direction; (f) MDM transverse to rolling direction; (g) MPO longitudinal to rolling direction; (h) MPO transverse to rolling direction.
Figure 6.
Phase fractions (a) and residual stresses (b) of investigated surface morphologies.
Figure 7.
Low cycle fatigue behavior of HSD® 600 TWIP steel with different surface morphologies: (a) development of stress amplitude (σa) vs. number of cycles (N); (b) total strain S-N curve.
Figure 7.
Low cycle fatigue behavior of HSD® 600 TWIP steel with different surface morphologies: (a) development of stress amplitude (σa) vs. number of cycles (N); (b) total strain S-N curve.
Figure 8.
Stress-controlled single step tests at 450 MPa, f = 5 Hz: (a) development of plastic strain amplitude (εa,p) vs. number of cycles (N); (b) development of temperature change (ΔT) vs. number of cycles (N); (c) distribution of temperature on a specimen with morphology MPO at N = 3000.
Figure 8.
Stress-controlled single step tests at 450 MPa, f = 5 Hz: (a) development of plastic strain amplitude (εa,p) vs. number of cycles (N); (b) development of temperature change (ΔT) vs. number of cycles (N); (c) distribution of temperature on a specimen with morphology MPO at N = 3000.
Figure 9.
Development of absolute temperatures T1 in the gage length for stress controlled fatigue tests with: (a) f = 0.2 Hz; (b) f = 2 Hz; (c) f = 5 Hz.
Figure 9.
Development of absolute temperatures T1 in the gage length for stress controlled fatigue tests with: (a) f = 0.2 Hz; (b) f = 2 Hz; (c) f = 5 Hz.
Figure 10.
Stress-controlled single step tests at 450 MPa, f = 2 Hz: (a) development of plastic strain amplitude (εa,p) vs. number of cycles (N); (b) development of temperature change (ΔT) vs. number of cycles (N); (c) distribution of temperature on a specimen with morphology MPO at N = 3000.
Figure 10.
Stress-controlled single step tests at 450 MPa, f = 2 Hz: (a) development of plastic strain amplitude (εa,p) vs. number of cycles (N); (b) development of temperature change (ΔT) vs. number of cycles (N); (c) distribution of temperature on a specimen with morphology MPO at N = 3000.
Figure 11.
Stress-controlled single step tests at 450 MPa, f = 0.2 Hz: (a) development of plastic strain amplitude (εa,p) vs. number of cycles (N); (b) development of temperature change (ΔT) vs. number of cycles (N); (c) distribution of temperature on a specimen with morphology MPO at N = 3000.
Figure 11.
Stress-controlled single step tests at 450 MPa, f = 0.2 Hz: (a) development of plastic strain amplitude (εa,p) vs. number of cycles (N); (b) development of temperature change (ΔT) vs. number of cycles (N); (c) distribution of temperature on a specimen with morphology MPO at N = 3000.

Table 1.
Chemical composition of HSD® 600 steel in wt. %.
| Element | C | Mn | Al | Si |
|---|---|---|---|---|
| wt. % | 0.36 | 15.30 | 1.80 | 2.30 |
Table 2.
Mechanical properties of the HSD® 600 steel (RD: rolling direction).
| Direction | Young’s Modulus in GPa | Yield Strength in MPa | Tensile Strength in MPa | Elongation at the Fracture in % | Hardness HV10 |
|---|---|---|---|---|---|
| Longitudinal to RD | 169 ± 7 | 607 ± 21 | 1028 ± 10 | 53 ± 2 | 301 ± 13 |
| Transverse to RD | 180 ± 1 | 621 ± 5 | 1044 ± 4 | 50 ± 2 | 301 ± 13 |
Table 3.
Milling parameters of the investigated surface morphologies.
| Tool Coating | fz/mm | n | nz |
|---|---|---|---|
| AlTiN | 0.025 | 5091 | 4 |
Table 4.
Mean roughness (Rz) in µm of the investigated surface morphologies.
| Morphology | MRS | MDM | MUM | MPO |
|---|---|---|---|---|
| Rz in µm (confocal) | 6.17 | 0.75 | 1.18 | 0.20 |
| Rz in µm (tactile) | 5.80 | 0.55 | 1.96 | 0.45 |
© 2018 by the authors. Licensee MDPI, Basel, Switzerland. This article is an open access article distributed under the terms and conditions of the Creative Commons Attribution (CC BY) license (http://creativecommons.org/licenses/by/4.0/).
Share and Cite
MDPI and ACS Style
Klein, M.W.; Smaga, M.; Beck, T. Surface Morphology and Its Influence on Cyclic Deformation Behavior of High-Mn TWIP Steel. Metals 2018, 8, 832. https://doi.org/10.3390/met8100832
AMA Style
Klein MW, Smaga M, Beck T. Surface Morphology and Its Influence on Cyclic Deformation Behavior of High-Mn TWIP Steel. Metals. 2018; 8(10):832. https://doi.org/10.3390/met8100832
Chicago/Turabian StyleKlein, Matthias W., Marek Smaga, and Tilmann Beck. 2018. "Surface Morphology and Its Influence on Cyclic Deformation Behavior of High-Mn TWIP Steel" Metals 8, no. 10: 832. https://doi.org/10.3390/met8100832
Note that from the first issue of 2016, this journal uses article numbers instead of page numbers. See further details here.