Mesomechanical Modeling and Numerical Simulation of the Diffraction Elastic Constants for Ti6Al4V Polycrystalline Alloy

1
Light Alloy Research Institute, Central South University, Changsha 410083, China
2
Science and Technology on High Strength Structural Materials Laboratory, Central South University, Changsha 410083, China
3
Collaborative Innovation Center of Advance Nonferrous, Central South University, Changsha 410083, China
*
Authors to whom correspondence should be addressed.
Metals 2018, 8(10), 822; https://doi.org/10.3390/met8100822
Submission received: 31 August 2018
/
Revised: 26 September 2018
/
Accepted: 10 October 2018
/
Published: 12 October 2018
Abstract
:A mesoscopic mechanical model based on the Mori-Tanaka method and Eshelby’s inclusion theory was presented to investigate the uniform elastic deformation behavior of Ti6Al4V with β-Ti and α-Ti phases. In particular, elastic mechanics field equations of inclusion and matrix phases were established separately, and several crystal plane diffraction elastic constants were predicted under uniaxial loading in this model. The results demonstrated that diffracted crystal plane elastic constants diversified with the elastic stiffness of the composition phase. In consequence, elastic deformation of one particular phase is related to the constraint of the whole deformation of all the phases constituting the materials. In this work, diffracted crystal plane elastic constants corresponding to different phases exert a substantial role in the determination of stresses by diffraction methods. Several numerical simulation results were compared and discussed.
1. Introduction
One of the tasks of two-phase material mesomechanics is to establish a reasonable mesomechanical model [1,2,3,4] to analyze and calculate the relationship between macro-mechanical properties of materials in order to provide a theoretical basis for material design and optimization of the mechanical properties [5,6]. As one of the most widely used two-phase alloys, Ti6Al4V (by weight, named Ti64 or TC4), accounts for approximately half of the production of titanium alloys [7] and is an ideal material for use in the manufacture of engines and blades [8]. There are many factors which cause the various microstructures of Ti6Al4V, for example, alloy composition [9,10], processing technology, processing conditions [11,12,13], and so on. An alloy such as this structure is prone to fatigue and fracture failure when subjected to cyclic loading, while micro stress affects the crack propagation speed of the microstructure [14,15]. Scholars are interested in developing methods to accurately determine the residual stress. Moussaoui [16] quantitatively interpreted the diffraction method for measuring the uncertainty in titanium alloys by X-ray diffraction, and Lundbäck et al. [17], further studied the optimization scheme for measuring residual stress in Ti6Al4V components of Ship-Launched Missile (SLM). It is important to profoundly understand the distribution of residual stress in two-phase titanium alloys.
When the residual stress in the determination of materials by X-ray strain measurement [18] is evaluated, proportionality constants are required, i.e., “X-ray Elasticity Constants” (XECs) related to a specific diffraction plane of the crystal [19]. Therefore, it is of great practical significance to study such parameters. At present, many scholars have set up different theoretical models for leading to XECs in the case of single-phase materials, such as the Reuss model [20], which assumed a certain stress; Voigt model [21], with certain strain; as well as the Kröner model [22], which considered the interaction between grains. In particular, Lin [23] established a calculation model of monophasic polycrystalline structures and argued that the same argument between XECs and diffracted crystal plane elastic constants (DECs) was slightly far-fetched, which implies that the elastic constants of X-ray diffraction based on different models may be inconsistent, etc. It is worth noting that the substantive differences in the calculation of crystal plane diffraction elastic constants (DECs), including and , of two-phase polycrystalline alloys with different crystalline structures, have not been reported. Although, elastic constants have been used to describe the materials’ elastic properties [24,25,26,27,28]. In this paper, the emphasis is kept on the mesomechanical model governing the effective elastic response to macroscopic load stress and the prediction of micromechanical stress-strain in Ti6Al4V under uniaxial loading. In Section 2, a theoretical model for predicting the mechanical elastic constants and the several diffraction elastic constants with qualitative analysis of Ti6Al4V polycrystalline alloy, following the framework of Mori-Tanaka method [29] and Eshelby’s equivalent inclusion theory [30] as well as previous research work [31]. The results are compared with the measured values, which verifies the reliability and the predictability in Section 3.
2. Two-Phase Model
It is assumed that the two-phase material contains a free distribution of spherical inclusions (C) that are firmly embedded in an isotropic homogeneous matrix phase (M), and that the boundary between C and M is approximately the ideal adhesion without considering interface damage and boundary effects. As shown in Figure 1, the concept of representative volume element [32] (RVE) is introduced to represent that the elastic properties of the effective medium are the same as that of the two-phase material.
2.1. Effective Elastic Properties of the Two-Phase Material
The anisotropic spherical inclusion particles that are embedded in an infinitely large homogeneous matrix form the basis of the self-consistent model by assuming that the stress is uniform, and that the corresponding distribution of the inclusion force or strain is calculated, which is so-called Eshelby’s equivalent inclusion theory [31]. By volume averaging of the stress or strain of all grains, the effective or average elastic properties of materials remain constant, when it comes to the material medium for the internal mean domain of any two-phase material [33]. In this case, the different scales for the two-phase material between a macroscopic stress-strain relationship and microscopic stress-strain response are presented.
In particular, it is supposed that a given two-phase material receives a long-range uniform stress on the boundary. Under the same external force with two second-order tensors, the constitutive equations of the matrix (M) of the two-phase materials are denoted by:
where this expression is in term of tensor, “:” stands for the inner products, and superscript of symbols M and C denote the matrix phase and inclusion, respectively, in the same crystallographic sense with identical properties. and are both typically-performed geometric mean processes [34]. and are elastic compliance and stiffness in the form of tetradic, respectively. It should be remembered that all elastic tensors, such as stress and strain are of second-order, the elastic property parameters, e.g., elastic stiffness and elastic compliance are tetradic (fourth-order tensors). The inner products between tensors can be represented by tensor components:
Following the transformation rules between tensors and matrices, the second-order tensor can be marked by the matrix with three ranks and the fourth-order tensor can be represented by the sixth-order matrix, i.e.,
where can be absolutely expressed by the column vector with six strain components as is the same for .
Because of the existence of the inclusion phase, the average strain in the matrix of the actual two-phase materials is different from , and consequently, a disturbance strain [35] will be introduced for the interaction between the inclusions. Namely, the average stress in the matrix of the two-phase materials is defined as:
Obviously, the perturbation part of the stress in the matrix is recorded as:
However, the mean stress and strain in the inclusion phase including their difference are and differ in the corresponding average values in the matrix under the external force field due to the difference of elastic properties of materials (elastic inhomogeneity). Eshelby dealt with the stress disturbance of inclusion on the basis of the average back stress of the matrix, that is:
appearing in the above formula is elastic stiffness tensor of inclusions, and is equivalent eigenstrain [36]. Following Eshelby’s deduction:
where is a fourth-order tensor related to the elastic properties of the matrix and the geometric morphology of the inclusion.
It is then obtained by combining with (2), (4), and (5):
Clearly, is fourth-order unit tensor.
Hill [37] showed that:
is volume ratio of inclusions, as depicted in Figure 1. Moreover, the following equation can be deduced from (2) and (4):
and that,
It is solved so that:
by substituting (5) and (9) into (4), which indicated that:
where fourth-rank tensor demonstrates the interaction between crystallites and infinite medium.
Furthermore, the internal volume average strain field of composite materials is written in terms of (7):
Finally, effective elastic modulus of two-phase materials produced by the above deduction is:
which is slightly different in other forms from [38] where Equation (3) was a derivation on the basis of the self-consistent method [39]. Paradoxically, the accuracy of the calculation is often pursued in iterative computation without considering the actual situation, such as the disturbance of stress and strain, the difference in elastic properties between inclusion phase C and matrix phase M, and so on [40]. As a result, the effective elastic stiffness of a monophasic crystal in an isolated phase may not be identical to a multi-phase polycrystal.
According to Mori-Tanaka’s principle, as previously mentioned, the effective bulk modulus and shear modulus are expressed by taking into account spherical-particle reinforced composites.
where, so is Poisson’s ratio that relates to and ; and signify the bulk modulus and shear modulus related to the matrix phase. respectively. The concrete expression will be given in the following calculation.
As a result, the effective elastic properties of a given multi-phase material are reflected by the effects of the phases constituting the multi-phase polycrystal on the whole material, which demonstrates that the effective elastic properties (e.g., the effective stress or strain state of a multi-phase material) can be obtained in a way that considers it as a series of inclusions with and embedded in an infinitely elastic isotropic homogeneous matrix. In fact, the elastic response of the whole material to the uniform elastic load is qualitatively described in terms of the effective elastic properties, i.e., mechanical elastic constants independent of diffraction crystal planes as the parameters for the quantitative analysis of the effective elastic properties of materials. Stemming from the Mori-Tanaka scheme, mechanical elastic constants (bulk modulus , shear modulus , elastic modulus , Poisson’s ratio ) of Ti6Al4V is qualitatively investigated for further comprehension of the effective elastic response of the material with regard to different dimensions.
2.2. Macroscopic Stress-Strain of the Two-Phase Material
In this section, the mesoscopic mechanical field equations for crystal plane diffraction elastic constants are presented in matrix-form to avoid the tedious tensor calculation. According to the assumption, it is aimed to explicitly construct the related elastic stress-strain response of two-phase materials in order to investigate mean phase effects on diffracting crystal plane elastic constants. Foremost, it is essential to consider the two-phase materials in different levels in order to quantitively determine the diffracting crystal plane elastic constants.
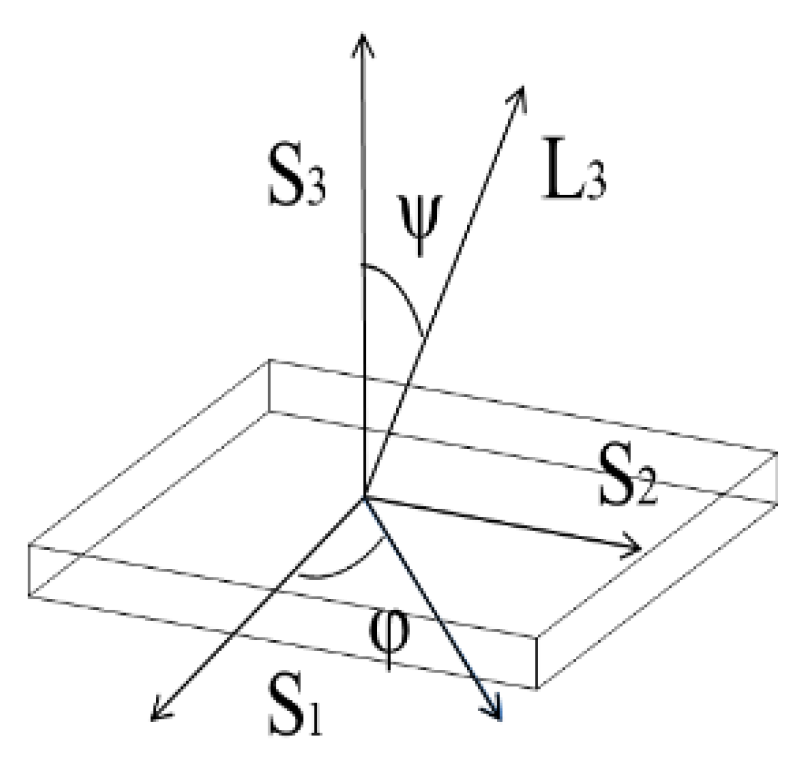
In the first place, the Cartesian coordinate system of materials [S], and the Cartesian coordinate system of crystal [L] are presented in the Figure 2.
Therefore, the coordinate transform matrix of [S] to [L] is []
Subsequently, the relationship between the strain and the stress of the two-phase material without consideration of the influence of the morphology or texture of the crystal, can be written as:
in which, and E refer to Poisson’s ratio and mechanical elastic modulus of the phases of the material, respectively. These terms and are their projection in the direction of measurement.
At length, as for isoelastomer in the inclusion phase C subjected to uniaxial tension (namely, , others equal 0), , the strain in the inclusion phase can be expressed by macroscopic load stress.
2.3. Microscopic Stress-Strain of the Two-Phase Material
Firstly, it is necessary to qualitatively analyze the interaction between the polycrystalline inclusions. Especially, the average strain of inclusions is related to the loaded average strain of two-phase materials according to Hill’s deduction [33]:
where is the strain concentration matrix of inclusion, and is the stress concentration matrix.
For spherical polycrystalline particles with bulk modulus and shear modulus embedded in an isotropic polycrystalline matrix with bulk modulus and shear modulus , the deformation (17) becomes the following by considering the load distribution per phase:
In the above formula,
In particular, it makes sense that the expression of and can be formulated as a concrete matrix form, for example,
where and . means the Kronecker delta with second-order tensor and stands for the fourth-order unit tensor in this equation. According to the transform, can be expressed as follows:
The inconvenience caused by the tensor calculation is greatly reduced.
Considering the isotropic matrix material containing anisotropic spherical inclusions, the material subjected to load stress field may be set as , and according to the equivalent elastic method [41], the corresponding average stress field in the inclusions can be expressed as:
where and are the additional terms of the average stress and strain fields, respectively, due to the difference of the elastic constants of the internal and external matrix materials in the spherical local area. In addition, combination with Formula (4) shows the following relationship exists.
According to the derivation results of Formulas (5) and (10), the relation holds:
where, SE is same as in Equation (5). In the same manner, can be rewritten as:
Substituting Formulas (21) and (22) into Formula (19), the following formula can be deduced:
Proceeding to the next step, the inverse matrix of the above formula of the inclusion materials in the elastic range is conducted,
After combination of the above formula and (18), the deformed expression can be expressed as:
where , which stands for the material elastic compliance interaction factor (because it reflects the relationship between strain and stress, corresponding to the elastic compliance). It is noteworthy that the above formula is in the same form as the elastic compliance of the matrix in which should be replaced by , termed .
Secondly, the is marked as and the Cartesian coordinate system of benchmark is denoted as , and the direction of the cosine of the strain direction relative to the direction of the coordinate may be set as .Then, the relationship between the strain in the direction and the strain in the coordinate system takes the form of:
Due to the disorderly distribution of cubic polycrystals, the distribution probability of each orientation in the three-dimensional space is considered to be almost the same. Averaging in all directions in three-dimensional space, the strain in the inclusion phase C can be determined by solving the average strain , which demonstrates that macroscopic average strain is the same as [23].
In the light of the derivation of Reuss20 based on the stress-dependency,
In the above formula, parameters are related to the Miller index , (i,j = 1, 2, 3, …, 6) are matrix components of the th column of the th column in the matrix related to the crystal symmetry.
In summary, the expression of the crystal plane diffraction elastic constants of the two-phase materials can be obtained from the analysis that mesomechanical model.
where are mechanical elastic constants and Poisson’s ratio of RVE, respectively.
The analysis of the crystal plane diffraction elastic constants of the matrix phase is similar to the above, only corresponding to a different crystal system with different forms of expression; Therefore, details are not described herein again.
Equation (16a), regarding the macroscopic elastic isotropic polycrystals (named quasi-isotropic that are composed of elastic anisotropic crystallites), can be rewritten as,
by replacing conventional elastic constants and with diffraction elastic constants, which is reasonable because of the difference between “diffraction strain” (named “lattice strain” in the following) and mechanical strain in the measuring scale where the strain measurement is determined by the diffraction method for lattice planes with the orientation of vertical alignment. That is to say, mechanical elastic constants, such as and , of material composition, are no longer applicable to the quantitative analysis of mechanical elastic stress from the diffraction lattice strain, based on the elastic parameters, including and , of the corresponding diffraction crystal planes [23]. In the next section, apparent differences in the elastic parameters are given a quantitative description.
3. Calculation Results and Validation
The material used in this calculation is Ti6Al4V, an ordinary hot-rolled annealed titanium alloy sheet, the chemical composition of which is shown in Table 1.
The primary structure consists predominantly of equiaxed or elongated primary α-phase presented in hexagonal polycrystalline and inter-granular β-phase existed in the form of cubic polycrystalline [42]. The single-crystal elastic constant tensor components of the two phases are shown in Table 2.
As described above, the way in which the tensor is denoted, irrespective of the second or fourth in the term of matrix, is the key to simplify calculation. The elastic stiffness matrix of the fourth-order tensor is shown as follows.
There is no doubt that the elastic stiffness of hexagonal crystals has five independent matrix components, while that of cubic crystals has three independent matrix components. Specifically, the , (i,j = 1, 2,…, 6) i.e., the Voigt notation was used in the transformation form between matrix and tensor.
With the help of the Kroner-Reuss model [44], and using the data in Table 2, the mechanical elastic constants of α-Ti and β-Ti are calculated as reflected in Table 3 where with and corresponding to the materials. It should be noted, the expressions of and are identical to and whether they are for α-Ti, β-Ti, or even TC4. Besides, as for bulk and shear modulus, i.e., and of these materials, the difference in the mesomechanics due to the implication that the Kroner-Reuss model is on the basis of monocrystals in single-phase should be distinguished.
As a result of the calculations, the mechanical elastic constants, including , , , of TC4 are obtained with the values, = 118 GPa, = 30.2 GPa, = 110.3 GPa, and = 45.2 GPa, taken from Equations (14a) and (14b), in turn. Expectantly, the mechanical elastic modulus of TC4 varies with the elastic properties of the phases that constitute the two-phase polycrystal, see the Equations (14a) and (14b). The results show that the predictions are in good agreement with the experiment [14,45] (see the measured in Table 3). The calculation results show that not only the mechanical elastic constants of the TC4 are different to those of α-Ti and β-Ti, but also any effect due to the orientation of the crystal on the mechanical elastic constants is rarely observed, see Section 2.1. In other words, the hypothesis stating that the effective elastic properties of the RVE are equivalent to that of whole material appears to be logical.
Nevertheless, although the difference between the diffracted crystal planes elastic constants and mechanical elastic constants in the qualitative analysis has been indicated in Section 2.1, the accurate determination of residual stress by the lattice strain measurement is provides a quantitative analysis of the elastic constants related to diffraction crystal planes, as shown in Table 4.
As per the description of Formula (25), it is the interaction between the crystals in the inclusion or the matrix that creates the uneven distribution of micromechanical loading stress. When it comes to combination of the macroscopic stress-strain response to the RVE and the mesoscopic elastic field in the phase, it is natural that the mechanical elastic constants of TC4 do critically affect the numerical precision of the elastic constants of the diffractive crystal plane to be measured according to the description of Formulas (28) and (29).
Spontaneously, a mesoscopical mechanics field equation governing the diffraction elastic constants of the matrix phase can be derived such as the inclusion phase, in addition to with a difference in the interaction influence coefficient .
Therefore, the interaction between particles in the matrix phase and the surrounding has been simulated quantitatively for TC4, which means that the load distribution in the matrix phase is more complicated than that in the inclusion phase.
Table 4 shows the values of the crystal plane diffraction elastic constant of matrix phase , and the inclusion phase , respectively, compared with those reported in the literature [43]. In Equation (30), the mechanical elastic modulus of α-Ti is clearly different from the diffraction elastic modulus related to the crystal plane orientation. Considering the systematic error of the measuring strain in the experiment, the residual stress can be calculated by the diffraction elastic constants of the crystal plane predicted by the theoretical model, which can provide a reference for the theoretical analysis of the residual stress distribution of materials.
4. Conclusions
(1) The elastic response of the whole material to stress-strain can be described by the representative volume element (RVE) applied load stress or strain field when the stress is assumed to be constant. As a result, the stress and strain field equations of the matrix phase and the spherical particles inclusion phase are deduced.
(2) Ignoring the microstructure of uniformly distributed particles, such as the orientation, distribution, and structure of micro-information, in the case of calculation stress-strain distribution, the two-phase material can be considered as the material reinforced by the inclusion phase to simplify the analysis step, and the distribution of the stress field or strain field can be predicted in view of statistical mesomechanics.
(3) When considering the interaction between particles, the true stress distribution is actually inhomogeneous. Following the situation that the particle distribution is approximately ideal, the theoretical values of several crystal plane diffraction elastic constants of Ti6Al4V polycrystalline alloy are calculated by using this theoretical model, assuming the volume average of stress-strain is obtained. For the α-phase, the theoretical values are slightly higher than the experimental values. The largest deviation is about 14.6% for {1011}. In contrast, the error between the theoretically calculated value and the experimental value of {1012} is smaller than that of the other α-phase. However, the theoretical prediction of with 3.2% deviation is closest to the experimental measurement. In general, smaller experimental errors demonstrate the accuracy and reliability of the theoretical model predictions.
Author Contributions
Q.C. extend this model on the basis of work of L.L. C.Z. analyzed the theoretical calculation results. The grammar and English expressions in this article are examined by the last co-author K.C.
Funding
This research was funded by National Natural Science Foundation of China grant number [51327902], National Basic Research Program of China grant number [2012CB619502] and Major National Science and Technology Projects grant number [2014ZX04012011].
Conflicts of Interest
The authors indicated no conflict of interest.
References
- Geraci, G.; Aliabadi, M.H. Micromechanical modelling of cohesive thermoelastic cracking in orthotropic polycrystalline materials. Comput. Method. Appl. Mech. Eng. 2018, 339, 567–590. [Google Scholar] [CrossRef]
- Luo, G.Q.; Shi, L.P.; Zhong, Y.S.; Yang, L.; Ma, X.L.; Li, M.W.; He, X.D. Compressive damage of three-dimensional random fibrous ceramic materials: a meso-mechanics modeling and experimental study. Ceram. Int. 2018, 44, 15690–15699. [Google Scholar] [CrossRef]
- Benedetti, I.; Aliabadi, M.H. Multiscale modeling of polycrystalline materials: A boundary element approach to material degradation and fracture. Comput. Method. Appl. Mech. Eng. 2015, 289, 429–453. [Google Scholar] [CrossRef] [Green Version]
- Zou, F.; Rao, J.; Aliabadi, M.H. Highly accurate online characterisation of cracks in plate-like structures. NDT E Int. 2018, 94, 1–12. [Google Scholar] [CrossRef]
- Chen, D.; Torquato, S. Designing disordered hyperuniform two-phase material with novel physical properties. Acta Mater. 2018, 142, 152–161. [Google Scholar] [CrossRef]
- Xu, W.; Jia, M.; Zhu, Z.; Liu, M.; Lei, D.; Gou, X. n-Phase micromechanical framework for the conductivity and elastic modulus of particulate composites: Design to microencapsulated phase change materials (MPCMs)-cementitious composites. Mater. Des. 2018, 145, 108–115. [Google Scholar] [CrossRef]
- Donachie, M.J. Titanium: A Technical Guide, 2nd ed.; ASM International Materials Park: Novelty, OH, USA, 2000; p. 9. ISBN 0-87170-686-5. [Google Scholar]
- Wang, Z.B.; Sun, J.F.; Chen, W.Y.; Liu, L.B.; Wang, R.Q. Machining distortion of Titanium alloys aero engine case based on the energy principles. Metals 2018, 8, 464. [Google Scholar] [CrossRef]
- Zhou, X.W.; Chen, Y.H.; Huang, Y.D.; Mao, Y.Q.; Yu, Y.Y. Effects of niobium addition on the microstructure and mechanical properties of laser-welded joints of NiTiNb and Ti6Al4V alloys. J. Alloys Compd. 2018, 735, 2616–2624. [Google Scholar] [CrossRef]
- Langen, D.; Maier, H.J.; Hassel, T. The effect of SiC addition on microstructure and mechanical properties of gas tungsten arc-welded Ti-6Al-4V alloy. J. Mater. Eng. Perform. 2018, 27, 253–260. [Google Scholar] [CrossRef]
- Zhang, Q.; Liang, Z.L.; Cao, M.; Liu, Z.F.; Zhang, A.F.; Lu, B.H. Microstructure and mechanical properties of Ti6Al4V alloy prepared by selective laser melting combined with precision forging. T. Nonferr. Metal. Soc. 2017, 27, 1036–1042. [Google Scholar] [CrossRef]
- Hemery, S.; Nait-Ali, A.; Gueguen, M.; Villechaise, P. Mechanical study of crystalline orientation distribution in Ti-6Al-4V: An assessment of micro-texture induced load partitioning. Mater. Des. 2018, 137, 22–32. [Google Scholar] [CrossRef]
- Bhattiprolu, V.S.; Johnson, K.W.; Ozdemir, O.C.; Crawford, G.A. Influence of feedstock powder and cold spray processing parameters on microstructure and mechanical properties of Ti-6Al-4V cold spray depositions. Surf. Coat. Technol. 2018, 335, 1–12. [Google Scholar] [CrossRef]
- Collings, E.W. Materials Properties Handbook: Titanium Alloys; ASM International Materials Park: Novelty, OH, USA, 1993; pp. 50, 95. ISBN 978-0-87170-481-8. [Google Scholar]
- Nie, B.H.; Zhao, Z.H.; Chen, D.C.; Liu, S.; Liu, M.S.; Zhang, J.L.; Liang, F.M. Effect of basketweave microstructure on very high cycle fatigue behavior of TC21 Titanium alloy. Metals 2018, 8, 401. [Google Scholar] [CrossRef]
- Moussaoui, K.; Segonds, S.; Rubio, W.; Mousseigne, M. Studying the measurement by X-ray diffraction of residual stresses in Ti6Al4V titanium alloy. Mater. Sci. Eng. A 2016, 667, 340–348. [Google Scholar] [CrossRef]
- Lundbäck, A.; Pederson, R.; Colliander, M.H.; Brice, C.; Steuwer, A.; Heralic, A.; Buslaps, T.; Lindgren, L.E. Modeling and experimental measurement with synchrotron radiation of residual stresses in laser metal deposited Ti-6Al-4V. In Proceedings of the 13th World Conference on Titanium, Hoboken, NJ, USA, 16–20 August 2015; pp. 1279–1282. [Google Scholar]
- He, B.B. Two-Dimensional X-ray Diffraction; John Wiley & Sons Inc.: Hoboken, NJ, USA, 2009; p. 249. ISBN 978-0-470-22722-0. [Google Scholar]
- Wern, H.; Johannes, R.; Walz, H. Dependence of the X-ray elastic constants on the diffraction plane. Phys. Status Solidi R. 2015, 206, 545–557. [Google Scholar] [CrossRef]
- Reuss, A. Calculation of the flow limits of mixed crystals on the basis of the plasticity of monocrystals. Z. Angew. Math. Mech. 1929, 9, 49–58. [Google Scholar] [CrossRef]
- Voigt, W. Ueber die Beziehung zwischen den beiden Elasticitätsconstanten isotroper Körper. Ann. Phys. Berl. 1889, 274, 573–587. [Google Scholar] [CrossRef]
- Kröner, E. Berechnung der elastischen Konstanten des Vielkristalls aus den Konstanten des Einkristalls. Zeitschrift Für Physik 1958, 151, 504–518. [Google Scholar] [CrossRef]
- Liu, M.; Ling, Z. The elastic constants of polycrystalline materials with cubic system structural single crystals, (in Chinese). Acta Phys. Sin. 2009, 58, 4096–4102. [Google Scholar]
- Wit, R.D. Diffraction elastic constants of a cubic polycrystal. J. Appl. Crystallogr. 1997, 30, 510–511. [Google Scholar] [CrossRef] [Green Version]
- Welzel, U.; Mittemeijer, E.J. Diffraction stress analysis of macro scopically elastically anisotropic specimens: On the concepts of diffraction elastic constants and stress factors. J. Appl. Phys. 2003, 93, 9001–9011. [Google Scholar] [CrossRef]
- Lundberg, M.; Saarimäki, J.; Moverare, J.J.; Peng, R.L. Effective X-ray elastic constant of cast iron. J. Mater. Sci. 2018, 53, 2766–2773. [Google Scholar] [CrossRef]
- Blaschke, D.N. Averaging of elastic constants for polycrystals. J. Mater. Sci. 2017, 122, 145110. [Google Scholar] [CrossRef] [Green Version]
- Zhang, Y.Q.; Manke, D.R.; Sharifzadeh, S.; Alejandro, L.B.; Ashwin, R.; Kristie, J.K. The elastic constants of rubrene determined by Brillouin scattering and density functional theory. Appl. Phys. Lett. 2017, 110, 071903. [Google Scholar] [CrossRef] [Green Version]
- Mori, T.; Tanaka, K. Average stress in matrix and average elastic energy of materials with misfitting inclusions. Acta Metall. 1973, 21, 571–574. [Google Scholar] [CrossRef]
- Eshelby, J.D. The determination of the elastic field of an ellipsoidal inclusion, and related problems. Proc. R. Soc. Lond. A 1957, 241, 376–396. [Google Scholar] [CrossRef]
- Du, S.Y.; Wang, B. Composites Meso-Mechanics; Science Press: Beijing, China, 1998; p. 5. ISBN 7-03-006182-9. (In Chinese) [Google Scholar]
- Kanit, T.; Forest, S.; Galliet, I.; Mounoury, V.; Jeulin, D. Determination of the size of the representative volume element for random composites: statistical and numerical approach. Int. J. Solids. Struct. 2003, 40, 3647–3679. [Google Scholar] [CrossRef]
- Ju, J.W.; Chen, T.M. Micromechanics and effective moduli of elastic composites containing randomly dispersed ellipsoidal inhomogeneities. Acta Mech. 1994, 103, 103–121. [Google Scholar] [CrossRef]
- Ju, J.W.; Chen, T.M. Effective elastic moduli of two-phase composites containing randomly dispersed spherical inhomogeneities. Acta Mech. 1994, 103, 123–144. [Google Scholar] [CrossRef]
- Sen, A.K.; Torquato, S. Effective conductivity of anisotropic two-phase composite media. Phys. Rev. B 1989, 39, 4504–4515. [Google Scholar] [CrossRef]
- Mura, T. Micromechanics of Defects in Solids, 2nd ed.; Springer Science & Business Media: Dordrecht, The Netherlands, 1987; p. 15. ISBN 90-247-3343-X. [Google Scholar]
- Hill, R. Eigenmodal deformations in elastic/plastic continua. J. Mech. Phys. Solids 1967, 15, 371–386. [Google Scholar] [CrossRef]
- Fréour, S.; Gloaguen, D.; François, M.; Guillen, R. Modelling and simulation of multi phase effects on X-ray elasticity constants. Phys. Status Solidi B 2003, 239, 297–309. [Google Scholar] [CrossRef]
- Hill, R. Continuum micro-mechanics of elastoplastic polycrystal. J. Mech. Phys. Solids 1965, 13, 89–101. [Google Scholar] [CrossRef]
- Budiansky, B. On the elastic moduli of some heterogeneous materials. J. Mech. Phys. Solids 1965, 13, 223–227. [Google Scholar] [CrossRef]
- Eshelby, J.D. Elastic inclusion and inhomogeneities. Prog. Solid. Mech. 1961, 2, 89–140. [Google Scholar]
- Petry, W.; Heiming, A.; Trampenau, J.; Alba, M.; Herzig, C. Phonon dispersion of the bcc phase of group-IV metals. I. bcc titanium. Phys. Rev. B 1991, 43, 10933–10947. [Google Scholar] [CrossRef]
- Stapleton, A.M.; Raghunathan, S.L.; Bantounas, I.; Stone, H.J.; Lindley, T.C.; Dye, D. Evolution of lattice strain in Ti-6Al-4V during tensile loading at room temperature. Acta Mater. 2008, 56, 6186–6196. [Google Scholar] [CrossRef]
- Ling, Z.; Liu, M. The New Exploration of Elastic Constants; Science Press: Beijing, China, 2011; p. 104. ISBN 978-7-03-031227-3. (In Chinese) [Google Scholar]
- Lee, Y.T.; Welsch, G. Young’s modulus and damping of Ti-6Al-4V alloy as a function of heat treatment and oxygen concentration. Mat. Sci. Eng. A 1990, 128, 77–89. [Google Scholar] [CrossRef]
Figure 1.
Schematic of self-consistent model of representative volume element (RVE).
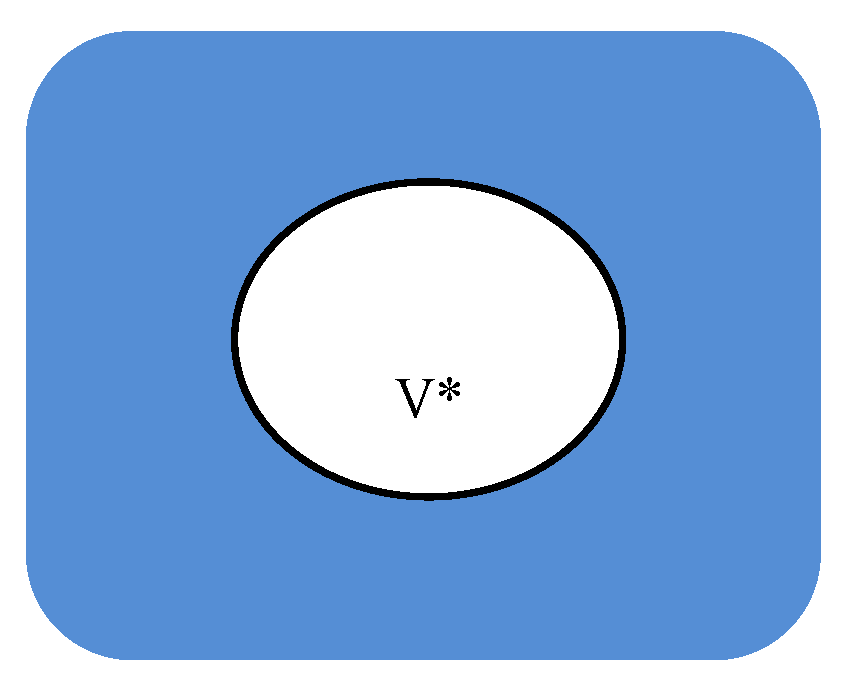
Figure 2.
Schematic of the macroscopic stress analysis.

Table 1.
Chemical composition of Ti6Al4V (wt.%).
| Al | V | Fe | C | O | N | H | Ti |
|---|---|---|---|---|---|---|---|
| 6.1 | 4.0 | 0.06 | 0.02 | 0.06 | <0.01 | 0.002 | Balance |
Table 2.
Stiffness coefficient /GPa of α-Ti phase and β-Ti phase.
| Phase | C11 | C12 | C13 | C33 | C44 |
|---|---|---|---|---|---|
| α-Ti | 168 | 95 | 69 | 191 | 48 |
| β-Ti | 134 | 110 | 110 | 110 | 55 |
Table 3.
The mechanical elastic constants of materials used in calculation.
| Materials | Bulk Modulus K/GPa | Shear Modulus G/GPa | Elastic Modulus E/GPa | Poisson’s Ratio ν |
|---|---|---|---|---|
| α-Ti | 110.3 | 45.2 | 119.3 | 0.3197 |
| β-Ti | 118 | 30.2 | 83.5 | 0.3821 |
| Ti6Al4V | 114.1 a | 37a | 100.2a | 0.3537 a |
| 96.3 b | 42b | 110b | 0.330 b |
a stands for the prediction by this model; b represents the experimental values [43].
Table 4.
The calculated results and experimental values of the crystal plane diffraction elastic constants for Ti6Al4V (TC4).
Table 4.
The calculated results and experimental values of the crystal plane diffraction elastic constants for Ti6Al4V (TC4).
| Peak | {1010} | {1011} | {1012} | {1120} | {1013} | {2021} | |
|---|---|---|---|---|---|---|---|
| /GPa | 96 | 93 | 106 | 96 | 106 | 100 | 78 |
| /GPa | 105.5 | 106.5 | 110.8 | 105.5 | 115.3 | 105.6 | 80.8 |
—experimental values of the crystal plane crystal plane diffraction elastic constants. —calculated crystal plane diffraction elastic constants.
© 2018 by the authors. Licensee MDPI, Basel, Switzerland. This article is an open access article distributed under the terms and conditions of the Creative Commons Attribution (CC BY) license (http://creativecommons.org/licenses/by/4.0/).
Share and Cite
MDPI and ACS Style
Chen, Q.; Liu, L.; Zhu, C.; Chen, K. Mesomechanical Modeling and Numerical Simulation of the Diffraction Elastic Constants for Ti6Al4V Polycrystalline Alloy. Metals 2018, 8, 822. https://doi.org/10.3390/met8100822
AMA Style
Chen Q, Liu L, Zhu C, Chen K. Mesomechanical Modeling and Numerical Simulation of the Diffraction Elastic Constants for Ti6Al4V Polycrystalline Alloy. Metals. 2018; 8(10):822. https://doi.org/10.3390/met8100822
Chicago/Turabian StyleChen, Qiang, Li Liu, Changjun Zhu, and Kanghua Chen. 2018. "Mesomechanical Modeling and Numerical Simulation of the Diffraction Elastic Constants for Ti6Al4V Polycrystalline Alloy" Metals 8, no. 10: 822. https://doi.org/10.3390/met8100822
Note that from the first issue of 2016, this journal uses article numbers instead of page numbers. See further details here.