Article

Experimental Investigation of the Effect of Temperature and Strain Rate on the Superplastic Deformation Behavior of Ti-Based Alloys in the (α+β) Temperature Field

by
Ahmed O. Mosleh
1,2,*,
Anastasia V. Mikhaylovskaya
1,
Anton D. Kotov
1,
Waheed S. AbuShanab
3,
Essam B. Moustafa
4 and
Vladimir K. Portnoy
1
1
Department of Physical Metallurgy of Non-Ferrous Metals, National University of Science and Technology “MISiS”, Leninsky Prospekt 4, 119049 Moscow, Russia
2
Mechanical Engineering Department, Shoubra Faculty of Engineering, Benha University, 108 Shoubra St., 11629 Cairo, Egypt
3
Marine Engineering Department, Faculty of Maritime Studies and Marine Engineering, King Abdulaziz University, Jeddah 21589, Saudi Arabia
4
Mechanical Engineering Department, Faculty of Engineering, King Abdulaziz University, Jeddah 21589, Saudi Arabia
*
Author to whom correspondence should be addressed.
Metals 2018, 8(10), 819; https://doi.org/10.3390/met8100819
Submission received: 13 September 2018 / Revised: 2 October 2018 / Accepted: 9 October 2018 / Published: 11 October 2018

Abstract

:
This paper presents the effect of temperature and strain rate on the superplastic deformation behavior of Ti-3%Mo-1%V-4%Al, Ti-4%V-6%Al, and Ti-1.8%Mn-2.5%Al alloys, which have different initial microstructures. The microstructure, before and after superplastic deformation in the deformation regimes that provided the maximum elongation, was analyzed. The deformation regimes, corresponding to the minimum strain hardening/softening effect, provided a higher elongation to failure due to their low tendency toward dynamic grain growth. As the values of stress became steady (σs), the elongation to failure and strain-hardening coefficient were analyzed under various temperature–strain rate deformation regimes. The analysis of variance of these values was performed to determine the most influential control parameter. The results showed that the strain rate was a more significant parameter than the temperature, with respect to the σs, for the investigated alloys. The most influential parameter, with both the elongation to failure and strain-hardening coefficient, was the temperature of the Ti-3%Mo-1%V-4%Al and Ti-1.8%Mn-2.5%Al alloys and the strain rate of the Ti-4%V-6%Al alloy.

Graphical Abstract

1. Introduction

Titanium alloys are widely utilized in aerospace applications due to their exceptional mechanical and physical properties [1,2,3,4]. Generally, titanium alloys exhibit a high level of strength and excellent oxidation and corrosion resistance at high operating temperatures [5,6,7,8,9]. The high flow stress and high sensitivity to deformation process parameters (temperature (Td), and strain rate ( ε ˙ )) at elevated temperatures make titanium difficult to deform, compared with other metallic materials. Many studies have investigated the deformation behavior of Ti-based alloys to carry out the processing parameters of hot and superplastic forming [10,11,12,13,14], studying superplastic deformation mechanisms [15,16] and constructing constitutive models of superplastic deformation behavior [17,18,19,20].
Superplastic forming (SPF) of titanium alloys is a perspective technology that is widely utilized for complex shape aerospace components [21,22,23,24]. The ability to produce more detailed shape parts is among the significant advantages of the SPF method, which is appropriate for Ti alloys because of their poor formability [25,26,27,28]. Strain rate ( ε ˙ ) and deformation temperature are considered to be the main processing parameters that affect the flow behavior at elevated temperatures, i.e., (Td). Many combinations of these parameters make the problem even more complicated. Additionally, the superplastic flow is very sensitive to the microstructure parameters, such as grain size and phase fraction [29,30,31].
Extensive research has been carried out on the superplastic deformation of titanium alloys, although there are insufficient available data related to the investigation of the deformation temperature (Td) and strain rate ( ε ˙ ) effects on the flow behavior of titanium alloys at elevated temperatures using the analysis of variance technique, for example, the Taguchi method [32,33,34,35,36,37]. Babu et al. [38] studied the effect of Td and ε ˙ and on the hot deformation behavior of Ti-4%V-6%Al using the Taguchi Method. He found that ε ˙ was a more influential factor than Td. Many more studies would be required to demonstrate which deformation parameter strongly affects the superplastic deformation of different titanium alloys. This would aid in the understanding of which parameter should be more strongly controlled during the superplastic forming process of various alloys.
Stress vs. temperature and strain rate behavior is considered an excellent design of the hot deformation process of metallic materials. The determination of the relationship between the flow stress behavior at elevated temperatures and deformation parameters is important. In addition, it is required for the enhancement of hot forming conditions, with the purpose of obtaining the desired microstructure and resultant mechanical properties. Therefore, the main purpose of this study is to investigate the effect of the deformation temperature and strain rate on the superplastic deformation behavior of different Ti-based alloys: Ti-3%Mo-1%V-4%Al, Ti-4%V-6%Al, and Ti-1.8%Mn-2.5%Al. In addition, this study aims to determine which processing parameter significantly affects the deformation process. The investigated alloys were selected due to their differences in microstructure parameters and superplastic deformation behavior. There are insufficient published data about the forming regimes of Ti-3%Mo-1%V-4%Al and Ti-1.8%Mn-2.5%Al alloys, and they are therefore narrowly involved in the industry, compared with the Ti-4%V-6%Al alloy. Thus, this study provides more useful information about the forming regimes of these alloys.
The factorial design of the experiment (DOE) and the analysis of variance (ANOVA) techniques were carried out to determine the optimum combination of processing parameters (strain rate ( ε ˙ ) and deformation temperature (Td)) to achieve the appropriate forming mode for the studied titanium alloys.

2. Materials and Test Experiments

Sheets of Ti-3%Mo-1%V-4%Al, Ti-4%V-6%Al and Ti-1.8%Mn-2.5%Al alloys were investigated. The microstructure of pre-processed sheets, after 30 min annealing and deformation, was studied. The annealing and deformation tests were performed in an argon atmosphere to eliminate oxidation. The tests, which involved decreasing the strain rate step-by-step, were performed to determine the strain rate range of the superplasticity of all studied alloys, with a temperature range of α+β field. The testing temperature range was chosen in accordance with previous studies [39,40]. The uniaxial constant strain rate tensile tests and step-by-step increasing in the strain rate tests were conducted using a Walter-Bay LFM100 test machine (Walter + Bai AG, Löhningen, Switzerland). The range of the chosen testing parameters and the dimensions of the “dog-bone” type samples, which were cut parallel to the rolling direction, are shown in Figure 1 and Table 1.
The results of the tensile tests were used for the design of the experiment (DOE) using an analysis of variance to determine the most influential control parameter on the superplastic deformation behavior of the investigated alloys.
The samples for the microstructure study were prepared using the standard mechanical grinding and polishing procedure and subsequent etching in Kroll’s solution. The microstructure was analyzed using a scanning electron microscope (SEM) Tescan-VEGA LMH TESCAN Brno, s.r.o., (Kohoutovice, Czech Republic). The linear intercept method was used to measure the mean grain size of the α and β phases.

3. Results and Discussion

3.1. Microstructure of As-Proceeded Sheets

The Ti-3%Mo-1%V-4%Al and Ti-4%V-6%Al alloys belong to the (α+β) group of Ti-based alloys, and Ti-1.8%Mn-2.5%Al alloy is a near-α alloy. Thus, a two-phase initial structure of α (dark) and β (bright) is observed in all studied alloys (Figure 2). The β-phase volume fraction is 32% for the Ti-3%Mo-1%V-4%Al alloy (Figure 2a); for the Ti-4%V-6%Al alloy, the β-phase percentage is 20% (Figure 2b); and, for the Ti-1.8%Mn-2.5%Al alloy, the β-phase percentage is 9% (Figure 2c).

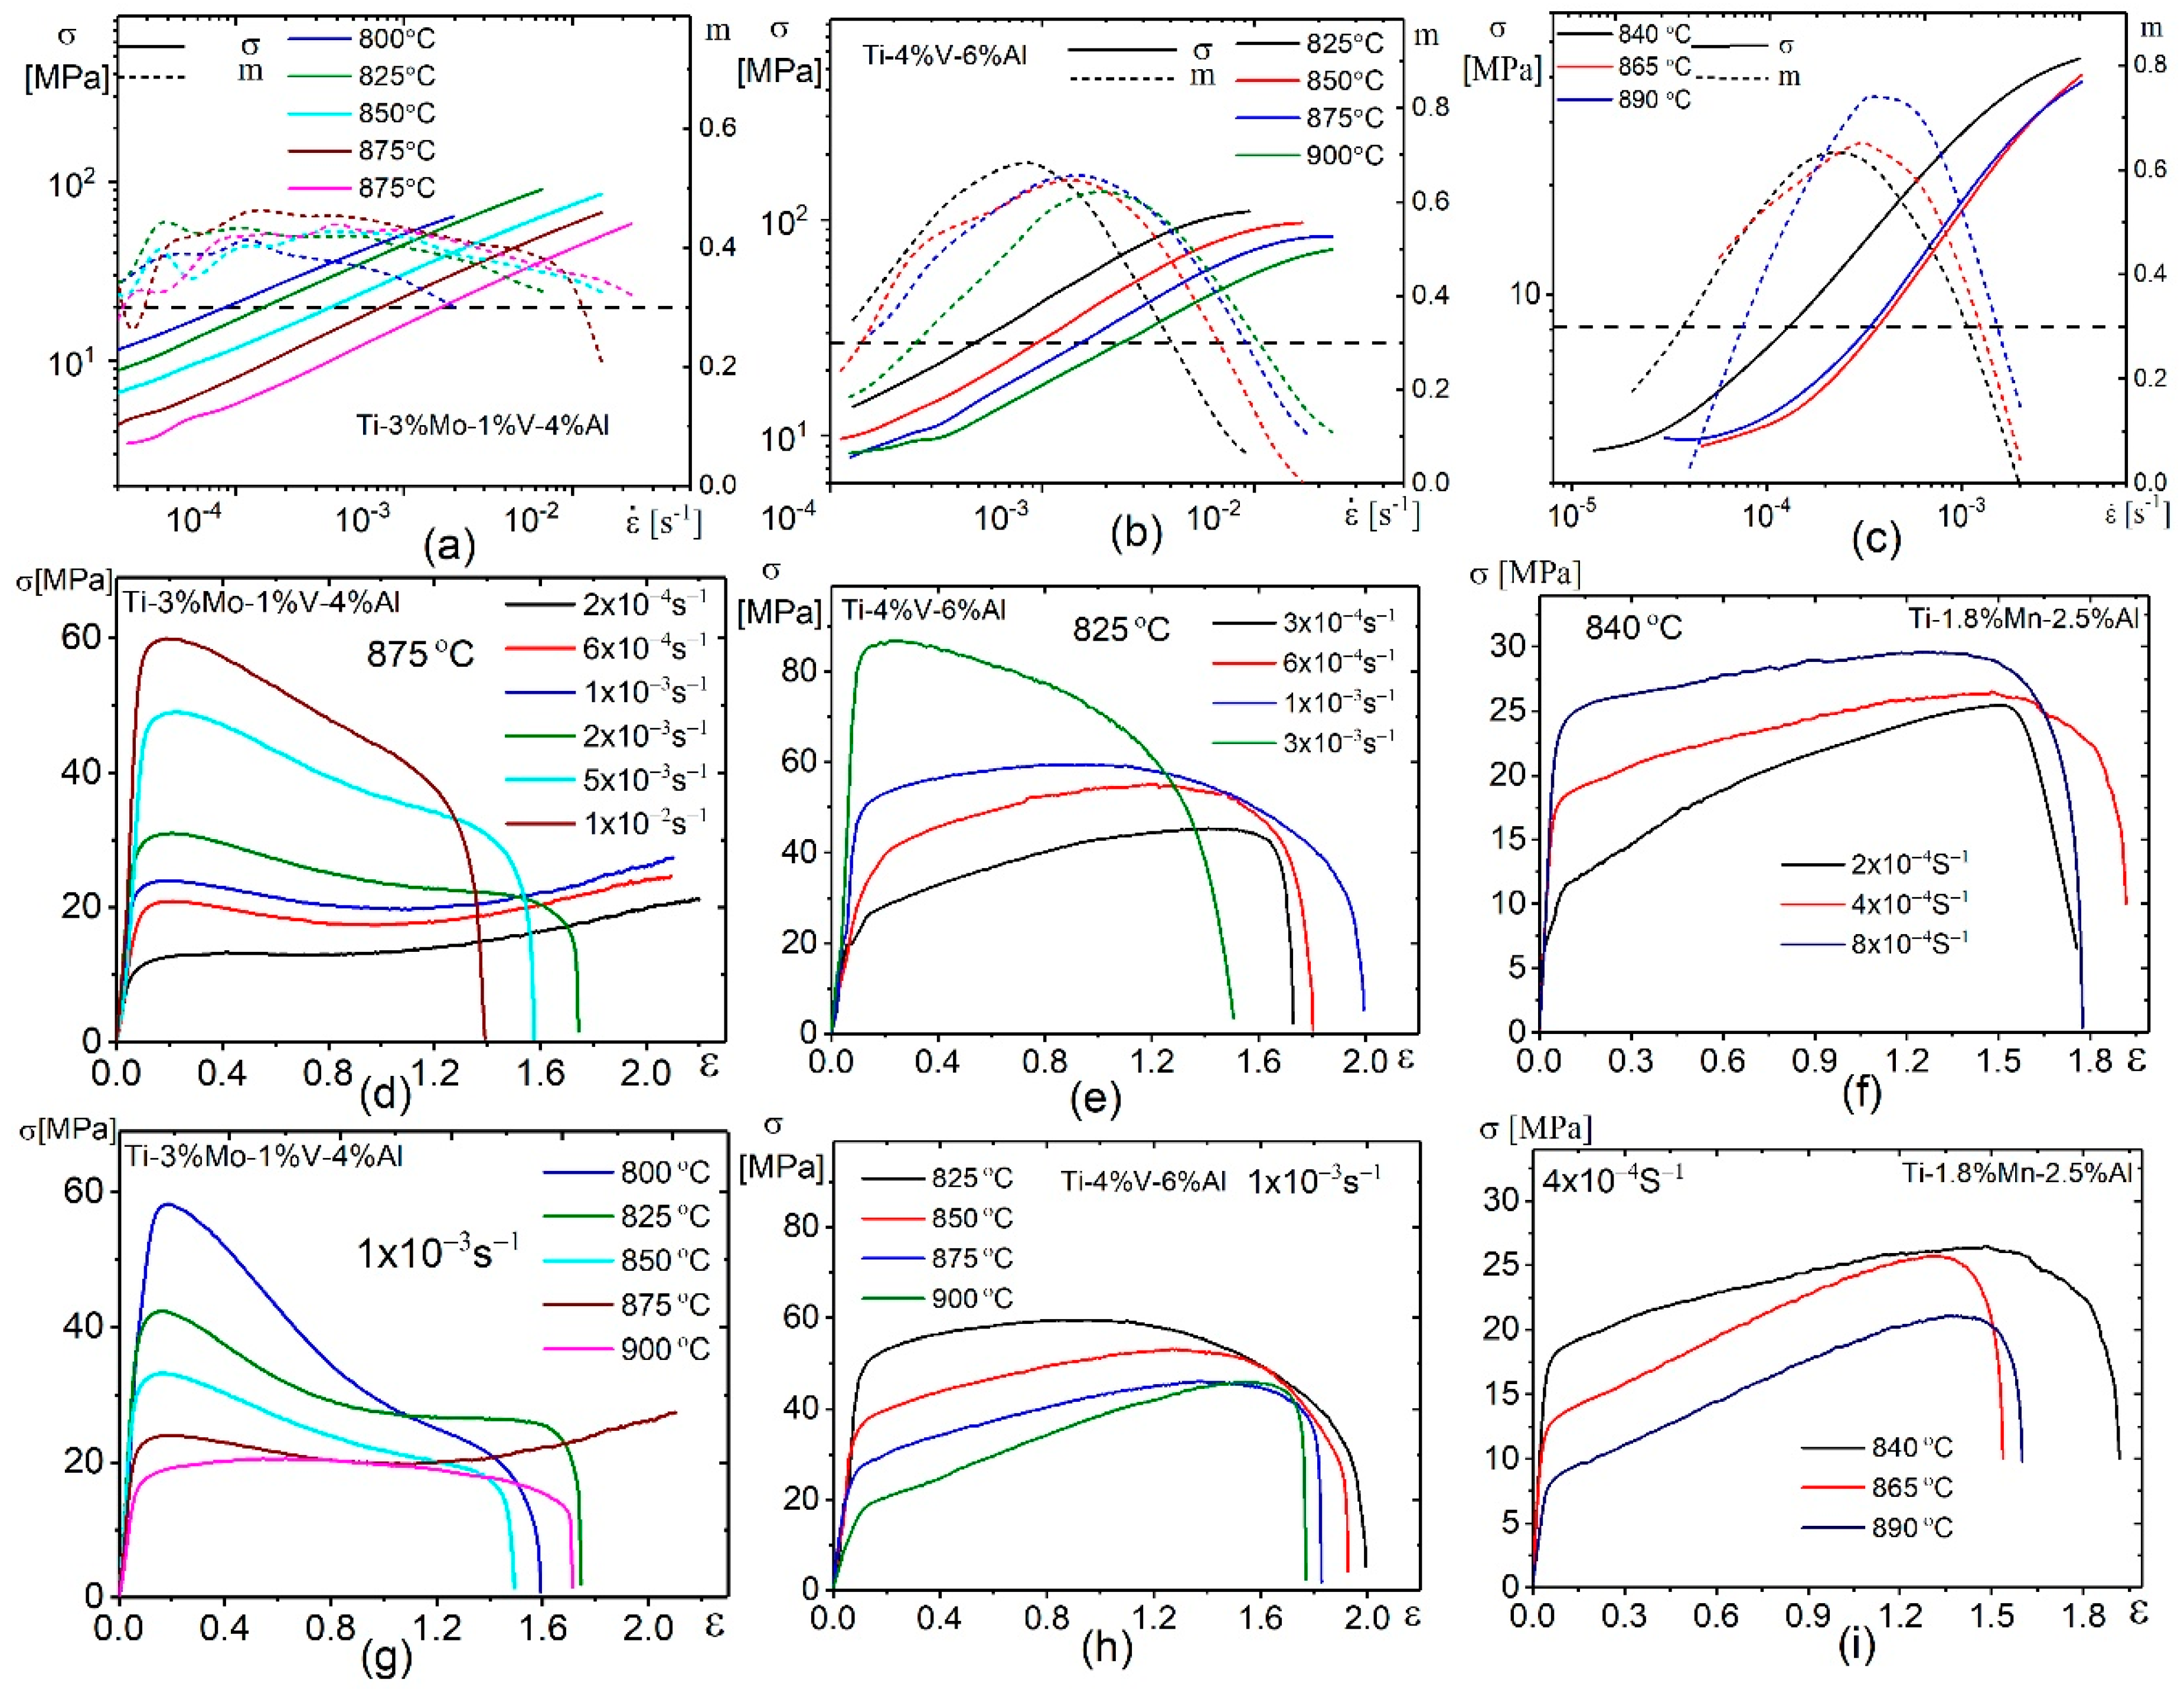
3.2. Tensile Test Results

The result of the tensile tests at various temperatures and strain rates for the investigated alloys is shown in Figure 3. Typical for superplastic behavior, a sigmoidal shape of the stress–strain rate curves was observed in the studied temperature range (Figure 3a–c). Values of the constant strain rate tests (Figure 3d–i) were chosen in the II range of the stress–strain rate curves. These strain rates belonged to the strain rate sensitivity index-m, above 0.3 (dash lines in Figure 3a–c), and corresponded to the superplastic behavior of the alloys (Figure 3a–c).
The experimental stress–strain curves at various strain rates and at various temperatures, within a strain rate–temperature range of superplastic deformation for each alloy are shown in Figure 3d-i. The steady stage begins at a strain of around 0.1 in all testing conditions. The studied alloys exhibit different stress–strain behavior. The Ti-3%Mo-1%V-4%Al alloy demonstrates stress softening, up to 1.1 of strain and strain hardening, at a strain of more than 1.1, for the low strain rates (Figure 3d,g). By contrast, the deformation of Ti-4%V-6%Al and Ti-1.8%Mn-2.5%Al alloys is mainly accompanied by strain hardening (Figure 3e,f,h,i). The stress value is mainly affected by a strain-induced microstructure evolution, because we used the constant strain rate tests. Thus, strain softening can be a result of dynamic recrystallization, and strain hardening can be explained by dynamic grain growth. The similar flow behavior and the dynamic grain growth were observed in the Ti-4%V-6%Al [37,38] and Ti-1.8%Mn-2.5%Al alloys [39]. Strain hardening, in the large strains of Ti-Al-Mo-V, could also be the result of dynamic grain growth.
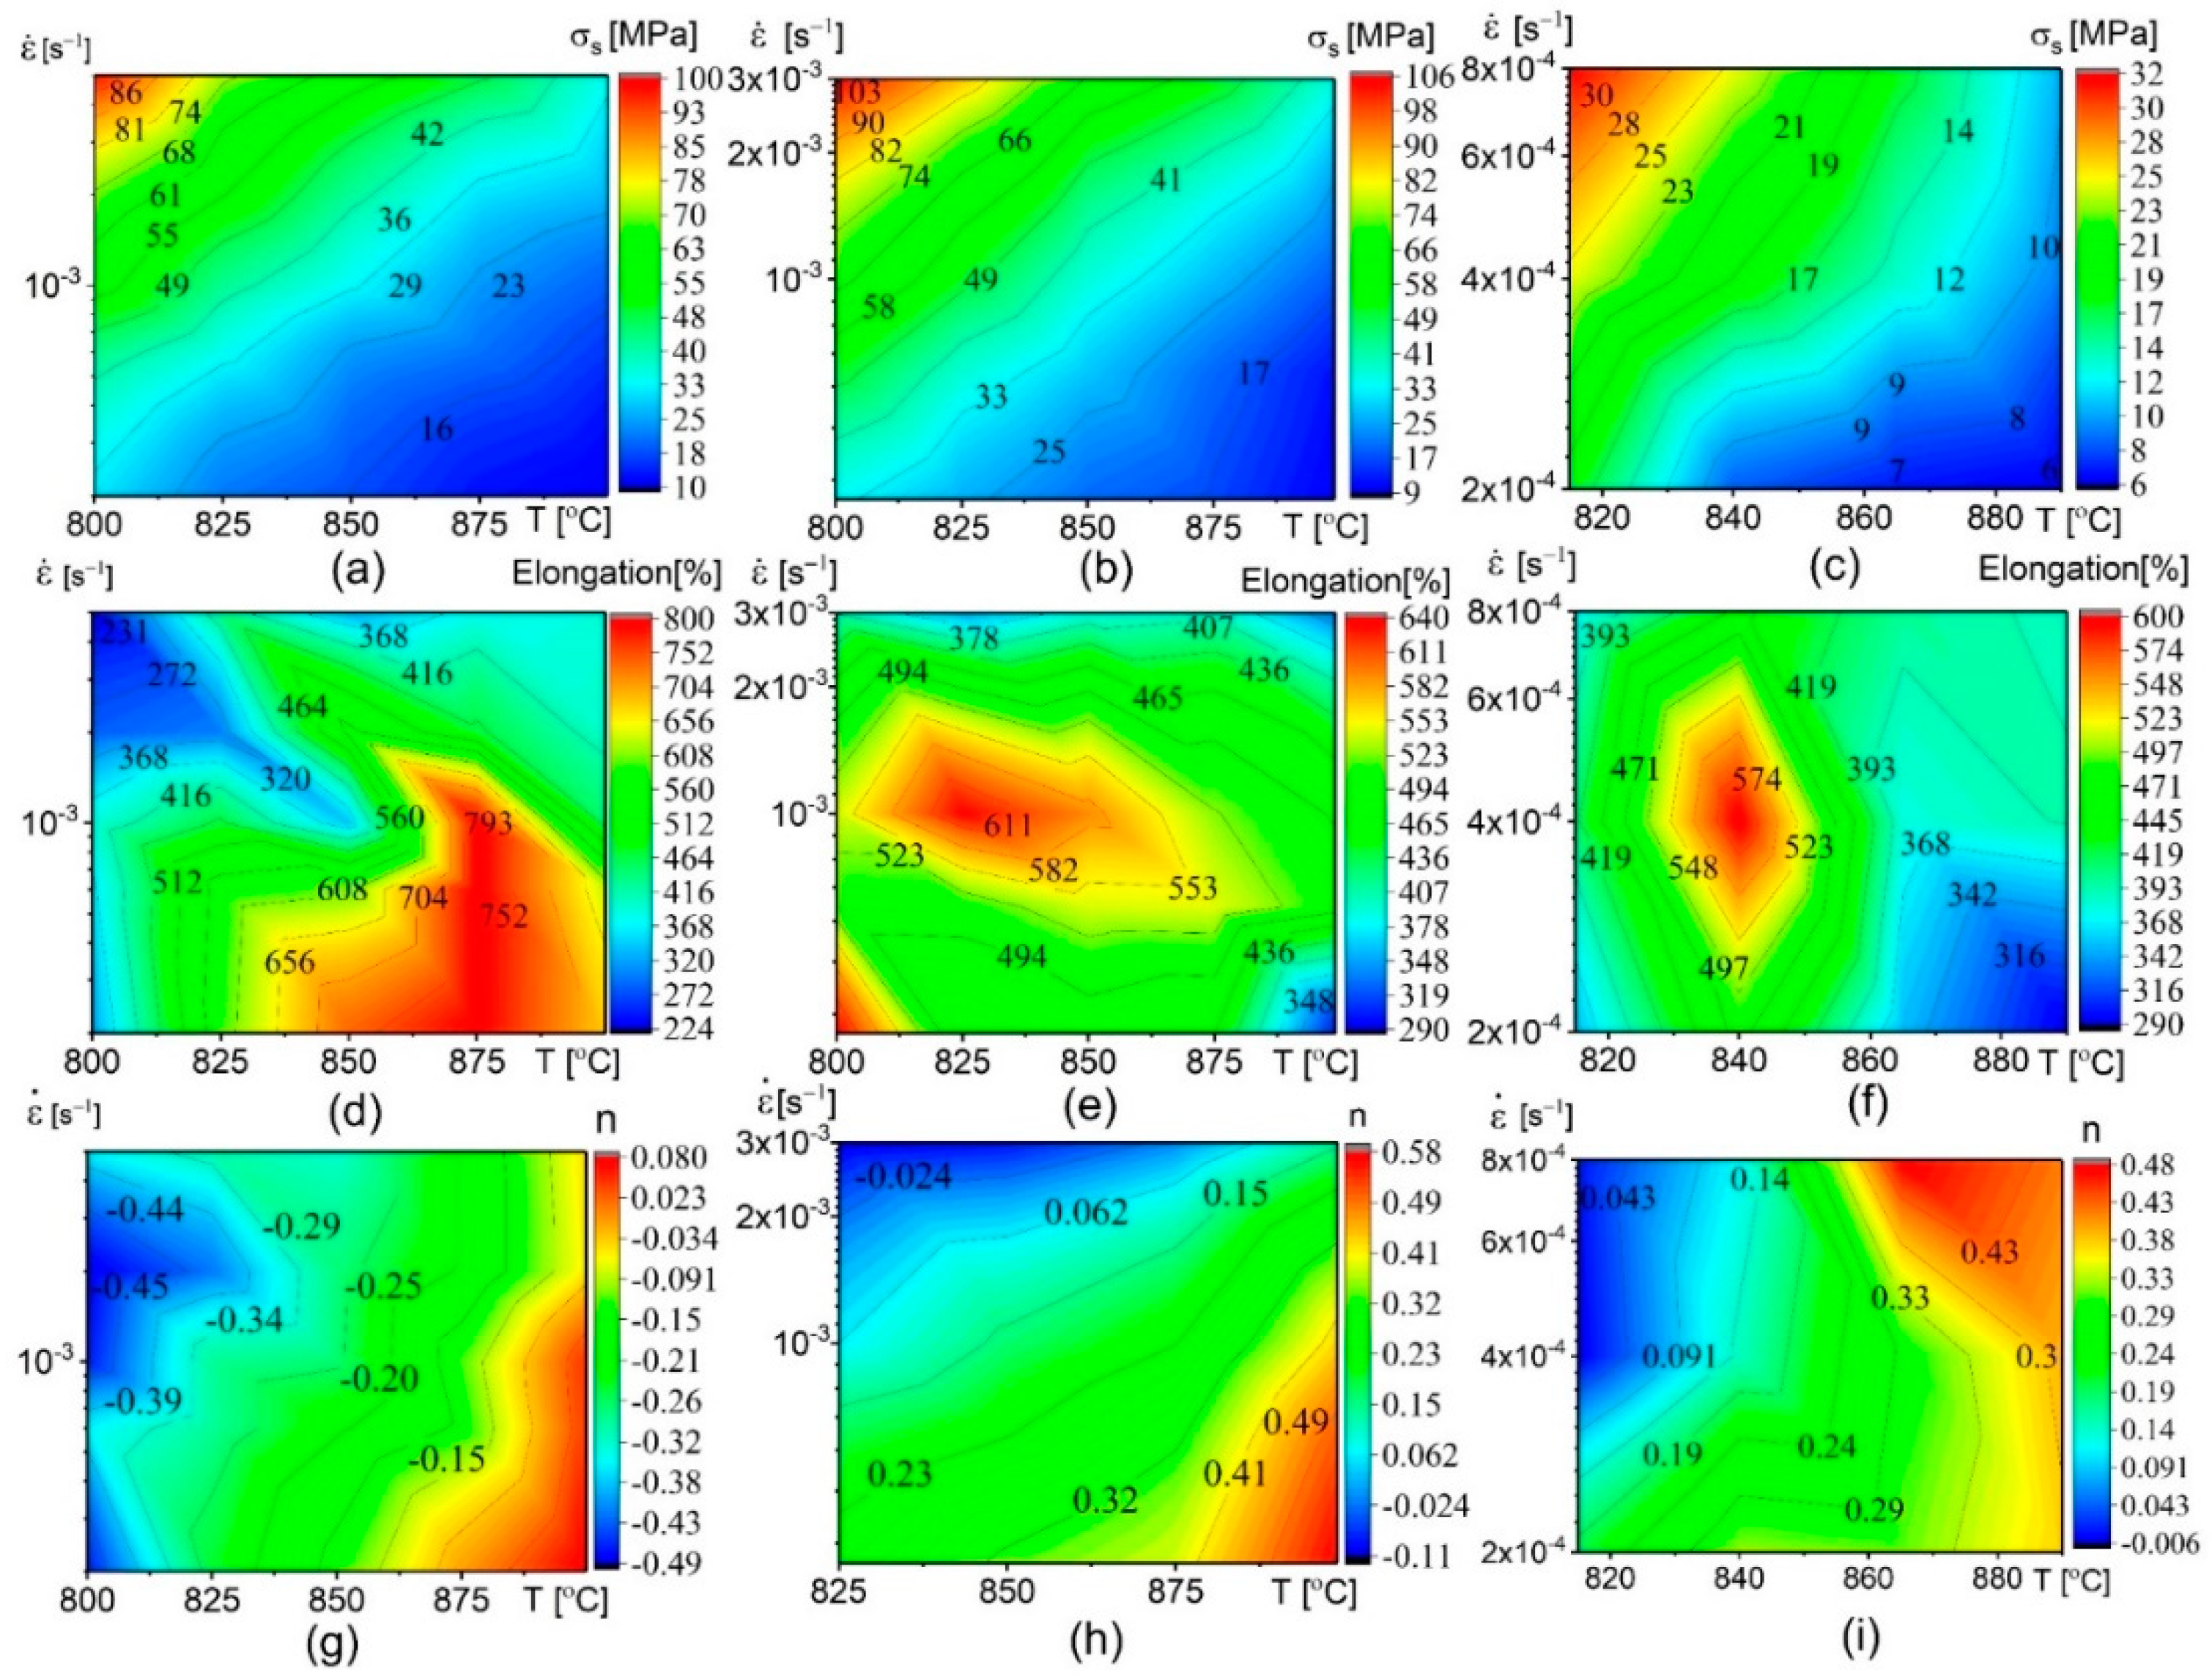
The values of the σs (Figure 4a–c), elongation to failure (Figure 4d–f) and strain hardening coefficient (Figure 4g–i) at the various temperatures and strain rates for the studied alloys are shown in Figure 4. Typically, an increase of the σs value was observed as the strain rate increased and the temperature decreased (Figure 4a–c). The maximum elongation, corresponding to the red zones in (Figure 4d–f), was achieved at different temperature–strain rate ranges for studied alloys (Figure 4d–f). The strain-hardening coefficient depended on both deformation temperature and strain rate and effected to the elongation to failure. The strain-hardening coefficient, in a range of −0.2 to 0.2, corresponded to a high elongation to failure (Figure 4g–i). It can be suggested that an insignificant strain hardening/softening effect and high elongation are the result of the high stability of the grain structure in deformation.
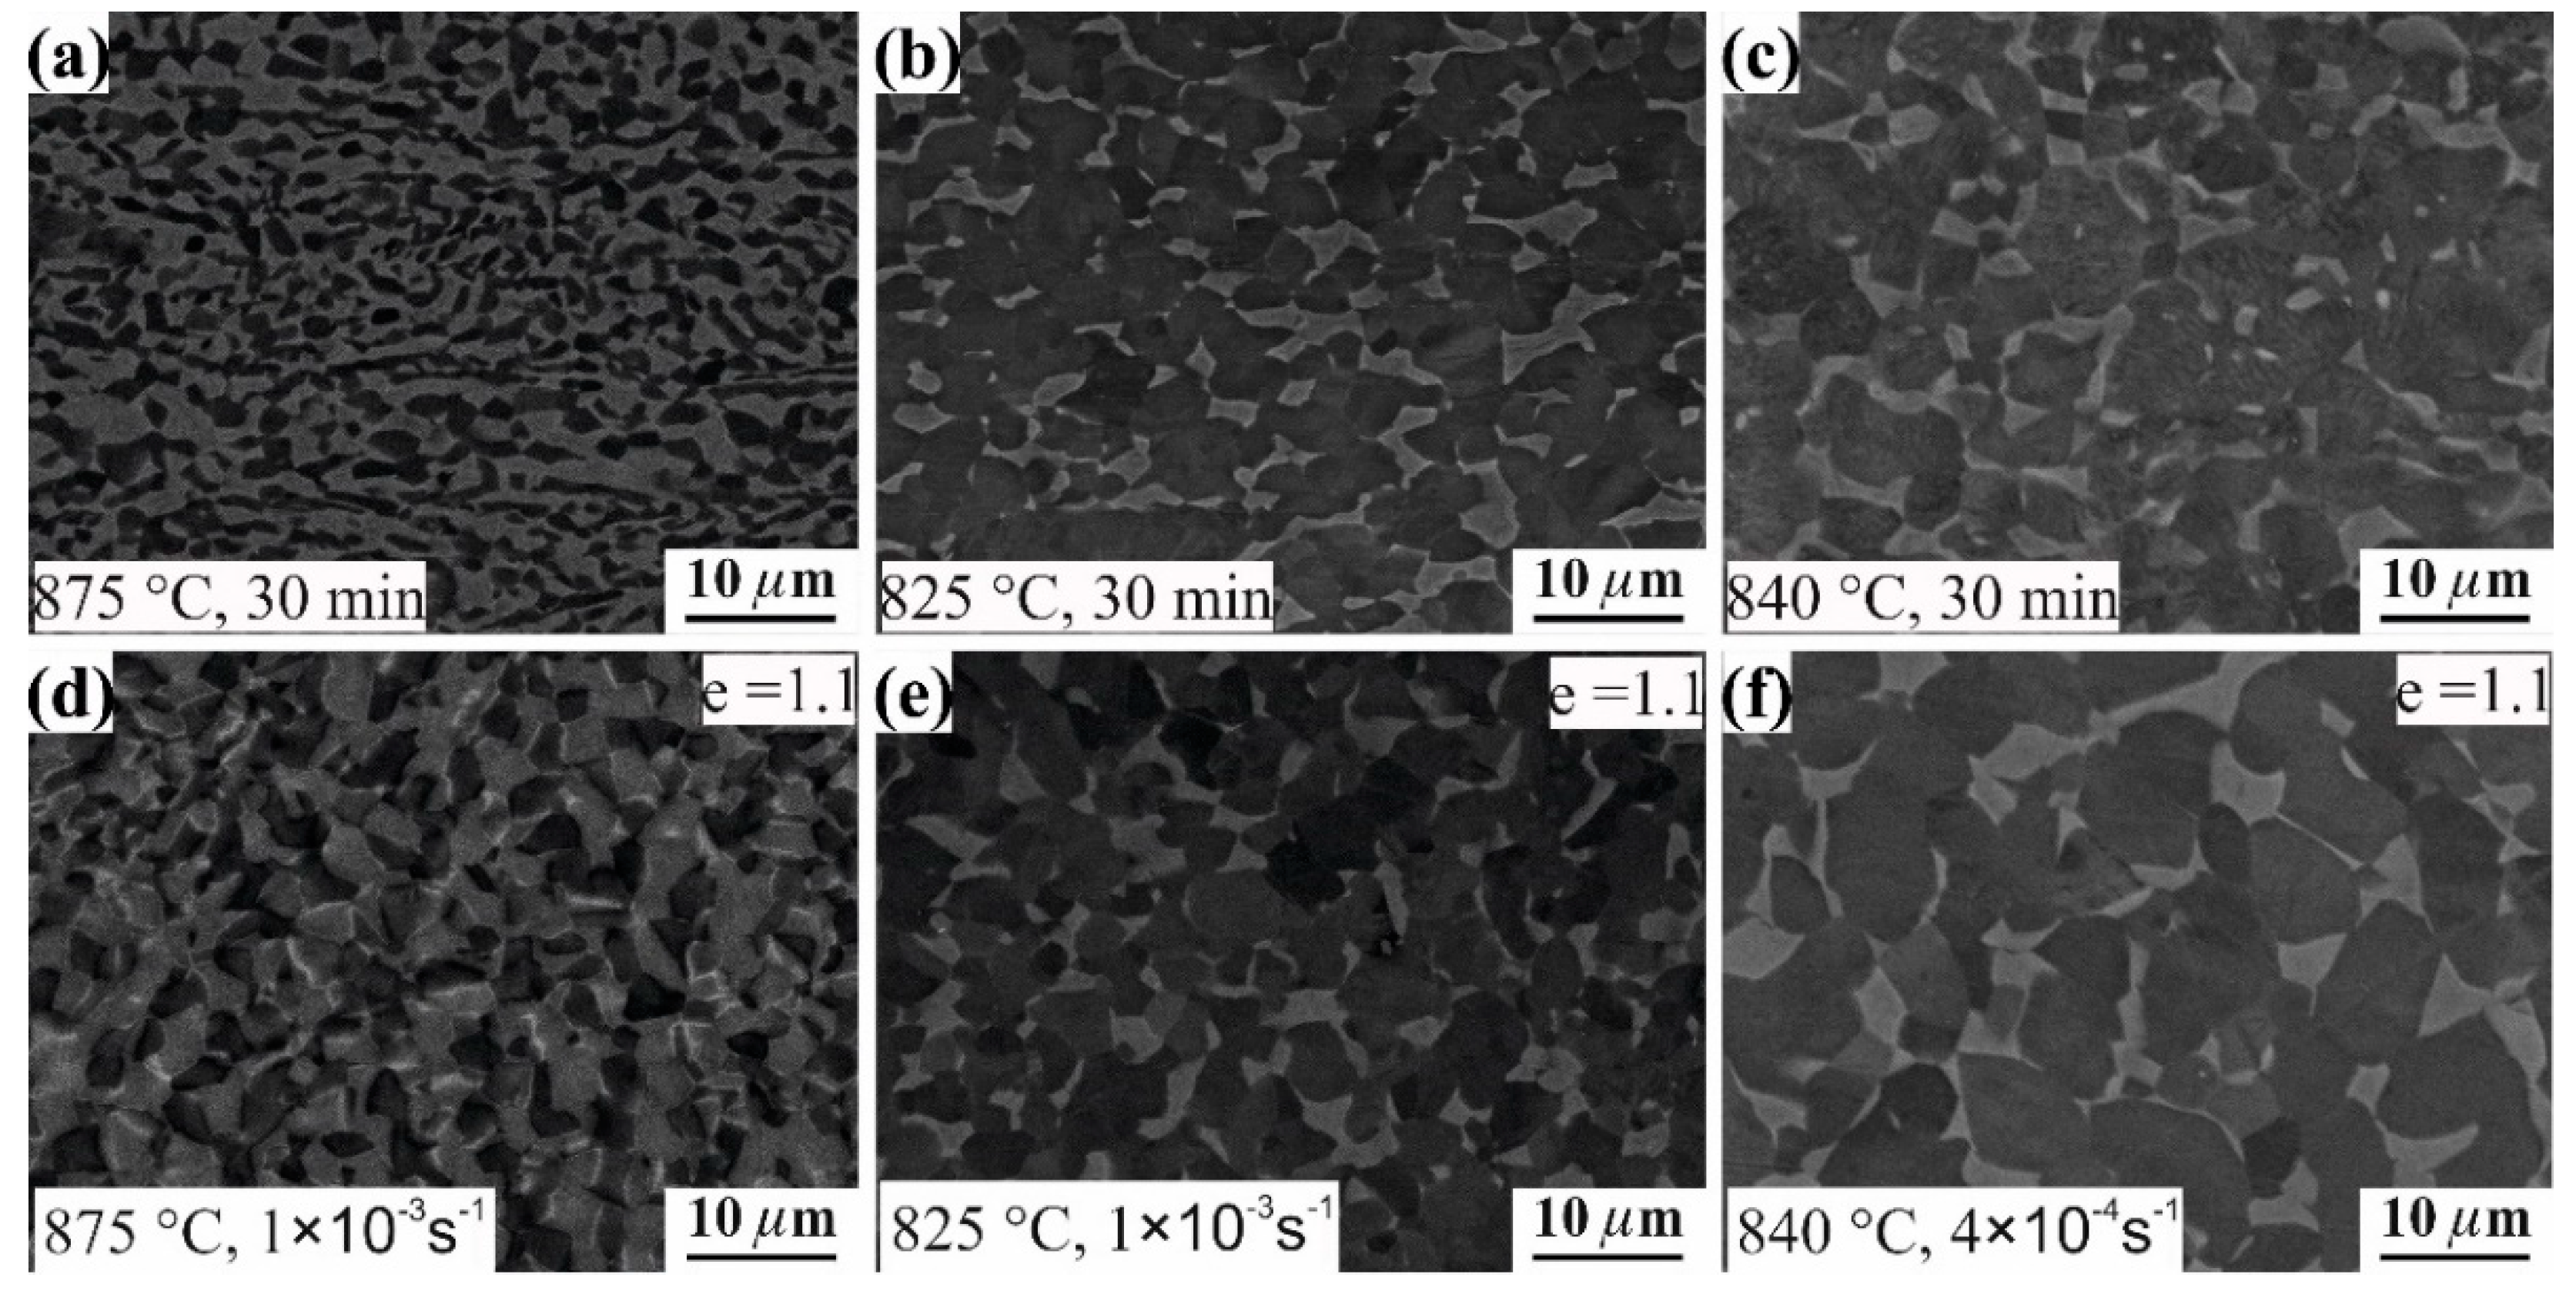
It is known that superplastic deformation depends on microstructure parameters and their strain-induced evolution [38,
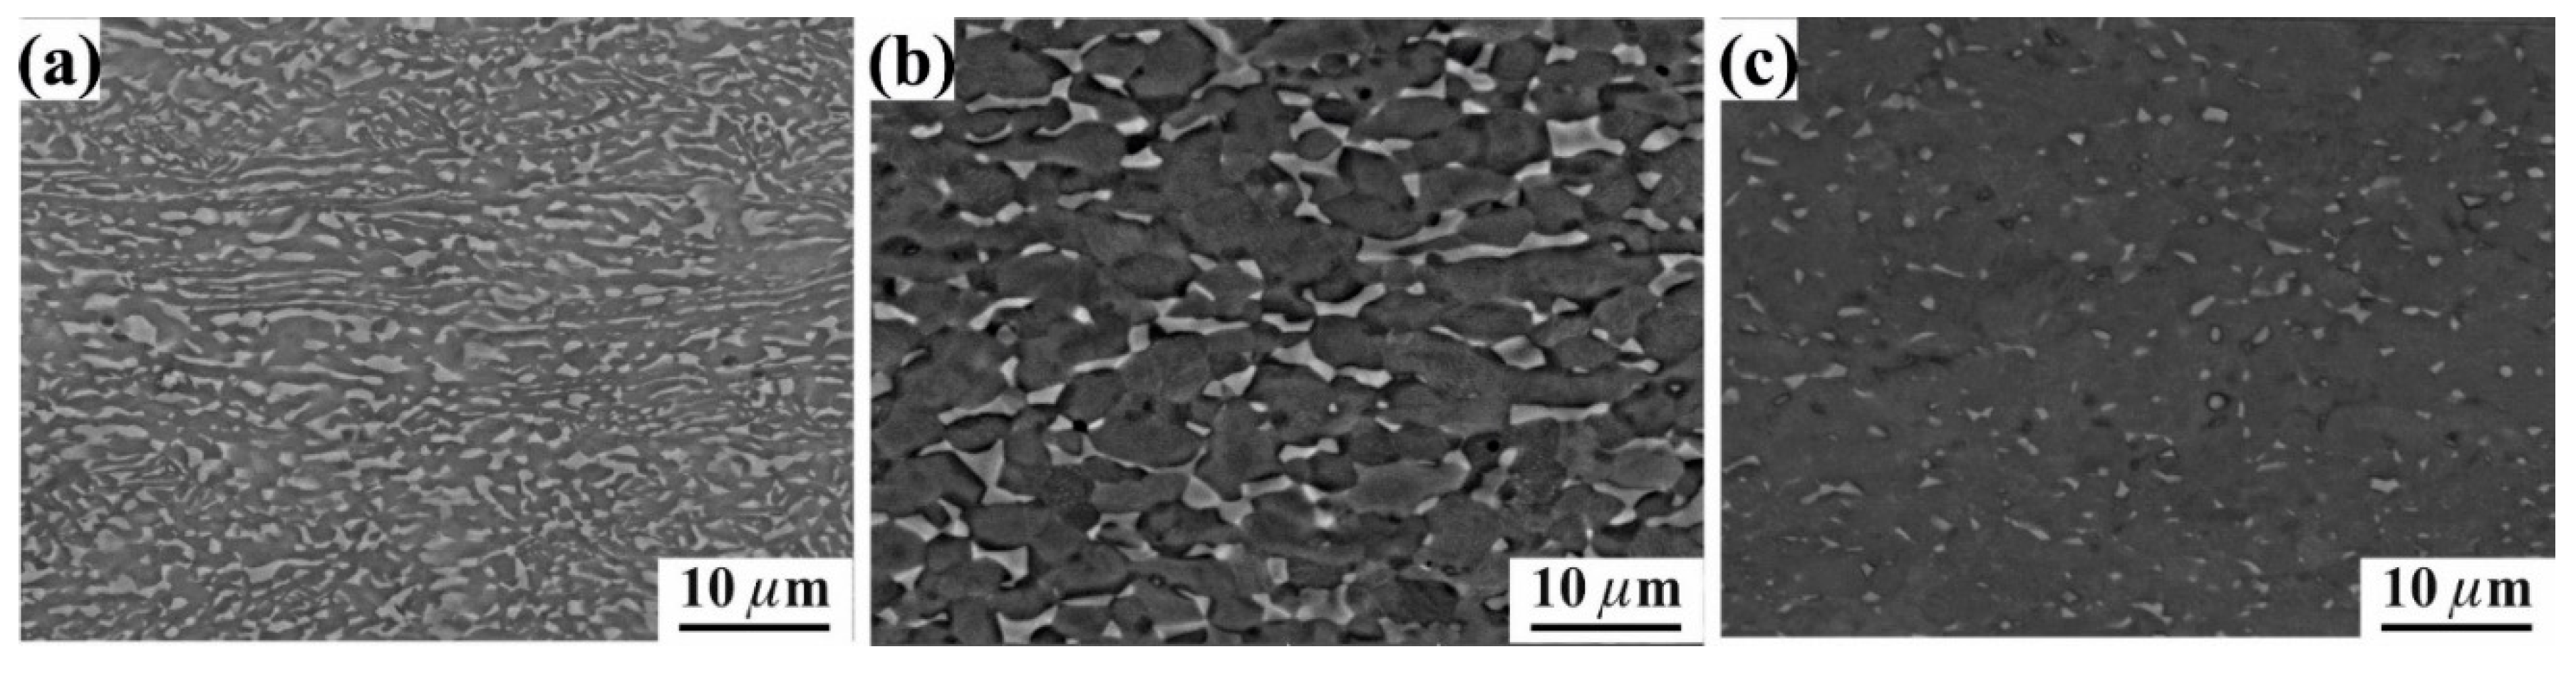
41]. The α/β phase ratio and the grain size of each phase are the most important microstructure parameters. The microstructure of the investigated alloys, after both annealing for 30 min and straining of 1.1, at the strain rate–temperature mode corresponding to the maximum elongation for each material, is shown in Figure 5.
Annealing for 30 min at 875 °C provided a partially globularized grain structure, with a β-phase fraction of 55% and mean grain size of Lβ = 2.0 ± 0.1 μm in the recrystallized volume of the Ti-3%Mo-1%V-4%Al alloy (Figure 5a). The equiaxed recrystallized grains, with a size of Lα = 2.3 ± 0.09 μm and Lβ = 2.5 ± 0.1 μm, were formed after 1.1 straining at 875 °C and 1 × 10⁻³ s−1 (Figure 5d). Thus, a dynamic recrystallization/globularization occurred, with a strain increase of 0.8–1.1, which led to insignificant strain softening, with an average coefficient of n = −0.16. The insignificant grain growth provided a high elongation of 800% in the Ti-4%Al-1%V-3Mo alloy at 875 °C and 1 × 10⁻³ s−1 (Figure 4d).
Annealing for 30 min at 825 °C led to the formation of a recrystallized structure of both phases, with a β-phase percentage of 40% and grain size of Lβ = 2.9 ± 0.1 μm in the Ti-4%V-6%Al alloy (Figure 5b). Additionally, the mean grain size insignificantly increased after straining of 1.1 at 825 °C and 1 × 10⁻³ s−1 (Figure 5b,e), which provided a maximum elongation of 620% (Figure 4e). The α and β grain size after 1.1 straining increased to 3.3 ± 0.2 μm and 3.0 ± 0.15 μm, respectively. The strain hardening coefficient n was 0.1 at the strain rate and temperature mode of the maximum elongation to failure in the Ti-4%V-6%Al alloy. The insignificant strain hardening is also the result of slight dynamic grain growth (Figure 3e,h and Figure 4h).
The Ti-1.8%Mn-2.5%Al alloy exhibited 30% of the β-phase and the mean grain size of recrystallized grains of Lβ = 2.2 ± 0.1 μm, after annealing for 30 min at 840 °C (Figure 5c). At the same temperature, and a strain rate of 4 × 10⁻⁴ s−1, the elongation was at the maximum for this alloy (Figure 4f). The α and β grain size after 1.1 straining was 6.1 ± 0.2 μm and 3.8 ± 0.15 μm, respectively (Figure 5f). The strain hardening coefficient n was 0.2 at this testing condition (Figure 4i), which was the minimum value for the Ti-1.8%Mn-2.5%Al alloy. More intensive dynamic grain growth is a reason for the higher n-value and the lower elongation in Ti-1.8%Mn-2.5%Al, compared to the other investigated alloys.
The Ti-3%Mo-1%V-4%Al alloy demonstrated 800% elongation, which was the maximum value among the studied materials, and the Ti-1.8%Mn-2.5%Al alloy demonstrated 580% elongation, which was the minimum value. Such behavior can be explained by the low tendency toward dynamic grain growth in the first alloy and the high tendency toward this phenomenon in the second one. Generally, an α/β close to 50/50 provides a stable grain structure and good superplasticity in two-phase materials [29]. In the current study, the maximum elongation was observed for a wide range of β fractions, which depended on the microstructure evolution during the deformation process and alloy composition.
Ti-3%Mo-1%V-4%Al and Ti-4%V-6%Al exhibited insignificant dynamic grain growth, providing the maximum elongation at the temperature of the β-phase fraction of 55% and 40%, respectively. This is close to the temperature of the α/β = 50/50 ratio. The Ti-1.8%Mn-2.5%Al alloy demonstrated the maximum elongation at a lower β-phase fraction. The increasing temperature led to an increase of the β-phase fraction to 50% but decreased the elongation to failure in Ti-1.8%Mn-2.5%Al because of significant dynamic grain growth [39].
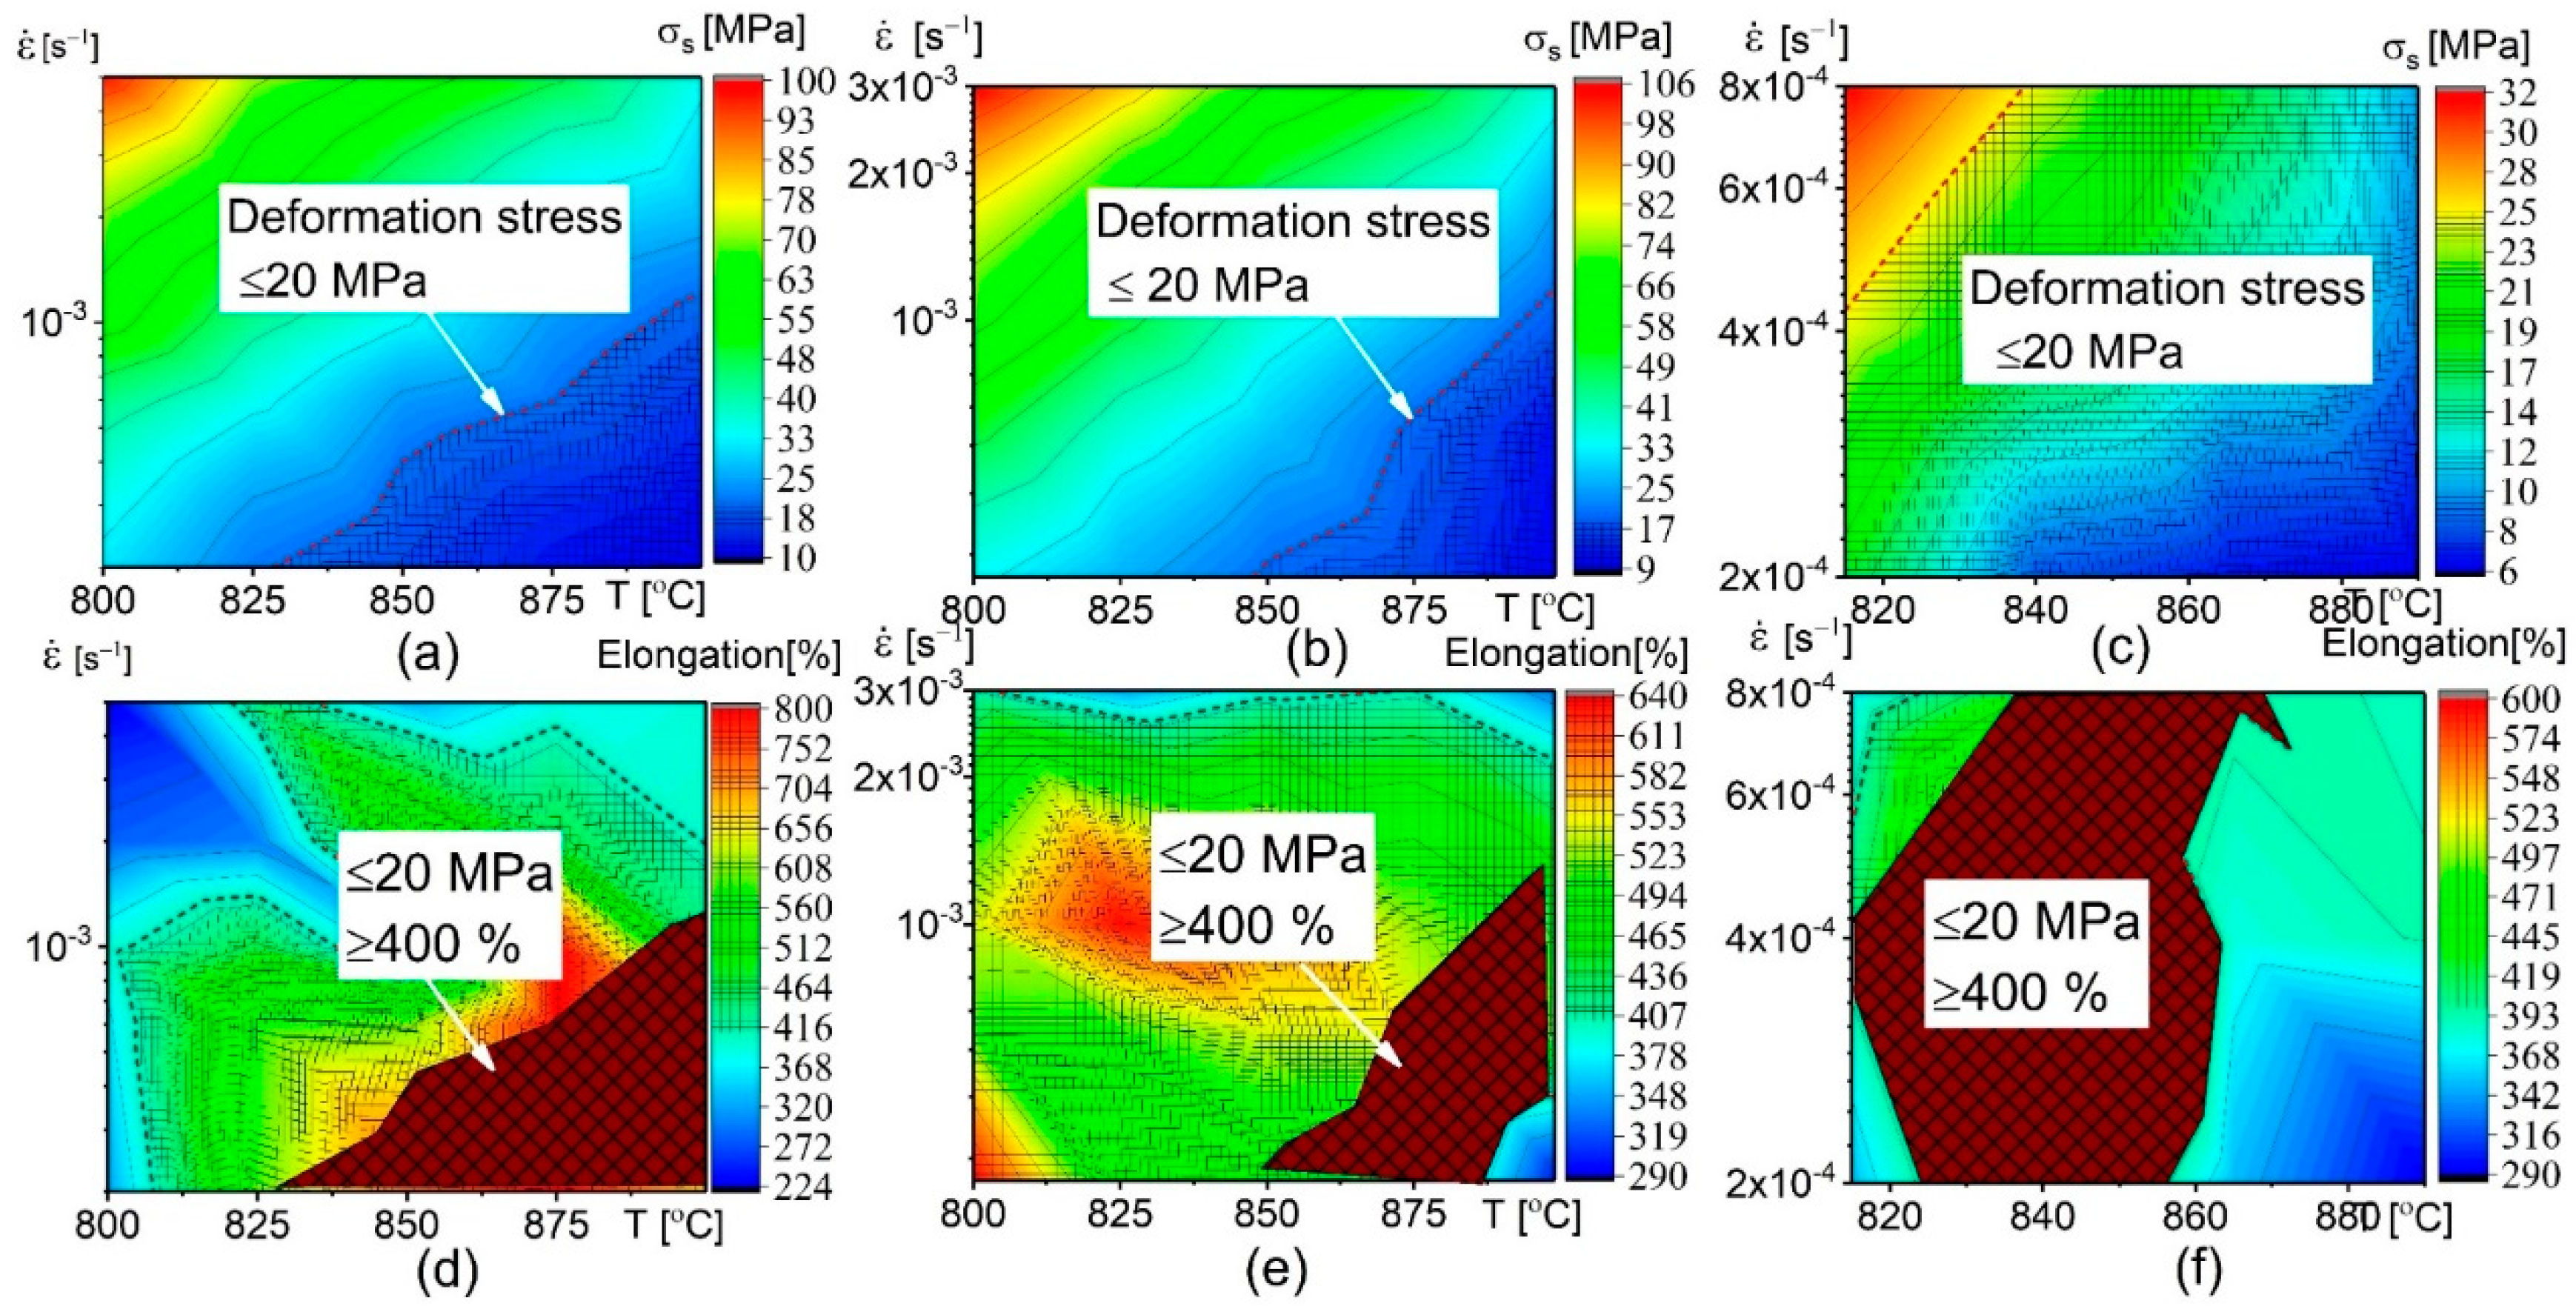
The deformation temperature and strain rate ranges for the investigated alloys, providing an elongation to failure larger than 400% and a stress at the start of the steady stage (σs) of less than 20 MPa, are shown in Figure 6.
To proceed to superplastic forming at a stress level of ≤20 MPa, in the studied strain rate–temperature ranges, the temperature must be above 825 °C for the Ti-3%Mo-1%V-4%Al alloy (Figure 6a), above 850 °C for the Ti-4%V-6%Al alloy (Figure 6b), and above 840 °C for the Ti-1.8%Mn-2.5%Al alloy (Figure 6c). The temperature and strain rate values, which provided both the elongation to failure ≥400% and stress level ≤20 MPa, were determined (the shaded brown regions in Figure 6d–f). Thus, the recommended temperature and strain rate ranges were ˃825 °C and ˂1 × 10⁻³ s−1 for the Ti-3%Mo-1%V-4%Al alloy, 850–890 °C and ˂1 × 10⁻³ s−1 for the Ti-4%V-6%Al alloy, and 815–860 °C and 2 × 10⁻⁴–8 × 10⁻⁴ s−1 for the Ti-2.5%Al-1.8 % Mn alloy.
The empirical expressions of the stress as the steady stage begins and the elongation to failure were established as functions of the deformation temperature (Td) and strain rate ( ε ˙ ), as listed in Table 2.
The accuracy of the developed regression models was evaluated by the correlation coefficient (R2). The (R2) for the (σs) of the Ti-3%Mo-1%V-4%Al, Ti-4%V-6%Al and Ti-1.8%Mn-2.5%Al alloys were 0.995, 0.998 and 0.999, respectively. The (R2) of the developed regression models for the elongation to failure of the Ti-3%Mo-1%V-4%Al, Ti-4%V-6%Al and Ti-1.8%Mn-2.5%Al alloys were 0.85, 0.91 and 0.97, respectively (Table 2). The high values of the (R2) confirmed the effectiveness of the developed models.

3.3. Most Influential Control Parameter Determination Using the Taguchi Method

Typically, titanium-based alloys are very sensitive to the deformation temperature due to the change in the α/β ratio and grain structure, which affect the superplastic deformation behavior [39,42]. A fine grain structure is required to activate grain boundary sliding, which is a dominant superplastic deformation mechanism for most metallic materials [41,42,43]. The elevated temperature provided the grain boundary sliding phenomenon, as well as the necessary diffusion and dislocation creeping mechanisms, which accommodated the grain boundary sliding. All superplastic deformation mechanisms affect the diffusion kinetic, and, finally, depend on the deformation temperature, strain rate and grain structure. Therefore, choosing an appropriate temperature–strain rate range of superplastic deformation is very important.
On the other hand, the temperature of superplastic deformation should be kept at the minimum as far as possible, since doing so results in power saving in the manufacturing process and die wear. However, the strain rate should be maintained at the maximum as far as possible to minimize the forming time. Therefore, the relative contribution of the hot deformation process parameters (temperature and strain rate), the stress as the steady stage begins (σs) and the elongation to failure is required to provide useful information for the producer, resulting in power and time savings in the manufacturing process.
For titanium alloys, the deformation process is considered to be superplastic deformation when the elongation is at the minimum (400%) and the required stress for deformation (20 MPa) is at the maximum (Figure 6). Thus, we needed to obtain a maximum elongation and a minimum deformation stress by choosing the best combination of the deformation temperature range and strain rate range on the basis of minimizing the deformation temperature and maximizing the deformation strain rate.
The design of the experimental (DOE) technique using the Taguchi method was performed. The Taguchi model studies the effect of the temperature and the strain rate on the σs, elongation to failure and strain-hardening/softening coefficient. The control parameter levels for each alloy are shown in Table 3. The number of the levels depended on the diapason of the possible superplastic deformation temperatures and strain rates. Thus, five levels were used for the Ti-3%Mo-1%V-4%Al alloy due to their wide superplastic temperature and strain rate ranges. The number of parameter levels was four for the Ti-4%V-6%Al alloy and three for the Ti-1.8%Mn-2.5%Al alloy, because the superplastic temperature and strain rate ranges were narrow for the Ti-1.8%Mn-2.5%Al alloy. MINITAB 16 software (Minitab Inc., State College, PA, USA) was utilized to design and analyze the experiments using the analysis of variance (ANOVA) technique procedure.
A standard experimental design, which requires a small number of experimental runs to indicate the effect of the most significant parameters on the target response, is known as orthogonal arrays (OA). The OA, according to Taguchi standard orthogonal arrays [44] for the Ti-3%Mo-1%V-4%Al, Ti-4%V-6%Al and Ti-1.8%Mn-2.5%Al alloys, were L25 (52), L16 (42) and L9 (32), respectively.
The signal to noise (S/N) ratio is an ideal metric for selecting the best values of the control variables. In this work, the “larger—is better” principle (Equation (1)) was considered in maximizing the elongation to failure, and the “smaller—is better” principle (Equation (2)) was used to minimize the stress at the start of the steady stage (σs) and the strain-hardening/softening effect. The S/N ratio can be computed using the following equations [45]:
S N = log ( 1 n i = 1 n 1 y 2 ) larger is   better
S N = log ( 1 n i = 1 n y 2 ) smaller is   better
where n is the number of the runs in a trail, and y is the response value.
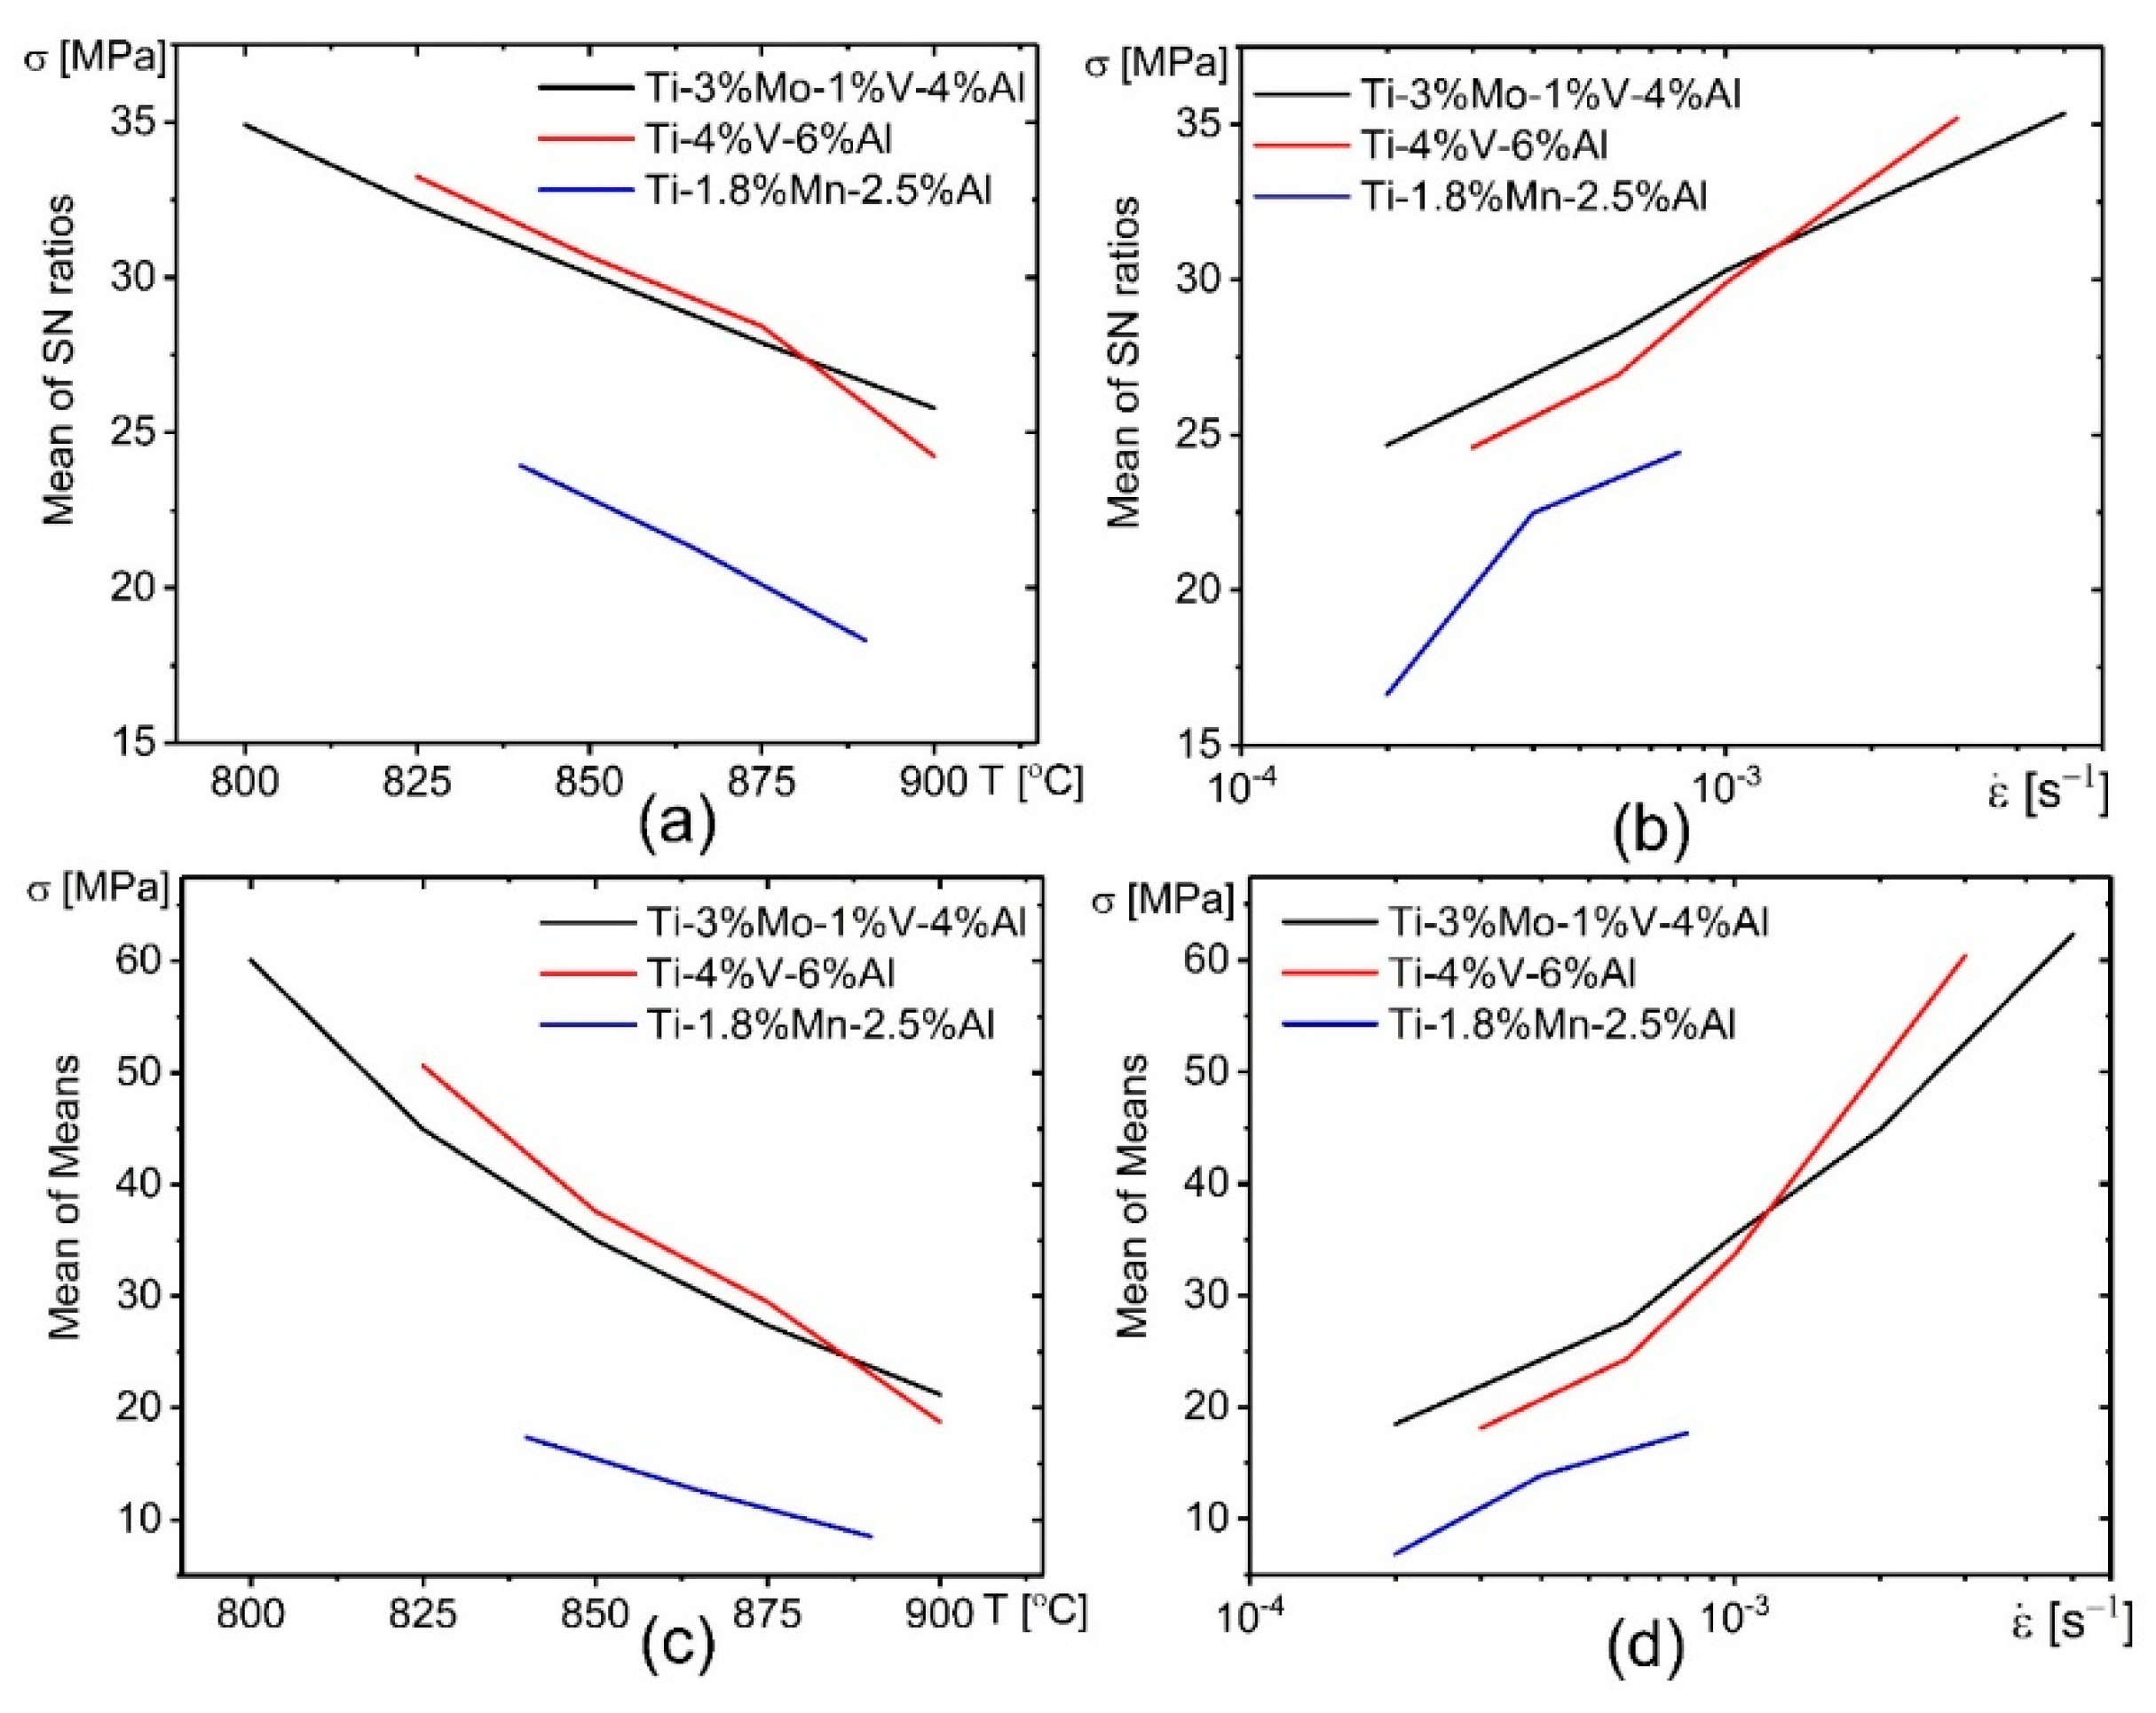
The σs vs. the deformation temperature and the strain rate dependences, for the investigated alloys, are illustrated in Figure 7. The mean of the S/N ratios and the mean of means of the σs were found to give the same trend under the temperature and strain rate effects. These values decreased as the temperature increased, but increased as the strain rate increased, for all alloys. For the minimum σs value, the last temperature level (Figure 7a,c) and the first strain rate level (Figure 7b,d) were recommended for all studied alloys.
The analysis of variance (ANOVA) for the S/N ratio and the mean of the σs, for all tested alloys, are shown in Table 4 and Table 5, respectively.
The percentage of the contribution and delta values for the strain rate was more than the percentage of the contribution and delta values for the temperature, for all tested alloys (Table 4 and Table 5). Thus, the rank of the strain rate was 1, and the rank of temperature was 2. Therefore, the strain rate affected the σs more significantly than did the temperature. These results match those observed in [36].
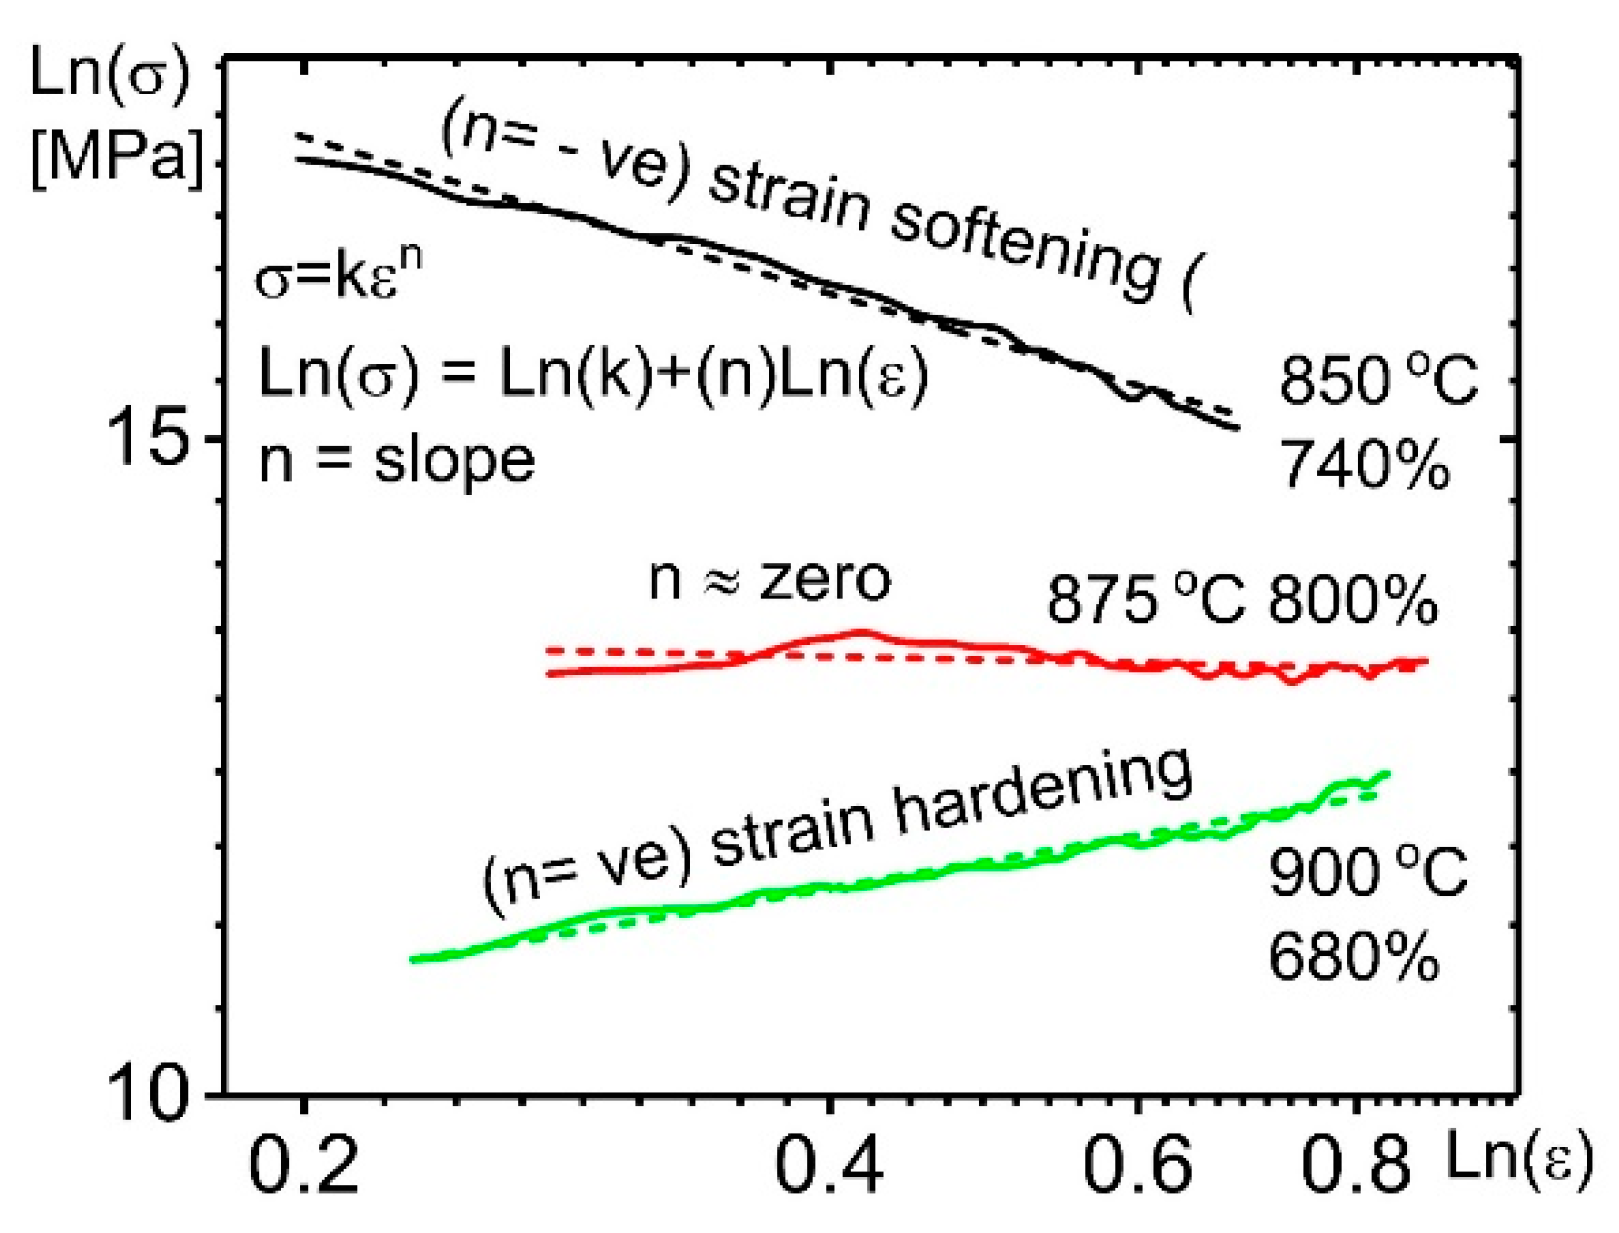
The maximum elongation can be obtained at the minimum strain hardening/softening effect, as shown in Figure 8 for Ti-3%Mo-1%V-4%Al at 2 × 10⁻⁴ s−1 and different temperatures. Thus, the strain hardening/softening must be close to zero. The absolute values of strain softening were provided in the Taguchi model.
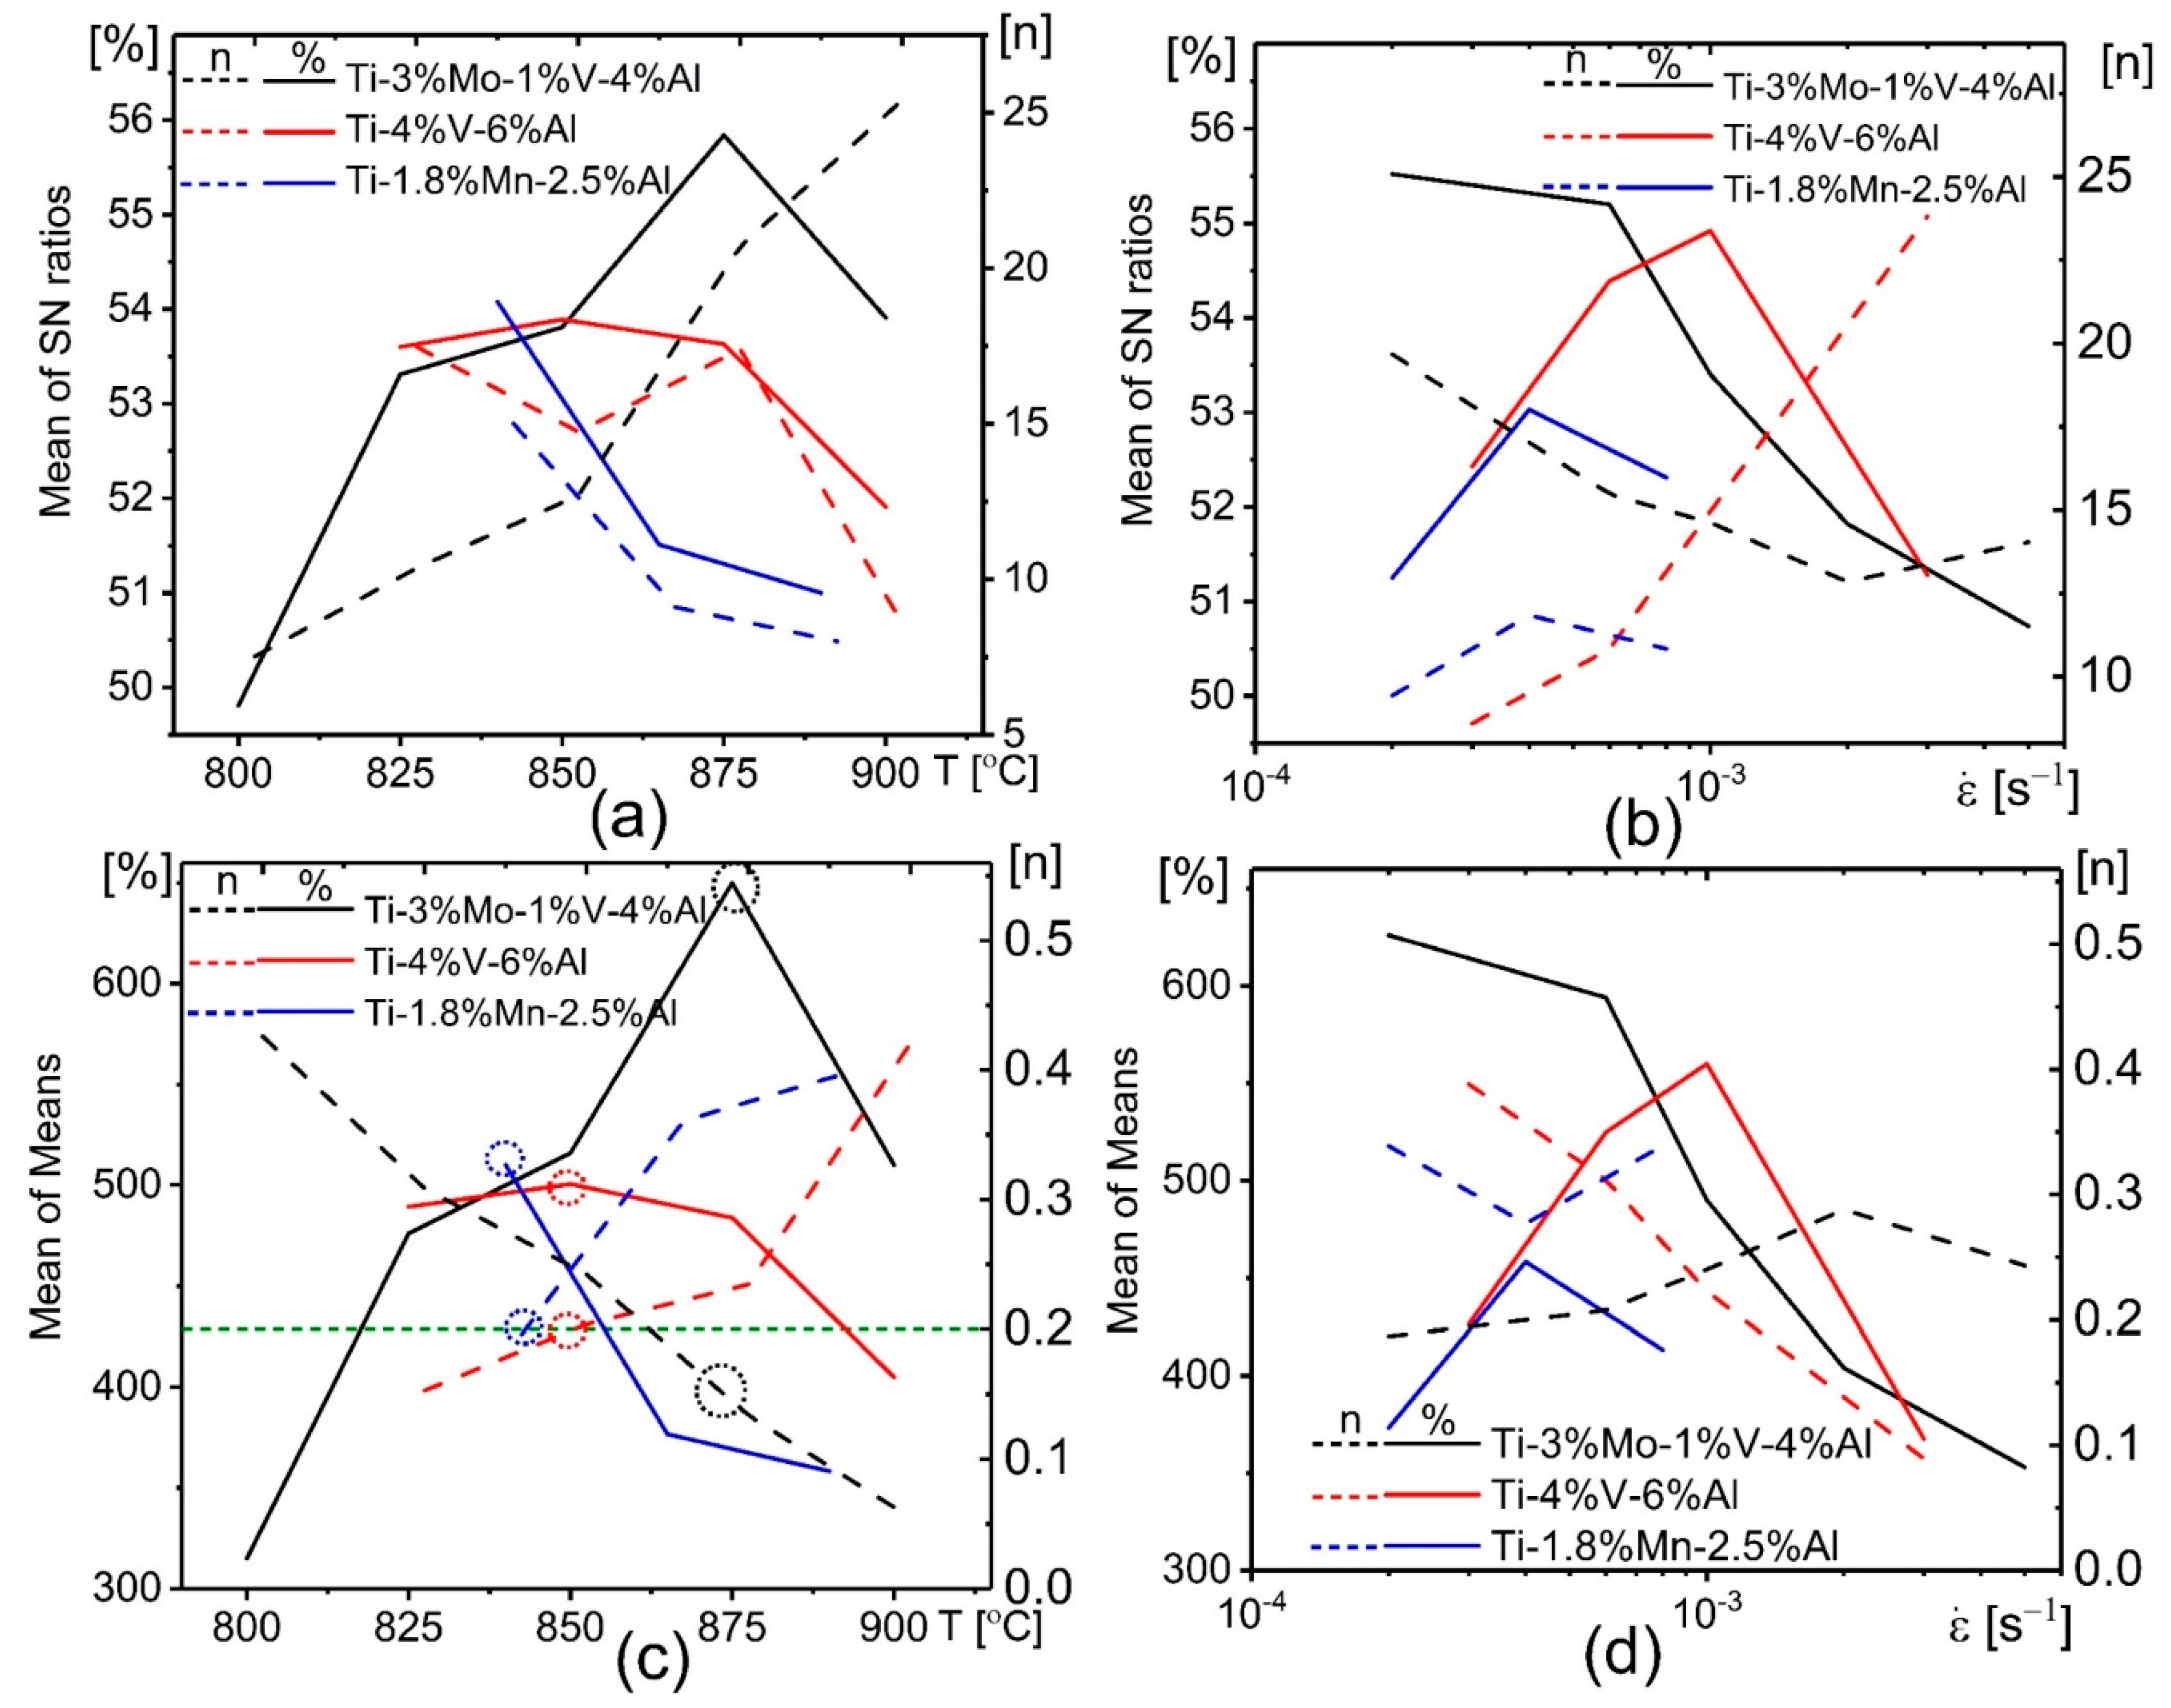
The effects of the temperature and strain rate on the elongation to failure and strain hardening/softening coefficient for the investigated alloys are shown in Figure 9. The mean of the S/N ratios and the mean of the elongation to failure had the same response under the temperature and strain rate effects. For the Ti-3%Mo-1%V-4%Al alloy, the elongation increased as the temperature increased, up to an optimum value of 875 °C, and then decreased again. It also exhibited the maximum elongation at strain rates up to 1 × 10⁻³ s−1. For the Ti-4%V-6%Al alloy, the elongation insignificantly changed in a temperature range of 825–875 °C, and it exhibited the maximum value at a strain rate of 1 × 10⁻³ s−1. For the titanium alloy, Ti-1.8%Mn-2.5%Al, the maximum elongation to failure was obtained at a temperature of 840 °C and a strain rate of 8 × 10⁻⁴ s−1. Maximum mean elongations were noted at a mean strain hardening coefficient in the range of −0.2 to 0.2 for all the alloys (Figure 9c).
The percentage of the contribution and the rank after the analysis of variance (ANOVA) for the S/N ratio and the means of elongation to failure, for the investigated alloys, are shown in Table 6.
The percentage of contribution and the delta value for the temperature were higher than these parameters for the strain rate of the Ti-3%Mo-1%V-4%Al and Ti-1.8%Mn-2.5%Al alloys (Table 6). By contrast, the percentage of contribution and the delta value for the strain rate were higher than these parameters for the temperature of the Ti-4%V-6%Al alloy (Table 6). Therefore, the temperature affected the elongation to failure more significantly than did the strain rate for the Ti-3%Mo-1%V-4%Al and Ti-1.8%Mn-2.5%Al alloys, and, conversely, the elongation to failure more strongly depended on the strain rate than on the temperature for the Ti-4%V-6%Al alloy.
The percentage of contribution and the rank after the analysis of variance (ANOVA) for the S/N ratio and the mean of the strain hardening/softening coefficient, for the investigated alloys, are shown in Table 7.
As can be seen in Table 7, the effects of temperature and strain rate on both the elongation to failure and strain hardening were similar. The percentage of contribution and delta value show that the deformation temperature was a more important parameter than the strain rate for the Ti-3%Mo-1%V-4%Al and Ti-1.8%Mn-2.5%Al alloys. Conversely, the strain hardening/softening effect more significantly depended on the strain rate than the temperature, for the Ti-4%V-6%Al alloy. The percentage of the contribution of temperature is insignificantly higher than the percentage of the contribution of strain rate, for Ti-4%V-6%Al, but, in the case of the other alloys, the difference between the percentage of the contribution of temperature and strain rate is high. Thus, the temperature has a high impact on the strain hardening/softening effect in the case of the Ti-3%Mo-1%V-4%Al and Ti-1.8%Mn-2.5%Al alloys.
As has been shown, the most influential parameter on the superplastic behavior was the strain rate at low strain values for the investigated alloys. Thus, the strain rate affects the stress at the start of the steady stage (σs) more greatly than does the temperature. This is possibly due to the high temperature stability of the fine grain structure, confirming the high strain rate sensitivity of the studied alloys.
It is well known that the elongation to failure in superplastic deformation is very sensitive to the strain-induced microstructure evolution [41,42,46,47,48]. For all studied alloys, the maximum elongation was obtained in the deformation regimes, providing close-to-zero values of the strain hardening coefficient. These deformation regimes also provided insignificant dynamic grain growth (Figure 5), especially for Ti-4%V-6%Al.
The temperature affected the elongation to failure more so than did the strain rate, for the Ti-3%Mo-1%V-4%Al and Ti-1.8%Mn-2.5%Al alloys. The possible reason for such a temperature effect is a significant microstructure change as the temperature is increased. This is in agreement with the previous study of the Ti-1.8%Mn-2.5%Al alloy [39]. However, the elongation to failure more strongly depends on the strain rate than on the temperature, for the Ti-4%V-6%Al alloy. This is possibly due to the low temperature sensitivity of the microstructure to the strain-induced changes in the studied deformation regimes.
The additional important result of the current study is the possibility to decrease the superplastic deformation temperature for all studied alloys. Thus, very good formability, with 400% of elongation and a stress value lower than 20 MPa, was observed at a temperature of 825 °C and strain rate of 2 × 10⁻⁴ s−1, for the Ti-3%Mo-1%V-4%Al alloy, of 850 °C and 3 × 10⁻⁴ s−1, for the Ti-4%V-6%Al alloy, and 815°C and 4 × 10⁻⁴ s−1, for the Ti-1.8%Mn-2.5%Al alloy.

4. Conclusions

Based on the current investigation, our conclusions are as follows:
The recommended temperature and strain rate ranges, for providing an elongation to failure of ≥400% and stress of ≤20 MPa, were determined for the studied alloys. For the Ti-3%Mo-1%V-4%Al alloy, the temperature and strain rate ranges were ˃825 °C and ˂1 × 10⁻³ s−1; for the Ti-4%V-6%Al alloy, they were 850–890 °C and ˂1 × 10⁻³ s−1; and for Ti-1.8%Mn-2.5%Al alloy, they were 815–860 °C and 2 × 10⁻⁴–8 × 10⁻⁴ s−1. According to the tensile tests, the optimum superplastic temperature and strain rate, which provided the maximum elongation, are 875 °C and 3 × 10⁻³ s−1 for the Ti-3%Mo-1%V-4%Al alloy; 850 °C and 1 × 10⁻³ s−1, for the Ti-4%V-6%Al alloy; and 840 °C and 4 × 10⁻⁴ s−1, for the Ti-1.8%Mn-2.5%Al alloy.
The maximum elongations to failure were observed at a temperature when the β phase fraction was in a range of 25–55% and the grain size was approximately 2–3 µm in the studied alloys. The Ti-3%Mo-1%V-4%Al alloy required 50% of the β-phase to provide the maximum elongation to failure. Conversely, the Ti-4%V-6%Al and Ti-1.8%Mn-2.5%Al alloys demonstrated the maximum elongation at a lower β-phase fraction of 25% and 35%, respectively. Increasing temperature led to an increase of the β-phase fraction to 50% but decreased the elongation to failure in both alloys.
The correlation coefficients of the developed regression models, for both the stress as the steady stage begins (σs) and the elongation to failure of the titanium alloys (Ti-3%Mo-1%V-4%Al, Ti-4%V-6%Al and Ti-1.8%Mn-2.5%Al), confirm the effectiveness of the developed empirical models.
The Taguchi method found that the strain rate has a higher statistical and physical significance than does the temperature on the stress as the steady stage begins (σs) for the investigated alloys. The temperature affects the elongation to failure more so than does the strain rate for the Ti-3%Mo-1%V-4%Al and Ti-1.8%Mn-2.5%Al alloys. However, the elongation to failure more strongly depends on the strain rate than does the temperature for the Ti-4%V-6%Al alloy.

Author Contributions

Conceptualization, A.V.M. and V.P.; Methodology, A.O.M. and A.D.K.; Software, A.O.M.; Validation, A.D.K., E.B.M. and W.S.A.; Formal Analysis, A.O.M.; Investigation, A.D.K.; Resources, E.B.M. and W.S.A.; Data Curation, A.O.M.; Writing—Original Draft Preparation, A.O.M. and A.V.M.; Writing—Review and Editing, V.K.P.; Visualization, A.D.K.; and Supervision, V.K.P.

Funding

The tensile test experiments, microstructure studies of the Ti-Al-V-Mo alloy and their interpretations were supported by the RSF grant 18-79-00348. A.D.K. acknowledges the Grant president, MK-2301.2017.8, for supporting the tensile tests of the Ti-Al-V alloy. The experimental part of the analysis of variance was supported by the Ministry of Education and Science in frame (B100) program, dated 16 March 2013, No. 211.

Acknowledgments

A.O.M. acknowledges the Ministry of Education and Science of the Russian Federation for supporting the experimental part of the analysis of variance in the framework of the Program (B100), aiming to increase the competitiveness of the National University of Sciences and Technology, “MISiS”, implemented by a governmental decree, dated 16 March 2013, No. 211. The authors also thank E. Bazanova, director of the Academic Writing Office, for her critical reading of the manuscript and many helpful suggestions.

Conflicts of Interest

The authors declare no conflict of interest. The founding sponsors had no role in the design of the study; in the collection, analyses, or interpretation of data; in the writing of the manuscript, and in the decision to publish the results.

References

  1. Ji, Z.; Chen, Y.H.; Qiang, Y.H.; Shen, C.J.; Li, H.W. Effect of deformation of constituent phases on mechanical properties of Ti-6.5Al-3.5Mo-1.5Zr-0.3Si titanium alloy. Mater. Sci. Eng. A 2018, 710, 200–205. [Google Scholar] [CrossRef]
  2. Liu, W.Y.; Lin, Y.H.; Chen, Y.H.; Shi, T.H.; Ambrish, S. Effect of Different Heat Treatments on Microstructure and Mechanical Properties of Ti6Al4V Titanium Alloy. Rare Met. Mater. Eng. 2017, 46, 634–639. [Google Scholar]
  3. Tan, L.; Yao, Z.; Zhou, W.; Guo, H.; Zhao, Y. Microstructure and properties of electron beam welded joint of Ti-22Al-25Nb/TC11. Aerosp. Sci. Technol. 2010, 14, 302–306. [Google Scholar] [CrossRef]
  4. Li, P.; Huang, S.; Xu, H.; Li, Y.; Hou, X.; Wang, Q.; Fu, W.; Fang, Y. Numerical simulation and experiments of titanium alloy engine blades based on laser shock processing. Aerosp. Sci. Technol. 2015, 40, 164–170. [Google Scholar] [CrossRef]
  5. Gao, A.; Hang, R.; Bai, L.; Tang, B.; Chu, P.K. Electrochemical surface engineering of titanium-based alloys for biomedical application. Electrochim. Acta 2018, 271, 699–718. [Google Scholar] [CrossRef]
  6. Li, C.; Xie, H.; Mao, X.; Zhang, P.; Hou, Z. High Temperature Deformation of TC18 Titanium Alloy. Rare Met. Mater. Eng. 2017, 46, 326–332. [Google Scholar]
  7. Sun, S.Y.; Lv, W.J. Microstructure and Mechanical Properties of TC18 Titanium Alloy. Rare Met. Mater. Eng. 2016, 45, 1138–1141. [Google Scholar]
  8. Ning, Y.Q.; Xie, B.C.; Fu, M.W.; Liang, H.Q.; Yao, Z.K.; Guo, H.Z. Microstructure and superplastic deformation for aerospace Ti-alloys associated with α-phase curing behavior. Aerosp. Sci. Technol. 2015, 45, 416–421. [Google Scholar] [CrossRef]
  9. Liu, Y.; Ning, Y.; Yao, Z.; Guo, H. Hot deformation behavior of Ti-6.0Al-7.0Nb biomedical alloy by using processing map. J. Alloy. Compd. 2014, 587, 183–189. [Google Scholar] [CrossRef]
  10. Liu, Z.; Li, P.; Geng, L.; Liu, T.; Gao, H. Microstructure and texture evolution of TA32 titanium alloy during superplastic deformation. Mater. Sci. Eng. A 2017, 699, 71–80. [Google Scholar] [CrossRef]
  11. Du, Z.; Liu, J.; Li, G.; Lv, K.; Liu, G.; Yan, L.; Chen, Y. Low-temperature superplastic behavior of beta titanium alloy. Mater. Sci. Eng. A 2016, 650, 414–421. [Google Scholar] [CrossRef]
  12. Kim, S.W.; Kim, J.H.; Song, Y.H.; Hong, J.K.; Hyun, Y.T.; Yeom, J.T. Deformation characteristics of Ti-6Al-4Fe alloys with enhanced high temperature ductility. Mater. Sci. Eng. A 2013, 559, 96–100. [Google Scholar] [CrossRef]
  13. Warchomicka, F.; Poletti, C.; Stockinger, M. Study of the hot deformation behaviour in Ti-5Al-5Mo-5V-3Cr-1Zr. Mater. Sci. Eng. A 2011, 528, 8277–8285. [Google Scholar] [CrossRef]
  14. Tanaka, Y.; Nakai, M.; Akahori, T.; Niinomi, M.; Tsutsumi, Y.; Doi, H.; Hanawa, T. Characterization of air-formed surface oxide film on Ti-29Nb-13Ta-4.6Zr alloy surface using XPS and AES. Corros. Sci. 2008, 50, 2111–2116. [Google Scholar] [CrossRef]
  15. Fan, J.K.; Kou, H.C.; Lai, M.J.; Tang, B.; Li, H.; Chang, J.S. Hot deformation mechanism and microstructure evolution of a new near β titanium alloy. Mater. Sci. Eng. A 2013, 584, 121–132. [Google Scholar] [CrossRef]
  16. Zhang, X.; Cao, L.; Zhao, Y.; Chen, Y.; Tian, X.; Deng, J. Superplastic behavior and deformation mechanism of Ti600 alloy. Mater. Sci. Eng. A 2013, 560, 700–704. [Google Scholar] [CrossRef]
  17. Mosleh, A.; Mikhaylovskaya, A.; Kotov, A.; Pourcelot, T.; Aksenov, S.; Kwame, J.; Portnoy, V. Modelling of the Superplastic Deformation of the Near-α Titanium Alloy (Ti-2.5Al-1.8Mn) Using Arrhenius-Type Constitutive Model and Artificial Neural Network. Metals 2017, 7, 568. [Google Scholar] [CrossRef]
  18. Fan, X.G.; Yang, H.; Gao, P.F. Prediction of constitutive behavior and microstructure evolution in hot deformation of TA15 titanium alloy. Mater. Des. 2013, 51, 34–42. [Google Scholar] [CrossRef]
  19. Alabort, E.; Putman, D.; Reed, R.C. Superplasticity in Ti-6A-4V: Characterisation, modelling and applications. Acta Mater. 2015, 95, 428–442. [Google Scholar] [CrossRef]
  20. Mosleh, A.O.; Mikhaylovskaya, A.V.; Kotov, A.D.; Portnoy, V.K. Arrhenius-Type Constitutive Equation Model of Superplastic Deformation Behaviour of Different Titanium Based Alloys. Defect Diffus. Forum 2018, 385, 45–52. [Google Scholar] [CrossRef]
  21. Bannister, M.; Bannister, M.; Mouritz, A.; Mouritz, A. Introduction to Aerospace Materials; Elsevier: Amsterdam, The Netherlands, 2009; pp. 224–231. [Google Scholar]
  22. Zhang, X.; Chen, Y.; Hu, J. Recent advances in the development of aerospace materials. Prog. Aerosp. Sci. 2018, 97, 35–60. [Google Scholar] [CrossRef]
  23. Moiseyev, V.N. Titanium Alloys: Russian Aircraft and Aerospace Applications; CRC Press: Boca Raton, FL, USA, 2006. [Google Scholar]
  24. Singh, P.; Pungotra, H.; Kalsi, N.S. On the characteristics of titanium alloys for the aircraft applications. Mater. Today Proc. 2017, 4, 8971–8982. [Google Scholar] [CrossRef]
  25. Deng, T.; Li, D.; Li, X.; Ding, P.; Zhao, K. Hot stretch bending and creep forming of titanium alloy profile. Procedia Eng. 2014, 81, 1792–1798. [Google Scholar] [CrossRef]
  26. Odenberger, E.L. Concepts for Hot Sheet Metal Forming of Titanium Alloys; Luleå University of Technology: Luleå, Sweden, 2009. [Google Scholar]
  27. Liu, J.; Tan, M.J.; Aue-U-Lan, Y.; Guo, M.; Castagne, S.; Chua, B.W. Superplastic-like forming of Ti-6Al-4V alloy. Int. J. Adv. Manuf. Technol. 2013, 69, 1097–1104. [Google Scholar] [CrossRef]
  28. Beal, J.D.; Boyer, R.; Sanders, D.; The Boeing Company. Forming of Titanium and Titanium Alloys. In ASM Handbook Metalwork Sheet Form; ASM International: Novelty, OH, USA, 2006; pp. 656–669. [Google Scholar]
  29. Sieniawski, J.; Motyka, M. Superplasticity in titanium alloys. J. Achiev. Mater. Manuf. Eng. 2007, 24, 123–130. [Google Scholar]
  30. Velay, V.; Matsumoto, H.; Vidal, V.; Chiba, A. Behavior modeling and microstructural evolutions of Ti-6Al-4V alloy under hot forming conditions. Int. J. Mech. Sci. 2016, 108–109, 1–13. [Google Scholar] [CrossRef]
  31. Zherebtsov, S.V.; Kudryavtsev, E.A.; Salishchev, G.A.; Straumal, B.B.; Semiatin, S.L. Microstructure evolution and mechanical behavior of ultrafine Ti6Al4V during low-temperature superplastic deformation. Acta Mater. 2016, 121, 152–163. [Google Scholar] [CrossRef]
  32. Kumar, S.D.; Vundavilli, P.R.; Mantry, S.; Mandal, A.; Chakraborty, M. A Taguchi Optimization of Cooling Slope Casting Process Parameters for Production of Semi-solid A356 Alloy and A356-5TiB2 in-situ Composite Feedstock. Procedia Mater. Sci. 2014, 5, 232–241. [Google Scholar] [CrossRef]
  33. Kumar, S.M.R.; Kulkarni, S.K. Analysis of Hard Machining of Titanium Alloy by Taguchi Method. Mater. Today Proc. 2017, 4, 10729–10738. [Google Scholar] [CrossRef]
  34. Taguchi, G.; Konishi, S. Taguchi Methods, Orthogonal Arrays and Linear Graphs: Tools for Quality Engineering; American Supplier Institute: Dearborn, MI, USA, 1987; pp. 35–38. [Google Scholar]
  35. Mersni, W.; Boujelbene, M.; Salem, S.B.; Alghamdi, A.S. Optimization of the surface roughness in ball end milling of titanium alloy Ti-6Al-4V using the Taguchi Method. Procedia Manuf. 2018, 20, 271–276. [Google Scholar] [CrossRef]
  36. Ananth, S.V.; Kalaichelvan, K.; Rajadurai, A. Optimization of Superplastic Forming of Al6063/5% SiCp Composites Using Taguchi Experimental Design. Int. Rev. Mech. Eng. 2012, 6, 1209–1212. [Google Scholar]
  37. Athreya, S.; Venkatesh, Y.D. Application of Taguchi Method for Optimization of Process Parameters in Improving the Surface Roughness of Lathe Facing Operation. Int. Ref. J. Eng. Sci. 2012, 1, 13–19. [Google Scholar]
  38. Babu, J.; Dutta, A.; Kumaraswamy, A. Experimental Studies on Effect of Temperature and Strain Rate on Deformation Behaviour of Ti-6Al-4V Using Taguchi Method. Procedia Mater. Sci. 2014, 6, 1121–1130. [Google Scholar] [CrossRef]
  39. Mikhaylovskaya, A.V.; Mosleh, A.O.; Kotov, A.D.; Kwame, J.S.; Pourcelot, T.; Golovin, I.S.; Portnoy, V. Superplastic deformation behaviour and microstructure evolution of near-α Ti-Al-Mn alloy. Mater. Sci. Eng. A 2017, 708, 469–477. [Google Scholar] [CrossRef]
  40. Chumachenko, E.N.; Portnoi, V.K.; Paris, L.; Billaudeau, T. Analysis of the SPF of a titanium alloy at lower temperatures. J. Mater. Process. Technol. 2005, 170, 448–456. [Google Scholar] [CrossRef]
  41. Langdon, T.G. Achieving superplasticity in ultrafine-grained metals. Mech. Mater. 2013, 67, 2–8. [Google Scholar] [CrossRef]
  42. Nieh, T.G.; Wadsworth, J.; Sherby, O.D. Superplasticity in Metals and Ceramics; Cambridge University Press: Cambridge, UK, 2014. [Google Scholar]
  43. Valiev, R.Z.; Semenova, I.P. Advances in Superplasticity of Ultrafine-Grained Alloys: Recent Research and Development. Mater. Sci. Forum 2016, 838–839, 23–33. [Google Scholar] [CrossRef]
  44. Semioshkina, N.; Voigt, G. An overview on Taguchi Method. J. Radiat. Res. 2006, 47 (Suppl. A), A95–A100. [Google Scholar] [CrossRef] [PubMed]
  45. Ross, P.J. Taguchi Techniques for Quality Engineering: Loss Function, Orthogonal Experiments, Parameter and Tolerance Design, 2nd ed.; McGraw-Hill: New York, NY, USA, 1996. [Google Scholar]
  46. Sergueeva, A.V.; Stolyarov, V.V.; Valiev, R.Z.; Mukherjee, A.K. Superplastic behaviour of ultrafine-grained Ti–6A1–4V alloys. Mater. Sci. Eng. A 2002, 323, 318–325. [Google Scholar] [CrossRef]
  47. Langdon, T.G. Forty-Five Years of Superplastic Research: Recent Developments and Future Prospects. Mater. Sci. Forum 2016, 838–839, 3–12. [Google Scholar] [CrossRef]
  48. Blandin, J.J. Superplasticity of Metallic Alloys: Some Current Findings and Open Questions. Mater. Sci. Forum 2016, 838–839, 13–22. [Google Scholar] [CrossRef]
Figure 1. The superplastic tensile specimen dimensions. (c = d).
Metals 08 00819 g001
Figure 2. Initial microstructure of the investigated alloys: Ti-3%Mo-1%V-4%Al alloy (a); Ti-4%V-6%Al alloy (b); and Ti-1.8%Mn-2.5%Al alloy (c).
Metals 08 00819 g002
Figure 3. The results of the tensile tests of the tested alloys at various temperatures and strain rates: Ti-3%Mo-1%V-4%Al alloy (a,d,g); Ti-4%V-6%Al alloy (b,e,h); and Ti-1.8%Mn-2.5%Al alloy (c,f,i).
Metals 08 00819 g003
Figure 4. Dependence of the σs (ac); elongation to failure (df); and strain hardening/softening coefficient (gi) on temperature and strain rate for the tested alloys: Ti-3%Mo-1%V-4%Al alloy (a,d,g); Ti-4%V-6%Al alloy (b,e,h); and Ti-1.8%Mn-2.5%Al alloy (c,f,i).
Metals 08 00819 g004
Figure 5. Microstructure of the investigated alloys, after annealing for 30 min (ac) and straining of 1.1 in the testing conditions of maximum elongation to failure (df) for the tested alloys: Ti-3%Mo-1%V-4%Al alloy (a,d); Ti-4%V-6%Al alloy (b,e); and Ti-1.8%Mn-2.5%Al alloy (c,f).
Metals 08 00819 g005
Figure 6. Stress at the start of the steady stage (σs) and elongation to failure dependence on both the deformation temperature and strain rate for the tested alloys: Ti-3%Mo-1%V-4%Al alloy (a,d); Ti-4%V-6%Al alloy (b,e); and Ti-1.8%Mn-2.5%Alalloy (c,f).
Metals 08 00819 g006
Figure 7. Dependence of the σs on the temperature and strain rate for the investigated alloys: (a,b) Means of S/N ratios; and (c,d) mean of means.
Metals 08 00819 g007
Figure 8. The dependence of strain hardening/softening on stress and strain for Ti-3%Mo-1%V-4%Al at 2 × 10⁻⁴ s−1 and different temperatures.
Metals 08 00819 g008
Figure 9. Elongation to failure vs temperature and strain rate dependence for the studied alloys: means of the S/N ratios (a,b); and the mean of means (c,d).
Metals 08 00819 g009
Table 1. Range of testing parameters and superplastic tensile specimen dimensions, mm.
AlloyTi-3%Mo-1%V-4%AlTi-4%V-6%AlTi-1.8%Mn-2.5%Al
Testing Temperature Range, °C750–900800–900840–890
Testing Strain Rate Range, s−12 × 10−4–5 × 10−33 × 10−4–3 × 10−32 × 10−4–8 × 10⁻⁴
A161417
R666
B1.2511.55
c/d141414
Table 2. Empirical expressions of the σs and elongation to failure. (Td is the deformation temperature (°C), and ε ˙ is the strain rate (s−1)).
Ti-3%Mo-1%V-4%Al σ s = 8085.6 + 207 × 10 5 T d 32 l n ( ε ˙ ) 1.85 × 10 10 T d 2 13.78 ( l n ( ε ˙ ) ) 2 147495 l n ( ε ˙ ) T d + 5.8 × 10 12 T d 3 0.088   ( l n ( ε ˙ ) ) 3 + 12026 ( l n ( ε ˙ ) ) 2 T d + 1.7 × 10 8 l n ( ε ˙ ) T d 2 R2 = 0.99
% = 564010 1897 T d + 18110.8   l n ( ε ˙ ) + 2.16 T d 2 + 578.15 ( l n ( ε ˙ ) ) 2 32.8 T l n ( ε ˙ ) 8 × 10 4 T d 3 + 32 ( l n ( ε ˙ ) ) 3 + 0.096 T d ( l n ( ε ˙ ) ) 2 + 0.0196 T d 2 l n ( ε ˙ ) R2 = 0.85
Ti-4%V-6%Al σ s = 48669 + 1.26 × 10 8 T d + 107.8   l n ( ε ˙ ) 1.09 × 10 11 T d 2 30.3 ( l n ( ε ˙ ) ) 2 592713 l n ( ε ˙ ) T d + 3.223 × 10 13 T d 3 1.6   ( l n ( ε ˙ ) ) 3 + 1579.7 ( l n ( ε ˙ ) ) 2 T d + 3.248 × 10 8 l n ( ε ˙ ) T d 2 R2 = 0.99
% = 249694 89.68 T d + 1664.8   l n ( ε ˙ ) + 0.9872 T d 2 899.73 ( l n ( ε ˙ ) ) 2 20.9 T d l n ( ε ˙ ) 3.6 × 10 4 T d 3 39.5 ( l n ( ε ˙ ) ) 3 0.056 T d ( l n ( ε ˙ ) ) 2 + 0.0112 T d 2 l n ( ε ˙ ) R2 = 0.91
Ti-1.8%Mn-2.5%Al σ s = 9.015 0.021 T d + 1.2 × 10 5 T d 2 3.2 × 10 3   l n ( ε ˙ ) 1 2 × 10 3 T d + 1.182 × 10 6 T d 2 + 0.0424   l n ( ε ˙ ) + 2.9 × 10 3 ( l n ( ε ˙ ) ) 2 R2 = 0.99
% = 385.9 113.98   l n ( T d ) + 8.415 ( l n ( T d ) ) 2 4.3 × 10 3   l n ( ε ˙ ) 1 0.295 l n ( T d ) + 0.0218 ( l n ( T d ) ) 2 9.15 × 10 6   l n ( ε ˙ ) R2 = 0.97
Table 3. Input levels of the investigated alloys.
AlloyParameterLevels
12345
Ti-3%Mo-1%V-4%AlTd [°C]800825850875900
ε ˙ [s−1] × 10−426102050
Ti-4%V-6%AlTd [°C]825850875900-
ε ˙ [s−1] × 10−4361030-
Ti-1.8%Mn-2.5%AlTd [°C]840865890--
ε ˙ [s−1] × 10−4248--
Table 4. Analysis of variance for the S/N ratios of the σs.
AlloyParameterD.F.Seq SSAdj SSAdj MSFPPc (%)DeltaRank
Ti-3%Mo-1%V-4%AlTemperature4258.35258.3564.59355.460.0043.8292
Strain rate4331.25331.2582.81455.750.0056.1810.611 *
Error162.912.910.18-----
Total24592.51--811.21-100%--
Ti-4%V-6%AlTemperature3174.68174.6858.23166.240.0040.999.002
Strain rate3251.49251.4983.83239.330.0059.0110.611 *
Error93.153.150.35-----
Total15429.32--405.57100%--
Ti-1.8%Mn-2.5%AlTemperature247.6847.6823.8416.530.01232.575.632
Strain rate298.7398.7349.3734.230.00367.437.791 *
Error45.775.771.44-----
Total8152--50.76-100%--
D.F., freedom degrees; SS, sum of squares; MS, mean square; F, F-test; P, Statistical significance; Pc, percentage of contribution; Delta, maximum–minimum variance; and * optimum value.
Table 5. Analysis of variance for the mean of the σs.
AlloyParameterD.F.Seq SSAdj SSAdj MSFPPc (%)DeltaRank
Ti-3%Mo-1%V-4%AlTemperature44694.604694.601173.6529.330.0045.3031.882
Strain rate45668.905668.901417.2435.420.0054.7042.311 *
Error16640.30640.3040.02-----
Total2411,003.80--64.75-100%--
Ti-4%V-6%AlTemperature32169.402169.40723.1219.940.0034.1831.882
Strain rate34177.704177.701392.5638.400.0065.8242.311 *
Error9326.40326.4036.26-----
Total156673.40--58.34-100%--
Ti-1.8%Mn-2.5%AlTemperature2118.58118.5859.296.500.05539.568.92
Strain rate2181.16181.1690.589.930.02860.4410.81 *
Error436.5036.509.12-----
Total8336--16.43-100%--
D.F., freedom degrees; SS, sum of squares; MS, mean square; F, F-test; P, Statistical significance; Pc, percentage of contribution; Delta, maximum–minimum variance; and * optimum value.
Table 6. Analysis of variance for the S/N ratios and mean of the elongation to failure.
AlloysParameterS/N RatioMeans
Pc (%)DeltaRankPc (%)DeltaRank
Ti-3%Mo-1%V-4%AlTemperature52.706.041 *50.893351 *
Strain rate47.304.78249.112732
Error------
Total100%--100%--
Ti-4%V-6%AlTemperature22.171.98219.5695.52
Strain rate77.833.641 *80.44192.51 *
Error------
Total100%--100%--
Ti-1.8%Mn-2.5%AlTemperature77.393.081 *79.15151.71 *
Strain rate22.611.78220.85852
Error------
Total100%--100%--
Pc, percentage of contribution; Delta, maximum–minimum variance; and * optimum value.
Table 7. Analysis of variance for the S/N ratios and the mean of the strain hardening/softening coefficient.
AlloysParameterS/N RatioMeans
Pc (%)DeltaRankPc (%)DeltaRank
Ti-3%Mo-1%V-4%AlTemperature89%17.9193%0.371
Strain rate11%6.827%0.12
Error------
Total100%--100%--
Ti-4%V-6%AlTemperature28%8.9245%0.272
Strain rate72%15.2155%0.31
Error------
Total100%--100%--
Ti-1.8%Mn-2.5%AlTemperature91%7190%0.21
Strain rate9%2.41210%0.062
Error------
Total100%--100%--
Pc, percentage of contribution; Delta, maximum–minimum variance.

