Heat Treatment Optimization in Al-Cu-Mg-Si Alloys, with or without Prior Deformation
by
 ,
,
Jose Florentino Alvarez-Antolin
1,*, 
Elvira Segurado-Frutos
1,
Hilario Neira-Castaño
1 and
Juan Asensio-Lozano
2 1
Departamento de Ciencia de los Materiales e Ingeniería Metalúrgica, Edificio departamental Este, Universidad de Oviedo, C/ Wifredo Ricart s/n, 33204 Gijón, Asturias, Spain
2
Departamento de Ciencia de los Materiales e Ingeniería Metalúrgica, Escuela de Ingeniería de Minas, Energía y Materiales, Universidad de Oviedo, C/ Independencia 13, 33004 Oviedo, Asturias, Spain
*
Author to whom correspondence should be addressed.
Metals 2018, 8(10), 739; https://doi.org/10.3390/met8100739
Submission received: 3 September 2018
/
Revised: 14 September 2018
/
Accepted: 18 September 2018
/
Published: 20 September 2018
Abstract
:The properties of Al-Cu-Mg alloys simultaneously depend on dissolving the maximum amount of Cu and Mg in the solution treatment and on achieving optimal ageing. The aim of this study is to analyze the effect on an Al-Cu4.5-Mg1.5-Si0.75 alloy, manufactured by continuous casting and hot rolling until achieving a reduction in its cross-section greater than 90%, of the dwell time at the solution temperature, 495 °C (4, 8, and 24 h), of the different ageing temperatures (160, 180, and 200 °C), and of cold rolling prior to ageing. The microstructural variations underwent the material during its manufacturing process, form its continuous casting to subsequent hot rolling, were analyzed by means of optical microscopy (OM) and scanning electronic microscopy (SEM), with characteristic energy dispersive X-ray (EDX) microanalysis. The crystalline phases present after the different solution and natural ageing treatments were identified and quantified by means of X-ray diffraction (XRD), concluding that Mg is easier to dissolve than Cu. The transient states associated with the Mg2Si phase are the most abundant. However, the longer the dwell time at the solution temperature, the greater the weight percentage of the transient states associated with the Al2Cu phase during ageing. The higher the ageing temperature, the faster the peak hardness is reached, but the lower its value. The ageing temperature that allows the highest hardness to be obtained was 160 °C. The maximum hardness value reached was 162 HV, obtained after a solution treatment at 495 °C for 4 h and ageing at 160 °C for 50 h. By means of prior cold rolling, the peak hardness values are reached more quickly and their values slightly exceed those obtained without this deformation. With ageing at 180 °C, 168 HV are reached after 6 h at this temperature.
1. Introduction
Al-Cu-Mg alloys are widely used both in the aeronautical industry and in the automotive industry to manufacture structural elements. In addition to depending on their chemical composition, their mechanical properties are also determined by the solution heat treatment, quench rate, and ageing heat treatment employed. In the solution heat treatment, the aim is to dissolve the phases containing Cu and Mg and eliminate possible interdendritic chemical segregations derived from a non-equilibrium cooling. The maximum temperature at which this treatment can be carried out will depend on the content in Cu and Mg. When the percentage by weight of Cu exceeds 4%, and the percentage of Mg exceeds 1.5%, the ternary eutectic reaction of equilibrium between the liquid phases, the α solid solution, CuMgAl2, and CuAl2 may take place at 508 °C [1].
In order to exploit the entire ageing potential of these alloys, the highest amounts of Cu and Mg possible should be dissolved in the solid solution [2]. If the temperature exceeds 500 °C, there is a risk of “scorching” [3], producing localized melting of the ternary eutectic. However, if the temperature were lower than 480 °C, the dissolving of Cu and Mg would not occur. Moreover, it should be kept in mind that an increase in Cu content up to 4.5% leads to an increase in the maximum hardness obtained during ageing [4]. Additions of Si and Fe promote the formation of Mg2Si and of insoluble phases such as Al12Fe3Si, Al7Cu2Fe, and Al6(Fe, Cu), which can have a negative effect on this ageing potential [5]. The CuAl2 and Mg2Si phases are easier to dissolve due to the high solubility of Cu and Mg in the α phase. However, the solubility of Fe in Al and Si in Al alloyed with Mg are very low [5].
The high level of saturation and the high concentration of vacancies that the α phase presents after quenching promote the rapid formation of Guinier–Preston (GP) zones [6]. These clusters have a high concentration of solute and maintain absolute coherence with the matrix, although elastic stresses are induced around them by the difference in size between the atoms of the solute and those of the solvent. At this point, there is an increase in hardness, as these GP zones are a major obstacle to the displacement of dislocations. Metastable transition precipitates, perfectly coherent with the matrix, nucleate from these zones [7]. By diffusion of the solute atoms from the matrix, these precipitates increase in size, while others, smaller in size, re-dissolve. When the precipitates reach a certain critical size, the interfacial bond is broken, making them no longer coherent with the matrix. The increase in strength is defined by the size of the precipitates, their distribution, and their coherence with the matrix. The interaction of these precipitates with the dislocations may be described by the Friede effect and by the Orowan mechanism [2]. The main metastable precipitates, perfectly coherent with the matrix, responsible for the hardening of Al-Cu-Mg-Si alloys are β”(Mg2Si), θ”(CuAl2), and Q”(Al5Mg8Si6Cu2) precipitates [2,8]. The temperatures employed in the artificial ageing of these alloys range between 150 and 210 °C [2]. Wang et al., suggest that formation of the θ’ phase does not actually take place if the Cu content does not exceed 1% [9]. Furthermore, a greater influence on the peak hardness is attributed to the precipitation of the β” phase [9,10]. All this justifies the need to ensure that a maximum of Cu and Mg is dissolved prior to the ageing treatment.
Cold rolling deformation generates an increase in the density of dislocations. Previous studies carried out on Al-Cu-Mg alloys and Al-Zn-Mg alloys coincide in concluding that deformations prior to ageing allow the peak hardness to occur at shorter ageing times [3,11,12,13,14,15,16]. The increase in dislocation density seems to increase the density of the precipitates, reducing their size [11]. However, in the case of Al-Cu-Mg-Si alloys, there are no studies that correlate hardening by ageing with prior cold rolling deformation. In this paper, starting out from the Al-Cu4.5-Mg1.5-Si0.75 alloy, the aim is to jointly define the optimal duration of the solution treatment at 495 °C and the most suitable parameters of the ageing treatment (temperature and duration) to obtain maximum hardness. The selected temperature for the solution treatment was the highest possible so as to facilitate the dissolution of Cu and Mg without scorching occurring. At this temperature, the solubility of Cu and Mg in Al is 3.7% and 1.4%, respectively [17]. The duration of the treatment depends on the contents in Cu and Mg, being greater at a lower Mg content. For instance, Han et al., suggest 8 h with 3.5% Cu at 490 °C or 4 h with Mg contents in the alloy [18]. The ageing temperatures for alloys of the Al-Cu-Mg-Si system are restricted to the 150–210 °C range [2]. We hence selected the temperatures 160, 180, and 200 °C in this study. Moreover, this paper compares the results thus obtained with those obtained when the material is cold rolled following the solution treatment. This will allow metal forming companies to select the most suitable temperature and duration of the ageing treatment depending on whether the material has been plastically deformed (rolled) or not. Moreover, the microstructural changes this alloy undergoes from its continuous casting at 700 °C (temperature taken in the casting tundish), subsequent hot rolling in two stages in a range of temperatures from 470 to 450 °C, and successive solution treatment at 495 °C, with different dwell times, and cooling in water are analyzed. During the hot rolling process, the material undergoes a 90% reduction in its cross-section. The study was carried out at an industrial scale on finished product in the form of wire rod.
2. Materials and Methods
The alloy is cast in a tundish at a temperature of 700 °C, from which the molten metal is channeled into a U-shaped circular copper die cooled with water, producing a bar with a rectangular cross-section. This is then transported by rollers to the rolling mills where the bar is transformed into 15 mm diameter wire rod, working within a temperature range of between 470 and 450 °C. Once this process is finished, the material is water cooled to a temperature of around 50–60 °C. The resulting microstructure was analyzed using specimens obtained from the finished product.
Subsequently, three solution treatments were carried out at 495 °C to avoid incipient fusion [19], employing different dwell times at this temperature: one of 4 h, another of 8 h, and third of 24 h. The aim of this last dwell time was to carry out a long treatment and compare the solution of the phases containing Cu and Mg with the two previous treatments. Cooling was carried out in water at 15 °C. The resulting microstructure was analyzed in the three cases. The phases present after 1000 h of natural ageing were identified and quantified by means of X-ray diffraction (XRD, PANalytical, Almelo, The Netherlands). The diffractograms were obtained on a Philips X’Pert Pro diffractometer (PANalytical, Almelo, The Netherlands) belonging to the Scientific-Technical Services, University of Oviedo (Spain). A fine focus Cu ceramic tube located in the fixed primary arm was used to produce X-rays, operating under 45 kV × 40 mA working conditions. The diffracted radiation was analyzed on an X’Celerator detector (PANalytical, Almelo, The Netherland) equipped with a secondary monochromator that filters the signal to the K doublet (1.54056–1.54439 Å) of the Cu anode. The recordings were made in continuous mode, over the two ranges between 10° and 90°, employing an angular step and count time of 0.0084° and 128 s, respectively. Conventional reference–intensity ratio (RIR) method [20] was used to estimate the weight fraction of the crystalline phases by means of semi-quantitative analysis.
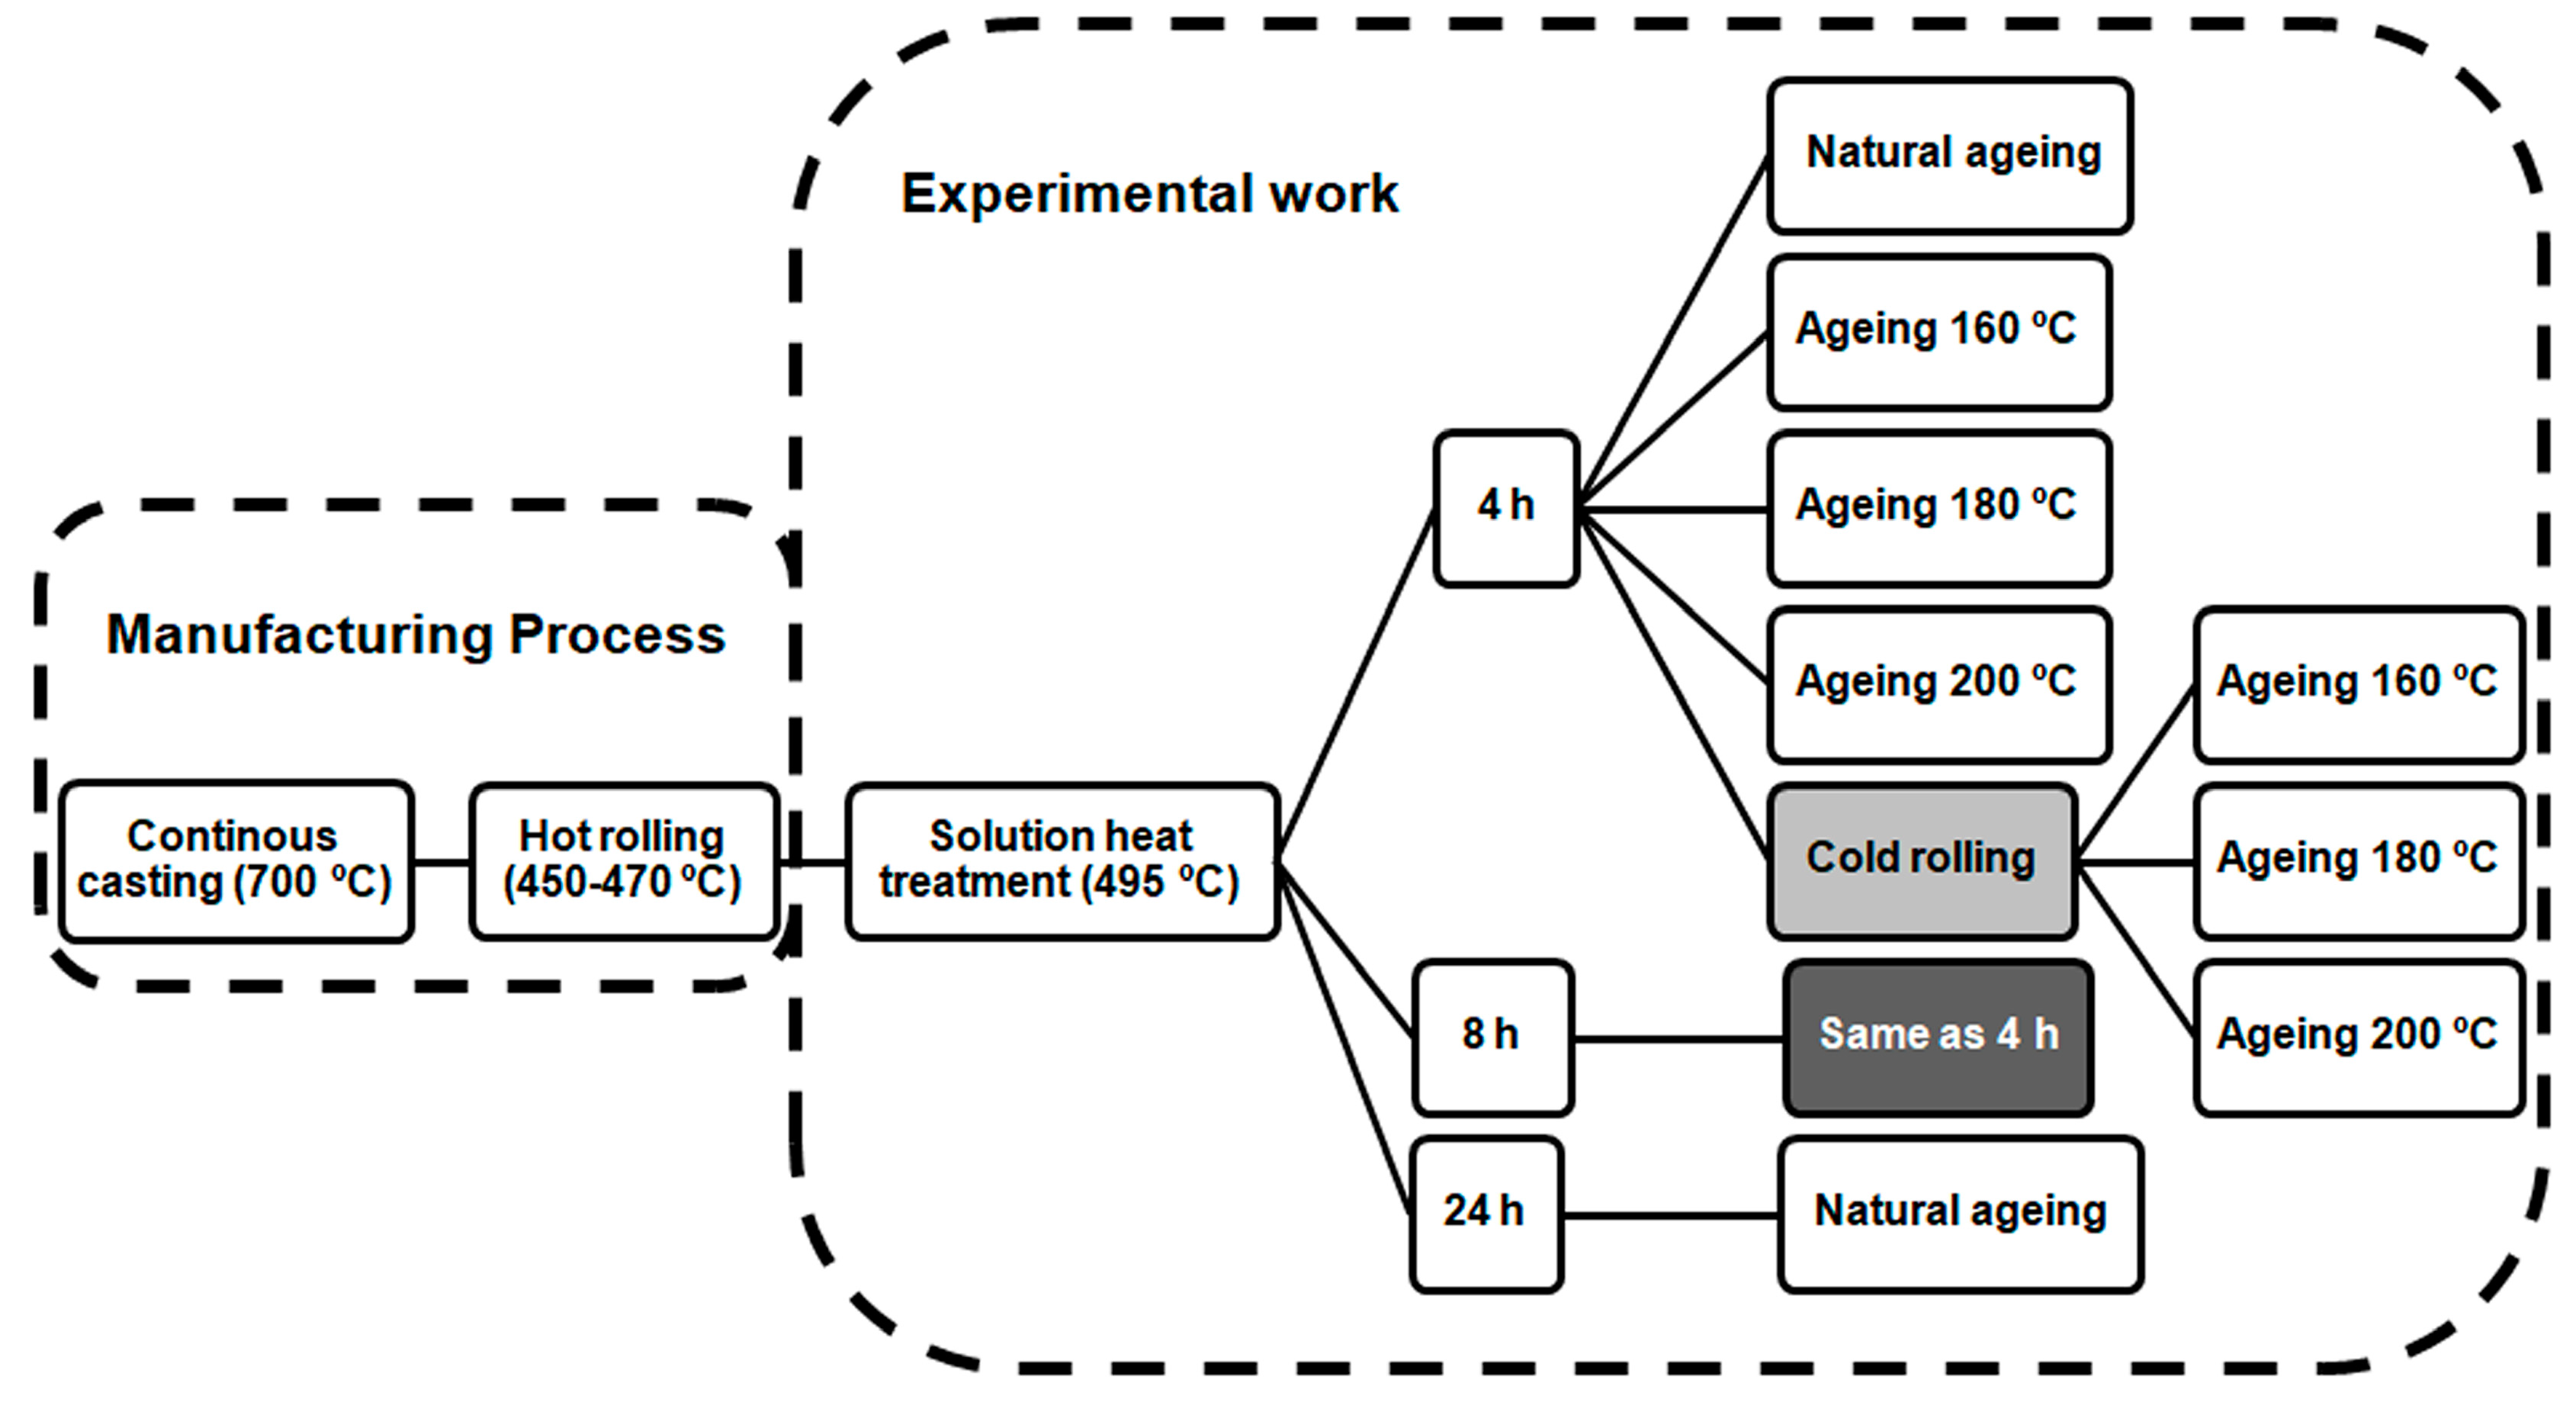
Several ageing treatments were carried out at three different temperatures on specimens treated for 4 and 8 h at 495 °C: 160, 180, and 200 °C. Other specimens that had previously been treated for 4 and 8 h at 495 °C were rolled at room temperature to obtain a true deformation of 0.25 (25%). They were then subjected immediately (in a period of less than 20 min) to ageing treatments at 160, 180, and 200 °C employing different dwell times at these temperatures. The deformation was carried out on 10 mm thick specimens by means of eight rolling passes in 75 mm diameter work-rolls rotating at a linear velocity of 65 mm/s. Hardness was determined after the different dwell times in order to determine the hardness peak for each ageing temperature and compare its value and time of appearance with the homologous samples that had been previously rolled. Figure 1 shows a schematic of the process that has been followed.
Metallographic inspection was carried out by means of optical microscopy (Nikon, Tokyo, Japan) and scanning electron microscopy (JEOL, Nieuw-Vennep, The Netherlands). A semi-quantitative analysis of the main elements present in the precipitated phases was carried out by means of characteristic energy dispersive X-ray (EDX, JEOL, Nieuw-Vennep, The Netherlands) microanalysis. The optical microscope employed was a NIKON Epiphot 200, the images being obtained using the Omnimet Enterprise Image Analysis System (Enterprise, BFuehler, Lake Bluff, IL, USA). The electron microscope used was a JEOL JSM-5600. The images were taken in an intermediate zone between the periphery and the center of the cross-section of the wire rod. Preparation of the metallographic samples was carried out via the process of cutting with a SiC disc, cold-drawing in plastic resin, roughing on SiC paper using different sizes of abrasive grain, from grit 240 to 600, and, finally, polishing with textile cloths spread with 6 and 1 micron diamond paste and lubricant. The samples were inspected without chemical etching, solely in the polished state.
Vickers hardnesses were obtained under the application of a 300 g load. The results correspond to the average value obtained from 10 indentations in each specimen. The hardnesses were measured in an intermediate zone between the periphery and the center of one of the cross-sections of the sample.
3. Results and Discussion
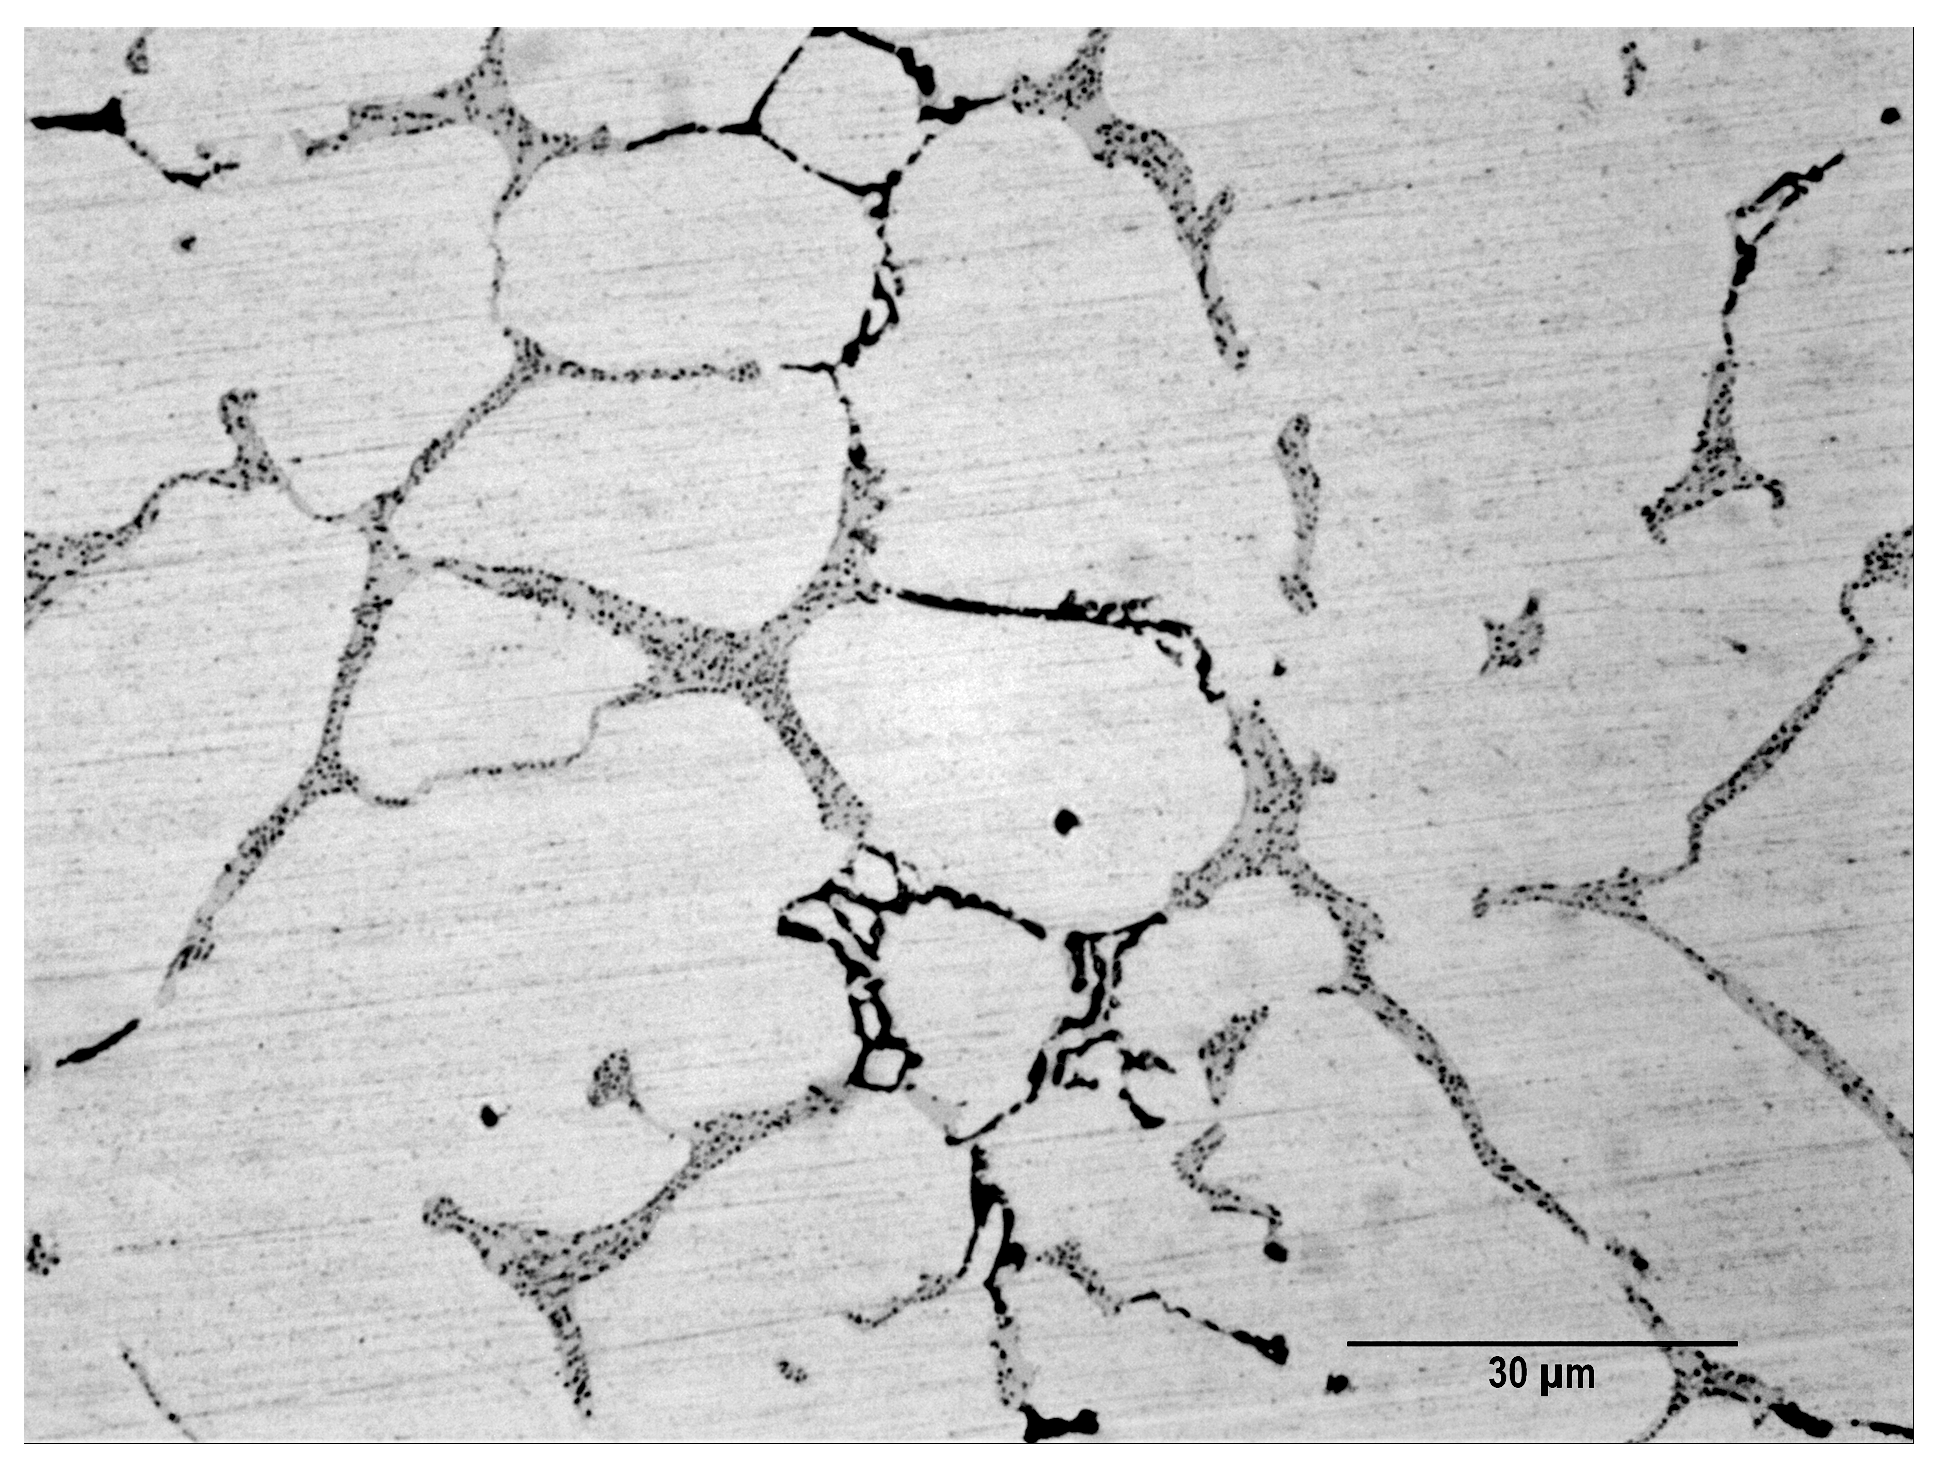
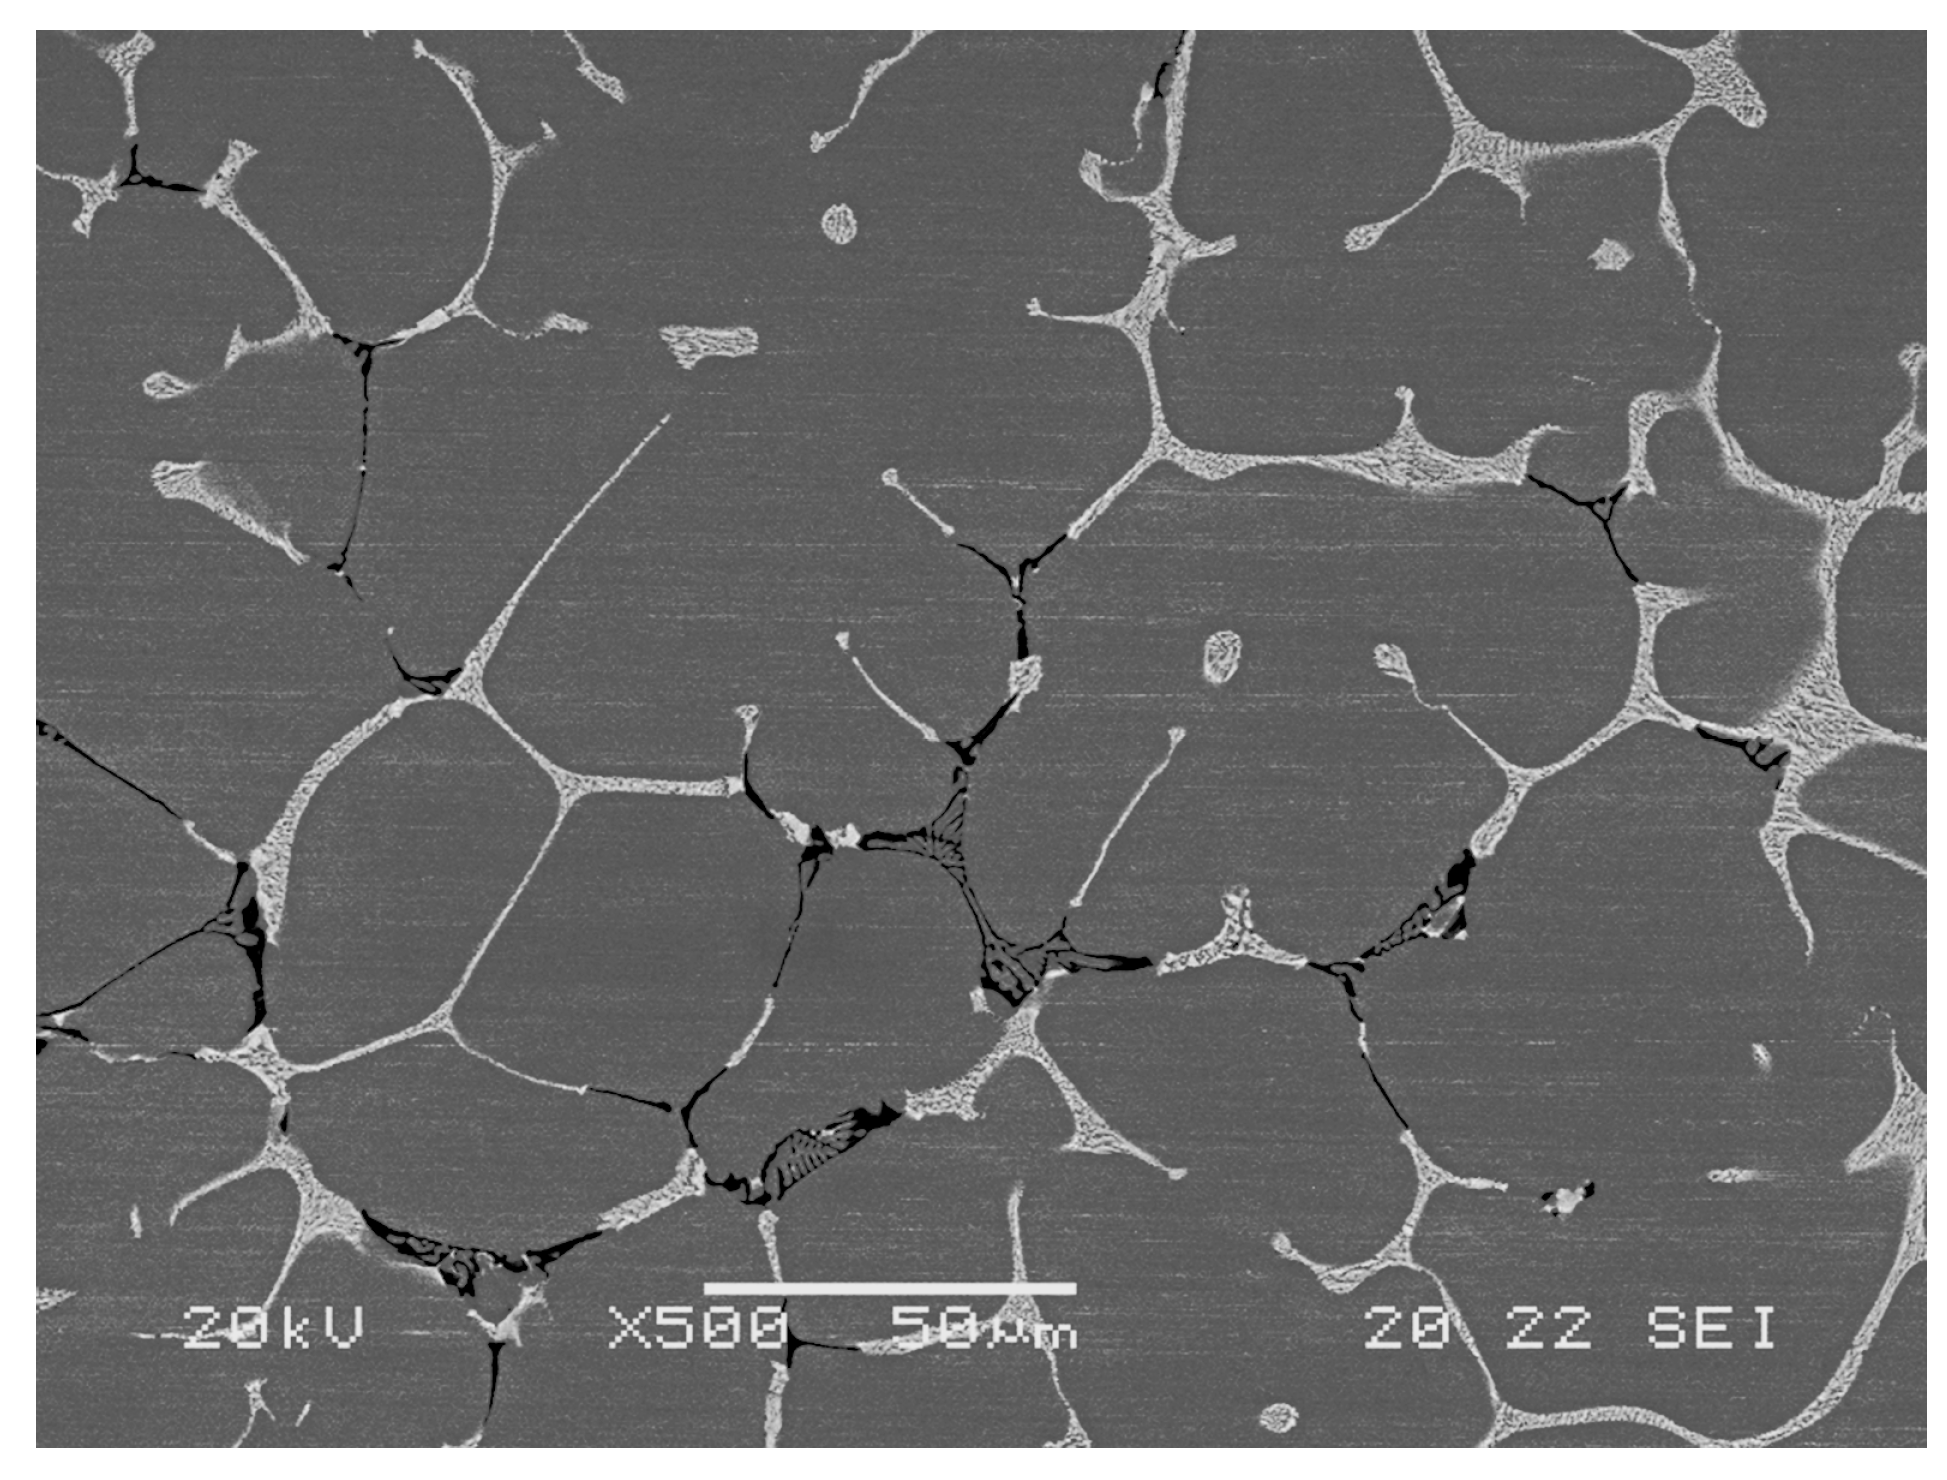
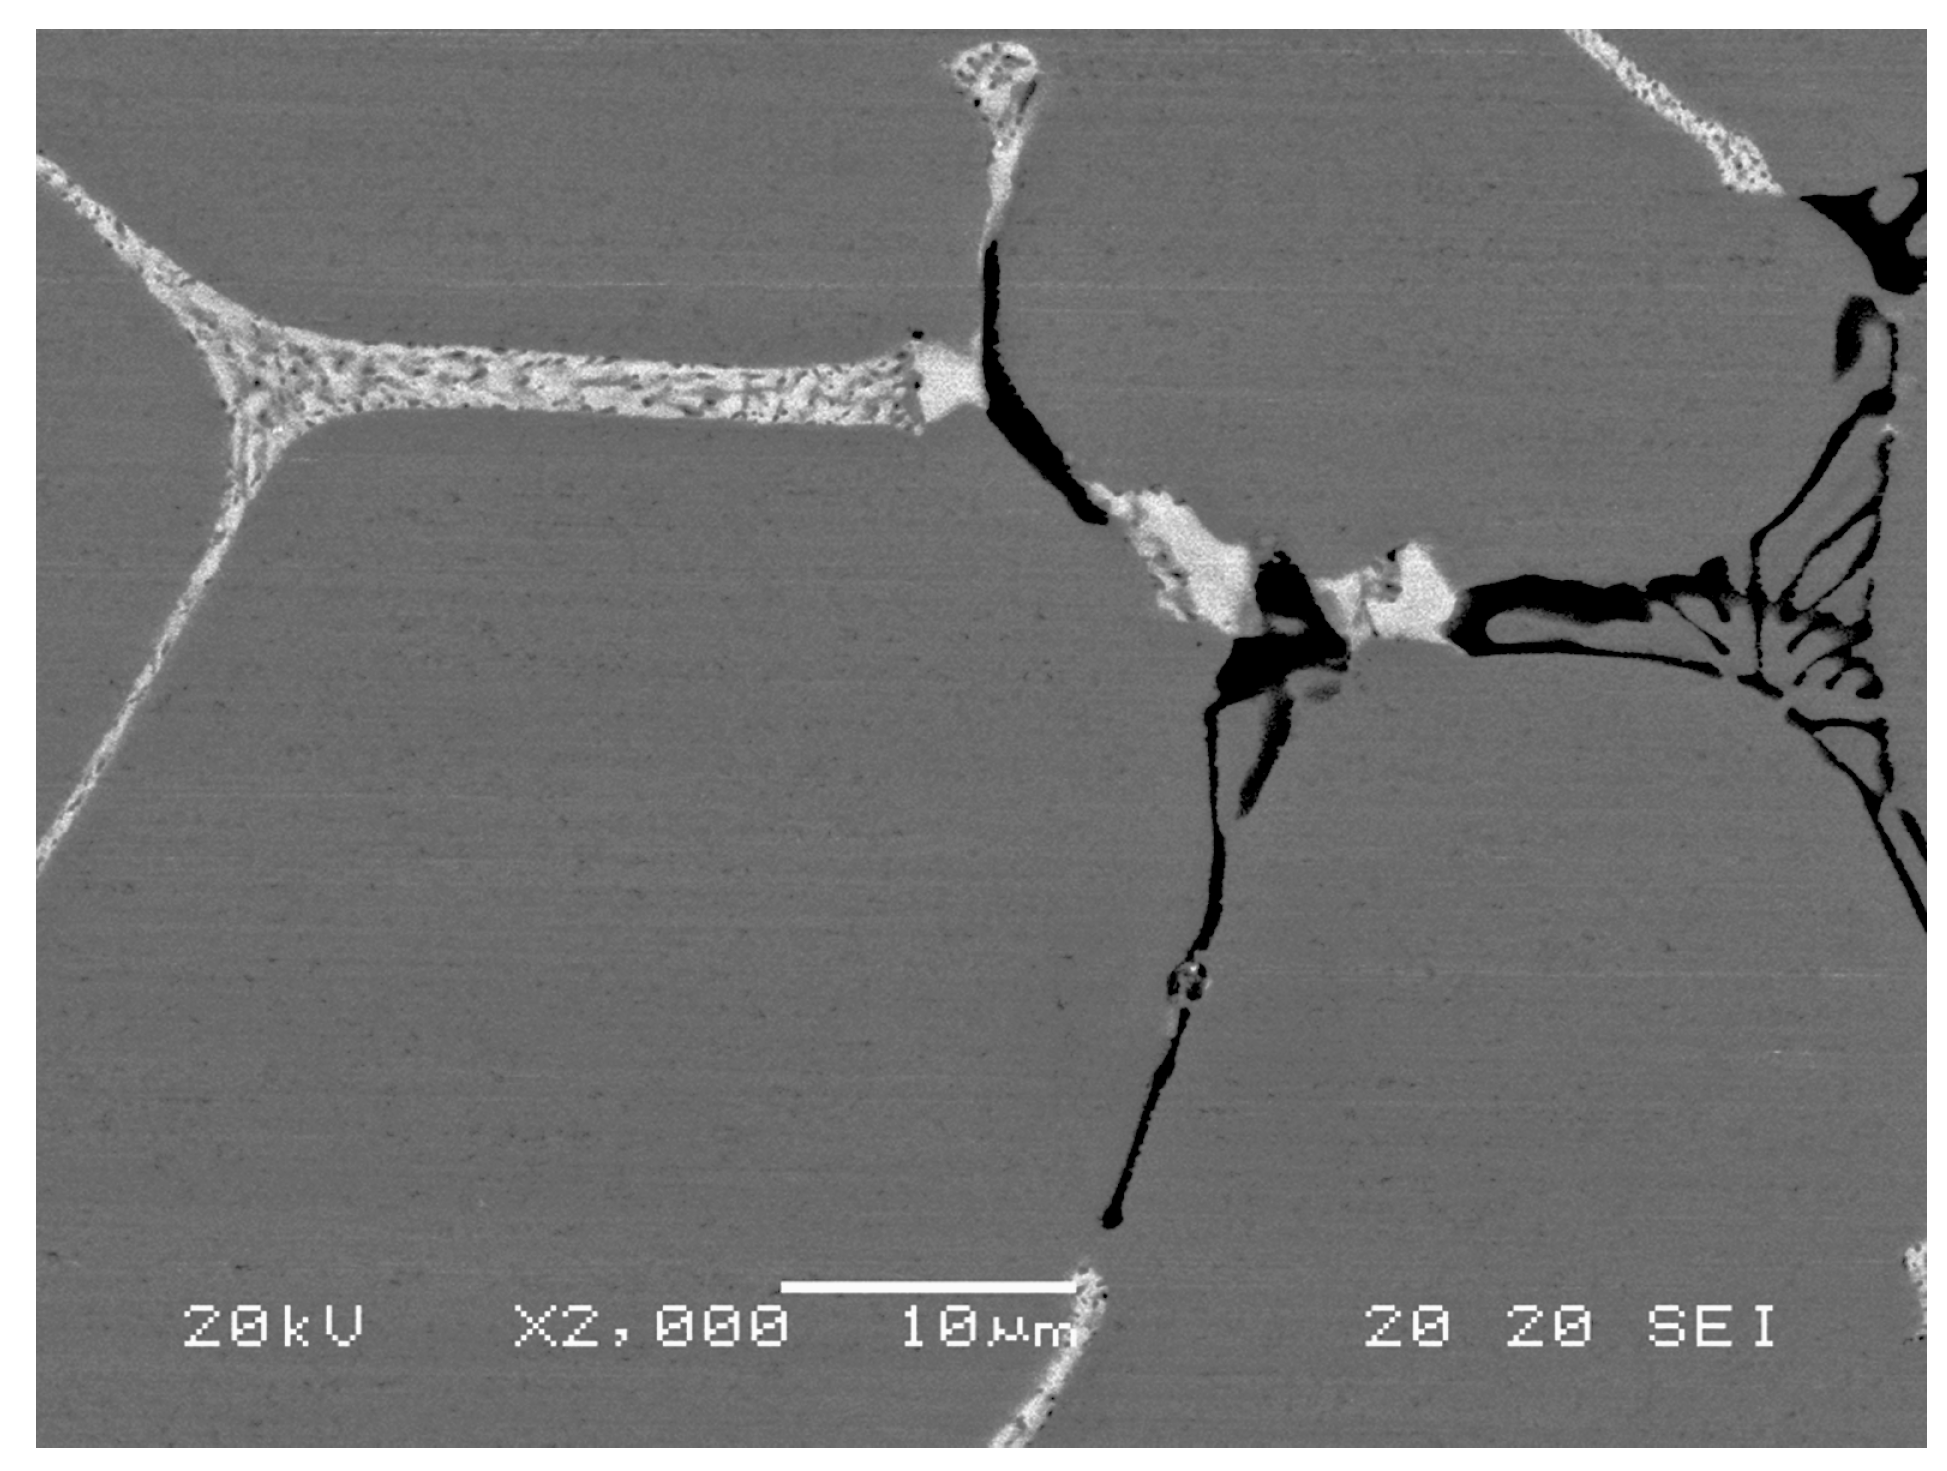
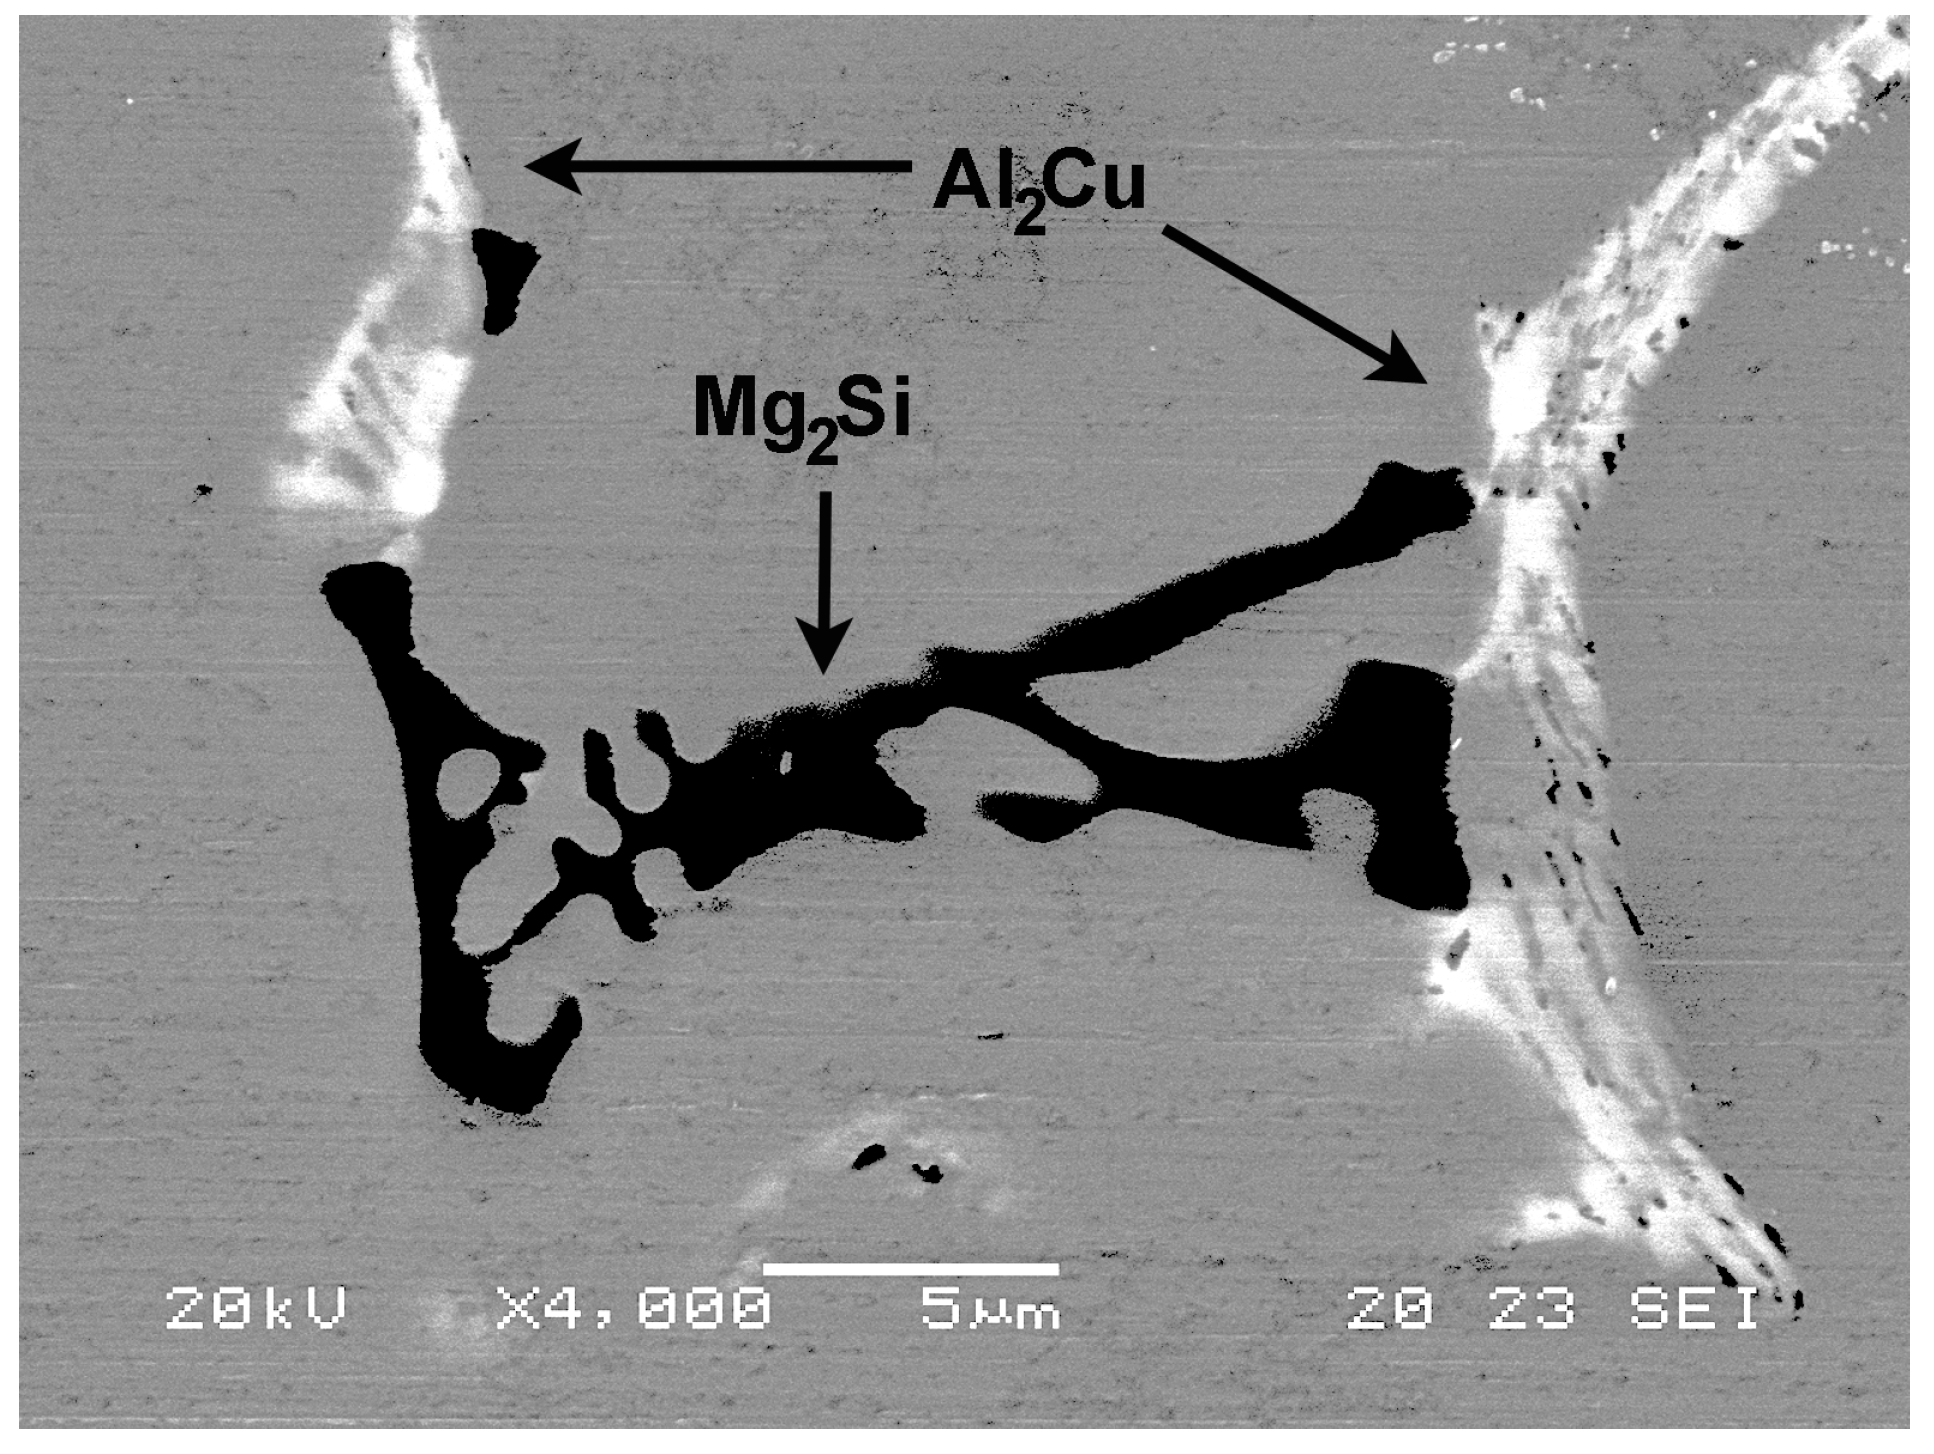
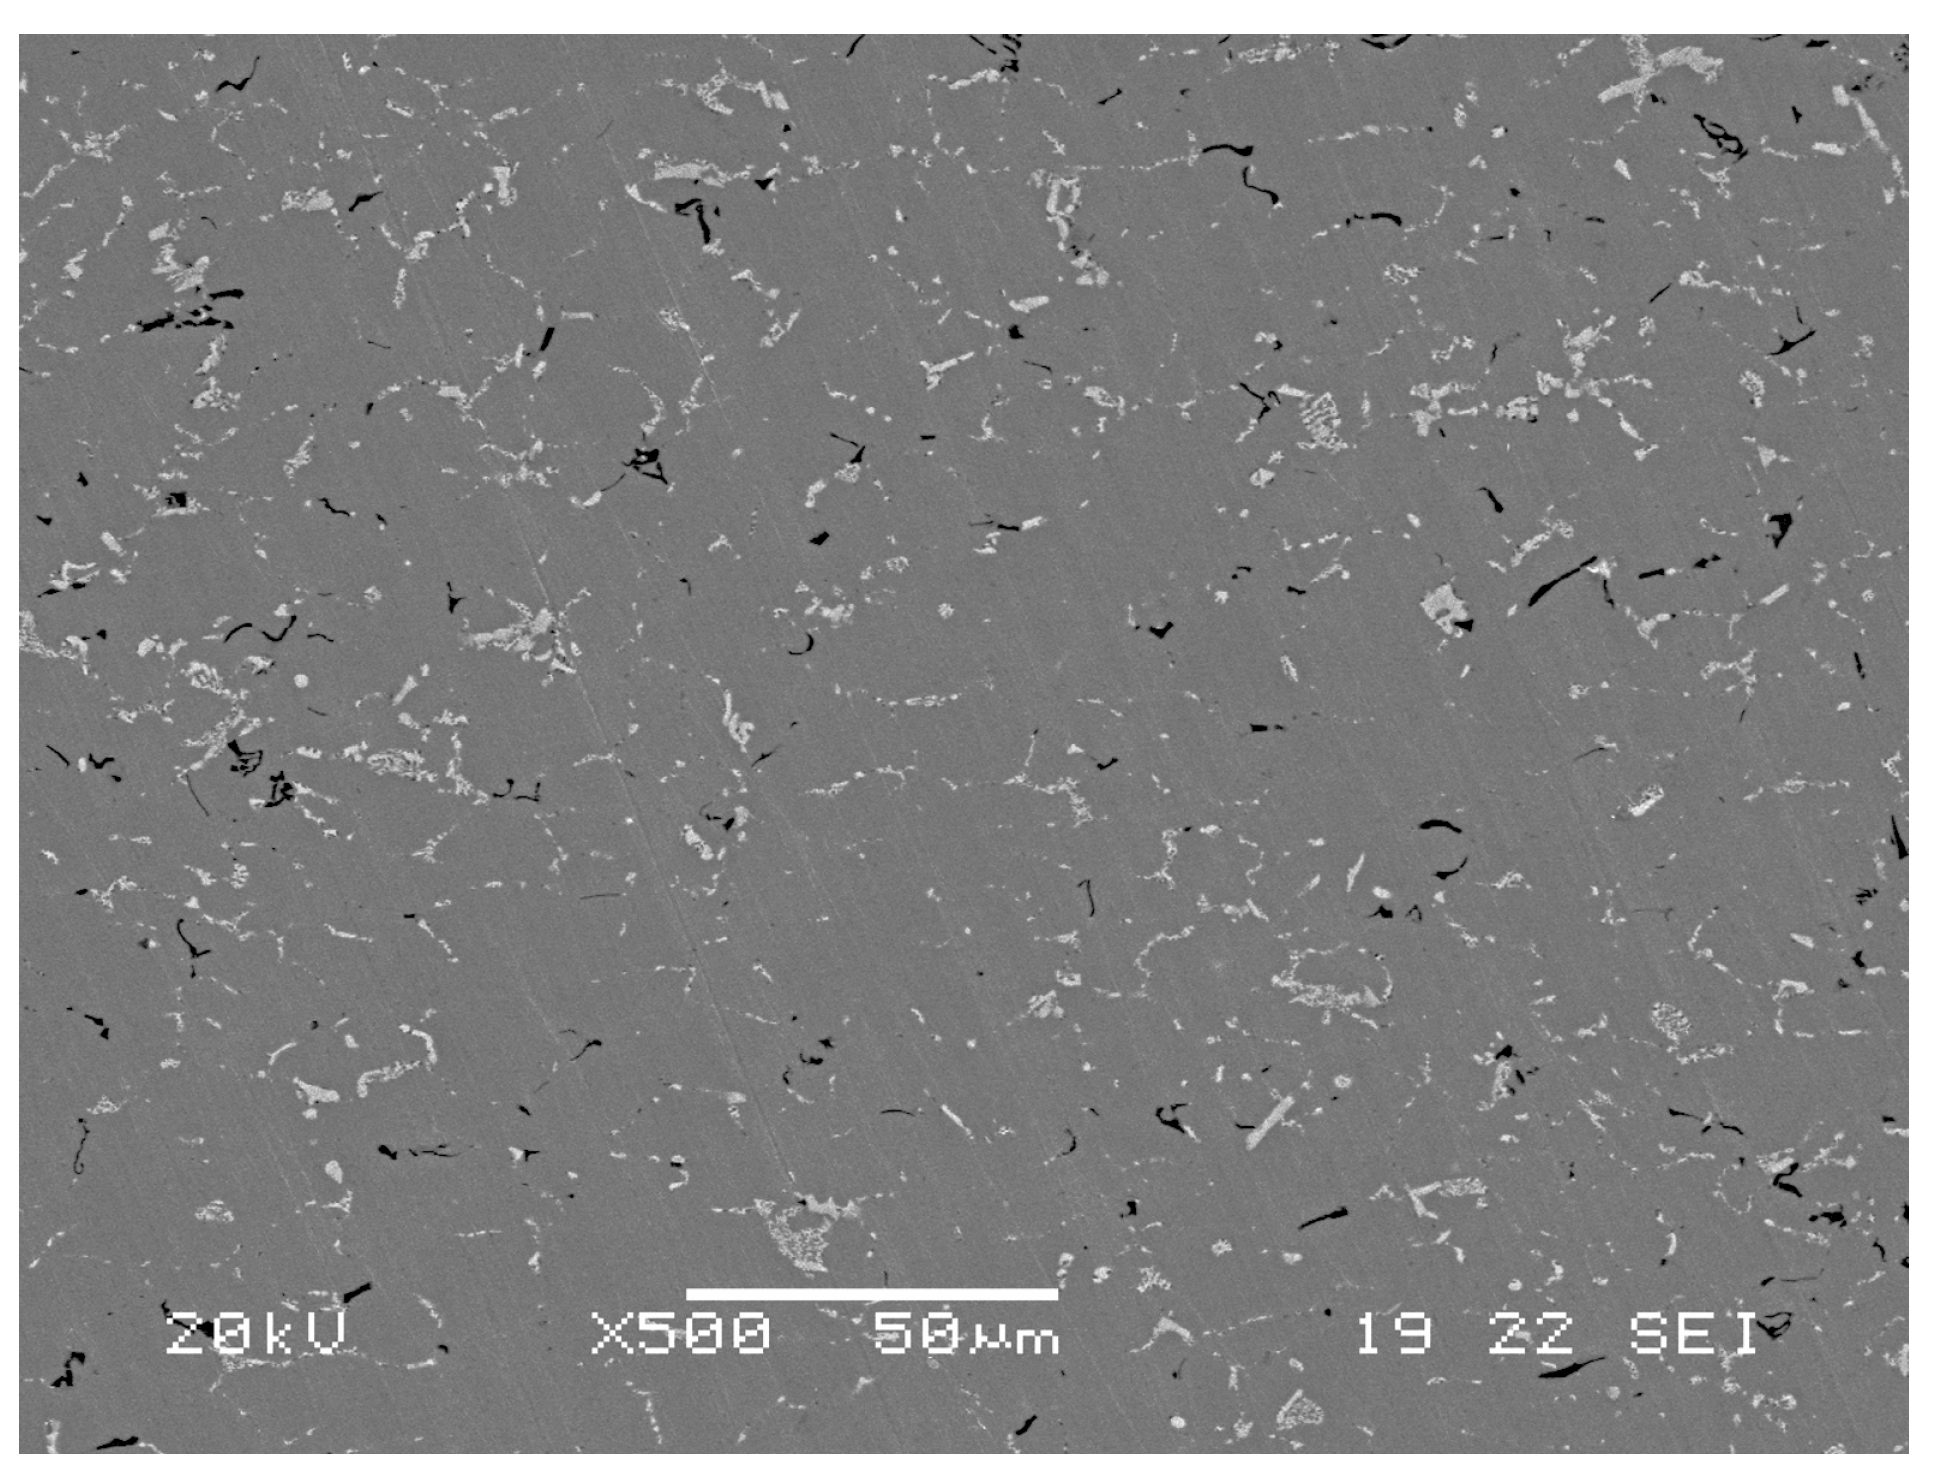
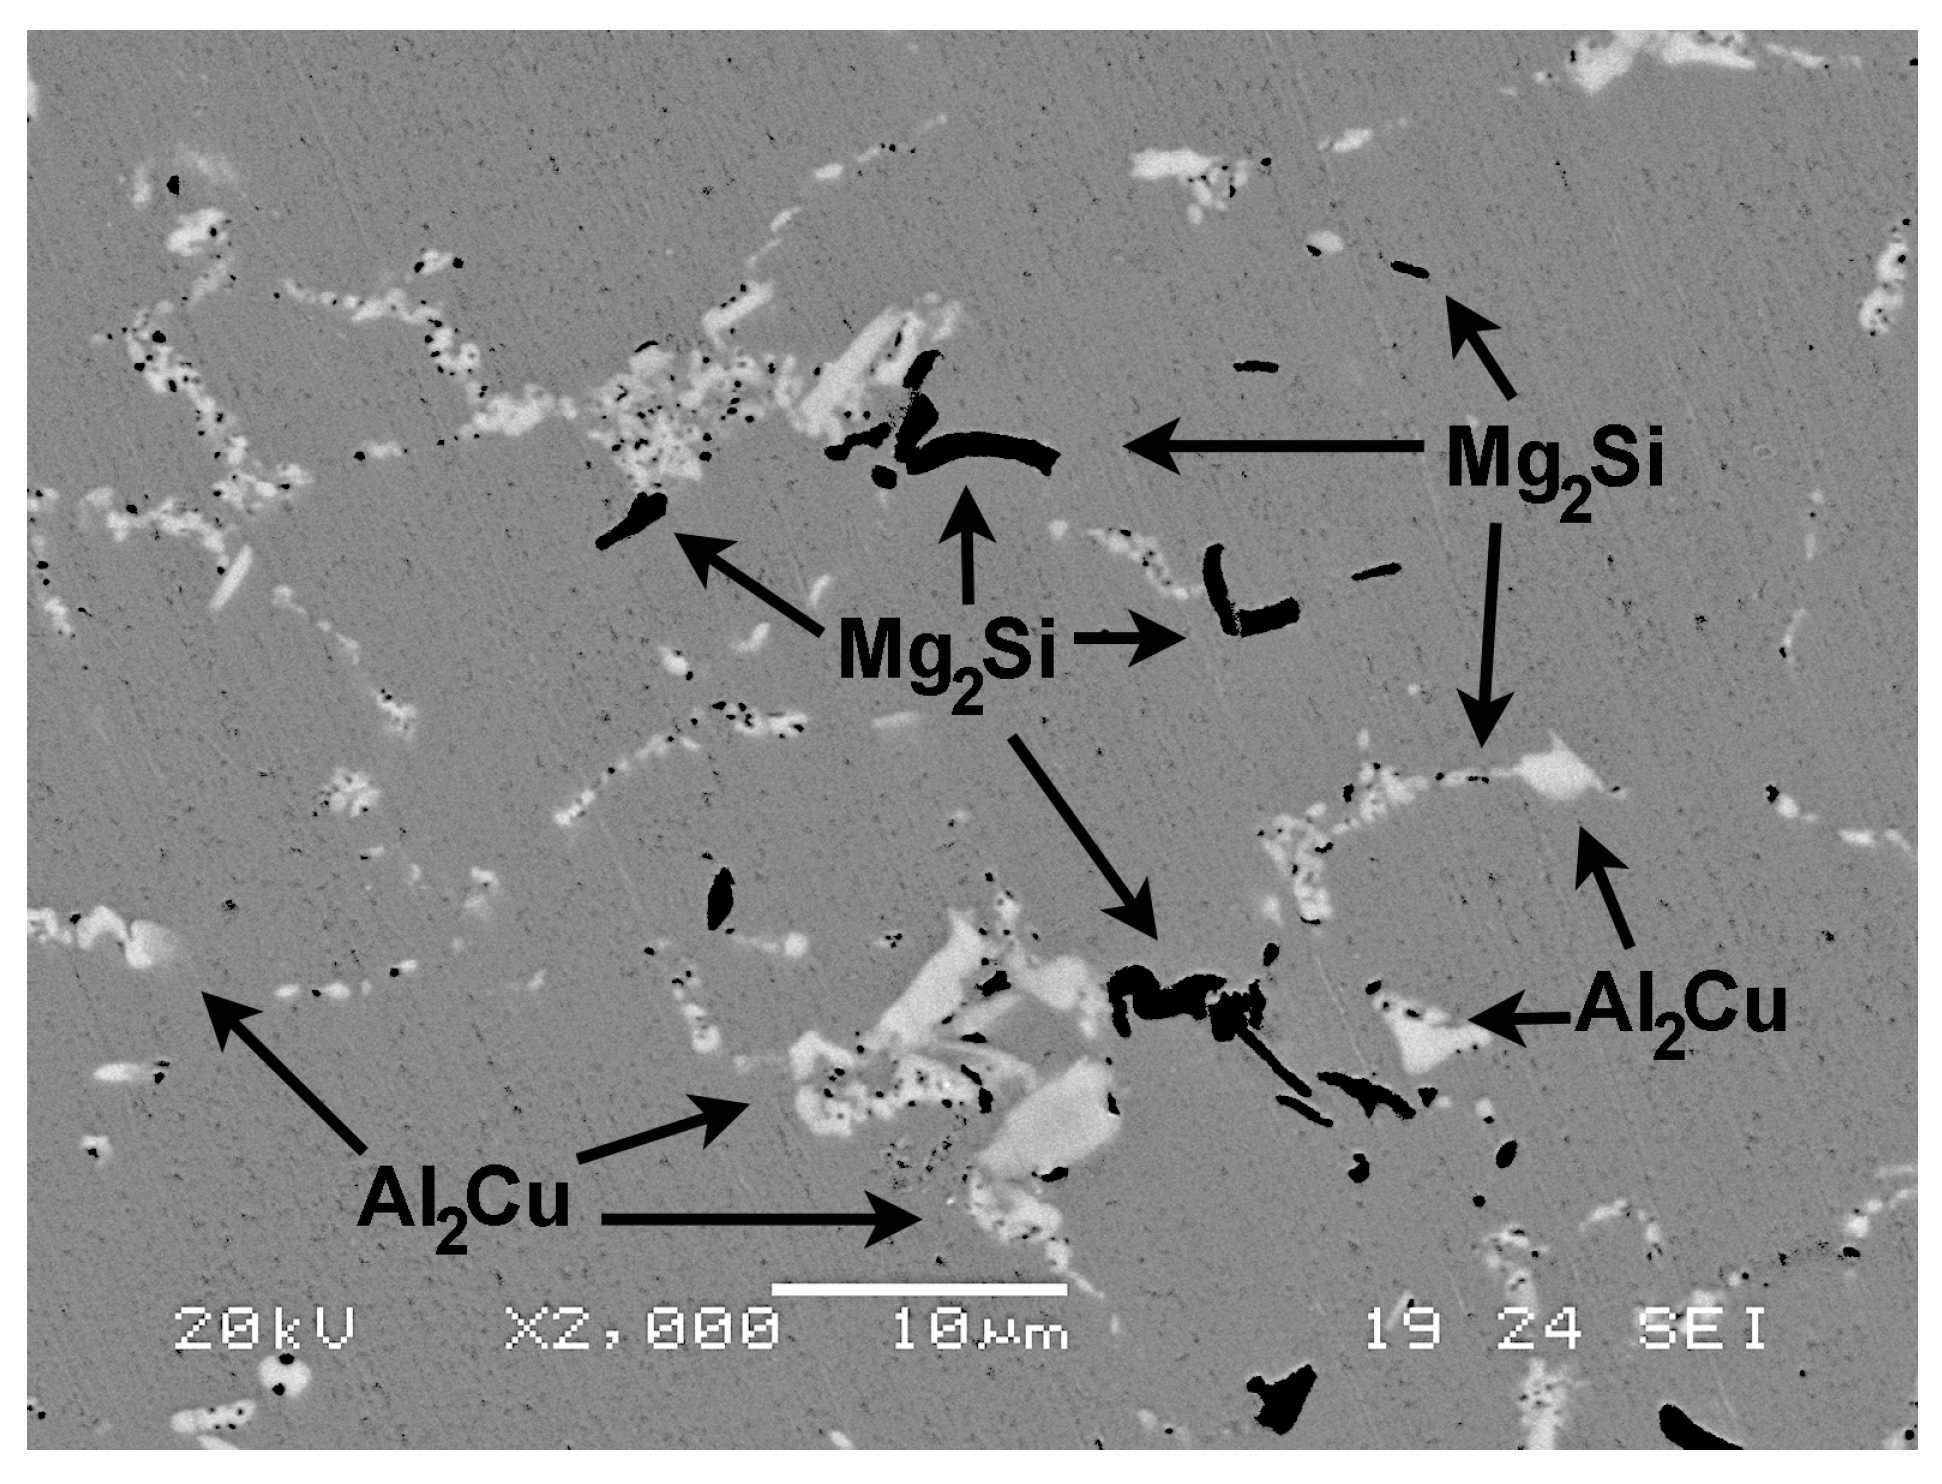
Table 1 shows the chemical composition of the Al-Cu4.5-Mg1.5-Si0.75 alloy under study. Figure 2, Figure 3, Figure 4 and Figure 5 show the microstructure obtained after continuous casting. In Figure 5, the Mg2Si and Al2Cu particles are identified as the main phases detected by the semi-quantitative analysis carried out by EDX. Figure 6 shows the microstructure obtained after hot rolling, during which a 90% reduction in cross-section is obtained. A finer microstructure can be seen as a result of the hot dynamic restoration and the hot static recrystallization the material underwent [21], which implies a refining of the grain size [22]. Furthermore, during this process, the fragmentation of the particles that had precipitated during the solidification takes place, losing their continuity in the grain joints. Figure 7 identifies, by EDX, the Mg2Si and Al2Cu phases as the main phases present after rolling. Dark spots appear within the Al2Cu network that were identified as Mg2Si via the semi-quantitative analysis by EDX. This phase precipitates at a higher temperature than the Al2Cu phase, so it may be assumed that its precipitation has ceased when the precipitation of the Al2Cu network begins.
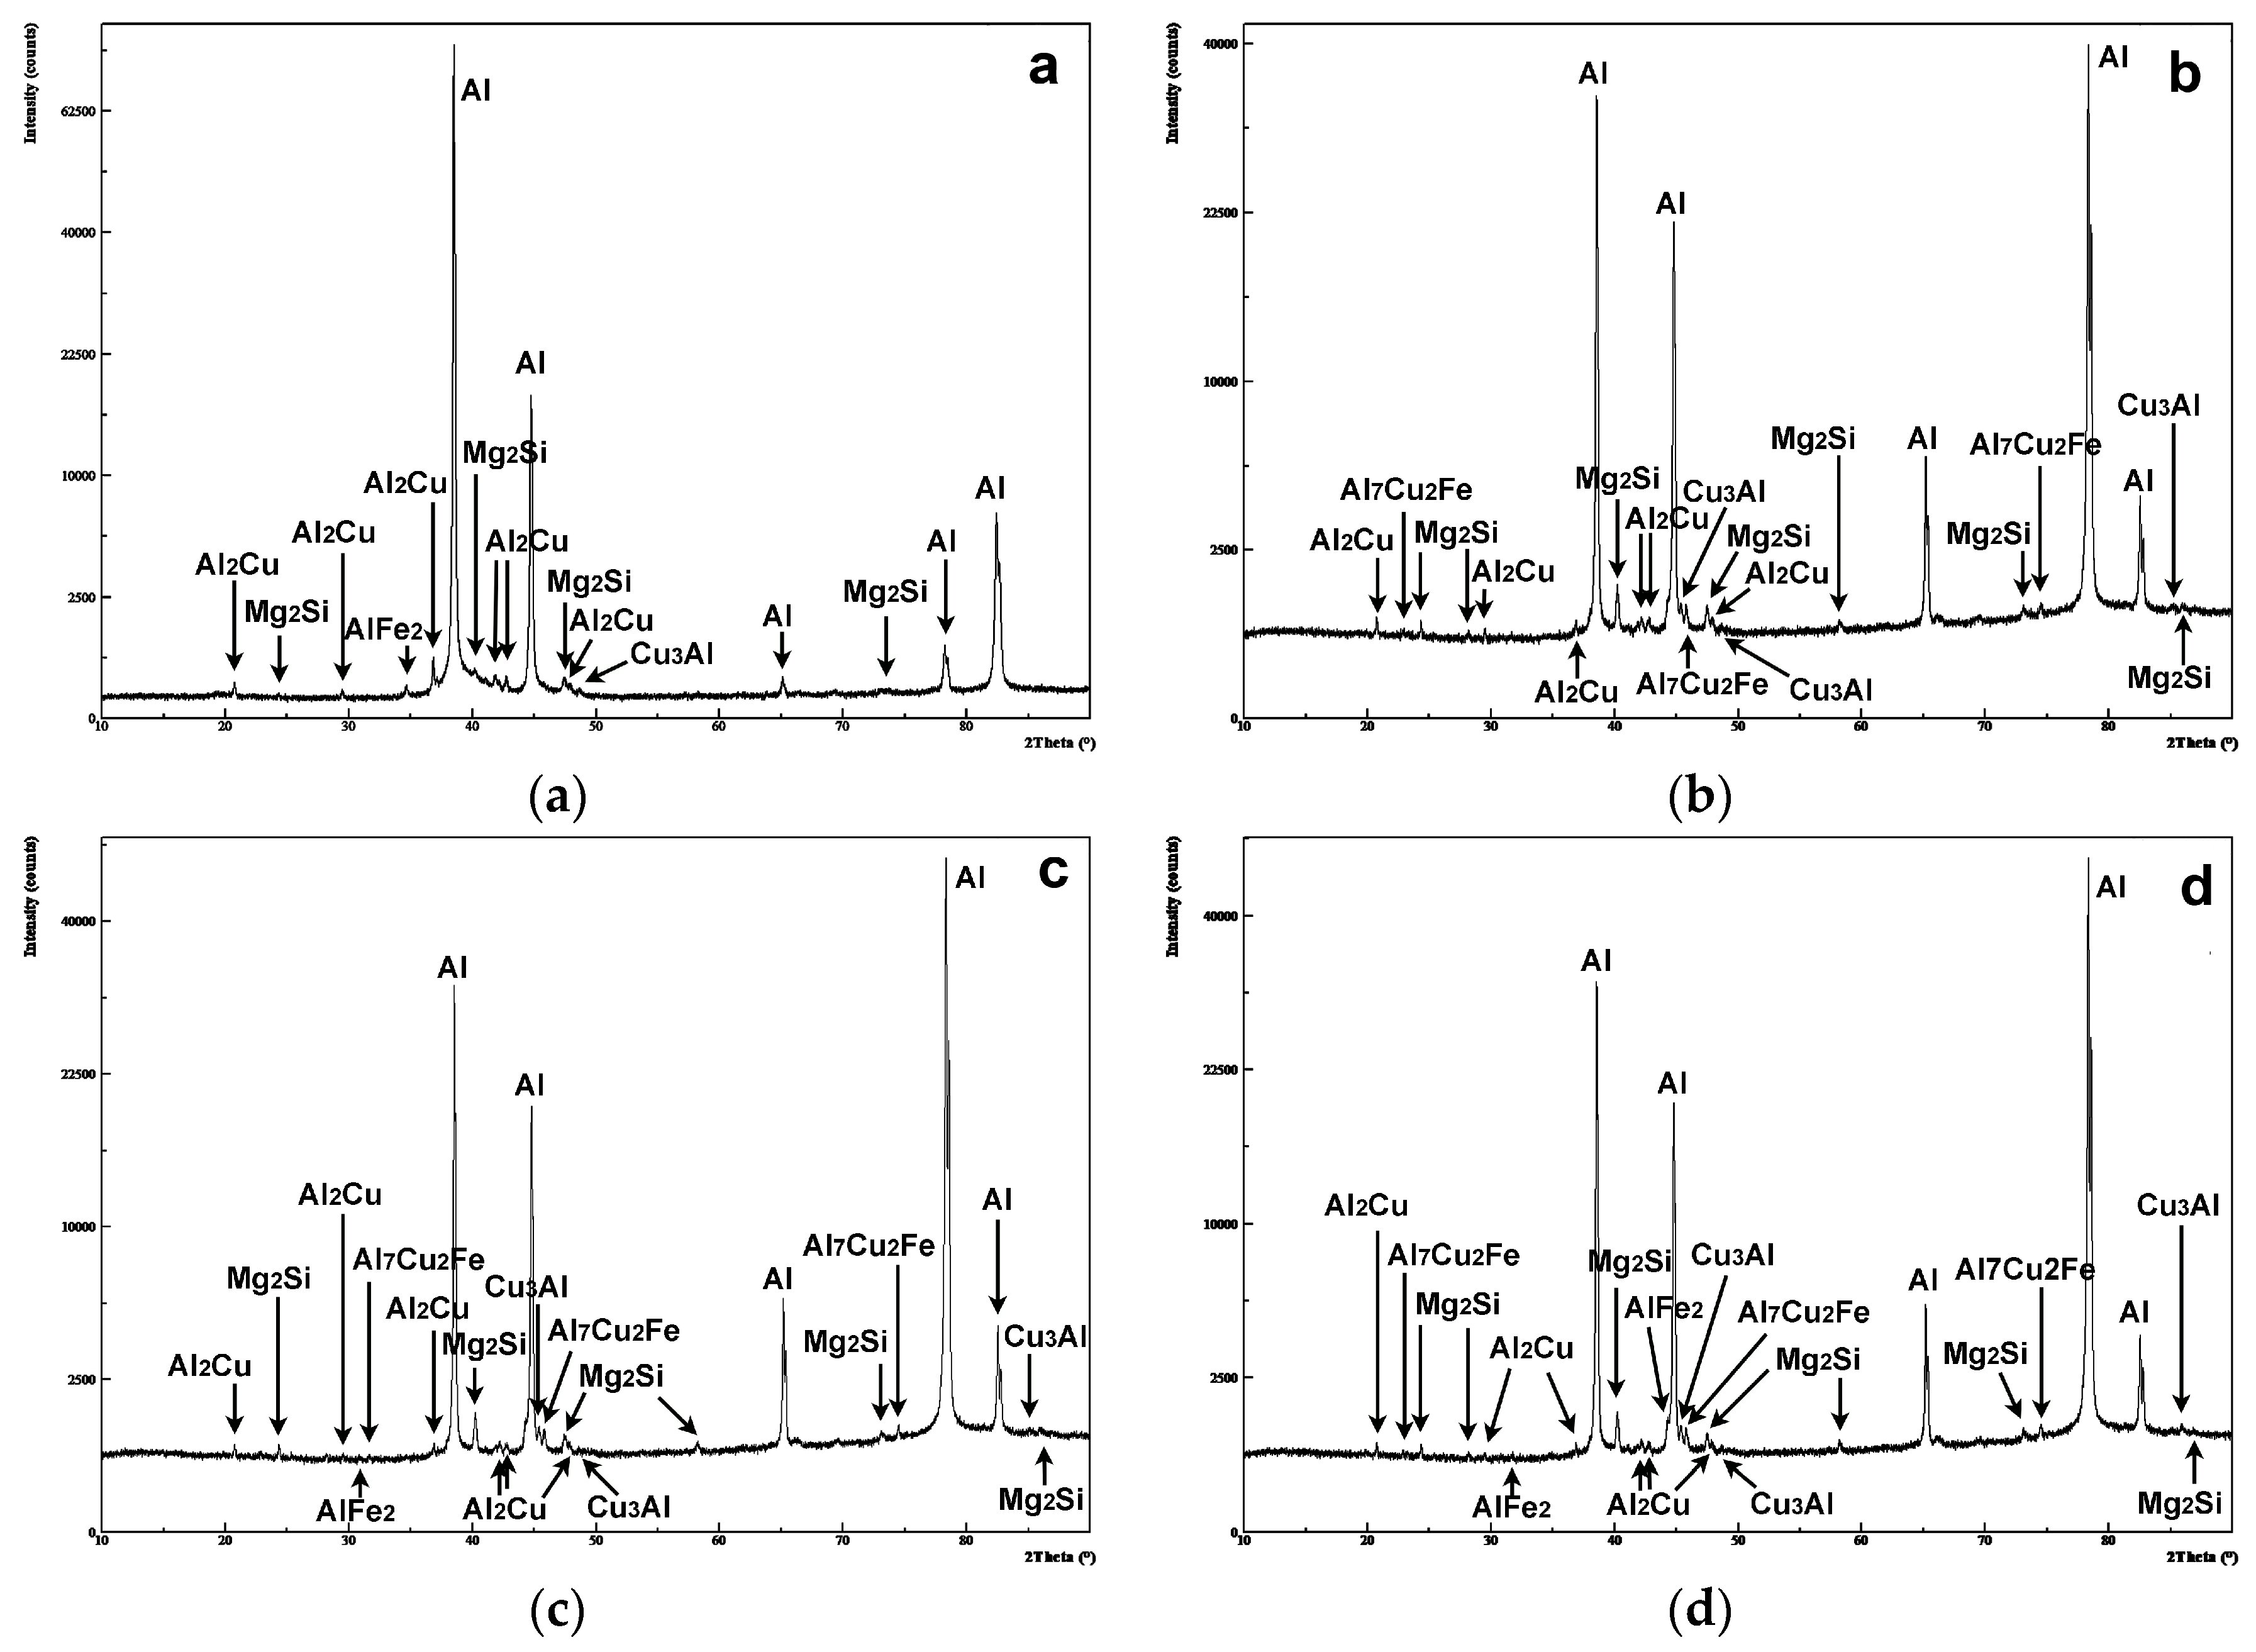
Figure 8 shows the diffractograms for the specimens in the form of ‘wire’, as well as after their solution heat treatment and natural ageing treatment. Figure 8a shows the diffractogram in the form of wire. Figure 8b–d respectively show the diffractograms obtained after dwell times of 4, 8, and 24 h at 495 °C and 1000 h of natural ageing. In the wire rod form, in addition to the α phase, the main identified phases were Al2Cu (θ) and Mg2Si (β), although the probable presence of AlFe2 and AlCu3 was also detected. The solution treatment and natural ageing led to a different texturing of the constituent matrix (α phase), which is reflected in the variation in the relative heights of its Bragg peaks associated with an increase in the percentage in weight of the previously identified phases and the appearance of the Al7Cu2Fe phase. Table 2 shows the percentage in weight obtained by means of the reference–intensity ratio (RIR) method. Ageing leads to an important increase in the percentage in weight of the Al2Cu and Mg2Si phases due to the precipitation of their transient θ”, θ’ and β”, β’ states, respectively. It should be noted that the greater the dwell time at 495 °C, the greater the percentage in weight of the transient states associated with the Al2Cu phase. It can thus be deduced that Mg has a greater facility to dissolve during the solution treatment than Cu, the latter needing more time. The omega-Al7Cu2Fe phase was found to precipitate during the heat treatment as a result of the dissolution and atom diffusion of Cu [23], which is a transition phase during aging [24].
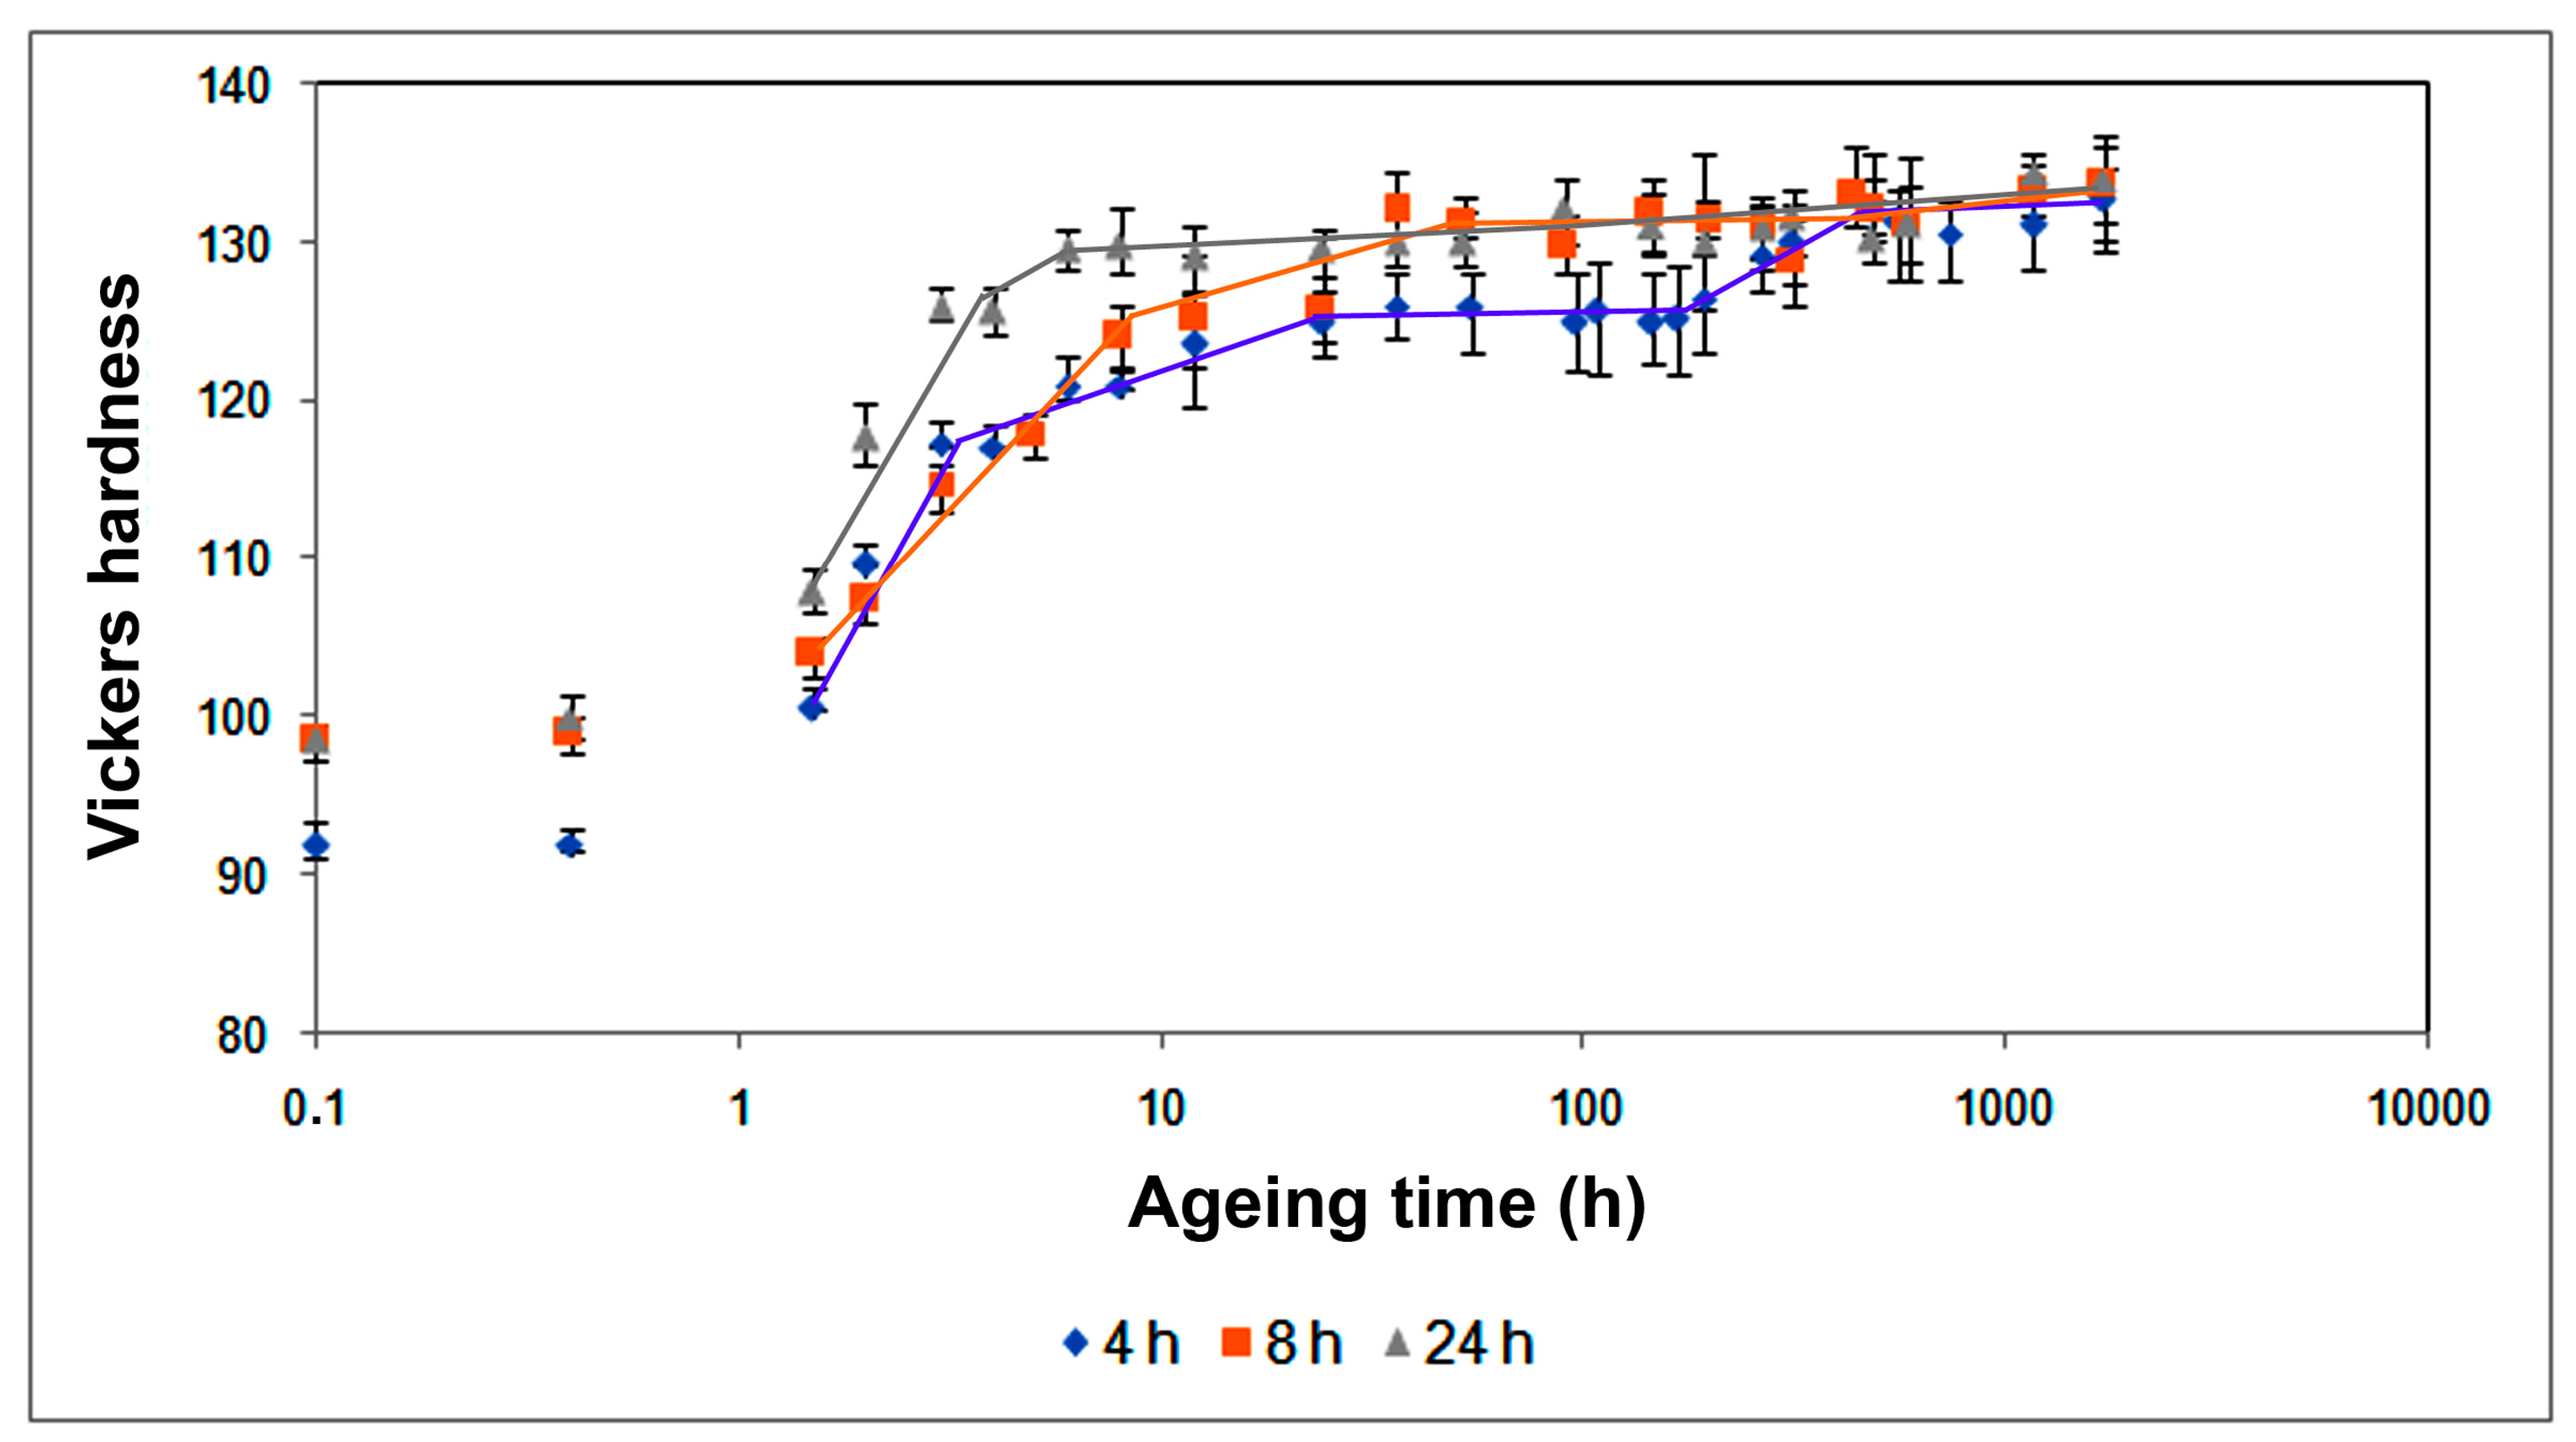
Figure 9 shows the hardness profile obtained during the natural ageing, up to 1700 h, of the quenched specimens following the solution treatment at 495 °C. A rapid increase in hardness in the first hours of ageing is observed in all three cases. From a certain point onward, however, this increase leveled out at a much lower rate. This higher initial rate of increase in hardness is greater when the dwell time at 495 °C is 24 h. After 1700 h, the hardness obtained in the three samples was around 134 HV, the maximum hardness not seeming to be obtained in any of the three cases.
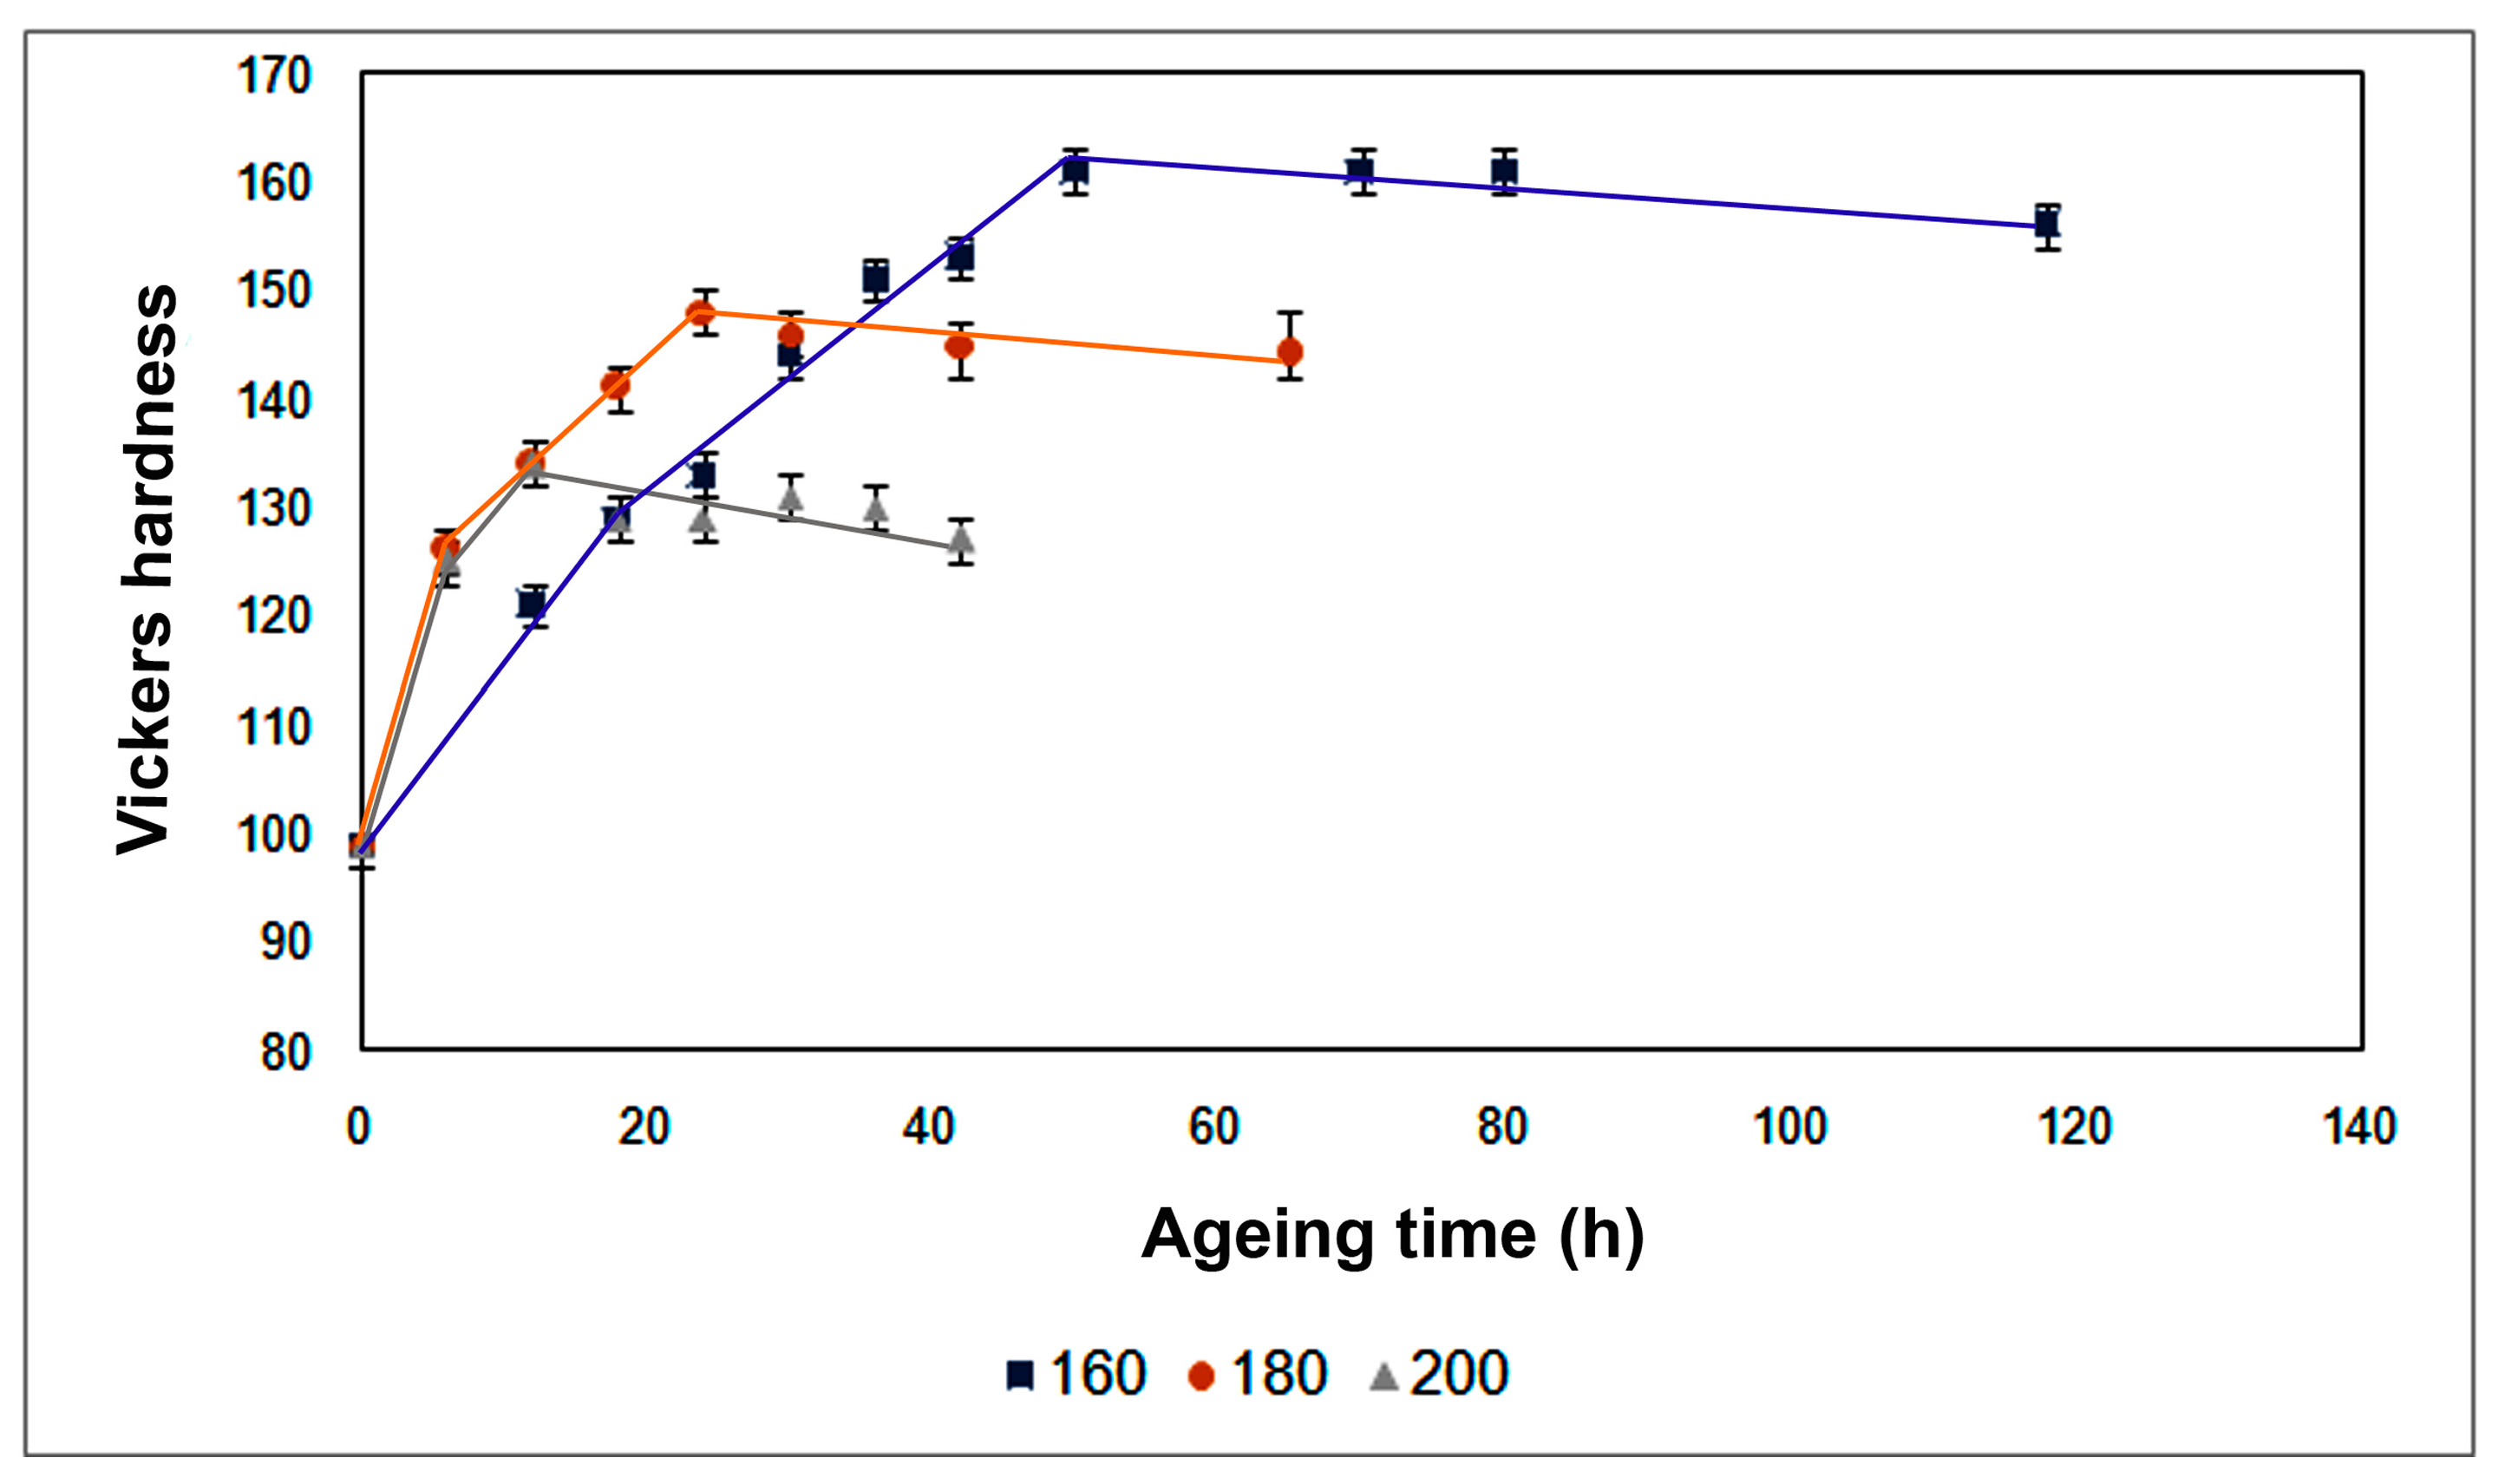
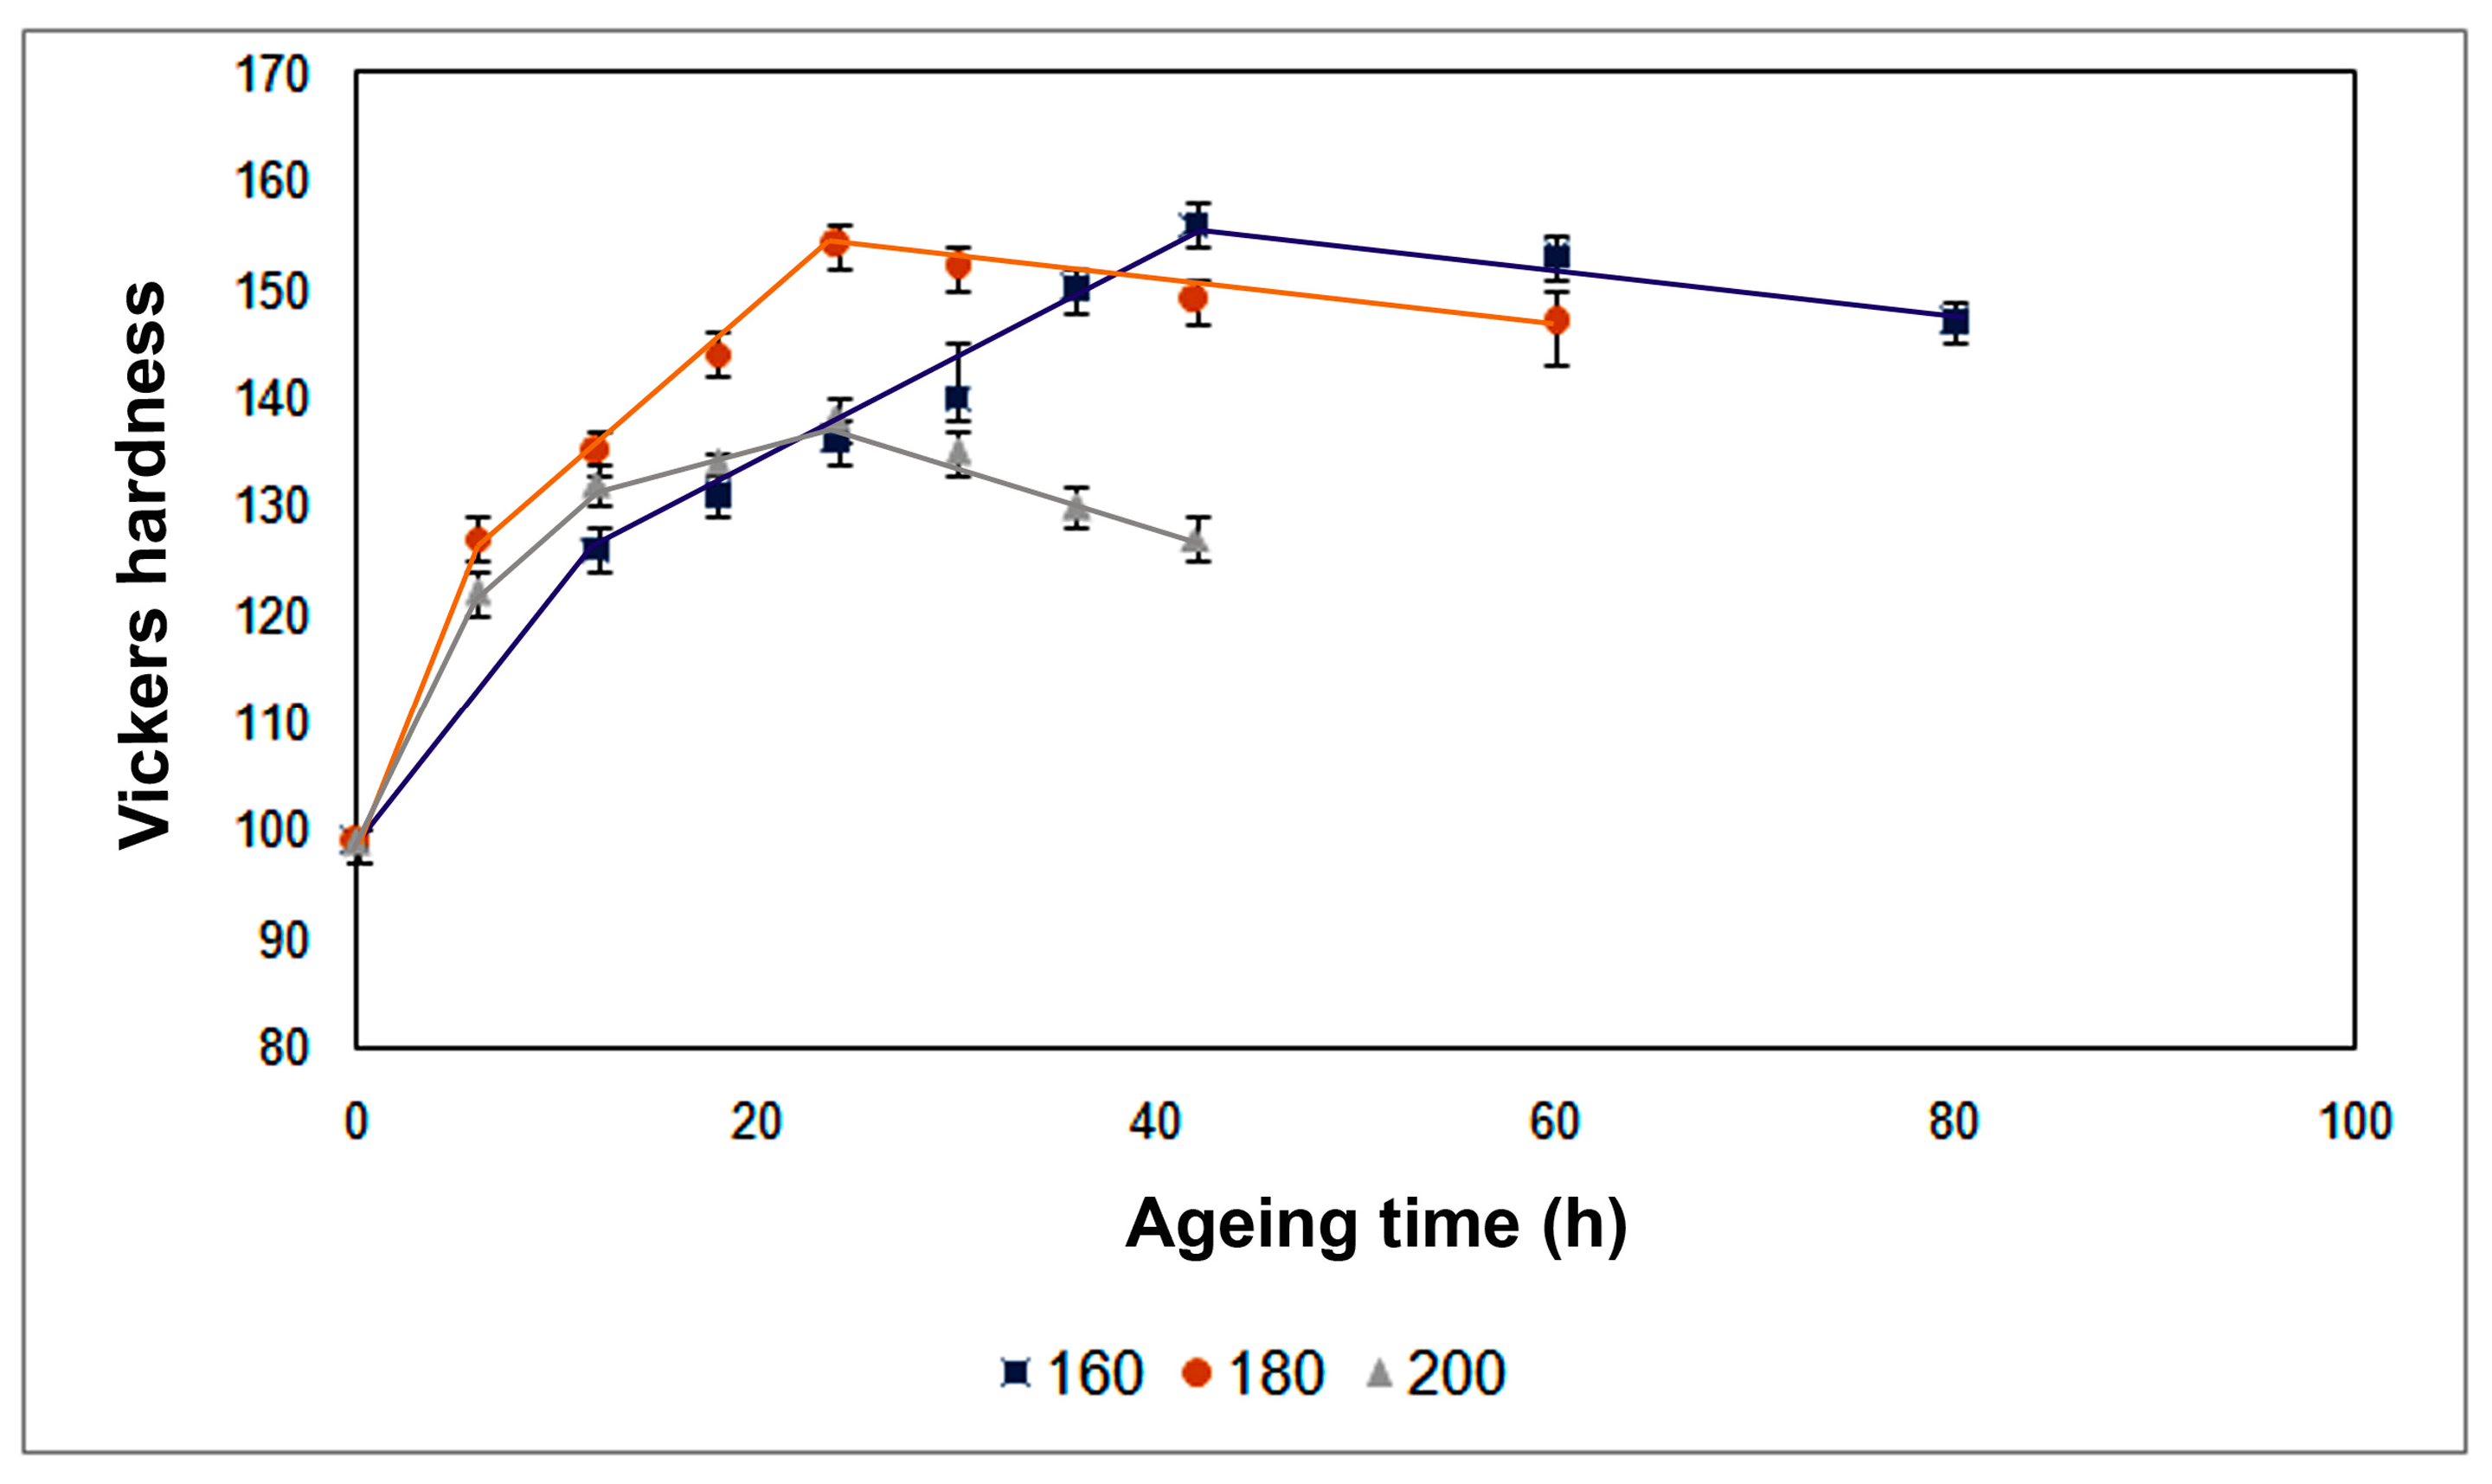
Figure 10 shows the hardness profiles obtained in the four specimens kept at 495 °C for 4 h. It can be observed that the peak hardness is reached first at the highest ageing temperature. Nevertheless, the maximum value of hardness is obtained at the lowest temperature (160 °C). Figure 11 shows the hardness profiles of specimens kept at 495 °C for 8 h. It can likewise be observed that the peak hardness is reached first at the highest ageing temperature. In this case, however, the maximum hardness value at 180 °C coincides with that obtained at 160 °C. The maximum hardness value achieved was 162 HV, after a solution treatment at 495 °C for 4 h and ageing at 160 °C for 50 h.
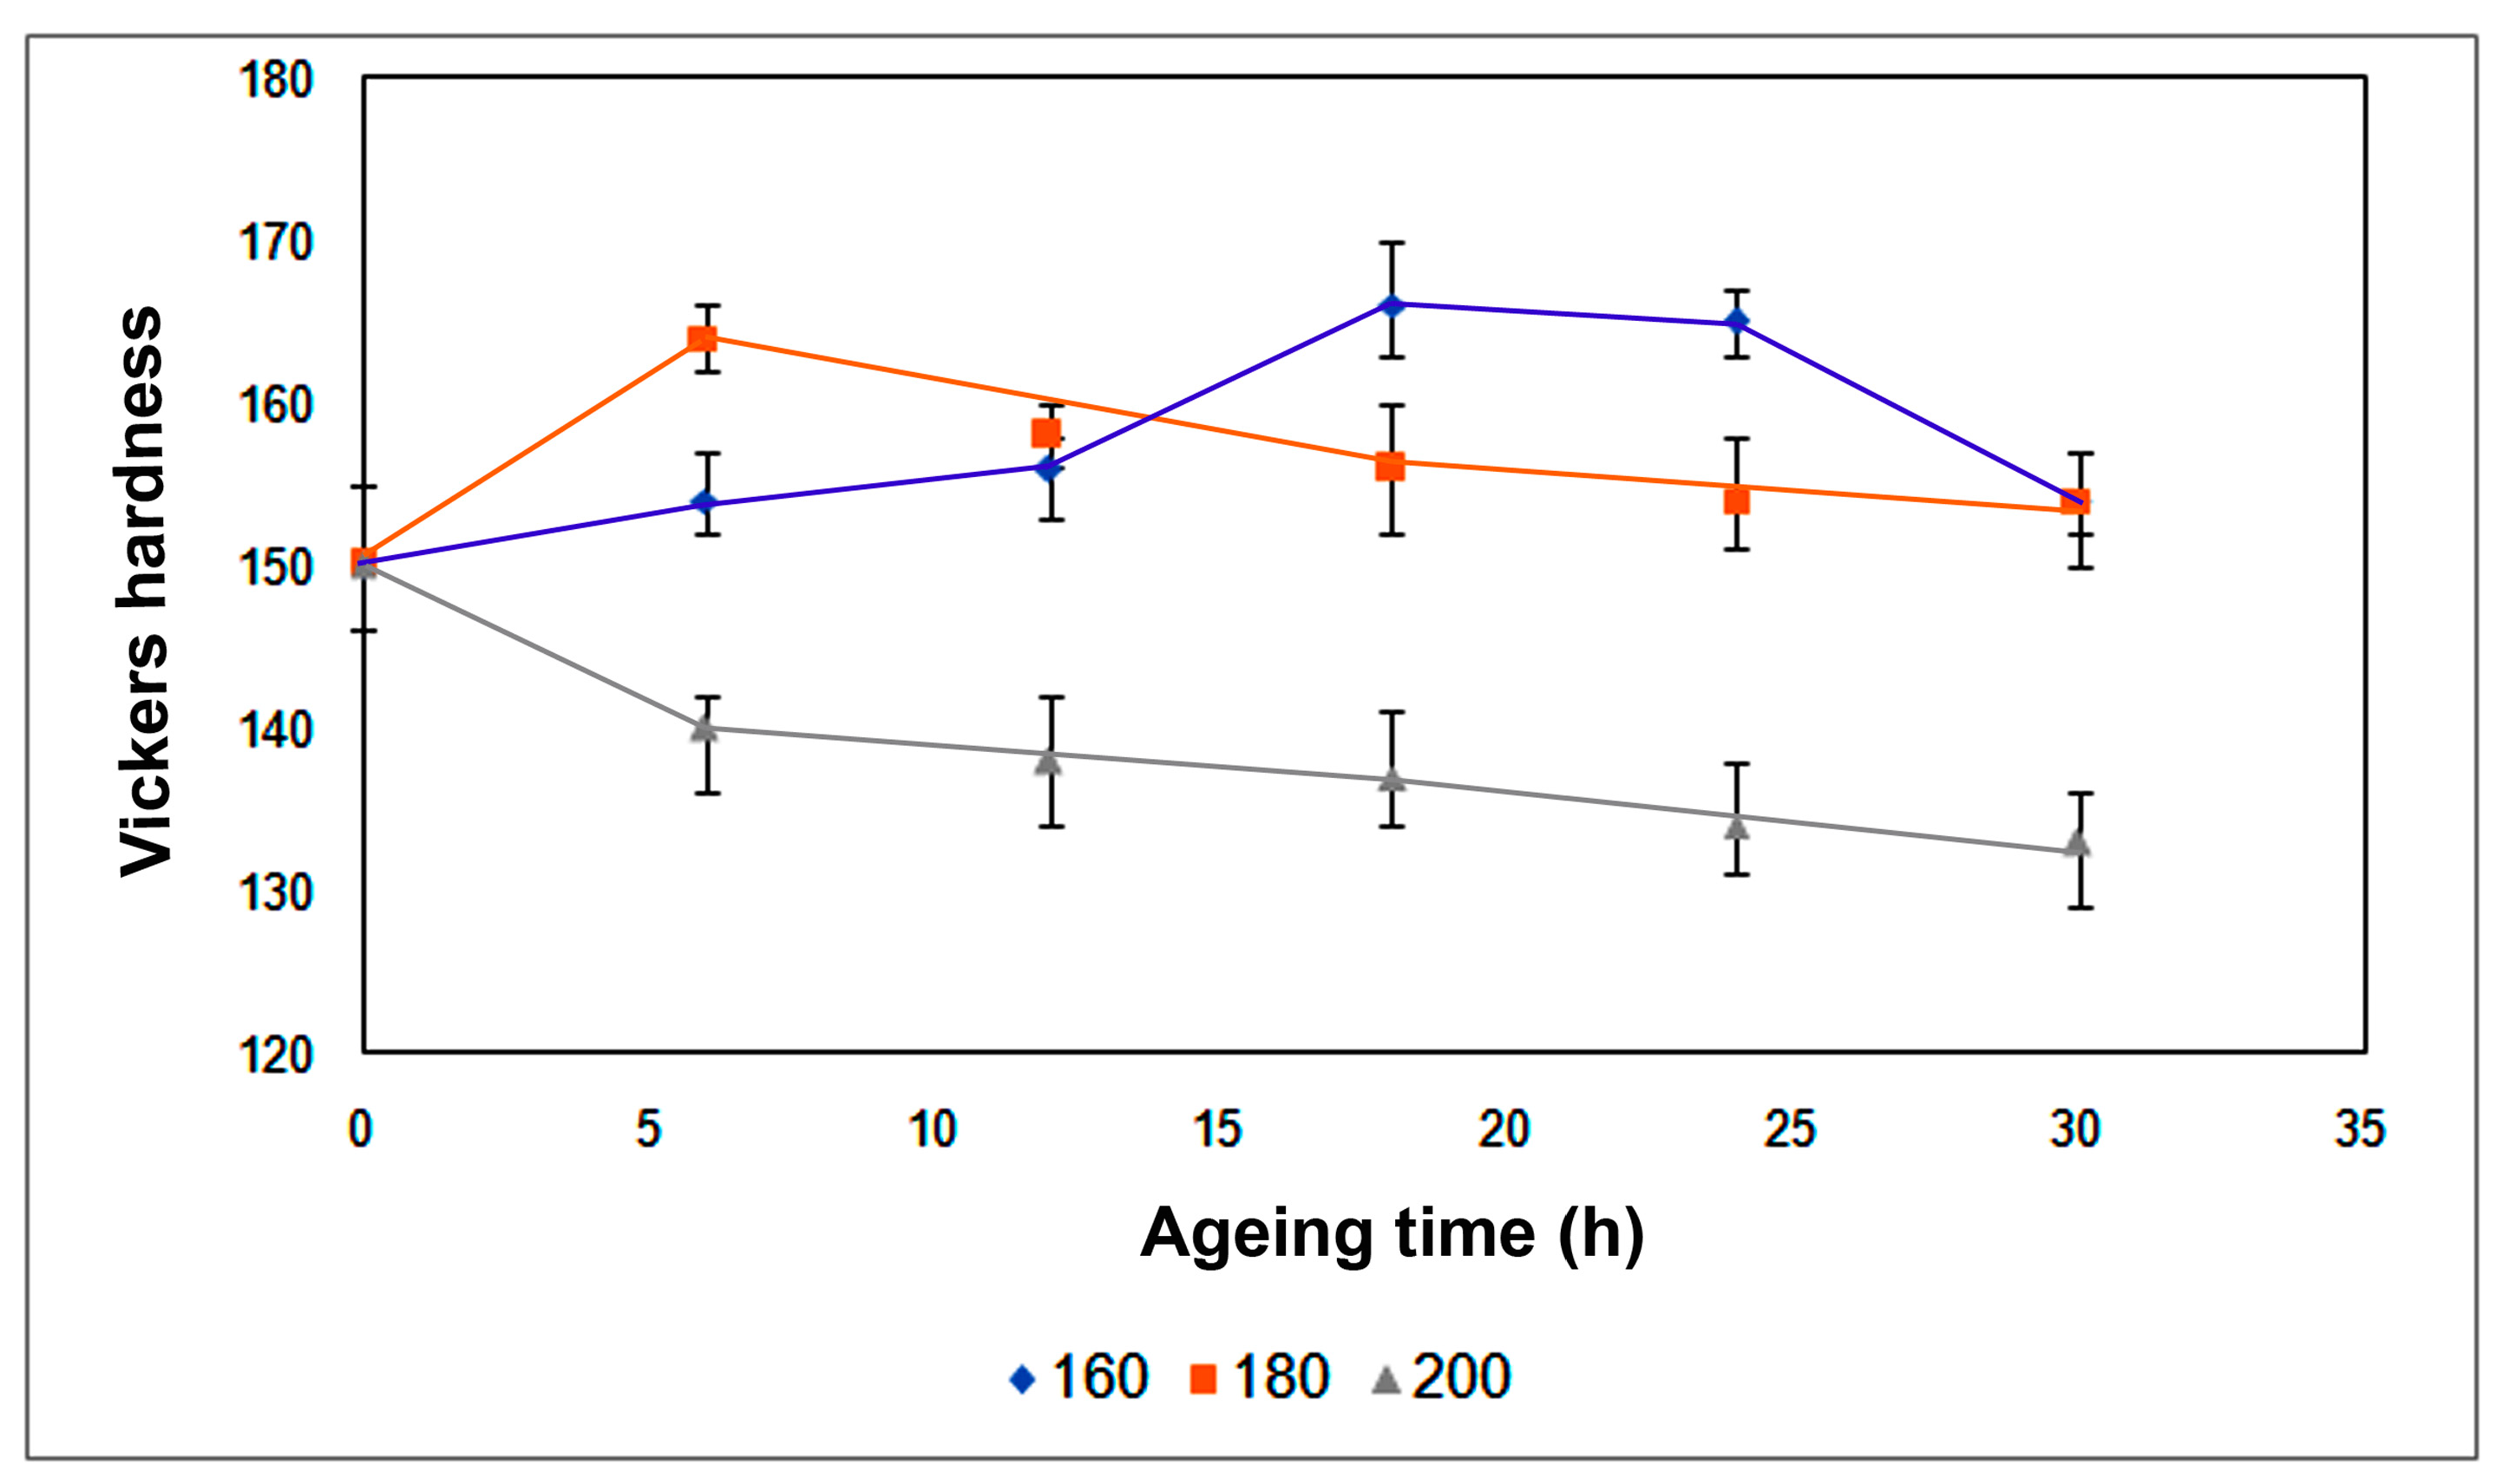
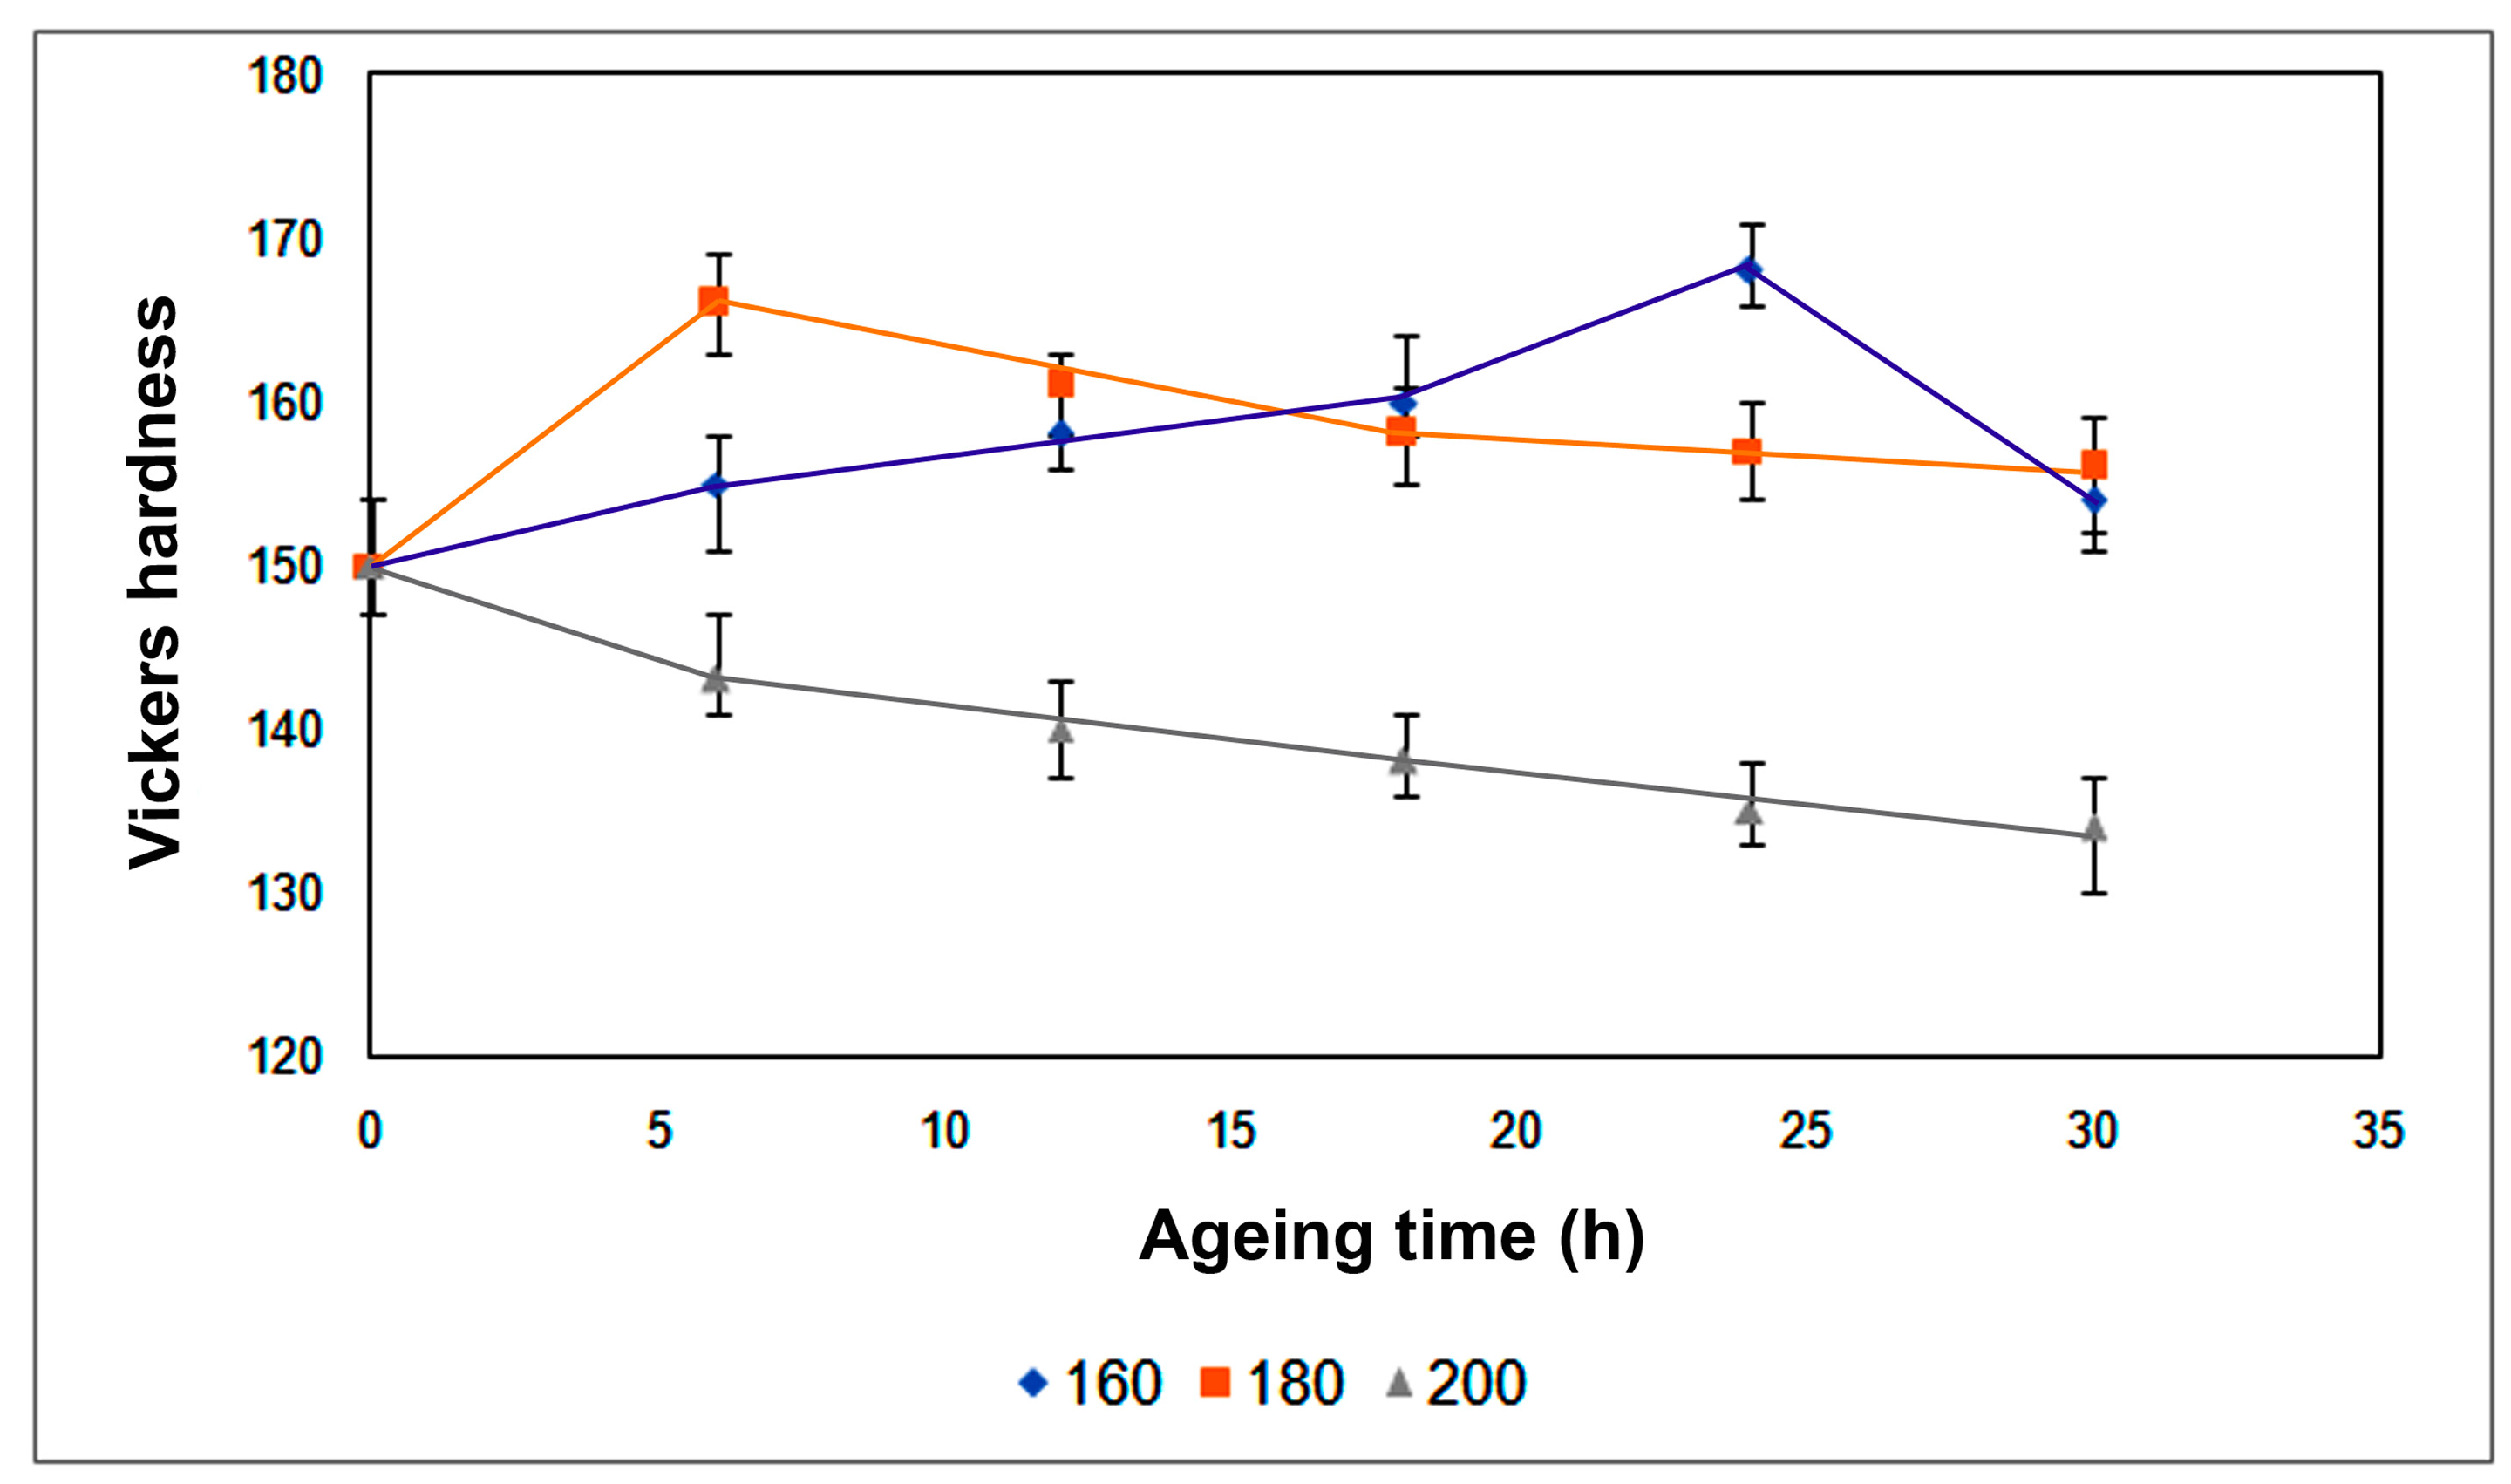
Figure 12 and Figure 13 show the hardness profiles of the specimens that were rolled prior to the artificial ageing treatments. Figure 12 shows the results obtained on the 4 specimens kept at 495 °C for 4 h, while Figure 13 shows the results obtained on the specimens that remained at this temperature for 8 h. In both cases, ageing does not take place at 200 °C, a continuous reduction in hardness being produced due to the recovery softening of the material at this temperature. The density of dislocations increases during cold rolling deformation, while two mechanisms compete during the subsequent ageing treatment: one in which the dislocations act like nucleating agents for precipitation, and another one in which the dislocations are reorganized promoting recovery softening [21]. Cieslar et al., report 200 °C as the temperature above which the latter mechanism could prevail [25]. Furthermore, the peak hardness is reached before with ageing at 180 °C than at 160 °C, both values being very similar at just over 165 HV regardless of the duration of the solution treatment at 495 °C. These values slightly exceed those obtained without prior deformation. However, it should be kept in mind that the hardness of the material after 25% deformation is 150 HV; hence. This means an increase in hardness of over 50%, which is related to the increase in dislocation density. The increase in hardness due to ageing treatment is less than 20 HV in all cases. If we compare this result with those obtained in the samples that did not undergo deformation, this very low increase in hardness can be attributed to competition between the two mechanisms described above and to the decrease in the concentration of vacancies resulting from the increase in dislocations, thereby decreasing the density of GP zones [13]. No less important is the finding that if ageing were carried out at 180 °C, the dwell time needed to reach the peak hardness would be 6 h. However, to obtain the maximum hardness without prior deformation, 50 h at 160 °C (Figure 9) would be necessary.
4. Conclusions
The effect on the hardness of an Al-Cu4.5-Mg1.5-Si0.75 alloy, manufactured by continuous casting and hot-milled until achieving a reduction in its cross-section greater than 90%, of the dwell time at a temperature of 495 °C (4, 8, and 24 h), of the ageing temperature (160, 180, and 200 °C), and of milling prior to ageing was analyzed.
As regards the dwell time at the solution temperature, it is concluded that:
- The greater the dwell time at 495 °C, the greater the percentage in weight of the transient states associated with the Al2Cu phase during natural ageing.
- Mg is easier to dissolve during the solution treatment than Cu, the latter needing more time.
- Precipitation of the Al7Cu2Fe phase is observed during natural ageing, its content being reduced with increasing dwell time at the solution temperature.
- Regardless of the dwell time at the solution temperature, the maximum hardness obtained during natural ageing only slightly exceeds 130 HV.
As to the artificial ageing temperature, it is concluded that:
- The higher the ageing temperature, the faster the peak hardness is reached, but the lower its value. The ageing temperature that allows a higher hardness value to be obtained is 160 °C.
- The maximum hardness value obtained was 162 HV, after a solution treatment at 495 °C for 4 h and ageing at 160 °C for 50 h.
If the material is cold milled with a true deformation of 25% prior to the ageing treatment, it is concluded that:
- During artificial ageing in the 160–180 °C range:
- The peak hardness values are reached more quickly.
- The hardness values exceed those achieved without prior deformation. However, this result is due to the hardness associated with the deformation, as the increase in hardness due to ageing was less than 20 HV in all cases.
- The maximum hardness values are the same regardless of the ageing temperature. The maximum hardness obtained was 168 HV when employing a dwell time of 8 h at 495 °C. The ageing time needed to obtain this hardness would be 6 h if this temperature were 180 °C, and 25 h if it were 160 °C.
- Ageing does not take place at 200 °C, a continuous reduction in hardness being produced due to the recovery softening of the material at this temperature.
Author Contributions
J.F.A.-A. and E.S.-F. analyzed the microstructure; H.N.-C. performed the heat treatments and determined the hardness profiles; J.F.A.-A. analyzed the data and wrote the paper; J.A.-L. defined the work methodology.
Conflicts of Interest
The authors declare no conflict of interest.
References
- Brooks, C.R. Heat Treatment, Structure and Properties of Nonferrous Alloys; American Society for Metals: Ohio, OH, USA, 1982; p. 419. [Google Scholar]
- Sjolander, E.; Seifeddine, S. The heat treatment of Al-Si-Cu-Mg casting alloys. J. Mater. Process. Technol. 2010, 210, 1249–1259. [Google Scholar] [CrossRef]
- Li, H.Z.; Liu, R.M.; Liang, X.P.; Deng, M.; Liao, H.J.; Huang, L. Effect of pre-deformation on microstructures and mechanical properties of high purity Al-Cu-Mg alloy. Trans. Nonferrous Met. Soc. China 2016, 26, 1482–1490. [Google Scholar] [CrossRef]
- Xiao, Q.; Liu, H.Q.; Yi, D.Q.; Yin, D.Y.; Chen, Y.Q.; Zhang, Y.; Wang, B. Effect of Cu content on precipitation and age-hardening behavior in Al-Mg-Si-xCu alloys. J. Alloys Compd. 2017, 695, 1005–1013. [Google Scholar] [CrossRef]
- Wang, G.Q.; Sun, Q.Z.; Feng, L.M.; Hui, L.; Jing, C.N. Influence of Cu content on ageing behavior of AlSiMgCu cast alloys. Mater. Des. 2007, 28, 1001–1005. [Google Scholar] [CrossRef]
- Bastow, T.J.; Hill, A.J. Guinier–Preston and Guinier–Preston-bagaryatsky zone reversion in Al-Cu-Mg alloys studied by NMR. Mater. Sci. Forum 2006, 519–521, 1385–1390. [Google Scholar] [CrossRef]
- Somoza, A.; Petkov, M.P.; Lynn, K.G.; Dupasquier, A. Stability of vacancies during solute clustering in Al-Cu-based alloys. Phys. Rev. B 2002, 65, 094107. [Google Scholar] [CrossRef]
- Eskin, D.G. Decomposition of supersaturated solid solutions in Al-Cu-Mg-Si alloys. J. Mater. Sci. 2003, 38, 279–290. [Google Scholar] [CrossRef]
- Chaieb, Z.; Ouarda, O.M.; Raho, A.A.; Kadi-Hanifi, M. Effect of Fe and Si impurities on the precipitation kinetics of the GPB zones in the Al-3 wt % Cu-1 wt % Mg alloy. Aims Mater. Sci. 2016, 3, 1443–1455. [Google Scholar] [CrossRef]
- Li, Y.J.; Brusethaug, S.; Olsen, A. Influence of Cu on the mechanical properties and precipitation behavior of AlSi7Mg0.5 alloy during aging treatment. Scr. Mater. 2006, 54, 99–103. [Google Scholar] [CrossRef]
- Quan, L.W.; Zhao, G.; Gao, S.; Muddle, B.C. Effect of pre-stretching on microstructure of aged 2524 aluminium alloy. Trans. Nonferrous Met. Soc. China 2011, 21, 1957–1962. [Google Scholar] [CrossRef]
- Naimi, A.; Yousfi, H.; Trari, M. Influence of cold rolling degree and ageing treatments on the precipitation hardening of 2024 and 7075 alloys. Mech. Time-Depend. Mater. 2013, 17, 285–296. [Google Scholar] [CrossRef]
- Chen, Y.T.; Nieh, G.Y.; Wang, J.H.; Wu, T.F.; Lee, S.L. Effects of Cu/Mg ratio and heat treatment on microstructures and mechanical properties of Al-4.6Cu-Mg-0.5Ag alloys. Mater. Chem. Phys. 2015, 162, 764–770. [Google Scholar] [CrossRef]
- Wu, Y.P.; Ye, L.Y.; Jia, Y.Z.; Liu, L.; Zhang, X.M. Precipitation kinetics of 2519A aluminum alloy based on aging curves and DSC analysis. Trans. Nonferrous Met. Soc. China 2014, 24, 3076–3083. [Google Scholar] [CrossRef]
- Parel, T.S.; Wang, S.C.; Starink, M.J. Hardening of an Al-Cu-Mg alloy containing Types I and II S phase precipitates. Mater. Des. 2010, 31, S2–S5. [Google Scholar] [CrossRef]
- Ben Naser, T.S.; Krallics, G. Mechanical behavior of multiple-forged Al 7075 aluminum alloy. Acta Polytech. Hungarica 2014, 11, 103–117. [Google Scholar]
- Belov, N.; Eskin, D.; Aksenov, A. Multicomponent Phase Diagrams: Applications for Commercial Aluminum Alloys; Elsevier: Oxford, UK, 2005; p. 424. [Google Scholar]
- Han, Y.M.; Samuel, A.M.; Samuel, F.H.; Valtierra, S.; Doty, H.W. Effect of solution heat treatment type on the dissolution of copper phases in Al-Si-Cu-Mg type alloys. Trans. Am. Foundry Soc. 2008, 116, 79. [Google Scholar]
- Ibrahim, M.F.; Samuel, A.M.; Samuel, F.H.; Doty, H.W. Effect of aging conditions on precipitation hardening in Al-Si-Mg and Al-Si-Cu-Mg alloys. Int. J. Metalcast. 2017, 11, 274–286. [Google Scholar] [CrossRef]
- Chung, F.H. Quantitative interpretation of x-ray-diffraction patterns of mixtures. Adiabatic principle of X-ray-diffraction analysis of mixtures. J. Appl. Crystallogr. 1974, 7, 526–531. [Google Scholar] [CrossRef]
- Pero-Sanz, J.A. Materials Science and Engineering, 4th ed.; Dossat: Madrid, Spain, 2000; pp. 516–538. [Google Scholar]
- Cepeda-Jimenez, C.M.; Ruano, O.A.; Carsi, M.; Carreno, F. Study of hot deformation of an Al-Cu-Mg alloy using processing maps and microstructural characterization. Mater. Sci. Eng. 2012, 552, 530–539. [Google Scholar] [CrossRef]
- Basak, C.B.; Babu, N.H. Influence of Cu on modifying the beta phase and enhancing the mechanical properties of recycled Al-Si-Fe cast alloys. Sci. Rep. 2017, 7, 5779. [Google Scholar] [CrossRef] [PubMed]
- Gazizov, M.; Kaibyshev, R. Precipitation structure and strengthening mechanisms in an Al-Cu-Mg-Ag alloy. Mater. Sci. Eng. A 2017, 702, 29–40. [Google Scholar] [CrossRef]
- Cieslar, M.; Karimi, A.; Martin, J.L. Bulge test characterization of static softening and dynamic instabilities in foils of an Al-based alloy. In Proceedings of the Symposium on Thin Films—Stresses and Mechanical Properties IX Held at the 2001 Fall MRS Meeting, Boston, MA, USA, 26–30 November 2001; pp. 127–132. [Google Scholar]
Figure 1.
Description of the experimental process followed.

Figure 2.
Characteristic microstructure of the material after continuous casting, obtained by optical microscopy. Light gray phase: solid solution (Al); Dark gray phase: Cu2Al; Black phase: Mg2Si.
Figure 2.
Characteristic microstructure of the material after continuous casting, obtained by optical microscopy. Light gray phase: solid solution (Al); Dark gray phase: Cu2Al; Black phase: Mg2Si.

Figure 3.
Characteristic microstructure of the material after continuous casting, obtained by scanning electron microscopy. Gray phase: solid solution (Al); White phase: Cu2Al; Black phase: Mg2Si.
Figure 3.
Characteristic microstructure of the material after continuous casting, obtained by scanning electron microscopy. Gray phase: solid solution (Al); White phase: Cu2Al; Black phase: Mg2Si.

Figure 4.
Microstructure of the material after continuous casting, obtained by scanning electron microscopy. Gray phase: solid solution (Al); White phase: Cu2Al; Black phase: Mg2Si.
Figure 4.
Microstructure of the material after continuous casting, obtained by scanning electron microscopy. Gray phase: solid solution (Al); White phase: Cu2Al; Black phase: Mg2Si.

Figure 5.
Microstructure of the material after continuous casting, obtained by scanning electron microscopy. Particles of Mg2Si (black coloring) and Al2Cu (white coloring) identified by semi-quantitative analysis by characteristic energy dispersive X-ray (EDX) microanalysis.
Figure 5.
Microstructure of the material after continuous casting, obtained by scanning electron microscopy. Particles of Mg2Si (black coloring) and Al2Cu (white coloring) identified by semi-quantitative analysis by characteristic energy dispersive X-ray (EDX) microanalysis.

Figure 6.
Characteristic microstructure after hot rolling of the material with a 90% reduction in cross-section, obtained by scanning electron microscopy. Grain refinement by hot dynamic restoration and hot static recrystallization.
Figure 6.
Characteristic microstructure after hot rolling of the material with a 90% reduction in cross-section, obtained by scanning electron microscopy. Grain refinement by hot dynamic restoration and hot static recrystallization.

Figure 7.
Microstructure after hot rolling of the material with a 90% reduction in cross-section, obtained by scanning electron microscopy. Particles of Mg2Si (black coloring) and Al2Cu (white coloring) identified by semi-quantitative analysis by characteristic energy dispersive X-ray (EDX) microanalysis.

Figure 8.
Diffractograms of the material obtained by X-ray diffraction (XRD). (a) Identification of the phases present after hot rolling. (b) Identification of the phases present after a solution treatment at 495 °C for 4 h and natural ageing for up to 1000 h. (c) Identification of the phases present after a solution treatment at 495 °C for 8 h and natural ageing for up to 1000 h. (d) Identification of the phases present after a solution treatment at 495 °C for 24 h and natural ageing for up to 1000 h.

Figure 9.
Hardness profiles after a solution treatment at 495 °C for 4, 8, and 24 h and subsequent natural ageing (21 °C) for up to 1700 h. Error bars define the distance between the maximum and minimum values vs. the average value.
Figure 9.
Hardness profiles after a solution treatment at 495 °C for 4, 8, and 24 h and subsequent natural ageing (21 °C) for up to 1700 h. Error bars define the distance between the maximum and minimum values vs. the average value.

Figure 10.
Hardness profiles of the specimens treated at 495 °C for 4 h, with ageing treatments at 160, 180, and 200 °C, respectively. Error bars define the distance between the maximum and minimum values vs. the average value.
Figure 10.
Hardness profiles of the specimens treated at 495 °C for 4 h, with ageing treatments at 160, 180, and 200 °C, respectively. Error bars define the distance between the maximum and minimum values vs. the average value.

Figure 11.
Hardness profiles of the specimens treated at 495 °C for 8 h, with ageing treatments at 160, 180, and 200 °C, respectively. Error bars define the distance between the maximum and minimum values vs. the average value.
Figure 11.
Hardness profiles of the specimens treated at 495 °C for 8 h, with ageing treatments at 160, 180, and 200 °C, respectively. Error bars define the distance between the maximum and minimum values vs. the average value.

Figure 12.
Hardness profiles of the specimens treated at 495 °C for 4 h and subsequently cold rolled until achieving a deformation of 25%, with ageing treatments at 160, 180, and 200 °C, respectively. Error bars define the distance between the maximum and minimum values vs. the average value.
Figure 12.
Hardness profiles of the specimens treated at 495 °C for 4 h and subsequently cold rolled until achieving a deformation of 25%, with ageing treatments at 160, 180, and 200 °C, respectively. Error bars define the distance between the maximum and minimum values vs. the average value.

Figure 13.
Hardness profiles of the samples treated at 495 °C for 8 h and subsequently cold rolled until achieving a deformation of 25%, with ageing treatments at 160, 180, and 200 °C, respectively. Error bars define the distance between the maximum and minimum values vs. the average value.
Figure 13.
Hardness profiles of the samples treated at 495 °C for 8 h and subsequently cold rolled until achieving a deformation of 25%, with ageing treatments at 160, 180, and 200 °C, respectively. Error bars define the distance between the maximum and minimum values vs. the average value.


Table 1.
Chemical composition of the Al-Cu4.5-Mg1.5-Si0.75 alloy (% in weight).
| Cu | Mg | Si | Fe | Ni | Al |
|---|---|---|---|---|---|
| 4.84 | 1.56 | 0.75 | 0.18 | 0.12 | Rem. |
Table 2.
Semi-quantitative analysis obtained by means of the reference–intensity ratio (RIR) method.
Table 2.
Semi-quantitative analysis obtained by means of the reference–intensity ratio (RIR) method.
| Crystalline Phases. | AsCast. | ST 4 h A 1000 h | ST 8 h A 1000 h | ST 24 h A 1000 h |
|---|---|---|---|---|
| Al (α) | 98.9 | 92.2 | 92.5 | 92.2 |
| Mg2Si | 0.3 | 3.6 | 3.4 | 3.5 |
| Al2Cu | 0.6 | 1.1 | 1.4 | 1.7 |
| AlFe2 | 0.1 | 0.6 | 0.7 | 0.7 |
| Cu3Al | 0.1 | 0.6 | 0.5 | 0.5 |
| Al7Cu2Fe | - | 1.9 | 1.6 | 1.5 |
Nomenclature: ST: Solution Treatment; A: Ageing. (% in weight).
© 2018 by the authors. Licensee MDPI, Basel, Switzerland. This article is an open access article distributed under the terms and conditions of the Creative Commons Attribution (CC BY) license (http://creativecommons.org/licenses/by/4.0/).
Share and Cite
MDPI and ACS Style
Alvarez-Antolin, J.F.; Segurado-Frutos, E.; Neira-Castaño, H.; Asensio-Lozano, J. Heat Treatment Optimization in Al-Cu-Mg-Si Alloys, with or without Prior Deformation. Metals 2018, 8, 739. https://doi.org/10.3390/met8100739
AMA Style
Alvarez-Antolin JF, Segurado-Frutos E, Neira-Castaño H, Asensio-Lozano J. Heat Treatment Optimization in Al-Cu-Mg-Si Alloys, with or without Prior Deformation. Metals. 2018; 8(10):739. https://doi.org/10.3390/met8100739
Chicago/Turabian StyleAlvarez-Antolin, Jose Florentino, Elvira Segurado-Frutos, Hilario Neira-Castaño, and Juan Asensio-Lozano. 2018. "Heat Treatment Optimization in Al-Cu-Mg-Si Alloys, with or without Prior Deformation" Metals 8, no. 10: 739. https://doi.org/10.3390/met8100739
Note that from the first issue of 2016, this journal uses article numbers instead of page numbers. See further details here.