Article

Oxidation Behavior of Zr–1Nb Corroded in Air at 400 °C after Plasma Immersion Titanium Implantation

1
Chair of Physical Metallurgy and Materials Technology, Brandenburg Technical University, 03046 Cottbus, Germany
2
Department of General Physics, National Research Tomsk Polytechnic University, Tomsk 634050, Russia
3
Laboratory of Inorganic Nanomaterials, National University of Science and Technology “MISiS”, Moscow 119049, Russia
*
Author to whom correspondence should be addressed.
Metals 2018, 8(1), 27; https://doi.org/10.3390/met8010027
Submission received: 4 October 2017 / Revised: 24 December 2017 / Accepted: 30 December 2017 / Published: 2 January 2018
(This article belongs to the Special Issue Zirconium Alloys)

Abstract

:
In this paper, the influence of plasma immersion titanium implantation into the zirconium alloy Zr-1Nb on the oxidation behavior at 400 °C for 5, 24, 72, and 240 h in air under normal atmospheric pressure (101.3 kPa) was shown. The influence of implantation on the protective properties of the modified layer was shown. The valence of the oxides before and after implantation was analyzed by means of X-ray photoelectron spectroscopy (XPS). Grazing incidence X-ray diffraction (GIXRD) was carried out to examine the phase composition after titanium ion implantation and oxidation. Differential scanning calorimetry (DSC) revealed that titanium implantation exhibited effects of stabilizing the β phase. The formation of the t-ZrO2 and m-ZrO2 was observed during the oxidation of the as-received and modified Zr-1Nb. The measurement of weight gain showed an improvement in oxidation resistance of Ti implanted Zr-1Nb at the oxidation up to 24 h when compared with that of the as-received Zr-1Nb. However, at longer oxidation cycle the oxidation rate of Ti-implanted zirconium alloy is the same with the as-received alloy, which attributed to the layer thickness. Nevertheless, the corrosion of the Ti-implanted alloy is more uniform, while a local corrosion and cracks was detected on the surface of the as-received alloy.

1. Introduction

Zirconium alloys (Zr-1Nb, Zr-2.5Nb, …….) have been widely used in water-cooled nuclear reactors as structural and in-core components (fuel cladding, square channels, pressure- and calandria tubes, garter springs, and fuel spacer grids) due to low thermal neutron capture cross-section, excellent corrosion resistance, and acceptable mechanical properties at conventional operating temperatures (300–400 °C) [1,2]. The main degradation issues for zirconium alloys are oxidation, hydrogen pick-up, and associated damage modes (hydrogenation, delayed hydride cracking, blistering), irradiation induced creep (axial and circumferential), and irradiation growth [3,4,5,6,7,8].
It is well-known that a thin native oxide film (2–5 nm) is formed on the surface of zirconium alloys, even at low temperatures [9]. The oxide film starts to grow, while the oxygen concentration exceeds the thermodynamic solubility. Despite this, the initial oxide layer reduces further development of the oxides, because the oxide film serves as barrier between zirconium and coolant. Transportation of oxygen through the oxide layer decreases, leading to a reduction of corrosion rate and hydrogen diffusion [10]. Lattice misfit increases during growth of the oxide film on the surface. Motta et al. found that stress accumulation to some critical value leads to cracking of the oxide film. Thus, fresh oxygen and hydrogen can easily enter the matrix and react with zirconium [11]. Oxidation becomes significant at elevated temperatures beyond 800 °C (during hypothetical loss-of-coolant accident). In combination with the release of hydrogen and the heat, it causes degradation of the mechanical properties of the material [12].
Such increasing temperature results in phase transition from hexagonal closed packed (hcp) α-phase to body centered cubic (bcc) β-phase structure. The phase transformation changes crystallographic textures and proportions of α- and β-phase.
At ambient temperature Zr-1Nb alloy mostly consists of α-phase Zr containing ≈1 weight percentage (wt. %) of Nb and 99 wt. % of Zr and a small amount of Nb-stabilized β phase with ≈20 wt. % Nb (Figure 1) [13]. According to the phase diagram of Zr-1Nb, there are two phase transitions. At around 610 °C, the monotectoid transformation βZr → αZr + βNb takes place. During heating between 610 °C and 850 °C the αZr → βZr transformation occurs combined with a loss of stability of the α-phase lattice over the entire volume and the realization of intensive structural changes (≥95% αZr → βZr transformation) [14].
Simultaneously, the current trend towards higher burn-up of nuclear fuel mainly driven by economic incentive, significantly affects nuclear power engineering [15]. However, together with increasing burn-up, growing intensity of hydrogen pick-up and oxidation is observed. On the other hand, negative impacts such as intensive formation of cracks, deformation of the constructions, and texture changes happen [16]. Therefore, increasing burn-up and loss-of-coolant accident can shorten service time of zirconium alloys (operational life-time).
Nowadays, there are numerous methods applied for improving hydrogen and oxidation resistance, such as the addition of stabilizing additives (yttrium) [17,18], deposition of thin solid films [19,20,21], micro-arc oxidation [22], as well as the modification of the surface by electron beam treatment [23]. Despite the multiplicity of the methods these problems are still relevant. Plasma immersion ion implantation (PIII) is widely used for surface modifications; both, ion implantation and thin film deposition are used for various applications [24,25]. During the PIII process, highly negative pulsed bias is applied to the target material, which accelerates the positively charged ions to very high velocities. The ion implantation method excludes the problem with pure adhesion of coatings on zirconium alloys [26]. PIII is used for treatment of three-dimensional (3-D) work pieces with complex shapes [27,28]. Our previous results [29,30] have shown positive influence of plasma immersion titanium implantation on the hydrogenation behavior into Zr-1Nb and Zr-2.5Nb. After Ti implantation, hydrogen is preferably accumulated in the modified surface layer consisted of the implanted Ti. Furthermore, the hydrogen concentration is considerably less in the modified sample than in the as-received samples. However, the effect of PIII of titanium on the oxidation behavior has not been studied yet. It is essential to study the oxidation behavior of this modified layer. According to the above mentioned, the purpose of this research is to investigate the influence of Ti implantation on surface morphology, oxidation rate, and phase structure of Zr-1Nb alloy after oxidation in air.

2. Experimental

2.1. Plasma Immersion Implantation of Titanium

The material of interest is Zr-1Nb (0.9–1.1 Nb, 0.09–0.12 O, Zr balanced, wt. %). The samples with fixed size of 1 mm thickness and 30 mm diameter were cut from rolled sheet and polished to the average roughness Ra of 0.045 ± 0.005 μm using sandpaper and diamond paste in order to achieve similar roughness for all of the samples, and to exclude the influence of this parameter on the oxidation results [31]. PIII of Ti was carried out using “Raduga Spectr” technique (National Research Tomsk Polytechnic University, Tomsk, Russia) [29]. The coaxial plasma filter (National Research Tomsk Polytechnic University, Tomsk, Russia) was used to clean the metal plasma from the microdroplet fraction and to focus the plasma flow. The vacuum chamber was evacuated to a base pressure lower than 2.5 × 10⁻³ Pa. Prior to implantation, the samples were cleaned by ion bombardment in argon glow discharge at 1500 V for 3 min in order to remove contamination from the surface. Ti (99.99% purity) from Magnetron AG (Moscow, Russia) was used as cathode material. Table 1 shows the parameters for Ti implantation. Time of implantation and bias voltage that were applied to the sample were chosen according to the hydrogenation results. Samples modified with these parameters have good hydrogen resistance [30]. The surface roughness before and after PIII of Ti are 0.045 ± 0.005 and 0.073 ± 0.008 μm, respectively. The average surface roughness Ra was measured using a contact profilometer Hommel Tester T1000 (Jenoptik, Jena, Germany). Subsequently, three samples after PIII of Ti as well as three initial samples before implantation were heat treated at 400 °C for 5, 24, 72, and 240 h in air under normal atmospheric pressure (101.3 kPa) in a furnace (Nabertherm, Lilienthal, Germany). The weight of each sample was measured with an electronic balance M21S from Sartorius (Goettingen, Germany), and the average weight gain as function of the oxidation time was used to determine the oxidation resistance.
A scanning electron microscope (SEM) from TESCAN Mira II (Brno, Czech Republic) with energy dispersive spectroscopy (EDS) analysis facility (Oxford Analysis, Wiesbaden, Germany) was used to investigate the surface morphology, as well as the entire oxide scale formed on the surface and its composition. For that purpose, cross-sections were prepared: the rectangular-shaped specimens were cut perpendicular to the surface out of the sample, embedded in epoxy resin and mechanically ground with SiC papers (gradation from 220 to 1200) and polished up to 3 µm. Subsequently, a solution of 260 mL OP-S (oxide polishing suspension of 0.04 µm), 40 mL H2O2, 10 mL HNO3, and 0.5 mL HF was used for the “mirror-like” surface finishing of the samples for 1.5 min. EDS was performed in a line scan with exposure time of 100 s per point.

2.2. Characterization

Differential scanning calorimetry (DSC) was used to compare the phase composition in the Zr-1Nb samples before and after titanium implantation. The DSC tests were performed using a DSC-404 F3 calorimeter (Netzsch, Selb, Germany). The DSC system was calibrated using the standard specimens of indium (melting point: 429.7 K), bismuth (melting point: 544.5 K), zinc (melting point: 629.6 K), silver (melting point: 1234.9 K), and gold (melting point: 1337.3 K), to ensure that the accurate temperature measurement within the heating temperature range. The samples were heated from room temperature up to 1050 °C with a heating rate of 10 °C/min under pure argon atmosphere (50 mL/min), in order to avoid oxidation of the samples. After heating, the samples were cooled to room temperature with the same rate. The DSC signals were analyzed to determine the influence of titanium implantation on the phase transformation.
Chemical composition of the surface and valence states was characterized by X-ray photoelectron spectroscopy (XPS) using an Axis Supra (Kratos Analytical, Manchester, UK) spectrometer. The maximum lateral dimension of the analyzed area was 0.7 mm. No charging neutralizer was used during the measurement. The spectra were analyzed without shifting of the binding energy (BE) scale. The spectra were acquired at pass energy of 40 eV. Fitting of XPS spectra was done with CasaXPS software after the subtraction of the Shirley-type background using Gaussian-Lorentzian (G-L) peaks with fixed G-L percentage of 30%. Values of binding energies (BEs) were taken from the literature [32,33]. Fitting of Ti2p 3/2 spectrum was performed using four components: metallic titanium Ti° (BE = 454.1 ± 0.1 eV, FWHM = 0.9 ± 0.1 eV), Ti2+ corresponding to titanium nitride TiN or suboxide TiO (BE = 454.9 ± 0.1 eV, FWHM = 1.3 ± 0.1 eV), Ti3+ corresponding to suboxide Ti2O3 (BE = 455.8 ± 0.1 eV, FWHM = 1.7 ± 0.1 eV), and Ti4+ corresponding to TiO2 (BE = 458.2 ± 0.1 eV, FWHM = 1.8 ± 0.1 eV). Fitting of Zr 3d 5/2 spectra was performed using the following components: ZrO2 (BE = 183.6 eV, FWHM = 1.6 eV), Zr suboxide A (BE = 180.5 eV, FWHM = 1.4 eV), Zr suboxide B (BE = 179.4 eV, FWHM = 1.0 eV), and metallic Zr0 (BE = 178.8 eV, FWHM = 0.7 eV). Prior to analysis, the surface of the samples was cleaned by Ar+ ion sputtering (beam energy of 3 keV) for 20 s.
Phase identification and structural investigations were performed using grazing incidence X-ray diffraction (GIXRD) with Cu Kα radiation (1.5410 Å wavelength) inside a D8 Discover (Bruker AXS, Karlsruhe, Germany) diffractometer in asymmetric mode at 40 kV, 30 mA with an incident beam angle of 3°.

3. Results and Discussion

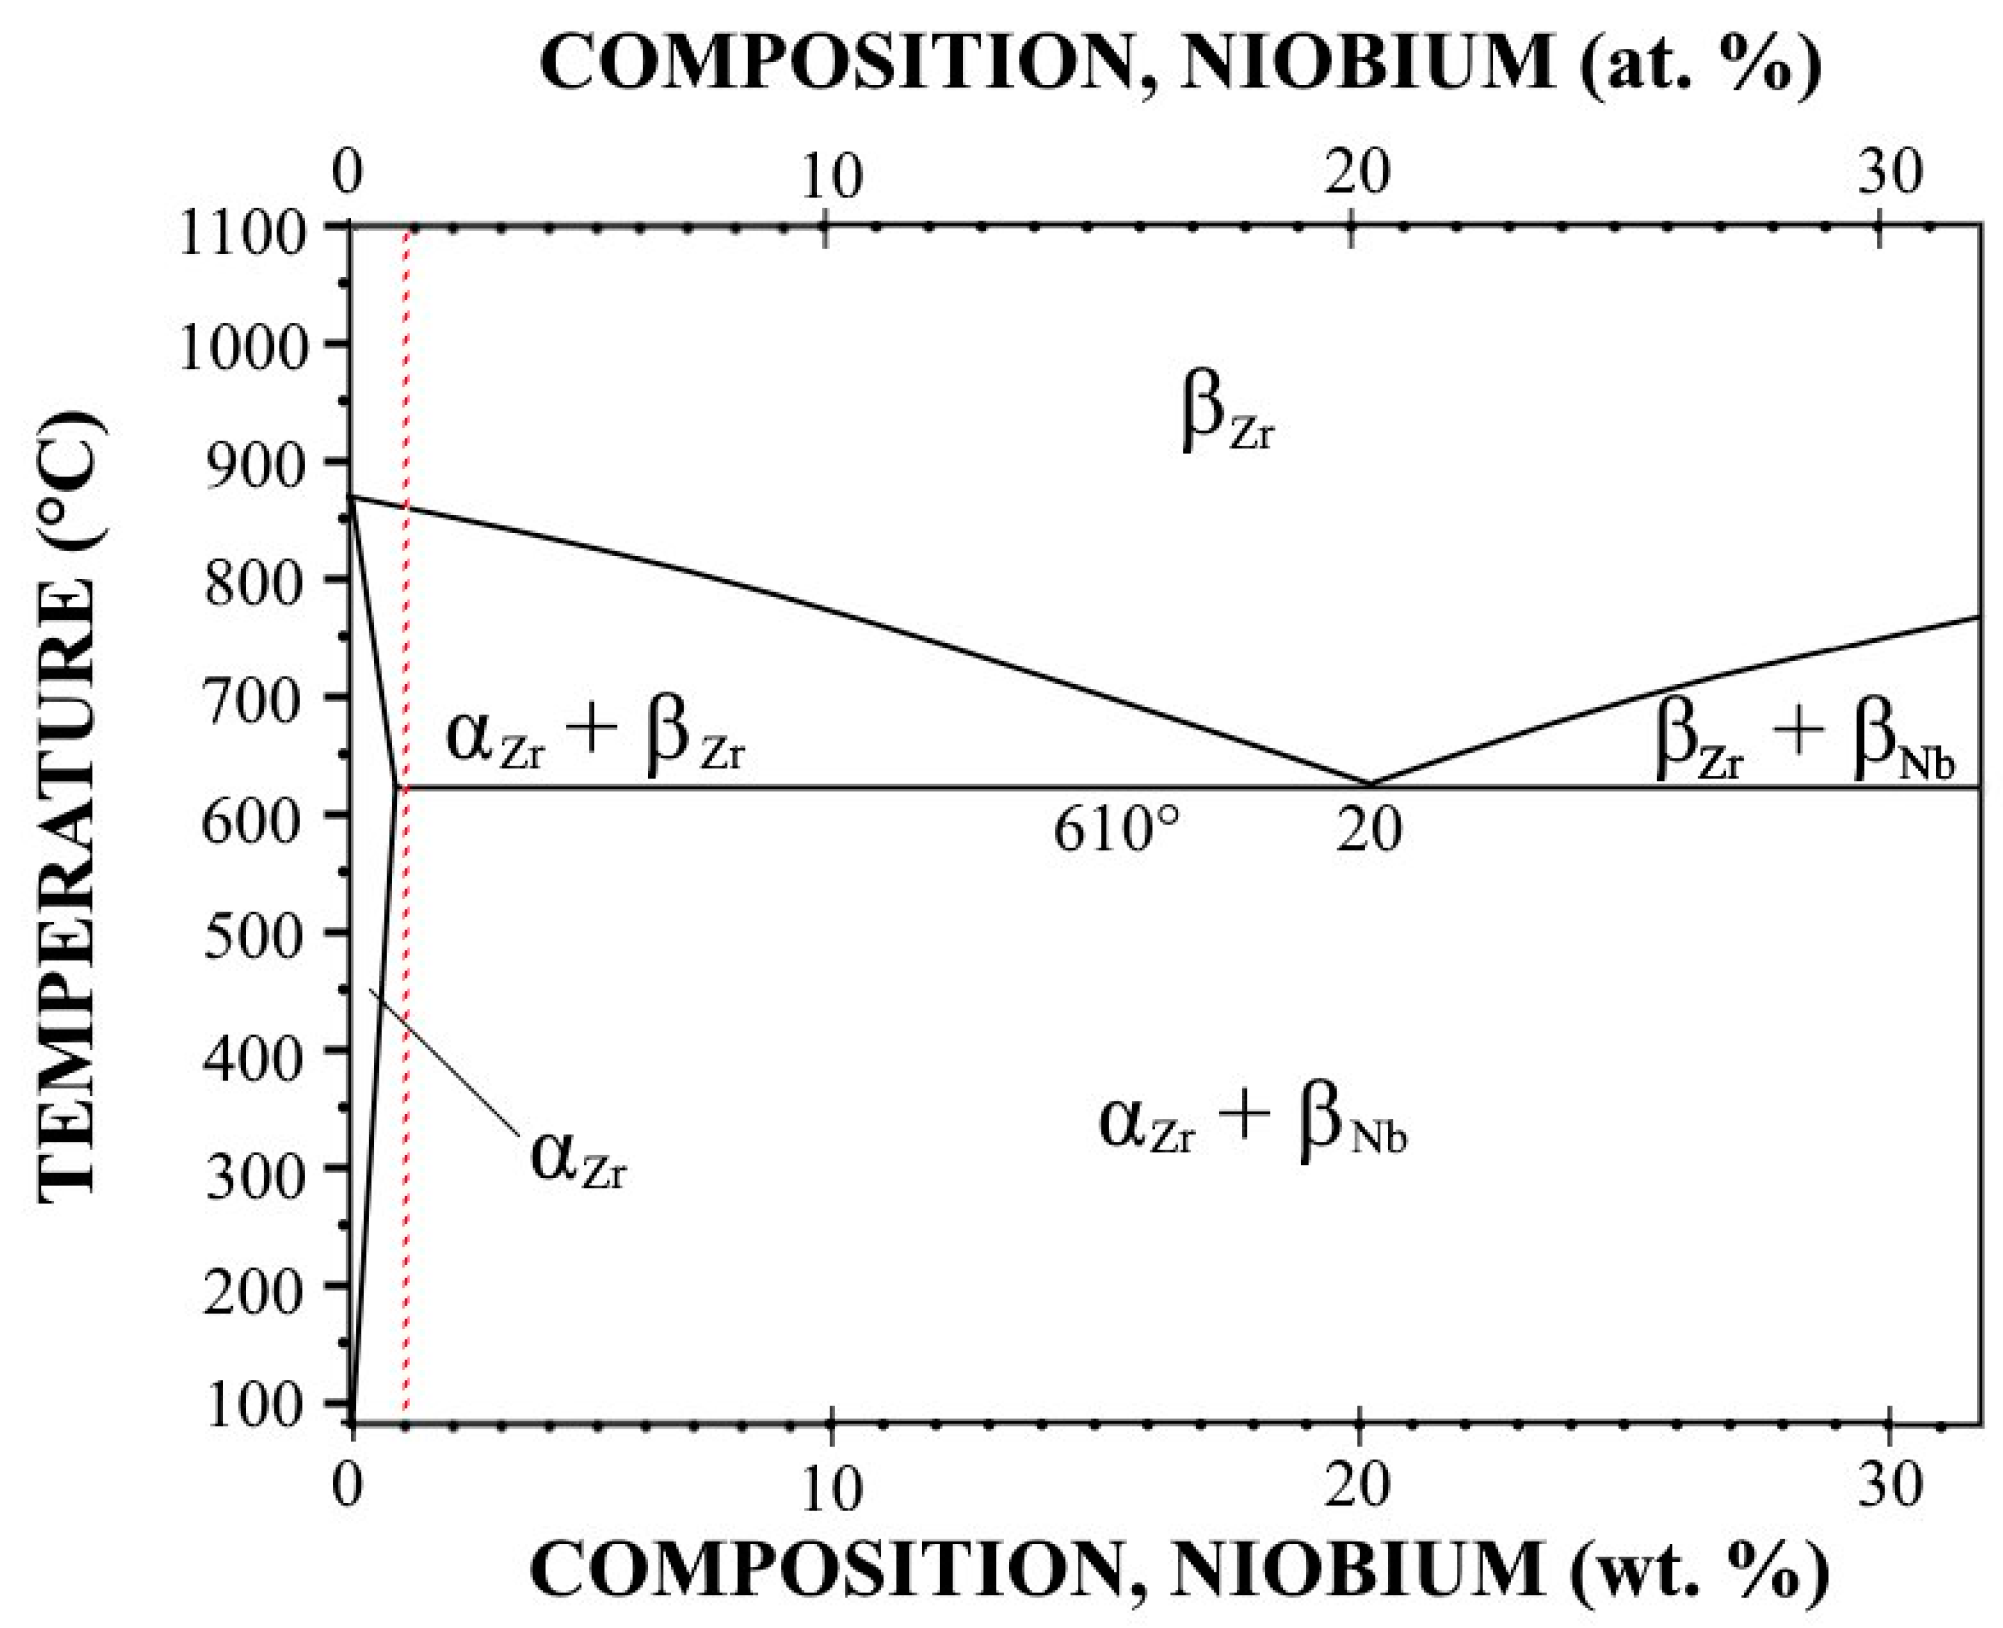
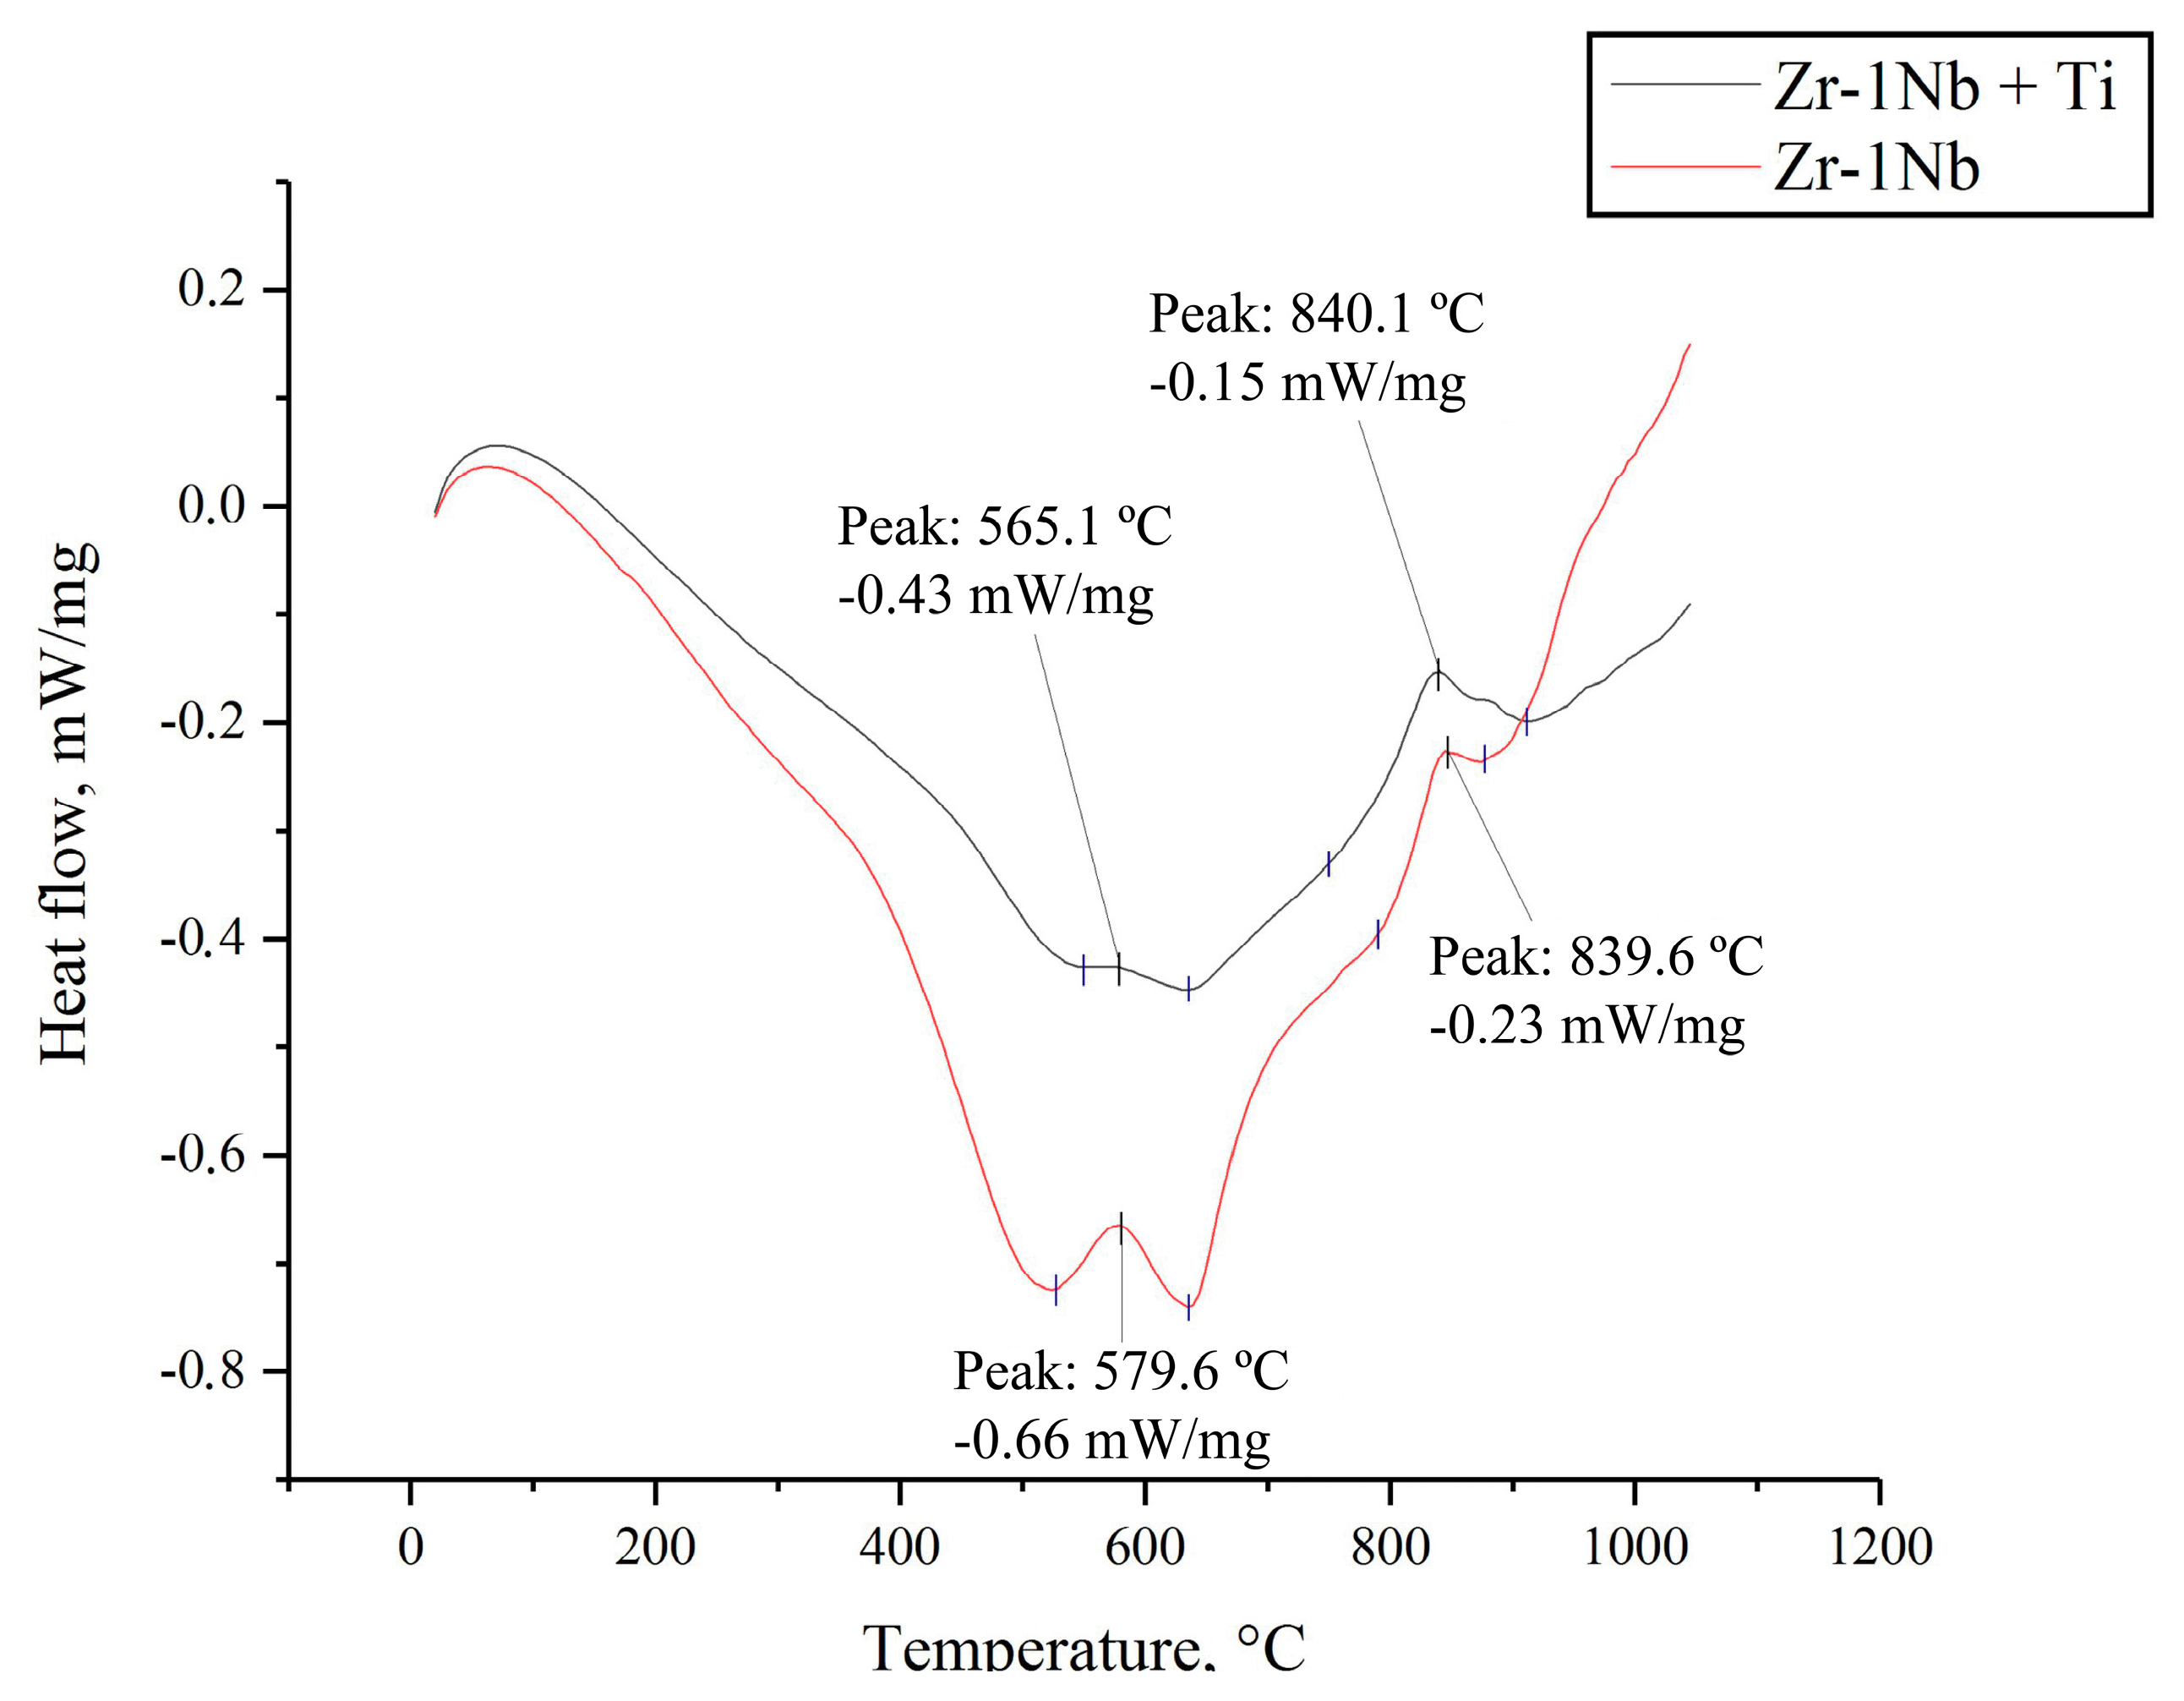
3.1. Differential Scanning Calorimetry

Figure 2 shows representative DSC curves obtained for continuous heating of the samples before and after titanium implantation. Two transitions are visible. DSC peak analysis shows that in Zr-1Nb before implantation the first transformation takes place at a higher temperature (579.6 °C) than for the sample after PIII of titanium (Zr-1Nb+Ti) (565.1 °C). Furthermore, the heat flow for the Ti-implanted sample (Zr-1Nb+Ti) is sufficiently lower than for the as-received alloy. The low temperature transition is attributed to the thermal decomposition of the metastable niobium-stabilized β-phase.
The highest transition temperature, appears between 790 and 870 °C with peak at 839.6 °C for Zr-1Nb, and between 760 and 910 °C, with peak at 840.1 °C for Zr-1Nb+Ti, respectively. This transition temperature is caused by the phase transformation of hcp α-Zr to bcc β-Zr. The heat of phase transformation is sufficiently lower in the case of Zr-1Nb+Ti than without Ti. Beneš et al. [34] reported that the starting point of the α-β transition depends on the temperature (equilibrium state), as well as on the heating rate.
Canay et al. [35] indicated a temperature of 776 °C for α → α + β transformation of Zr-1Nb alloy in comparison to Tα→β of 863 °C for pure Zr [36], indicating that Nb stabilized the β-Zr phase. Furthermore, they found that addition of Sn stabilizes the β phase. Yang et al. [37] reported that both transformation temperatures Tα→(α+β) and T(α+β)→β were lowered by Mo addition. Similar to the addition of Nb, Mo, and Sn [36,37,38], implantation of Ti into Zr-1Nb alloys decreases both Tα→(α+β) and T(α+β)→β temperature, respectively. Therefore, titanium exhibits effects of stabling β phase.

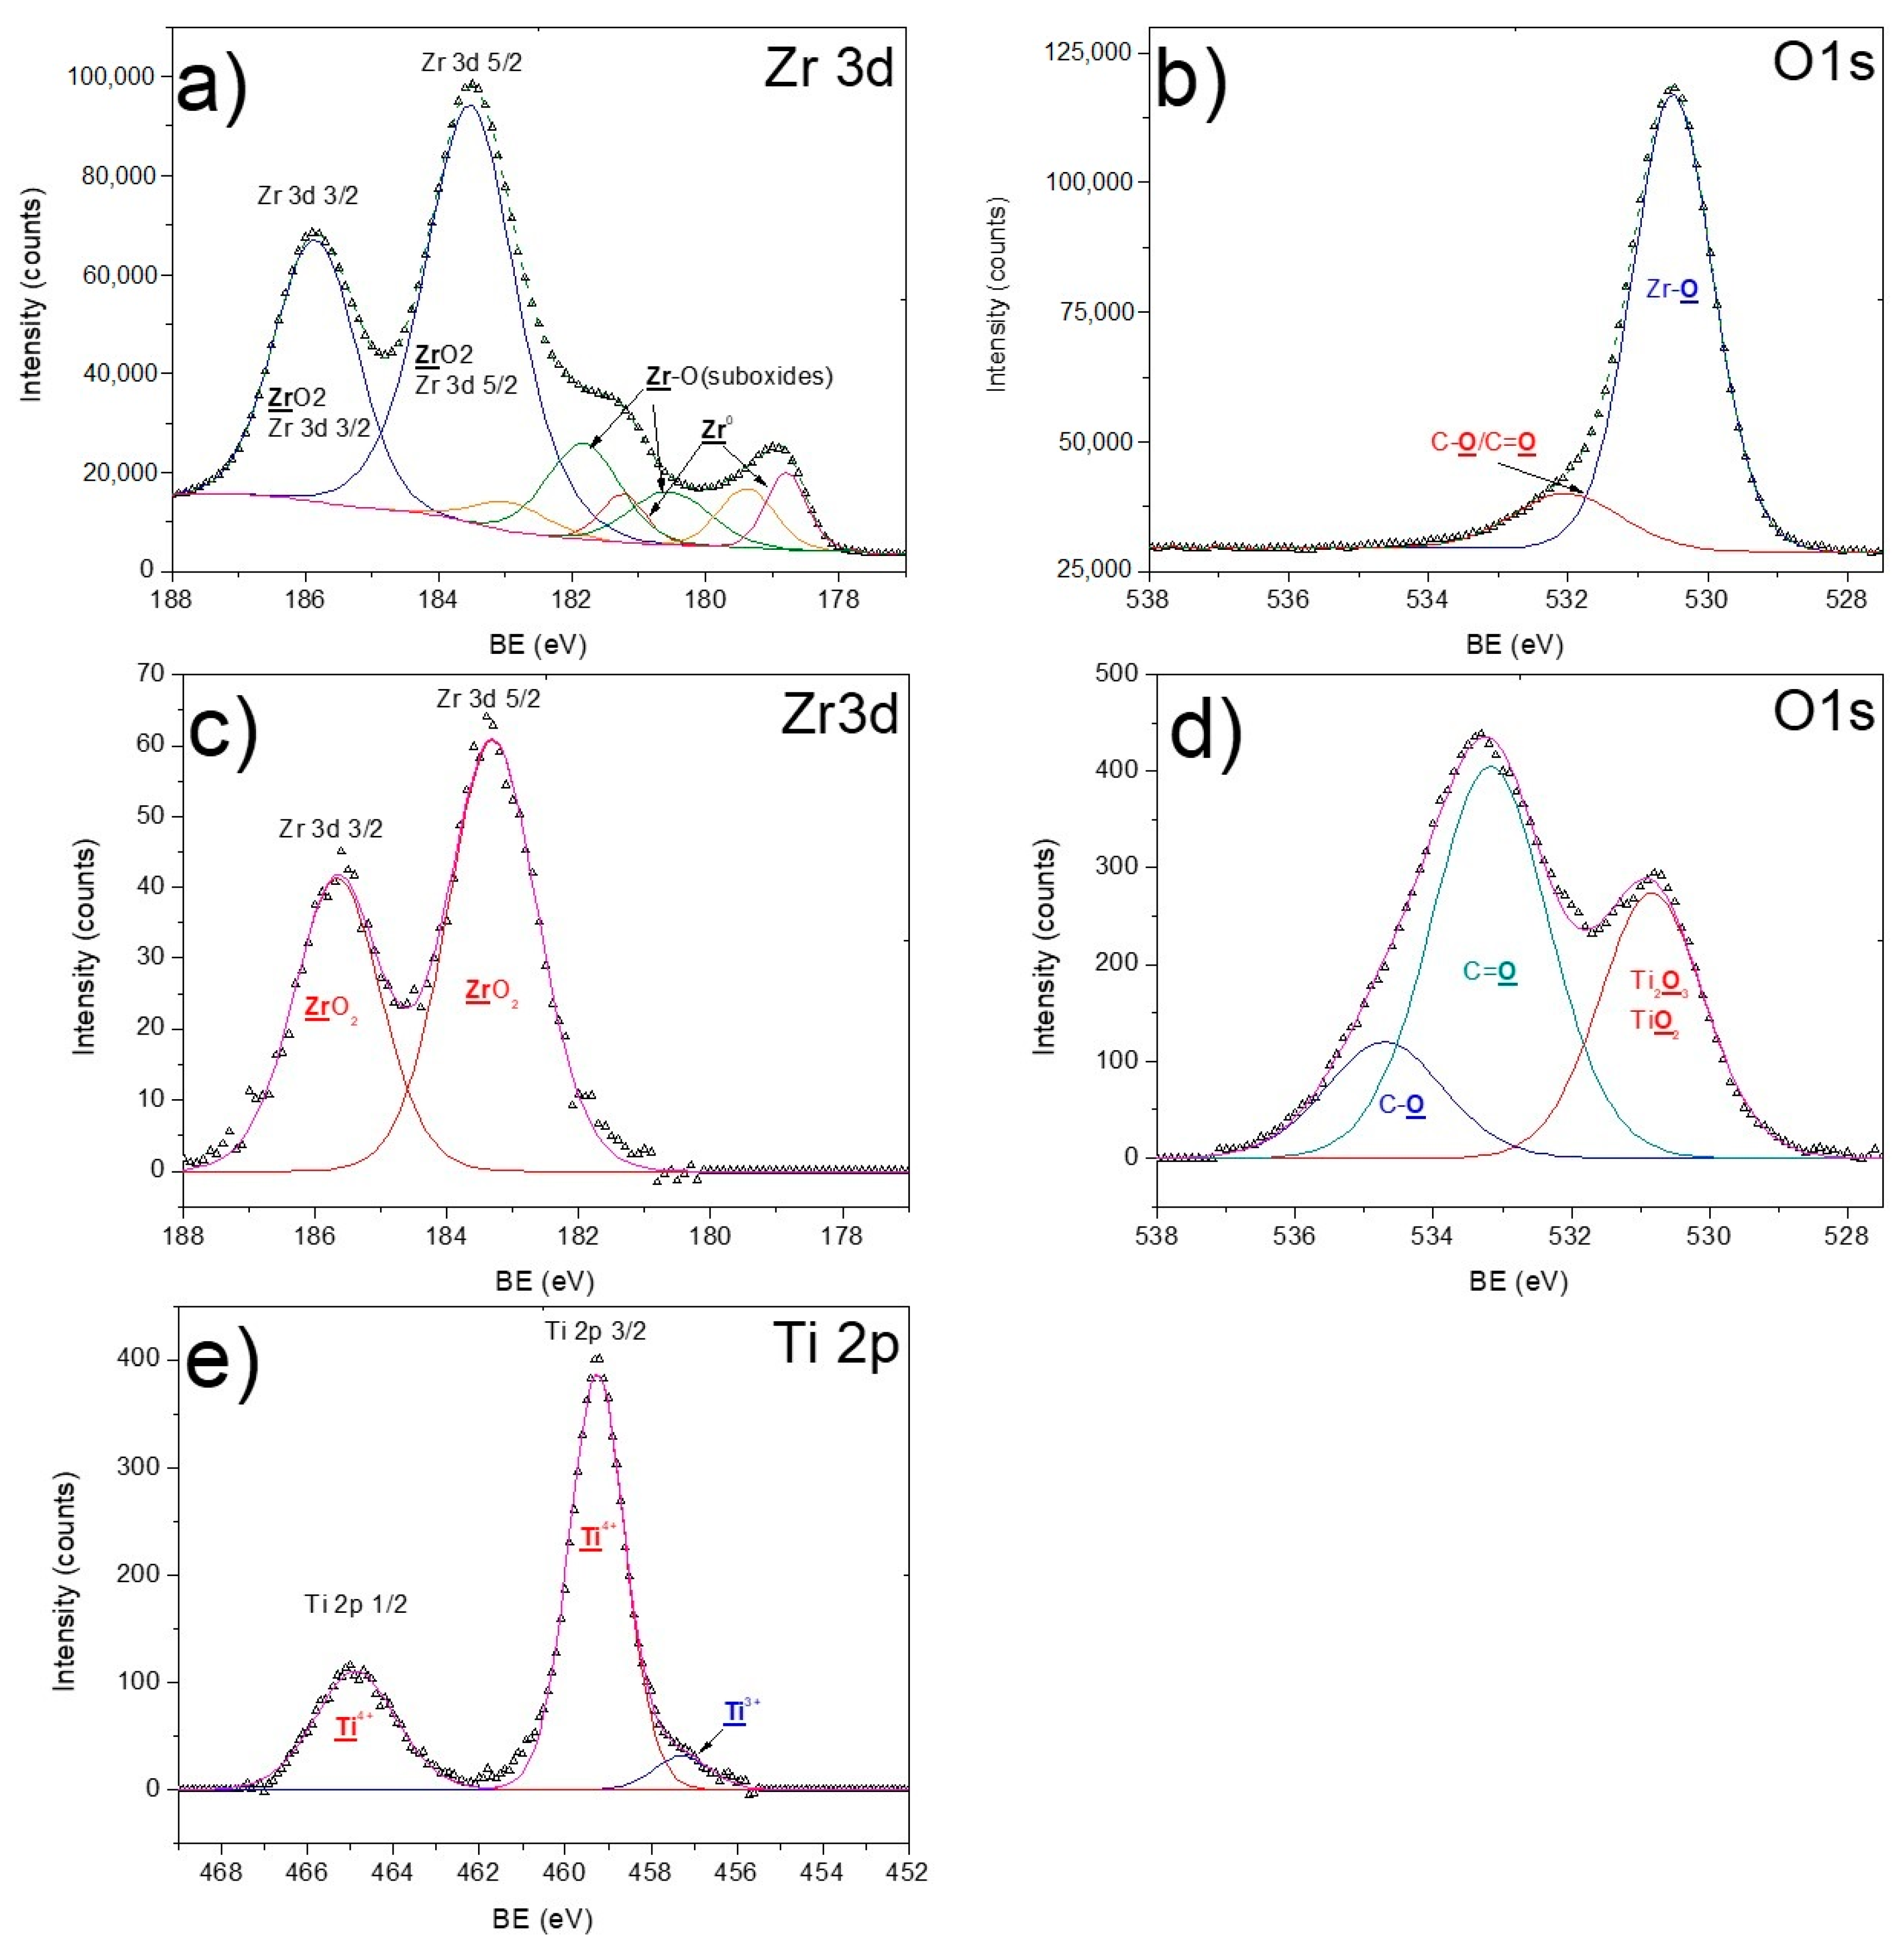
3.2. X-ray Photoelectron Spectroscopy

The pristine surface of the zirconium alloy is mainly composed of zirconium oxide ZrO2 as O1s (Zr-O contribution at 530.4 eV) and Zr three-dimensional (3d) XPS curve fitting reveals (Figure 3). The BE of ZrO2 contribution within Zr 3d 3/2 and Zr 3d 5/2 spectra was about 185.9 and 183.6 eV, respectively. Zirconium suboxides (BE~180 eV), metallic zirconium (BE~178.8 eV) and some carbon contaminations are present at the surface. Even though the structure of the Zr3d exhibited very small changes, after Ti implantation the composition of the surface has significantly changed, as suboxides and metallic zirconium contributions were diminished. Ti2p and O1s signals suggest that a significant amount of titanium oxide is implanted into the material. The Ti2p XPS spectrum after implantation was fitted with the sum of the two components: Ti4+ (TiO2) and Ti3+ (Ti2O3). The concentration of Ti2O3 phase was so small that it becomes visual exclusively by a stronger Ti 2p 3/2 line. Due to higher relative sensitivity factor (RSF), and as a result, of higher signal to noise ratio and accuracy of Ti2p 3/2, only the results for Ti2p 3/2 fitting were reported.
The fitting of O1s XPS spectra revealed that the main oxygen environment is TiO2 or Ti2O3. The BE of oxygen is almost the same in both oxides (around 530.7 eV), and therefore it is impossible to distinguish the amount of O atoms linked to TiO2 or Ti2O3 structures. The contributions of oxygen at higher BE (532.5 and 533.2 eV) correspond to C=O and C–O environments, respectively. This is in good agreement with Peng et al. [39] who reported that the implanted titanium exists in the form of TiO2 and zirconium as ZrO2, too.

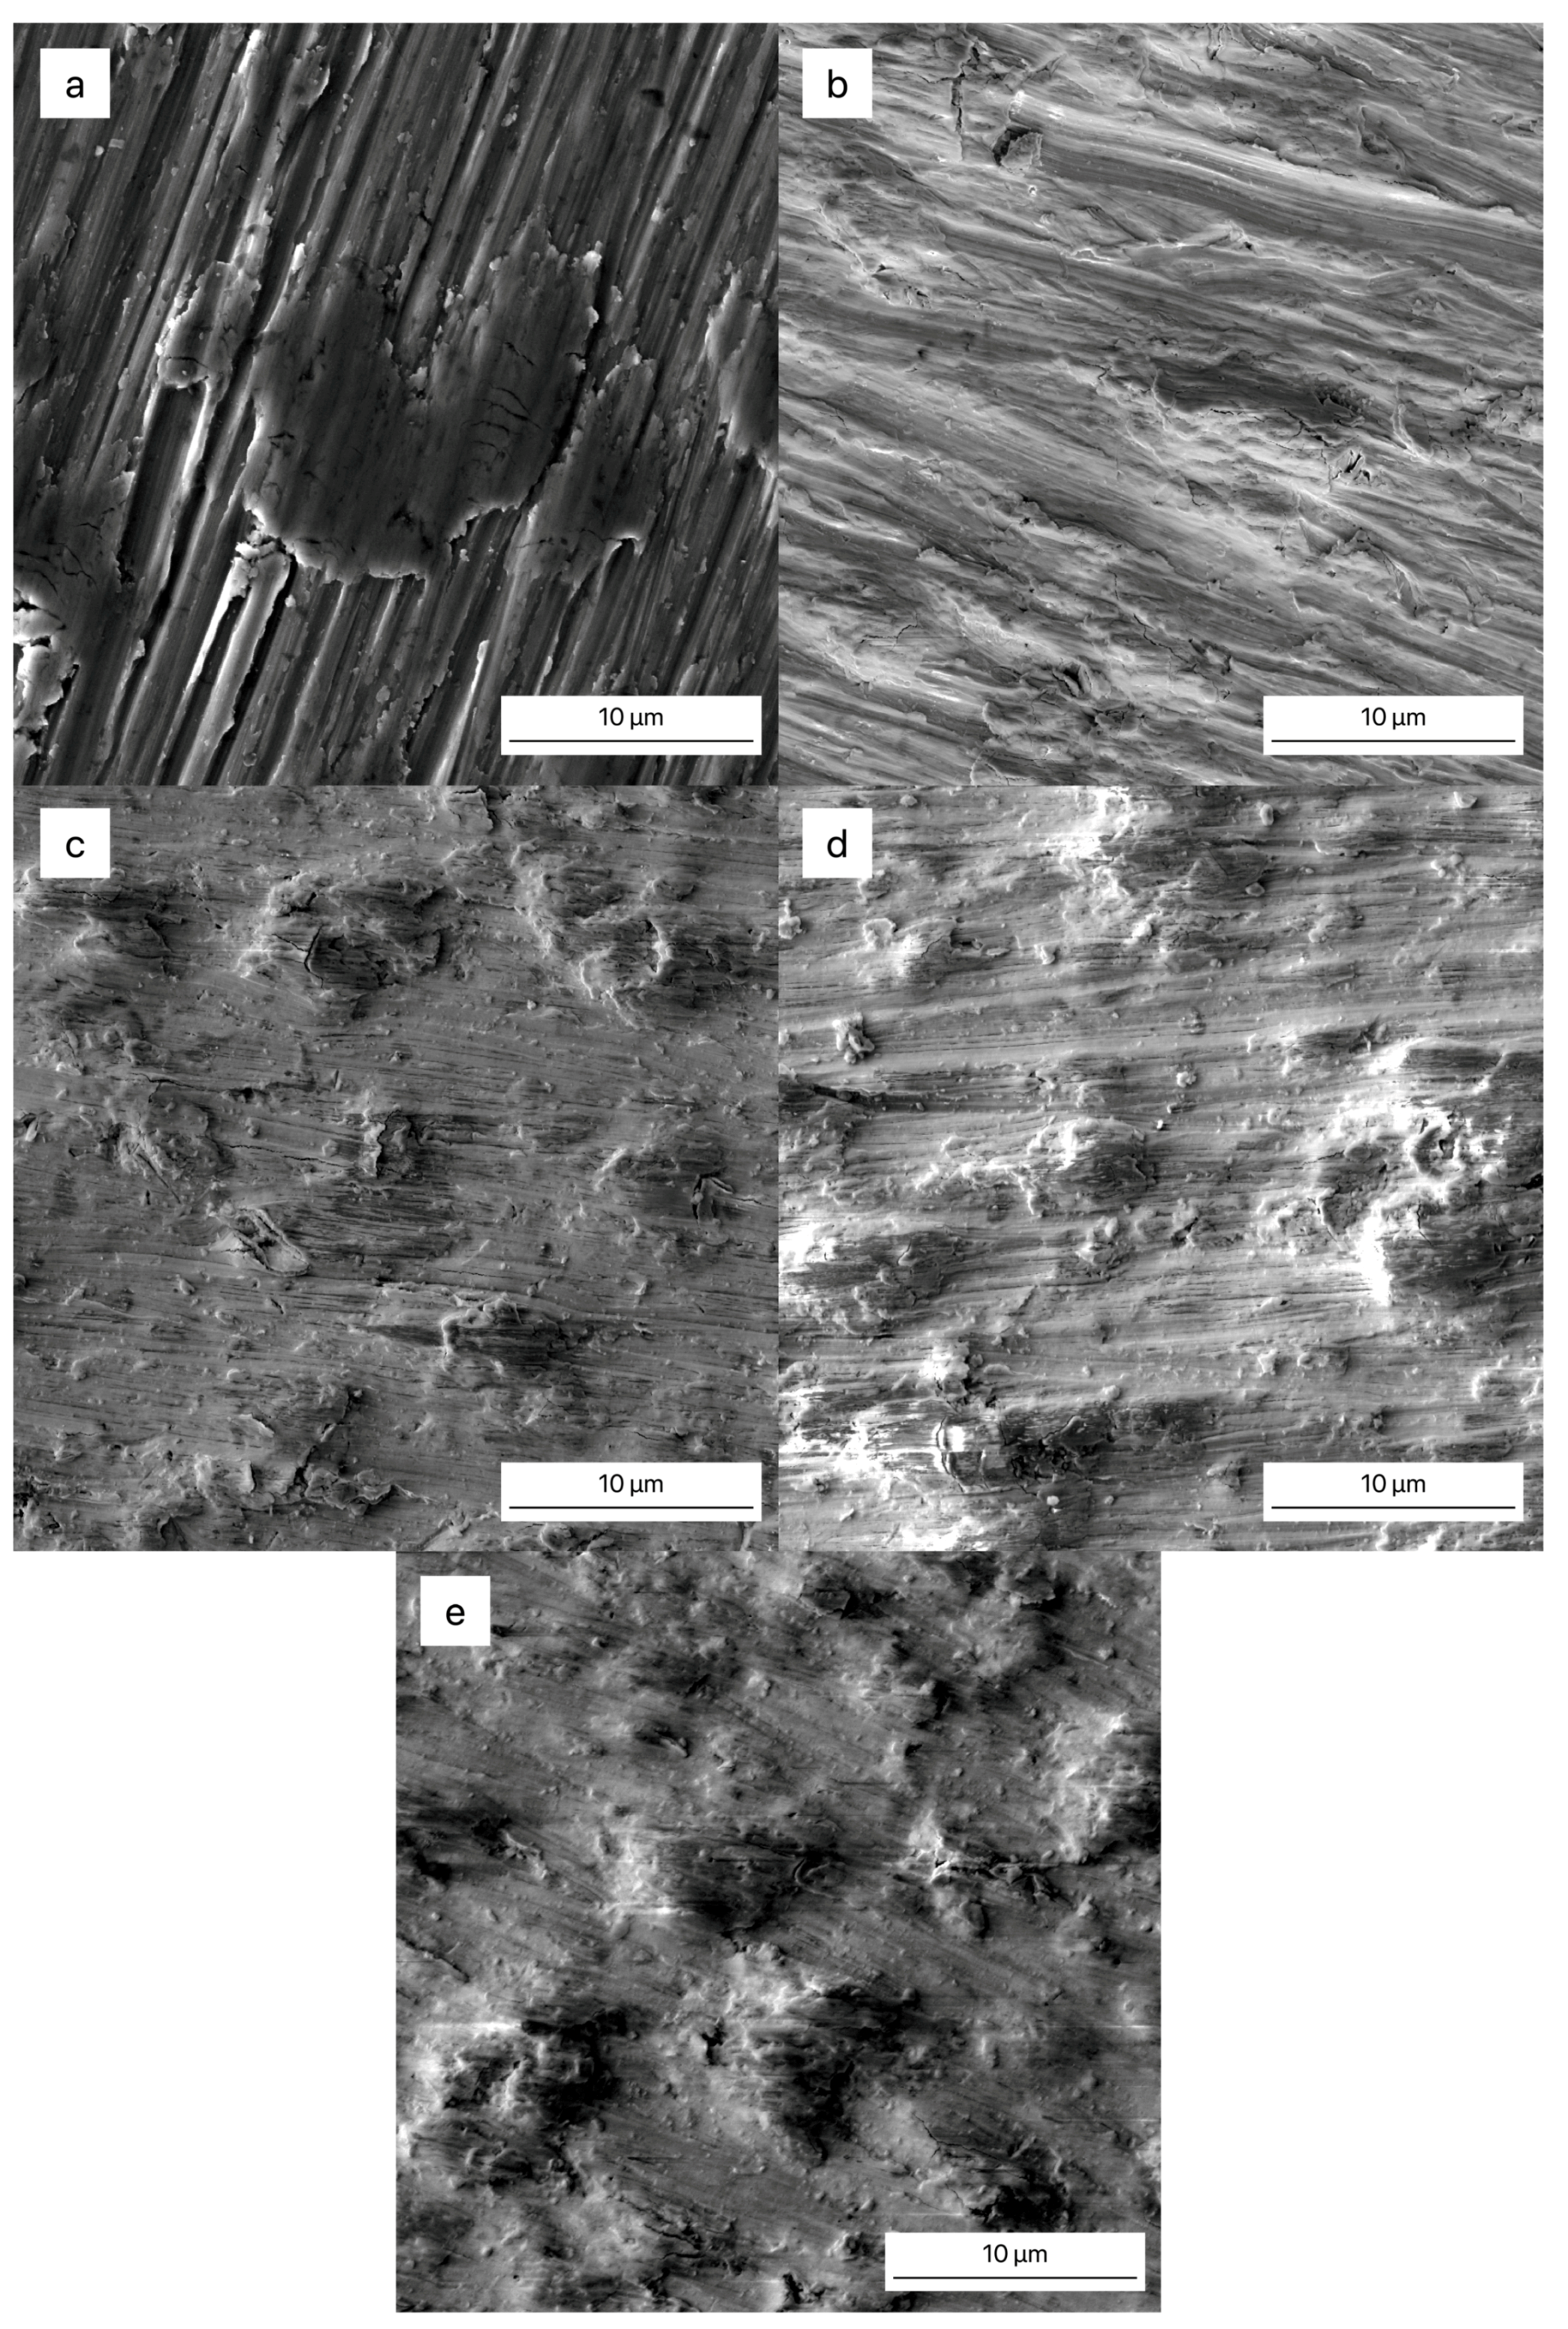
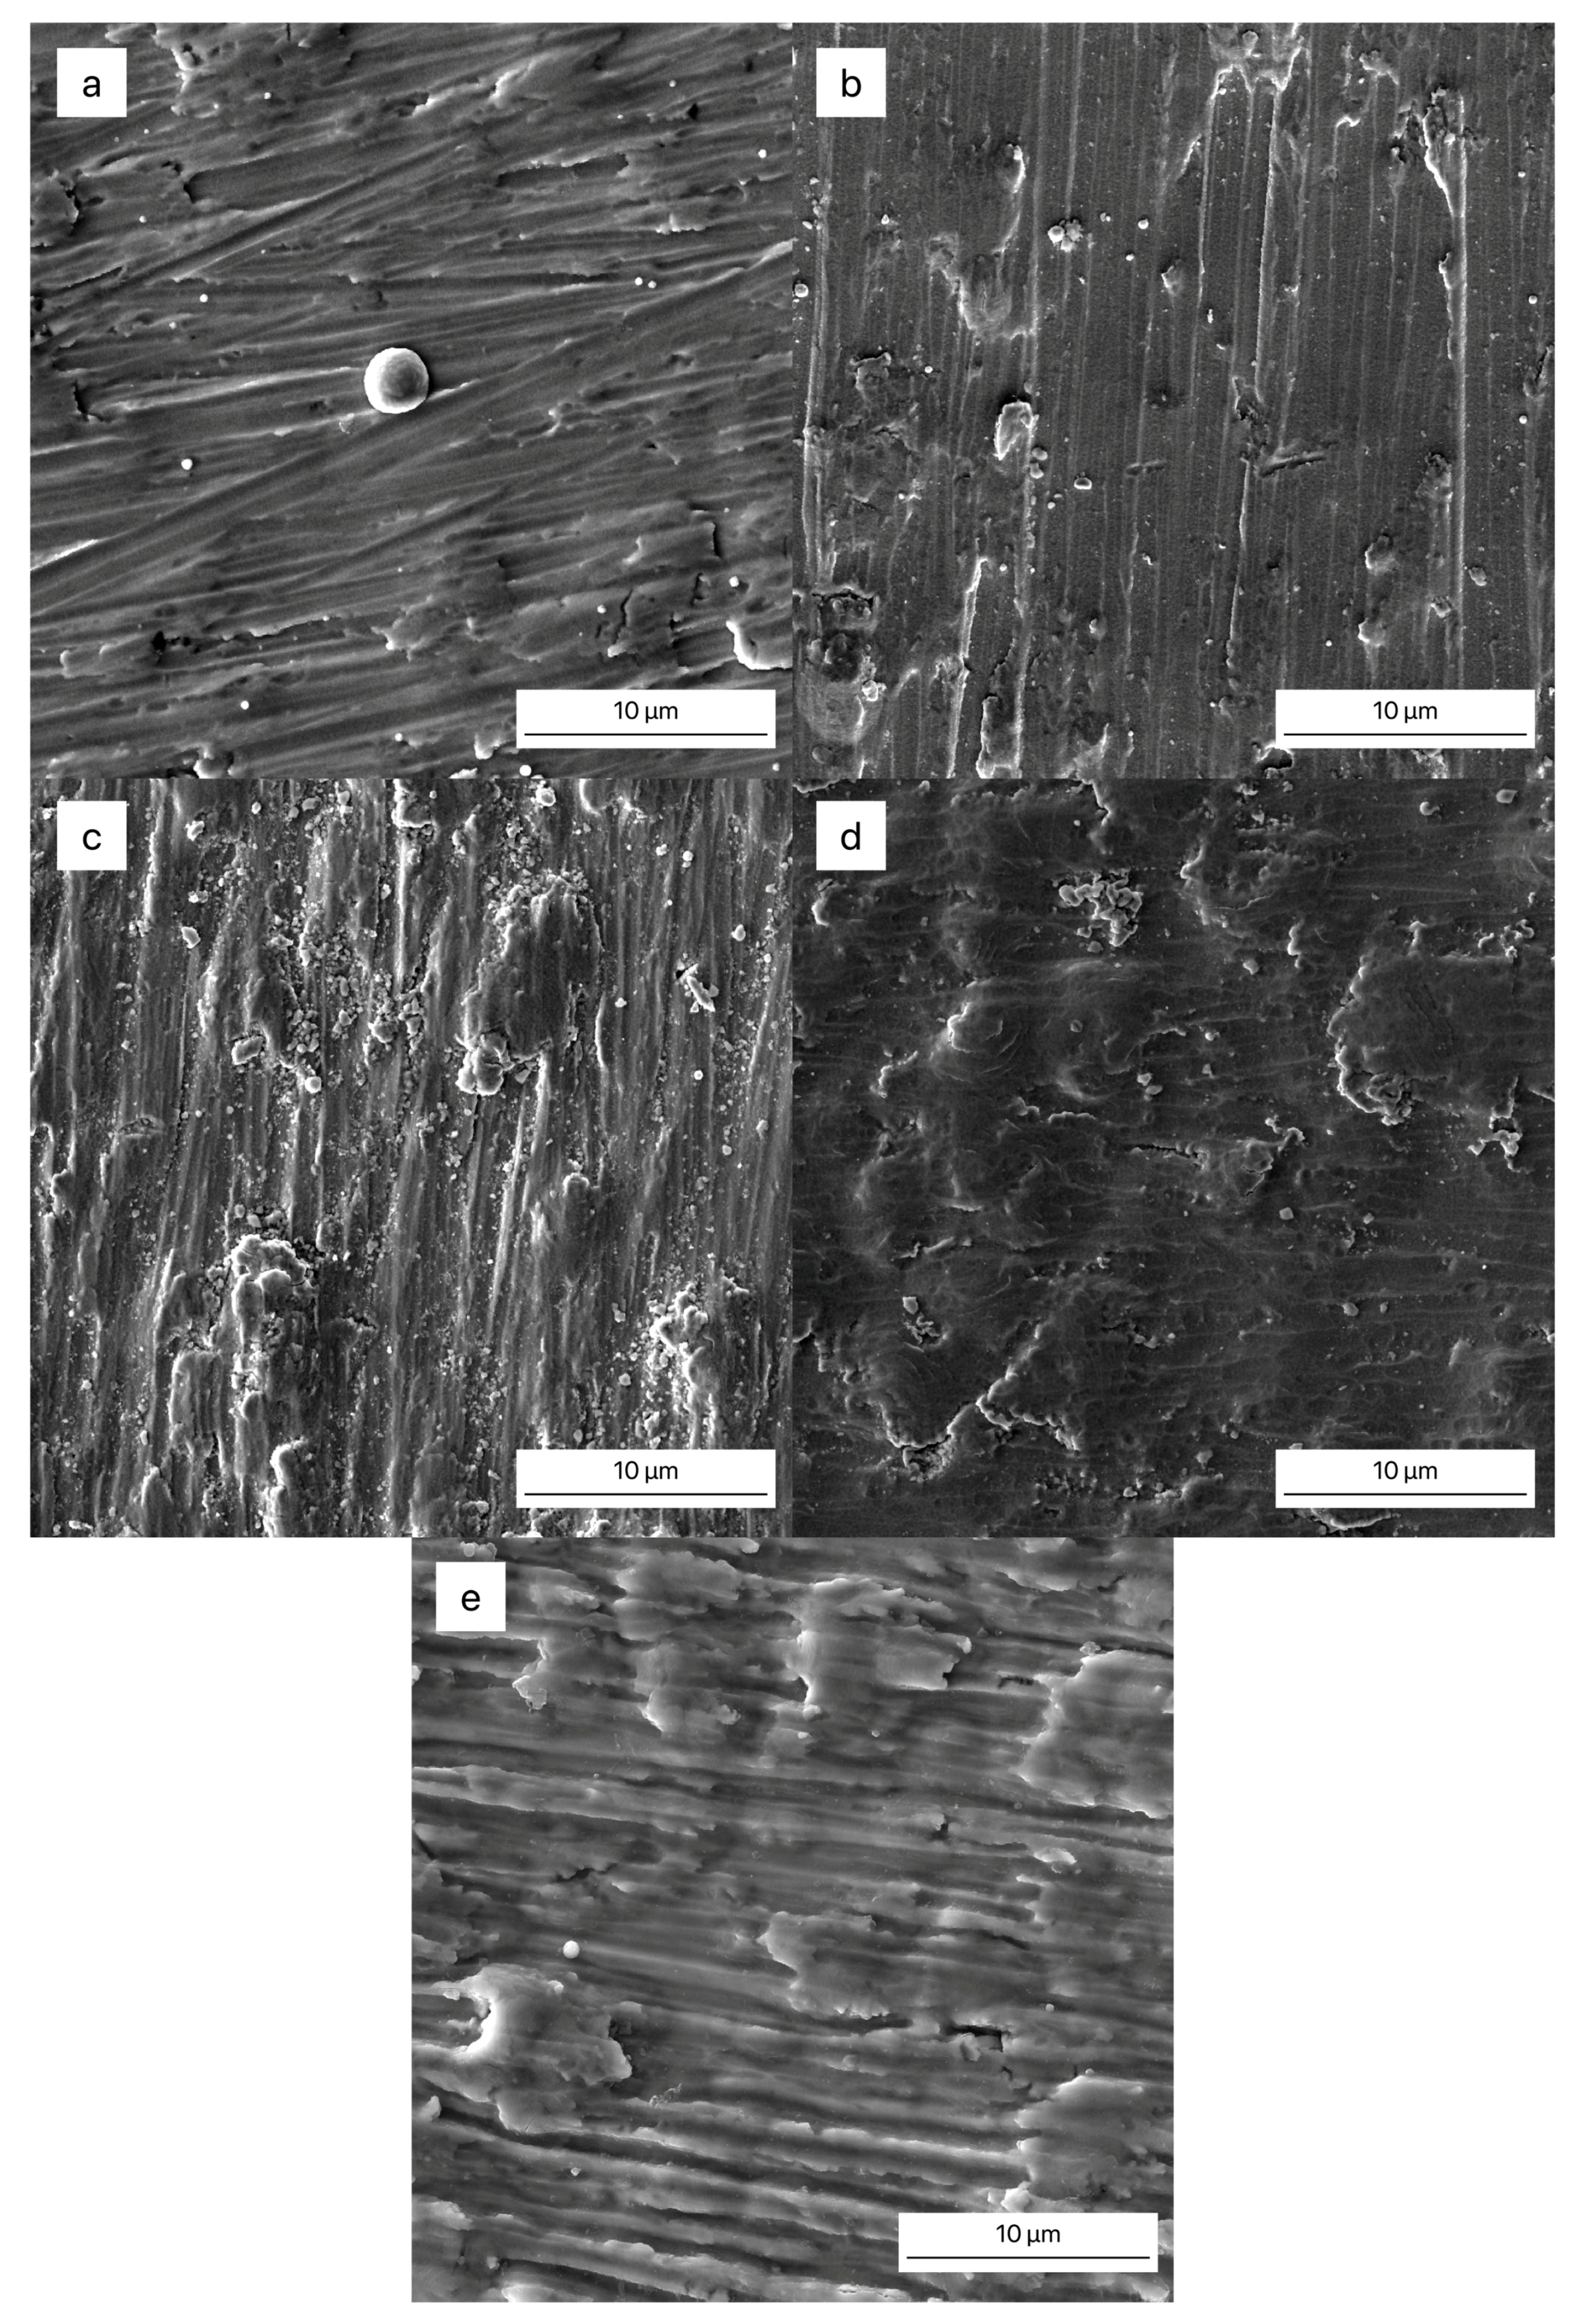
3.3. Surface Morphology
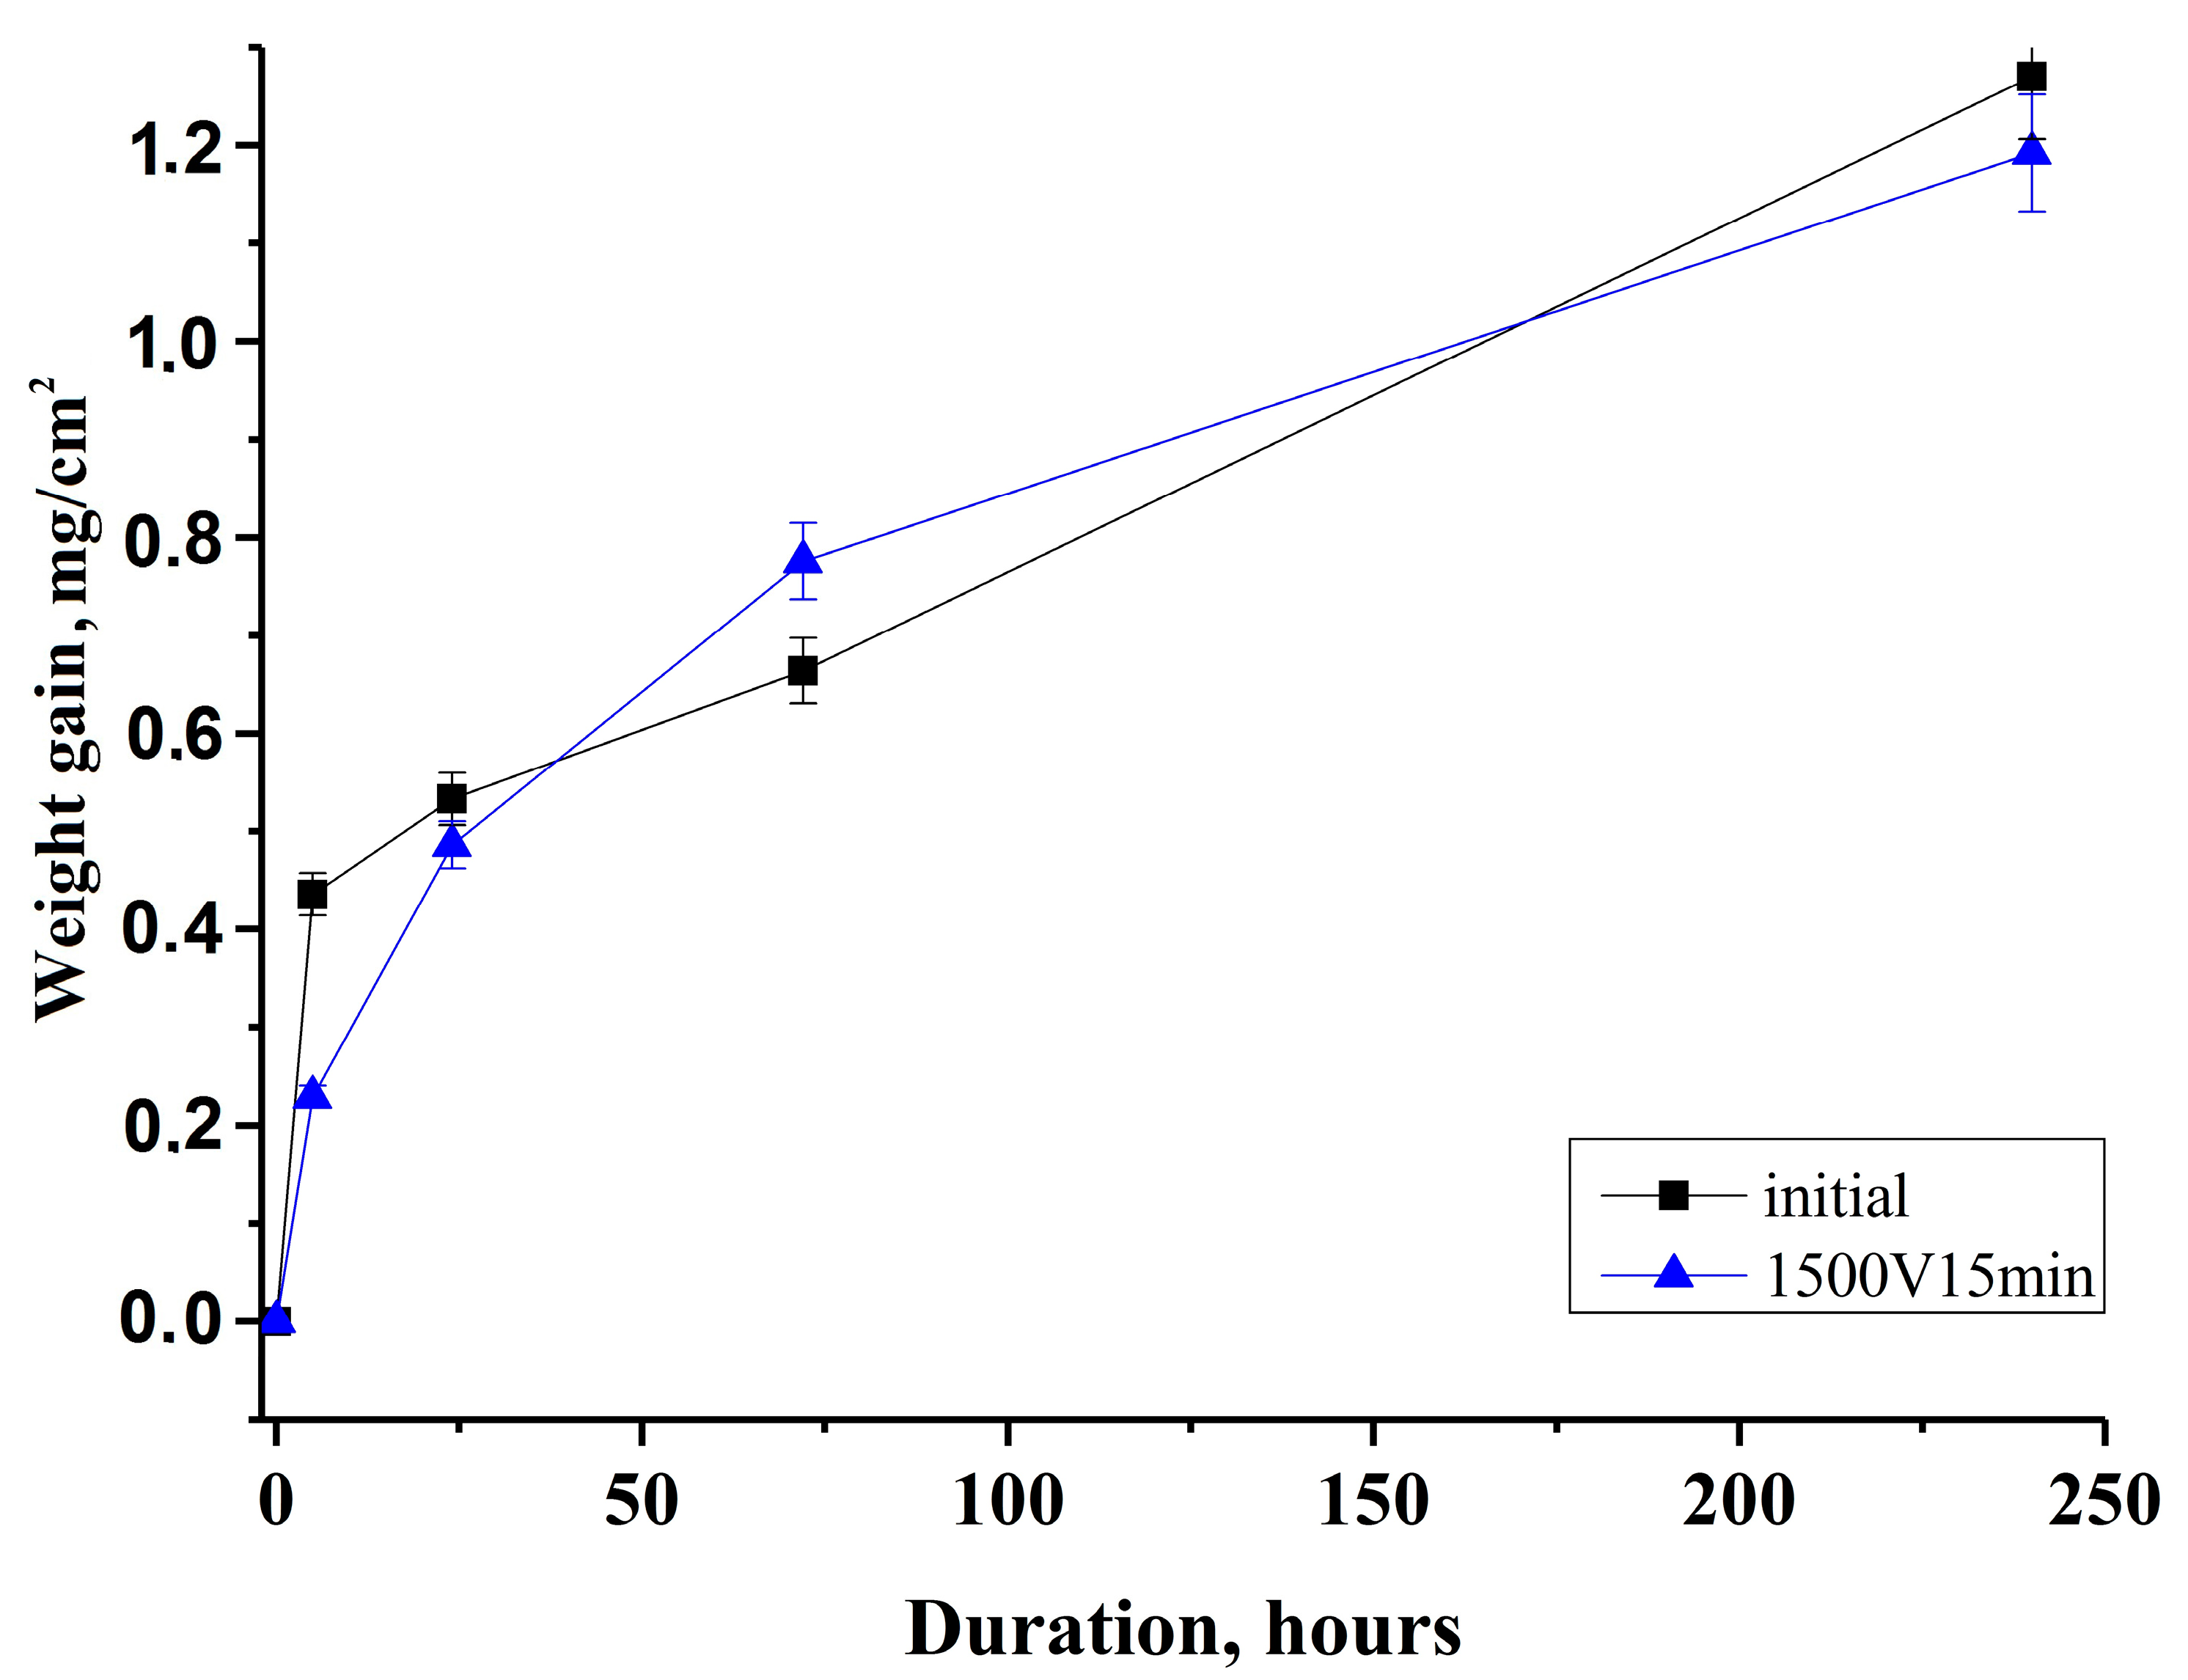
Figure 4 shows surface morphologies of as-received Zr-1Nb before and after oxidation in air for 5, 24, 72 and 240 h. In Figure 5 the corresponding morphologies of zirconium alloy after PIII of Ti before and after oxidation with the above mentioned durations are given. The surface morphologies of the non-implanted and implanted samples are quite different. Occurrence of local corrosion with cracks is observed on the surface of as-received Zr-1Nb, even after 5 h of oxidation. This can be attributed to the transformation from t-ZrO2 to m-ZrO2, resulting in a micro-porous surface layer [40]. During oxidation the polishing traces on the surface are smoothened due to the growth of oxides. On the surface of the titanium implanted samples, microcracks appear after the first 24 h of oxidation. However, they are formed mainly on traces and surface defects left after grinding. The absence of local corrosion after PIII of titanium indicates a uniform oxidation of the surface for 240 h.

3.4. Weight-Gains

Figure 6 shows the results of weight-gain after oxidation for 5, 24, 72, and 240 h in air of as-received Zr-1Nb and after PIII of Ti, respectively. The oxidation rate of the as-received Zr-1Nb after heat treatment between 5 h and 24 h is almost two times higher than the one of the alloy after PIII of Ti. During oxidation, the weight gain of all the samples should develop according to t1/2, if we assume that bulk diffusion of oxygen on the surface of the Zr1Nb alloy will be predominant. The weight gain of Zr-1Nb with implanted titanium rises for long oxidation time and converges to the values of the non-implanted samples. This can be attributed to phase formations different to the ones occurring in the as-received alloy as shown below. Another reason can be the low thickness of the modified layer. Complete oxidation of the layer does not significantly influence the oxidation kinetics in total. As a result, after oxidation for 72 h the weight gain of specimens that were modified at 1500 V for 15 min is higher than the one of as-received Zr-1Nb. However, this behavior (acceleration of the oxidation kinetics) of Zr-1Nb after Ti implantation is not observed after oxidation for 240 h and the weight gains of the specimens are within the margin error. Peng et al. [41] investigated the influence of aluminum ion implantation on the oxidation behavior of ZIRLO alloy (Nb 0.99 wt. %, Sn 0.98 wt. %, Fe 0.11 wt. %, Cr 0.008 wt. %, Si 0.003 wt. %, O 0.11 wt. %, C 0.007 wt. %, balanced with zirconium) in air for 120 min, and also observed the beneficial effect of implantation. However, his time of oxidation was significantly lower than the one in this study and implantation parameters used in his work significantly differ from the ones in our study (40, 80, and 120 KeV).

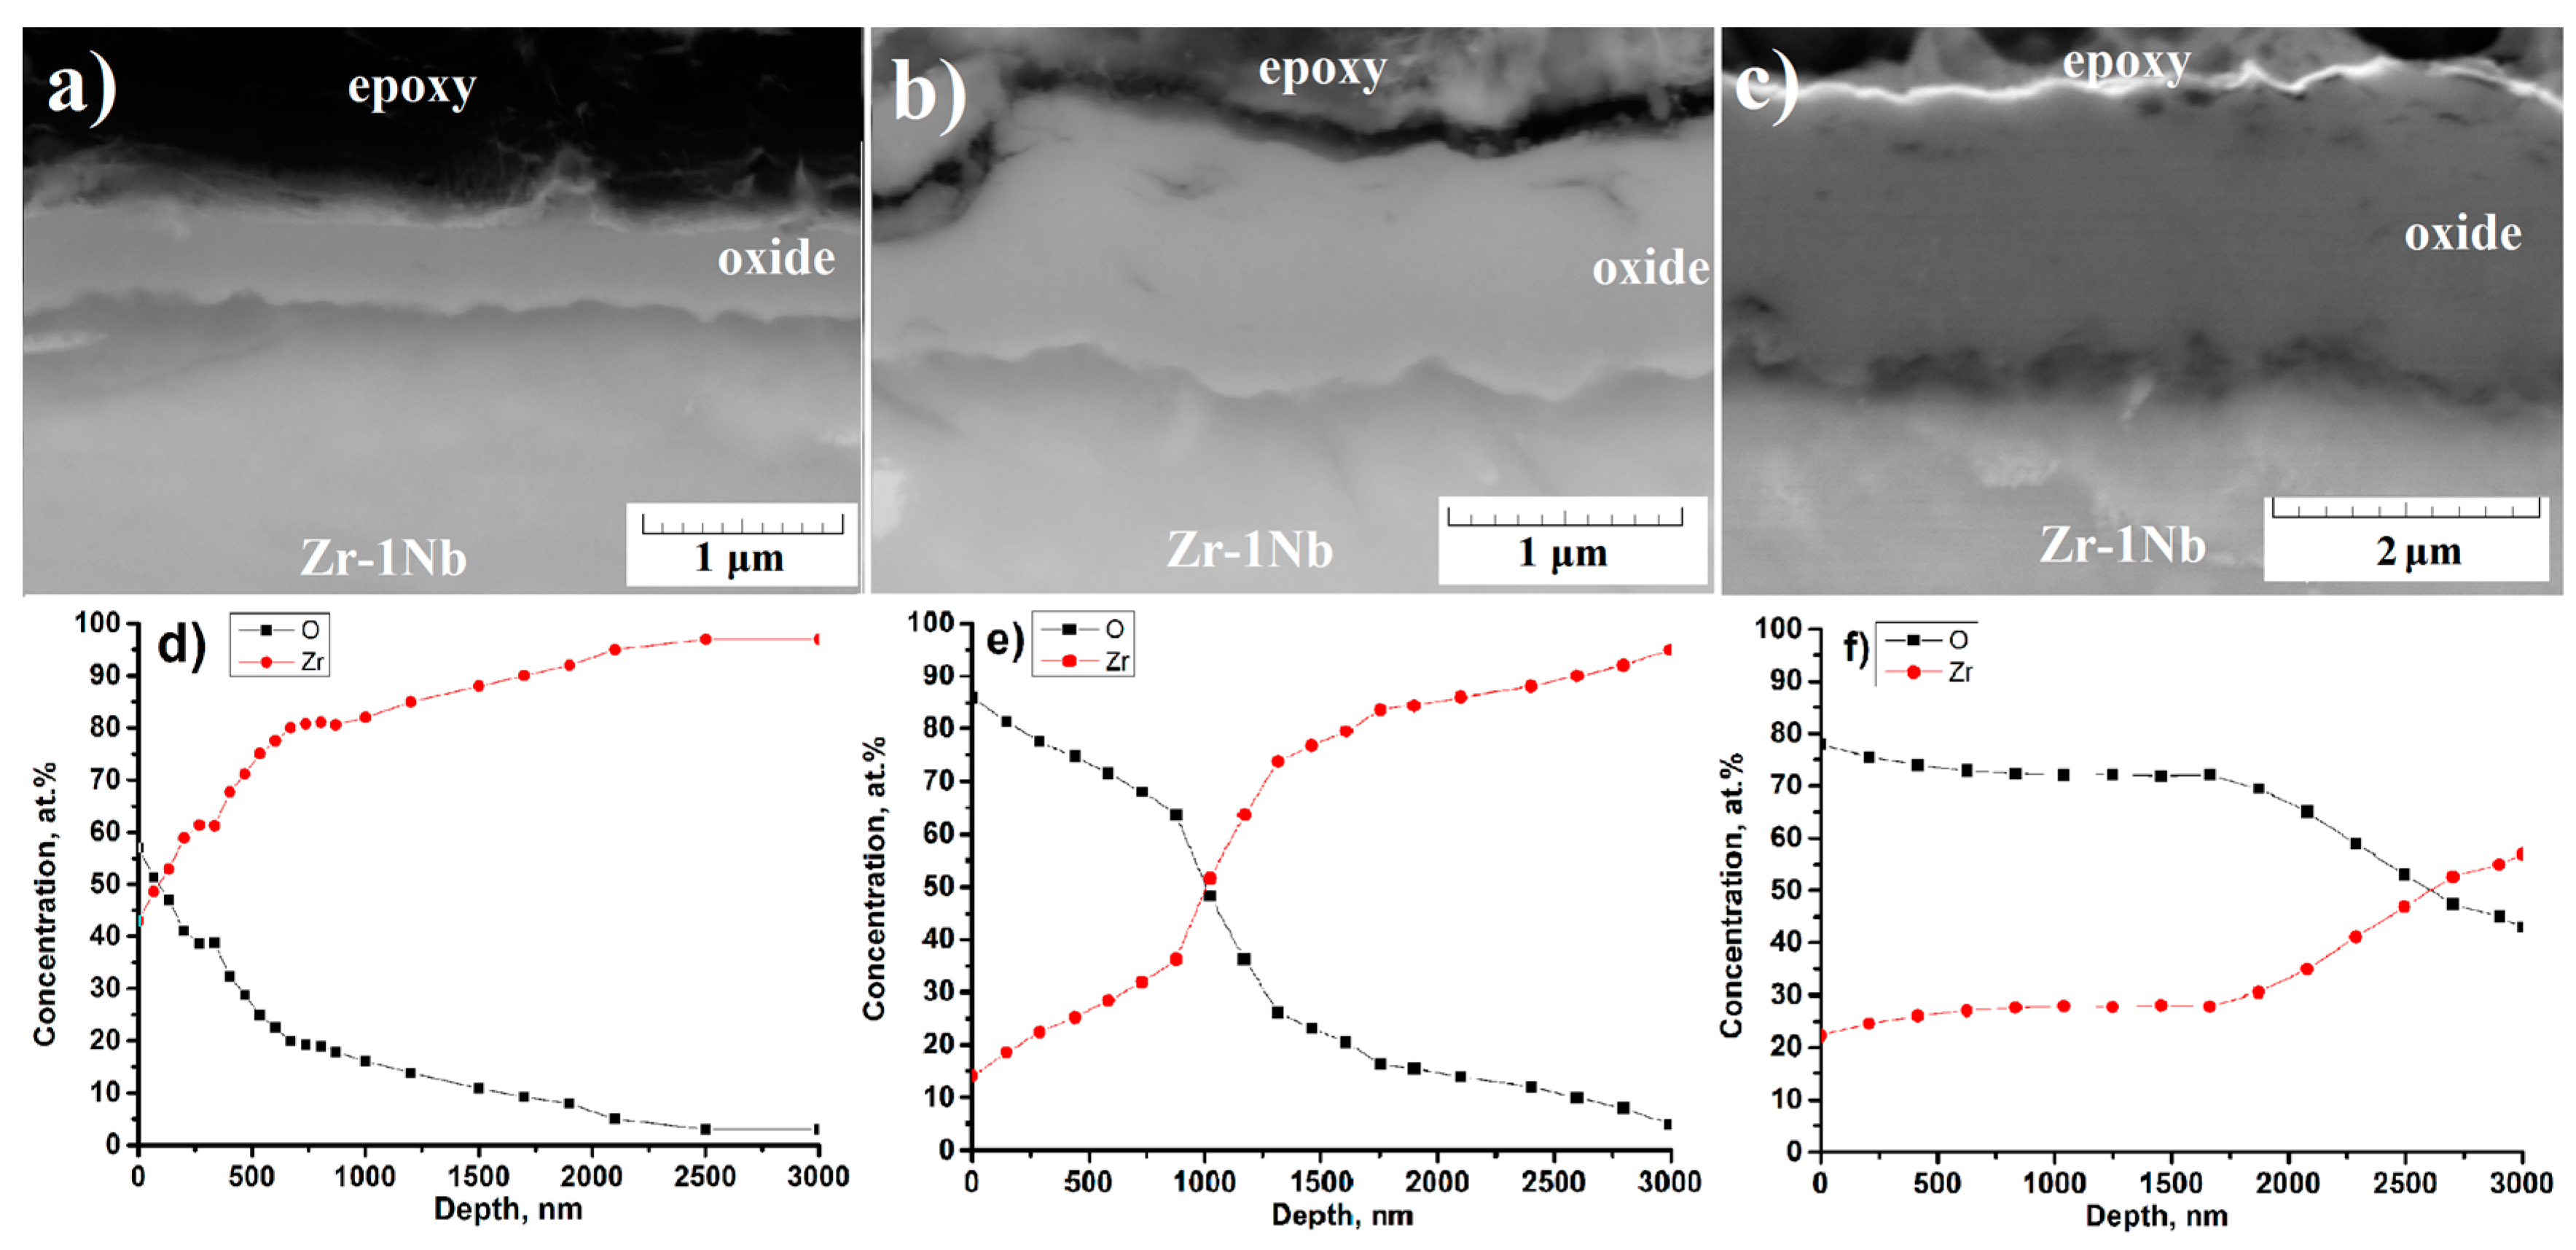
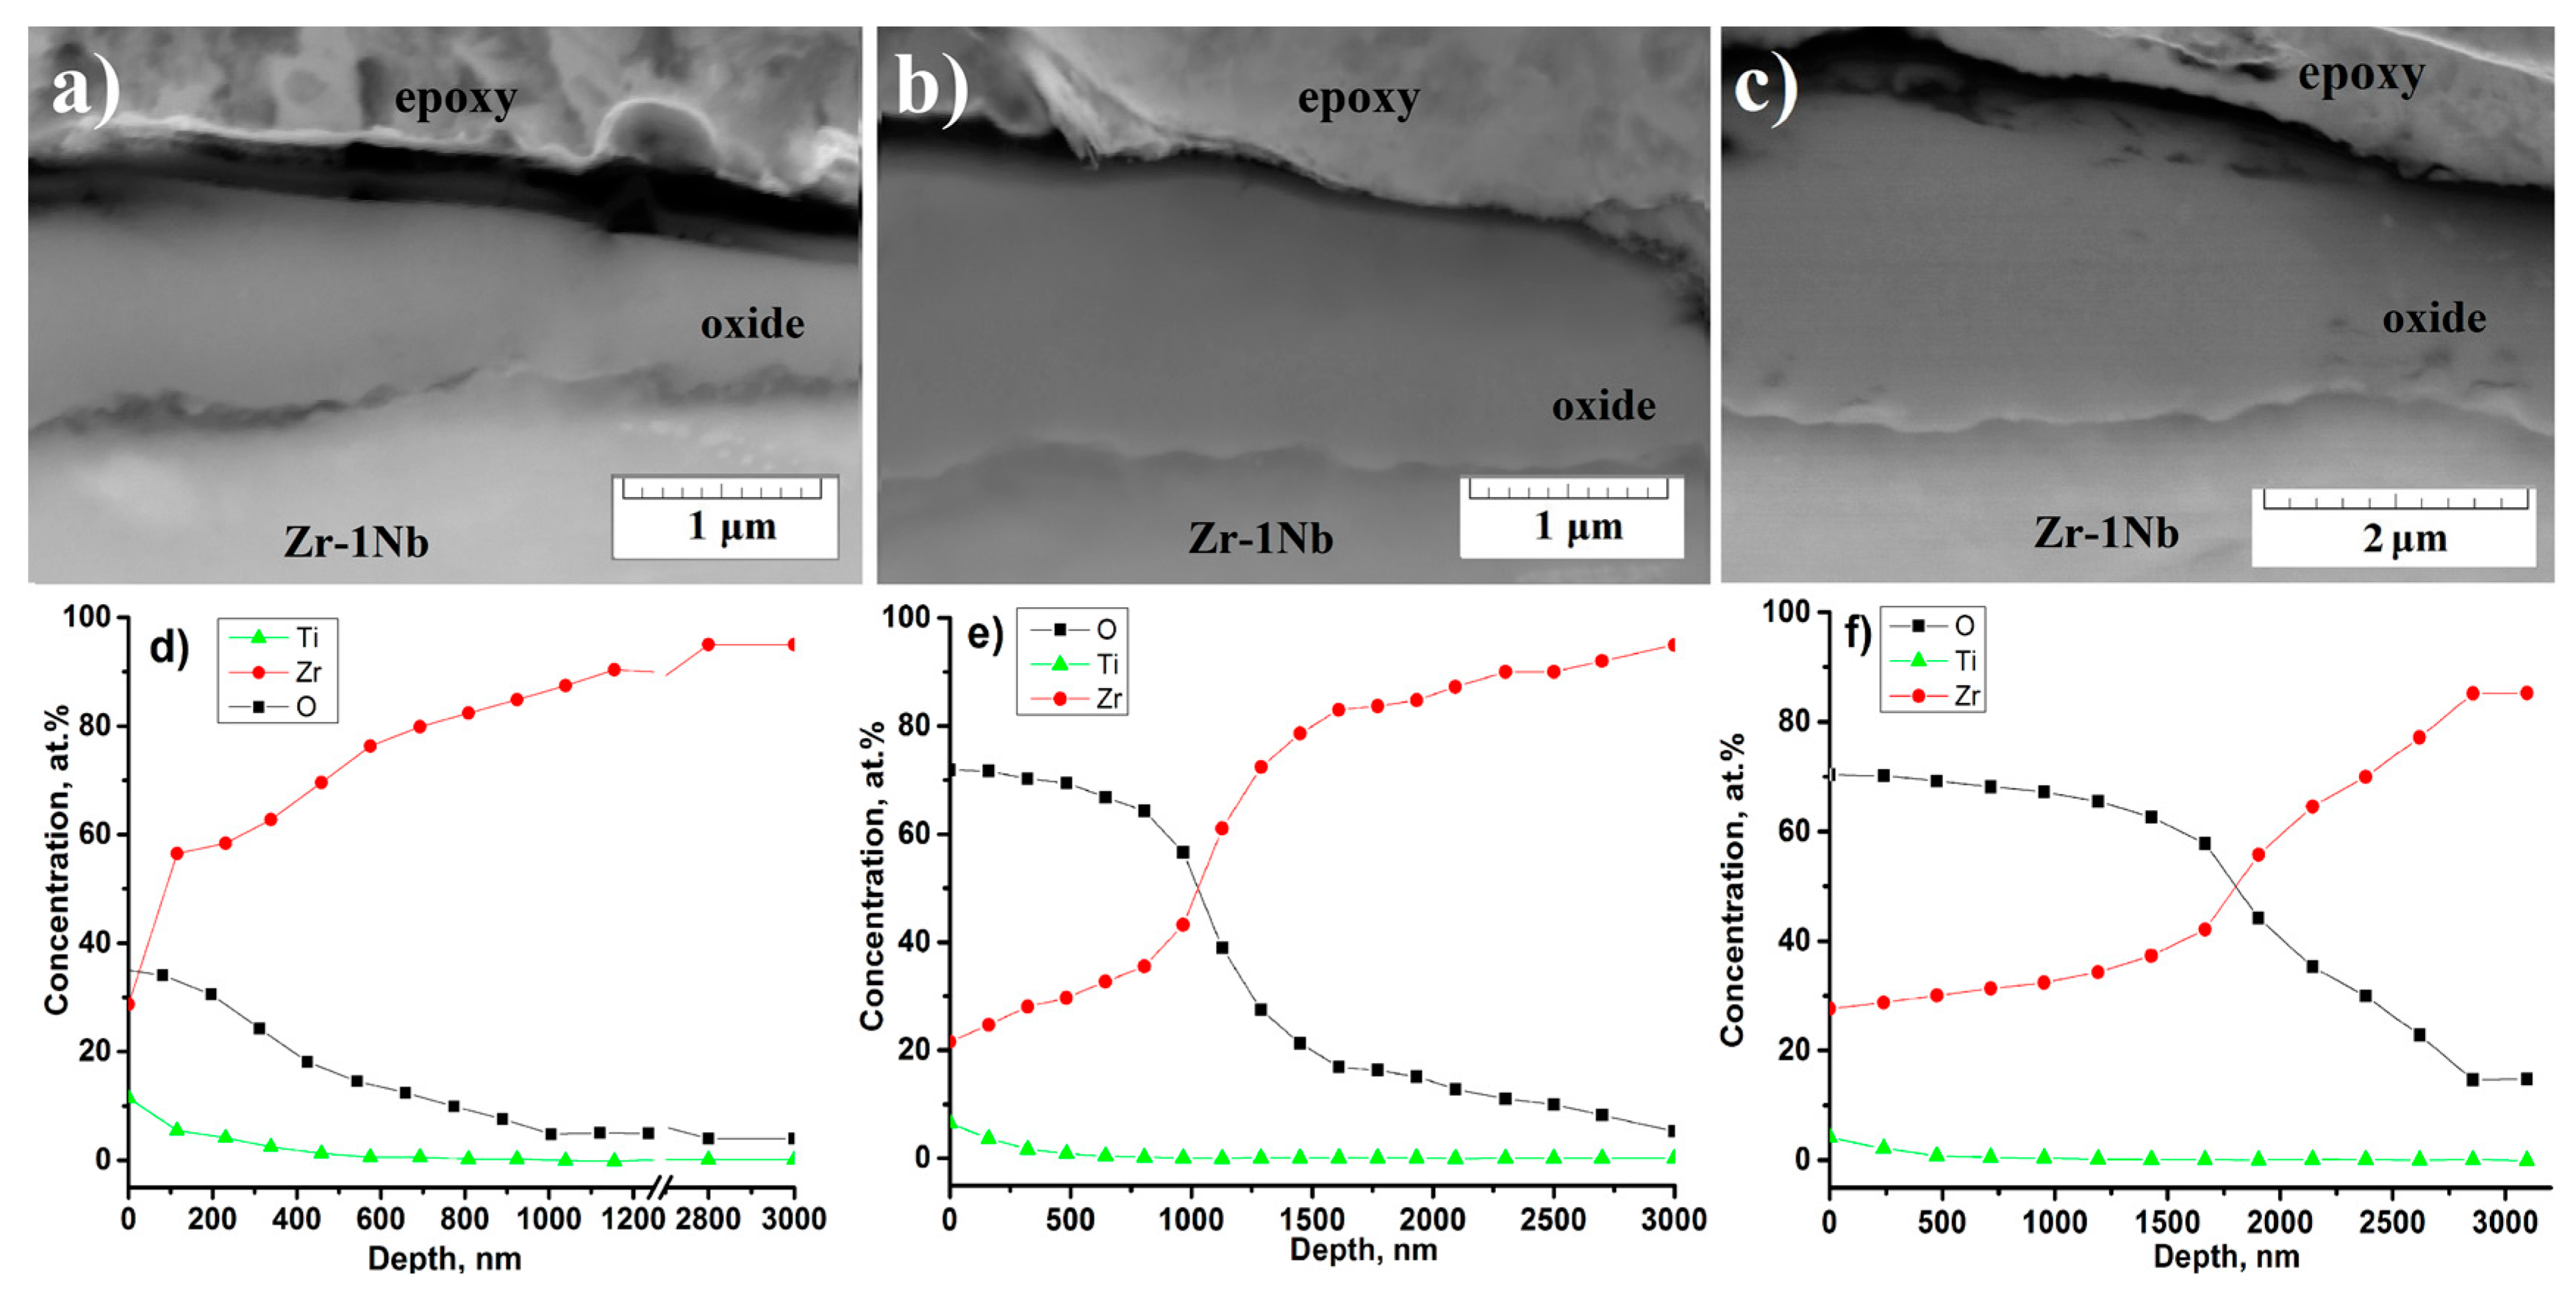
3.5. Microstructure of the Cross-Section of the Oxide Film before and after PIII of Ti

Figure 7 shows microstructures and EDS analyses of the cross-sections of the oxide/metal (O/M) interface on as-received Zr-1Nb alloy after oxidation in air at 400 °C for 24, 72, and 240 h, respectively. In Figure 8 the corresponding microstructures and EDS analyses after PIII of Ti and after oxidation in air at 400 °C for the above mentioned durations are given. Expanded cracks parallel to the O/M interface are observed in the oxide layer of as-received Zr-1Nb (Figure 7). This is in good agreement with the experimental results of Likhanskii et al. [42]. These cracks near the O/M interface appear when a critical thickness of the oxide film was achieved. Ploc et al. [43] found similar small cracks close to the oxide/metal interface. Furthermore, mercury porosimetry under pressure indicates cracks or pores that are very close to the oxide/metal interface [44]. One possible reason for crack formation can be the oxidation of β-Nb precipitates leading to additional stress. Defects diffuse, annihilate and condensate under the effect of stress to form pores and micro-cracks within the oxide layer [45]. At the same time, there are no cracks or defects inside the oxide layers of Zr-1Nb after Ti implantation (Figure 8). EDS analysis revealed a thickness of the Ti implanted layer of approximately 250–300 nm.
The oxide film after 24 h heat treatment on as-received Zr-1Nb is thinner than the one of Zr-1Nb after PIII of Ti. However, the oxide layer thickness of the as-received Zr-1Nb increases with an increasing duration of oxidation in comparison with the modified Zr-1Nb where the oxide film thickness remains nearly constant. The concentration of O near the top of the surface increases from 55 at. % (24 h) to 78 at. % (240 h) for the as –received Zr-1Nb. At the same time, the oxygen concentration is about 38 at. % (24 h) and 70 at. % (72 h and 240 h) for Zr-1Nb after implantation.

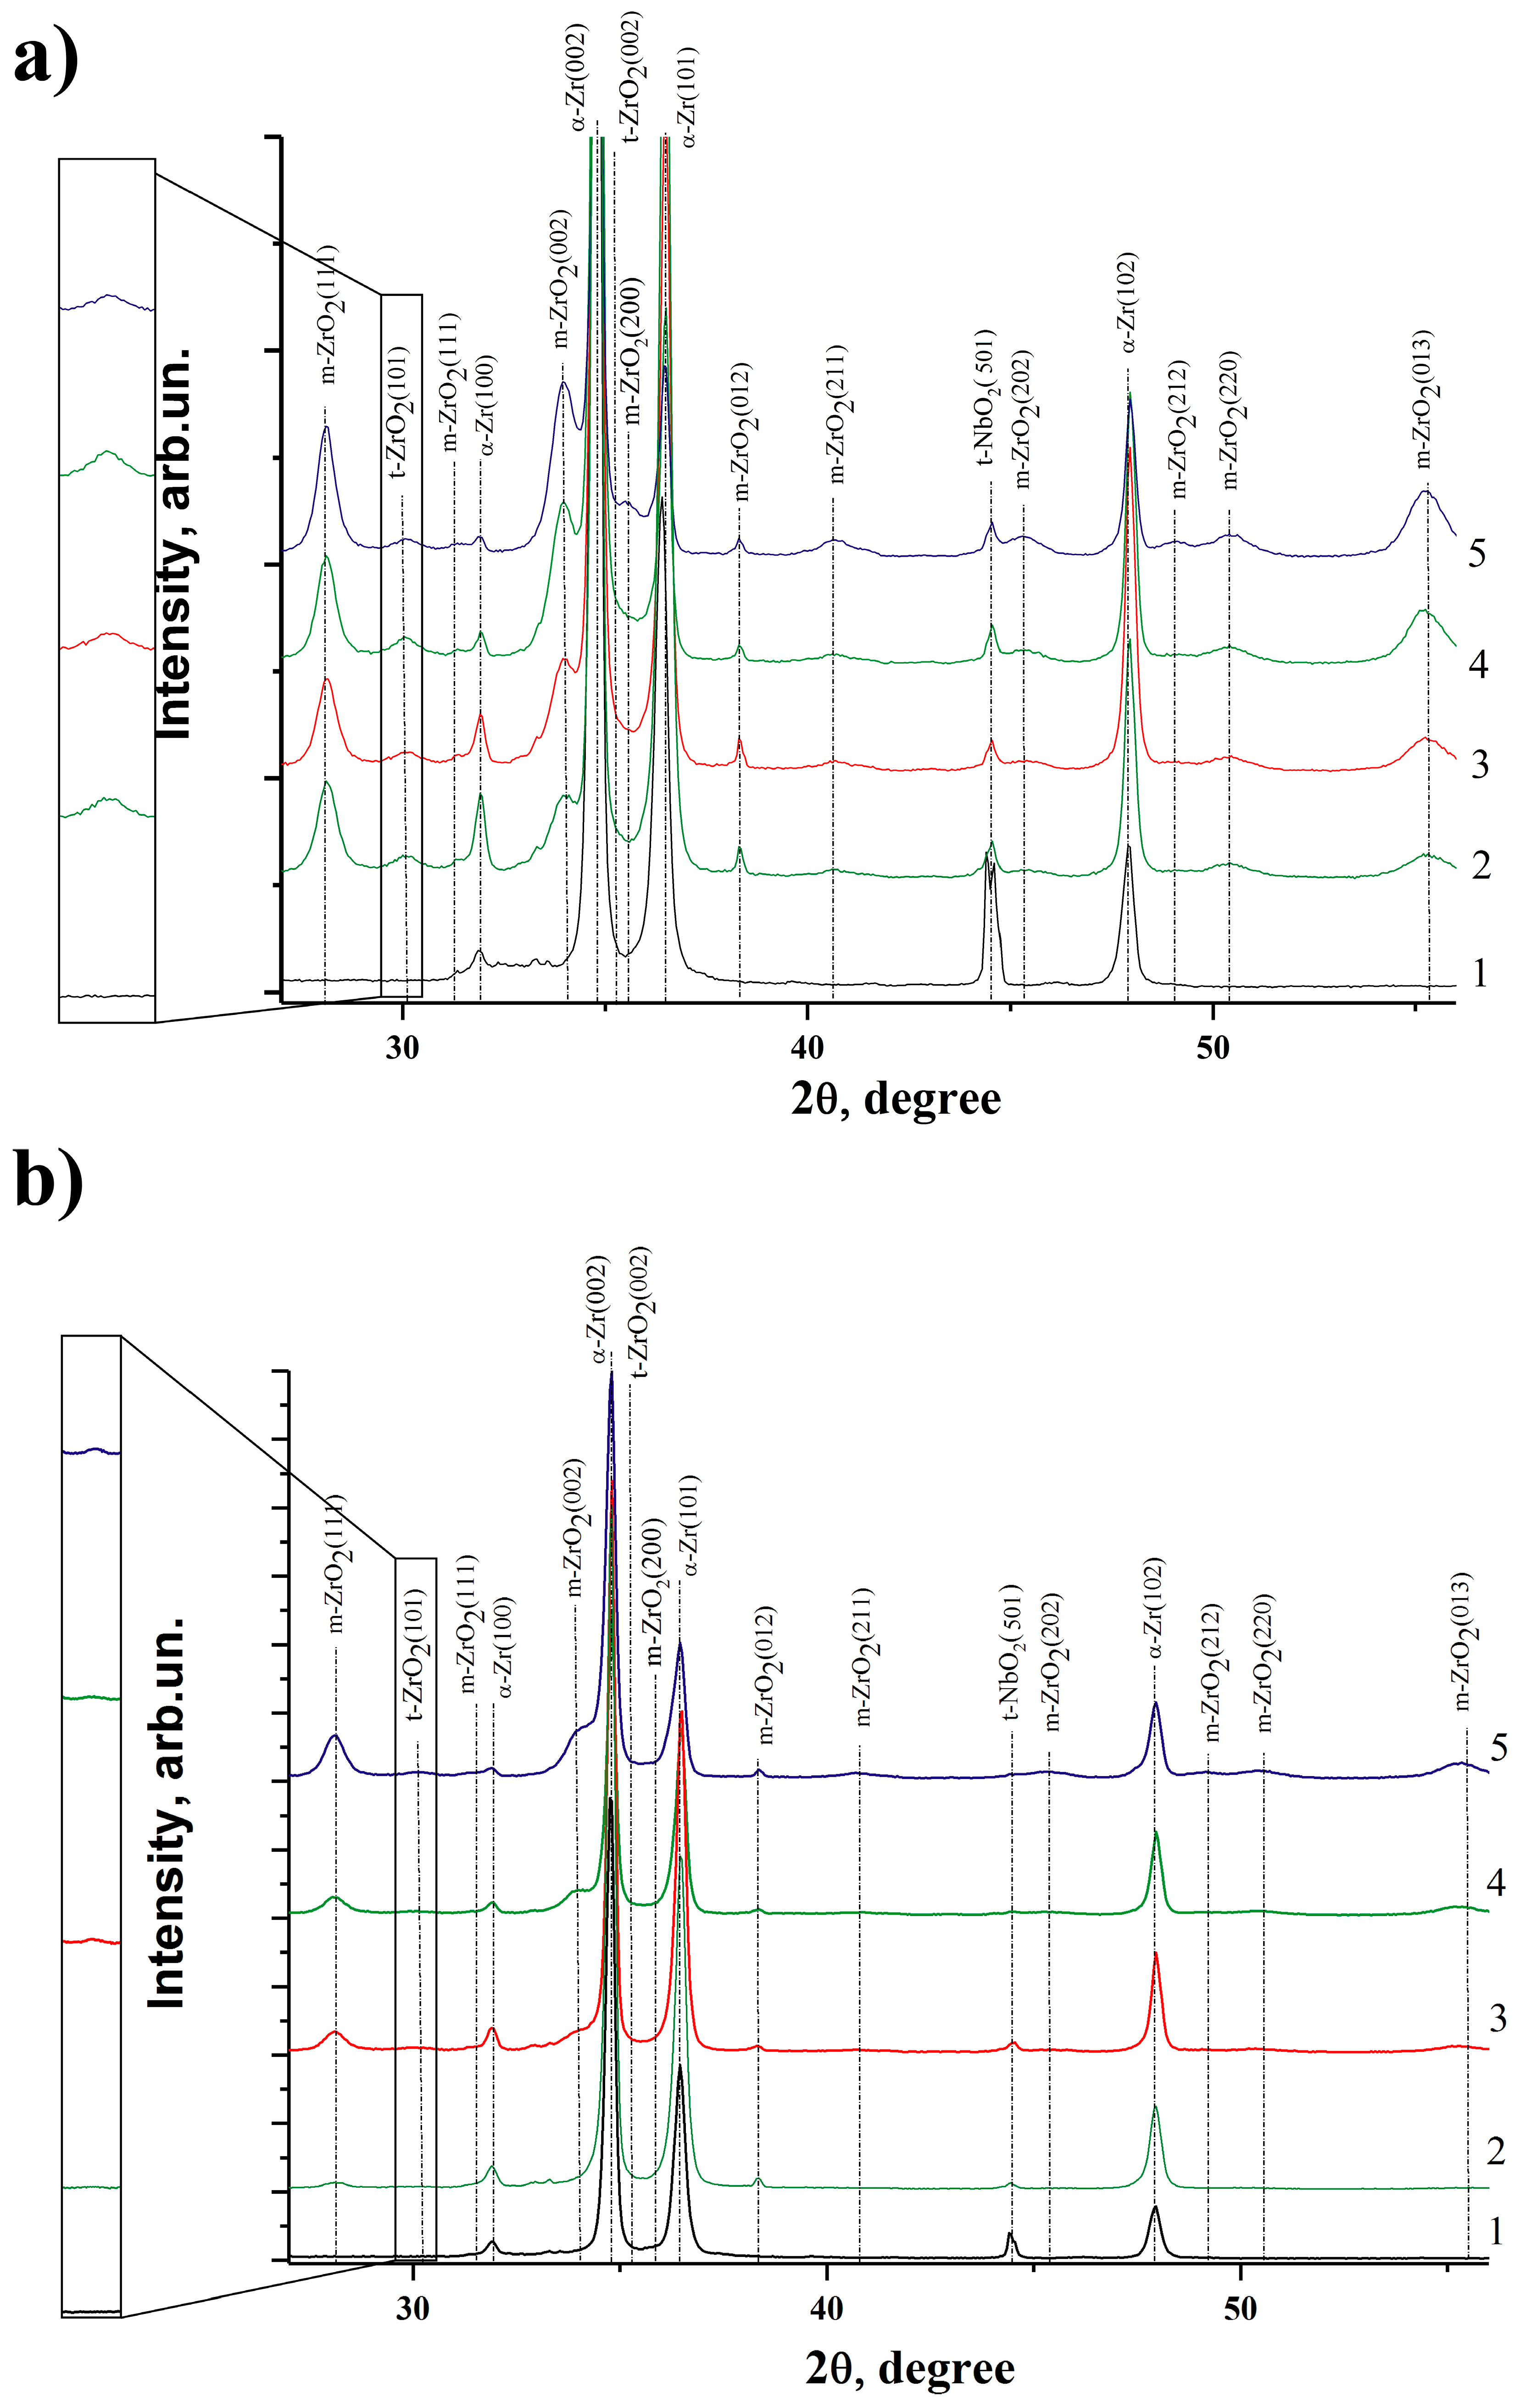
3.6. X-ray Diffraction Analysis

Figure 9 shows the diffraction patterns of both, as-received Zr-1Nb and Zr-1Nb after Ti implantation, after oxidation. After titanium implantation, exclusively α-Zr reflections with hexagonal close-packed (HCP) crystal lattice were detected. After oxidation, formation of stable monoclinic zirconium dioxide m-ZrO2 and tetragonal zirconium dioxide t-ZrO2 is observed. The intensity of the α-Zr reflexes decreases with increasing oxidation time, while the intensities of the m-ZrO2 and t-ZrO2 reflexes rise. Such behavior is caused by an increasing thickness of the oxide layers.
After oxidation for 5 h, the intensity of zirconium oxide reflections is more intensive for the sample with PIII of Ti than the one of the as-received specimen. Formation of t-ZrO2 reflexes in as-received Zr-1Nb is observed. After Ti implantation, only m-ZrO2 occurs. However, after 24 h oxidation the intensity of m-ZrO2 increases and phases of t-ZrO2 appear in the titanium implanted samples. Despite this, the intensity growth of zirconium oxides is faster on as-received Zr-1Nb than on Zr-1Nb after Ti implantation. Moreover, an additional reflex of t-ZrO2 (002) appears on as-received Zr-1Nb during oxidation. XRD combined with the presence of a t-NbO2 peak whose intensity decreases with further oxidation. In the case of Zr1Nb after implantation, the peak nearly disappears after 24 h. In contrast to other publications no more Nb2O5 oxide was observed. Yao et al. [45] reported that β-Nb precipitates firstly oxidize to NbO2 and further to Nb2O5. Additional stresses will be higher if β-Nb oxidizes to Nb2O5.
It is known that t-ZrO2 has low stability. If t-ZrO2 is stabilized by the compressive stress within the oxide, t-ZrO2 transforms into the monoclinic m-ZrO2. During the rising of the oxide film on the surface the lattice misfit becomes larger. When the stress has accumulated to some critical value, inside the oxide film the shear resulting from twinning during transformation leads to microcracking and fresh oxygen can enter the matrix and react with zirconium [46]. Peng et al. [47] reported that after implantation of carbon tetragonal zirconia (T-ZrO2) was still present and the samples were oxidized to black color.
The existence of titanium inside zirconium can influence the oxidation process, which is very important for applications in nuclear reactors. Ti4+ might substitute Zr4+ to form TiO2. The formation of TiO2 after titanium implantation in zirconium alloys was shown in [48]. There are two possible reactions for the formation of Ti3+ out of Ti4+. A Ti4+ ion can receive a photoelectron and transform to Ti3+. The other possibility is due to loss of oxygen from the surface of TiO2 during annealing in vacuum condition, thermal treatment under reducing atmosphere (H2, CO), or by bombardment using electron beam, neutrons, or γ-rays [49]. In both processes, Ti4+ ions receive electrons from reducing gases or lattice oxygen, usually removed from stoichiometric TiO2. Ti4+ ions became incorporated into the structure of tetragonal zirconia (T-ZrO2), hindering monoclinic phase transition [50].
The addition of other elements into the zirconium lattice can influence the valence of the surface and change corrosion and oxidation rates of the alloys. It is well-known that t-ZrO2 or cubic c-ZrO2 can be stabilized at room temperature by addition of lower valence oxides (usually Y2O3) to form anion conducting solid solutions in presence of oxygen vacancies [51,52,53]. According to the results presented in this work, it can be concluded that the addition of titanium can stabilize ZrO2. In diverse publications, several mechanisms have been proposed to explain this phenomenon [54,55,56,57,58,59]. As consequence of the structural changes caused by Ti4+ inside the ZrO2 lattice, several authors [56,57,58,59] report that a reduction of free oxygen vacancies occurs in TiO2 doped zirconia. According to our previous paper [60], the defect structure after Ti implantation is represented by a gradient distribution of the open volume defects (vacancies, clusters or dislocations), which could stabilize t-ZrO2.
In this research the formation of t-ZrO2 and m-ZrO2 is observed before and after Ti implantation. However, the growth of unstable t-ZrO2 and stable m-ZrO2 decreases after Ti implantation. T-ZrO2 appears only after oxidation for 24 h on modified Zr-1Nb. This behavior can be associated with the stabilization of zirconium after Ti implantation. In addition, the weight gain of Zr-1Nb after Ti implantation is lower after oxidation for 5 h. Despite the intensive growth of oxide film thickness, the surface morphology has fewer cracks on the surface and corrosion is more homogeneous after Ti implantation. The cross-section microstructure of the O/M interface does not contain cracks or defects within the oxide layers of modified Zr-1Nb. The increase in the oxidation rate of implanted Zr-1Nb after 5 h oxidation can be related to more intensive oxidation of the zirconium alloy outside of the modified layer because the implanted titanium layer is very thin (~250–300 nm). Furthermore, enhanced corrosion resistance of implanted Zr-1Nb can be associated with the formation of defects and crystal lattice distortions during implantation, like the change of compressive and tensile stresses within the oxide/metal interface [48].

4. Conclusions

In this study, the influence of plasma immersion titanium implantation into the zirconium alloy Zr-1Nb on the oxidation in air at 400 °C for 5, 24, 72, and 240 h under normal atmospheric pressure is described. Before oxidation, Ti and Zr are bonded in oxides inside the surface layer. The depth of the Ti-modified layer was approx. 250–300 nm. Ti implantation positively effects the corrosion resistance of Zr-1Nb alloy until 5 h of oxidation, where the weight gain is decreased by ~2 times. Further oxidation shows intensive increase in weight gain of Zr-1Nb after Ti implantation and the oxidation behavior becomes similar to the one of the untreated alloy. In general, oxidation of the Ti-implanted alloy proceeds more constant without cracking and local corrosion than in the untreated alloy, where local corrosion and cracks were detected on the surface and within the cross-section. Despite the stabilizing effect of TiO2 on the t-ZrO2 phase, only m-ZrO2 phase was measured by means of XRD after oxidation for 5 h. It is supposed that the increase in oxidation rate of the Ti-implanted alloy after 5 h is caused by the formation of unstable t-ZrO2 within the deeper layers of the alloy. Since the modified layer is already fully oxidized, compressive and tensile stresses occur within the oxide/metal interface. The formation of both t-ZrO2 and m-ZrO2 was observed during oxidation of the as-received Zr-1Nb over the entire oxidation time interval.
Plasma immersion titanium implantation is a promising method to protect Zr-1Nb alloy from oxidation, however, the protective properties are limited by the implantation depth. In order to improve the long term oxidation behavior of Zr-1Nb, the implantation depth should be increased by the optimization of the implantation parameters. Alternatively, additional treatments (nitriding, coating deposition, etc.) are necessary. Afterwards, in the case of higher burn up, implanted layers should increase the working time and positively affect the hydrogenation resistance. Further investigations on this topic are planned for the near future.

Acknowledgments

We thank Birgit Kunze for sample preparation and metallographic analysis and Grit Rodenbeck and Alexander Starostin for their help with the DSC measurements. The research is funded from Tomsk Polytechnic University Competitiveness Enhancement Program grant. Anton Manakhov also acknowledges the financial support of the Ministry of Education and Science of the Russian Federation in the framework of Increase Competitiveness Program of NUST “MISiS”, implemented by a governmental decree dated 16 March 2013, N 211.

Author Contributions

Aleksei Obrosov and Alina N. Sutygina carried out oxidation process, DSC and XRD measurements, analyzed the results and prepared the paper. Egor Kashkarov provided PIII of titanium. Sebastian Bolz performed SEM observations as well as EDS measurements. Anton Manakhov carried out XPS analysis and described the results. Sabine Weiß and Egor Kashkarov revised the manuscript and directed the work.

Conflicts of Interest

The authors declare no conflict of interest.

References

  1. Zinkle, S.J.; Was, G.S. Materials challenges in nuclear energy. Acta Mater. 2013, 61, 735–758. [Google Scholar] [CrossRef]
  2. Murty, K.L.; Charit, I. Texture development and anisotropic deformation of zircaloys. Prog. Nucl. Energy 2006, 48, 325–359. [Google Scholar] [CrossRef]
  3. Kiran Kumar, M.; Aggarwal, S.; Kain, V.; Saario, T.; Bojinov, M. Effect of dissolved oxygen on oxidation and hydrogen pick up behaviour—Zircaloy vs. Zr–Nb alloys. Nucl. Eng. Des. 2010, 240, 985–994. [Google Scholar] [CrossRef]
  4. Ahmed, T.; Keys, L. The breakaway oxidation of zirconium and its alloys a review. J. Less Common Met. 1975, 39, 99–107. [Google Scholar] [CrossRef]
  5. Reddy, A.V.R.; Venugopal, V.; Sinha, R.K.; Banerjee, S. (Eds.) Proceedings of the International Conference on Peaceful Uses of Atomic Energy; Bhabha Atomic Research Centre: Mumbai, India, 2009; Volume 2, p. 384. [Google Scholar]
  6. McRae, G.; Coleman, C.; Leitch, B. The first step for delayed hydride cracking in zirconium alloys. J. Nucl. Mater. 2010, 396, 130–143. [Google Scholar] [CrossRef]
  7. Weatherly, G. Hydrogen Behaviour and Hydride Cracking Problems in Zirconium Alloys: Symposium on Zirconium Alloys in Service in Nuclear Reactors. Can. Metall. Q. 1985, 24, 225. [Google Scholar] [CrossRef]
  8. Pieroy, G. Mechanisms for the in-reactor creep of Zirconium alloys. J. Nucl. Mater. 1968, 26, 18–50. [Google Scholar] [CrossRef]
  9. Bespalov, I.; Datler, M.; Buhr, S.; Drachsel, W.; Rupprechter, G.; Suchorski, Y. Initial stages of oxide formation on the Zr surface at low oxygen pressure: An in situ FIM and XPS study. Ultramicroscopy 2015, 159, 147–151. [Google Scholar] [CrossRef] [PubMed]
  10. Allen, T.R.; Konings, R.J.M.; Motta, A.T. Corrosion of Zirconium Alloys. Compr. Nucl. Mater. 2012, 5, 49–68. [Google Scholar] [CrossRef]
  11. Motta, T.; Couet, A.; Comstock, R.J. Corrosion of Zirconium Alloys Used for Nuclear Fuel Cladding. Annu. Rev. Mater. Res. 2015, 45, 311–343. [Google Scholar] [CrossRef]
  12. Steinbrück, M.; Schaffer, S. High-Temperature Oxidation of Zircaloy-4 in Oxygen-Nitrogen Mixtures. Oxid. Met. 2016, 85, 245–262. [Google Scholar] [CrossRef]
  13. Abriata, J.P.; Bolcich, J.C. The Nb–Zr (Niobium–Zirconium) system. J. Phase Equilibria 1982, 3, 34–44. [Google Scholar] [CrossRef]
  14. Toffolon, C.; Brachet, J.C.; Servant, C.; Legras, L.; Charquet, D.; Barberis, P.; Mardon, J.P. Experimental study and preliminary thermodynamic calculations of the pseudo-ternary Zr-Nb-Fe-(O, Sn) system. In Zirconium in the Nuclear Industry: Thirteenth International Symposium; ASTM STP 1423; ASTM International: West Conshohocken, PA, USA, 2002; pp. 361–383. [Google Scholar]
  15. Lee, J.S. Operation and Maintenance of Spent Fuel Storage and Transportation Casks/Containers; IAEA: Vienna, Austria, 2007. [Google Scholar]
  16. Yegorova, L.; Lioutov, K.; Jouravkova, N.; Konobeev, A. Experimental Study of Embrittlement of Zr—1%Nb VVER Cladding under LOCA—Relevant Conditions; International Agreement Report; United States Nuclear Regulatory Commission: Washington, DC, USA, 2005.
  17. Batra, I.S.; Singh, R.N.; Sengupta, P.; Maji, B.C.; Madangopal, K.; Manikrishna, K.V.; Tewari, R.; Dey, G.K. Mitigation of hydride embrittlement of zirconium by yttrium. J. Nucl. Mater. 2009, 389, 500–503. [Google Scholar] [CrossRef]
  18. Chen, L.; Wang, X.; Gong, W.; Zhang, H. Effect of yttrium addition on microstructure and orientation of hydride precipitation in Zr-1Nb alloy. Int. J. Hydrogen Energy 2014, 39, 21116–21126. [Google Scholar] [CrossRef]
  19. Alat, E.; Motta, A.T.; Comstock, R.J.; Partezana, J.M.; Wolfe, D.E. Multilayer (TiN, TiAlN) ceramic coatings for nuclear fuel cladding. J. Nucl. Mater. 2016, 478, 236–244. [Google Scholar] [CrossRef]
  20. Kim, I.; Khatkhatay, F.; Jiao, L.; Swadener, G.; Cole, J.I.; Gan, J.; Wang, H. TiN-based coatings on fuel cladding tubes for advanced nuclear reactors. J. Nucl. Mater. 2012, 429, 143–148. [Google Scholar] [CrossRef]
  21. Obrosov, A.; Sutygina, A.N.; Volinsky, A.A.; Manakhov, A.; Weiß, S.; Kashkarov, E.B. Effect of Hydrogen Exposure on Mechanical and Tribological Behavior of CrxN Coatings Deposited at Different Pressures on IN718. Materials 2017, 10, 563. [Google Scholar] [CrossRef] [PubMed]
  22. Zou, Z.; Xue, W.; Jia, X.; Du, J.; Wang, R.; Weng, L. Effect of voltage on properties of microarc oxidation films prepared in phosphate electrolyte on Zr-1Nb alloy. Surf. Coat. Technol. 2013, 222, 62–67. [Google Scholar] [CrossRef]
  23. Pushilina, N.S.; Kudiiarov, V.N.; Laptev, R.S.; Lider, A.M.; Teresov, A.D. Microstructure changes in Zr-1Nb alloy after pulsed electron beam surface modification and hydrogenation. Surf. Coat. Technol. 2015, 284, 63–68. [Google Scholar] [CrossRef]
  24. Terrani, K.A.; Parish, C.M.; Shin, D.; Pint, B.A. Protection of zirconium by alumina- and chromia-forming iron alloys under high-temperature steam exposure. J. Nucl. Mater. 2013, 438, 64–71. [Google Scholar] [CrossRef]
  25. Hui, R.; Cook, W.; Sun, C.; Xie, Y.; Yao, P.; Miles, J.; Olive, R.; Li, J.; Zheng, W.; Zhang, L. Deposition, characterization and performance evaluation of ceramic coatings on metallic substrates for supercritical water-cooled reactors. Surf. Coat. Technol. 2011, 205, 3512–3519. [Google Scholar] [CrossRef]
  26. Anders, A. Handbook of Plasma Immersion Ion Implantation and Deposition; Wiley-VCH Verl.: Weinheim, Germany, 2004. [Google Scholar]
  27. Ueda, M.; Silva, A.; Pillaca, E.; Mariano, S.; Rossi, J.; Oliveira, R.; Pichon, L.; Reuther, H. New possibilities of plasma immersion ion implantation (PIII) and deposition (PIII&D) in industrial components using metal tube fixtures. Surf. Coat. Technol. 2017, 312, 37–46. [Google Scholar] [CrossRef]
  28. Chu, P. Progress in direct-current plasma immersion ion implantation and recent applications of plasma immersion ion implantation and deposition. Surf. Coat. Technol. 2013, 229, 2–11. [Google Scholar] [CrossRef]
  29. Kashkarov, E.B.; Nikitenkov, N.N.; Syrtanov, M.S.; Sutygina, A.N.; Shulepov, I.A.; Lider, A.M. Influence of plasma immersion titanium implantation on hydrogenation and mechanical properties of Zr-2.5Nb. Appl. Surf. Sci. 2016, 370, 142–148. [Google Scholar] [CrossRef]
  30. Kashkarov, E.B.; Nikitenkov, N.N.; Sutygina, A.N.; Syrtanov, M.S.; Vilkhivskaya, O.V.; Pryamushko, T.S.; Kudiiarov, V.N.; Volesky, L. Effect of titanium ion implantation and deposition on hydrogenation behavior of Zr-1Nb alloy. Surf. Coat. Technol. 2016, 308, 2–9. [Google Scholar] [CrossRef]
  31. Billone, M.; Yan, Y.; Burtseva, T.; Daum, R. Cladding Embrittlement during Postulated Loss-of-Coolant Accidents; NUREG/CR-6967, ANL07/04; Argonne National Laboratory: Lemont, IL, USA, 2008.
  32. Beamson, G.; Briggs, D. High Resolution XPS of Organic Polymers; John Wiley & Sons: Chichester, UK, 1992; ISBN 978-04-7193-592-6. [Google Scholar]
  33. Tezuka, Y.; Shin, S.; Ishii, T.; Ejima, T.; Suzuki, S.; Sato, S. Photoemission and Bremsstrahlung Isochromat Spectroscopy Studies of TiO2(Rutile) and SrTiO3. J. Phys. Soc. Jpn. 1994, 63, 347–357. [Google Scholar] [CrossRef]
  34. Beneš, O.; Van Uffelen, P.; van de Laar, J.; Győri, C.; Konings, R.J.M.; Hózer, Z. Kinetic studies of the α–β phase transition in the Zr1%Nb cladding for nuclear reactors. J. Nucl. Mater. 2011, 414, 88–91. [Google Scholar] [CrossRef]
  35. Canay, M.; Dan, C.A.; Arias, D. Phase transition temperature in the Zr-rich corner of Zr ± Nb ± Sn ± Fe alloys. J. Nucl. Mater. 2000, 280, 365–371. [Google Scholar] [CrossRef]
  36. Okamoto, H. Nb-Zr (niobium-zirconium). J. Phase Equilibria 1992, 13, 577. [Google Scholar] [CrossRef]
  37. Yang, H.L.; Kano, S.; Matsukawa, Y.; Li, Y.F.; Shen, J.J.; Li, F.; Zhao, Z.S.; Satoh, Y.; Abe, H. Effect of molybdenum on microstructures in Zr-1.2Nb alloys after β-quenching and subsequently 873 K annealing. Mater. Des. 2016, 104, 355–364. [Google Scholar] [CrossRef]
  38. Ivanov, O.S.; Grigorovich, V.K. Theoretical and experimental aspects of controlled nuclear fusion. In Proceedings of the Second UN International Conference on Peaceful Uses of Atomic Energy, Geneva, Switzerland, 1–13 September 1958; Volume 3, p. 34. [Google Scholar]
  39. Peng, D.; Bai, X.; Pan, F.; Sun, H.; Chen, B. Influence of titanium ions implantation on corrosion behavior of zirconium in 1 M H2SO4. Appl. Surf. Sci. 2006, 252, 2196–2203. [Google Scholar] [CrossRef]
  40. Guo, X. Hydrothermal degradation mechanism of tetragonal Zirconia. J. Mater. Sci. 2001, 36, 3737–3744. [Google Scholar] [CrossRef]
  41. Peng, D.; Bai, X.; Pan, F.; Sun, H.; Chen, B. Influence of aluminum ions implanted on oxidation behavior of ZIRLO alloy at 500 °C. Vacuum 2006, 80, 530–536. [Google Scholar] [CrossRef]
  42. Likhanskii, V.; Kolesnik, M. On the evolution of wave structure at the metal/oxide interface during oxidation of Zr alloys. Corros. Sci. 2014, 87, 416–420. [Google Scholar] [CrossRef]
  43. Molins, R.; Germidis, A.; Andrieu, E.; Newcomb, S.B.; Little, J.A. Microscopy of Oxidation 3. In Proceedings of the Third International Conference on the Microscopy of Oxidation, Cambridge, UK, 16–18 September 1996; Institute of Materials, Minerals and Mining: London, UK, 1996. [Google Scholar]
  44. Cox, B. Some thoughts on the mechanisms of in-reactor corrosion of zirconium alloys. J. Nucl. Mater. 2005, 336, 331–368. [Google Scholar] [CrossRef]
  45. Yao, M.; Gao, C.; Huang, J.; Peng, J.; Liang, X.; Zhang, J.; Zhou, B.; Li, Q. Oxidation behavior of β-Nb precipitates in Zr–1Nb–0.2Bi alloy corroded in lithiated water at 360 °C. Corros. Sci. 2015, 100, 169–176. [Google Scholar] [CrossRef]
  46. Cox, B.; Kritsky, V.G.; Lemaignan, C.; Polley, V.; Ritchie, I.G.; Ruhmann, H.; Shishov, V.N.; Bibilashvili, Y.K.; Nikulina, A.V. Waterside Corrosion of Zirconium Alloys in Nuclear Power Plants; TECDOC-996; International Atomic Energy Agency: Vienna, Austria, 1998. [Google Scholar]
  47. Peng, D.; Bai, X.; Pan, F.; Sun, H.; Chen, B. Surface analysis of Zircaloy-2 implanted with carbon before and after oxidation in air at 500 °C. Mater. Charact. 2006, 56, 112–120. [Google Scholar] [CrossRef]
  48. Zhanga, X.Y.; Wan, Q.; Baib, X.D.; Jina, Z.X.; Liua, X.Y. Effect of Titanium ion implantation on the oxidation behaviour of zircalloy-4 at 500 °C. Vacuum 2006, 80, 1003–1006. [Google Scholar] [CrossRef]
  49. Xiong, L.B.; Li, J.L.; Yang, B.; Yu, Y. Ti3+ in the surface of titanium dioxide: generation, properties and photocatalytic application. J. Nanomater. 2012, 2012, 831524. [Google Scholar] [CrossRef]
  50. Ho, S.M. On the Structural Chemistry of Zirconium Oxide. Mater. Sci. Eng. 1982, 54, 23–29. [Google Scholar] [CrossRef]
  51. Li, P.; Chen, I.W.; Penner-Hahn, J.E. X-ray-absorption studies of zirconia polymorphs. II. Effect of Y2O3 dopant on ZrO2 structure. Phys. Rev. B 1993, 48, 10074–10081. [Google Scholar] [CrossRef]
  52. Santamaria, M.; Di Quarto, F.; Habazaki, H. Influences of structure and composition on the photoelectrochemical behaviour of anodic films on Zr and Zr-20 at.%Ti. Electrochim. Acta 2008, 53, 2272–2280. [Google Scholar] [CrossRef] [Green Version]
  53. Li, P.; Chen, I.-W.; Penner-Hahn, J.E. Effect of Dopants on Zirconia Stabilization—An X-ray Absorption Study: III, Charge-Compensating Dopants. J. Am. Ceram. Soc. 1994, 77, 1289–1295. [Google Scholar] [CrossRef]
  54. Zschech, E.; Kountouros, P.N.; Petzow, G.; Behrens, P.; Lessmann, A.; Frahm, R. Synchrotron Radiation Ti-k XANES Study of TiO2–Y2O3-Stabilized Tetragonal Zirconia Polycrystals. J. Am. Ceram. Soc. 1993, 76, 197–201. [Google Scholar] [CrossRef]
  55. Traqueia, L.S.M.; Pagnier, T.; Marques, F.M.B. Structural and electrical characterization of titania-doped YSZ. J. Eur. Ceram. Soc. 1997, 17, 1019–1026. [Google Scholar] [CrossRef]
  56. Valigi, M.; Gazzoli, D.; Incocciati, E.; Dragone, R. Metastable phase formation in the TiO-ZrO, and Cd-ZrO. Solid State Ion. 1997, 101–103, 597–603. [Google Scholar] [CrossRef]
  57. Capel, F.; Moure, C.; Duran, P.; Gonzalez-Elipe, A.R.; Caballero, A. Titanium local environment and electrical conductivity of TiO2-doped stabilized tetragonal zirconia. J. Mater. Sci. 2000, 35, 345–352. [Google Scholar] [CrossRef]
  58. Hodgson, S.N.B.; Cawley, J. The effect of titanium oxide additions on the properties and behaviour of Y-TZP. J. Mater. Process. Technol. 2001, 119, 112–116. [Google Scholar] [CrossRef]
  59. Colomer, M.T.; Jurado, J.R. Structure, microstructure, and mixed conduction of [(ZrO2)0.92(Y2O3)0.08]0.9(TiO2)0.1. J. Solid State Chem. 2002, 165, 79–88. [Google Scholar] [CrossRef]
  60. Kashkarov, E.; Nikitenkov, N.; Sutygina, A.; Laptev, R.; Bordulev, Y.; Obrosov, A.; Liedke, M.; Wagner, A.; Zak, A.; Weiβ, S. Microstructure, defect structure and hydrogen trapping in zirconium alloy Zr-1Nb treated by plasma immersion Ti ion implantation and deposition. J. Alloys Compd. 2017, 732, 80–87. [Google Scholar] [CrossRef]
Figure 1. Zr-Nb phase diagram [13].
Metals 08 00027 g001
Figure 2. Thermal analysis differential scanning calorimetry (DSC) for Zr-1Nb before and after titanium implantation.
Metals 08 00027 g002
Figure 3. The X-ray photoelectron spectroscopy (XPS) curve fitting of Zr3d and O1s signal before Ti implantation ((a,b), respectively) and Zr3d, O1s, and Ti2p curve fitting after Ti implantation ((ce), respectively).
Metals 08 00027 g003
Figure 4. Surface morphology of as-received Zr-1Nb after oxidation in air at 400 °C for (a) 0, (b) 5, (c) 24, (d) 72 h, and (e) 240 h.
Metals 08 00027 g004
Figure 5. Surface morphology of Zr-1Nb after PIII of Ti for 15 min at bias voltage 1500 V after oxidation in air at 400 °C for (a) 0, (b) 5, (c) 24, (d) 72 h, and (e) 240 h.
Metals 08 00027 g005
Figure 6. Weight gain for oxidized at 400 °C for 5, 24, 72, and 240 h in air: as-received Zr-1Nb and after PIII of Ti during 15 min at bias voltage 1500 V.
Metals 08 00027 g006
Figure 7. Microstructure and energy dispersive spectroscopy (EDS) analysis of the cross-section of the oxide/metal (O/M) interface of as-received Zr-1Nb alloy after oxidation in air at 400 °C for 24 (a,d), 72 (b,e), and 240 h (c,f).
Metals 08 00027 g007
Figure 8. Microstructure and EDS analysis of the cross-section of the O/M interface of Zr-1Nb alloy after PIII of Ti and after oxidation in air at 400 °C for 24 (a,d), 72 (b,e), and 240 h (c,f).
Metals 08 00027 g008
Figure 9. XRD patterns of samples after oxidation at 400 °C for: (1) 0 h; (2) 5 h; (3) 24 h; (4) 72 h; and, (5) 240 h of as-received Zr-1Nb (a) and after PIII of Ti (b).
Metals 08 00027 g009
Table 1. Plasma immersion ion implantation (PIII) parameters of Ti in Zr-1Nb.
MaterialArc Current, АPressure (Ar), PаPulse Repetition Rate, kHzPulse Length, μsBias Voltage, ВTime of Implantation, min
Zr-1Nb700.151005150015

