Analysis of the Microstructure and Selected Properties of the Aluminium Alloys Used in Automotive Air-Conditioning Systems


1
Faculty of Non-Ferrous Metals, AGH University of Science and Technology, Krakow Mickiewicza 30 Av., 30-059 Krakow, Poland
2
Faculty of Management, AGH University of Science and Technology, Krakow Gramatyka 10, 30-067 Krakow, Poland
3
Maflow, Boryszew Group, Tychy Serdeczna 42, 43-100 Tychy, Poland
*
Author to whom correspondence should be addressed.
Metals 2018, 8(1), 10; https://doi.org/10.3390/met8010010
Submission received: 6 December 2017
/
Revised: 22 December 2017
/
Accepted: 22 December 2017
/
Published: 28 December 2017
Abstract
:The results of microstructure examinations and studies of selected mechanical properties of four aluminium alloys used in the production of automotive air-conditioning ducts (AA3103, AA5049, AA6060, AA6063) before and after the ASTM G85:A3 SWAAT Test (Sea Water Acetic Acid Test) for corrosion resistance are presented. Materials used for the manufacture of such components should be temperature stable, and therefore thermal resistance tests were carried out in a wide range of temperatures, i.e., −25 °C, 25 °C, 40 °C, 60 °C, 80 °C, 100 °C, 140 °C, 180 °C, and 220 °C. Annealing was performed for 72 h and 240 h, followed by cooling in water. The obtained results have proved that the non-precipitation-hardenable AA3103 and AA5049 alloys remain stable in the entire range of the investigated temperatures. The measured microhardness of these alloys was 43–46 HV0.1 for AA3103 and 56–64 HV0.1 for AA5049. The microhardness of the 6xxx series aluminium alloys was not stable in the investigated range of temperatures. The maximum was observed in the temperature range of 100–140 °C, which corresponded to the precipitation process of intermetallic phases, as further confirmed by microstructure observations. After the corrosion test, the mechanical properties and elongation decreased by about 5–20%.
1. Introduction
Aluminium alloys are widely used in various industries. One of their applications is the manufacture of components for heat exchangers in vehicles. The trend recently observed in modern car design is to reduce weight and obtain the maximum fuel economy. Consequently, various steps are taken to make the walls of components as thin as possible, while maintaining or even increasing the working pressure and operating temperature. Meeting such requirements is not an easy task, as it means there is a need to keep different properties that often exclude each other at an equally high level [1,2,3]. Modern automotive heat exchangers operate at a temperature of about 100 °C and a pressure of up to 250 kPa (2.5 bars), but in heavy vehicles, the heat exchanger temperature can even reach 275 °C at a pressure of up to 350 kPa (3.5 bars) [1].
At present, the automotive industry uses the chemical agent R134a as a vehicle refrigerant, which belongs to the HFC group. This is, however, a transitional situation only, given that the EU Directives require its change in the near future for environmental reasons.
Agents such as hydrocarbons, R152a, and CO2 have already found potential application as refrigerants in automotive air conditioning systems. It is believed that CO2 (R744) has the greatest chance of being implemented, as it is non-flammable and environmentally friendly. However, its implementation will require a number of modifications to be introduced to the automotive air conditioning components [4,5,6,7]. Air conditioners with R744 are operating under thermodynamically non-standard conditions. One of the major operational problems of CO2 is the required high pressure of this medium. The working pressure parameters used for R744 are from 35 to 130 bars for low and high pressure, respectively, while the instantaneous values can occasionally even reach 160 bars. The temperature profile is also different, and at the outlet from the compressor, the temperature is nearly three times higher (about 160 °C) than the value obtained for the R134a agent.
When analyzing the properties of an automotive air conditioner, factors such as different operating conditions, including vibrations from the drive system, daily temperature changes, changes in the operating temperature, pressure, and environmental effects (e.g., the salinity of roads during winter, humidity), as well as the frequency of use, should be taken into consideration.
Under such, often extremely adverse, conditions, the use of aluminium alloys for parts of air conditioners is dictated by some favourable features of these alloys, such as their light weight, high strength, and corrosion resistance. The surface of aluminium alloys is immediately coated with an oxide film of about a 2–10 nm thickness. This thin film is stable in natural environments in the absence of chlorides and provides natural corrosion resistance to the metal. When the passive layer is damaged, a localized attack starts by the adsorption of aggressive anions and formation of soluble transitional complexes with cations at the oxide surface. Nominally, aluminium is passive in the pH range of ~4 to 9 due to the presence of an Al2O3 film [8,9].
The corrosion potential of aluminium alloys depends on the composition of the aluminium-rich solid solution. The presence of intermetallic inclusions and changes in the chemical composition results in the formation of corrosive cells when water and brine are present, and due to this, the progressing corrosion can damage the surface of the air conditioner components. The most sensitive areas are those where individual parts are joined by brazing and where the occurrence of phase heterogeneity is unavoidable [9]. Despite this fact, aluminium alloys are an excellent material for this type of application and hold an important place in the modern automotive industry.
Therefore, studies of aluminium alloys as a material for the air conditioning units using new refrigerants are of primary importance. The main aim of the research described in this paper was to determine the thermal stability, corrosion resistance, and mechanical properties of four aluminium alloys, i.e., 3103, 5049, 6063, and 6060, used in the manufacture of automotive air-conditioning components, and to investigate their suitability for operation with new agents.
2. Materials and Methods
Studies were carried out on four aluminium alloys of the chemical composition given in Table 1. The tested alloys were delivered in the form of 18 mm diameter tubes with a wall thickness of 1.5 mm, tempered to the following conditions: AA3103–H12, AA5049–F18, AA6060, and AA6063–T1.
The samples were annealed at −25 °C, 25 °C, 40 °C, 60 °C, 80 °C, 100 °C, 140 °C, 180 °C, and 220 °C for 72 h and 240 h and then water cooled. Samples taken from the tubes were subjected to the ASTM G85 Annex 3 (A3) SWAAT test (Sea Water Acetic Acid Test). This is a corrosion test that uses synthetic sea salt instead of traditional sodium chloride. The solution is then acidified using glacial acetic acid. The test is to be operated under wet bottom conditions.
Salt Solution: A synthetic sea salt solution made with the addition of glacial acetic acid, pH range: 2.8–3.0. The temperature of the saturator tower (bubble tower) was kept at 50 ± 1 °C. ASTM G85 Annex 3 (A3) SWAAT (ASTM International, Montgomery, PA, USA) utilizes the following cycle: 30 min spray followed by a 90 min soak at above 98% relative humidity. This test can be used to determine time to perforation primarily on aluminium alloy brazing sheets used for the manufacture of heat exchangers, or even on complete heat exchangers under pressure, or on other parts. It is also applicable in studies of the effect of varying heat treatment conditions on the corrosion behaviour.
Samples in the initial state and after annealing were examined with an Olympus GX51 optical microscope (Olympus, Tokyo, Japan) and Schottky electron gun Scanning Electron Microscope (SEM) (Hitachi, Tokyo, Japan) with Thermo Scientific NORAN System 7 X-ray microanalysis system (EDS)–Hitachi SU70 (Thermo Fisher Scientific, Waltham, MA, USA). Samples for microstructure examinations were mechanically ground and polished with diamond paste and a colloidal suspension of SiO2. The microstructure was revealed by the technique of etching with Barker reagent. The composition of the Barker reagent was as follows: 1.8 cm3 HBF4 + 100 mL H2O. The microstructure was additionally examined by transmission electron microscopy (TEM) using a JEOL 2010 ARP microscope (Jeol Ltd., Tokyo, Japan) with OXFORD Pentafet EDS Energy Dispersive Spectroscopy (Oxford Instruments, Abingdon, UK). The thin foils for electron transmission observations were cut out from the sample longitudinal sections and prepared by the standard technique of electrolytic polishing using Struers apparatus. Tubes after the corrosion test were also examined under an Olympus LEXT OLS 4100 confocal microscope (Olympus, Tokyo, Japan), additionally measuring the corrosion scale thickness. Information about the chemical composition and phase composition of samples was provided by the EDS and X-ray diffraction (XRD) analyses (PAN alytical Empyrean diffractometer (PANalytical, Almelo, The Netherlands), Cu Kα1 = 1.5417 Å radiation, U = 40 kV, I = 30 mA, PIXel detector).
Vickers microhardness (HV) was measured on mirror-shine polished sample surfaces using a standard SHIMADZU HMV-2T E microhardness tester (Shimadzu Corp., Kioto, Japan) with a Vickers indenter. A load of 100 g was applied in the hardness measurements.
The tensile test was performed at room temperature on a Zwick Roell Z050 testing machine (Zwick Roell Group, Ulm, Germany) with a constant crosshead velocity corresponding to an initial strain rate of 10−3 s−1. In each case, the length of both the measuring base and mandrels was calculated based on the PN-EN ISO 6892-1: 2010 Standard. For each variant of the tube before and after the corrosion test, at least three samples were tested (24 samples in total). Based on the obtained results, the 0.2% yield strength (σ0.2), ultimate tensile strength (σUTS), and elongation to failure (εf) were determined.
3. Results and Discussion
3.1. Microstructure Investigations
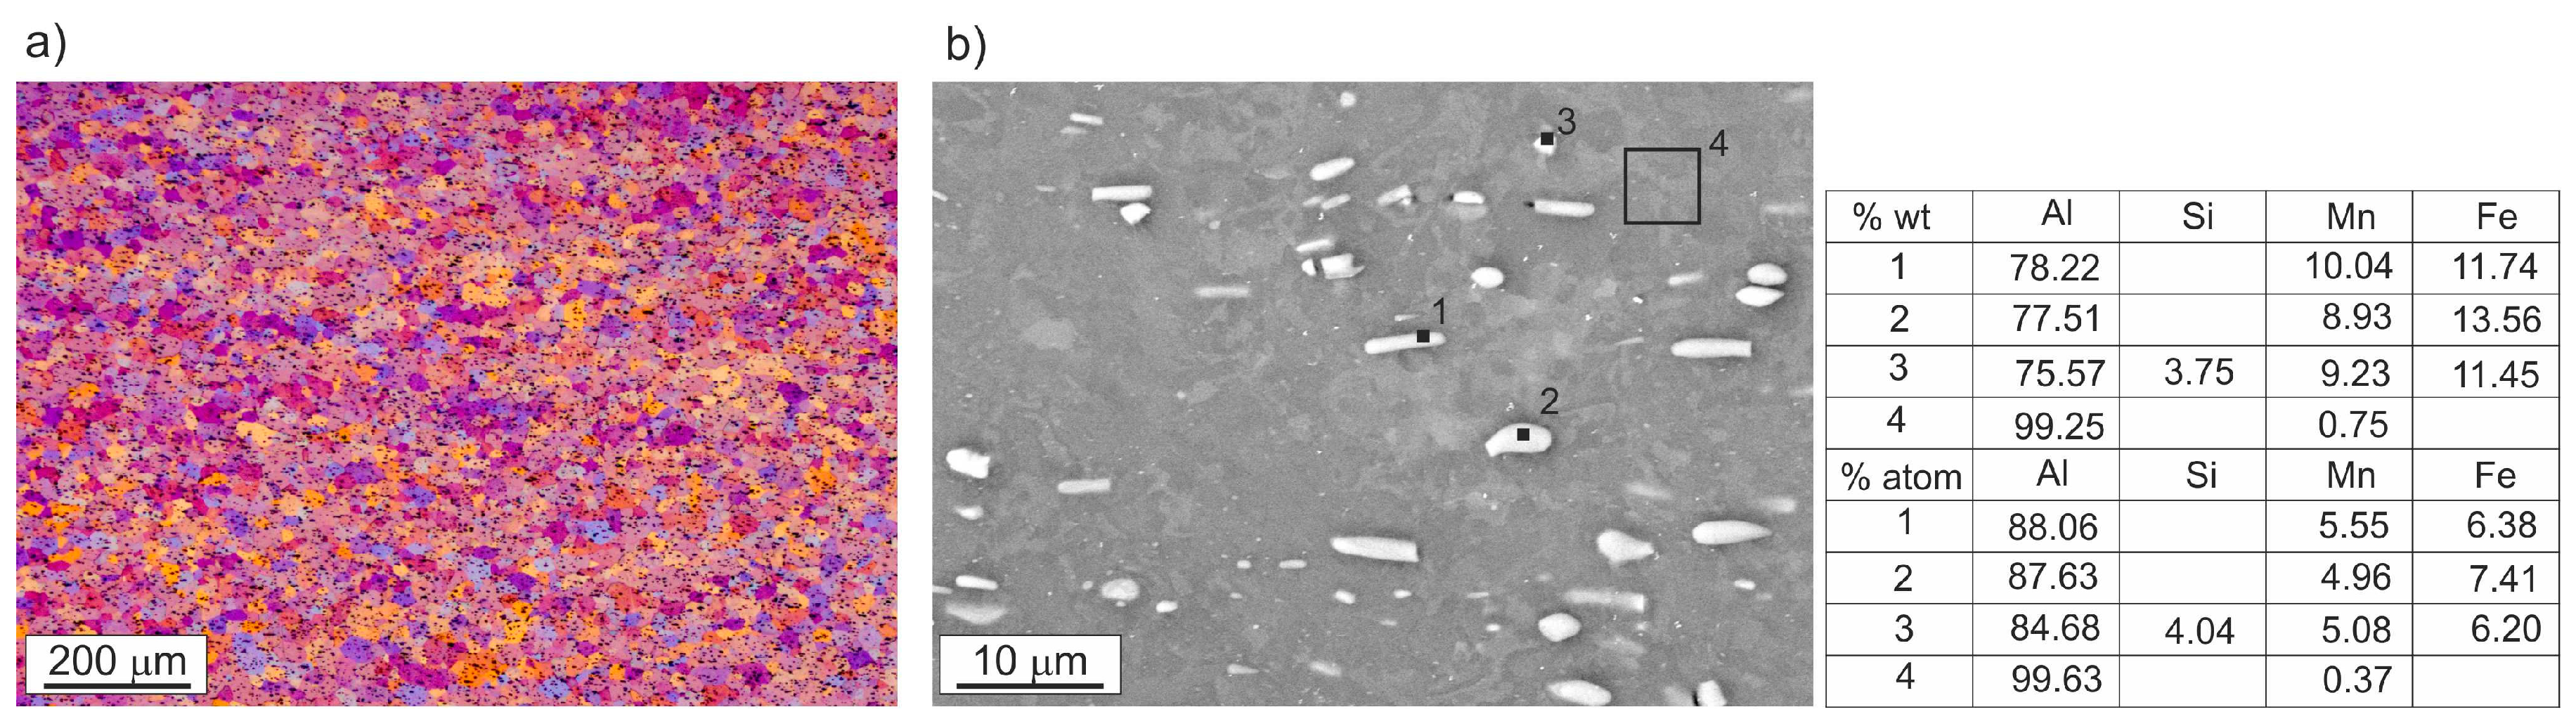
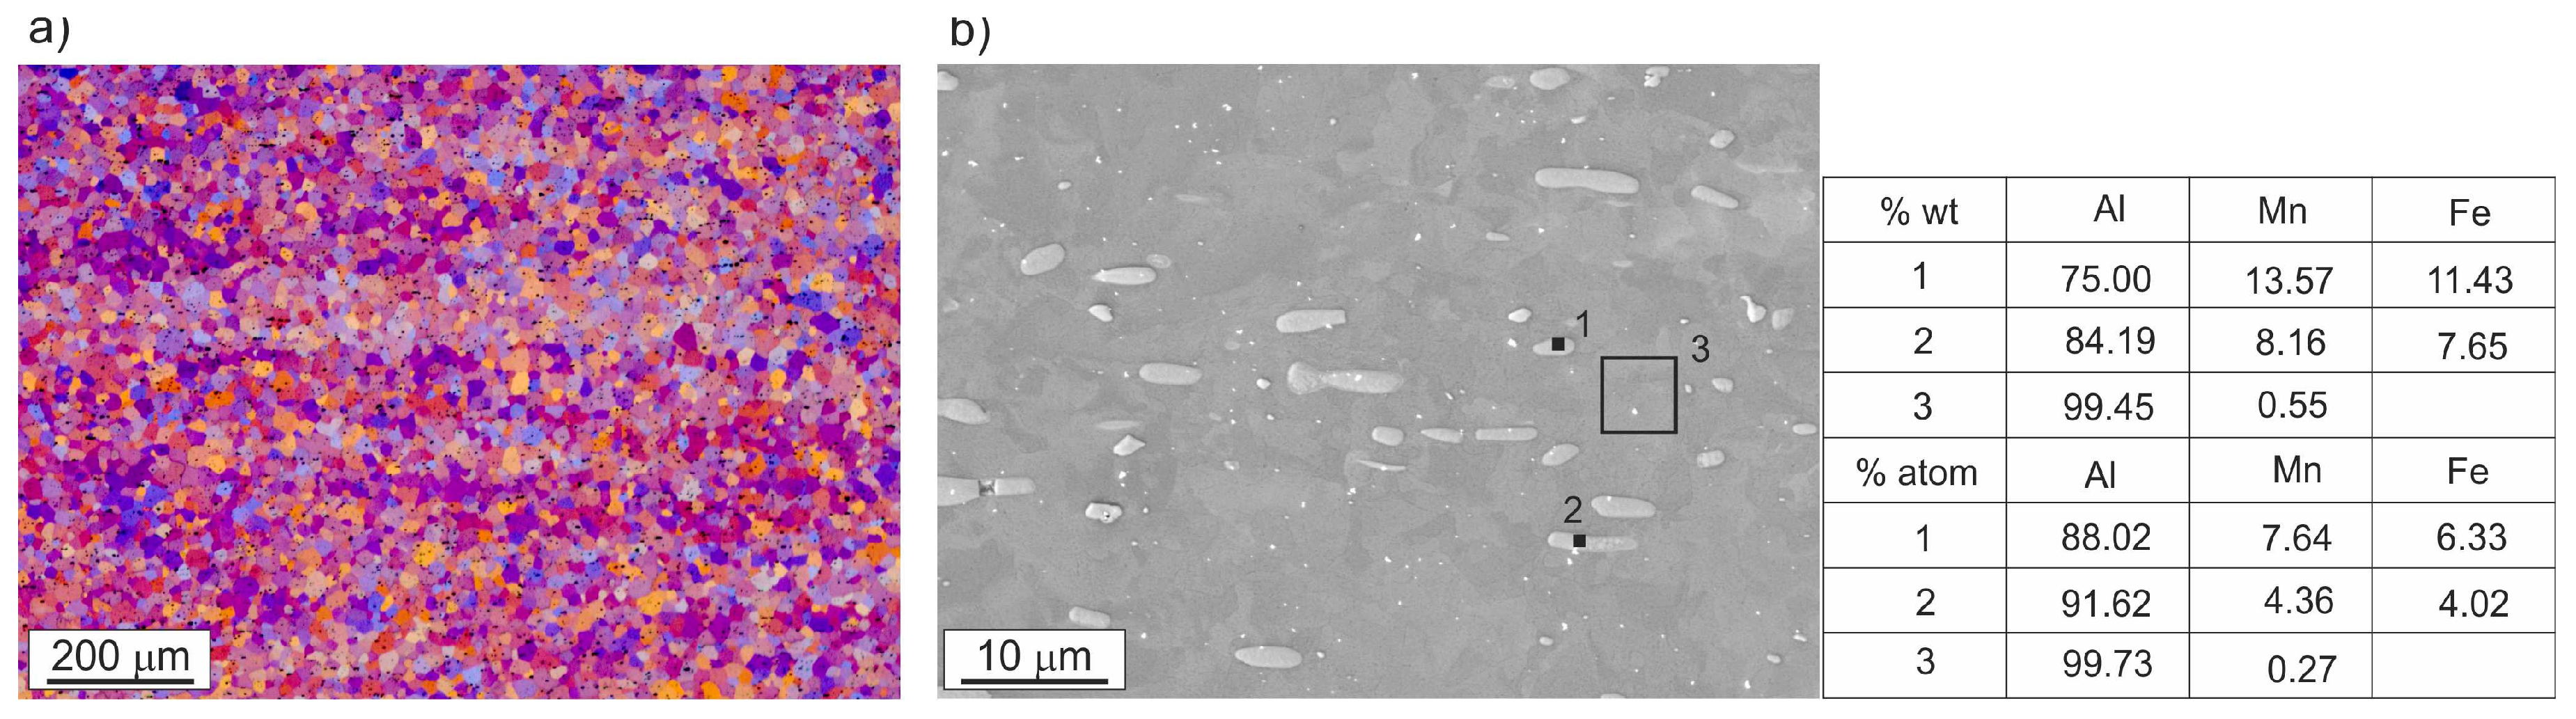
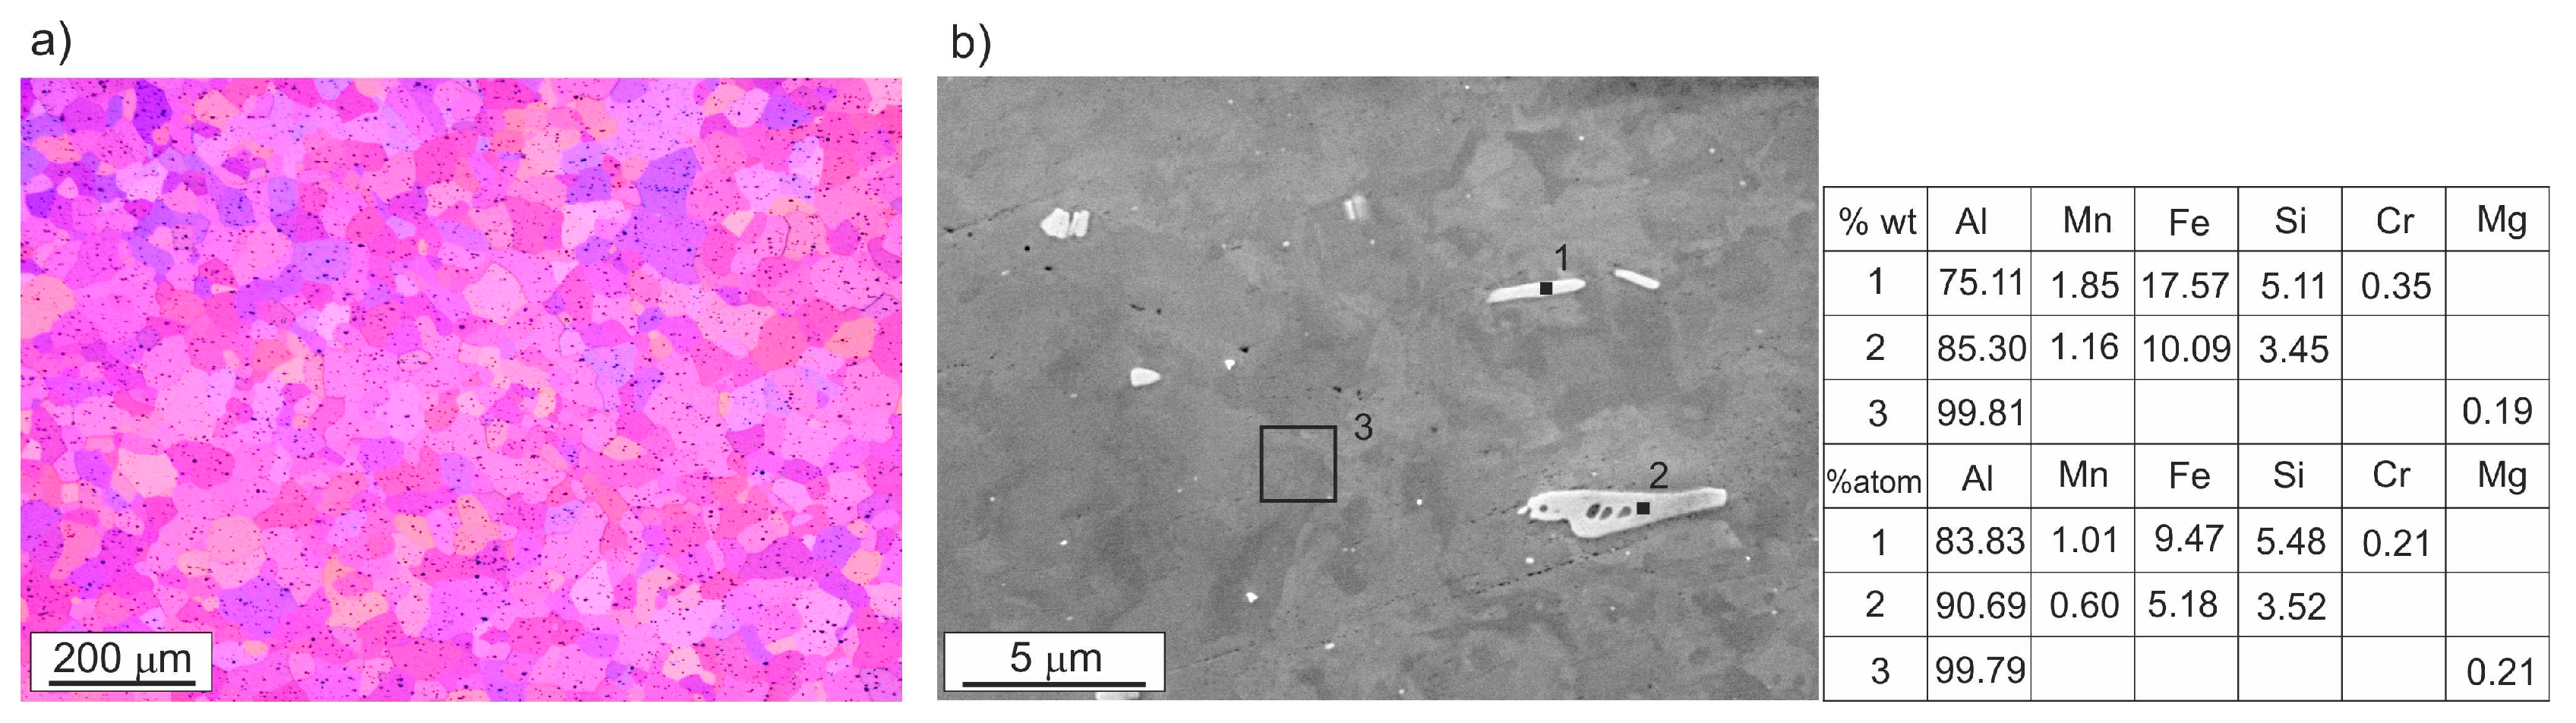
The characteristic microstructures and the phase analysis of the investigated alloys are shown in Figure 1, Figure 2, Figure 3, Figure 4, Figure 5, Figure 6, Figure 7 and Figure 8. Additionally, Figure 1b, Figure 2, Figure 3, Figure 4, and Figure 5b show the results of point analysis. All tested alloys have a regular shape of grains, with a mean grain diameter of 20 μm for AA3103 and AA5049, 35 μm for AA6063, and 70 μm for AA6060.
In the microstructure of all tested alloys, numerous evenly spaced precipitates of the size from a few nanometres up to several of microns were observed. The precipitates were most numerous in the 3103 alloy (Figure 1). Studies of the chemical composition in microregions carried out by EDS showed that in both alloys, i.e., 3103 and 5049, the precipitates were rich in Mn and Fe. On the other hand, TEM analysis of the chemical composition of these precipitates has proved that some of them contained silicon. In microscopic images, the silicon-containing precipitates were visible as dark grey particles, while the silicon-free precipitates had a bright colour (Figure 1b, Figure 2, Figure 3b and Figure 4). In the microstructure of the 6060 and 6063 alloys, iron-rich phases (bright-colour precipitates) and magnesium-rich phases were present. Magnesium was also traced in the alloy matrix (Figure 5).
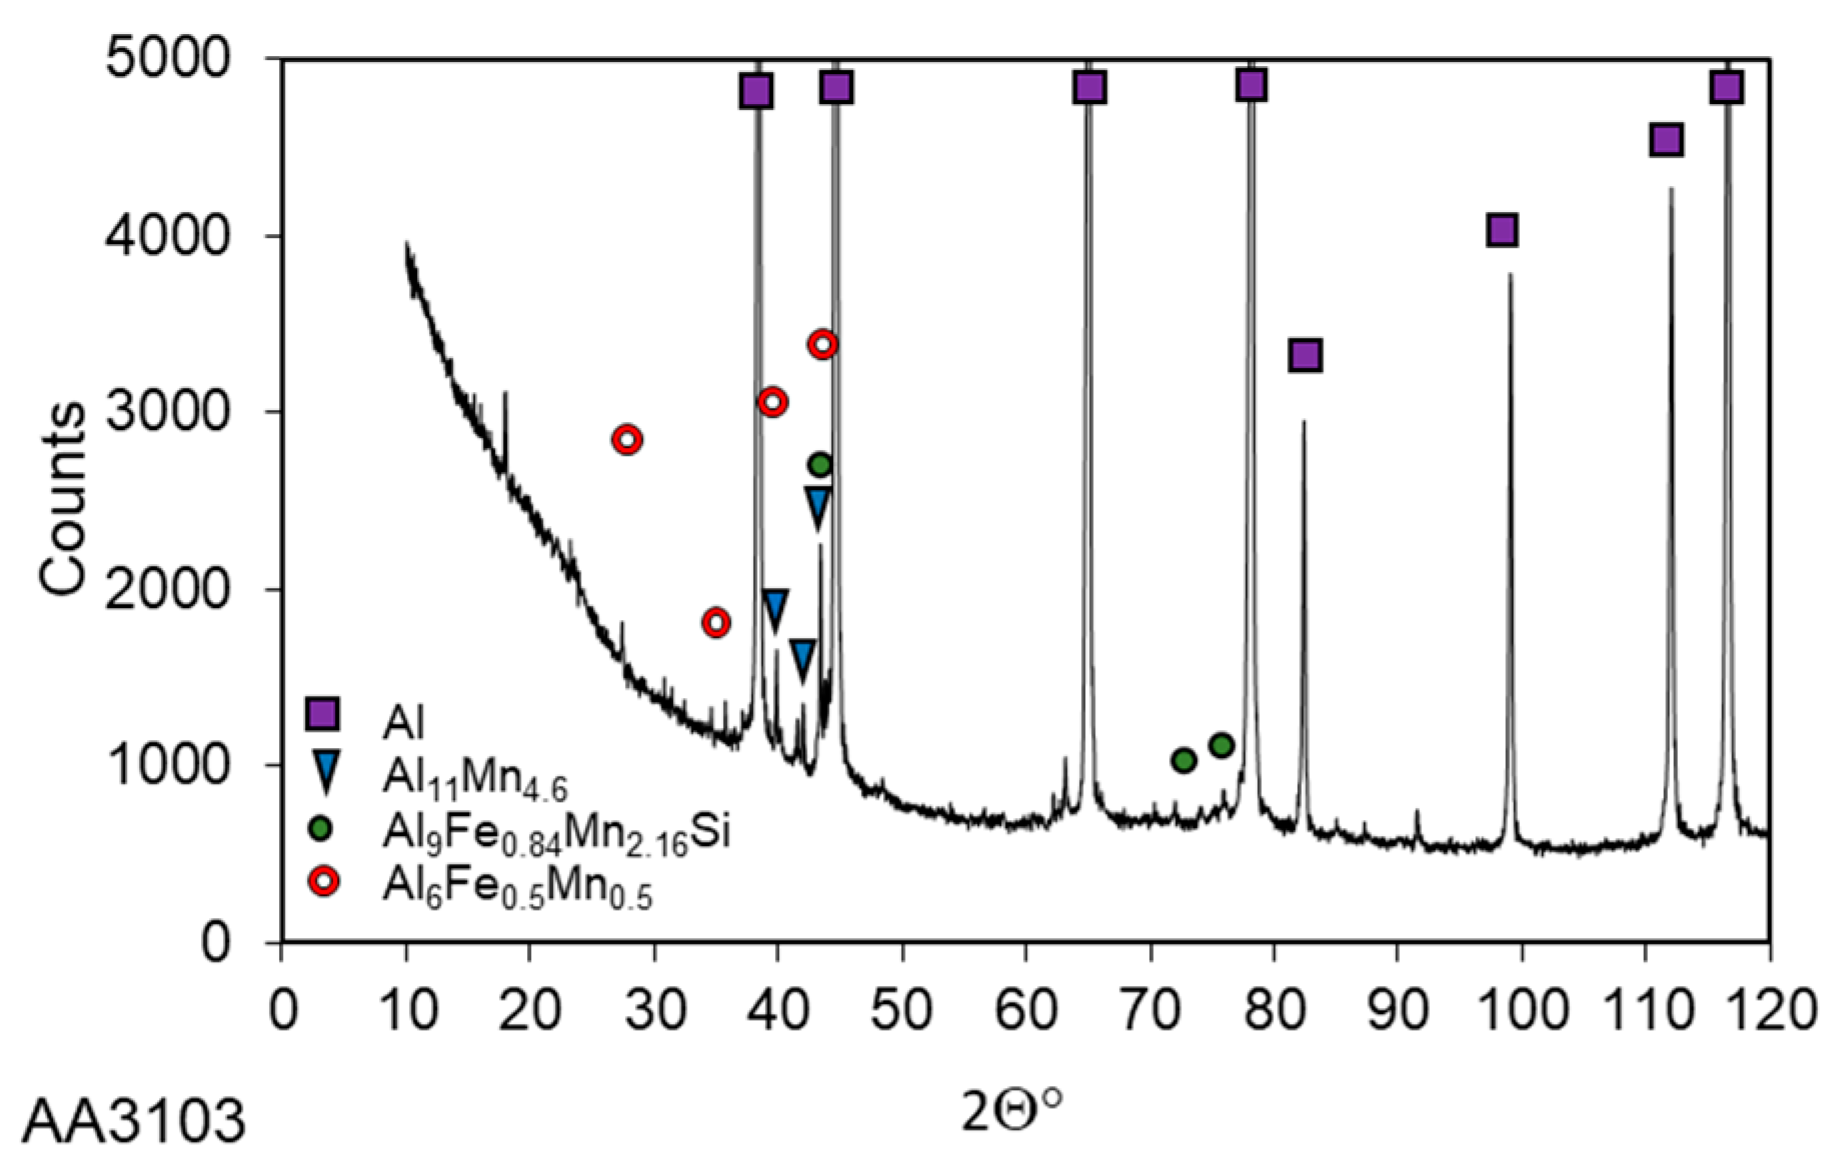
For a more accurate determination of the chemical composition of the precipitates, an X-ray phase analysis was also performed. The peaks visible on the diffraction pattern indicate that in the 3103 and 5049 alloys, the precipitates are Al11Mn4.6 and Al6Fe0.5Mn0.5 phases. Additionally, two other phases were identified, i.e., Al9Fe0.84Mn2.16Si in the 3103 alloy and Al17.1Fe3.2Mn0.8Si1.9 in the 5049 alloy (Figure 6 and Figure 7). In the 6xxx series alloys examinations by the X-ray phase analysis indicated the presence of peaks originating from the Al3Fe, Mg2Si, and Al5.15Mg3.15 phases (Figure 8).
3.2. Thermal Stability Investigations
Due to variations in the operating temperature, materials used for the automotive air conditioning components should meet the condition of thermal stability. To confirm that all tested alloys meet this condition, annealing of tubes was carried out in a wide range of temperatures, i.e., from −25 °C to 220 °C, for the time of 72 h and 240 h, followed by hardness measurements. The obtained results are graphically depicted in Figure 9a–d.
The results of microhardness measurements have proved that 3103 and 5049 aluminium alloys are stable within the entire range of the heat treatment temperatures. The average hardness of 3103 and 5049 is 45 HV0.1 and 60 HV0.1, respectively. The differences are within the range of measurement error. A longer annealing time has nearly no effect on the level of microhardness (Figure 9a,b).
The situation was different in the case of 6060 and 6063 alloys, where changes in microhardness were found to be dependent on the annealing temperature. The microhardness of the 6060 alloy remained at a constant level of 59–64 HV0.1 up to a temperature of 80 °C. Annealing at higher temperatures resulted in its increase, followed by a decrease to approximately 46HV0.1 after annealing for 72 h and to 40 HV0.1 after annealing for 240 h. In the case of 72 h annealing, the microhardness peak occurred at 140 °C and the measured value of microhardness was 80 HV0.1, while after annealing for 240 h, the peak occurred at 100 °C with a microhardness value of about 90 HV0.1 (Figure 9c).
The microhardness of the 6063 alloy was higher than that of the 6060 alloy, and this was mainly due to the higher content of alloying additives and smaller grain size. When heat treated for 72 h, this alloy was stable up to a temperature of 140 °C (the average hardness was 80HV0.1), and then a decrease in hardness occurred. With the annealing time extended to 240 h, the microhardness started growing at 100 °C (92 HV0.1) (Figure 9d). Differences in the hardness of 6xxx series alloys are controlled by the precipitation process. In the 6xxx series containing magnesium and silicon, alloy properties are mainly shaped by the process of precipitation hardening, the result of which depends on the conditions of solution treatment and ageing. In the initial stage of the annealing process, separate clusters of Mg and Si atoms are formed in the solid solution. Then, joint clusters of Mg/Si appear, accompanied by the formation of GP zones [10,11,12,13,14]. AlMgSi alloys are most effectively strengthened by the β″ phase of the Mg5Si6 formula [10,15]. During further ageing, the β′ phase is formed along with other phases which need a higher ageing temperature for their formation (200–300 °C) and are generally described in the literature as U2, U1, and B′, or B, A, and C, respectively [10]. According to the literature, several of the above-mentioned phases, e.g., β′, U2, U1, and B′, or β″, β′, U1, and U2 [10,12], can occur simultaneously in the microstructure of the aged alloys. In the final stage of ageing, the β-Mg2Si equilibrium phase is formed, while in alloys with a higher silicon content, silicon precipitates also appear.
It has been assumed that the precipitation sequence during the ageing of 6xxx series aluminium alloys follows the general scheme described below [12]:
Supersaturated solid solution α(Al) → Mg/Si clusters → GP zones (spherical) → β″ (needles) → (β′ + U2 + U1 + B′) (rods) → β.
Except for the β-Mg2Si phase, other phases are considered metastable during ageing treatment. The type of precipitates and their relative quantity depend on the alloy composition, mechanical deformation, and thermal history prior to ageing, e.g., the storage time at room temperature [10,16,17]. Table 2 gives an overview of phases most commonly found in the AlMgSi system.
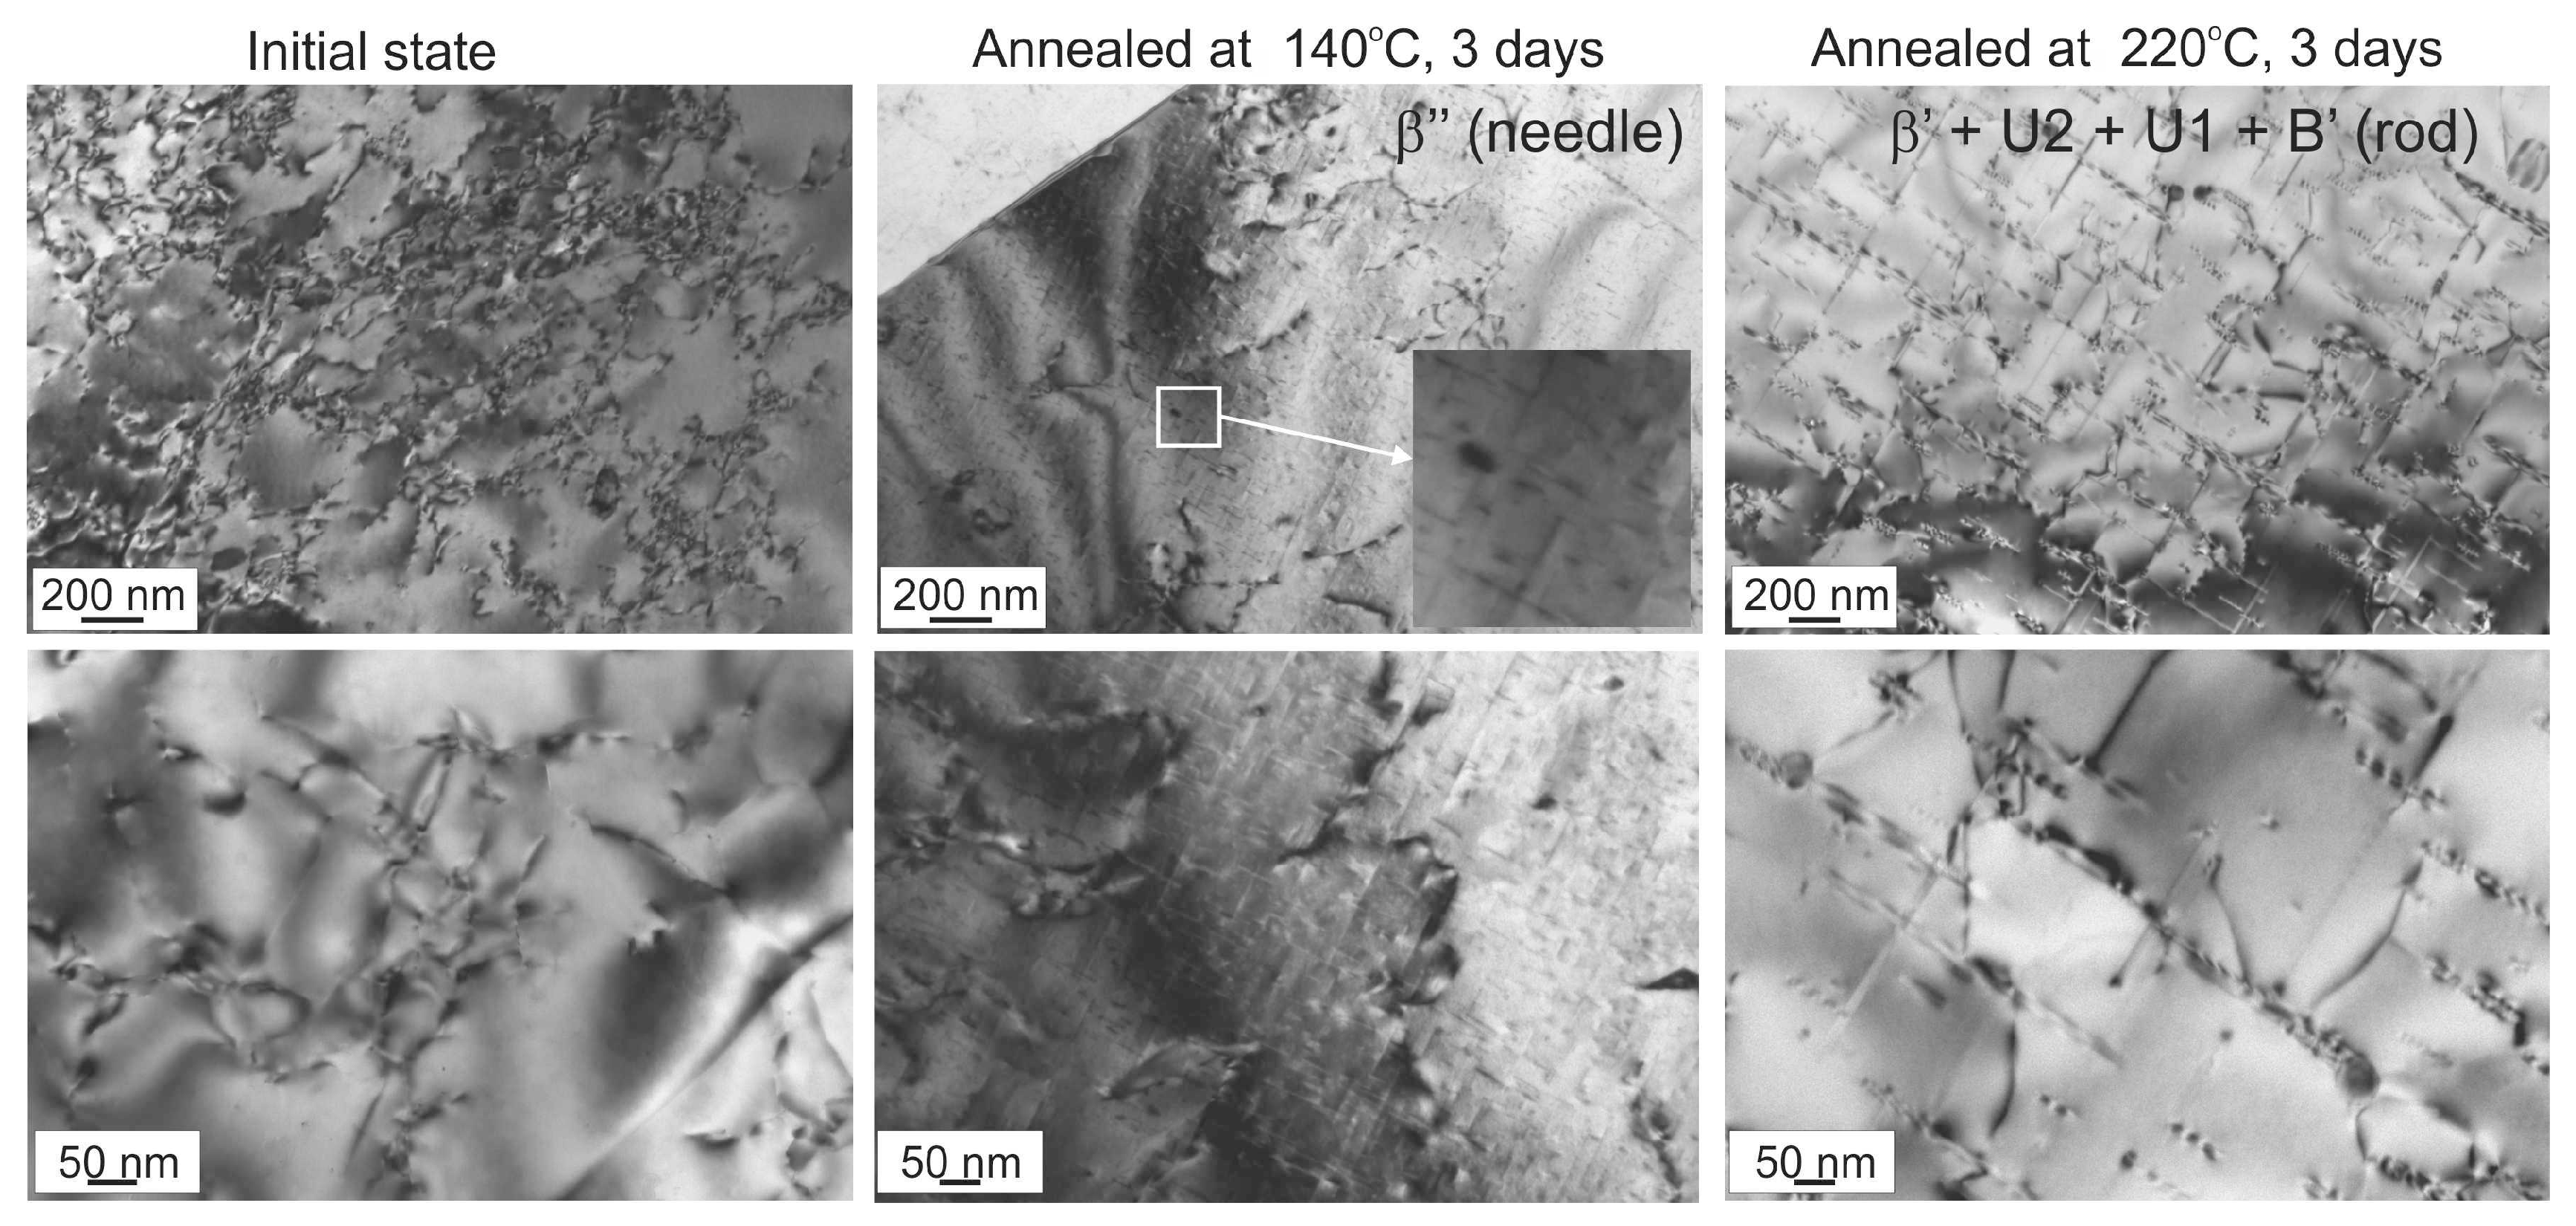
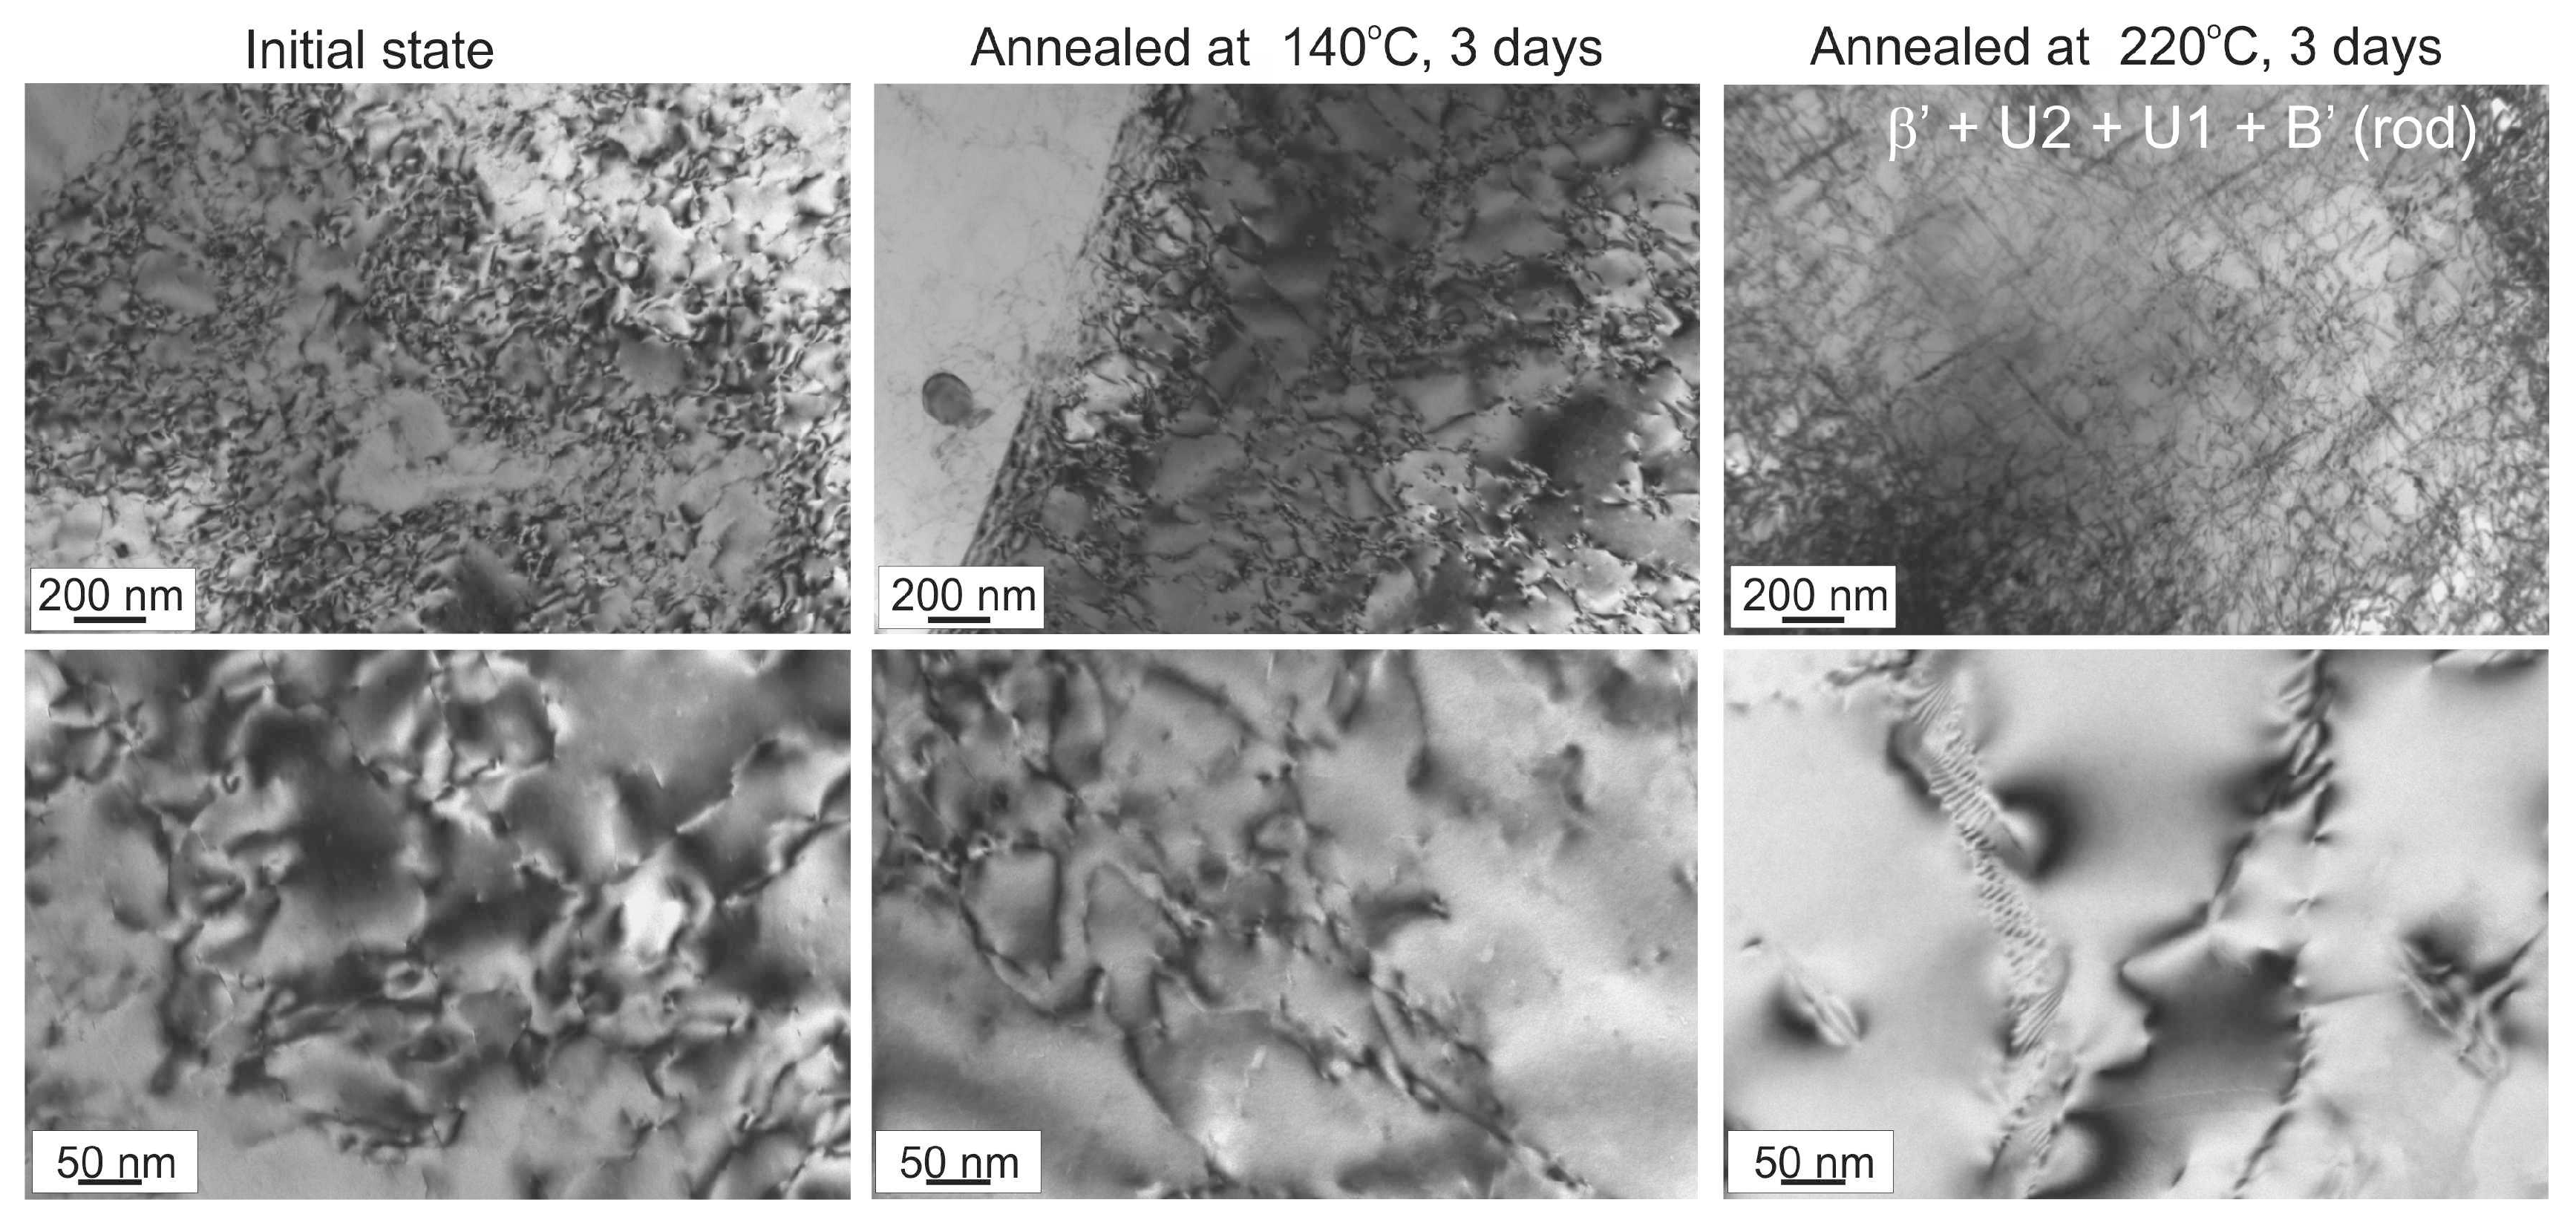
Figure 10 and Figure 11 show selected TEM images of the microstructure of 6060 and 6063 alloys in the initial state and after annealing at 140 °C and 220 °C for three days.
It can be presumed that the growth peak observed in the microhardness graph is related to the occurrence of β″ phase precipitates in the microstructure of the alloys. The precipitates of this phase have the shape of needles of the maximum length of a few dozen nanometres and they are coherent with the crystal lattice only in their length [10]. A higher annealing temperature results in a significant decrease of microhardness, overageing of the alloy, and precipitation in its microstructure of the β′ phase and of other phases defined as U2, U1, and B′. A detailed analysis of the dislocation microstructure may indicate that these are the precipitates of the β′, U2, and U1 phases. According to literature data, these precipitates have the shape of rods of up to a 500 nm length and form phases semi-coherent with the matrix [10]. In the microstructure of the alloy in the initial condition, dislocation tangles and small precipitates are visible.
3.3. Corrosion Resistance Investigations
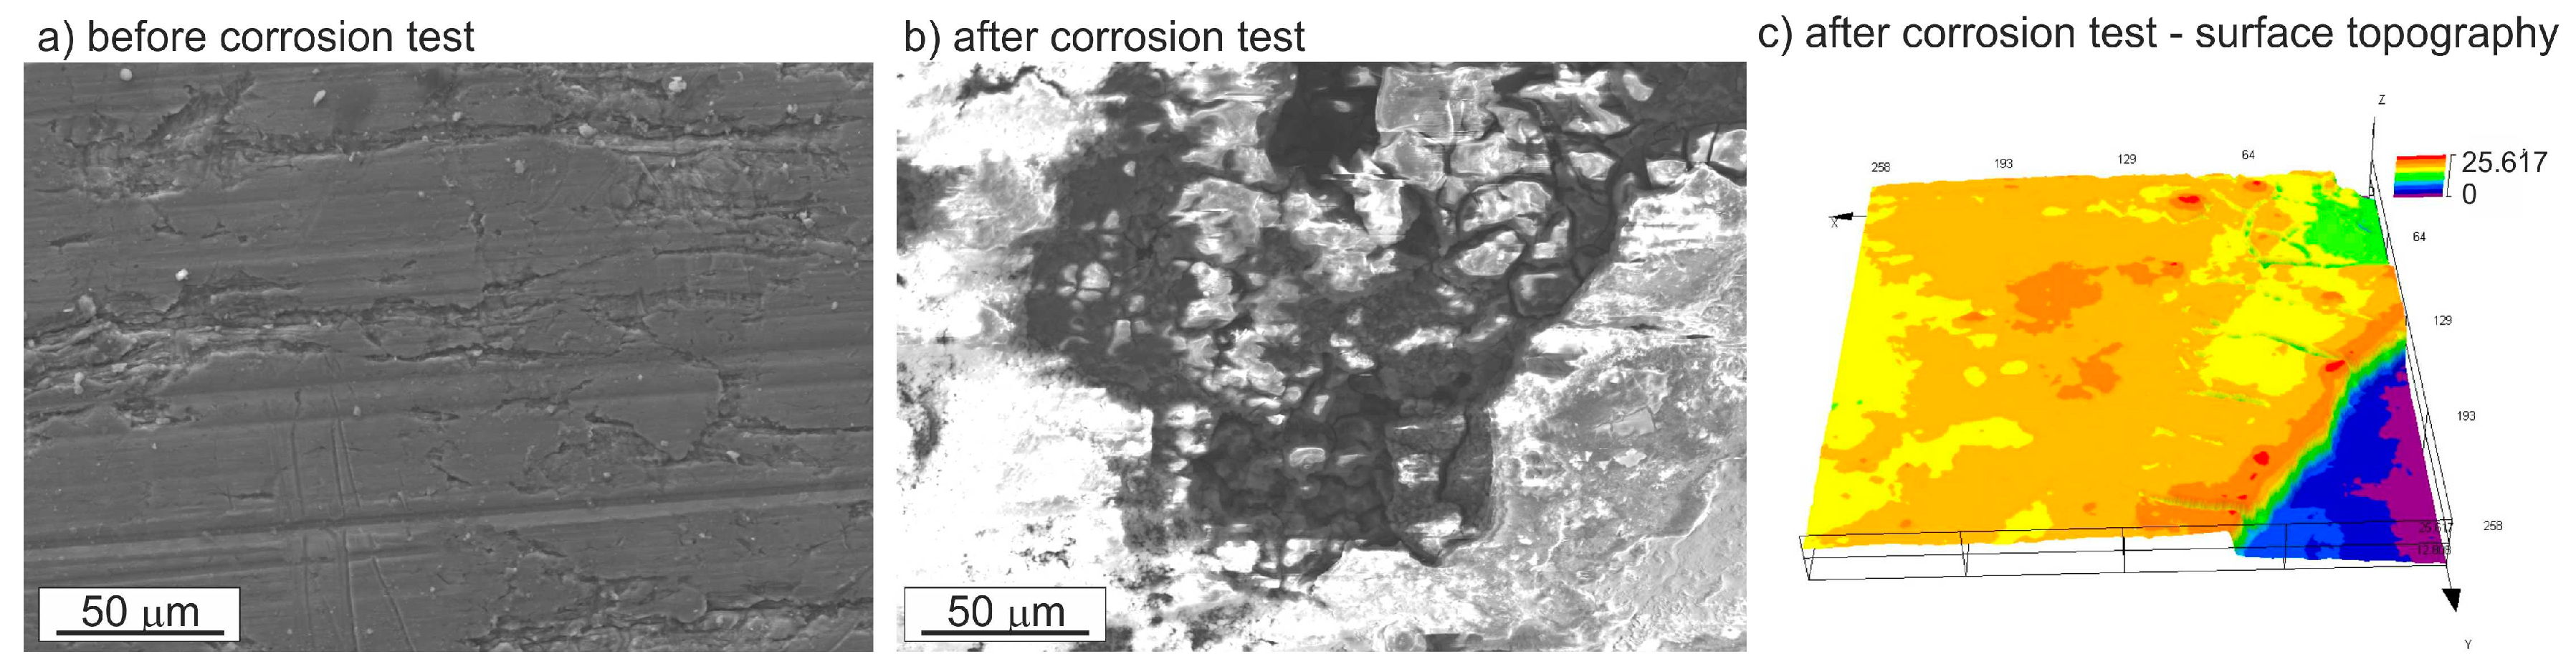
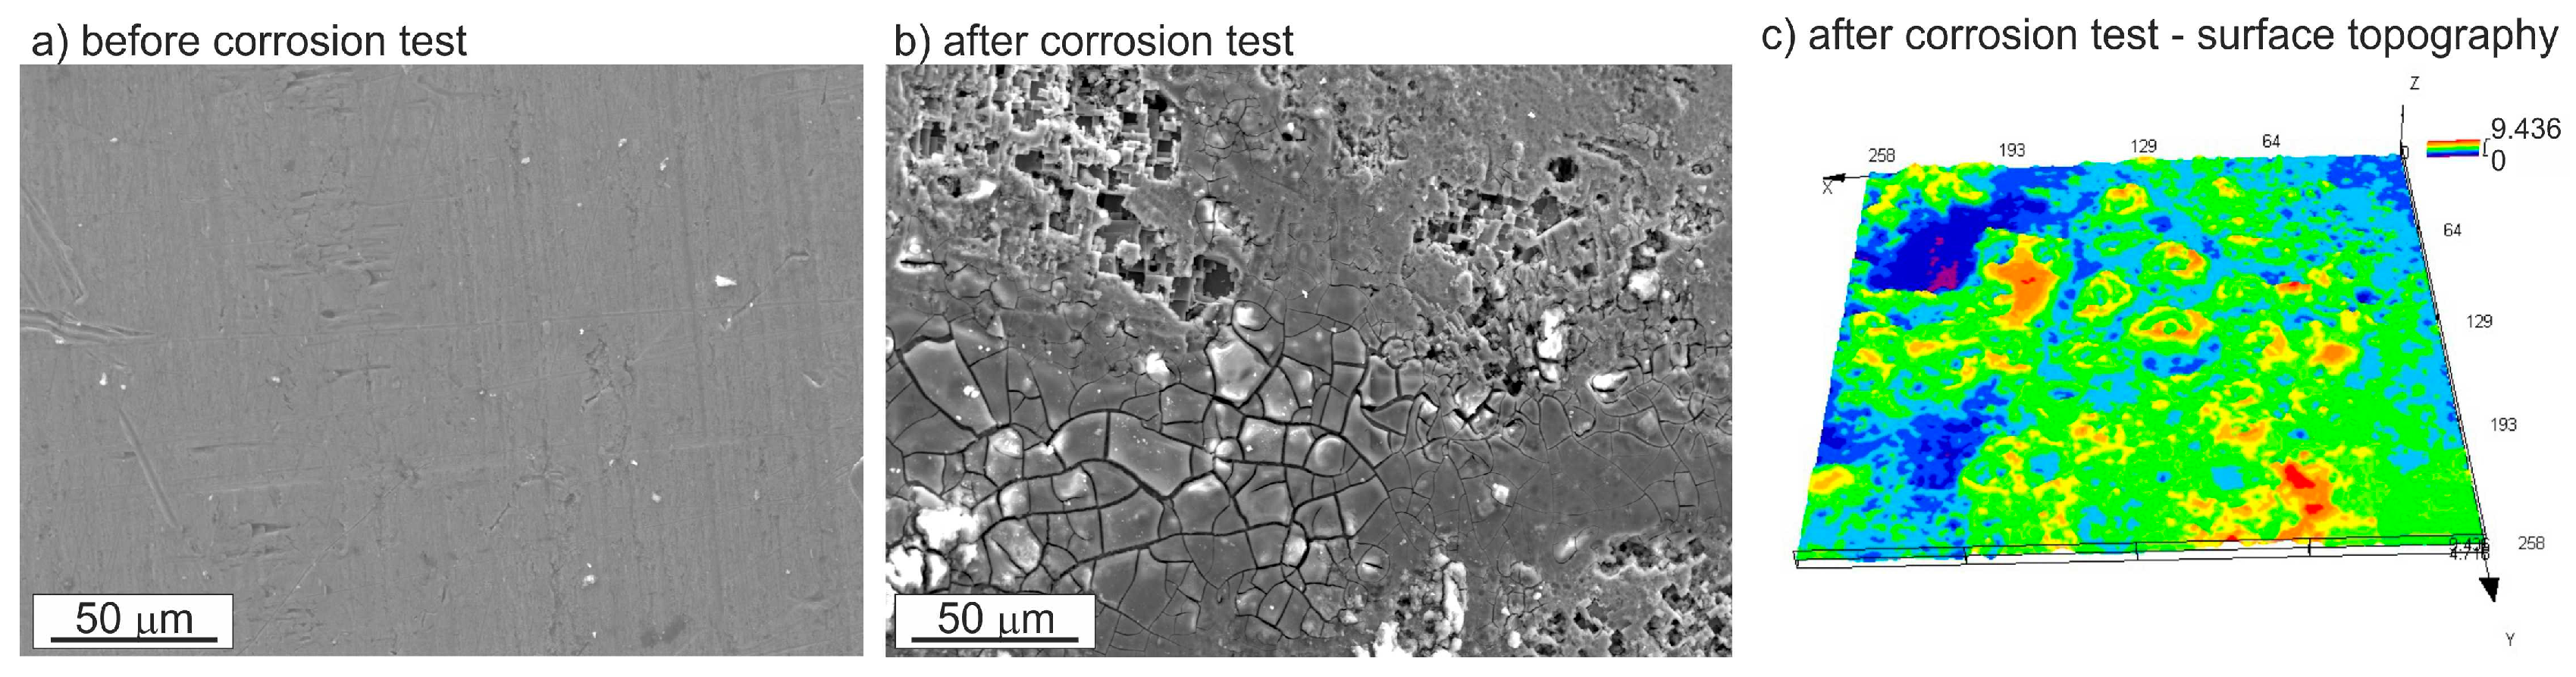
On the surface of tubes before corrosion tests, surface defects such as scratches and even micro cracks are visible (Figure 12a, Figure 13a, Figure 14a and Figure 15a). Under favourable conditions, these defects can facilitate the development of corrosion process. Observations of the surface of tubes after the salt spray test show large variations in the morphology of the formed scale (Figure 12, Figure 13, Figure 14 and Figure 15). In the 3103 and 5049 alloys, the scale forms “islands” and does not completely cover the surface of the tubes (Figure 12b,c and Figure 13b,c). On the other hand, it forms a thick layer on the surface of tubes made from the 6xxx series alloys, especially as regards tubes made from the 6063 alloy (Figure 14 and Figure 15). Additionally, numerous cracks appear in the scale (Figure 14b and Figure 15b). Their presence can facilitate the formation of corrosion centres and, consequently, accelerate the destruction of corrosion-affected installations under varying atmospheric conditions.
Detailed study of the tube surface after the corrosion test shows the occurrence of pitting corrosion, best seen in Figure 15b. The susceptibility of aluminium alloys to pitting corrosion and other forms of localized corrosion, such as selective dissolution, trenching, intermetallic particle etchout, intergranular attack, and exfoliation corrosion, is associated with the electrochemical nature of the intermetalic phases. Surface and subsurface grain etchout is also influenced by grain energy, which is directly related to the density of grain defects. The corrosion behaviour is often correlated with the difference of potential between the intermetalic compounds present in the alloy and the matrix. The mere existence of intermetallic compounds can promote failures in the protective oxide film [9,18,19,20].
The corrosion process in aluminium alloys is generally of a local nature, because anodic and cathodic reactions are well-separated and solution resistance limits the galvanic cell size [9]. In [18,21], the authors have demonstrated that when an aluminium alloy is exposed to the effect of NaCl solution, the corrosion of metal is accompanied by the oxidation of aluminium taking place as an anodic reaction:
Since the solution of NaCl contains a certain amount of dissolved oxygen, the main cathodic reaction at the cathodic sites (outside the pits) will be the reduction of oxygen:
or hydrogen reduction in acidified solution, such as occurs in a pit environment, as a result of aluminium hydrolysis:
As a result of the cathodic reaction, the concentration of hydroxide ions increases, so the local pH becomes more alkaline and the following reaction occurs:
Al(OH)3 is further transformed into Al2O3 by:
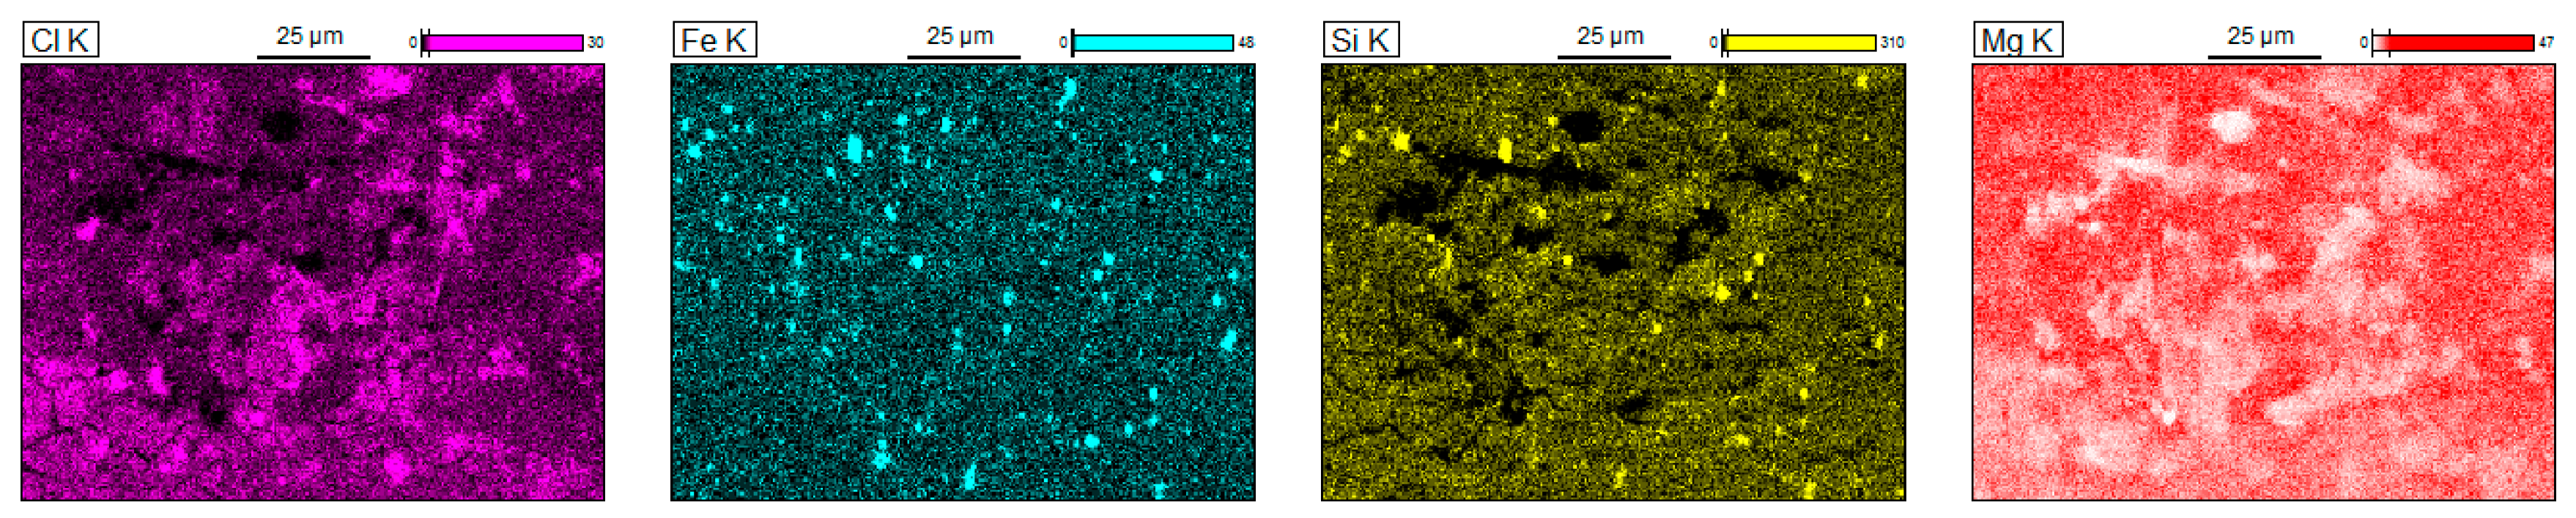
Chloride ions from the corrosive atmosphere can react with the Al3+ cations and form aluminium chloride. The possible corrosion products consist of Al(OH)3, Al2O3, and AlCl3 [22]. Figure 16 shows the microstructure of the AA6063 alloy and maps of the distribution of selected elements on the surface of the tube subjected to corrosion testing. Studies have confirmed the occurrence of the previously mentioned corrosion products.
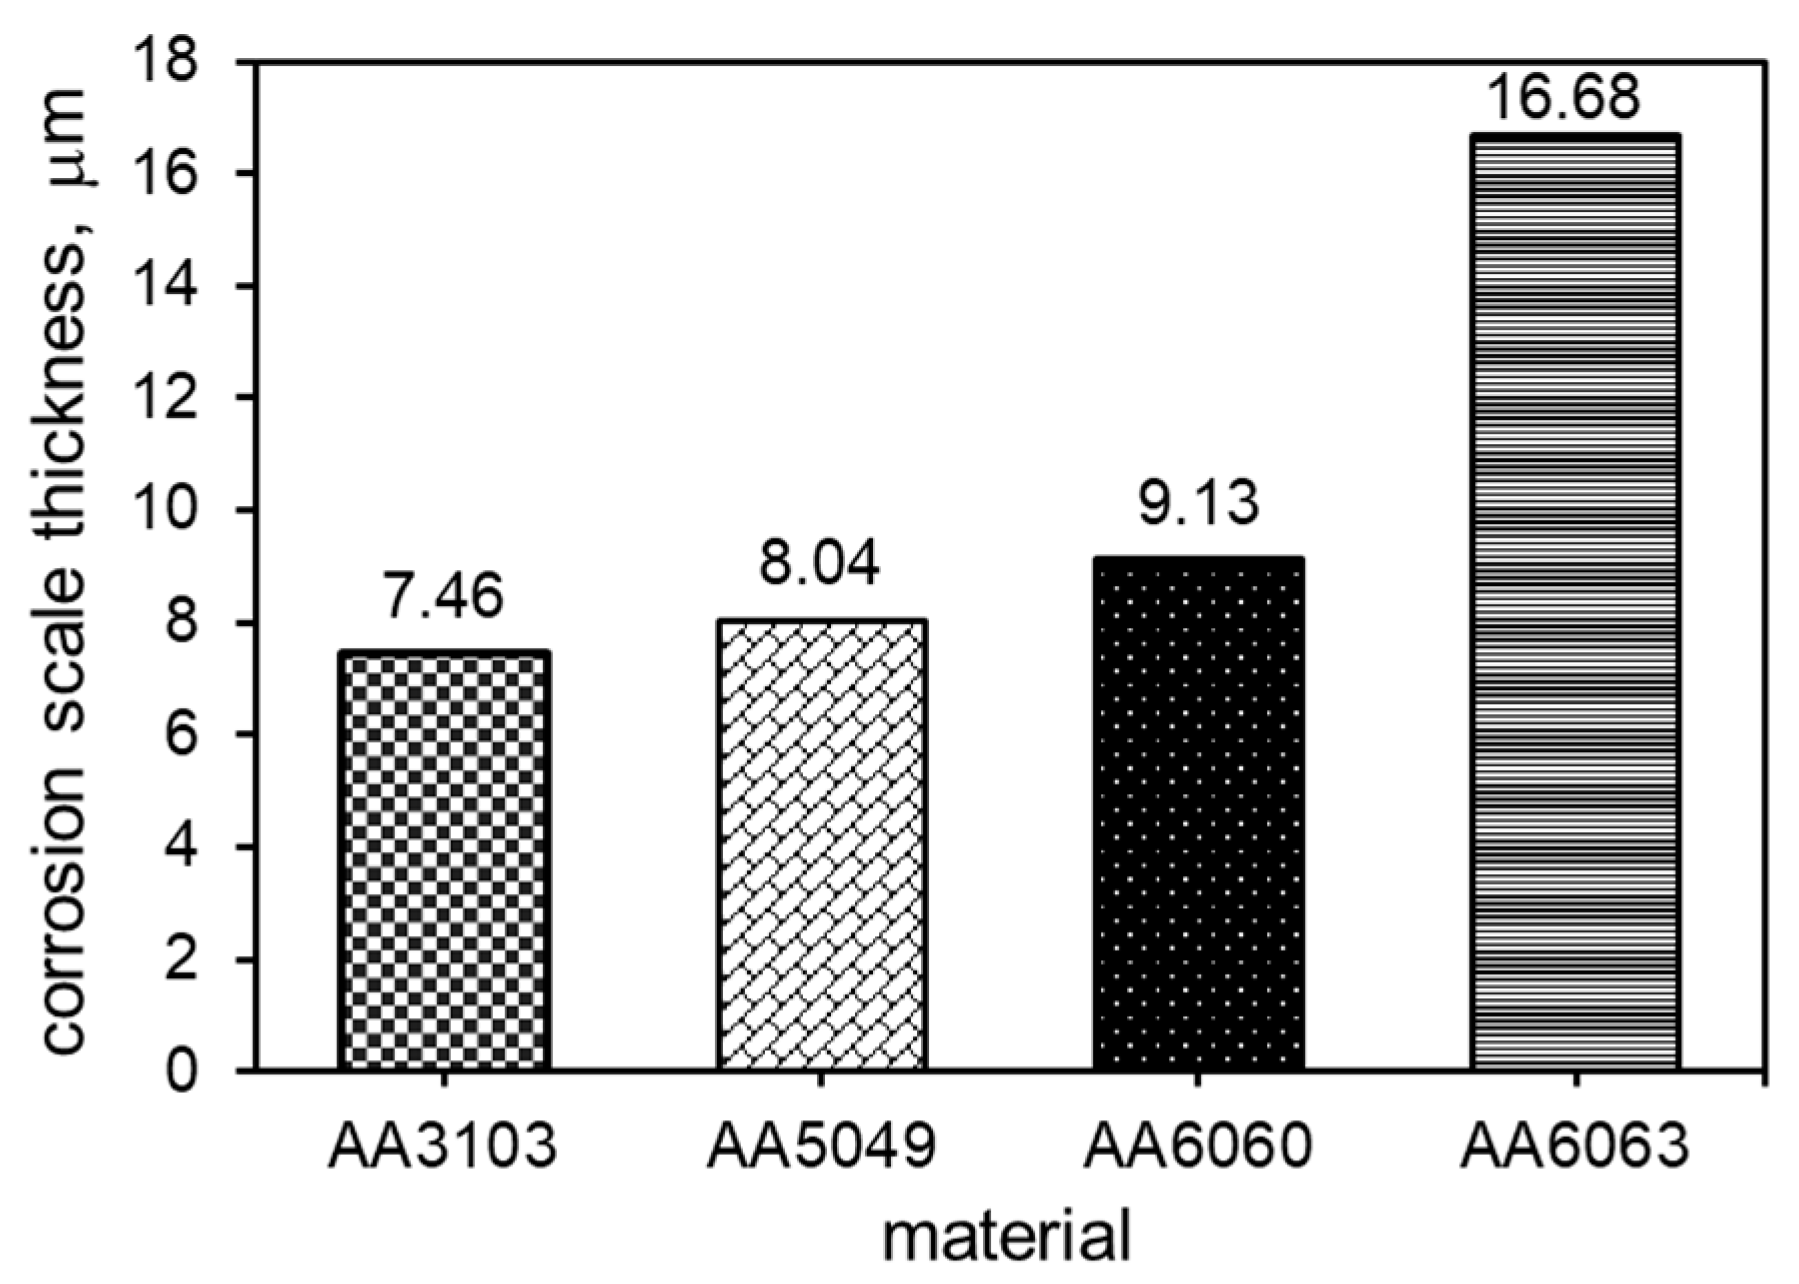
The measured thickness of the scale formed on the test tubes during the salt spray corrosion test depended on the alloy grade. The thickness of the scale formed on the 3103, 5049, and 6060 alloys was comparable and measured approximately 7.5–9 μm. Studies have shown that the thickest layer of scale was formed on the 6063 alloy; its average thickness was 17 μm (Figure 17).
To identify the possible impact of a corrosive environment on the destruction of materials in the subsurface layer, cross sections of the tubes were examined. The results showed that in each case, the subsurface layer was destroyed, but the depth of changes penetrating into the material depended on the alloy grade (Figure 18). The AA3103 alloy was characterized by the highest resistance to the effect of a corrosive environment, while AA6060, where pitting locally penetrated into the material even to a depth of 300 μm, was the most corrosion-sensitive. The images in Figure 18 show the presence of local intercrystalline corrosion, which is particularly evident in the AA5049 and AA6060 alloys. This type of corrosion is extremely dangerous, as it can contribute to the formation of cracks, especially under the conditions of variable stresses and temperatures, to the extent that the automotive air conditioning components are exposed. The progressing corrosive changes contribute to the deterioration of mechanical properties, as confirmed by the results shown in Figure 19.
The research described in [9] interrelates the corrosion rate with the hardness of the aluminium alloy. The results show that the higher the hardness of the alloy, the higher the corrosion rate. It has also been observed that precipitation-hardenable alloys are characterized by the highest rate of corrosion. The reported results confirm this observation, especially with reference to the AA6060 alloy, in which the greatest decrease in mechanical properties after the corrosion test in a salt spray chamber was observed, and in which the depth of corrosion penetration was also the largest (Figure 18 and Figure 19).
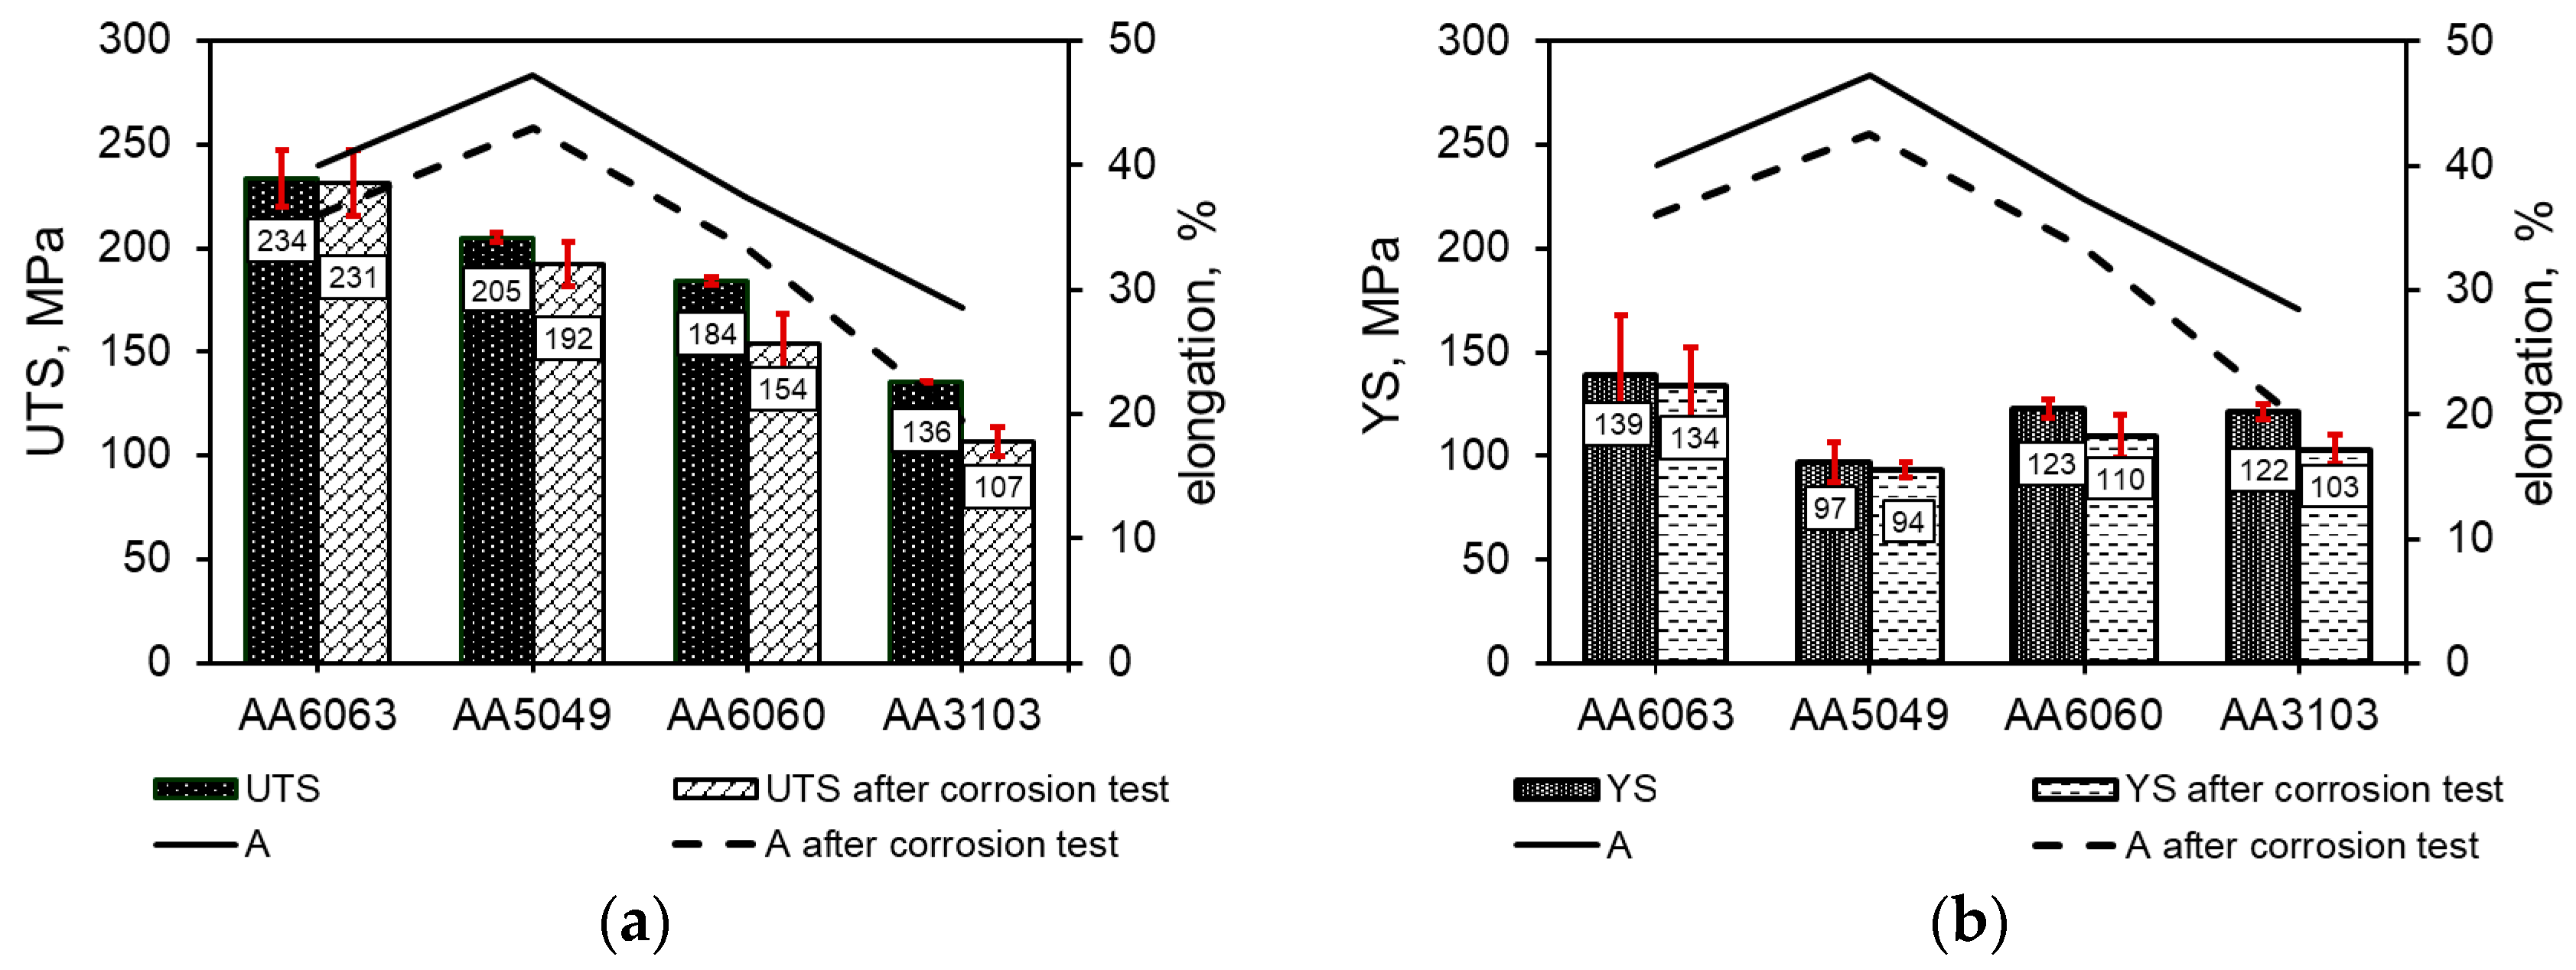
A uniaxial tensile test was performed to determine the mechanical properties of the alloys tested. The obtained results showed a 5–20% decrease in both mechanical properties and elongation in all the examined alloys after the corrosion resistance test in a salt spray chamber (Figure 19a,b). The greatest decrease in tensile strength was observed in the 6060 alloy.
The results plotted in respective graphs are average values. Three samples of each alloy were subjected to the tensile test before and after the corrosion test. The average values of the tensile strength and yield strength obtained in the AA6063 alloy tubes before and after the corrosion test in a salt spray chamber were at a similar level and amounted to approximately UTS = 230 MPa and YS = 135 MPa. The observed minor differences were within the range of measurement error. After the corrosion test, a UTS drop of approximately 7% was observed in the AA5049 alloy, and the tensile strength values before and after the test were UTS = 205 MPa and UTS = 192 MPa, respectively. The yield strength was rather stable and at a level of approximately YS = 95 MPa. After the corrosion salt spray test, both AA6060 and AA3103 suffered a nearly 20% drop in UTS; the yield strength was reduced by 10% in AA6060 and by 16% in AA3103. The measured values were then as follows: for AA6060 before corrosion test: UTS = 184 MPa, YS = 123 MPa, and after corrosion test: UTS = 154 MPa, YS = 110 MPa, for AA3103 before corrosion test: UTS = 136 MPa, YS = 122 MPa, and after corrosion test: UTS = 107 MPa, YS = 103 MPa. In each case, the elongation decreased by 10%–20% (Figure 17a,b).
As stated earlier, the precipitation process of the intermetallic phases in aluminium alloys due to temperature changes was responsible for changes in the phase composition, especially in alloys from the 6xxx series. One of the consequences of these changes was variations in microhardness and mechanical properties. Additionally, the intermetallic phases had different electrochemical characteristics, which initiated the corrosion process.
In spite of all these facts, it has been found that the variations in the tested alloys are within the limits set by the DIN 74106:2015-08 Standard. Therefore, it can be firmly stated that the investigated alloys are suitable for parts of the automotive air conditioning systems.
4. Conclusions
The results obtained in this study have led to the following conclusions:
- Both AA3103 and AA5049 are stable within the entire range of the investigated temperatures. The average measured microhardness of AA3103 and AA5049 is 45 HV0.1 and 60 HV0.1, respectively. As regards AA6060 and AA6063, neither of them is stable in the investigated range of temperatures. The maximum HV0.1 occurs in the temperature range of 100–140 °C and is due to the precipitation process of the intermetallic phases.
- Pitting is the main corrosion process. It starts in or around the intermetallic particles present in the alloys and is the result of the difference of potential between the intermetallic phases and the matrix.
- The obtained results have demonstrated a decrease in the mechanical properties and elongation of about 5–20%, observed in all the examined alloys after the corrosion resistance test in a salt spray chamber. This is mainly due to the effect of corrosion that attacks the material and penetrates into its interior.
- Despite the adverse impact of corrosion deteriorating the strength properties of the tested alloys, the values obtained remain within the acceptable range. Hence the conclusion follows that all the tested alloys satisfy the imposed requirements and can be safely used for parts of the automotive air conditioning systems.
Acknowledgments
Financial support from The National Centre for Research and Development under grant No.: PBS3/B5/43/2015 is gratefully acknowledged.
Author Contributions
Beata Leszczyńska-Madej and Maria Richert conceived and designed the experiments; Beata Leszczyńska-Madej and Anna Wąsik performed the experiments; Beata Leszczyńska-Madej and Maria Richert analyzed the data; Adam Szafron contributed reagents/materials/analysis tools; Beata Leszczyńska-Madej and Maria Richert wrote the manuscript. All authors have discussed the results, read, and approved the final manuscript.
Conflicts of Interest
The authors declare no conflict of interest.
References
- Kahl, S.; Ekström, H.-E.; Mendoza, J. Tensile, Fatigue and Creep Properties of Aluminium Heat Exhanger Tube Alloys for Temperatures from 293 K to 573 K (20 °C to 300 °C). Metall. Mater. Trans. A 2014, 45, 663–681. [Google Scholar] [CrossRef]
- Hirsch, J. Aluminium in Innovative Light-Weight Car Design. Mater. Trans. 2011, 52, 818–824. [Google Scholar] [CrossRef]
- Fridlyander, N.; Sister, V.G.; Grushko, O.E.; Berstenev, V.V.; Sheveleva, L.M.; Ivanova, L.A. Aluminium alloys: Promising Materials in the Automotive Industry. Metal Sci. Heat Treat. 2002, 44, 365–370. [Google Scholar] [CrossRef]
- Kruse, H.; Suess, J. Research on the Behaviour of Refrigeration Compressors Using CO2 as the Refrigerant. Int. Compress. Eng. Conf. 1996, 111, 223–228. [Google Scholar]
- Paul, M.; Zhongjie, H. A review of carbon dioxide as a refrigerant in refrigeration technology. S. Afr. J. Sci. 2011, 111, 1–10. [Google Scholar]
- Skrzyniowski, A.; Skrzyniowska, D. Poszukiwania alternatywnego czynnika ziębniczego dla urządzeń klimatyzacyjnych w pojazdach samochodowych. J. KONES Powertrain Transp. 2015, 13, 165–175. [Google Scholar]
- Gaurav; Kumar, R. Sustainability of alternative material R-134a in mobile air-conditioning system: A review. Mater. Today Proc. 2017, 4, 112–118. [Google Scholar] [CrossRef]
- Rameez, U.D.; Borodo, K.; Morten, S.J.; Rajan, A. Accelerated growth of oxide film on aluminium alloys under steam: Part II: Effect of alloy chemistry and steam vapour pressure in corrosion and adhesion performance. Surf. Coat. Technol. 2015, 276, 106–115. [Google Scholar]
- Sukiman, N.L.; Zhou, X.; Birbilis, N.; Mol, J.M.; Garcia, S.J.; Zhou, X.; Thompson, G.E. Durability and corrosion of aluminium and its alloys: Overview, property space, techniques and developments. In Aluminium Alloys—New Trends in Fabrication and Applications; Ahmad, Z., Ed.; InTech: Rijeka, Croatia, 2013; pp. 47–97. ISBN 978-953-51-0861-0. [Google Scholar]
- Andersen, S.J.; Marioara, C.D.; Frøseth, A.; Vissers, R.; Zandbergen, H.W. Crystal structure of the orthorhombic U2-Al4Mg4Si4 precipitate in the Al-Mg-Si alloy system and its relation to the β’ and β” phases. Mater. Sci. Eng. A 2005, 390, 127–138. [Google Scholar] [CrossRef]
- Edwards, G.A.; Stiller, K.; Dunlop, G.L.; Couper, M.J. The precipitation sequence in Al-Mg-Si alloys. Acta Mater. 1998, 46, 3893–3904. [Google Scholar] [CrossRef]
- Frøseth, A.G.; Høier, R.; Derlet, P.M.; Andersen, S.J.; Marioara, C.D. Bonding in MgSi and Al-Mg-Si compounds relevant to Al-Mg-Si alloys. Phys. Rev. B 2003, 67, 1–11. [Google Scholar] [CrossRef]
- Matsuda, K.; Sakaguch, Y.; Miyata, Y.; Uetani, Y.; Sato, T.; Kamio, A.; Ikeno, S. Precipitation sequence of various kinds of metastable phases in Al-1.0 mass% Mg2Si-0.4 mass% Si alloy. J. Mater. Sci. 2000, 35, 179–189. [Google Scholar] [CrossRef]
- Murayama, M.; Hono, K. Pre-precipitate clusters and precipitation processes in Al-Mg-Si alloys. Acta Mater. 1999, 47, 1537–1548. [Google Scholar] [CrossRef]
- Zandbergen, H.W.; Andersen, S.J.; Jansen, J. Structure Determination of Mg5Si6 Particles in Al by Dynamic Electron Diffraction Studies. Science 1997, 277, 1221–1225. [Google Scholar] [CrossRef]
- Marioara, C.D.; Andersen, S.J.; Zandbergen, H.W.; Holmestad, R. The Influence of Alloy Composition on Precipitates of the Al-Mg-Si System. Metall. Mater. Trans. A 2005, 36, 691–702. [Google Scholar]
- Marioara, C.D.; Andersen, S.J.; Jansen, J.; Zandbergen, H.W. The influence of temperature and storage time at RT on nucleation of the β” phase in a 6082 Al-Mg-Si alloy. Acta Mater. 2003, 51, 789–796. [Google Scholar] [CrossRef]
- Wang, B.; Zhang, L.; Su, Y.; Xiao, Y.; Liu, J. Corrosion Behavior of 5A05 Aluminium Alloy in NaCl Solution. Acta Metall. Sin. 2013, 26, 581–587. [Google Scholar] [CrossRef]
- Alavi, A.; Corns, R.A. The Determination of pH, Potential and chloride concentration in corroding crevies on 304 stainless steel and 7475 aluminium alloy. Corros. Sci. 1987, 27, 443–451. [Google Scholar] [CrossRef]
- Aballe, A.; Bethencourt, M.; Botana, F.J.; Cano, M.J.; Marcos, M. Localized alkaline corrosion of alloy AA5083 in neutral 3.5% NaCl solution. Corros. Sci. 2001, 43, 1657–1674. [Google Scholar] [CrossRef]
- Gudić, S.; Smoljko, I.; Kliškić, M. The effect of small addition of tin and indium on the corrosion behavior of aluminium in chloride solution. J. Alloys Compd. 2010, 505, 54–63. [Google Scholar] [CrossRef]
- Li, T.; Li, X.G.; Dong, C.F.; Cheng, Y.F. Characterization of Atmospheric Corrosion of 2A12 Aluminum Alloy in Tropical Marine Environment. J. Mater. Eng. Perform. 2010, 19, 591–598. [Google Scholar] [CrossRef]
Figure 1.
Microstructure and chemical analysis of AA 3103 alloy: (a) Light microscopy; (b) Scanning Electron Microscope (SEM).
Figure 1.
Microstructure and chemical analysis of AA 3103 alloy: (a) Light microscopy; (b) Scanning Electron Microscope (SEM).

Figure 2.
Microstructure and chemical analysis of precipitates in AA3103 alloy; transmission electron microscopy (TEM).
Figure 2.
Microstructure and chemical analysis of precipitates in AA3103 alloy; transmission electron microscopy (TEM).
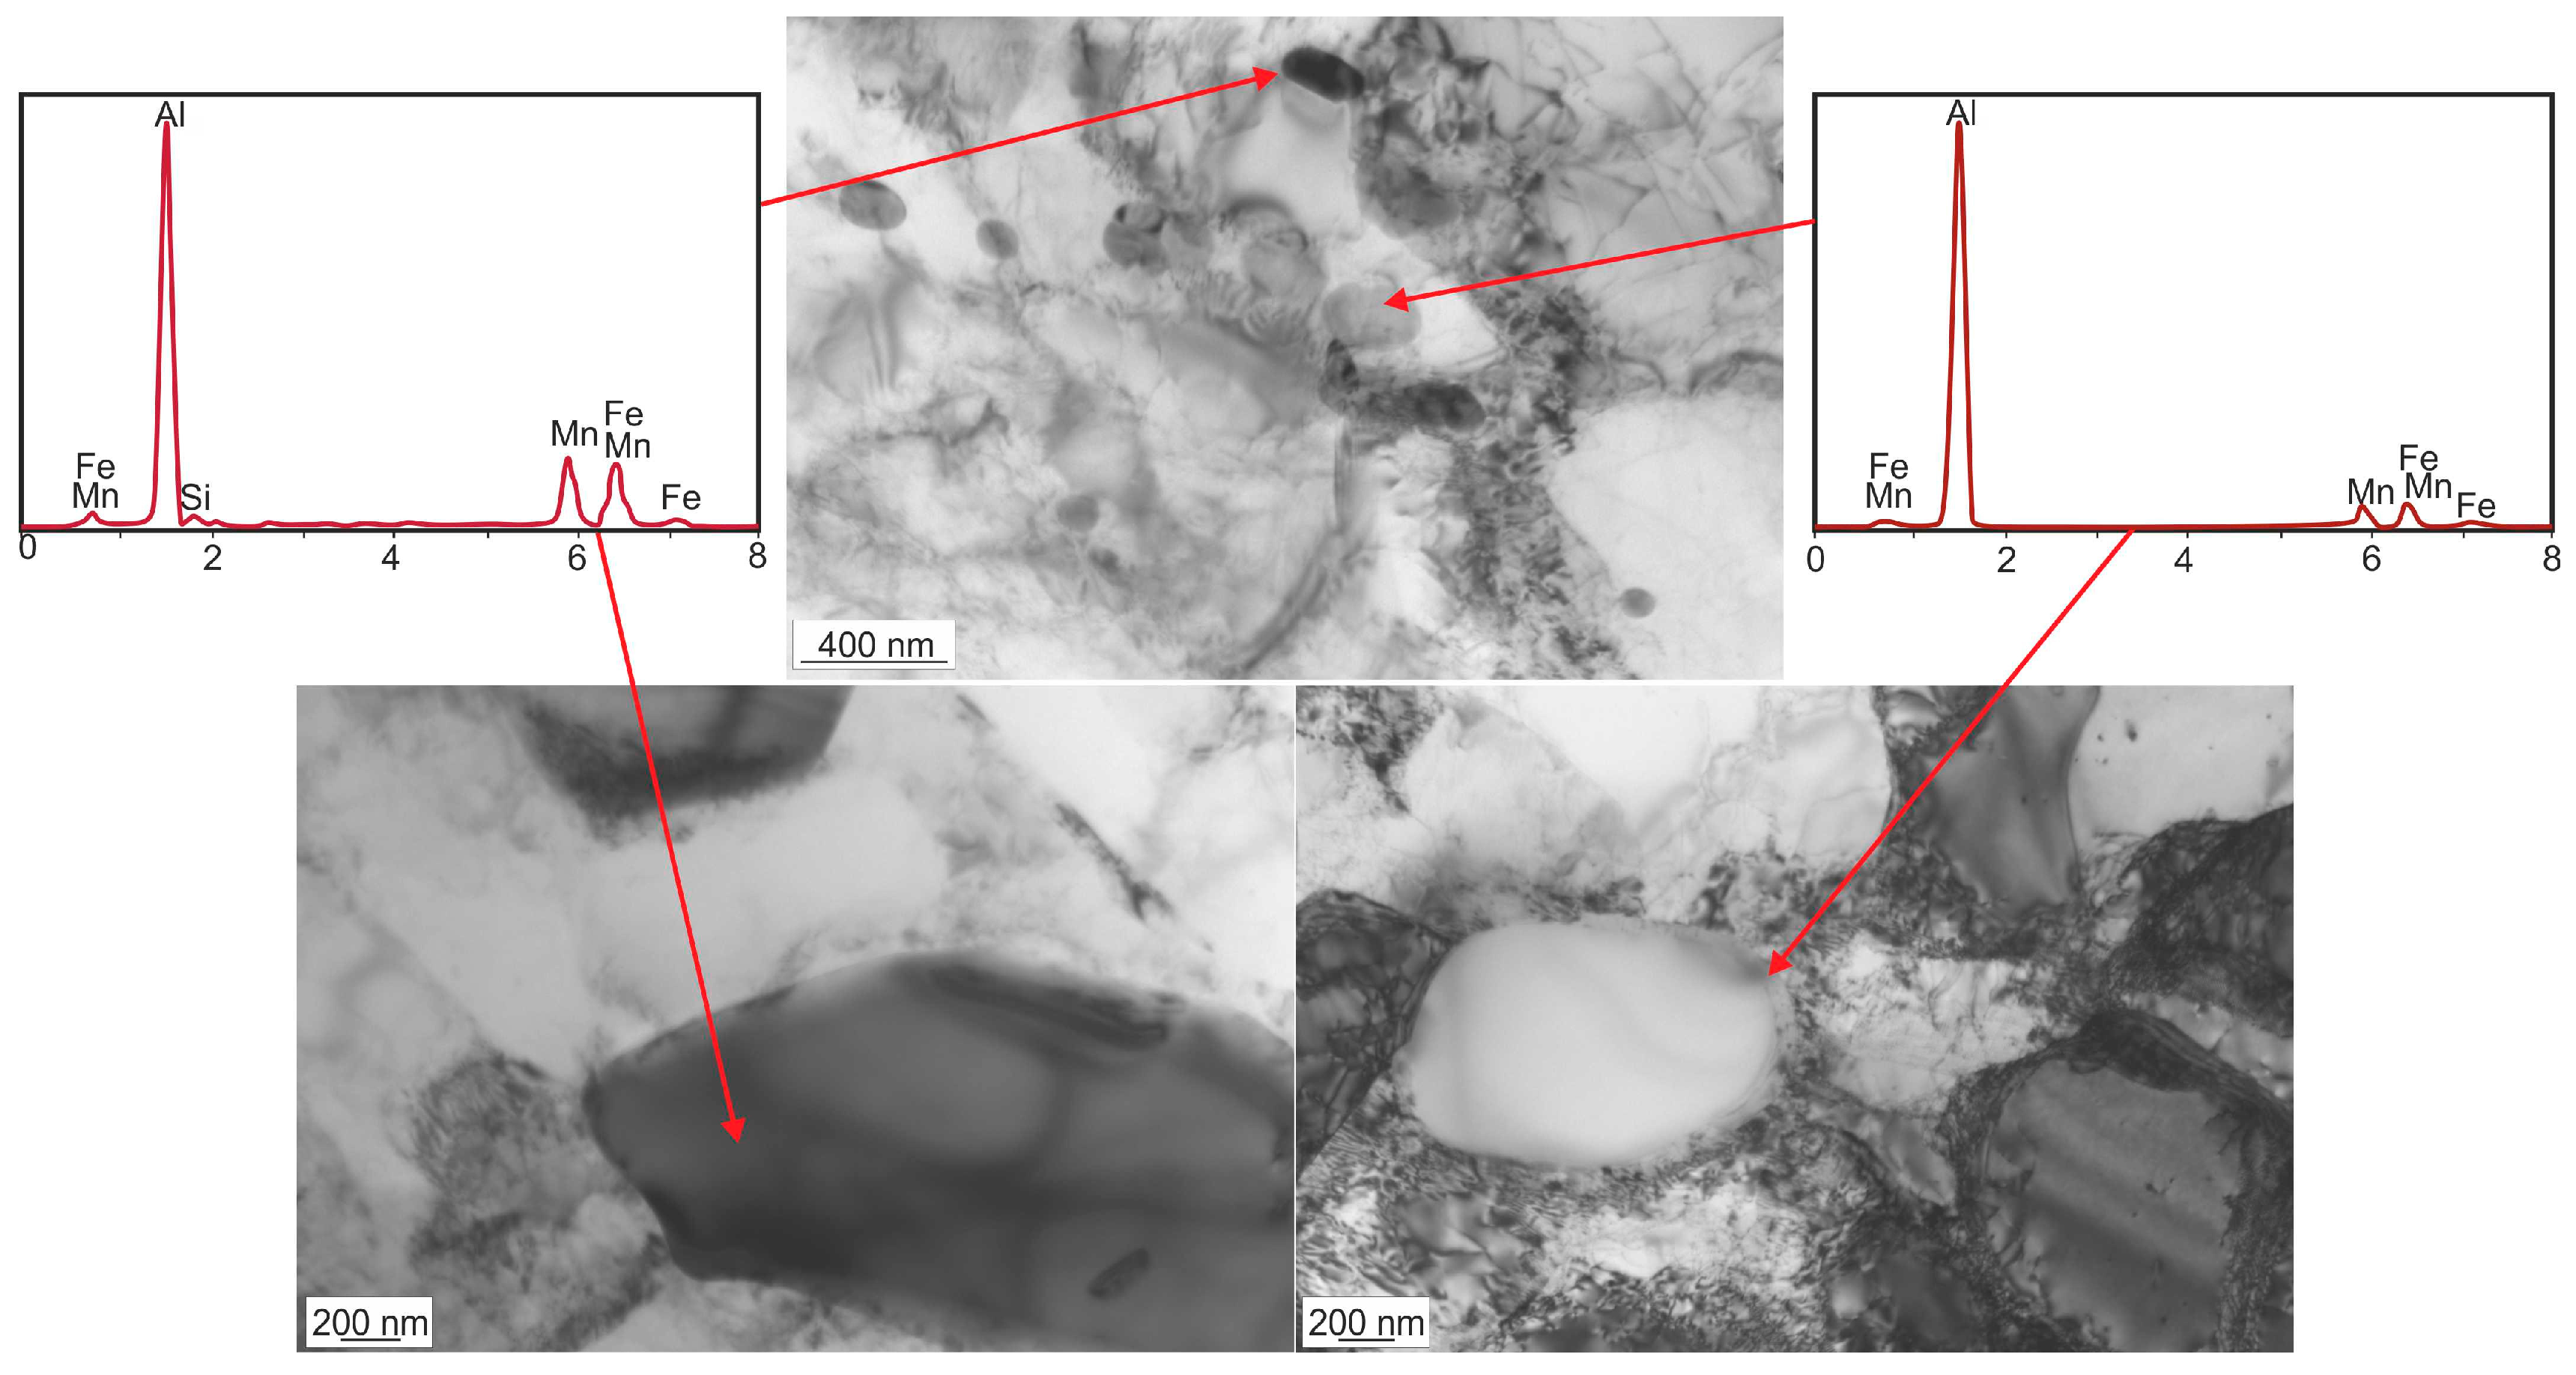
Figure 3.
Microstructure and chemical analysis of AA 5049 alloy: (a) Light microscopy; (b) SEM.

Figure 4.
Microstructure and chemical analysis of precipitates in AA5049 alloy; TEM.
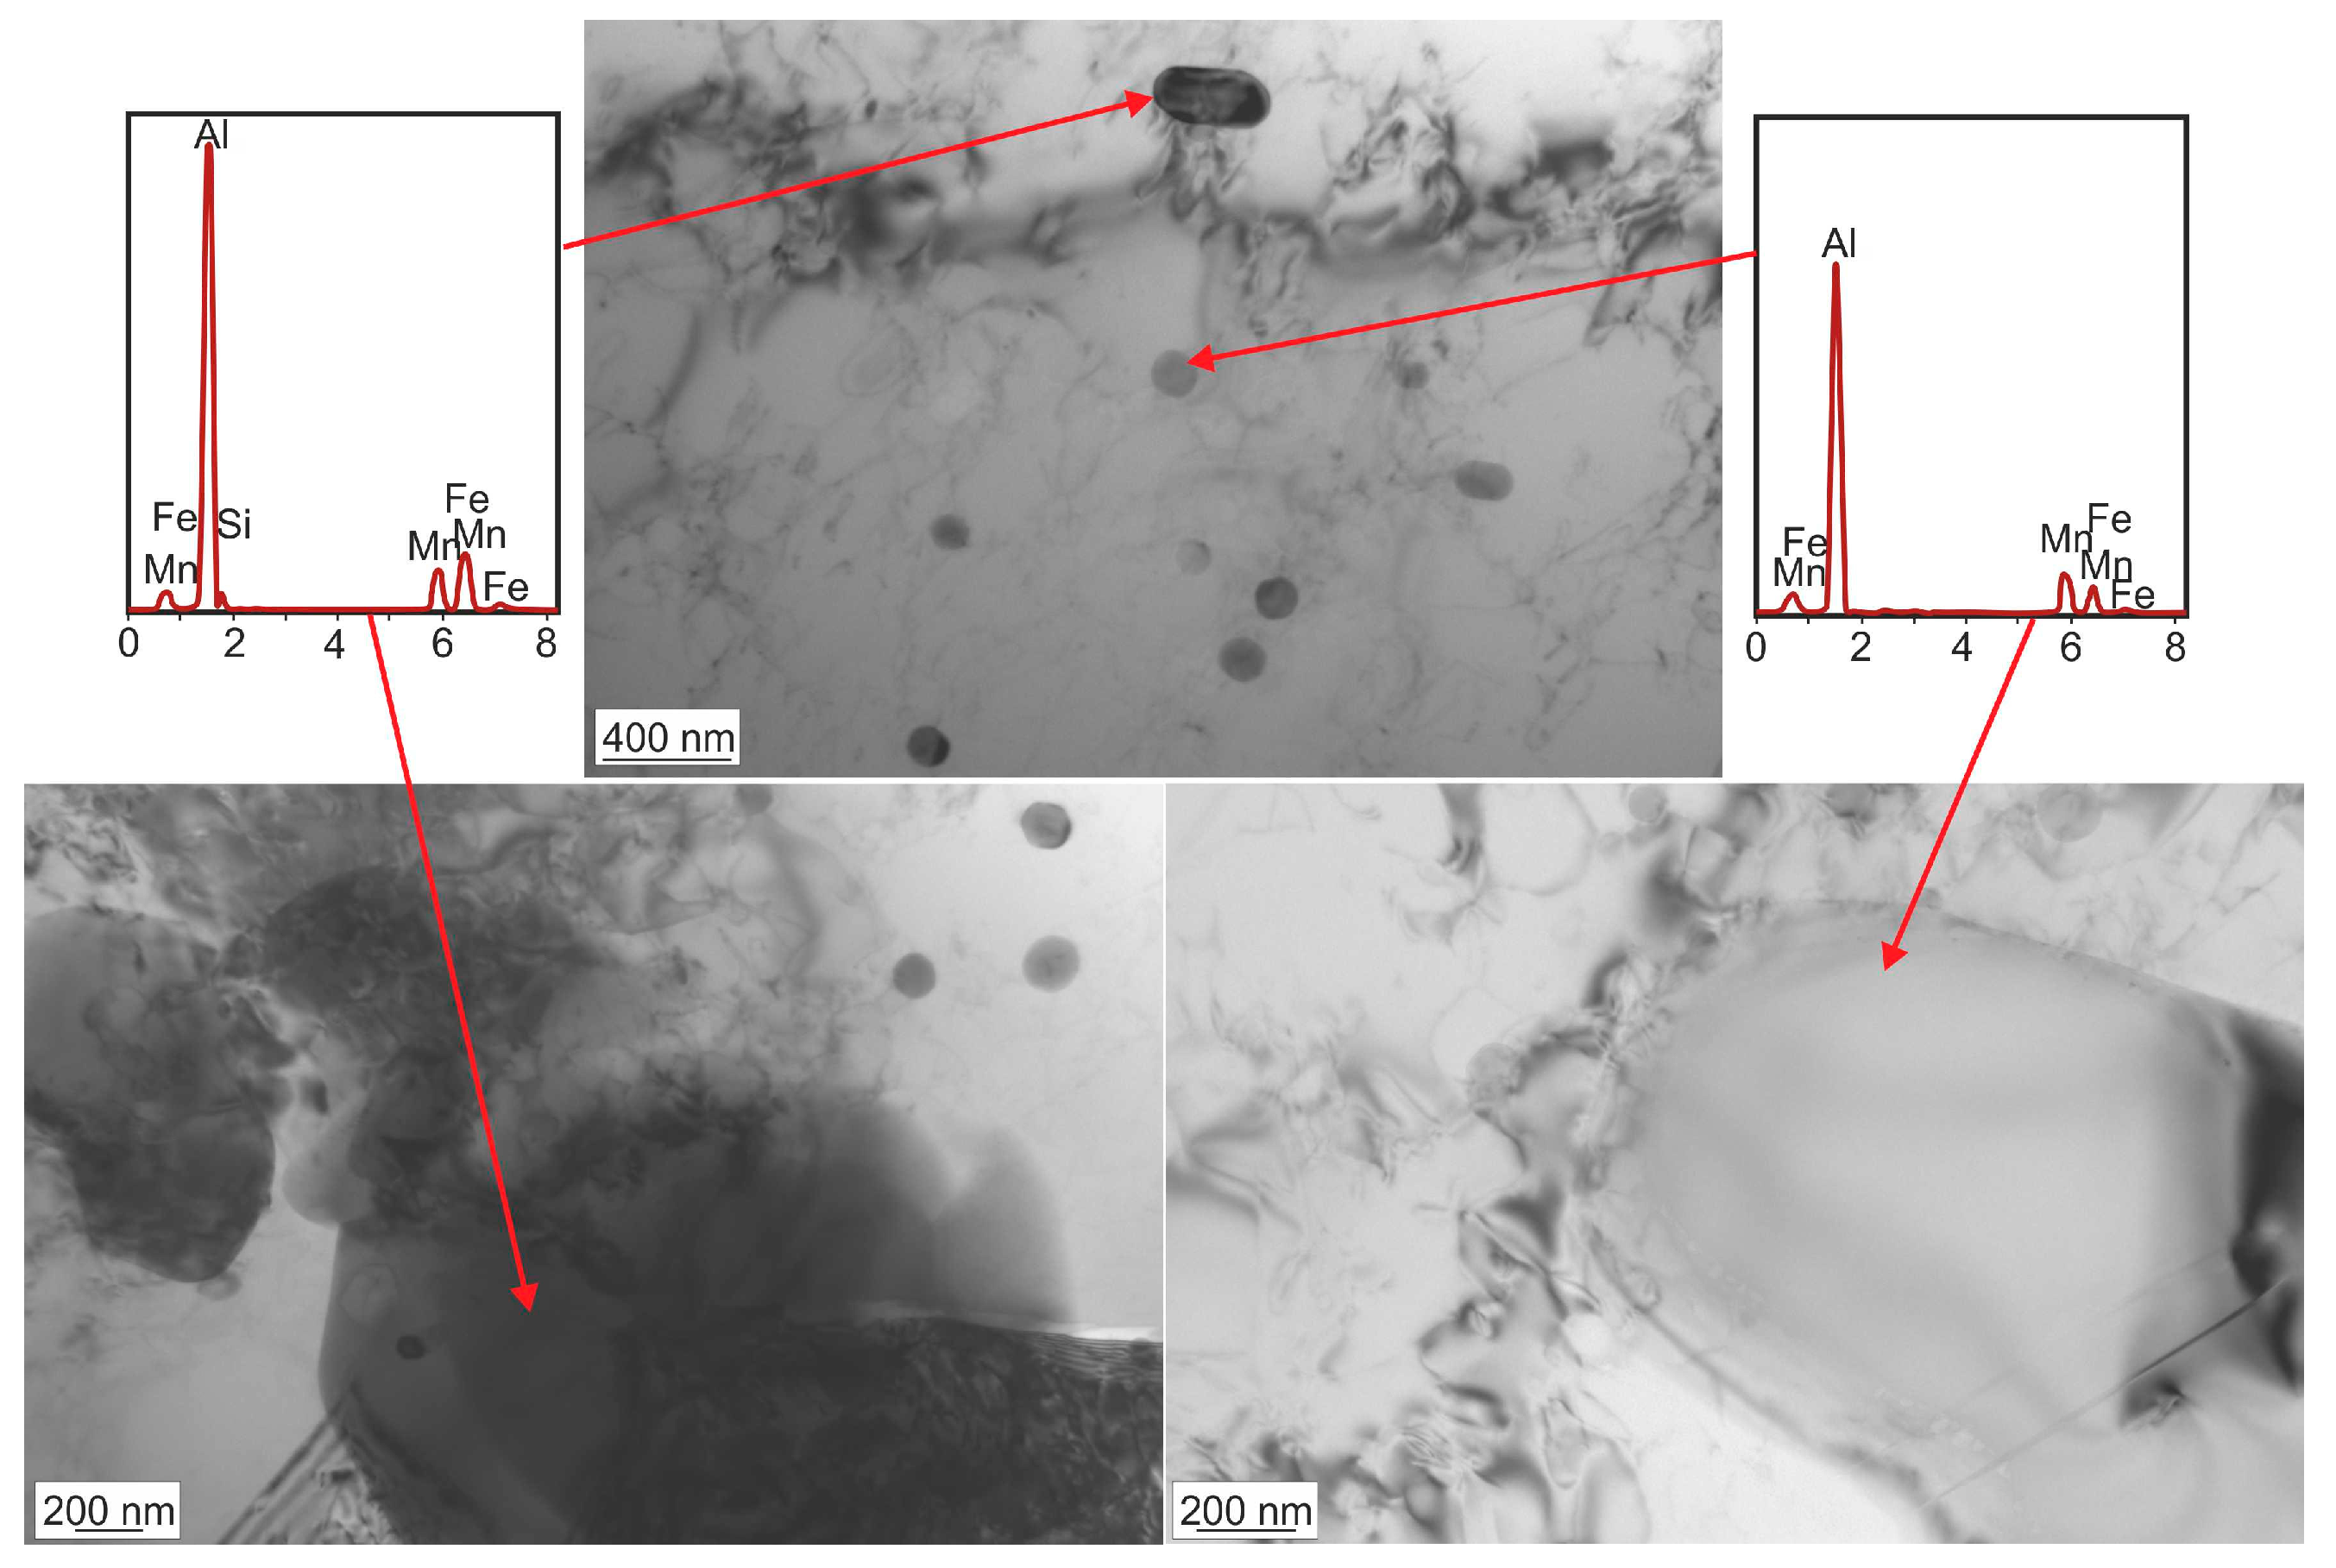
Figure 5.
Microstructure and chemical analysis of AA6060 alloy: (a) Light microscopy; (b) SEM.

Figure 6.
X-ray diffraction analysis of AA3103 alloy.

Figure 7.
X-ray diffraction analysis of AA5049 alloy.
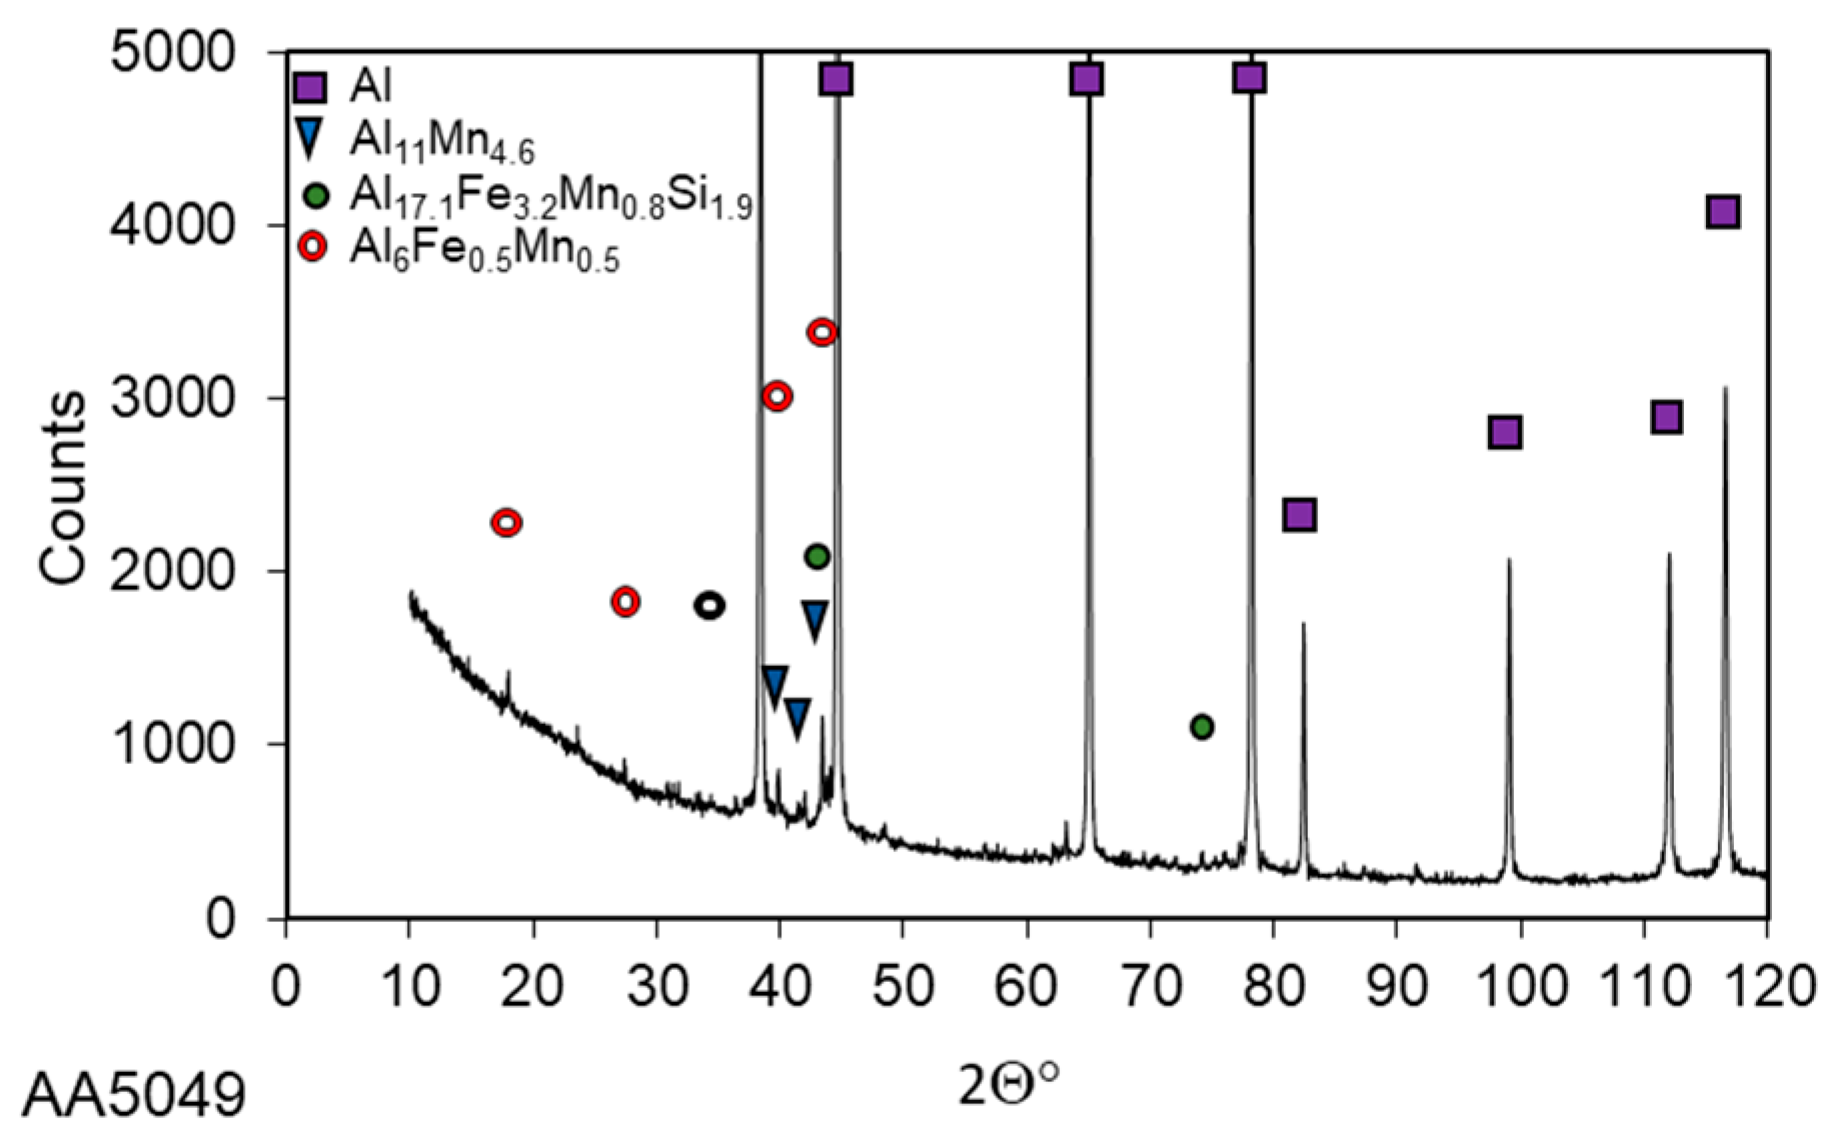
Figure 8.
X-ray diffraction analysis of AA6060 and AA6063 alloys.
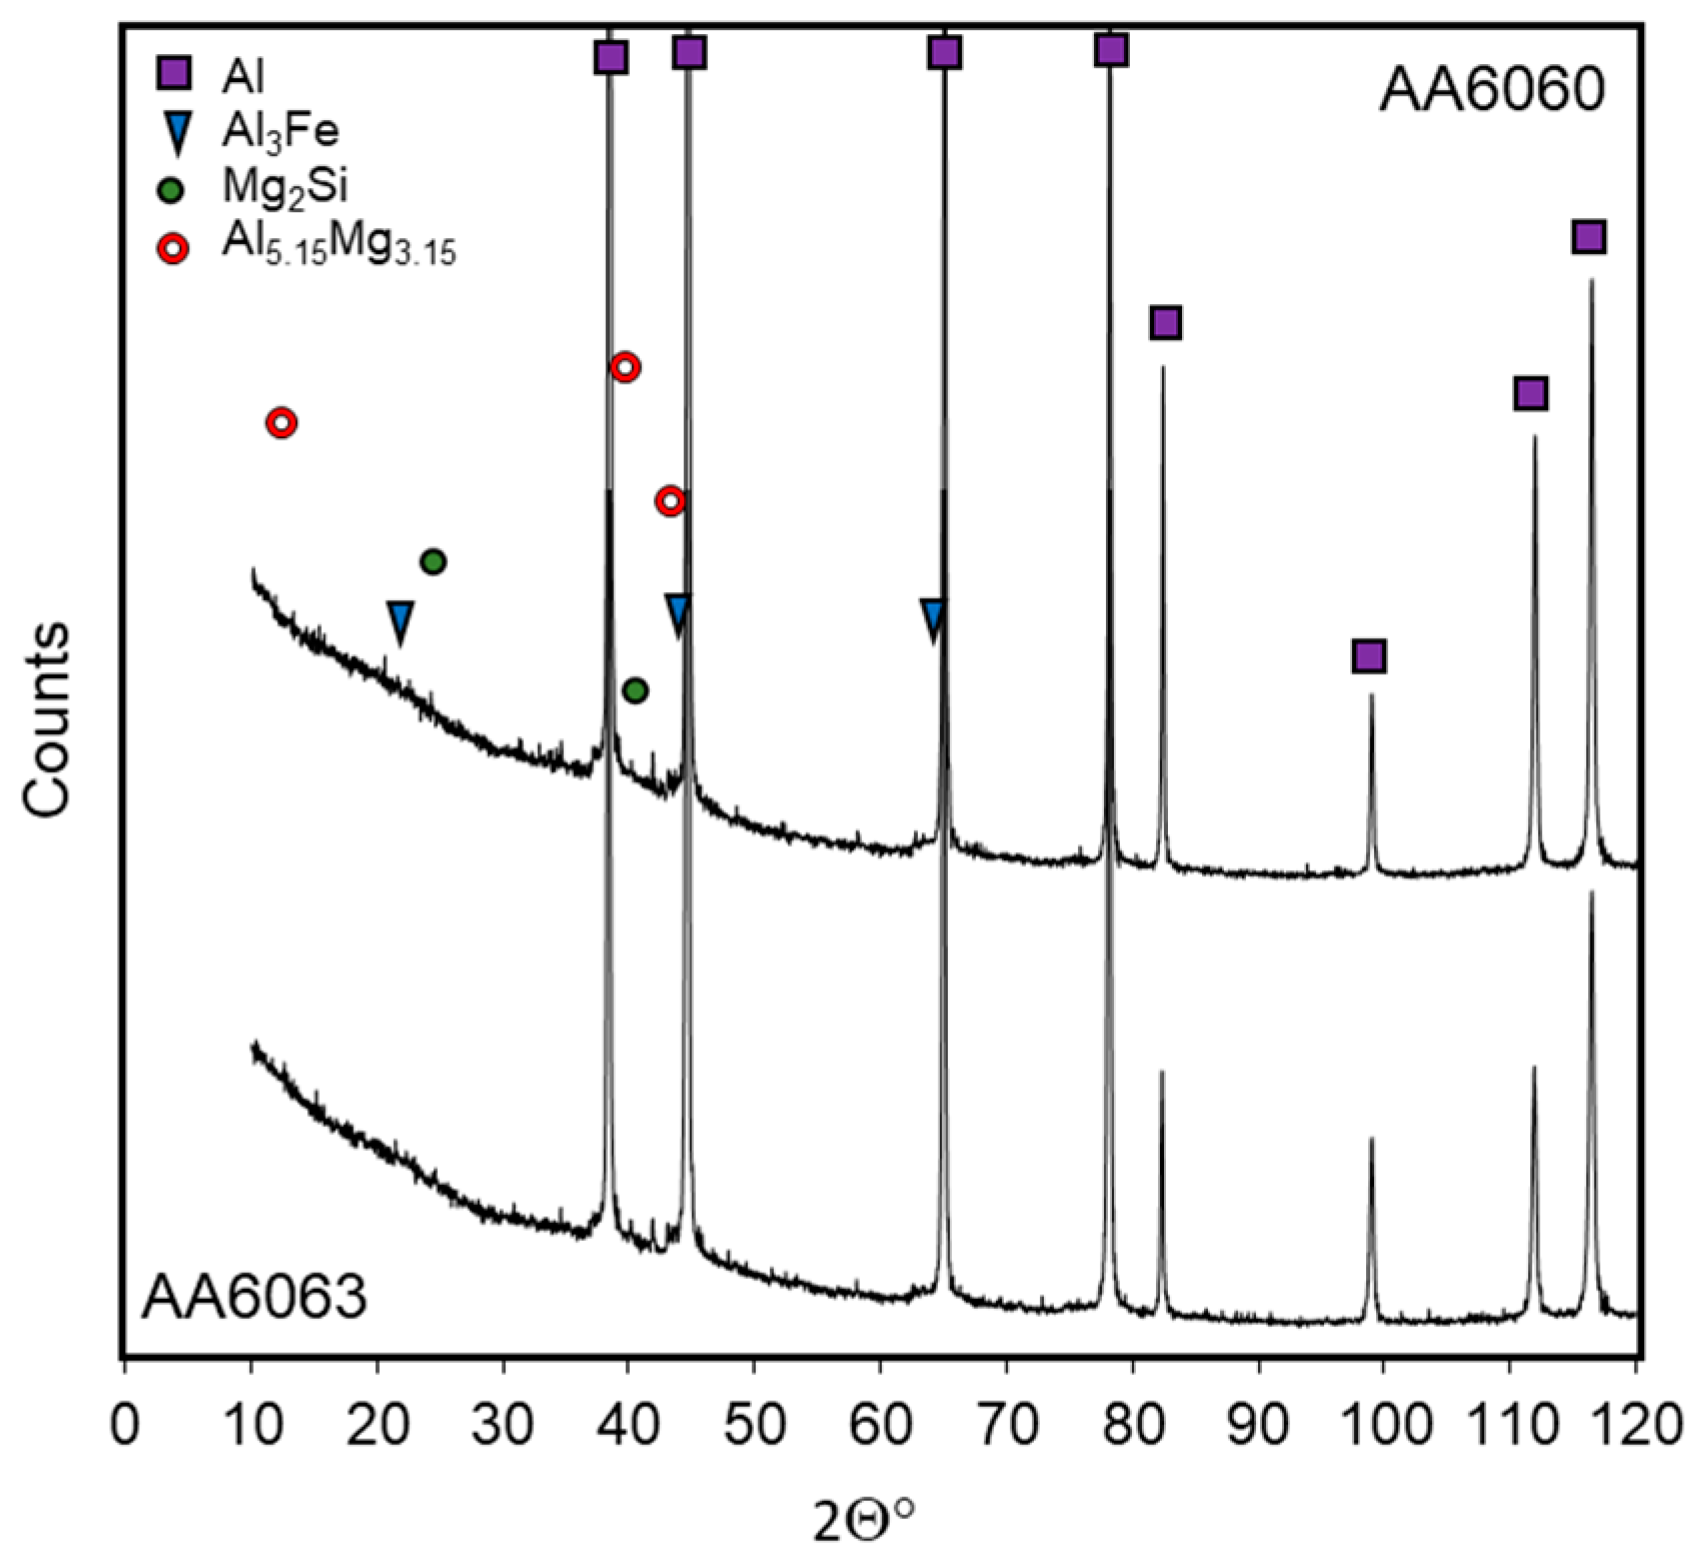
Figure 9.
Microhardness of the investigated alloys after annealing in the temperature range of −25 °C–220 °C for 72 h and 240 h followed by water cooling: (a) AA3103 alloy; (b) AA5049 alloy; (c) AA6060 alloy; (d) AA6063 alloy.
Figure 9.
Microhardness of the investigated alloys after annealing in the temperature range of −25 °C–220 °C for 72 h and 240 h followed by water cooling: (a) AA3103 alloy; (b) AA5049 alloy; (c) AA6060 alloy; (d) AA6063 alloy.
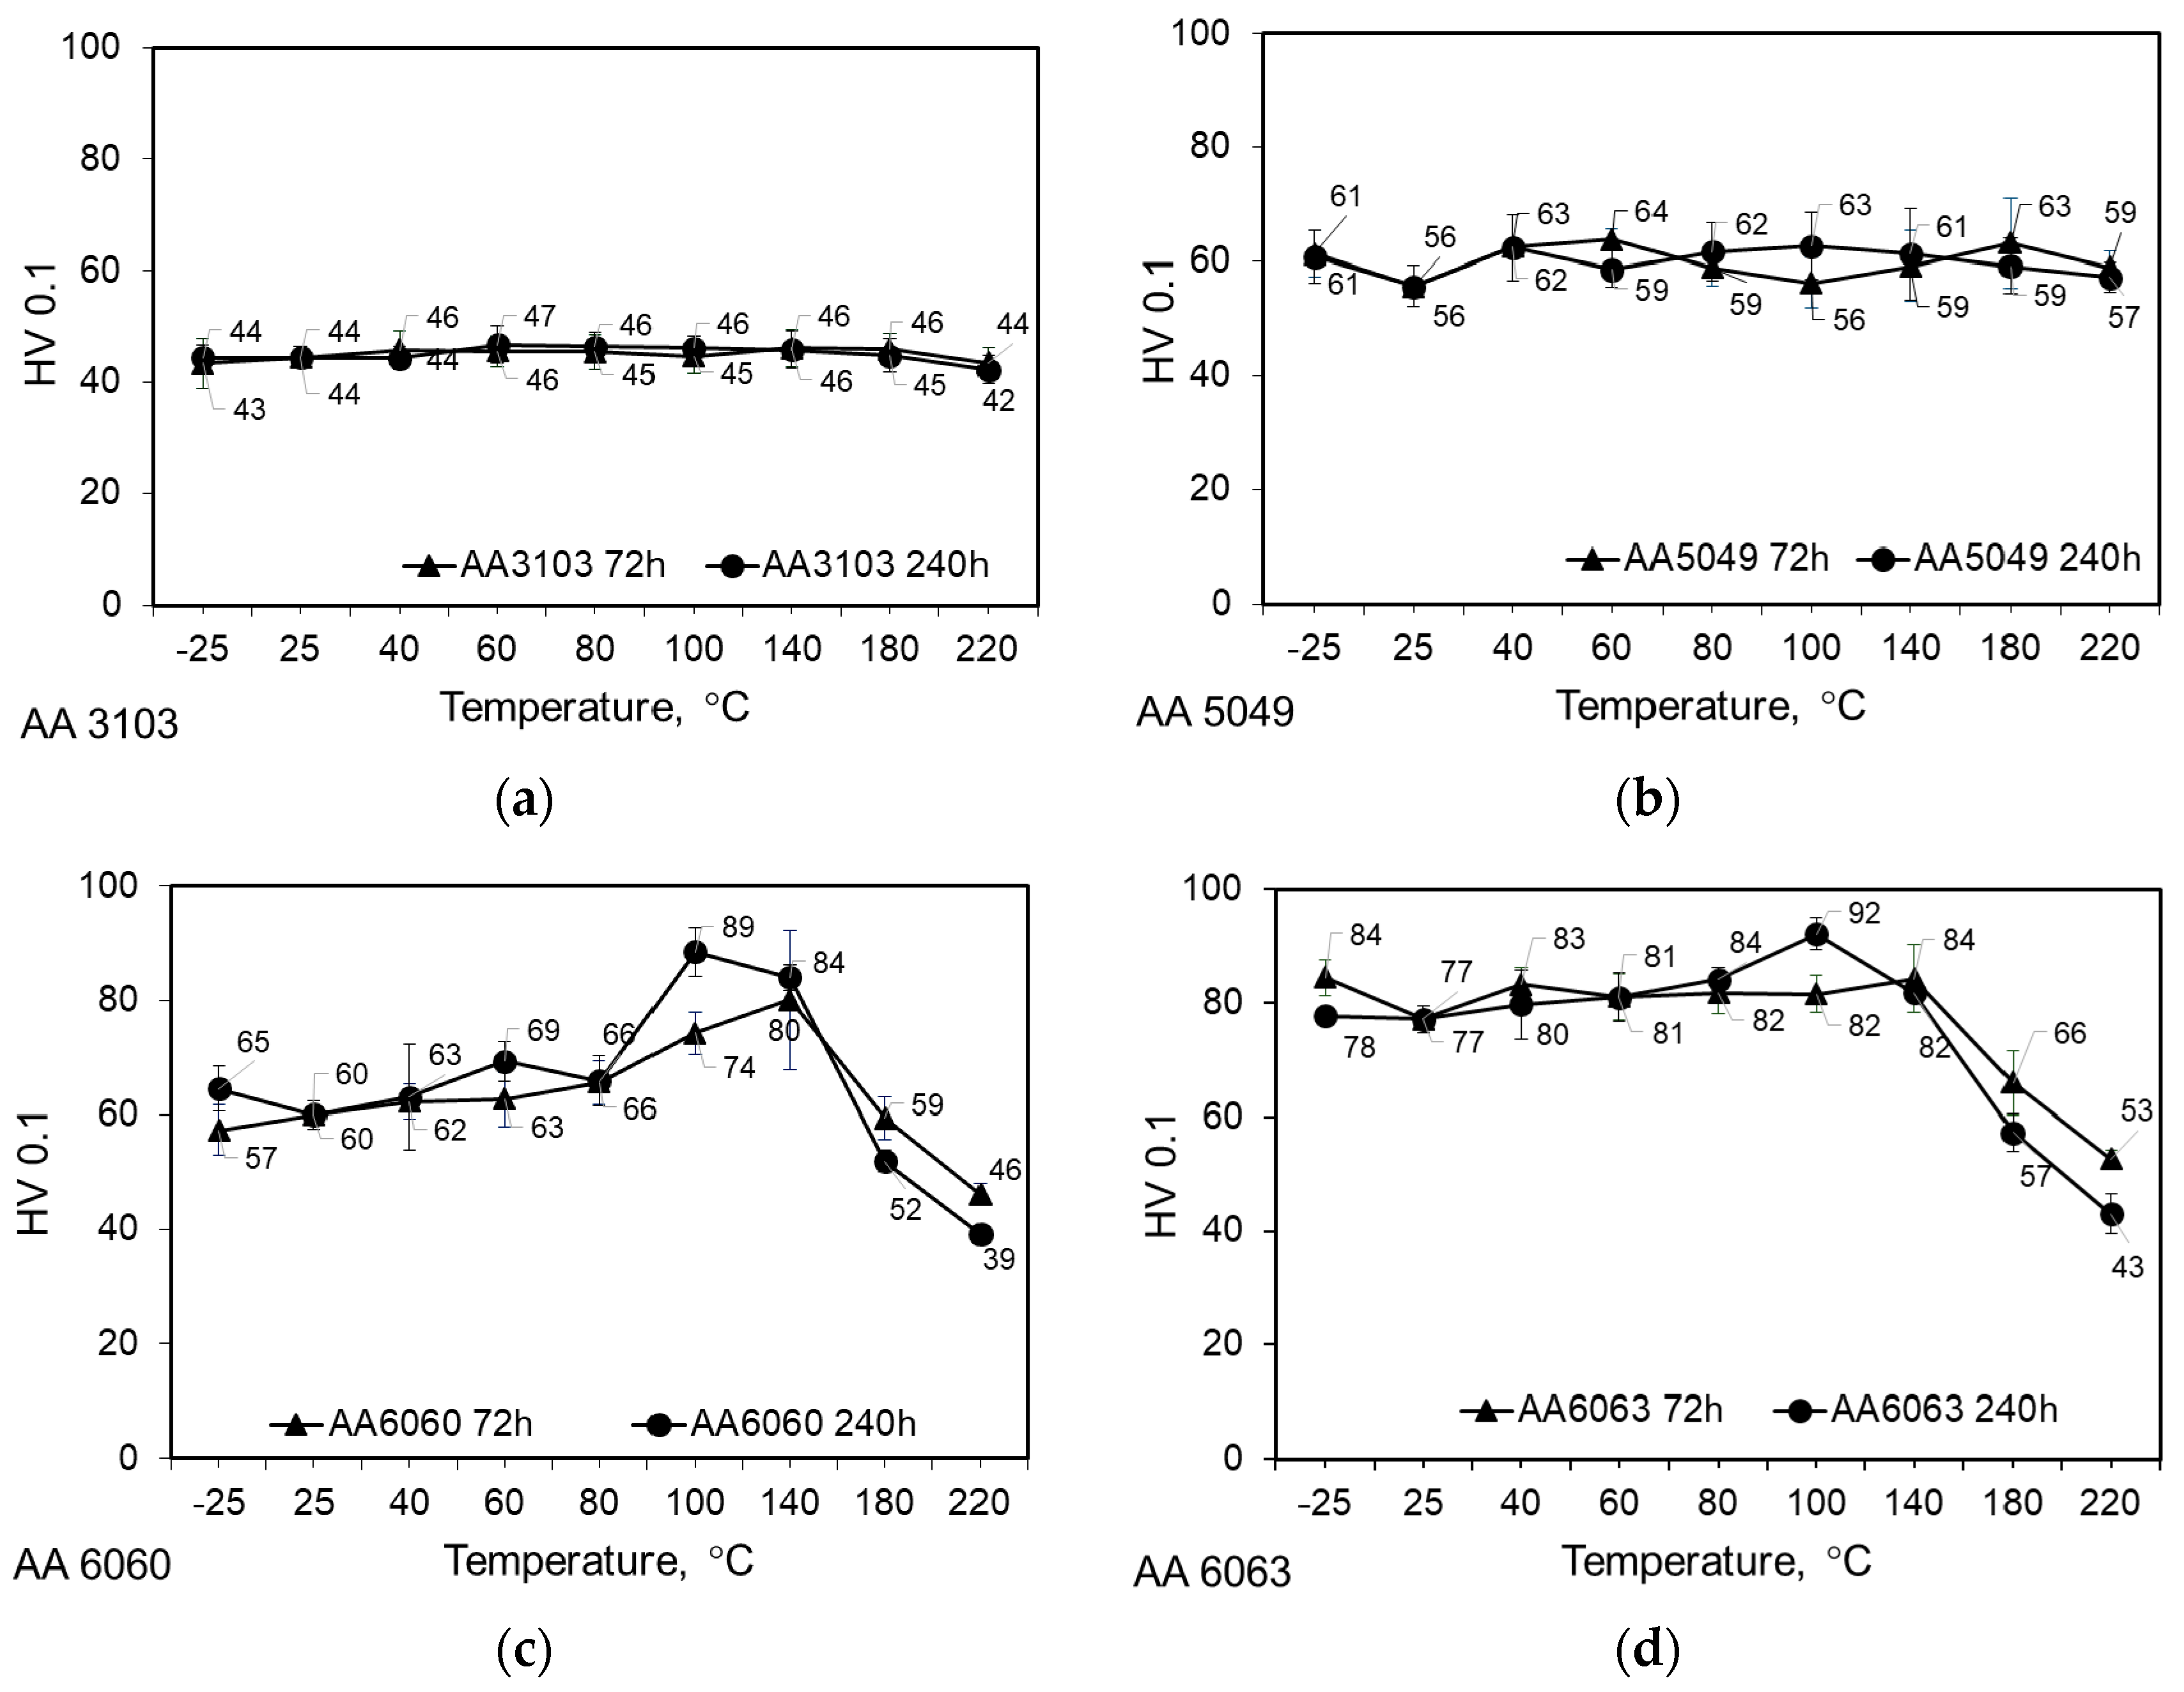
Figure 10.
Microstructure of AA6060 alloy in the initial state and after annealing at 140 °C and 220 °C; TEM.
Figure 10.
Microstructure of AA6060 alloy in the initial state and after annealing at 140 °C and 220 °C; TEM.

Figure 11.
Microstructure of AA6063 alloy in the initial state and after annealing at 140 °C and 220 °C; TEM.
Figure 11.
Microstructure of AA6063 alloy in the initial state and after annealing at 140 °C and 220 °C; TEM.

Figure 12.
Surface of the AA3103 alloy tube: (a) before corrosion test; SEM; (b) after corrosion test; SEM; (c) after corrosion test; confocal microscope.
Figure 12.
Surface of the AA3103 alloy tube: (a) before corrosion test; SEM; (b) after corrosion test; SEM; (c) after corrosion test; confocal microscope.
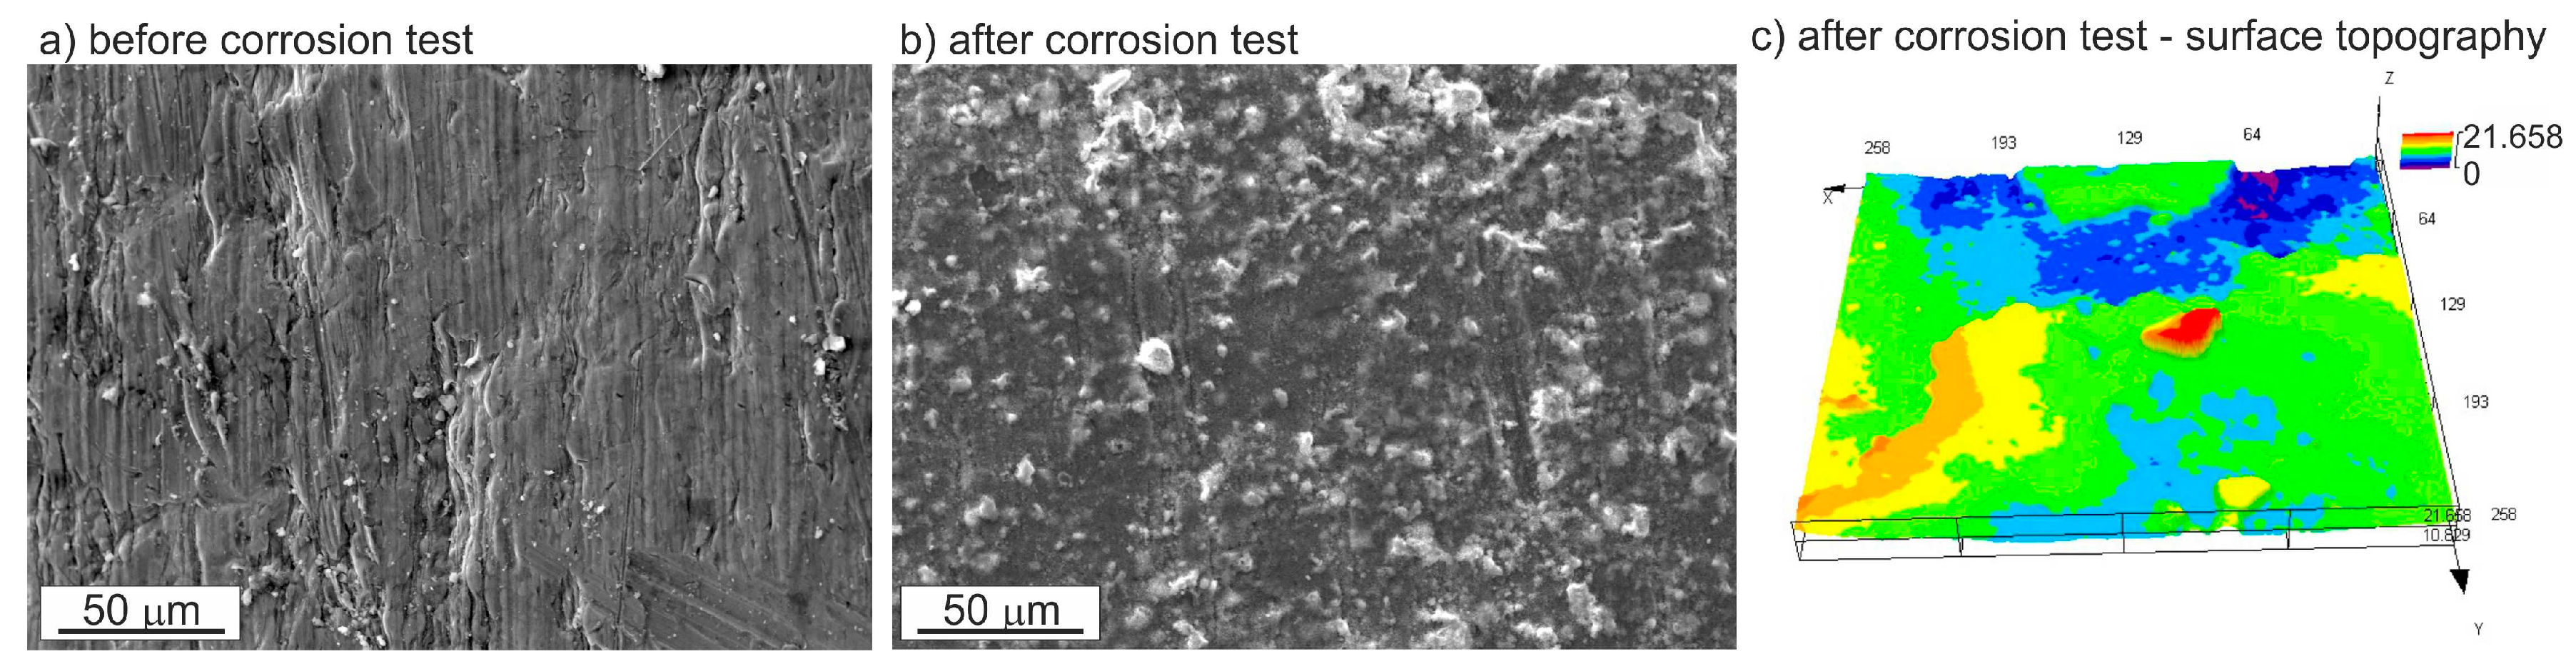
Figure 13.
Surface of the AA5049 alloy tube: (a) before corrosion test; SEM; (b) after corrosion test; SEM; (c) after corrosion test; confocal microscope.
Figure 13.
Surface of the AA5049 alloy tube: (a) before corrosion test; SEM; (b) after corrosion test; SEM; (c) after corrosion test; confocal microscope.

Figure 14.
Surface of the AA6060 alloy tube: (a) before corrosion test; SEM; (b) after corrosion test; SEM; (c) after corrosion test; confocal microscope.
Figure 14.
Surface of the AA6060 alloy tube: (a) before corrosion test; SEM; (b) after corrosion test; SEM; (c) after corrosion test; confocal microscope.
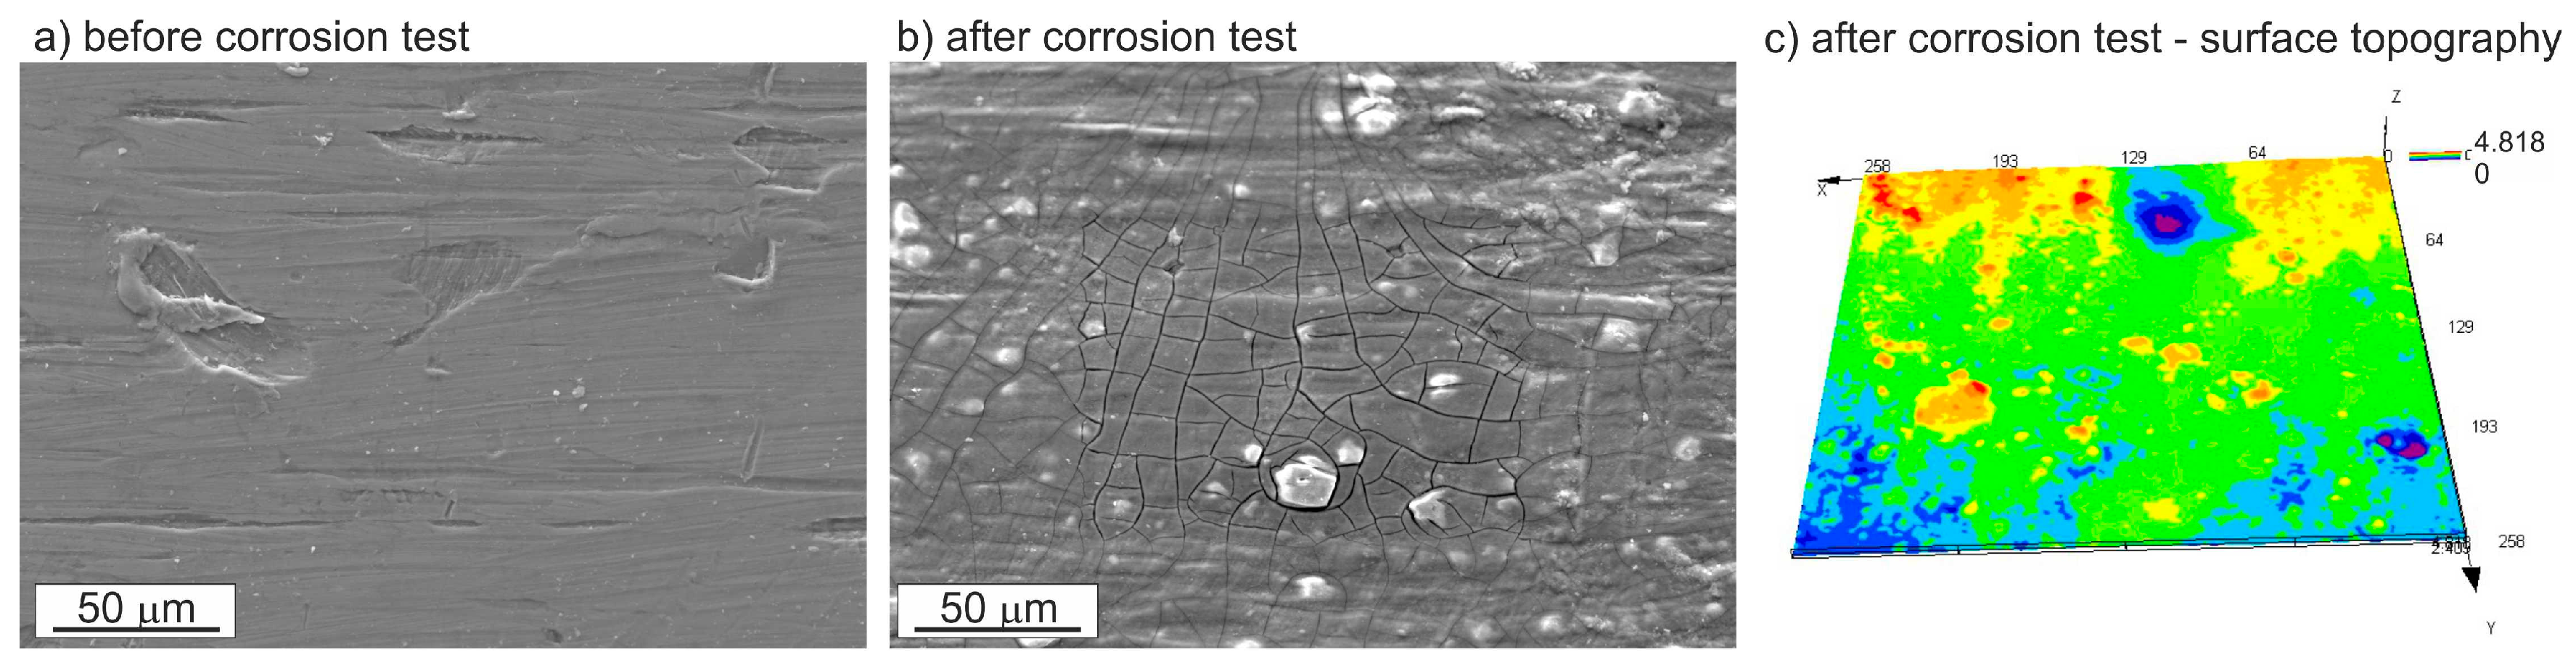
Figure 15.
Surface of the AA6063 alloy tube: (a) before corrosion test; SEM; (b) after corrosion test; SEM; (c) after corrosion test; confocal microscope.
Figure 15.
Surface of the AA6063 alloy tube: (a) before corrosion test; SEM; (b) after corrosion test; SEM; (c) after corrosion test; confocal microscope.

Figure 16.
Microstructure and maps of the Al, O, Na, Cl, Fe, Si, and Mg distribution on the surface of tube made from the AA6063 alloy after corrosion test; SEM.
Figure 16.
Microstructure and maps of the Al, O, Na, Cl, Fe, Si, and Mg distribution on the surface of tube made from the AA6063 alloy after corrosion test; SEM.
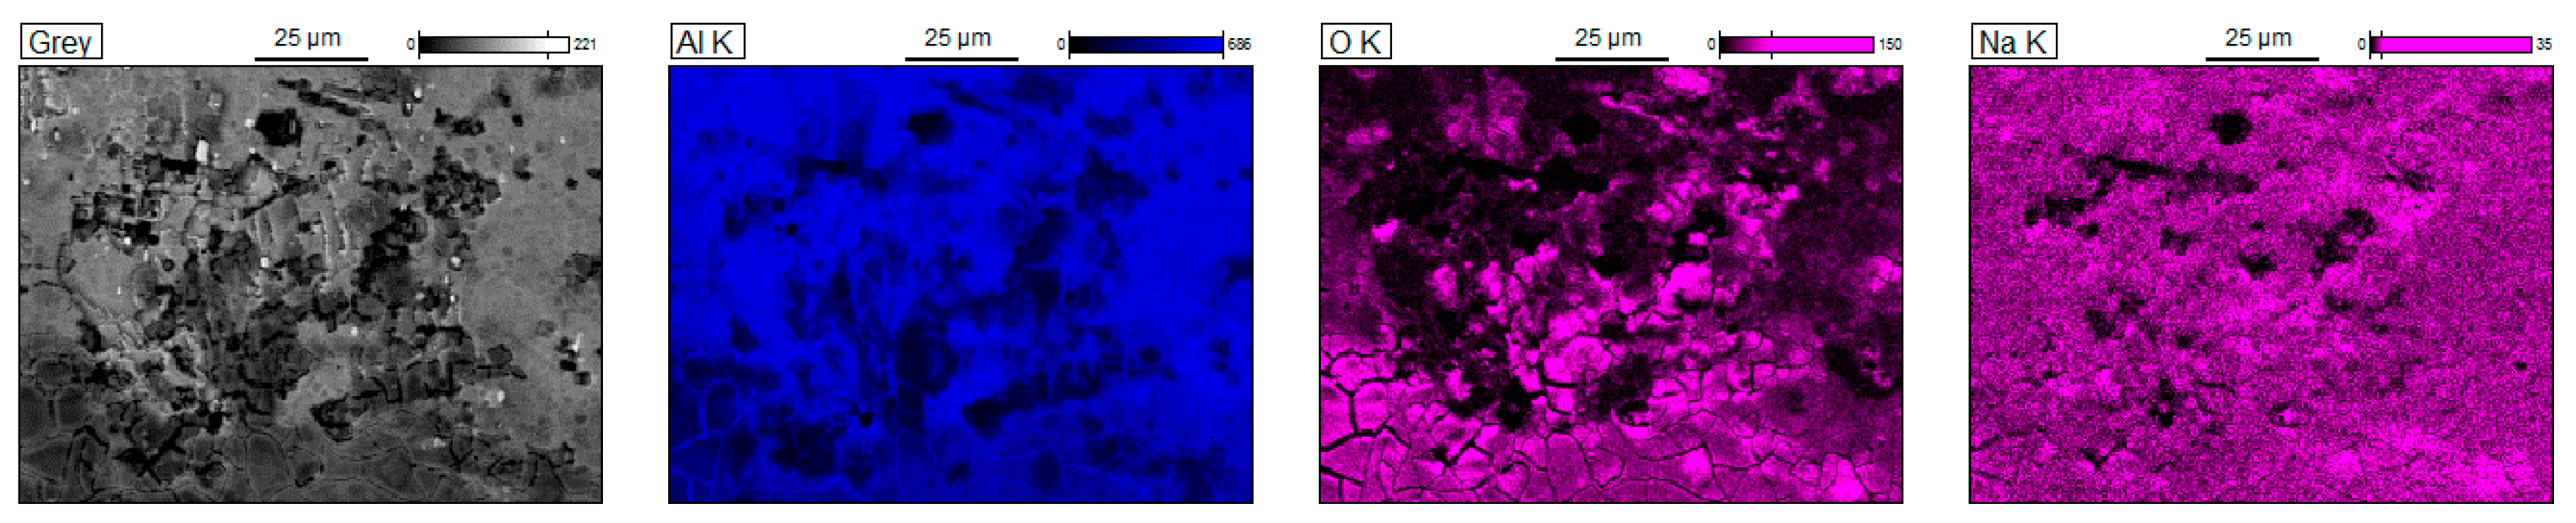

Figure 17.
Average thickness of corrosion scale.

Figure 18.
Cross sections of tubes after the corrosion test in a salt spray chamber; (a) AA3103 alloy; (b) 5049 alloy; (c) AA6060 alloy; (d) AA6063 alloy.
Figure 18.
Cross sections of tubes after the corrosion test in a salt spray chamber; (a) AA3103 alloy; (b) 5049 alloy; (c) AA6060 alloy; (d) AA6063 alloy.
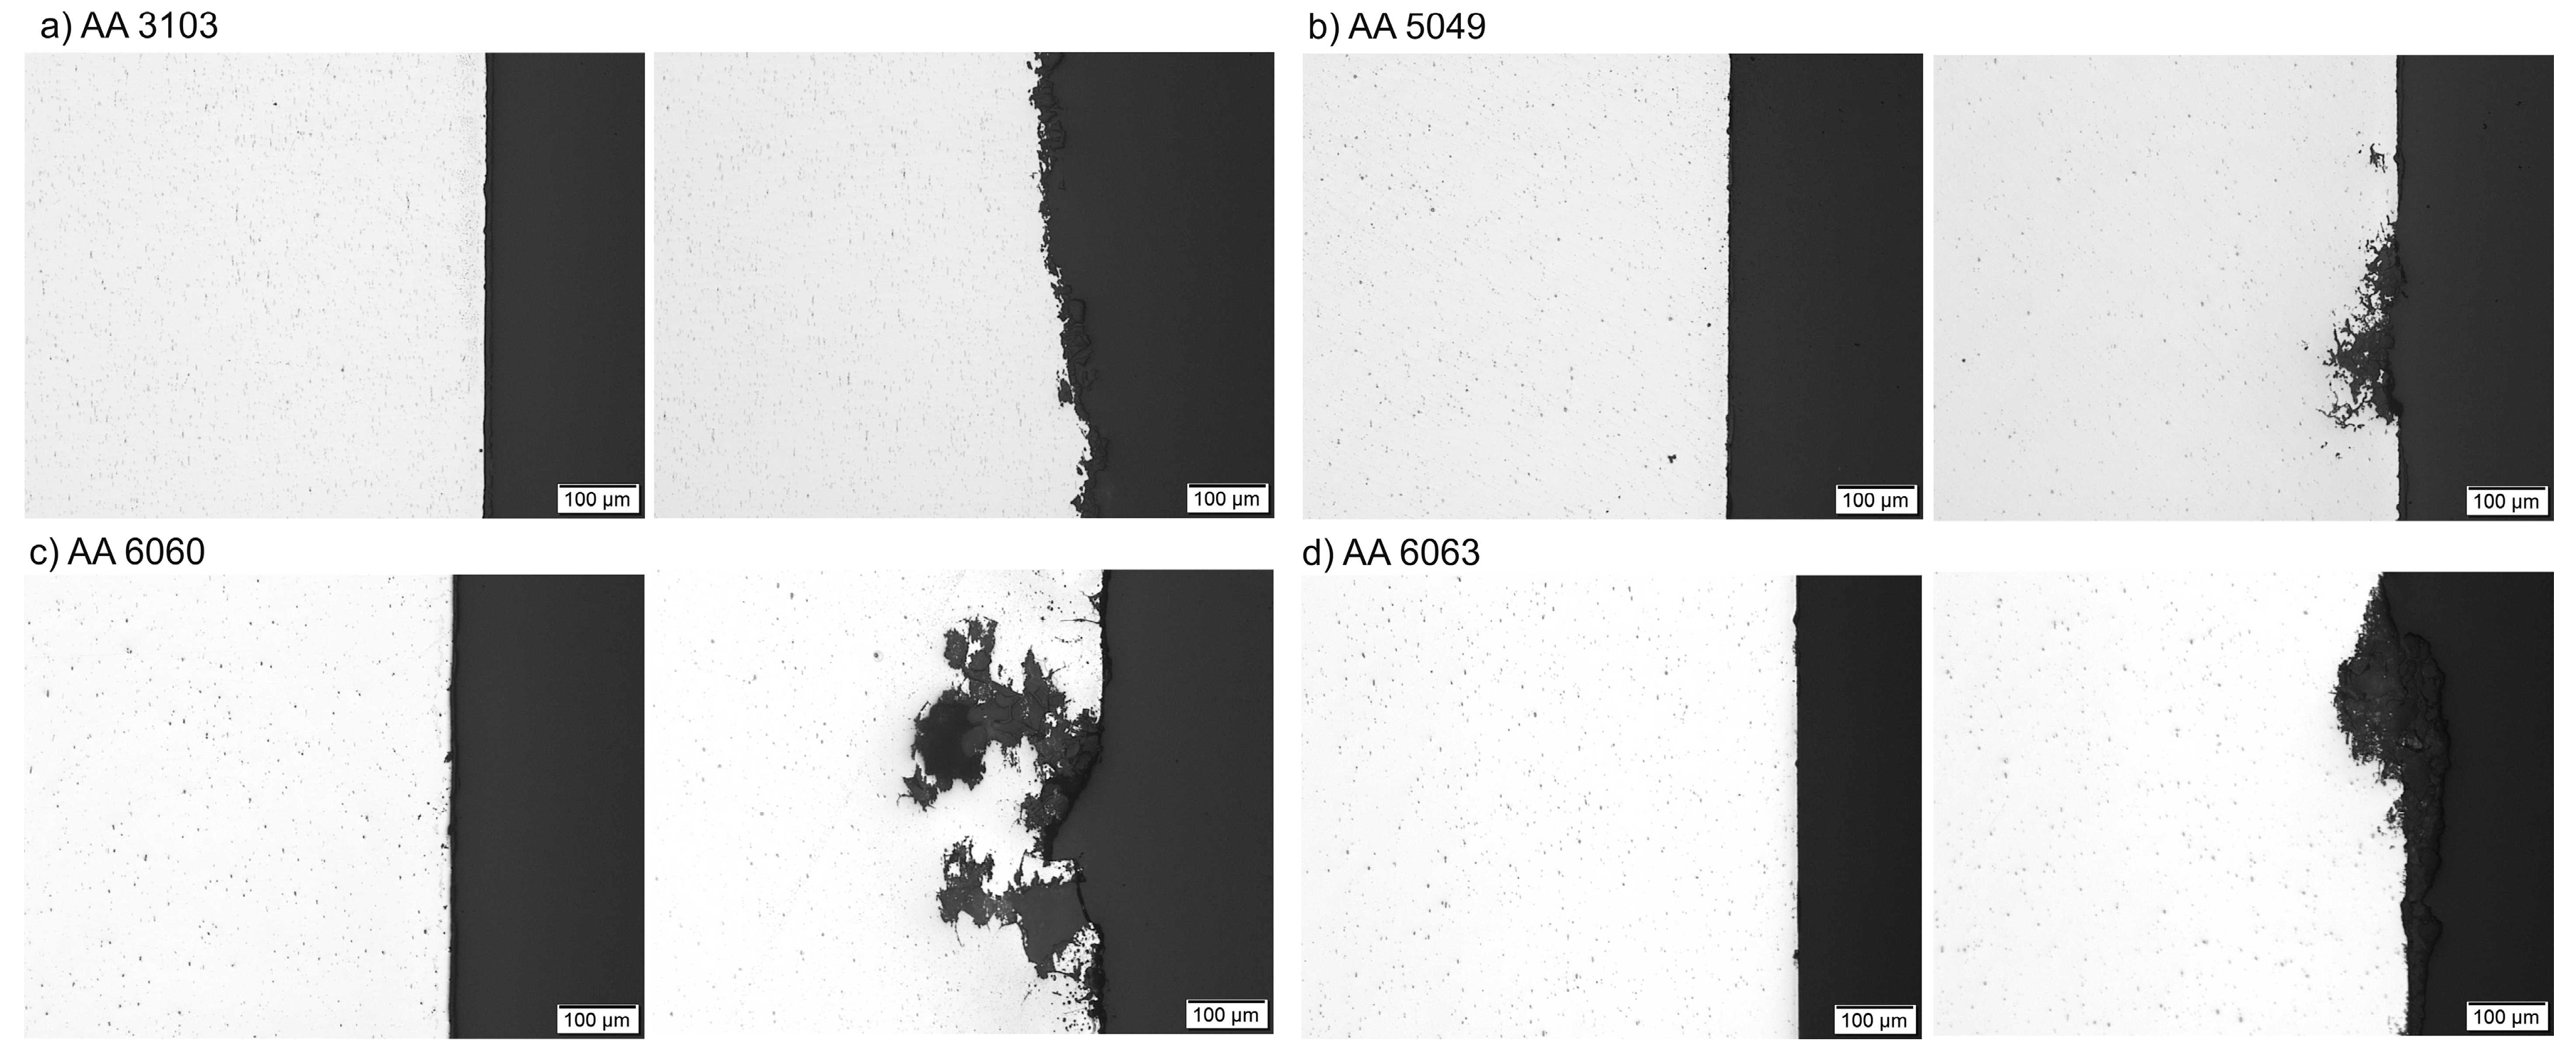
Figure 19.
Mechanical properties of the investigated alloys: (a) before and (b) after corrosion test.
Figure 19.
Mechanical properties of the investigated alloys: (a) before and (b) after corrosion test.


Table 1.
Chemical composition of the investigated alloys, wt %.
| Alloy | Si | Fe | Cu | Mn | Mg | Cr | Zn | Ti/Zr | Al |
|---|---|---|---|---|---|---|---|---|---|
| AA3103 | 0.50 | 0.70 | 1.10 | 0.90–1.50 | 0.30 | 0.10 | 0.20 | <0.10 | balance |
| AA5049 | 0.40 | 0.50 | 0.10 | 0.50–1.10 | 1.60–2.50 | <0.30 | 0.20 | <0.10 | balance |
| AA6060 | 0.30–0.60 | 0.10–0.30 | 0.10 | 0.1 | 0.35–0.60 | 0.05 | 0.15 | 0.15 | balance |
| AA6063 | 0.40–0.60 | 0.15–0.30 | 0.05 | 0.1 | 0.50–0.70 | 0.05 | 0.05 | - | balance |
© 2017 by the authors. Licensee MDPI, Basel, Switzerland. This article is an open access article distributed under the terms and conditions of the Creative Commons Attribution (CC BY) license (http://creativecommons.org/licenses/by/4.0/).
Share and Cite
MDPI and ACS Style
Leszczyńska-Madej, B.; Richert, M.; Wąsik, A.; Szafron, A. Analysis of the Microstructure and Selected Properties of the Aluminium Alloys Used in Automotive Air-Conditioning Systems. Metals 2018, 8, 10. https://doi.org/10.3390/met8010010
AMA Style
Leszczyńska-Madej B, Richert M, Wąsik A, Szafron A. Analysis of the Microstructure and Selected Properties of the Aluminium Alloys Used in Automotive Air-Conditioning Systems. Metals. 2018; 8(1):10. https://doi.org/10.3390/met8010010
Chicago/Turabian StyleLeszczyńska-Madej, Beata, Maria Richert, Anna Wąsik, and Adam Szafron. 2018. "Analysis of the Microstructure and Selected Properties of the Aluminium Alloys Used in Automotive Air-Conditioning Systems" Metals 8, no. 1: 10. https://doi.org/10.3390/met8010010
Note that from the first issue of 2016, this journal uses article numbers instead of page numbers. See further details here.