Characterization of Corrosion Products on Weathering Steel Bridges Influenced by Chloride Deposition


1
Department of Building Structures, Faculty of Civil Engineering, VSB-Technical University of Ostrava, L. Podeste 1875, 708 00 Ostrava, Czech Republic
2
SVUOM Ltd., U Mestanskeho Pivovaru 934/4, 170 00 Prague 7, Czech Republic
*
Author to whom correspondence should be addressed.
Metals 2017, 7(9), 336; https://doi.org/10.3390/met7090336
Submission received: 15 August 2017
/
Revised: 25 August 2017
/
Accepted: 26 August 2017
/
Published: 31 August 2017
(This article belongs to the Special Issue Mechanical Behavior of High-Strength Low-Alloy Steels)
Abstract
:The article presents the results of experimental testing of corrosion processes on weathering steel bridges. Two bridge structures spanning various obstacles were selected for the experimental measurement. The tested bridges are situated in the same location and structural solution of these bridges is similar. Differences in development of corrosion products are mainly affected by the microclimate below the bridge structure. Special attention is paid to a bridge over the motorway which is strongly affected by the deposition of chlorides. The dependences between the measured deposition of chlorides and parameters of corrosion layers (thickness of corrosion products, corrosion rates, and chemical composition) are discussed and evaluated in this article.

1. Introduction
Steel structures located in the outdoor environment are exposed to factors of atmospheric corrosion causing the formation of corrosion products on the metal surface and consequently a decrease in the thickness of the material. Among the main factors of atmospheric corrosion belong mainly humidity, temperature, aggressive stimulants present in the atmosphere such as SO2, Cl−, NOx, solid particulate matter, and others [1]. The inappropriate use of structural carbon steel without corrosion protection in the outdoor environment and others reasons has led to the development of new types of low-alloy steels [2]. The first steel with increased resistance to atmospheric corrosion, the so-called weathering steel, was patented in the USA in 1933. In 1964, weathering steel was first used for the design of the main supporting structure of a bridge [3,4]. The alloying elements contained in weathering steel remain within 2 wt. % and are primarily represented by Cu, Cr, P, and Ni. What matters is the balance of individual alloying elements, especially the Cu–P–Cr combination.
Weathering steel is mainly used in designing bridge structures, lattice towers from sections and tubes, but also as roofing and cladding materials or decorative material. The increased resistance to corrosion in the atmosphere results from the development of a compact adhesive corrosion layer on the surface that reduces corrosion rate to a technically permissible limit. The corrosion layer with protective properties, the so-called “patina”, forms after 3 to 7 years of exposure under suitable environmental conditions with respect to the concentration of SO2 in the atmosphere. The necessary atmospheric conditions include, in particular, regular wetting and drying of the steel surface and also an environment remaining within the permissible limits of aggressive corrosion stimulators. In order to ensure a favourable development of the protective corrosion layer, it is necessary to ensure regular maintenance of the structure as well as regular inspections, mainly in the first years after construction, revealing places prone to accumulation of dust particles, impurities, or moisture. When designing structures increased attention must be paid to the layout design of the bridge structure, the structural details, and the design of the drainage system for the bridge [5].
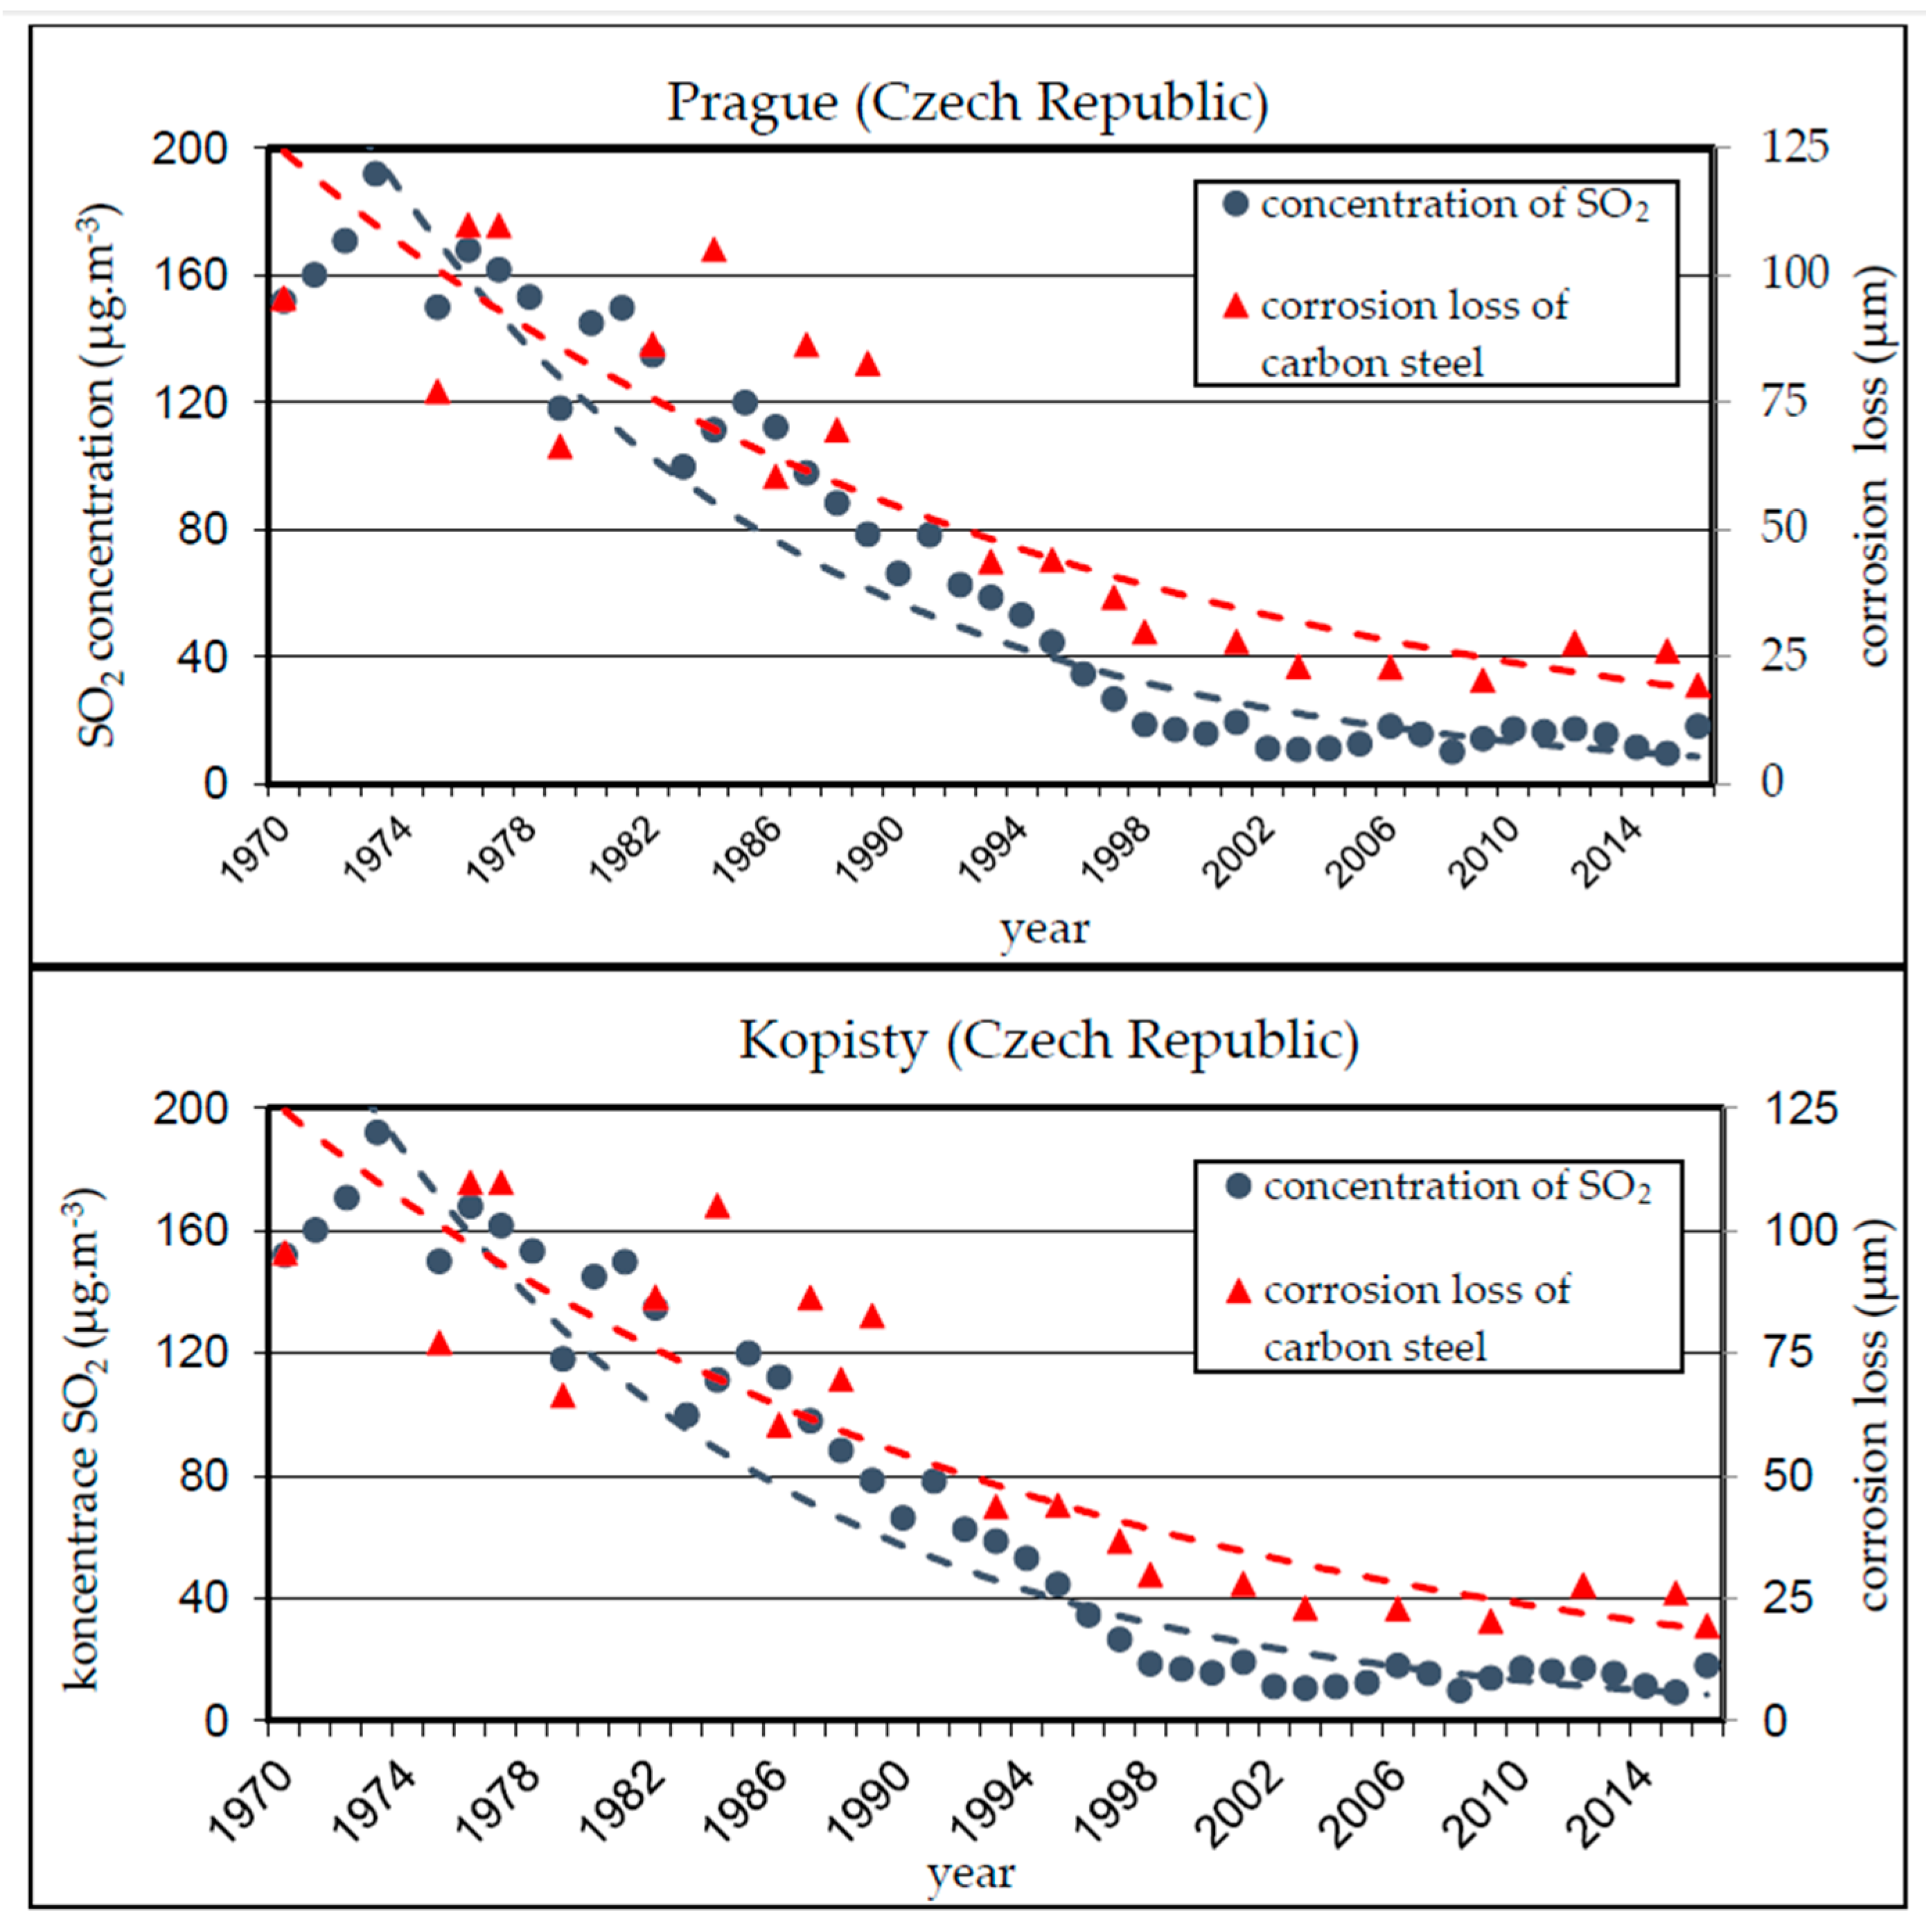
As mentioned above, the most important aggressive corrosion stimulators occurring in the atmosphere include sulphur dioxide (SO2) and chloride ions (Cl−). Sulphur dioxide is brought to the air primarily as a product of fossil fuel combustion. It had the greatest impact on steel corrosion rate in the Czech Republic between 1970 and 1980. The subsequent introduction of desulphurization units brought a substantial reduction of SO2 concentration in the atmosphere and the corrosion losses of carbon steel in the Czech Republic, current values stay below 10 µg/m3 [6,7,8], see Figure 1.
Due to the notable decline in SO2 concentrations, chlorine ions (Cl−) originating from de-icing salt used for winter road maintenance have become much more important factors of corrosive damage. The action of the chlorides leads to the formation of a corrosion layer at an increased rate, the resulting layer being thick and layered with numerous pores limiting the protective function of the corrosion layer on the surface of the weathering steel [8,9]. In coastal areas, the deposition rate of chlorides ranges from 250 mg·m−2·day−1 to 2000 mg·m−2·day−1, which is mainly sea salt aerosol in the air [8]. In inland areas, chlorides are spreading from de-icing chemicals used during the winter. In the Czech Republic, road maintenance mainly uses sodium chloride (NaCl). In the vicinity of roads so treated, the chloride deposition rate can then be expected to reach values otherwise typical for coastal areas. Significant deposition can be expected during the winter period, although certain studies indicate that higher deposition rates can still be measured for up to two and a half months after the last application of de-icing agents [9,10]. It is thus currently needed to concentrate more intensively on the issue of chlorides spreading around bridge structures. Increased chloride deposition can cause significant corrosive damage and reduce the formation of the protective layer on the weathering steel surface.
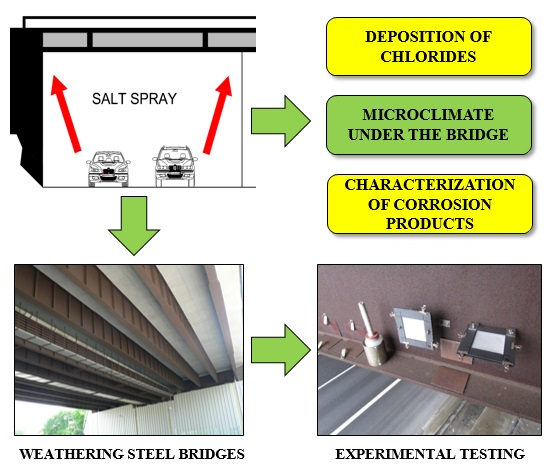
In view of the above, this article presents an experimental monitoring of chloride deposition on a supporting steel structure of selected bridges designed from weathering steel. The measurement results are evaluated in relation to the results of atmospheric corrosion tests carried out in parallel with the chloride deposition measurements. The main objective of the research is to monitor the influence of the environment under the bridge structure (especially the impact of increased chloride deposition from road transport under the bridge) on the development of the corrosion layer and its protective properties.
2. Materials and Methods
2.1. Bridge Structures for Experimental Tests
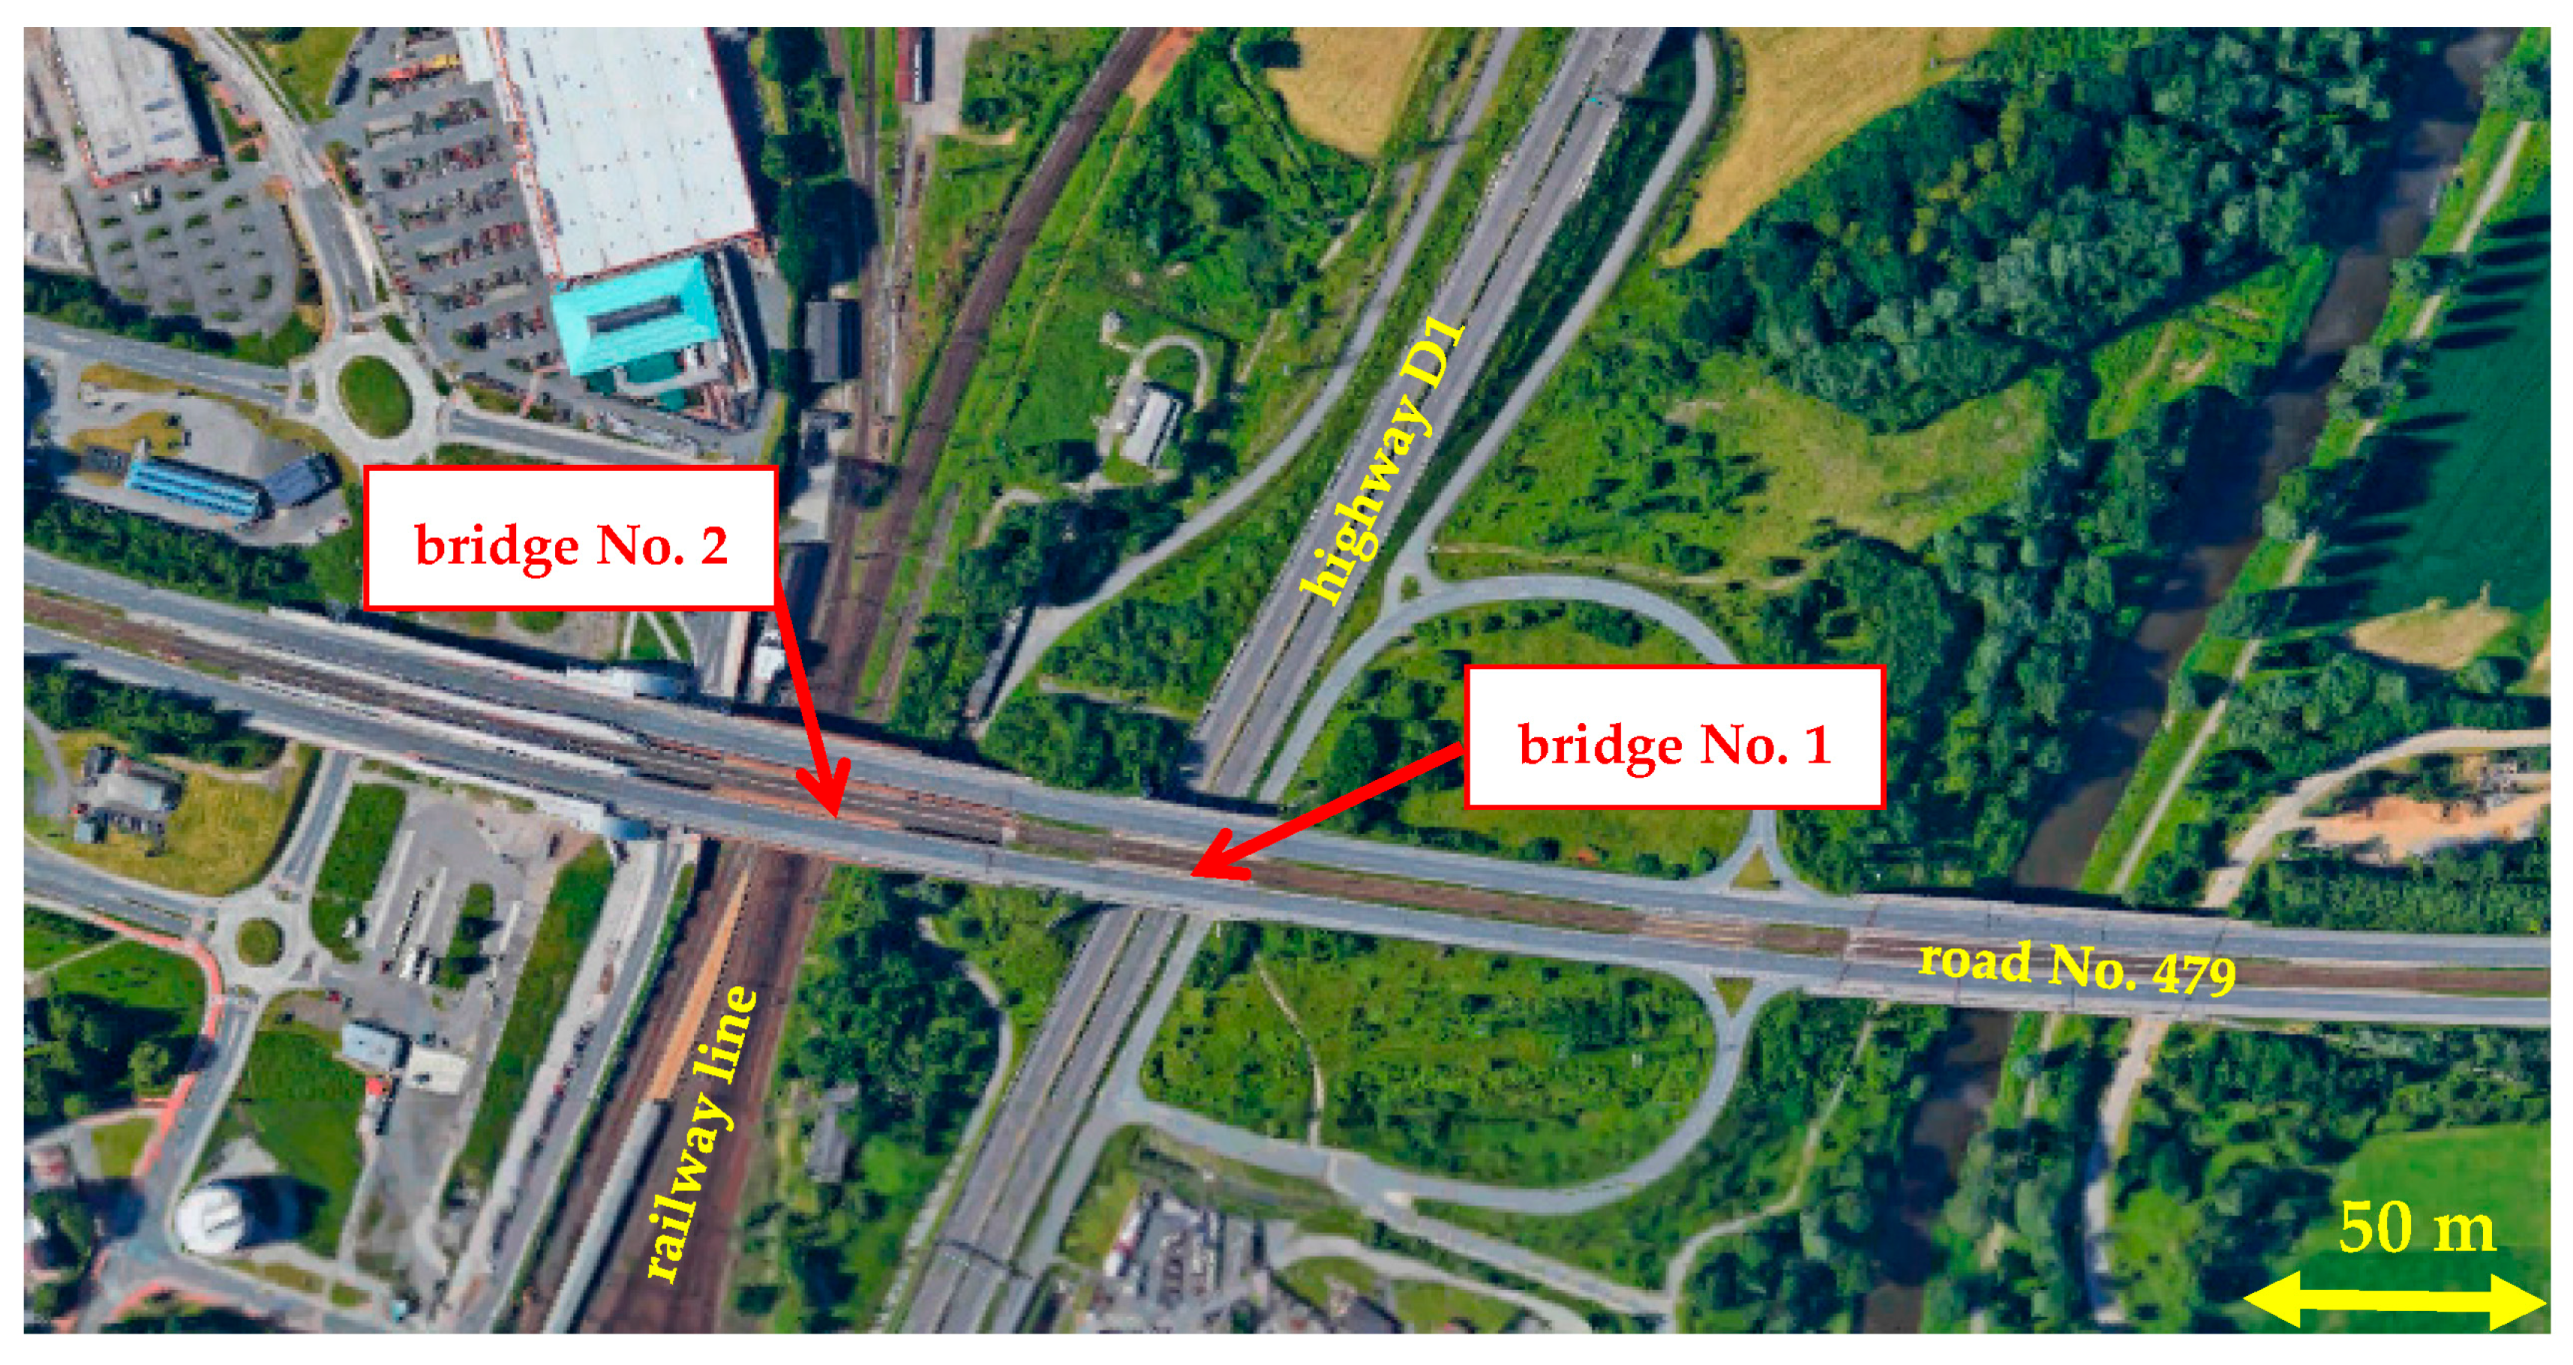
To verify experimentally the influence of road transport under the bridge structure on the amount of chloride deposition and the subsequent development of corrosion products on typical surfaces of bridges designed from weathering steel, two bridge structures located on the same road in Ostrava, Czech Republic (distance from coastal area is about 500 km) were selected (see Figure 2):
- Bridge No. 1: Bridge on road No. 479 over highway D1 (built in 2001);
- Bridge No. 2: Bridge on road No. 479 over a railway (built in 1983).
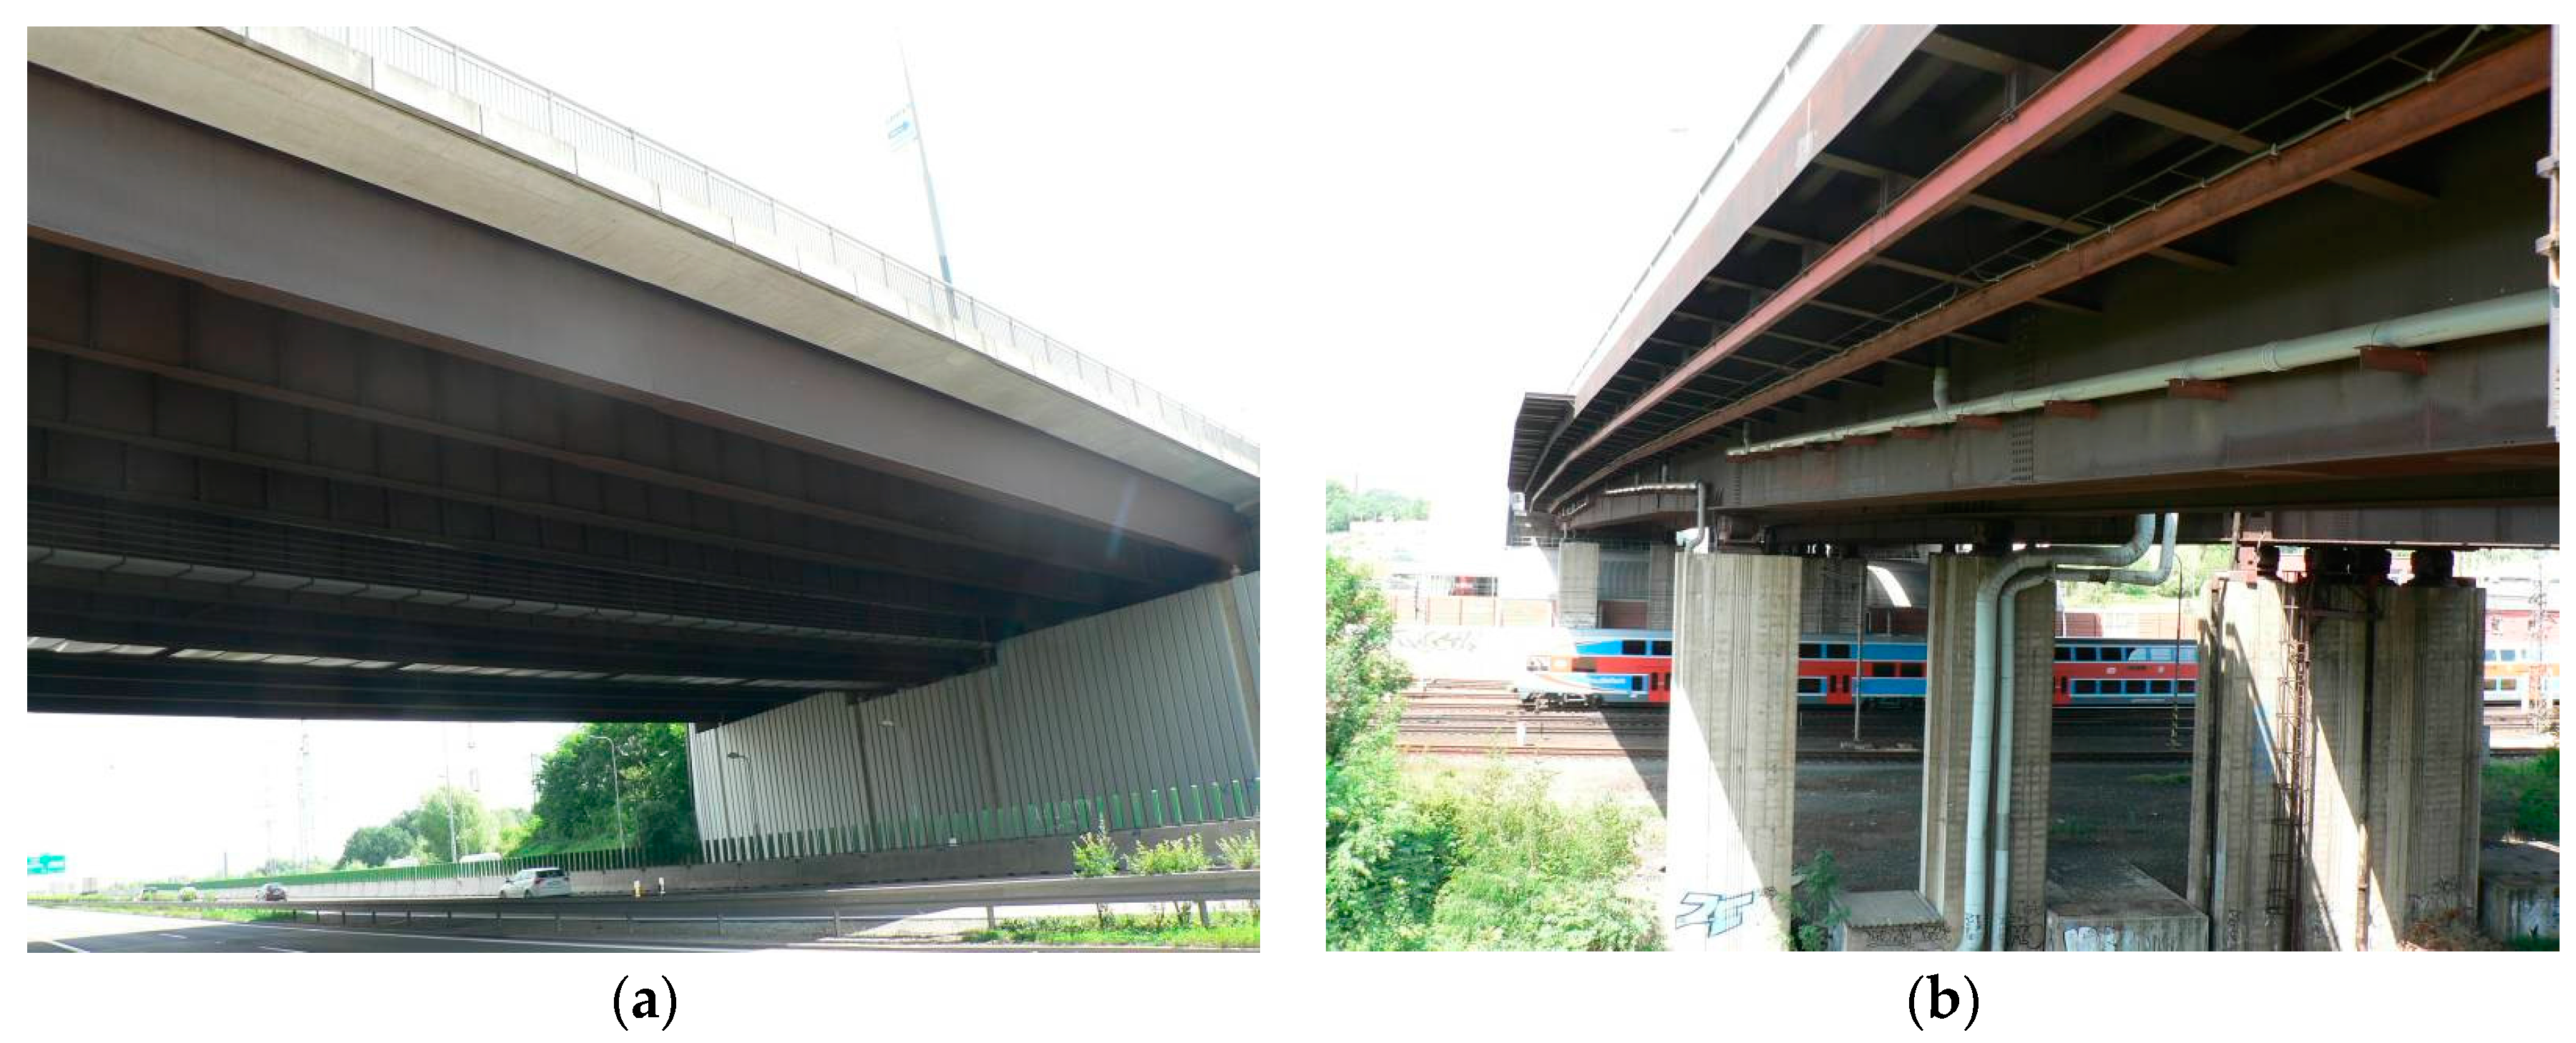
Bridge No. 1 takes the road No. 479 across the busy highway D1. The composite bridge is designed with a reinforced concrete slab and I-shaped main girders. Bridge No. 2 brings the same road across a railway line and is designed with an orthotropic deck and main box girders. Both bridge constructions are designed with Atmofix B [11] weathering steel and are located in Ostrava-Svinov, Czech Republic. The site can be characterized as an urban environment with a degree of atmospheric corrosivity categories C2 to C3 for steel complying with EN ISO 9223 [12]. The distance between the centers of both bridges is approximately 200 m. Figure 3 shows a view of both bridges.
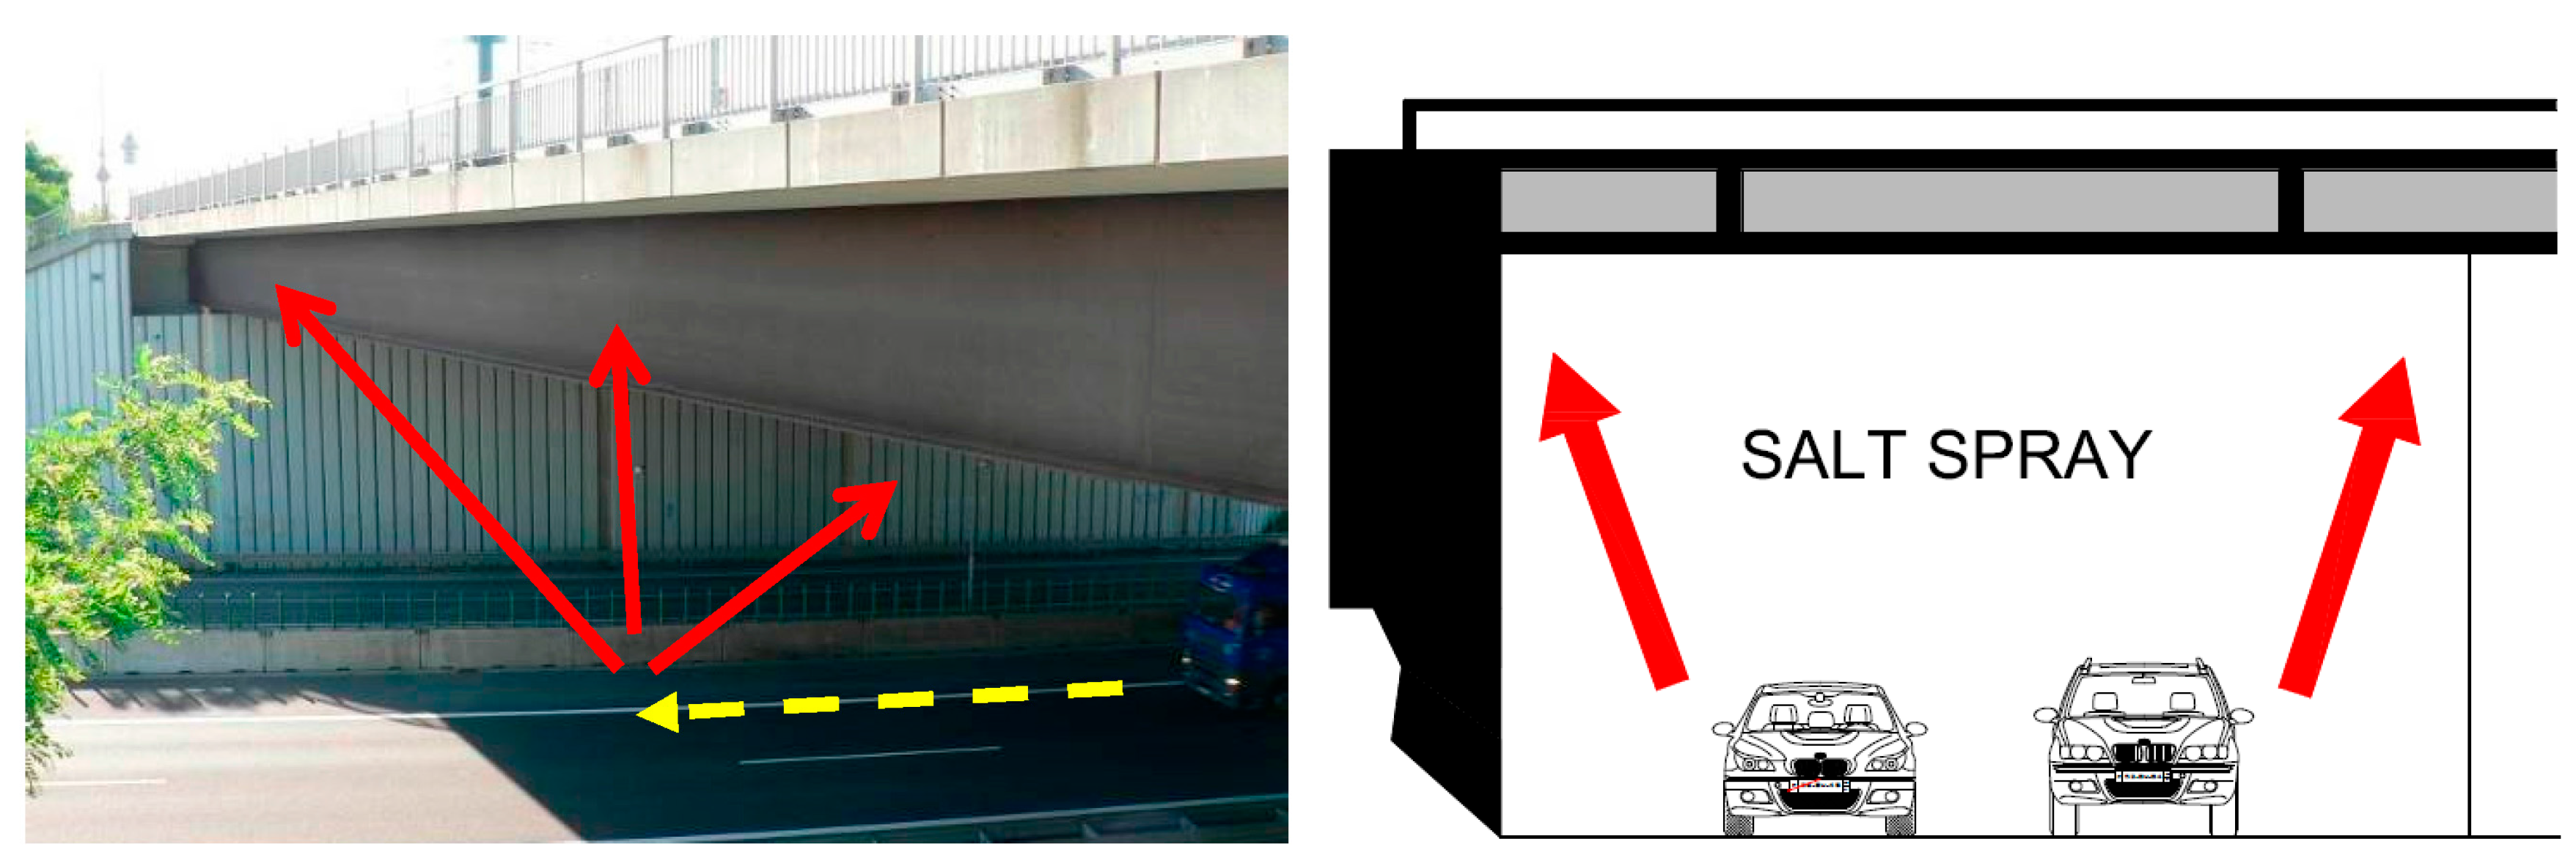
The general conditions for the development of corrosion products on typical surfaces of the bridge constructions are very similar—the bridges are situated in the same location, with just minimal differences in orientation. The design solutions are not too different from one another, either—both bridge constructions are designed as girder road bridges with upper deck. Any significant variations in the development of corrosion products on a particular typical surface of each individual bridge are thus conditioned primarily by the specific local microclimate surrounding the bridge. The decisive factor within those microclimates is the impact of road traffic under the bridge. Only bridge No. 1 is exposed to intense road traffic underneath. In addition, the abutments of bridge No. 1 stand in close proximity to the highway, which makes is somewhat similar to the so-called “tunnel-like conditions” and the associated increased deposition of chlorides on the structure [13,14,15], see Figure 4.
2.2. Experimental Tests for Monitoring the Development of Corrosion Products on Weathering Steel
To monitor the development of corrosion layers on the surface of the weathering steel, corrosion samples for modified atmospheric corrosion tests were installed on both bridges. Corrosion samples are attached to selected typical surfaces of the bridge structure in such a way that the conditions for development of protective corrosion layers on the surface of the samples correspond as closely as possible to the conditions on the adjacent surface of the bridge structure, see Figure 5. Three corrosion samples have been fastened to each selected surface, to be withdrawn later after 1, 3, and 10 years of exposure. For more detailed information on installing corrosion samples, see [5]. The typical surfaces common to both bridges being compared include:
- Surface P1: External wall of the main girder (north orientation);
- Surface P2: External wall of the main girder (south orientation);
- Surface P3: Internal wall of the main girder;
- Surface P4: Upper flange of the main girder—bottom surface;
- Surface P5: Bottom flange of the main girder—external upper surface;
- Surface P6: Bottom flange of the main girder—internal upper surface;
- Surface P7: Bottom flange of the main girder—bottom surface.
The following experimentally measured properties of corrosion layers are used to evaluate the course of corrosion processes on both selected bridge structures:
- Average thickness of corrosion products after long-term exposure;
- Average thickness of corrosion products after one year of exposure of corrosion samples;
- Corrosion loss after one year of exposure of corrosion samples;
- Chemical composition of corrosion products;
- Dry deposition of chlorides.
The thickness of the corrosion products is measured by magnetic-induction method. For each surface under evaluation, an average of 30 measurements is determined. The measurements are made directly on the bridges’ surfaces (long-term exposure) and also on the surfaces of the corrosion samples (one-year exposure). Corrosion rates rcorr (i.e., corrosion losses) after one year of exposure of the corrosion samples are evaluated according to EN ISO 9226 [16] and EN ISO 9223 [12].
A laboratory analysis of the withdrawn corrosion layers determines the weight percentage of individual elements in the corrosion products. The element demonstrating the exposure to an environment affected by deposits of de-icing salts is chlorine (Cl). An increased proportion of dust deposits is reflected in the concentrations of silicon (Si) and aluminium (Al).
In addition to the chemical composition of the corrosion products, a phase composition analysis was also performed. The representation of individual phases is determined by an X-ray diffraction analysis of the corrosion products. The most stable phase is goethite α-FeOOH. The least stable one is lepidocrocite γ-FeOOH. In the corrosion products, compounds like magnetite Fe3O4 or maghemite γ-Fe2O3 are produced; in environments containing chlorine, it is also akaganeite β-FeOOH phase. The relative ratio of the main compounds and phases in the corrosion product layer can be used to determine the Protective Ability Index [17,18].
2.3. Experimental Tests for Monitoring the Deposition Rate of Chlorides
A sampling device was installed on both bridge structures to monitor the deposition rate of chlorides. Two basic methods according to EN ISO 9225 [19] are used to measure the dry deposition of chlorides: Wet candle method and dry plate method.
When measuring using the dry plate method, standard flat samples are installed on the bridge structure together with a frame with gauze stretched across. The perforation of the gauze used for the measurement allows dust deposits from the atmosphere to be collected without risking their loss by being blown away again. This method was applied to measure the deposition rate of chlorides from chemical de-icing agents used for winter road maintenance in Japan [9].
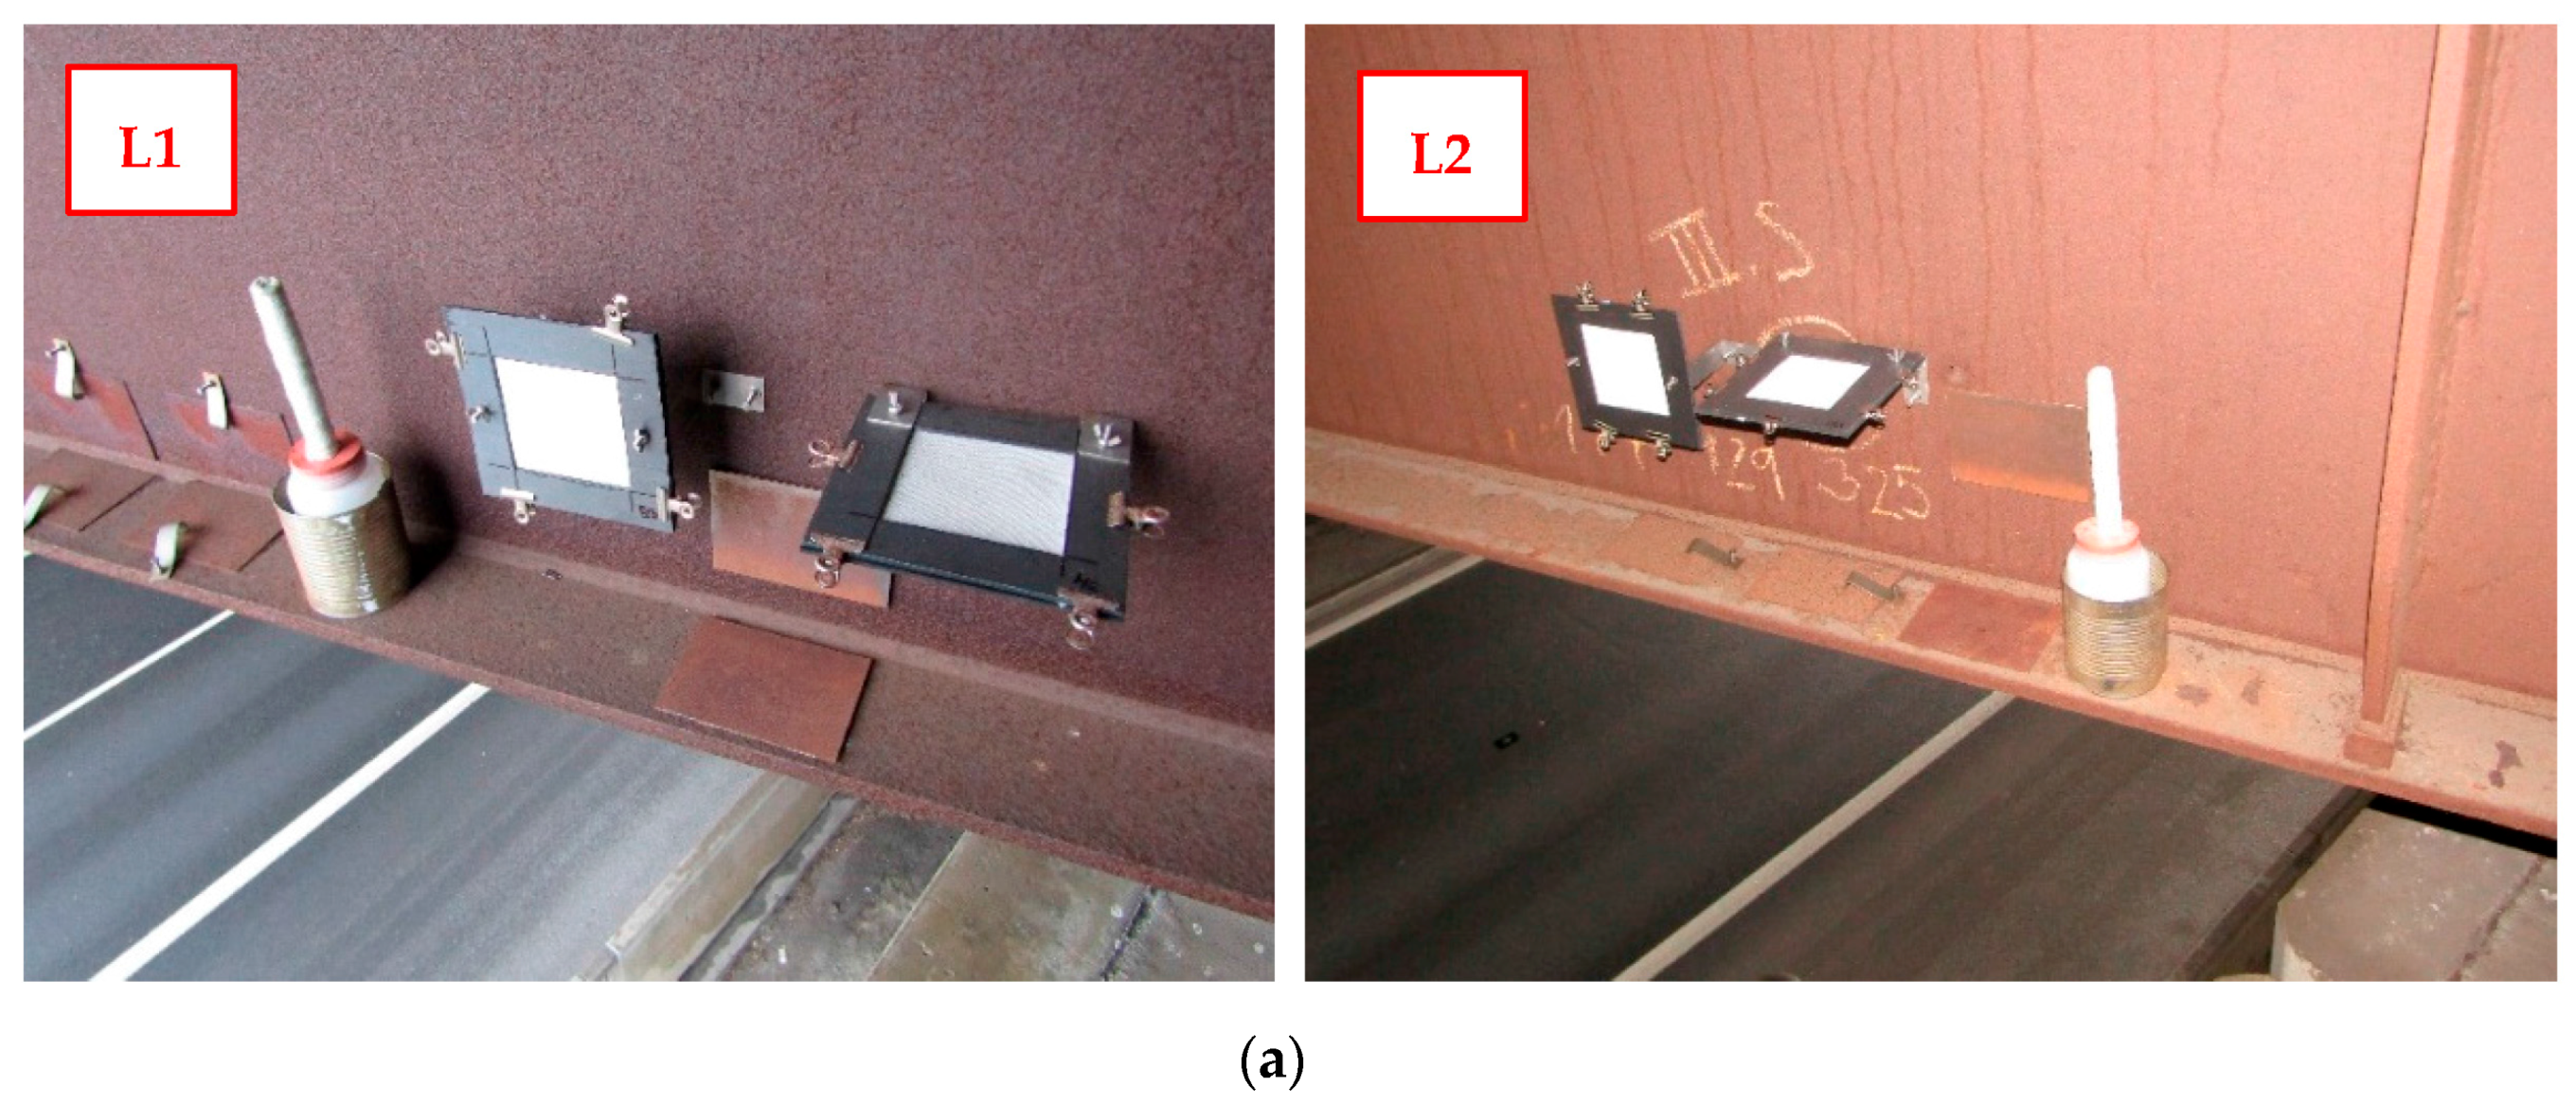
Wet candle method means installing bottles on the bridge structure, containing a solution of glycerol and a wick made of inert material and wrapped in surgical gauze. The chlorides are gradually deposited on the surface of the gauze wick and, after dissolution, they mix with the solution in the bottle. The chloride deposition measuring equipment was placed on the following selected positions of the bridges under evaluation:
- L1—bridge No. 1—external girder, north orientation (corresponds to surfaces P1 and P5);
- L2—bridge No. 1—internal girder, south orientation (corresponds to surfaces P3 and P6);
- L3—bridge No. 1—external girder, south orientation (corresponds to surface P2);
- L4—bridge No. 2—external girder, north orientation (corresponds to surfaces P1 and P5).
The location of the sampling device is shown in Figure 6. Each position includes a sampling device both for wet candle method and dry plate method in a horizontal and a vertical direction, simulating the deposition of chlorides on the vertical and horizontal parts of the structure’s surface. The individual positions are shown in Figure 7. The sampling devices were installed on 1 December 2016. Samples are replaced after one month of exposure; the sample is removed from the sampling device and an analysis is performed according to the procedure set out in [19] to determine the amount of chlorides stored in the wet candle solution and on the dry plate. The wind direction and velocity were not monitored within the research.
3. Results
Comparison of the results from the experimental measurements carried out on the bridge structures as described above can be used to evaluate the effects of road transport under bridges. The following part of the paper presents the results of experimental measurements of the corrosion products’ average thickness, corrosion loss in corrosion samples after one year of exposure, the chemical and phase composition of the corrosion layers, and the measured values of chloride deposition rate.
3.1. Average Thickness of Corrosion Products After Long-Term and 1-Year Exposure
The thickness of corrosion products tcorr was measured on typical surfaces of bridge structures near the position of corrosion samples (long-term exposure: 16 years for the bridge No. 1 and 33 years for the bridge No. 2), as well as on corrosion samples themselves after one year of exposure. The results of the measurement of corrosion thicknesses on typical surfaces of the bridge structures under evaluation are given in Table 1 (average values from 30 measurements are listed in the table).
The values of thickness of corrosion layer measured on bridge No. 1 exceed the values of thickness measured on bridge No. 2. The impact of intensive road transport under the bridge and of the design creating a partial “tunnel-like effect” was most pronounced at the upper surfaces of the bottom flanges. The increased occurrence of dust deposits (including chlorides) has had a very negative influence, especially so in the case of non-ventilated internal surfaces of the bottom flanges, which do not develop a sufficiently protective corrosion layer, see Figure 8.
Looking at the values given in Table 1, both bridges under evaluation show a significant influence of location and orientation of the area on the development of corrosion products. The highest corrosion product thickness values were found on the upper surfaces of the bottom flanges of the main girders. More details on the differences in the development of corrosion products on typical surfaces of bridge structures can be found in [20,21].
3.2. Corrosion Losses After 1 Year of Exposure
The determined values of corrosion loss after the first year of exposure are shown in Table 2. The values of corrosion loss are determined in accordance with EN ISO 9226 [16].
There is a strong correlation between the values of corrosion losses and thicknesses of corrosion layers measured on corrosion samples after one year of exposure [20,21]. The microclimate affected by the intense transport under bridge No. 1 was thus also significantly reflected in the evaluation of corrosion loss values, where as much as a three-fold increase can be observed compared to the reference bridge over the highway.
3.3. Chemical Composition of Corrosion Products
Four samples of corrosion products for composition and phase analysis were collected from the surface of the steel supporting structure of bridge No. 1 (bridge over highway D1). The samples were withdrawn from the external wall of the main girder (surface P1), the internal wall of the main girder (surface P3), the upper external surface of the bottom flange of the main girder (surface P5), and the upper internal surface of the bottom flange of the main girder (surface P6).
The results of the composition analysis are summarized in Table 3. The table only lists concentrations of chlorine (Cl) identifying the amount of de-icing salts deposited and then silicon (Si) and aluminium (Al) concentrations indicating the amount of dust deposits.
The highest concentrations of chloride and also elements pointing to an increased proportion of dust deposits (silicon and aluminium) have been identified on surface P6, i.e., the internal upper surface of the bottom flange of the main girder. It is logical that horizontal surfaces are exposed to increased deposition of dust and chlorides. However, the internal girders do not get cleaned by rain and wind as much as the external surfaces, and non-protective corrosion products have thus developed on the bottom flanges.
Representation ratios of individual compounds of the corrosion layer of weathering steel can be obtained by X-ray diffraction analysis. Protective functionality expressed by indexes PA (protective ability indexes) can be assessed by comparing these ratios [17,18]. An X-ray diffraction analysis was also performed on the withdrawn samples of corrosion products and PA Index values were determined from the obtained phase composition; see Table 4. The phase analysis clearly shows that the corrosion products collected from surfaces P1, P3, and P5 correspond to the already relatively steady state of the corrosion layer—goethite is the dominant phase there. The akaganeite, indicative of the action of chlorides, was detected at high concentrations on surface P6; increased values were also identified on surface P1. This finding corresponds to the composition analysis and the identified weight percentages of chloride in the collected corrosion products. A higher proportion of akaganeite was manifested in the values of PAIα and PAIβ. The increased proportion of dust deposits on surface P6 was signaled by the heavy occurrence of aluminium and certain compounds.
Both bridges also underwent a composition analysis of corrosion products developed after 1 year of exposure on the surface of corrosion samples. The main girders of bridge No. 2 are made of box sections with a small overlap of the bottom flange; that surface thus cannot be used to compare both bridges. That is why surface P1, i.e., the external wall of the main girder, was selected for comparison.
The results of the composition analysis of the corrosion products for both bridges and the reference surface P1 are given in Table 5. The concentrations of all monitored elements (Cl, Si, and Al) are approximately three times higher at bridge No. 1 (bridge over the highway) when compared to bridge No. 2 (bridge above the railway). Again, this finding points to the adverse corrosive effects of intense road transport beneath the bridge structure.
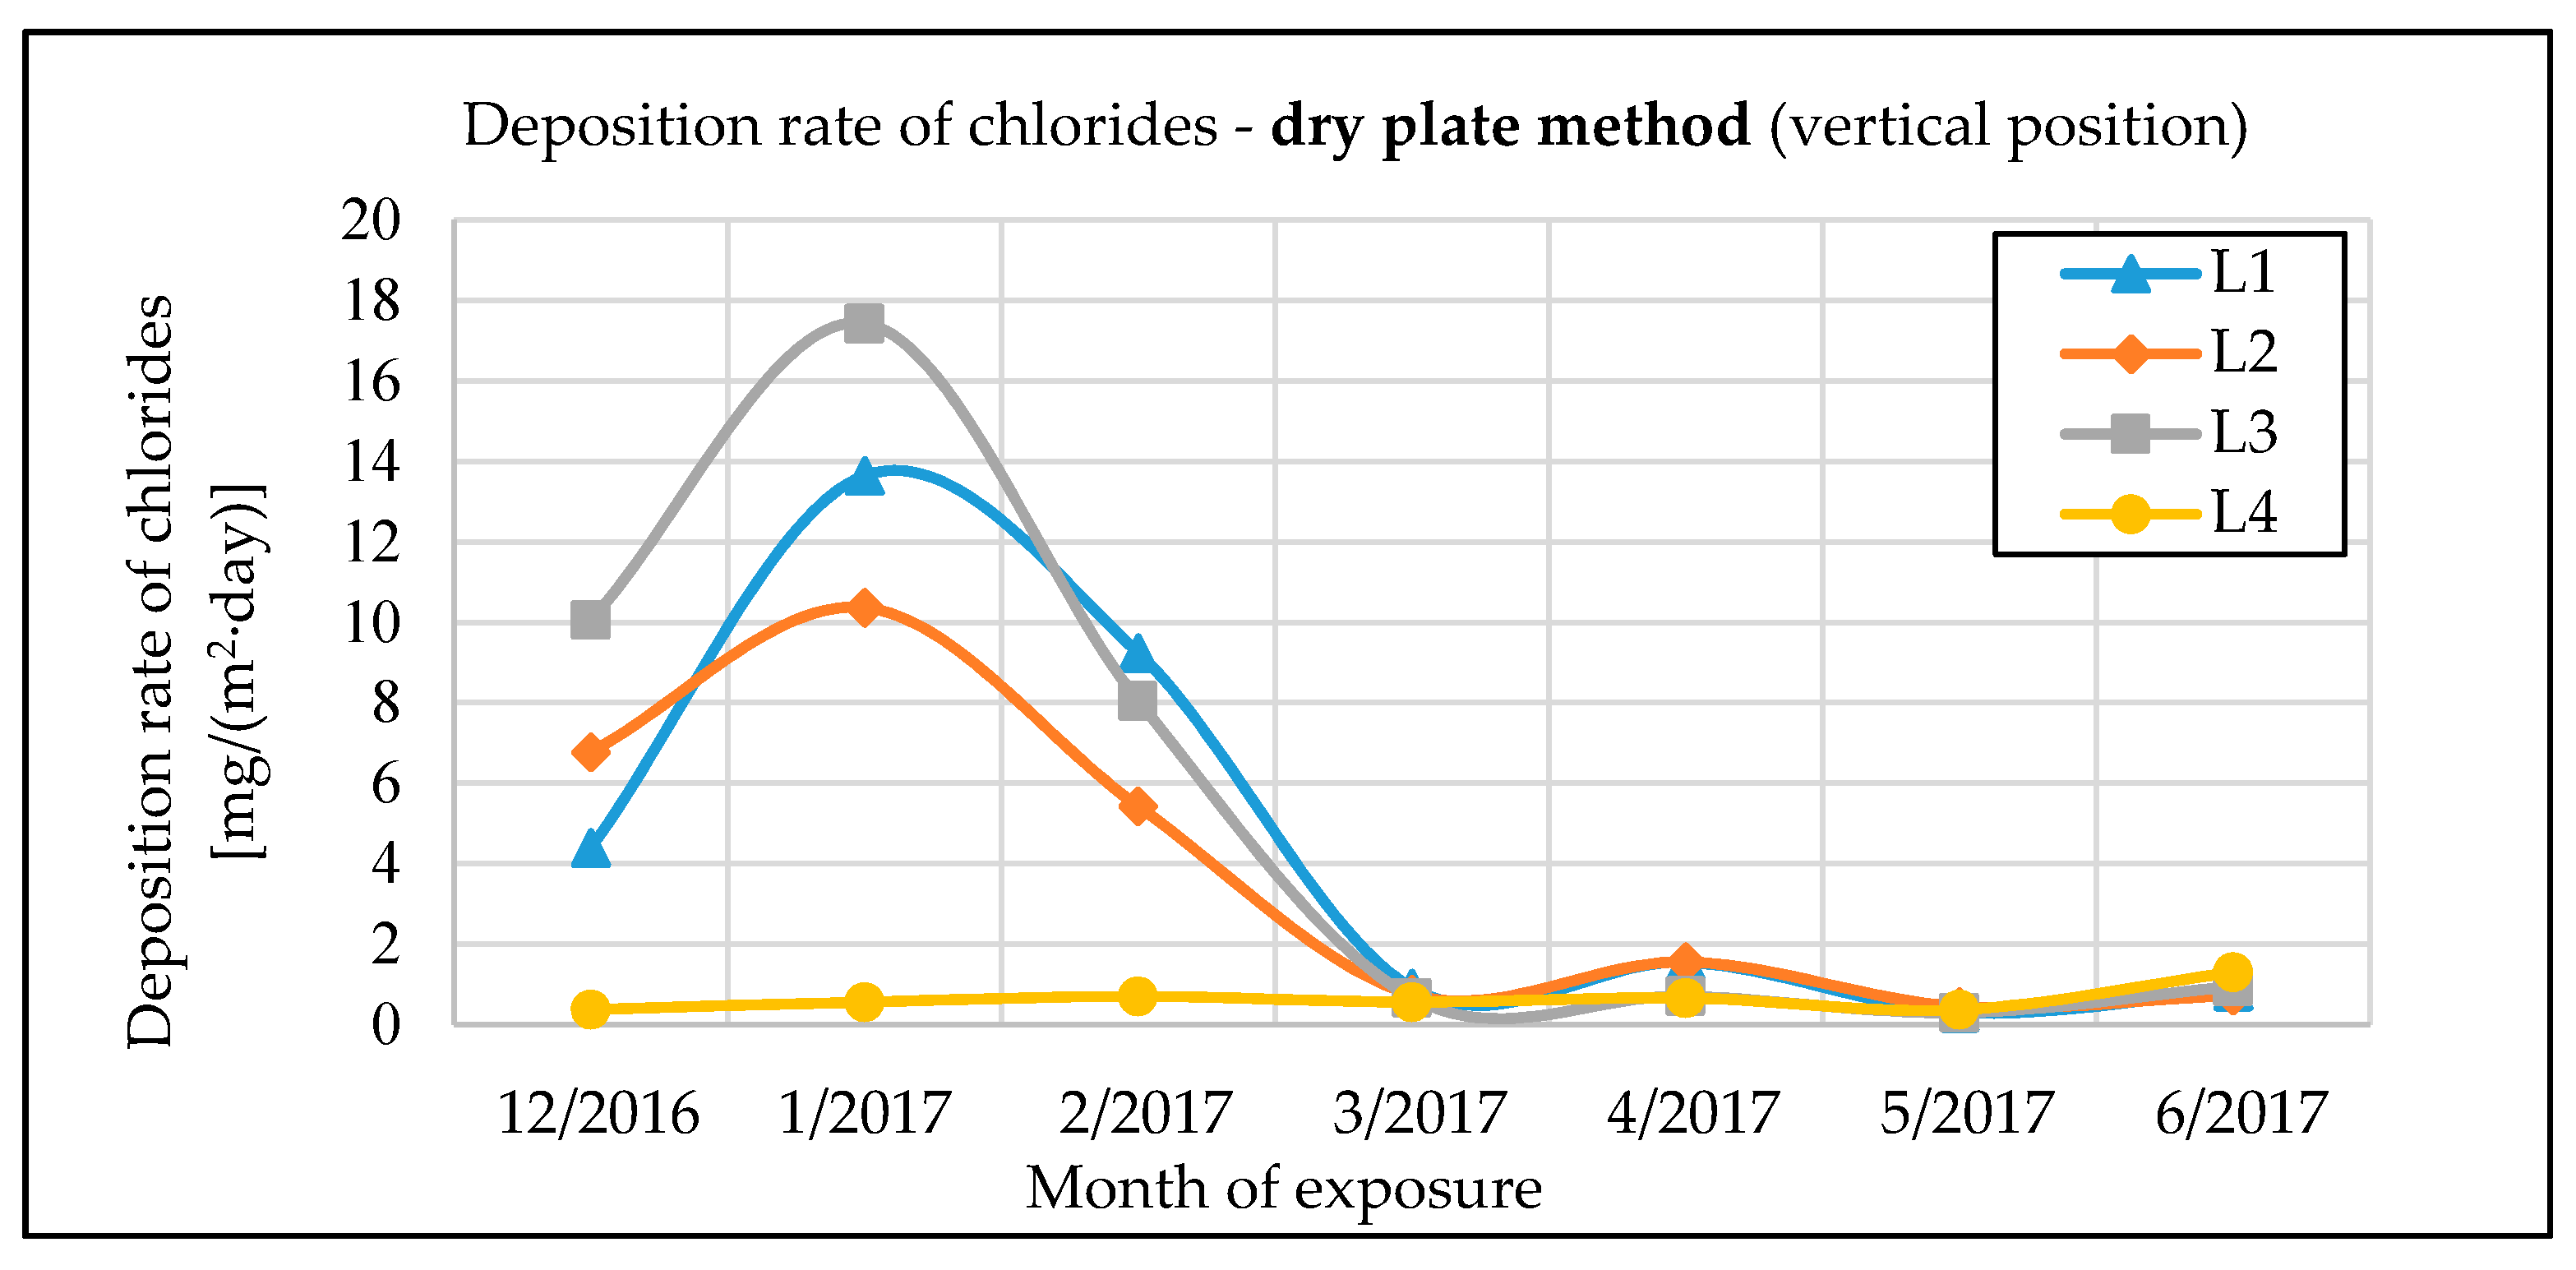
3.4. Deposition Rate of Chlorides
At present, experimentally measured chloride deposition rates are available for the period from December 2016 to June 2017, see Figure 9, Figure 10 and Figure 11. Chloride deposition values are measured using wet candle method and dry plate method. The results include three months (December 2016 to February 2017) during which the winter maintenance with de-icing salts was performed on the roads concerning the bridges under evaluation.
Several interesting results and dependencies can be observed when looking at the chloride deposition rates measured:
- There is a clear link between the amount of deposited chlorides and the winter maintenance using de-icing salt. The chloride deposition rates during the winter maintenance period (December 2016 to February 2017) significantly exceed the values measured during the spring months. The difference is evident especially with bridge No. 1, which is affected by the intense traffic on the D1 highway underneath. The drop in deposition rate at the end of the winter maintenance period is rather steep. The chloride deposition rate during the winter period amounts to 5 mg·m−2·day−1. The gradual decline in the deposition rate over approximately two months after the end of winter maintenance, reported in the literature [9,10], has not been observed.
- Comparing the results from sampling devices located at bridge No. 1 (positions L1, L2, and L3) with results from bridge No. 2 (position L4) shows the significant influence of the specific microclimate found under the bridge structure. It is quite evident that the road traffic under the bridge structure is the main source of chloride deposition upon the bridge’s supporting elements. The results from bridge No. 2 show, on the other hand, that a suitable design of the bridge (girder bridge with an upper deck and sufficient overhang over the external main girders), significantly reduces the amount of chloride deposits originating from the road traffic on the bridge.
- The method used for measuring the dry deposition of chlorides significantly affects the resulting values. For most measurements, the highest chloride deposition rates are obtained using the wet candle method (maximum deposition rate measured was 90 mg·m−2·day−1). In some cases, however, the highest chloride deposition rate was measured with a dry plate method in a horizontal position. Dry plate vertical measurements provided in all cases significantly lower values when compared with other measurement methods (approximately four times less than the dry plate in the horizontal position).
- The results indicate that the external surfaces of the supporting steel structure are exposed to higher levels of chloride deposition when compared to internal surfaces (this observation is in line with the results presented in [9,10]). However, dust deposition (including chlorides) on the external surfaces of bridge No. 1 is regularly washed by rainfall or wind. Non-protective corrosion products only form on the internal flanges, despite the fact that the chloride deposition rate on the internal surfaces is lower compared to the external ones.
4. Discussion
All experimentally determined data clearly show that the development of corrosion products largely depends on the local microclimate under the bridge structure. Intense road traffic under the bridge becomes the source of increased dust and chloride deposition on the bridge bearing elements. The most affected areas of the load-bearing steel structure are the internal surfaces of the bottom flanges of the I-shaped cross-sections, unlike the external ones, these horizontal surfaces do not benefit from sufficient washing from regular rainfall and blowing of the dust deposits by the wind.
Experimental measurements have also shown that dust and chloride deposition on the load-bearing steel structure coming from road traffic on the bridge is significantly lower than the deposition resulting from the traffic underneath. For that, however, some basic constructional principles must be observed regarding the design of bridges with an upper deck. The supporting structure under the deck is then protected against the corrosive effects of the traffic on the bridge.
To evaluate the development of corrosion products on the typical surfaces of bridge structures, various methods can be used. A basic visual assessment should always be supplemented by a measurement of the corrosion products’ average thickness. Measurements are easily taken with portable thickness gauges and the results are readily available. Average thickness of corrosion products of 350 to 400 μm is usually considered as the limit value of a favorable development of the protective corrosion layer for long-exposed bridges [19,22]. The values of corrosion product thickness measured during the initial bridge’s exposure can be used for an accurate estimation of the corrosion rate, as there is a strong correlation between thickness of corrosion products and corrosion loss [21].
The atmospheric corrosion tests using corrosion samples installed on the surfaces of the bridge structure provides the most valuable data on the development of corrosion processes. By applying a sufficiently large number of corrosion samples to the surface of the structure, it is possible to obtain data on the corrosion product development in time. The progression of corrosion loss, changes in the thickness of the corrosion layer and the chemical composition of the corrosion products can be observed. An important finding resulting from the atmospheric corrosion tests is the fact that the development of corrosion products is significantly affected by the location of the evaluated surface within the structure [21]. For example, on bridge No. 1, corrosion losses after one year of exposure to the bottom external surface of the flanges are approximately four times higher compared to the bottom surface of the upper flanges:
- Bridge No. 1, surface P4, 1 year exposure: rcorr = 8.5 μm·year−1;
- Bridge No. 1, surface P5, 1 year exposure: rcorr = 35.2 μm·year−1.
The composition analysis of corrosion products can be used to identify the decisive stimulators of corrosion. The increased deposition of road salt results in a higher mass ratio of chlorine (Cl) in the corrosion products. Higher ratios of silicon (Si) and aluminium (Al) in corrosion products indicate increased deposition of dust. There is not yet enough statistical data to estimate the permissible limit values for chlorine concentrations in the corrosion product layer. The results obtained from bridge No. 1 indicate that during the development of corrosion layer on a surface suffering from the deposition of chlorides, the concentration of chloride in the corrosion products is gradually increasing:
The increased chloride deposition rate also reflected in the phase composition of corrosion products determined by X-ray diffraction analysis, see Table 4. Corrosion products developed in combination with an increased deposition of chlorides also show high ratios of akaganeite. A greater presence of akaganeite was reflected in the values of the protective ability indexes PAIα and PAIβ. The literature states [17,18] that a fully protective corrosion layer with a corrosion rate rcorr < 10 μm·year−1 correspond to PAIα > 1. If the PAIα ratio < 1, calculation of the PAIβ is necessary to determine another factor of the layer’s protective ability (PAIβ < 0.5—a corrosion product layer without protective ability; or PAIβ > 0.5—partially protective corrosion layer). Interpreting the detected values of PA Indexes is still rather complicated. As an example, it can be compared the values of the corrosion product layer average thickness tcorr measured on the surface of the structure, the initial rcorr corrosion rates and the PAIα indexes of the corrosion layer on surfaces P1, P3, P5, and P6; see Table 6. The highest PAIα value of corrosion layer protective ability was identified on surface P5, but that surface also shows the highest initial corrosion rate rcorr and a high value of average corrosion thickness tcorr. The results indicate that there may be no positive correlation between corrosion loss and the patina protective ability index.
The monitoring of chloride deposition rate explicitly showed the potential negative effects of microclimatic conditions under the bridge structure. Winter road maintenance using de-icing salts combined with intense road traffic under the bridge structure are a significant source of chloride and dust deposition on the bridge’s load-bearing elements. The maximum measured value of chloride deposition rate on bridge No. 1 was almost 90 mg·m−2·day−1. The effect can be largely intensified by an inappropriate design of the bridge, creating tunnel-like conditions. Measurements of chloride deposition rates also showed that with a proper bridge design, there are very low amounts of chloride deposits from road traffic on the bridge, compared to the potential effects of traffic going on under the same bridge. The maximum measured value of chloride deposition rate on bridge No. 2, which is not affected by road traffic underneath, was only 10 mg·m−2·day−1.
The chloride deposition rates are measured using the wet candle and the dry plate methods in compliance with the EN ISO 9225 standard [19]. The standard sets the relationship between chloride deposition rates measured by wet candle Sd,c and on the dry plate Sd,p (the dry plate is assumed to be in a vertical position):
Sd,c = 2.4 × Sd,p.
The results of the measurements differ slightly from the assumption in the standard. The average value of the conversion factor for all measurements is m = 3.99; it is thus higher than the 2.4 value assumed by the standard. In addition, there was substantial variation among individual measurements: Coefficient of variation v = 0.29, minimum value min = 1.40, maximum value max = 6.06.
5. Conclusions
As a result of the significant decrease of SO2 concentration in the Czech Republic, the influence of other corrosion stimulators is increasing. Roads and their surrounding areas are exposed to a significant source of corrosive damage in the form of chloride deposition. The chlorides come from de-icing salt used during winter maintenance. The space around the bridge structure is specific. Measuring of chloride deposition on surfaces of the bridge structure should be monitored as they can influence the development of the corrosion protection layer. The evaluation of corrosion processes on road bridges designed from weathering steel in the Czech Republic shows that most surfaces of the steel supporting structures under evaluation have developed a sufficiently protective corrosion layer. At some bridges, though, faults in the protective corrosion layer development have been identified—which in turn relates to the deposition of chlorides and dust deposits.
There are several cases where the development of protective corrosion layer on bridges located on the same road has been very different and affected by the deposition of chlorides and dust deposits. The bridge structures mentioned in this article can be used as a typical example of these cases: Bridge No. 1 is negatively affected by intense road traffic on the highway under the bridge, bridge No. 2 crosses a railway and the potential use of chlorides deposition is negligible compared to bridge No. 1.
A comparison of the negative impact of road traffic under the bridge construction has been demonstrated by several results of experimental testing mentioned in this article. The thicknesses of the protective corrosion layer after 1-year of exposure were compared for similar surfaces of these bridges. Thicknesses of the layer of corrosion products after 1-year of exposure for the bridge No. 1 are about two times higher than thicknesses measured for bridge No. 2. Also thicknesses of corrosion layer after long-term exposure are higher for the bridge No. 1. Moreover, for the upper surface of bottom flange of the main internal girder for bridge No. 1 a sufficiently protective corrosion layer is not yet created there, nor after 16 years of exposure. A second pointer showing the negative effect of the microclimate under the bridge structure on the development of a sufficiently protective layer of corrosion products on the surface of the weathering steel are corrosion losses obtained after 1 year of exposure of corrosion samples. Corrosion losses for bridge No. 1 are even up to three times higher, for some compared surfaces, than for bridge No. 2. The highest corrosion losses were again found on the upper surface of the bottom flange of the main internal girder. The measurements thus confirmed that the progression of corrosion processes on the surface of the bridge’s load-bearing structure is significantly affected by the character of the obstacle that the bridge is designed to overcome.
The structural design of the bridge is another very important factor determining the amount of chlorides and dust deposited. This was confirmed by the measurement of the deposition rate of chlorides. Values of chloride deposition in the winter even reached a value of 90 mg·m−2·day−1 for bridge construction No. 1, while for bridge No. 2 above the railway reached chloride deposition had a maximum value of 10 mg·m−2·day−1. Measurements on bridge No. 2 show that a proper structural design of the bridge can eliminate the negative effects of road transport on the bridge itself to a large extent. The arrangement of abutments of bridge No. 1 is a good example of improper structural design from the point of view of chloride and dust deposition, as it creates tunnel-like conditions. In this case, the design contributes to the corrosive damage of the bridge structure, as confirmed by the results of the experimental tests.
Bridge structures must be designed in such a way that they can function reliably throughout their intended lifetime. A reliable estimation of the microclimatic conditions around the projected bridge structure will have a major impact on the future functionality of the selected system of protection against corrosion. For structures designed from unprotected weathering steel, real corrosion loss must not exceed the assumptions of the static calculation. The knowledge obtained from the measurements carried out on bridge structures in operation greatly enhances our understanding of the environment surrounding road infrastructure and its characteristics. Another valuable finding resulting from the experimental measurements is the correlation between the bridge’s structural design and the progression of corrosion processes on individual surfaces of the structure.
Acknowledgments
This outcome has been achieved with funds of Conceptual development of science, research, and innovation assigned to VSB—Technical University of Ostrava by Ministry of Education Youth and Sports of the Czech Republic and the project MSMT-3375/2017-1 Durability and Sustainability of Engineering Constructions.
Author Contributions
Vit Krivy and Katerina Kreislova conceived and designed the experiments; Vit Krivy, Monika Kubzova and Viktor Urban performed the experiments; Vit Krivy, Katerina Kreislova and Monika Kubzova analyzed the data; Vit Krivy and Monika Kubzova wrote the paper.
Conflicts of Interest
The authors declare no conflict of interest.
References
- Fontana, M.G. Corrosion Engineering, 3rd ed.; Tata McGraw-Hill: New Delhi, India, 2005. [Google Scholar]
- Bhadeshia, H.K.D.H.; Honeycombe, R. Steels Microstructure and Properties, 3rd ed.; Elsevier: Burlington, ON, Canada, 2006; ISBN 9780080462929. [Google Scholar]
- Morcillo, M.; Díaz, I.; Chico, B.; Cano, H.; de la Fuente, D. Weathering steels: From empirical development to scientific design. A review. Corros. Sci. 2014, 83, 6–31. [Google Scholar] [CrossRef]
- Nickerson, R.L. Performance of Weathering Steel in Highway Bridges a Third Phase Report; American Iron and Steel Institute: Washington, DC, USA, 1995. [Google Scholar]
- Krivy, V.; Urban, V.; Kreislova, K. Development and failures of corrosion layers on typical surfaces of weathering steel bridges. Eng. Fail. Anal. 2016, 69, 147–160. [Google Scholar] [CrossRef]
- Kreislova, K.; Geiplova, H.; Bartak, Z.; Majtas, D. Atmospheric corrosion models. Koroze Ochr. Mater. 2017, 61, 59–66. [Google Scholar] [CrossRef]
- Kreislova, K.; Knotkova, D. The Results of 45 Years of Atmospheric Corrosion Study in the Czech Republic. Materials 2017, 10, 394. [Google Scholar] [CrossRef] [PubMed]
- Alcantara, J.; Fuente, D.; Chico, B.; Simancas, J.; Diaz, I.; Morcillo, M. Marine Atmospheric Corrosion of Carbon Steel: A Review. Materials 2017, 10, 406. [Google Scholar] [CrossRef] [PubMed]
- Iwasaki, E. Scattering of Deicing Salt and Corrosion of Steel Bridges. In Proceedings of the Challenges in Design and Construction of an Innovative and Sustainable Built Environment, 19th IABSE Congress, Stockholm, Sweden, 21–23 September 2016; pp. 1436–1441. [Google Scholar]
- Yamaguchi, E. Maintenance of weathering steel bridges. Steel Constr. Today Tomorrow 2015, 45, 12–15. [Google Scholar]
- Krivy, V.; Konecny, P. Real material properties of weathering steels used in bridge structures. Procedia Eng. 2013, 57, 624–633. [Google Scholar] [CrossRef]
- International Organization for Standardization. Corrosion of Metals and Alloys—Corrosivity of Atmospheres—Classification, Determination and Estimation; ISO 9223; International Organization for Standardization: Geneva, Switzerland, 2012. [Google Scholar]
- Dolling, C.; Hudson, R. Weathering steel bridges in the U.K. Rev. Métall. 2003, 100, 1125–1133. [Google Scholar] [CrossRef]
- Xanthakos, P.P. Theory and Design of Bridges; Consulting Engineer: Washington, DC, USA, 1994. [Google Scholar]
- Kreislova, K.; Knotkova, G. Atmosférická Koroze; SVÚOM: Praha, Czechia, 2014; ISBN 978-80-87444-11-5. (In Czech) [Google Scholar]
- International Organization for Standardization. Corrosion of Metals and Alloys—Corrosivity of Atmospheres—Determination of Corrosion Rate of Standard Specimens for the Evaluation of Corrosivity; ISO 9226; International Organization for Standardization: Geneva, Switzerland, 2012. [Google Scholar]
- Kamimura, T.; Hara, S.; Miuyki, H.; Yamashita, M.; Uchida, M. Composition and protective ability of rust layer formed on weathering steel exposed to various environments. Corros. Sci. 2006, 48, 2799–2812. [Google Scholar] [CrossRef]
- Hara, S.; Kamimura, T.; Miyuki, H.; Yamashita, M. Taxonomy for protective ability of rust layer using its composition formed on weathering steel bridge. Corros. Sci. 2007, 49, 1131–1142. [Google Scholar] [CrossRef]
- International Organization for Standardization. Corrosion of Metals and Alloys—Corrosivity of Atmospheres—Measurement of Environmental Parameters Affecting Corrosivity of Atmospheres; ISO 9225; International Organization for Standardization: Geneva, Switzerland, 2012. [Google Scholar]
- Urban, V.; Krivy, V.; Kreislova, K. The development of corrosion processes on weathering steel bridges. Procedia Eng. 2015, 114, 546–554. [Google Scholar] [CrossRef]
- Krivy, V.; Urban, V.; Kubzova, M. Thickness of corrosion layers on typical surfaces of weathering steel bridges. Procedia Eng. 2016, 96, 56–62. [Google Scholar] [CrossRef]
- Morcillo, M.; Chico, B.; Díaz, I.; Cano, H.; de la Fuente, D. Atmospheric corrosion data of weathering steels, a review. Corros. Sci. 2013, 77, 6–24. [Google Scholar] [CrossRef]
Figure 1.
Decreasing concentration of SO2 and one year corrosion losses of carbon steel (CS) in atmospheric test sites Prague and Kopisty (Czech Republic).
Figure 1.
Decreasing concentration of SO2 and one year corrosion losses of carbon steel (CS) in atmospheric test sites Prague and Kopisty (Czech Republic).

Figure 2.
Location of the bridge structures.
Figure 3.
View at selected bridges for experimental testing: (a) Bridge No. 1 and (b) bridge No. 2.

Figure 4.
Bridge No. 1—Environment under the bridge is similar to the environment in the tunnels.

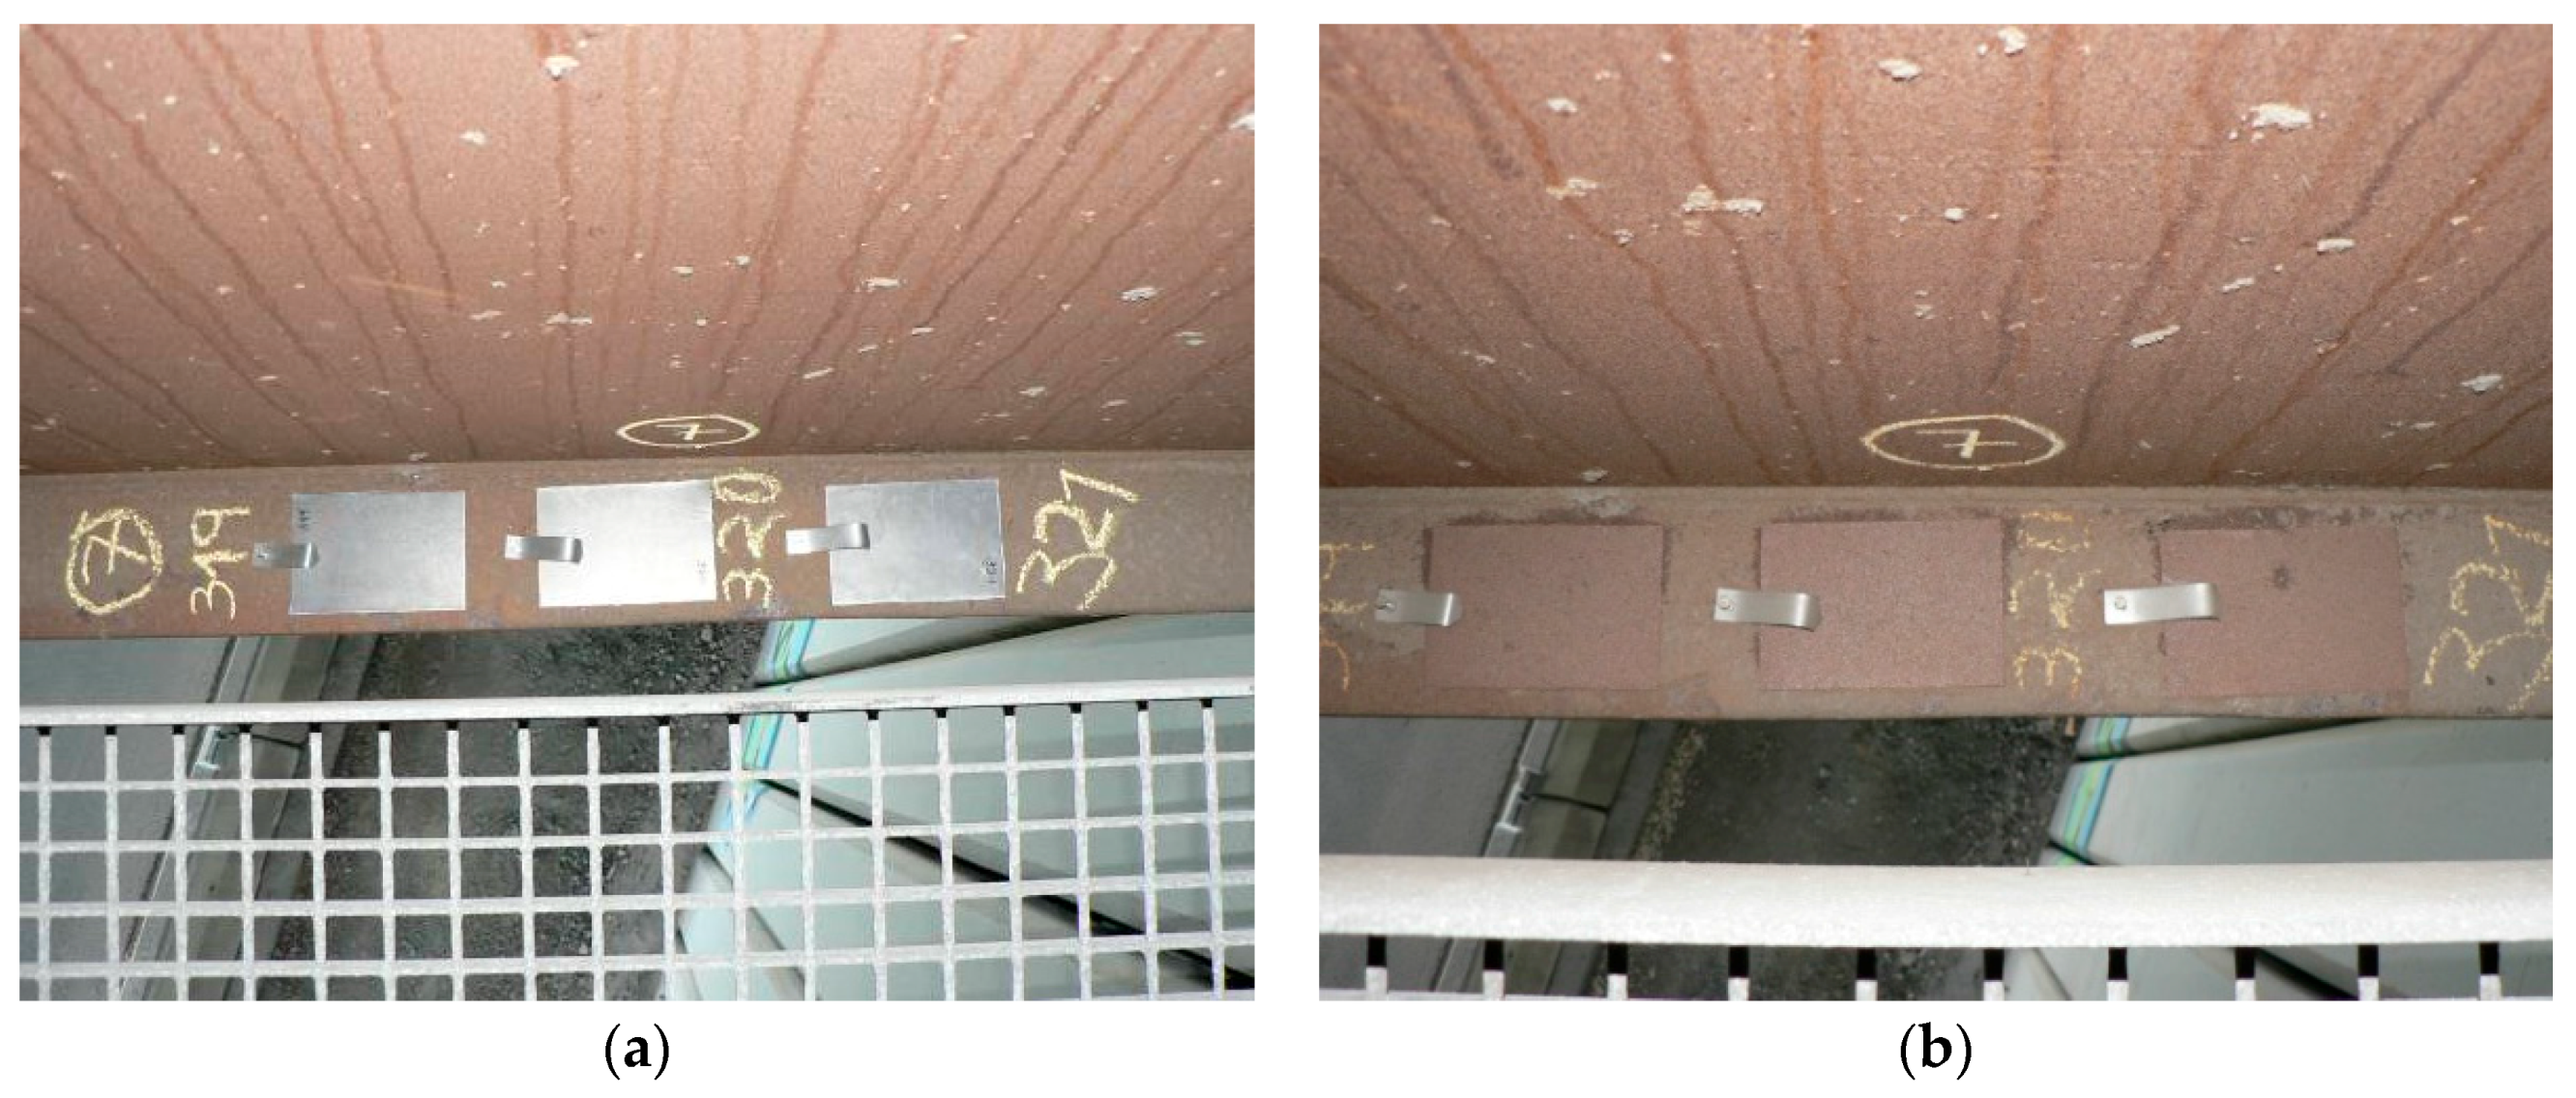
Figure 5.
Corrosion samples on the upper surface of the bottom flange at the time of installation (a) and after 1 year of the exposure (b).
Figure 5.
Corrosion samples on the upper surface of the bottom flange at the time of installation (a) and after 1 year of the exposure (b).

Figure 6.
Position of the measuring devices on the selected bridge structures—bridge No. 1 (a) and bridge No. 2 (b).
Figure 6.
Position of the measuring devices on the selected bridge structures—bridge No. 1 (a) and bridge No. 2 (b).
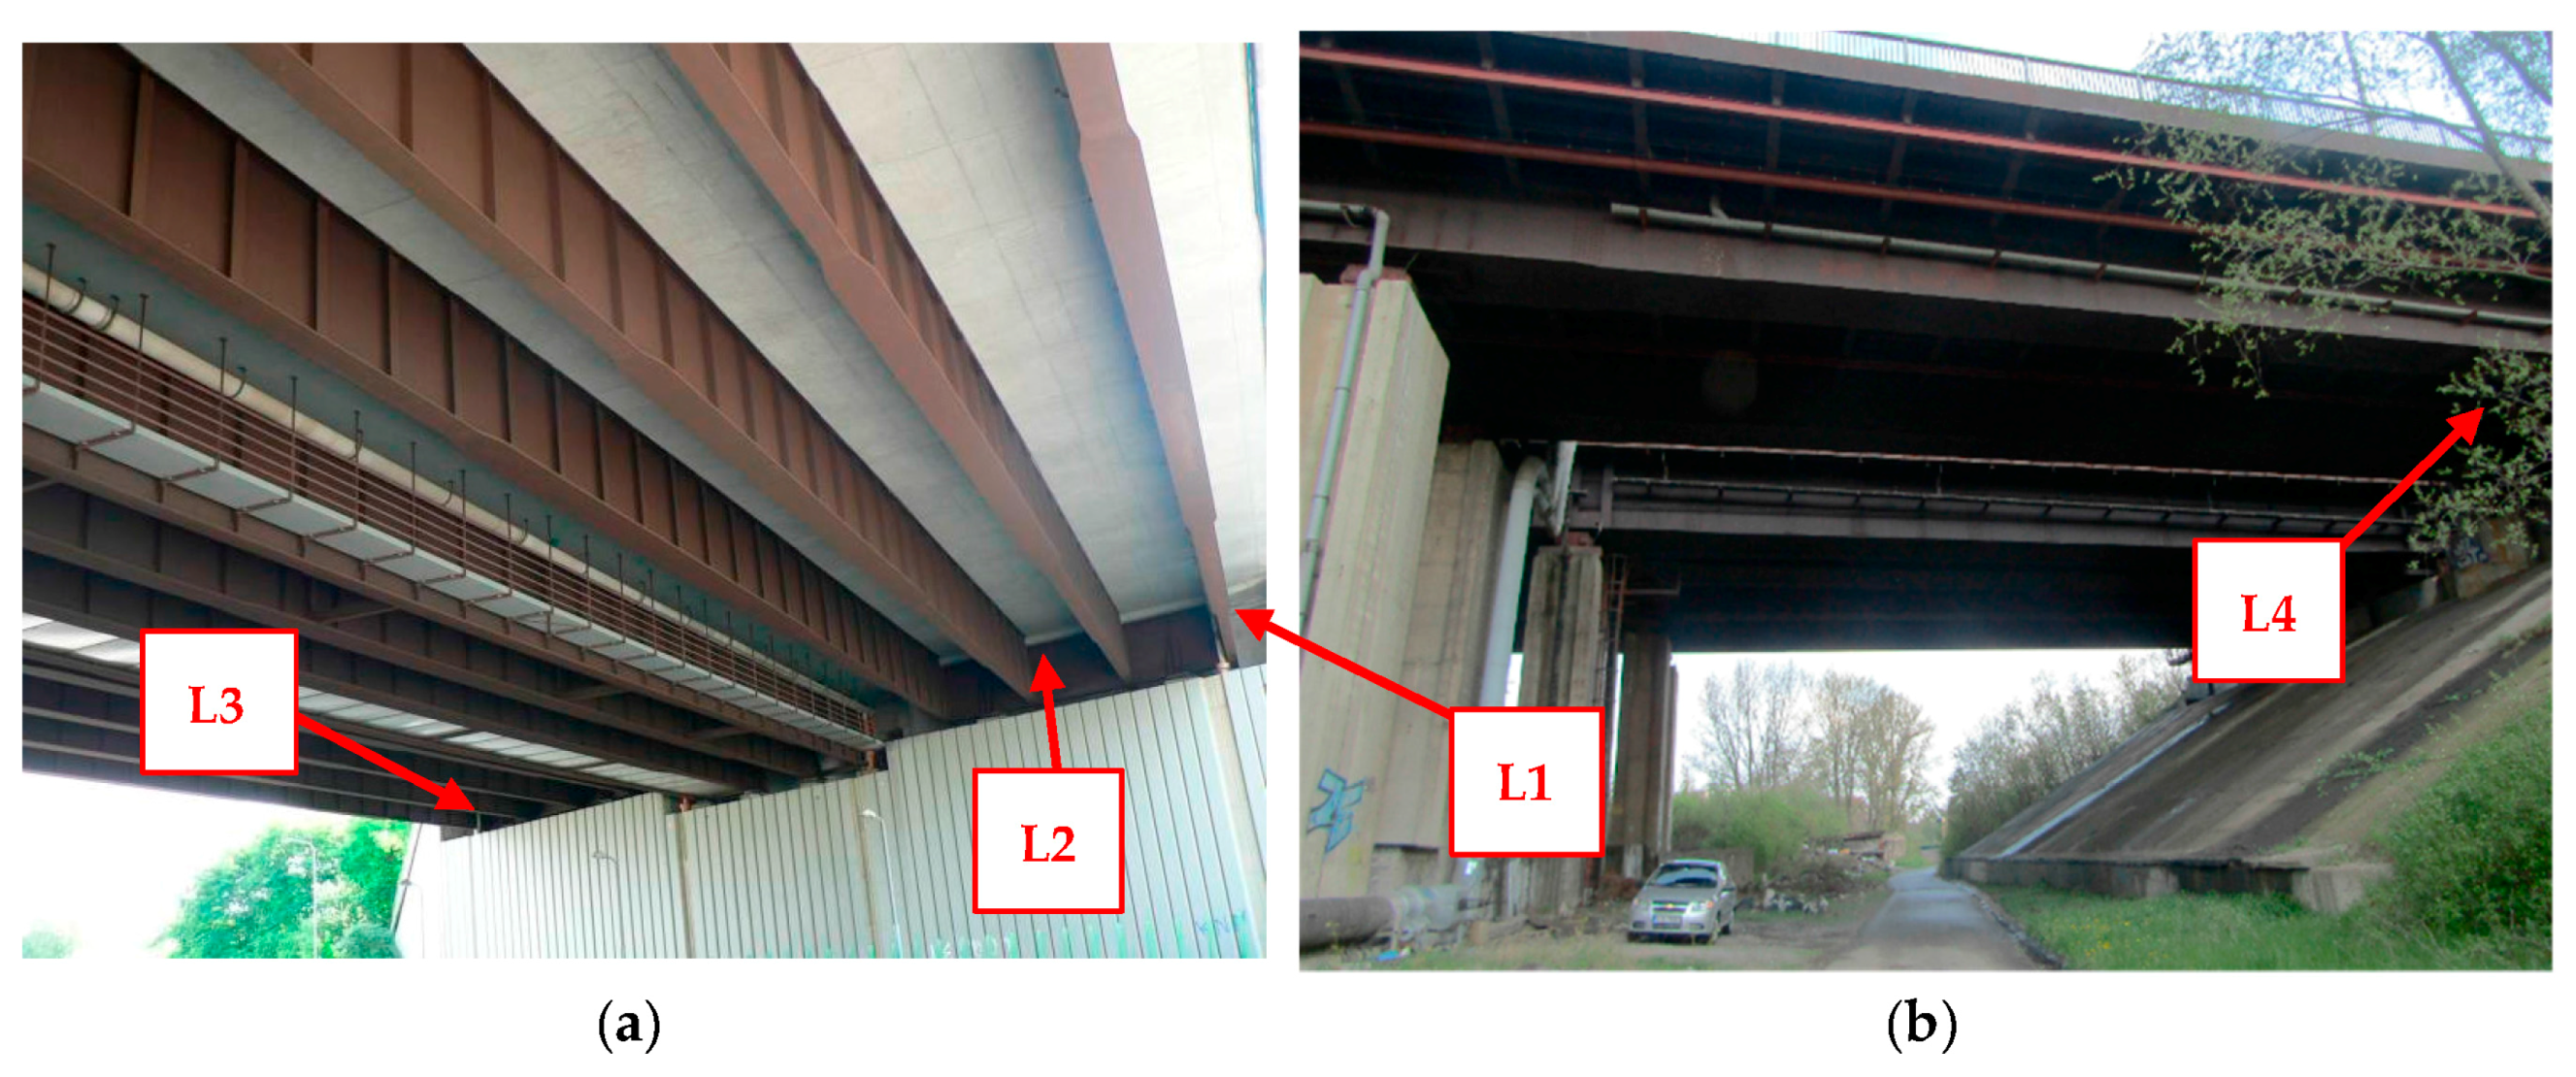
Figure 7.
(a) Individual positions of the measuring devices on the selected bridges; (b) Individual positions of the measuring devices on the selected bridges.
Figure 7.
(a) Individual positions of the measuring devices on the selected bridges; (b) Individual positions of the measuring devices on the selected bridges.

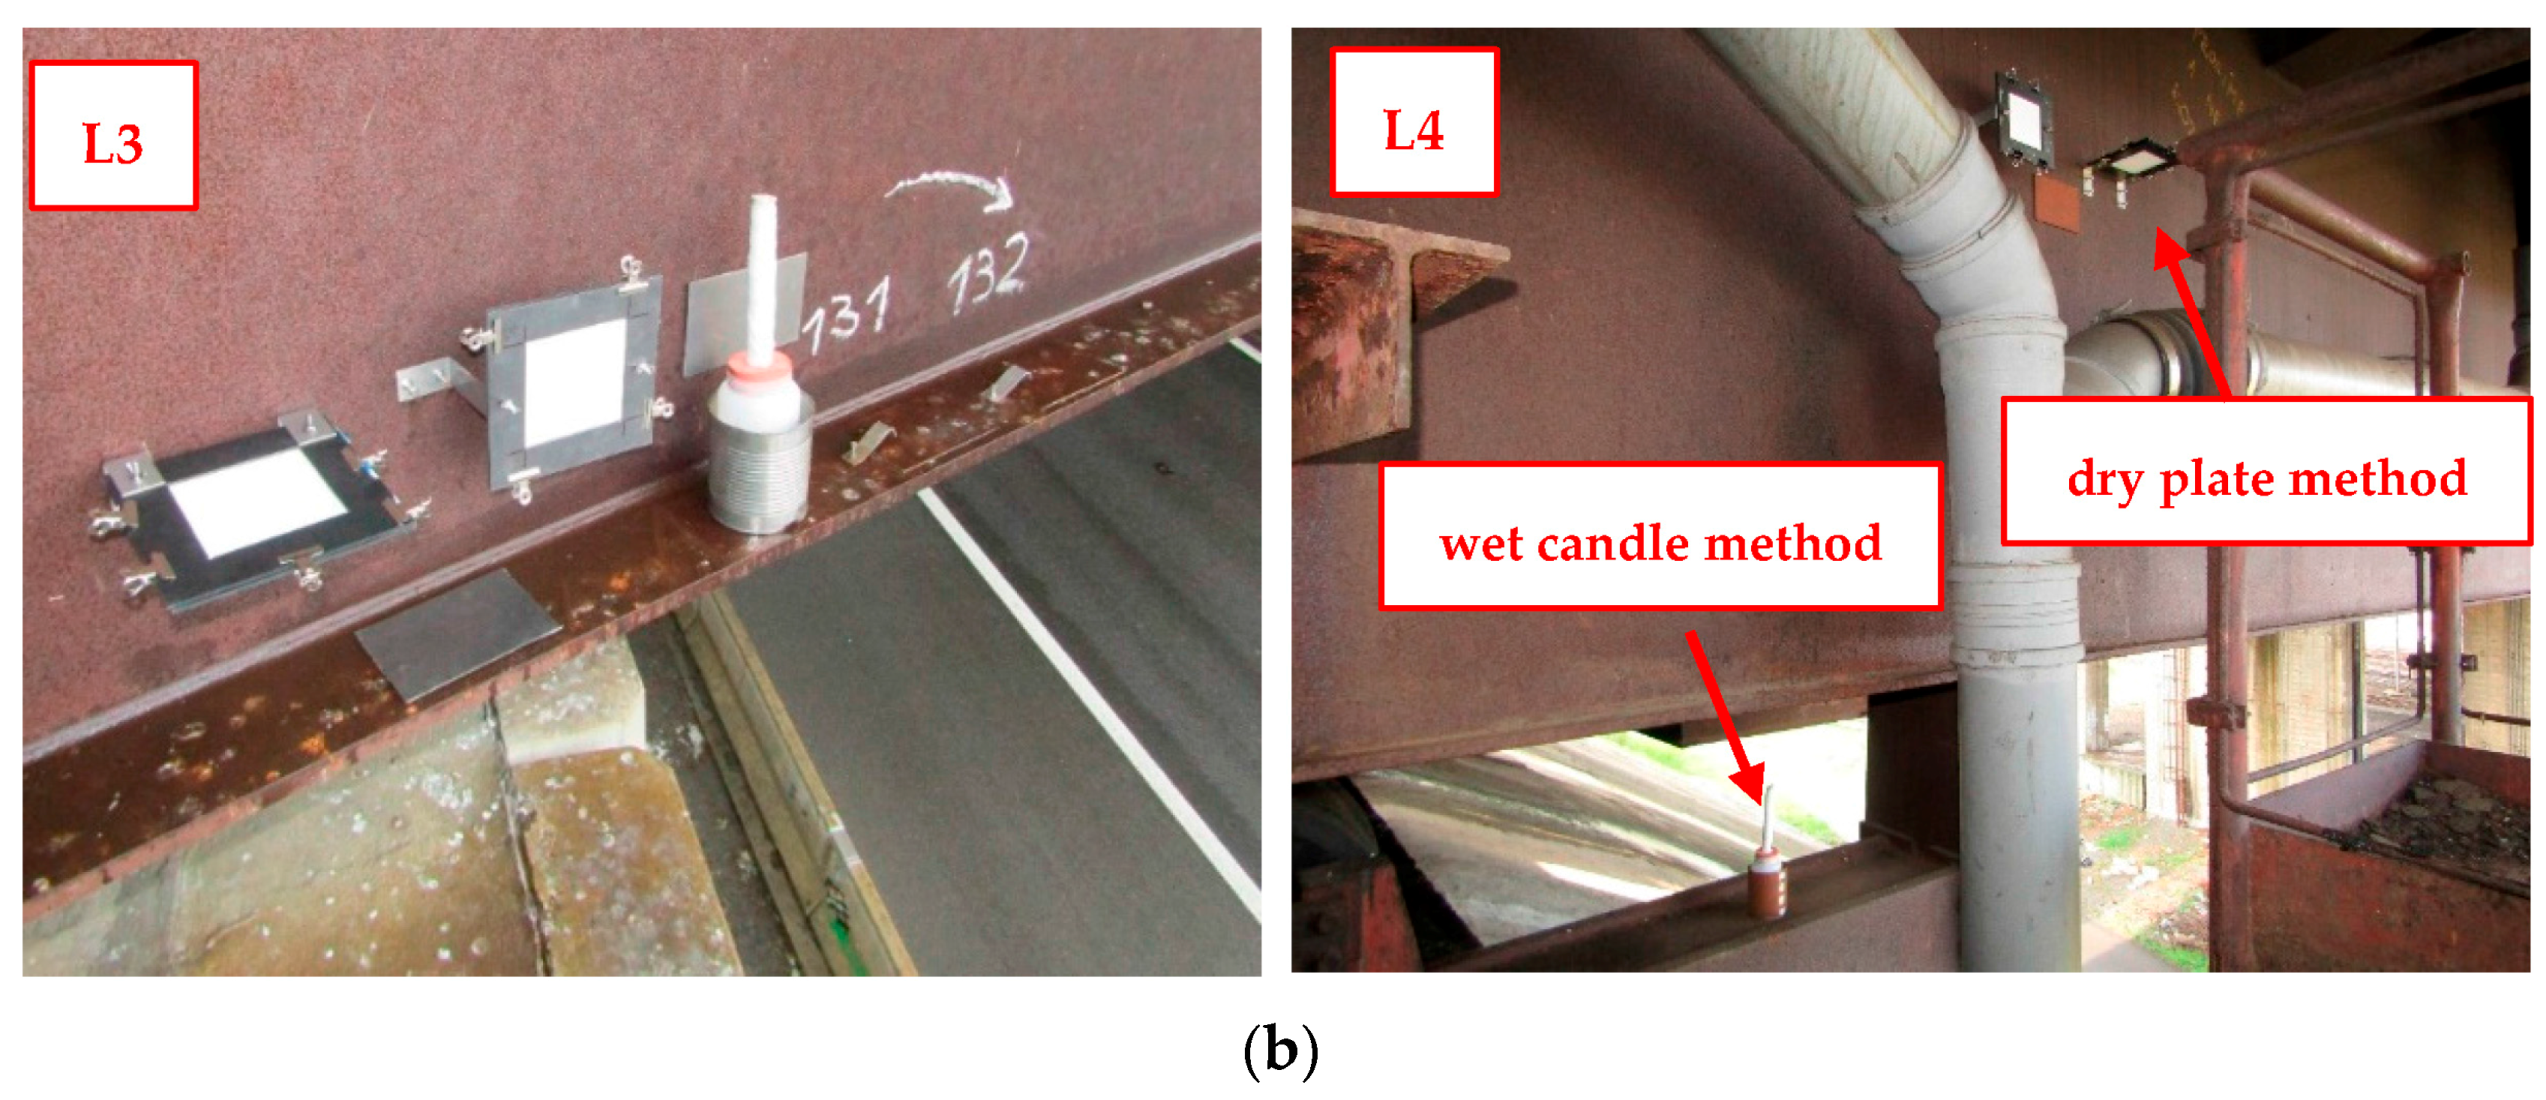
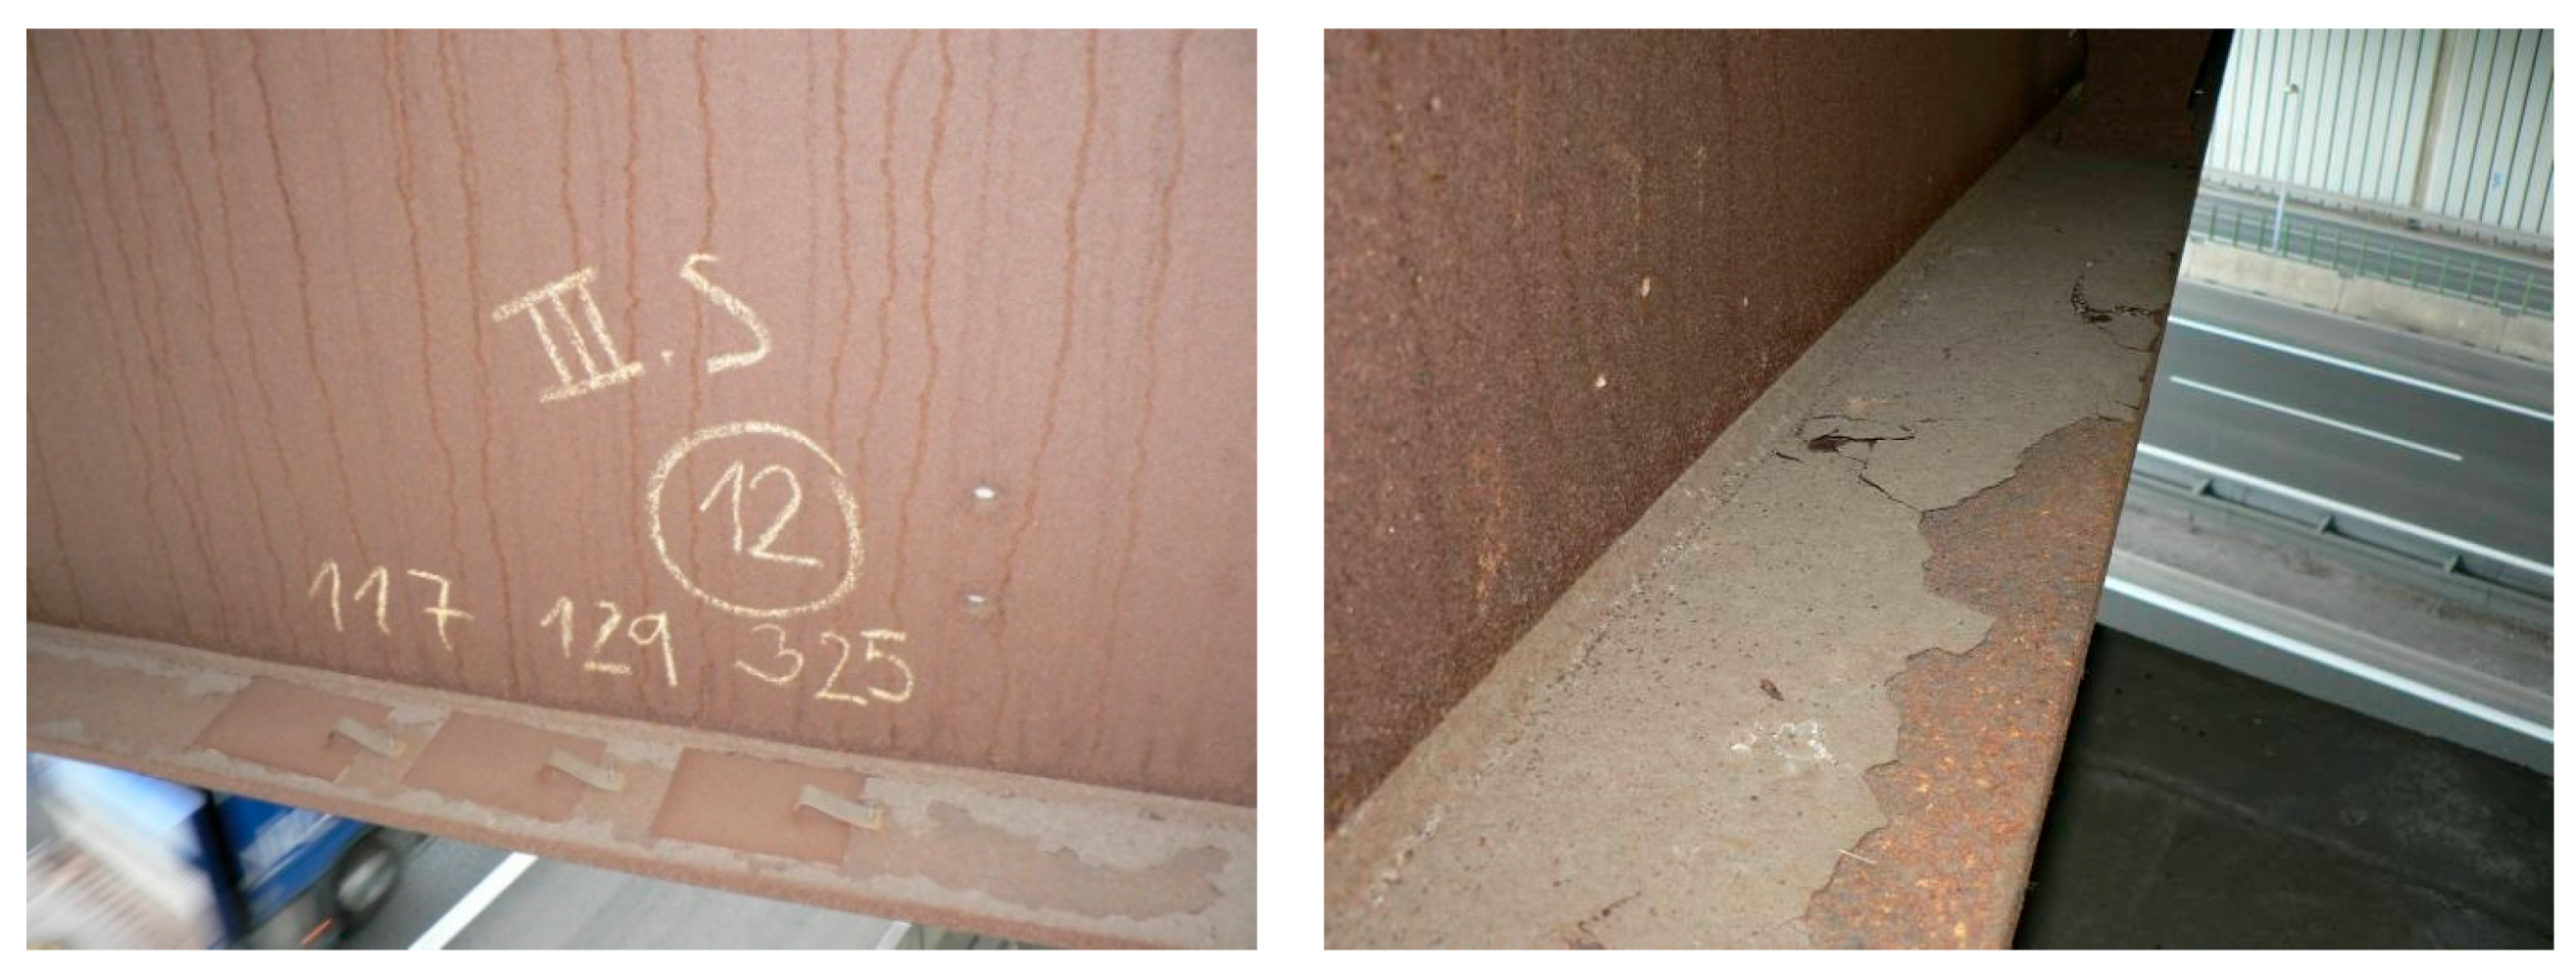
Figure 8.
Bridge No. 1—unfavorable development of corrosion products on the internal upper surface of the bottom flange (surface P6).
Figure 8.
Bridge No. 1—unfavorable development of corrosion products on the internal upper surface of the bottom flange (surface P6).

Figure 9.
The deposition rates of chlorides determined by the wet candle method.
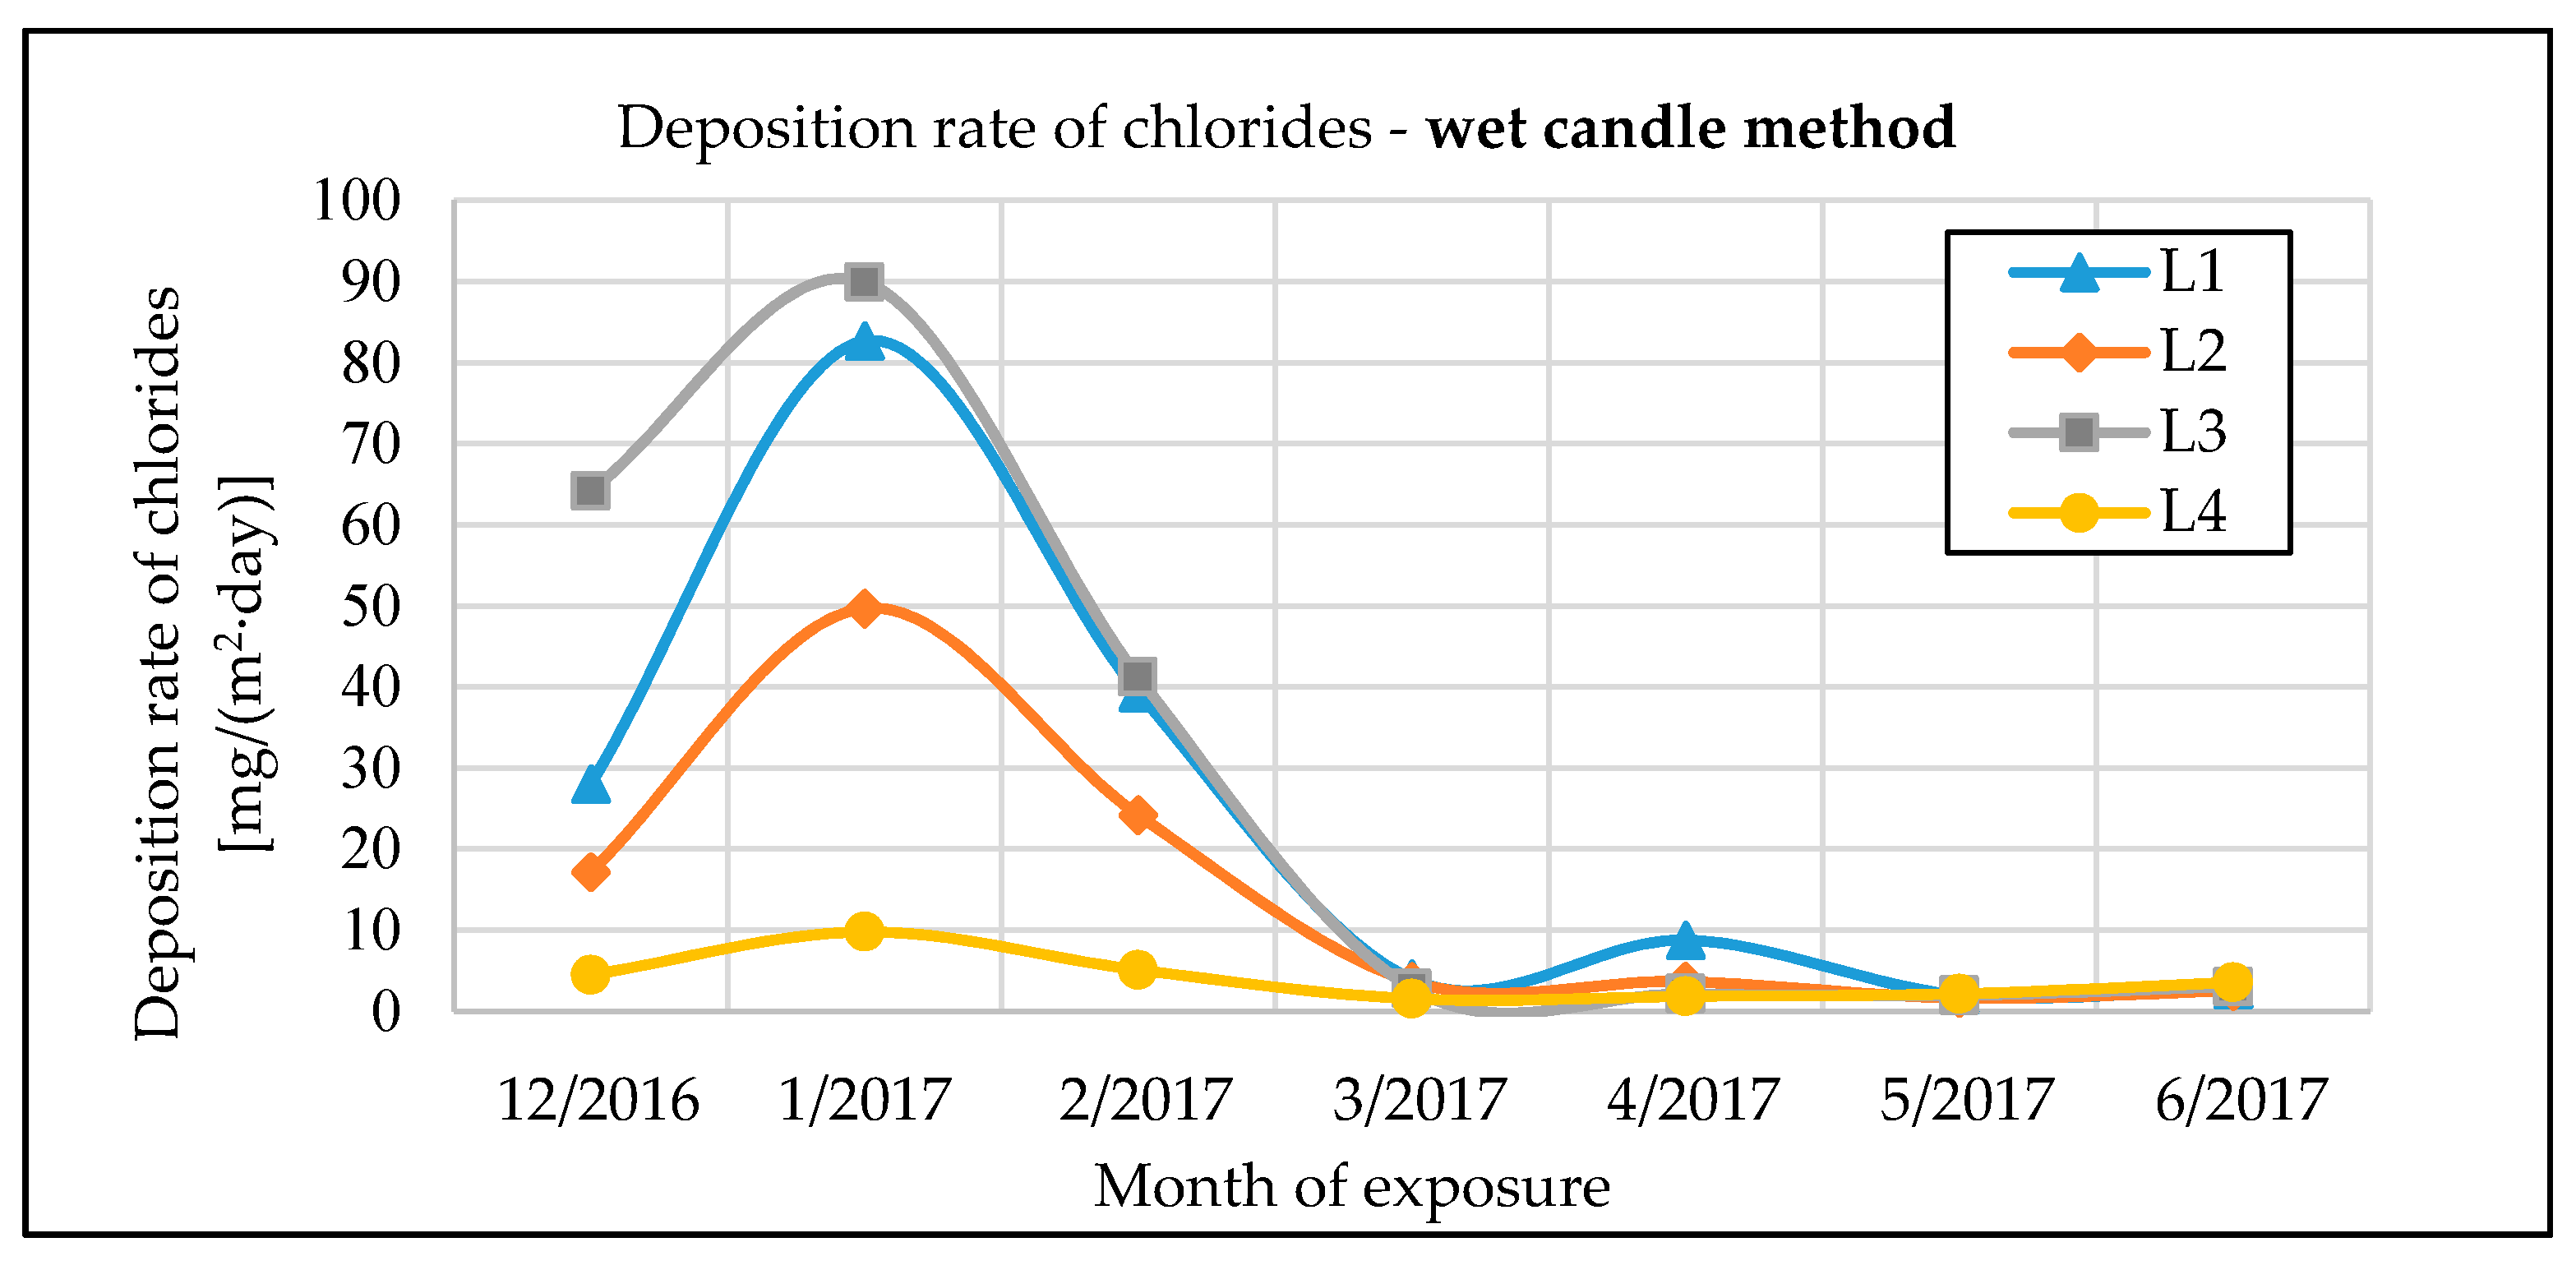
Figure 10.
The chloride deposition rates determined by the dry horizontal plate method.
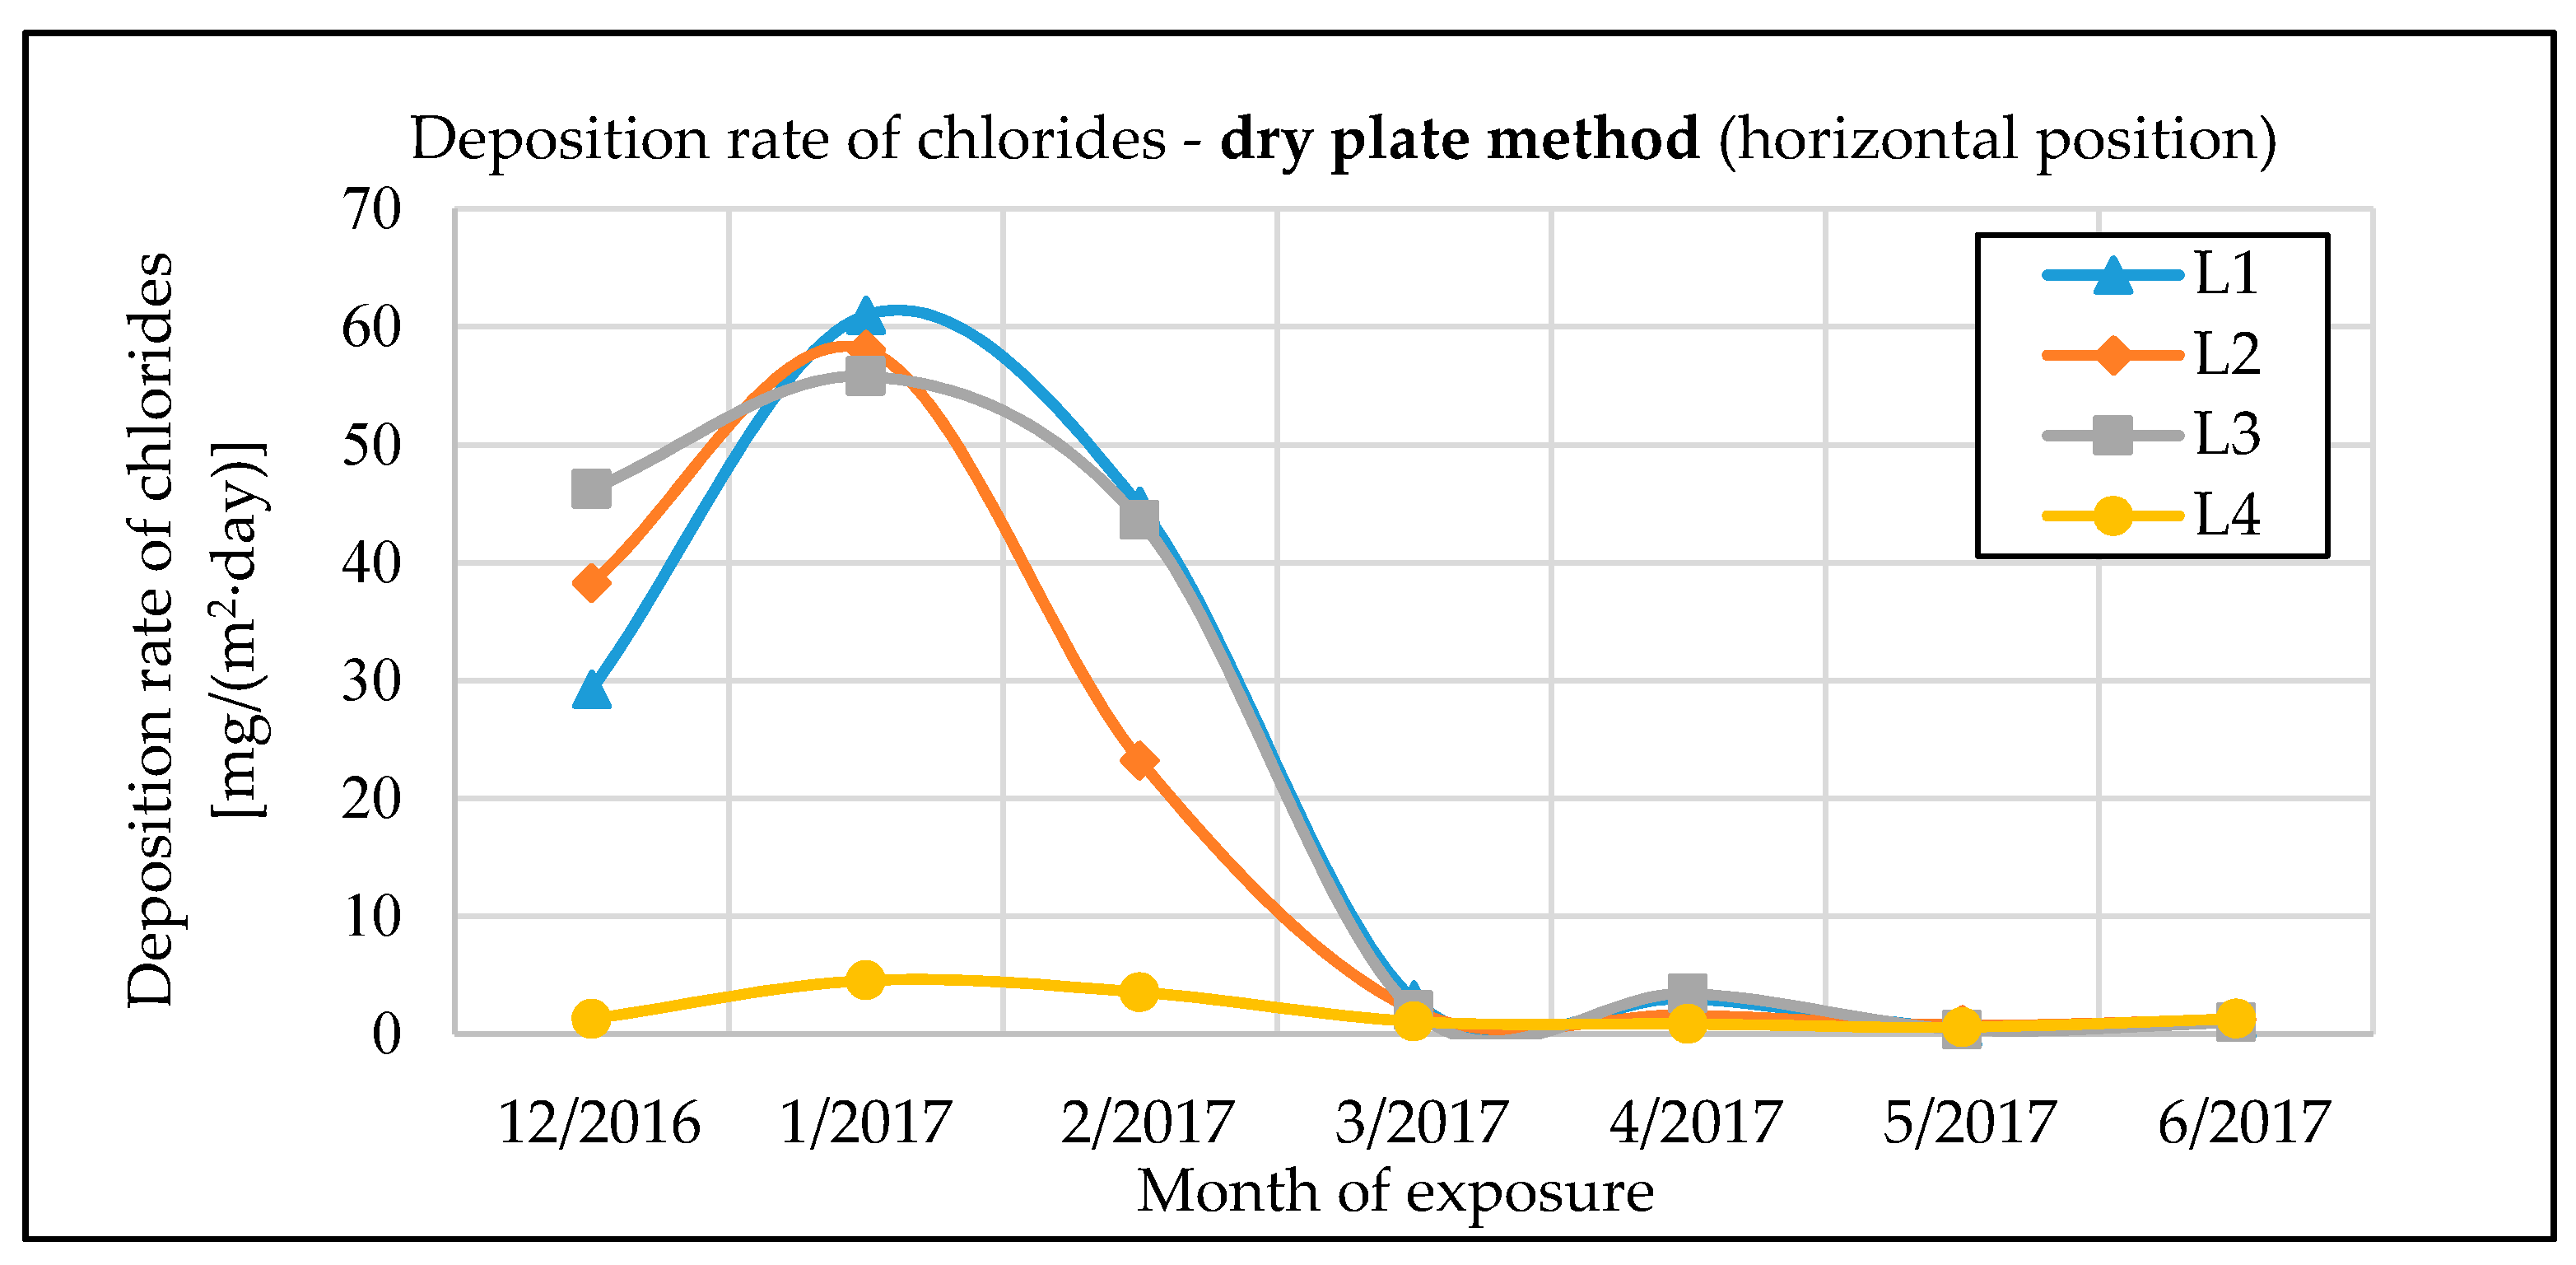
Figure 11.
The chloride deposition rates determined by the dry vertical plate method.


Table 1.
Average thickness of corrosion products tcorr after long-term and 1-year exposure (µm).
| Tested Surface | Tested Bridge Structures | |||
|---|---|---|---|---|
| No. 1 | No. 2 | No. 1 | No. 2 | |
| After Long-Term Exposure | After 1-Year Exposure | |||
| P1—external wall of the main girder (north) | 127.1 | 90.9 | 54.4 | 27.0 |
| P2—external wall of the main girder (south) | 89.9 | 82.4 | 37.5 | 27.0 |
| P3—internal wall of the main girder | 144.3 | 108.9 | 48.5 | 14.2 |
| P4—upper flange of the main girder (bottom surface) | 134.1 | - | 45.6 | - |
| P5—bottom flange of the main girder (external upper surface) | 272.0 | - | 156.0 | - |
| P6—bottom flange of the main girder (internal upper surface) | 700.0 1 | - | 118.1 | - |
| P7—bottom flange of the main girder (bottom surface) | 158.4 | 168.2 | 63.9 | 35.5 |
1 The internal surfaces of the bottom flanges of the main girders have not developed a sufficiently protective corrosion layer. Non-adherent corrosion products are formed which gradually fall off the surface of the flange, see Figure 8.
Table 2.
Corrosion losses after 1 year of exposure rcorr (μm·year−1).
| Tested Surface | Tested Bridge Structures | |
|---|---|---|
| No. 1 | No. 2 | |
| P1—external wall of the main girder (north) | 14.6 | 5.3 |
| P2—external wall of the main girder (south) | 10.5 | 5.3 |
| P3—internal wall of the main girder | 12.0 | 4.0 |
| P4—upper flange of the main girder—bottom surface | 8.5 | - |
| P5—bottom flange of the main girder—external upper surface | 35.2 | - |
| P6—bottom flange of the main girder—internal upper surface | 24.1 | - |
| P7—bottom flange of the main girder—bottom surface | 10.8 | 8.8 |
Table 3.
Composition analysis—samples withdrawn from surfaces of bridge No. 1.
| Tested Surface | Concentration (wt. %) | ||
|---|---|---|---|
| Cl | Si | Al | |
| P1—external wall of the main girder (north) | 1.297 | 2.436 | 0.624 |
| P3—internal wall of the main girder | 1.072 | 0.645 | 0.159 |
| P5—bottom flange of the main girder—external upper surface | 1.152 | 1.811 | 0.498 |
| P6—bottom flange of the main girder—internal upper surface | 2.513 | 6.334 | 1.644 |
Table 4.
X-ray diffraction analysis—samples withdrawn from structures of bridge No. 1.
| Tested Surface | X-ray Diffraction Analysis | PAIα | PAIβ |
|---|---|---|---|
| P1 | strongly goethite, akaganeite and quartz, weakly lepidocrocite | 0.47 | 0.86 |
| P3 | very strongly goethite, weakly lepidocrocite and akaganeite | 0.83 | 0.60 |
| P5 | very strongly goethite, weakly lepidocrocite and akaganeite | 1.09 | 0.60 |
| P6 | very strongly quartz, strongly goethite and akaganeite, very weakly lepidocrocite, weakly limestone CaSO4·2H2O, very weakly muscovite KAl2(Si, Al)4O10(OH)2 | 0.25 | 0.90 |
Table 5.
Composition analysis of corrosion products after one-year exposure—comparison of both bridges.
Table 5.
Composition analysis of corrosion products after one-year exposure—comparison of both bridges.
| Tested Surface | Concentration (wt. %) | ||
|---|---|---|---|
| Cl | Si | Al | |
| bridge No. 1—surface P1 (external wall of the main girder) | 0.311 | 0.329 | 0.168 |
| bridge No. 2—surface P1 (external wall of the main girder) | 0.119 | 0.143 | 0.021 |
Table 6.
Comparison of the average thicknesses of the corrosion layer tcorr measured on the surface of the structure, corrosion rates rcorr and PAIα indexes.
Table 6.
Comparison of the average thicknesses of the corrosion layer tcorr measured on the surface of the structure, corrosion rates rcorr and PAIα indexes.
| Tested Surface | tcorr (μm) | rcorr (μm·year−1) | PAIα |
|---|---|---|---|
| P1—external wall of the main girder (north) | 127.1 | 14.6 | 0.47 |
| P3—internal wall of the main girder | 144.3 | 12.0 | 0.83 |
| P5—bottom flange of the main girder—external upper surface | 272.0 | 35.2 | 1.09 |
| P6—bottom flange of the main girder—internal upper surface | 700.0 | 24.1 | 0.25 |
© 2017 by the authors. Licensee MDPI, Basel, Switzerland. This article is an open access article distributed under the terms and conditions of the Creative Commons Attribution (CC BY) license (http://creativecommons.org/licenses/by/4.0/).
Share and Cite
MDPI and ACS Style
Krivy, V.; Kubzova, M.; Kreislova, K.; Urban, V. Characterization of Corrosion Products on Weathering Steel Bridges Influenced by Chloride Deposition. Metals 2017, 7, 336. https://doi.org/10.3390/met7090336
AMA Style
Krivy V, Kubzova M, Kreislova K, Urban V. Characterization of Corrosion Products on Weathering Steel Bridges Influenced by Chloride Deposition. Metals. 2017; 7(9):336. https://doi.org/10.3390/met7090336
Chicago/Turabian StyleKrivy, Vit, Monika Kubzova, Katerina Kreislova, and Viktor Urban. 2017. "Characterization of Corrosion Products on Weathering Steel Bridges Influenced by Chloride Deposition" Metals 7, no. 9: 336. https://doi.org/10.3390/met7090336
Note that from the first issue of 2016, this journal uses article numbers instead of page numbers. See further details here.