Friction Stir Welding of near α and α + β Titanium Alloys: Metallurgical and Mechanical Characterization


1
University of Washington, Seattle, WA 98195, USA
2
Senior Technical Fellow, The Boeing Company, Seattle, WA 98124, USA
*
Author to whom correspondence should be addressed.
Metals 2017, 7(12), 565; https://doi.org/10.3390/met7120565
Submission received: 19 October 2017
/
Revised: 11 December 2017
/
Accepted: 11 December 2017
/
Published: 14 December 2017
(This article belongs to the Special Issue Recent Achievements in Rotary, Linear and Friction Stir Welding of Metals Alloys)
Abstract
:Butt welds of friction stir welded dissimilar titanium alloys (near α: Ti-6242 standard grain (SG) and ; Ti-54M) were produced for varying processing parameters (rotation speed: rpm and traverse speed; mm·min−1). Microstructures, microhardness, and fractured surfaces were analyzed for three different rpms and mm·min−1 with Ti-6242 SG and Ti-54M kept on the advancing and retreating side, respectively. While constant traverse speed (varying rotation speed) has no significant effect on micrographic patterns in weld nugget, constant rotation speed (with increasing traverse speed) results in an increasing number of streaks with specified spacing (advances per revolution) (consisting of material migrating from retreating side) on the advancing side. Although, hardness variation within streaks (due to lower values of ; where are traverse and rotation speed) were challenging to evaluate, yet hardness maps imitated the micrographic morphology of the weld nugget. For varying rotation (225–325 rpm) and traverse speed (100–150 mm·min−1), corresponding microstructure evolutions on the advancing and retreating side were related, with variations in evolving temperatures for corresponding welding parameters. Fractured surfaces revealed an appearance of a combination of transcrystalline and intercrystalline fracture for all the processing parameters. Nature of solid state joining has been shown with a distinct boundary between Ti-6242 SG and Ti-54M, demonstrating the interlocking between streaks of different aspect ratios of these two alloys.
1. Introduction
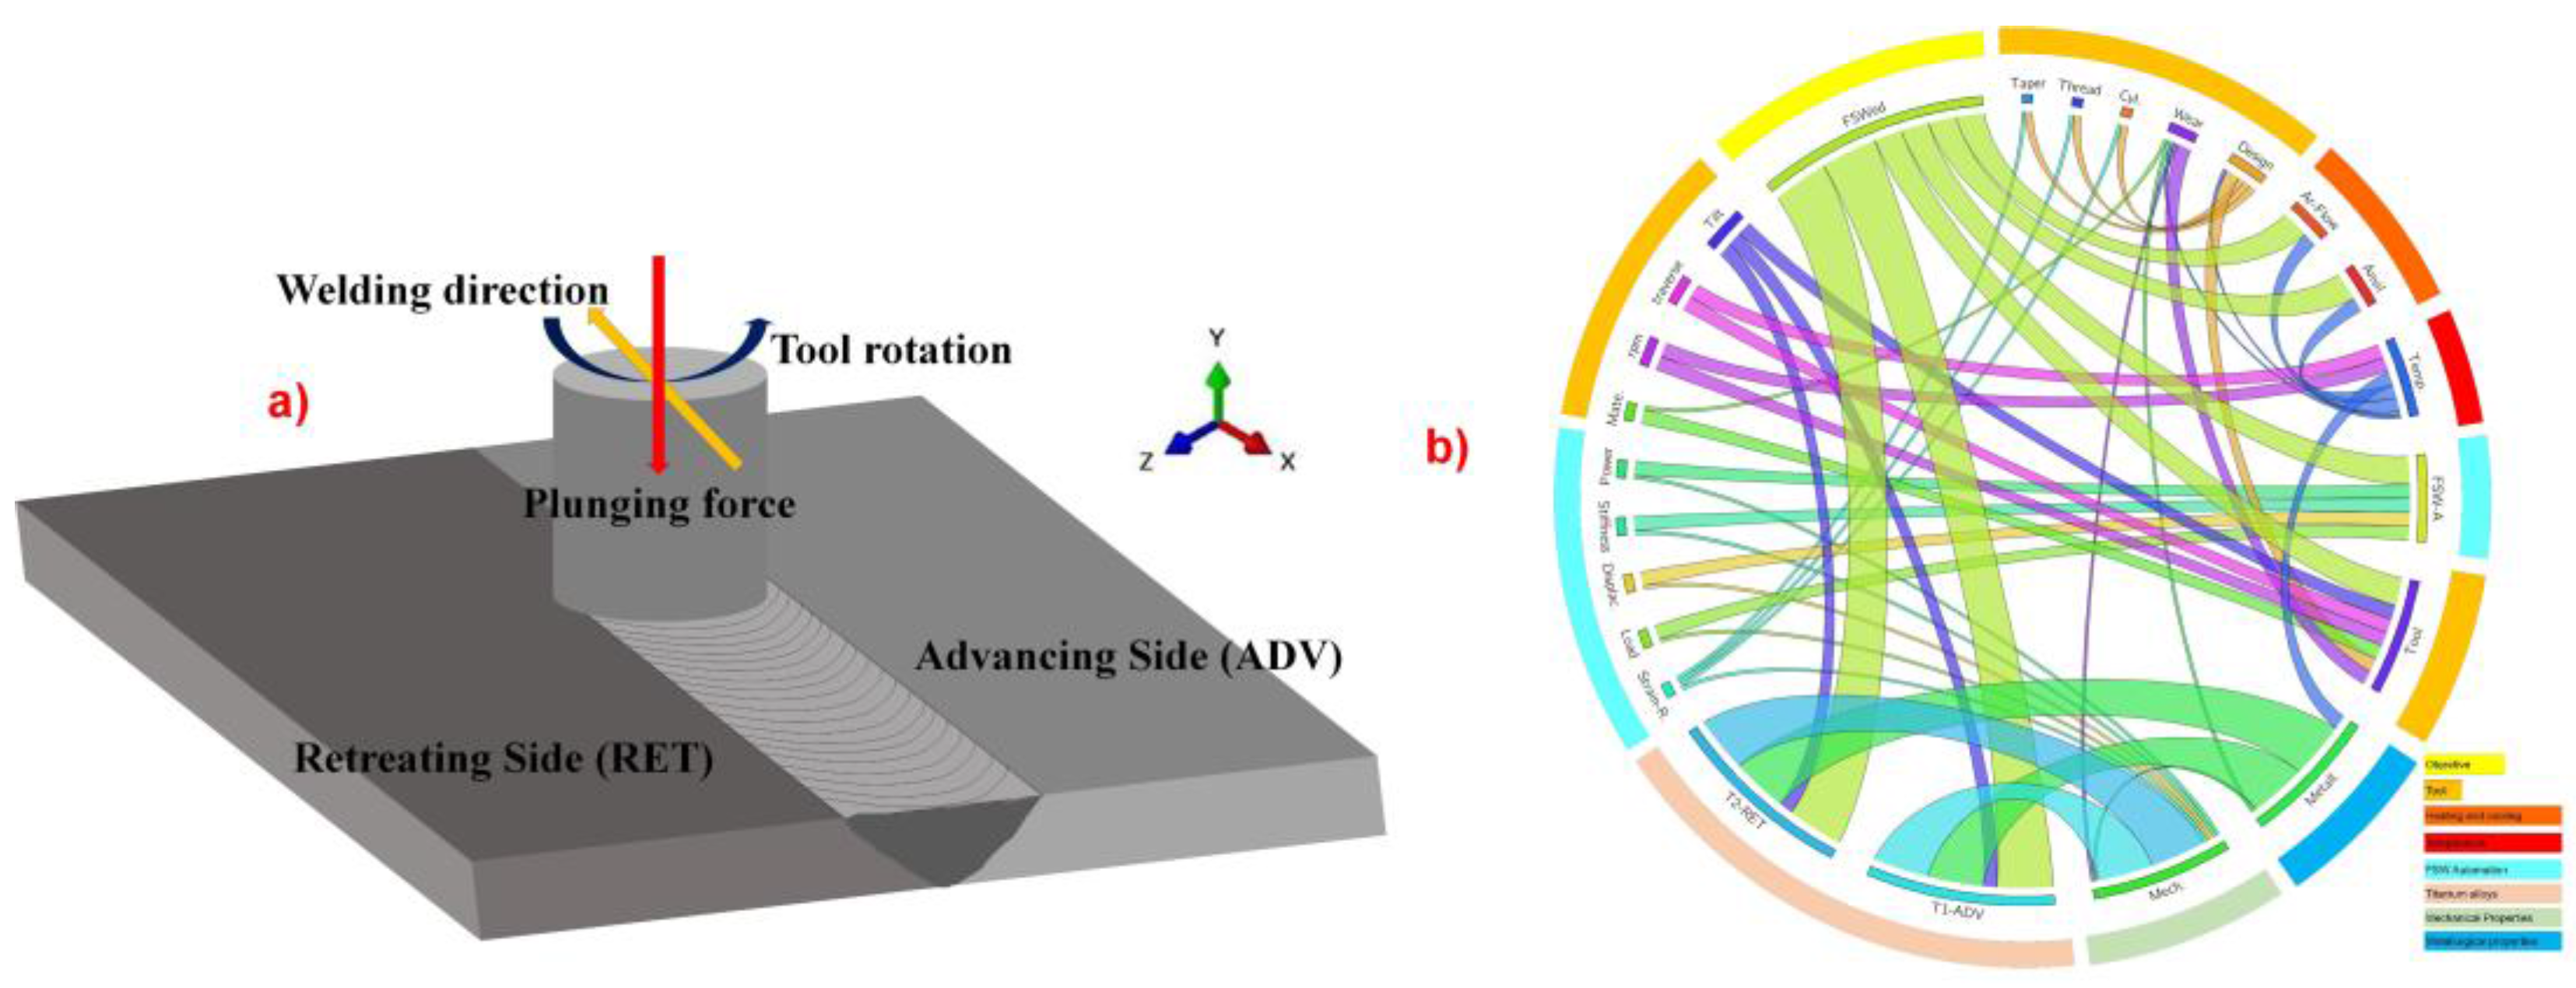
With years of research, developments and improved advances in welding, and automation technology, solid state joining has emerged as a vying method to overcome the detrimental shortcomings of fusion welding. Solid state joining offering welding of similar or dissimilar materials without melting, renders advantages over fusion welding in terms of near absence of intermetallic compounds and porosity. Among numerous friction based solid state joining methods invented in the last two decades, Friction stir welding (FSW) stands out as a novel technique having a unique ability to create various designs that are a combination of butt welds, L and T joints [1]. As the research progressed, since 1991, a variety of metals (similar and dissimilar; ferrous or non-ferrous) have been butt welded or lap-welded by using FSW [2]. Challenges met in the selection of appropriate processing conditions (i.e., tool selection, rotation speed, and traverse speed, load or displacement control) have been met with extreme diligence to overcome the defects such as tearing, hooking, lack of penetration throughout the weld nugget [3,4,5]. The complexity of FSW poses even bigger threat when it comes to titanium alloys due to presence of allotropic phases (α and β) depending on the emerging temperatures, β transus temperature (of titanium alloys), and alloying elements [6,7,8]. Although the existing literature in FSW of titanium alloys avails thorough information on FSWed similar titanium alloys, yet research on FSW of dissimilar titanium alloys remain scanty [9,10,11,12,13,14]. For engineering structures operating under disparate temperatures and loading, not only is it essential to use a combination of dissimilar metals but also to ensure the integrity of structure where these two different metals are either riveted, or welded. This article, in regard with FSW, presents a characterization scheme for metallurgical and mechanical properties to strengthen the existing literature of FSW of titanium alloys. A schematic of FSW and the interdependence of complexity associated with the process of FSW are shown in Figure 1. Figure 1a demonstrates typical schematics of FSW process and notations involving RET and ADV side. Friction stir butt welding is performed by a nonconsumable rotating and traversing, and slightly tilted () tool in the softer material’s side in case of dissimilar materials inserted into the interface at the contiguous line of the metal plates. By means of automated FSW (either displacement controlled or load controlled), tilted tool is then inserted to create a start hole in order to reduce the forces for tool propagation. Accordingly, a backing anvil (either preheated or at room temperature) also needs to be clamped under the welding sheets to provide necessary cooling. As the tool rotates and traverses, severely plasticized material migrates from retreating, to advancing side, and deposits in the wake of the tool. The metal plates are thus joined by the frictional heat between tool shoulder, tool pin, and alloying sheets. The combination of frictional and adiabatic localized heating in the fusion zone softens the material promoting the material flow around the rotating tool. The interdependence of FSW parameters as shown in Figure 1b suggests that any slight change in any of the parameters will have an effect of microstructure and mechanical properties of FSWed structure. For instance, if alterations in automation of FSW (FSW-A) were permissible (either machine stiffness, or load/displacement control mechanism), it can eventually affect the mechanical properties in general terms. Therefore, each parameter remains of importance and careful considerations in FSW. Additionally, if parameter β transus (for titanium alloys) were to be included in Figure 1b, the network of interdependence would have been even denser and far more complex for FSW of titanium alloys. The list of abbreviations for terms used in Figure 1b is shown in Table 1.
Since the complexity of FSW is significant, with application of this technique for titanium alloys, the challenge is even bigger if not met with dexterity in processing parameters resulting in undesirable microstructure and unfavorable mechanical properties. Furthermore, to make the matter more interesting, if dissimilar titanium alloys are used utmost care must be taken and improvised while selecting the processing parameters. For instance, one set of parameters might give us desirable microstructure and mechanical properties if T1 (an alloy of titanium), and T2 (another alloy o titanium) were kept on ADV and RET side respectively. However, if an identical set of parameters were adopted for same combination of titanium alloys with reverse position (i.e., T1 and T2 on RET and ADV side respectively), changes in structure and properties are not only inevitable but also could be undesirable and unfavorable. Therefore, in light of such occurrences two fundamental needs arise:
- (1)
- Selection of processing parameters
- (2)
- Selection of titanium alloys
There are only few studies available that have tackled these issues in detail to understand the versatility of FSW for dissimilar titanium alloys. While structure and properties are discussed in detail, a correlation with the processing parameters, individual transus temperature, microstructure and mechanical properties is nonexistent. Gonser et al. have presented a detailed characterization of -21S and Ti-6Al-4V in terms of microstructure, phase, and evolution of texture [16]. However, the global characteristics are yet to be understood to utilize this technique more effectively for selected titanium alloys.
Under such restricted applicability and narrow operation window for predetermined performance of FSWed structures, it is essential to explore as many avenues as possible to obtain a thorough understanding of underlying concepts of FSW of dissimilar titanium alloys. Presented results in this article create a nexus between processing parameters, peak temperatures, transus temperatures of both alloys, microstructure and mechanical properties. It is our belief that these results, however, not transferrable to other titanium alloys or even to the same combination of titanium alloys with interchanged positions, can be used to understand the effect of processing parameters on structure and properties. Novelty of this research lies in correlating the solid state joining to interlocking of different plates in WN under effect of different transus temperatures with evolving microstructure and global tensile response of FSWed specimens for selected processing parameters. Furthermore, the results for microstructures and microhardness are presented in conjunction with diffusivity of either -stabilizer or -stablizer in corresponding phases and macrographic appearances in and around WN.
In this article, a combination of near α (on the ADV side; Ti-6242 SG) and α + β (on the RET side; Ti-54M) alloys are FSWed and has been characterized for microstructure, microhardness, and fracture morphology. Crescent (of various shapes sizes and spacing) like macrographs have been observed for all adopted processing parameters. Heterogeneity in thermal and microstructure gradient makes it difficult to elucidate the microstructures at multiple locations, yet the microhardness profiles revealed a significant difference in the streaking patterns of material migrating from retreating (RET) side to advancing (ADV) side.
2. Materials and Methods
The materials used in this investigation are Ti-6Al-2Mo-4Zr-2Sn (near ), Ti-5Al-4V titanium alloys with an average grain size of and respectively. Chemical composition by wt % of these two alloys is shown in Table 2.
2.1. Friction Stir Welding
Plates of dimensions were butt-welded producing welded panel of dimension. Tapered tool dimensions (Shoulder diameter; Sd, Pin diameter (attached to shoulder; Pd) and (root diameter; Pr)) were such that negligible thinning of sheets has been observed for the WN. The friction stir welding of the specimen was performed at Boeing facility located in Auburn, Washington by The Boeing Company. The welding parameters used to produce joints are listed in Table 3 along with plate notation used in this article [17].
While the tool dimensions remain subjected to the information considered as proprietary, the typical tool profile (conical pin, and narrow shoulder made of tungsten–anthanum (W–La)) is shown here [18]. All welds were made on a W–La backing anvil that was initially at the room temperature. In addition to controlled flow of inert gas (Argon), the weld pin and anvil were water cooled to prevent overheating of the tool and to provide a degree of thermal management within the weld itself. Depending on tool rotation speed (responsible for peak temperatures), and traverse speed (responsible for exposure of these temperatures) a variety of microstructures have been observed in and around WN.
2.2. Metallography
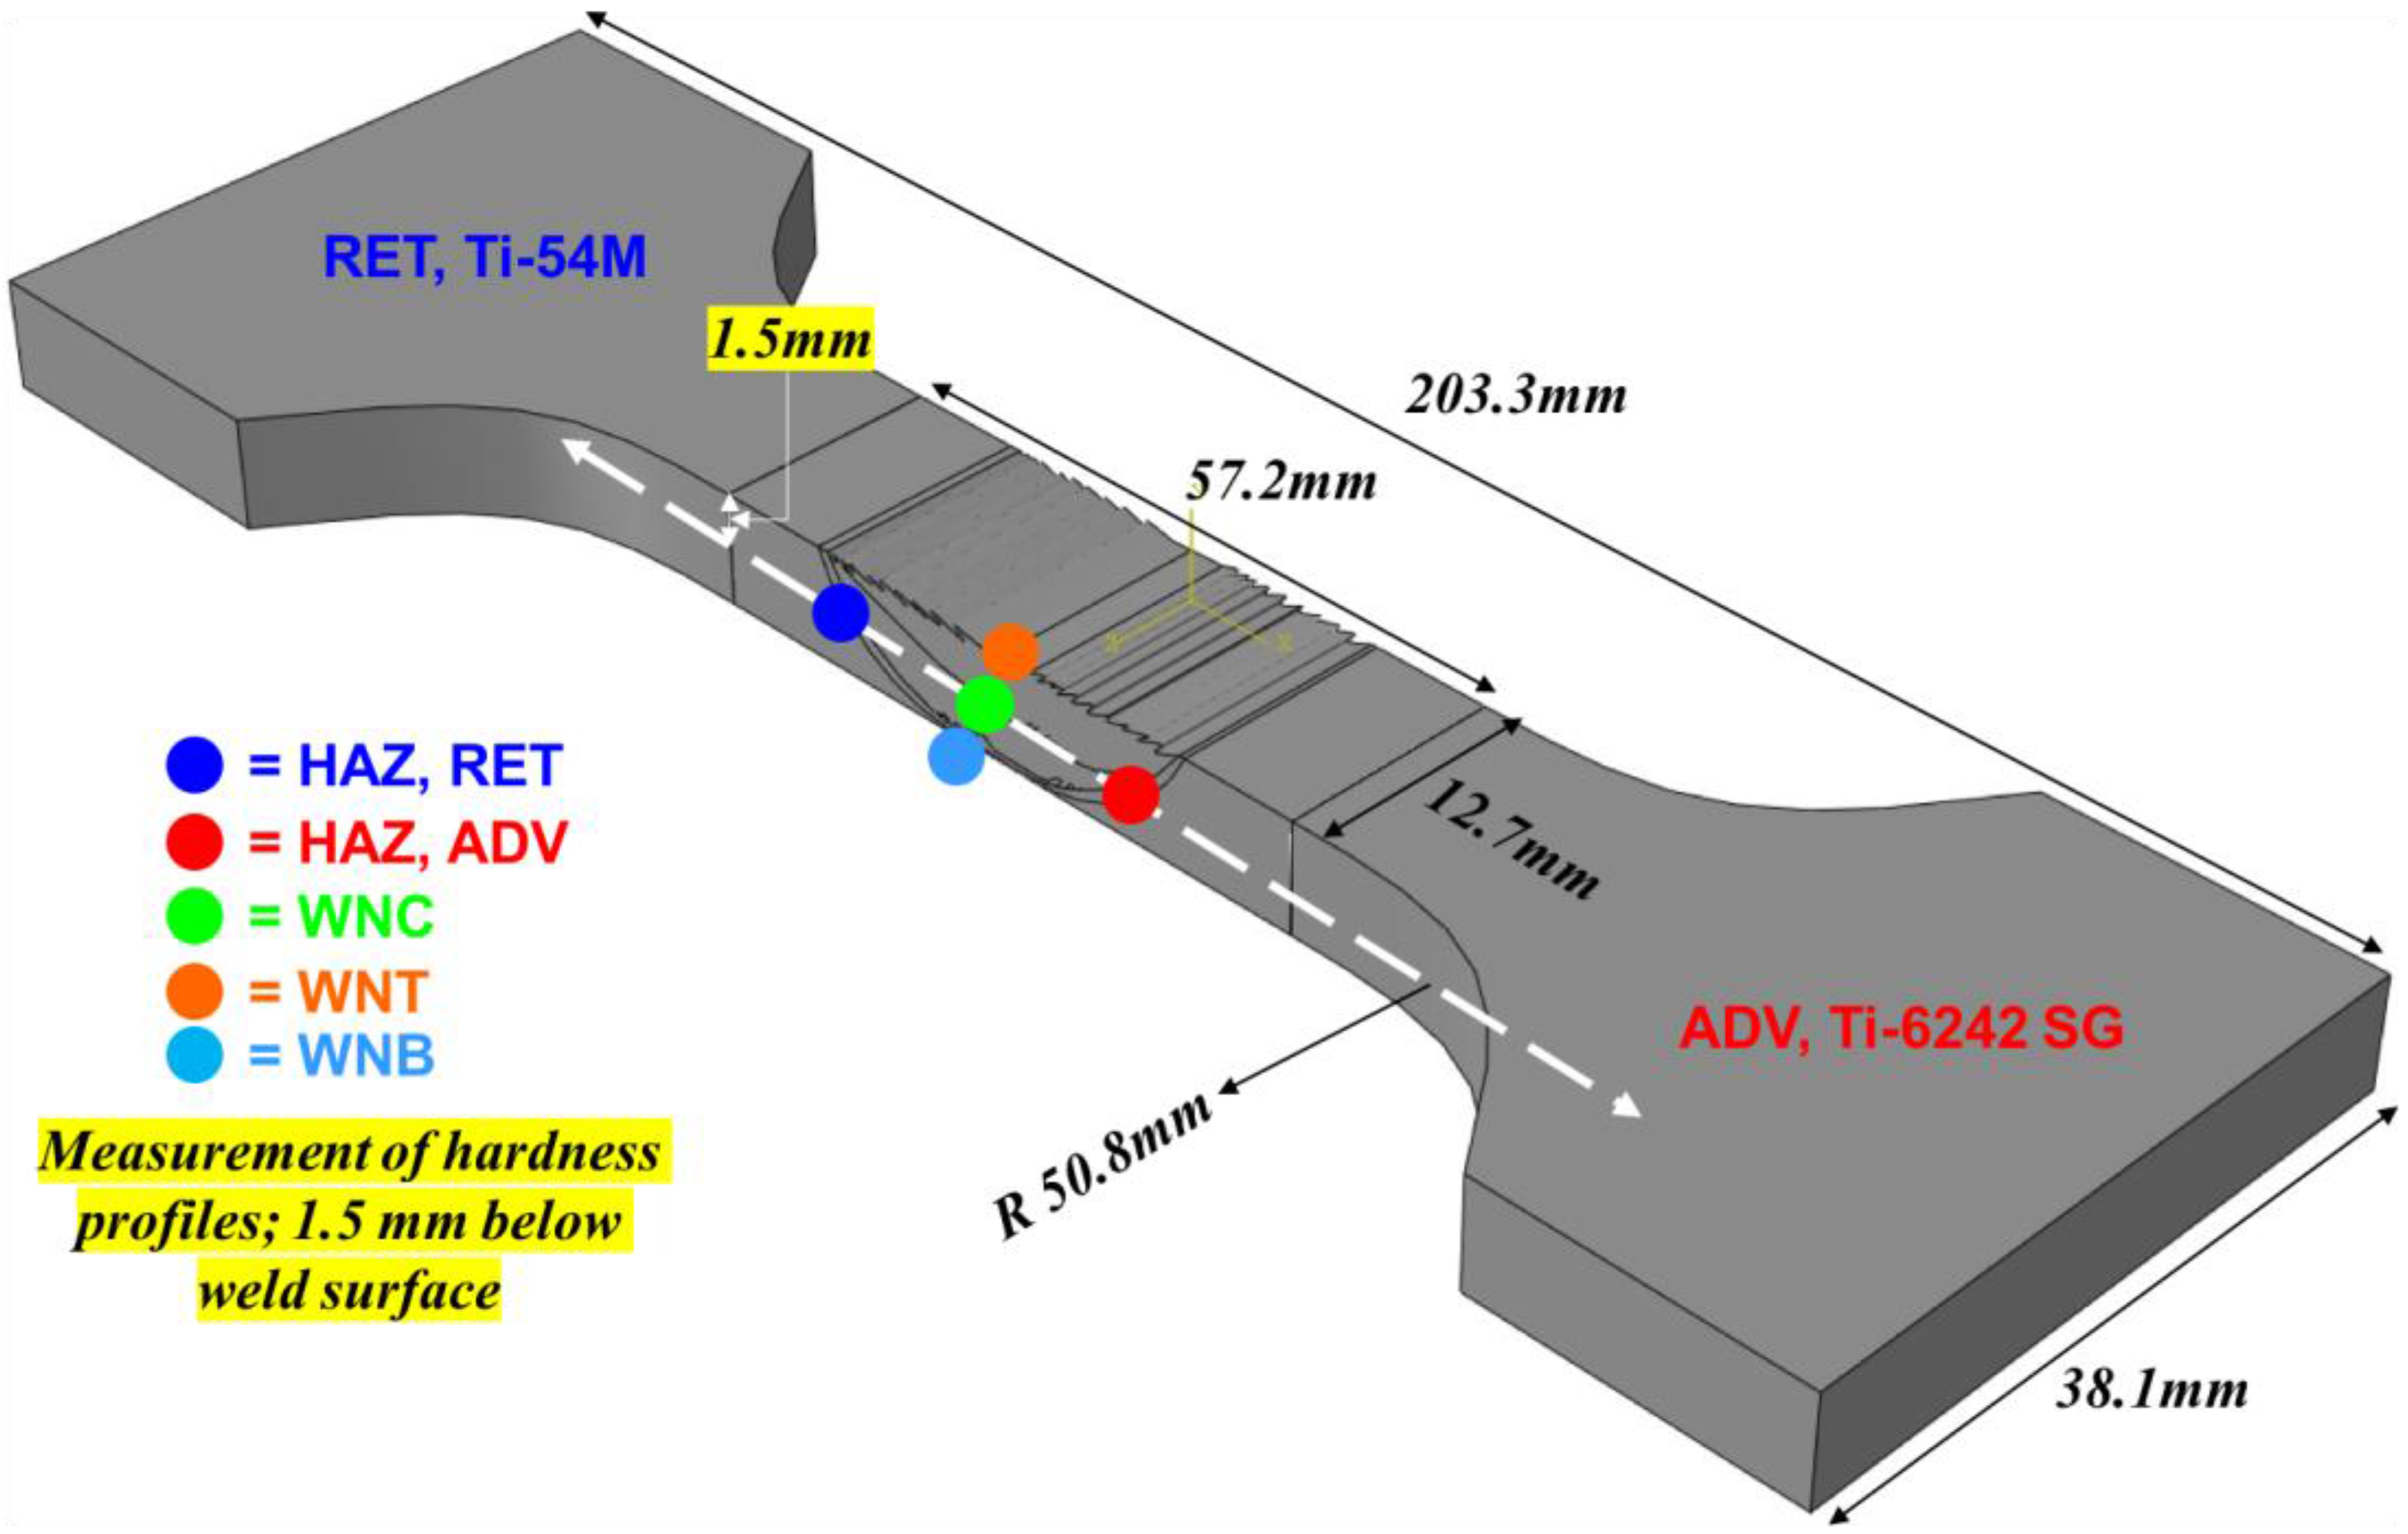
Macrostructures of transverse cross section of welds were captured for characterization of any void, porosity, tear or hook like defect in the WN. For microstructural analysis, all specimens were polished on alumina oxide () polishing wheels and then etched using Kroll’s reagent. Emergence of streaks within WN and on the ADV side is subjected to processing parameters. A typical schematic of FSWed dissimilar titanium alloys (325 rpm and 125 mm·min−1) along with specified tensile specimen geometry is shown in Figure 2. Corresponding locations for microstructural analysis are also shown. WN (T, C and B) represent weld nugget top, center and bottom respectively. HAZ on ADV and RET side represent heat affected zone on advancing and retreating side respectively.
2.3. Mechanical Properties
Vickers hardness (HV) (load: 300 g; dwell time: 13 s) on the transverse cross section of the weld was measured using an automated LECO AMH 43 Microhardness Testing System. The distance between any two indents (horizontal and vertical) was kept constant; with a total of 1920 indents on the transverse cross section of 5 thick welded sheets.
Tensile specimens were extracted from the welded sheets (as shown in Figure 2) by using water jet machining. The dimensions of the tensile specimens are in accordance with ASTM E8. All tests were conducted under displacement control at a constant cross head extension speed of 1.27 mm·min−1.
Specimens for fractographic analysis were extracted from transverse tensile specimens and fractured surfaces were observed in FEI-Sirion-XL30 located in the Molecular Engineering & Sciences Building at University of Washington, Seattle campus. Prior to observation, all the specimens were cleaned in acetone in ultrasonic bath for approximately 10 min at a lowest frequency to avoid any damage to the fractured surface.
3. Results
3.1. Weld Surfaces
The top surface of butt welds for a combination of five different processing conditions are shown in Figure 3. As can be seen that for adopted processing and environmental (Ar gas shielded chamber) conditions, a relatively smoother surface, with nearly consistent tool marks has been observed in all the cases. However, upon closer look we can see some inconsistency in tool spacing on the ADV side, in case of P5 (lowest rotation speed), and P4 (lowest traverse speed). As the values of processing parameters increase, rather better surface with uniform tool marks spacing has been achieved. Furthermore, from the appearance of the welded surface we can also say that weld surface with highest traverse speed, P2 has resulted into the most consistent tool marks on both RET and ADV side. Since, migration of material is from RET to ADV side, resulting tool marks on the ADV side are more inconsistent in comparison with what we observe on the RET side for either case. For lowest rotation speed (P5) this inconsistency in the tool marks on ADV side results in periodic spacing. Conversely, for lowest traverse speed the inconsistency in tool marks is spread sporadically. Among all the welded panels, P2 is best weld in terms of appearance and surface regularities on either side of the WN.
3.2. Macrographs
Typical macrographs for welded panels on the transverse cross sections are shown in Figure 4. Material flow, from RET to ADV side is dominant in all the cases. Under the effect of either rpm or mm·min−1, it is inevitable to consider not only shear forces on RET and ADV sides but also an ability of material migrating from RET side (Ti-54M in our case) to penetrate on the ADV side (Ti-6242 SG in our case) while interlocking to create a solid-state joint. While these phenomena set the ground for macrographic appearances, evolution of microstructures is far more complex and is a result of different transus temperatures. Considering a constant traverse speed case (varying rotation speed P5 < P1 < P3) we can see a thinning behavior in the streaks of Ti-54M migrating from RET to ADV side. For the case of constant rotation speed, we can observe a continuous spread of Ti-54M from RET to ADV as the traverse speed is increasing (P4 < P1 < P2). For all the cases defect free welds have been observed confirming the suitable adaptation of these processing conditions for the combination of aforementioned 5 mm thick sheets of titanium alloys. Nearly, uniform thickness of WN has been achieved indicating negligible thinning of welded panels with appropriate adopted tapered tool design. The parabolic shape of the WN (of lighter shades in appearance) projects different morphology of streaks on the ADV. An electron dispersive spectroscopy (EDS) study conducted on material migration shows that these streaks are migrating from RET side, and consist of Ti-54M. Shape, and size of streaks depend on processing conditions i.e., rotation speed (rpm) and traverse speed (mm·min−1). Considering two extreme cases; P3 (highest rotation speed), and P2 (highest traverse speed), we can see an interesting pattern of Ti-54M being interlocked with plates of Ti-6242 SG on the ADV side.
For the case of highest rotation speed (P3) the migrating material from RET to ADV side, deposits in form of bands with secondary streaks emerging at multiple locations on the band. While, for highest traverse speed (P2) Ti-54M is uniformly distributed on the ADV side under the assumption that advances per revolution; , however, an ability of Ti-54M to penetrate Ti-6242 SG determines the extent of uniformity of these streaks of Ti-54M on the advancing side. Therefore, no conclusive remarks about the aspect ratio (width:length) of these streaks can be made at this point. Additionally, due to differences in the alloying compositions, it is likely that at a given location and temperature () the diffusivity of either of stablizers (aluminum and oxygen) or of stablizers (molybdenum and vanadium) is such that emerging phases () are rich with their corresponding stabilizers. Furthermore, differences in diffusion flux (dependent on) of these alloying elements may result in different microstructure in neighboring streaks. Additionally, due to material flow, peak temperatures, cooling scheme and poor thermal conductivity of titanium we can see that near WN interface on ADV side, these streaks are rather thinner in comparison with what have been observed in the center of WN on the ADV side.
3.3. Microstructures
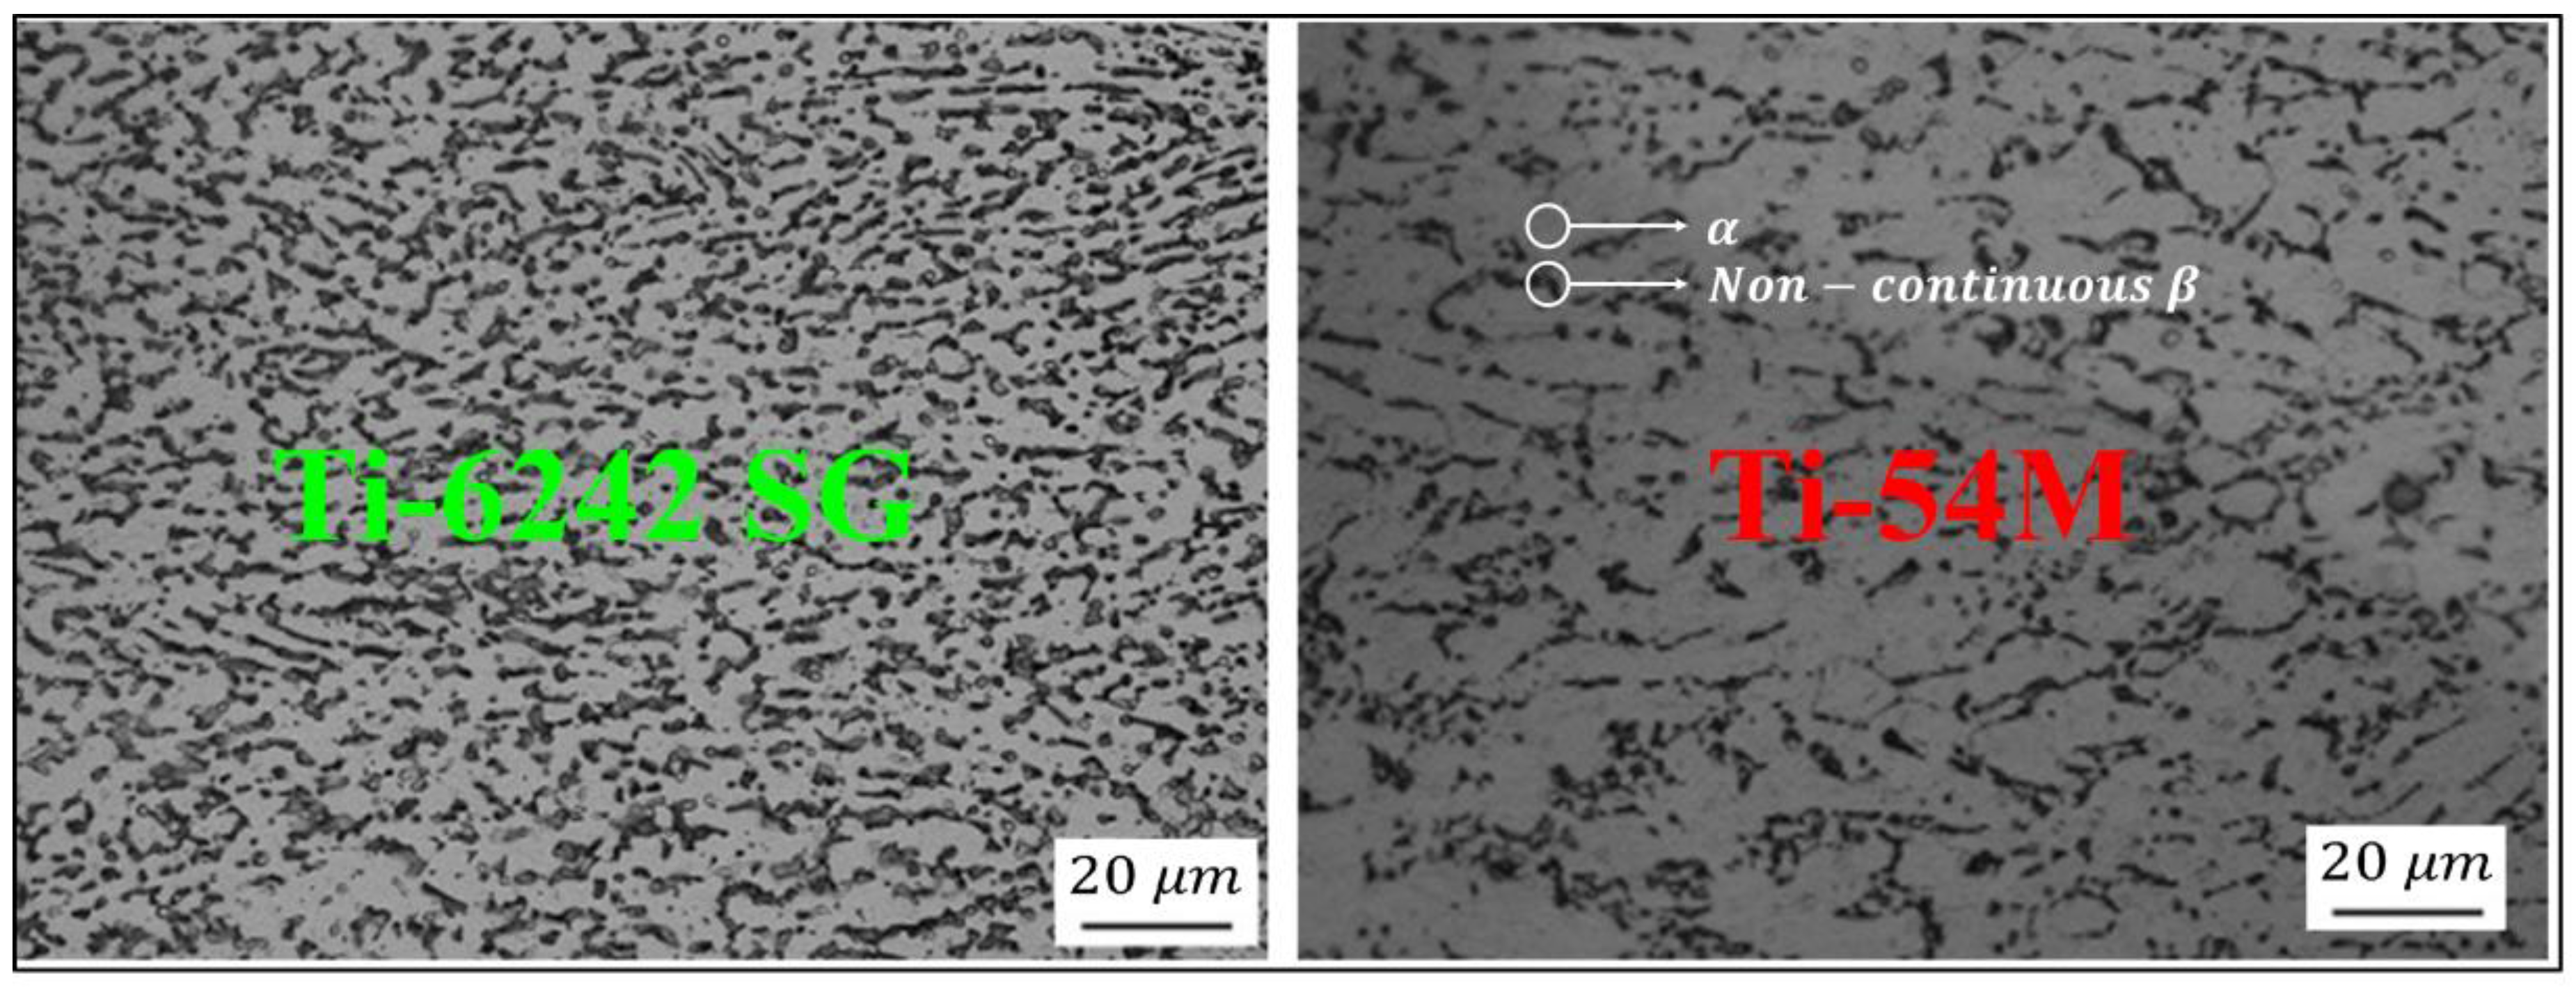
Microstructures of base materials (as shown in Figure 5); Ti-6242 SG, and Ti-54M is primary α infused with intergranular β, and equiaxed grains of with along the grain boundaries respectively.
In general, microstructures on the RET and ADV side revealed bimodal, refined α respectively. In the center (CEN) of weld nugget (WN), majority of microstructure is acicular with a varying prior β grain sizes. Hardness values in the WN were higher in comparison with base material (BM) on either side. From a broad perspective, it has been demonstrated that fracture in general occurs on the ADV side of the weld with an appearance of either transcrystalline or intercrystalline structures [19]. For highest rotation speed corresponding with highest peak temperature, lamella microstructure in conjunction with untransformed has been observed. For lowest rotation speed, refined grains of have been observed in Ti-6242 while in Ti-54, microstructure evolved from to refined prior grains of . Macrographic appearance of WN is significantly different for each varying parameter while keeping the other parameter constant.
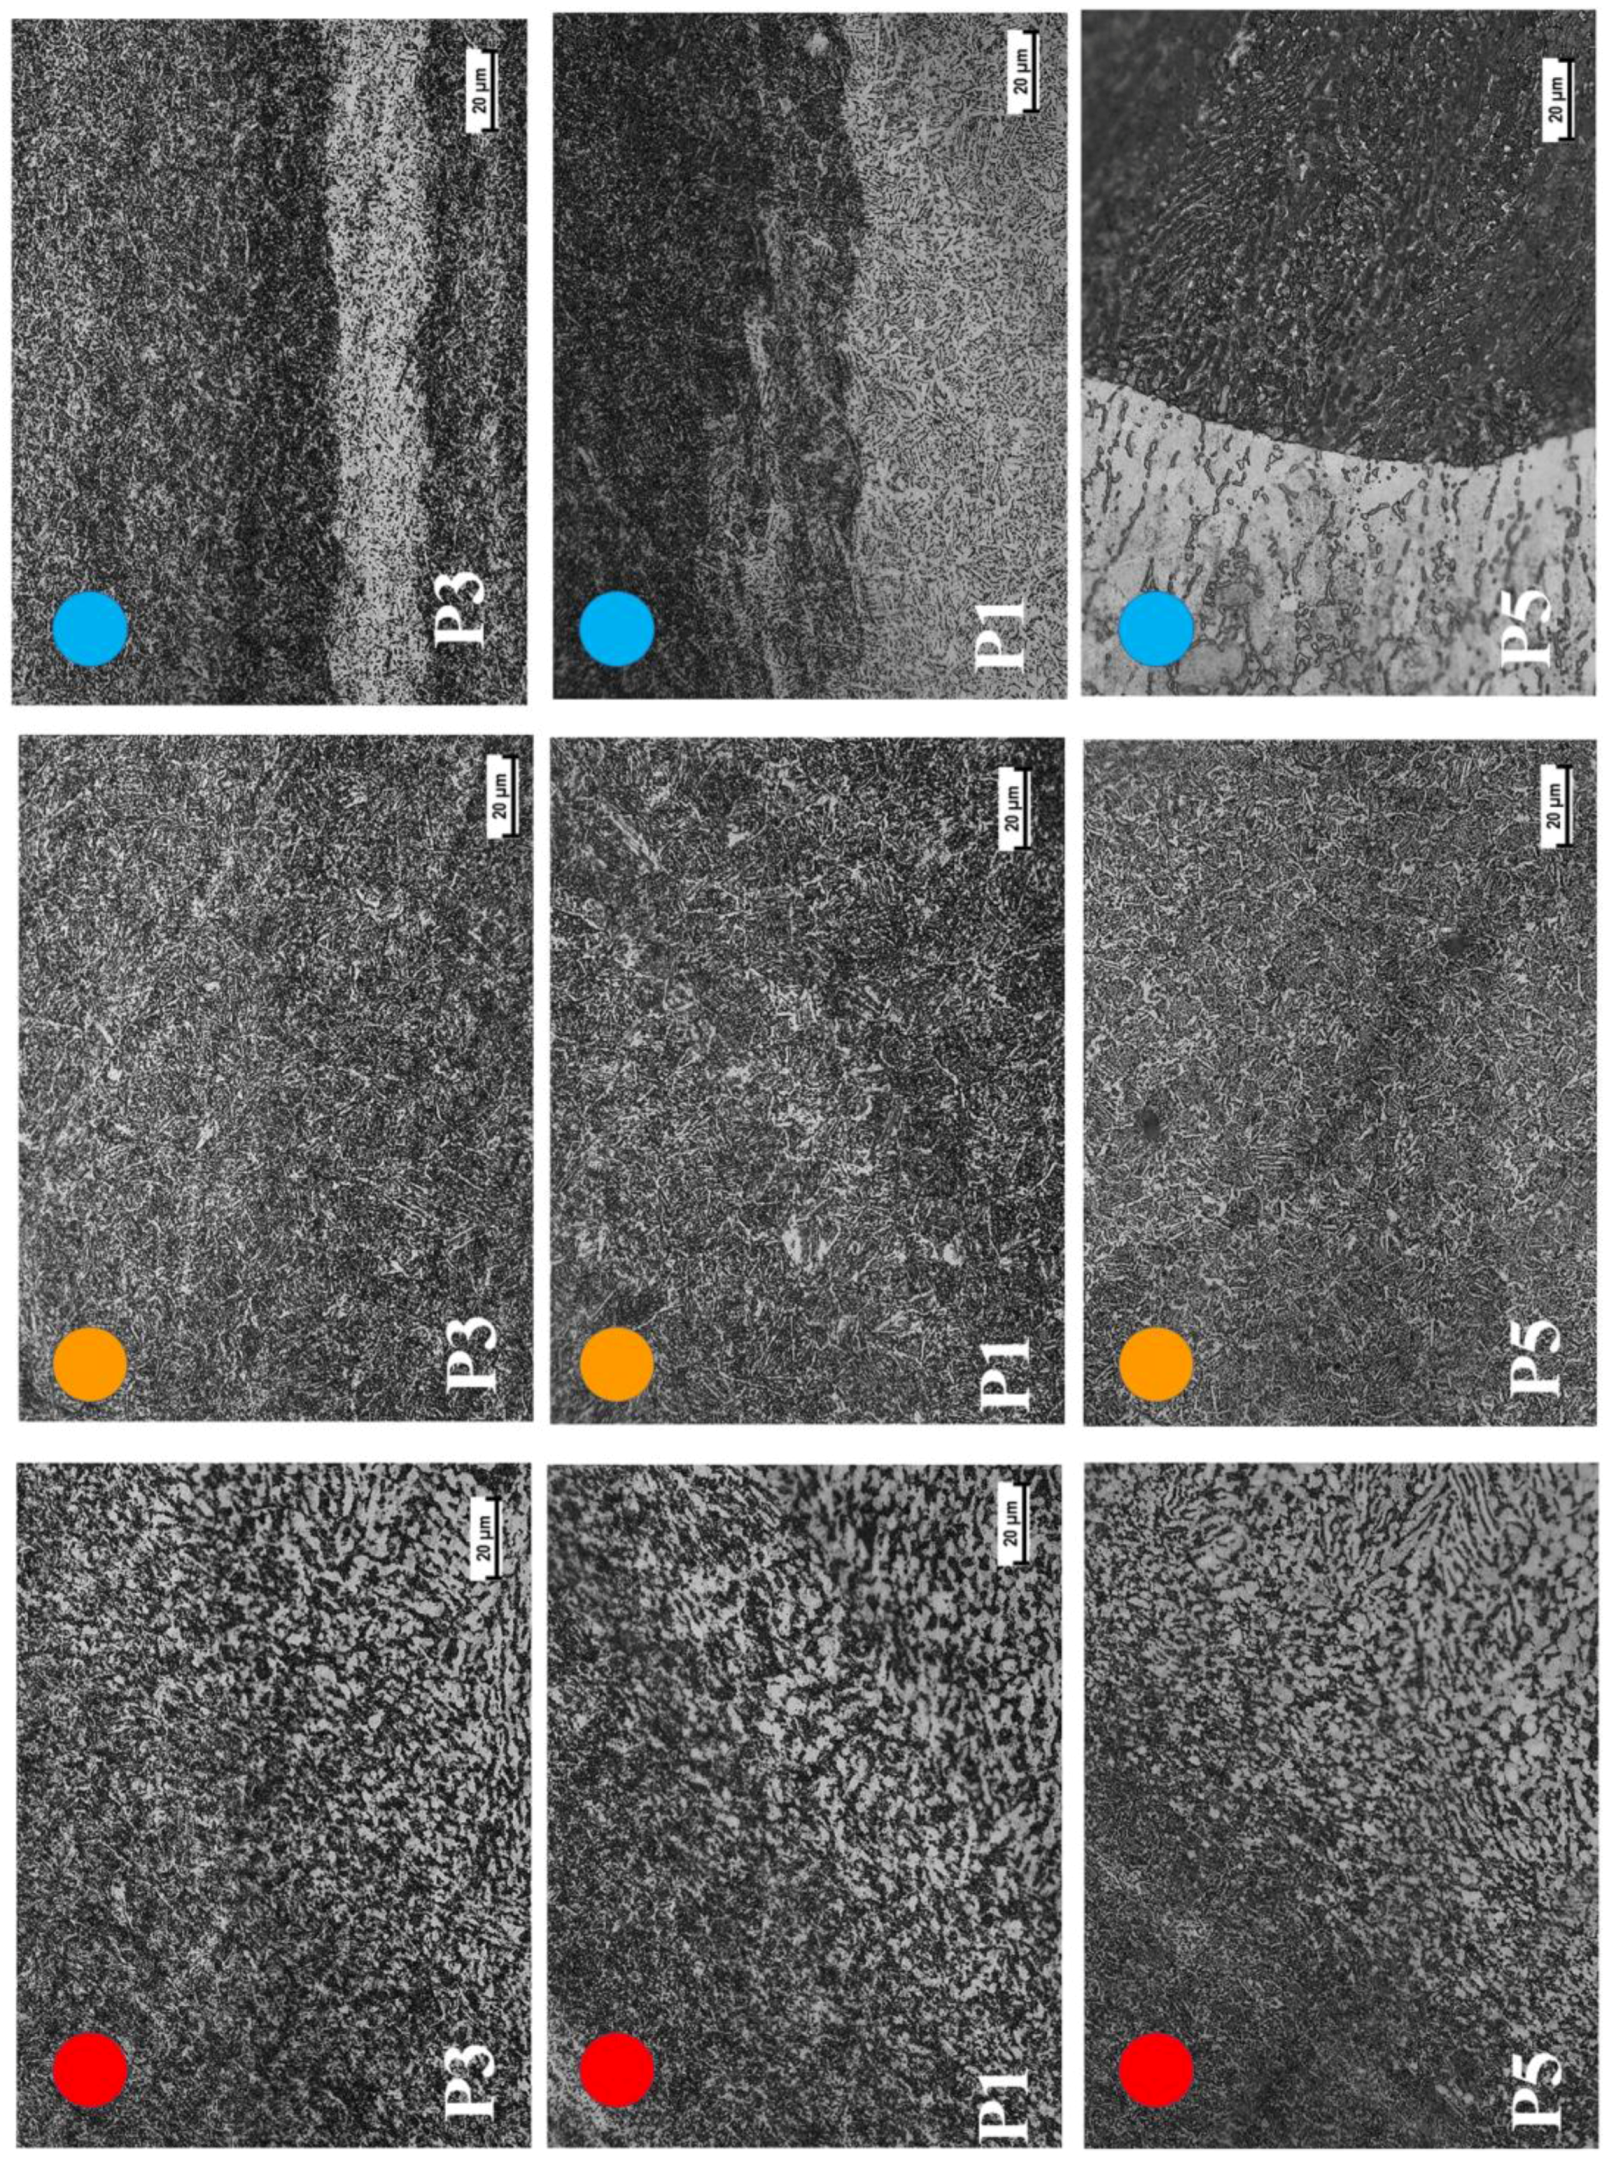
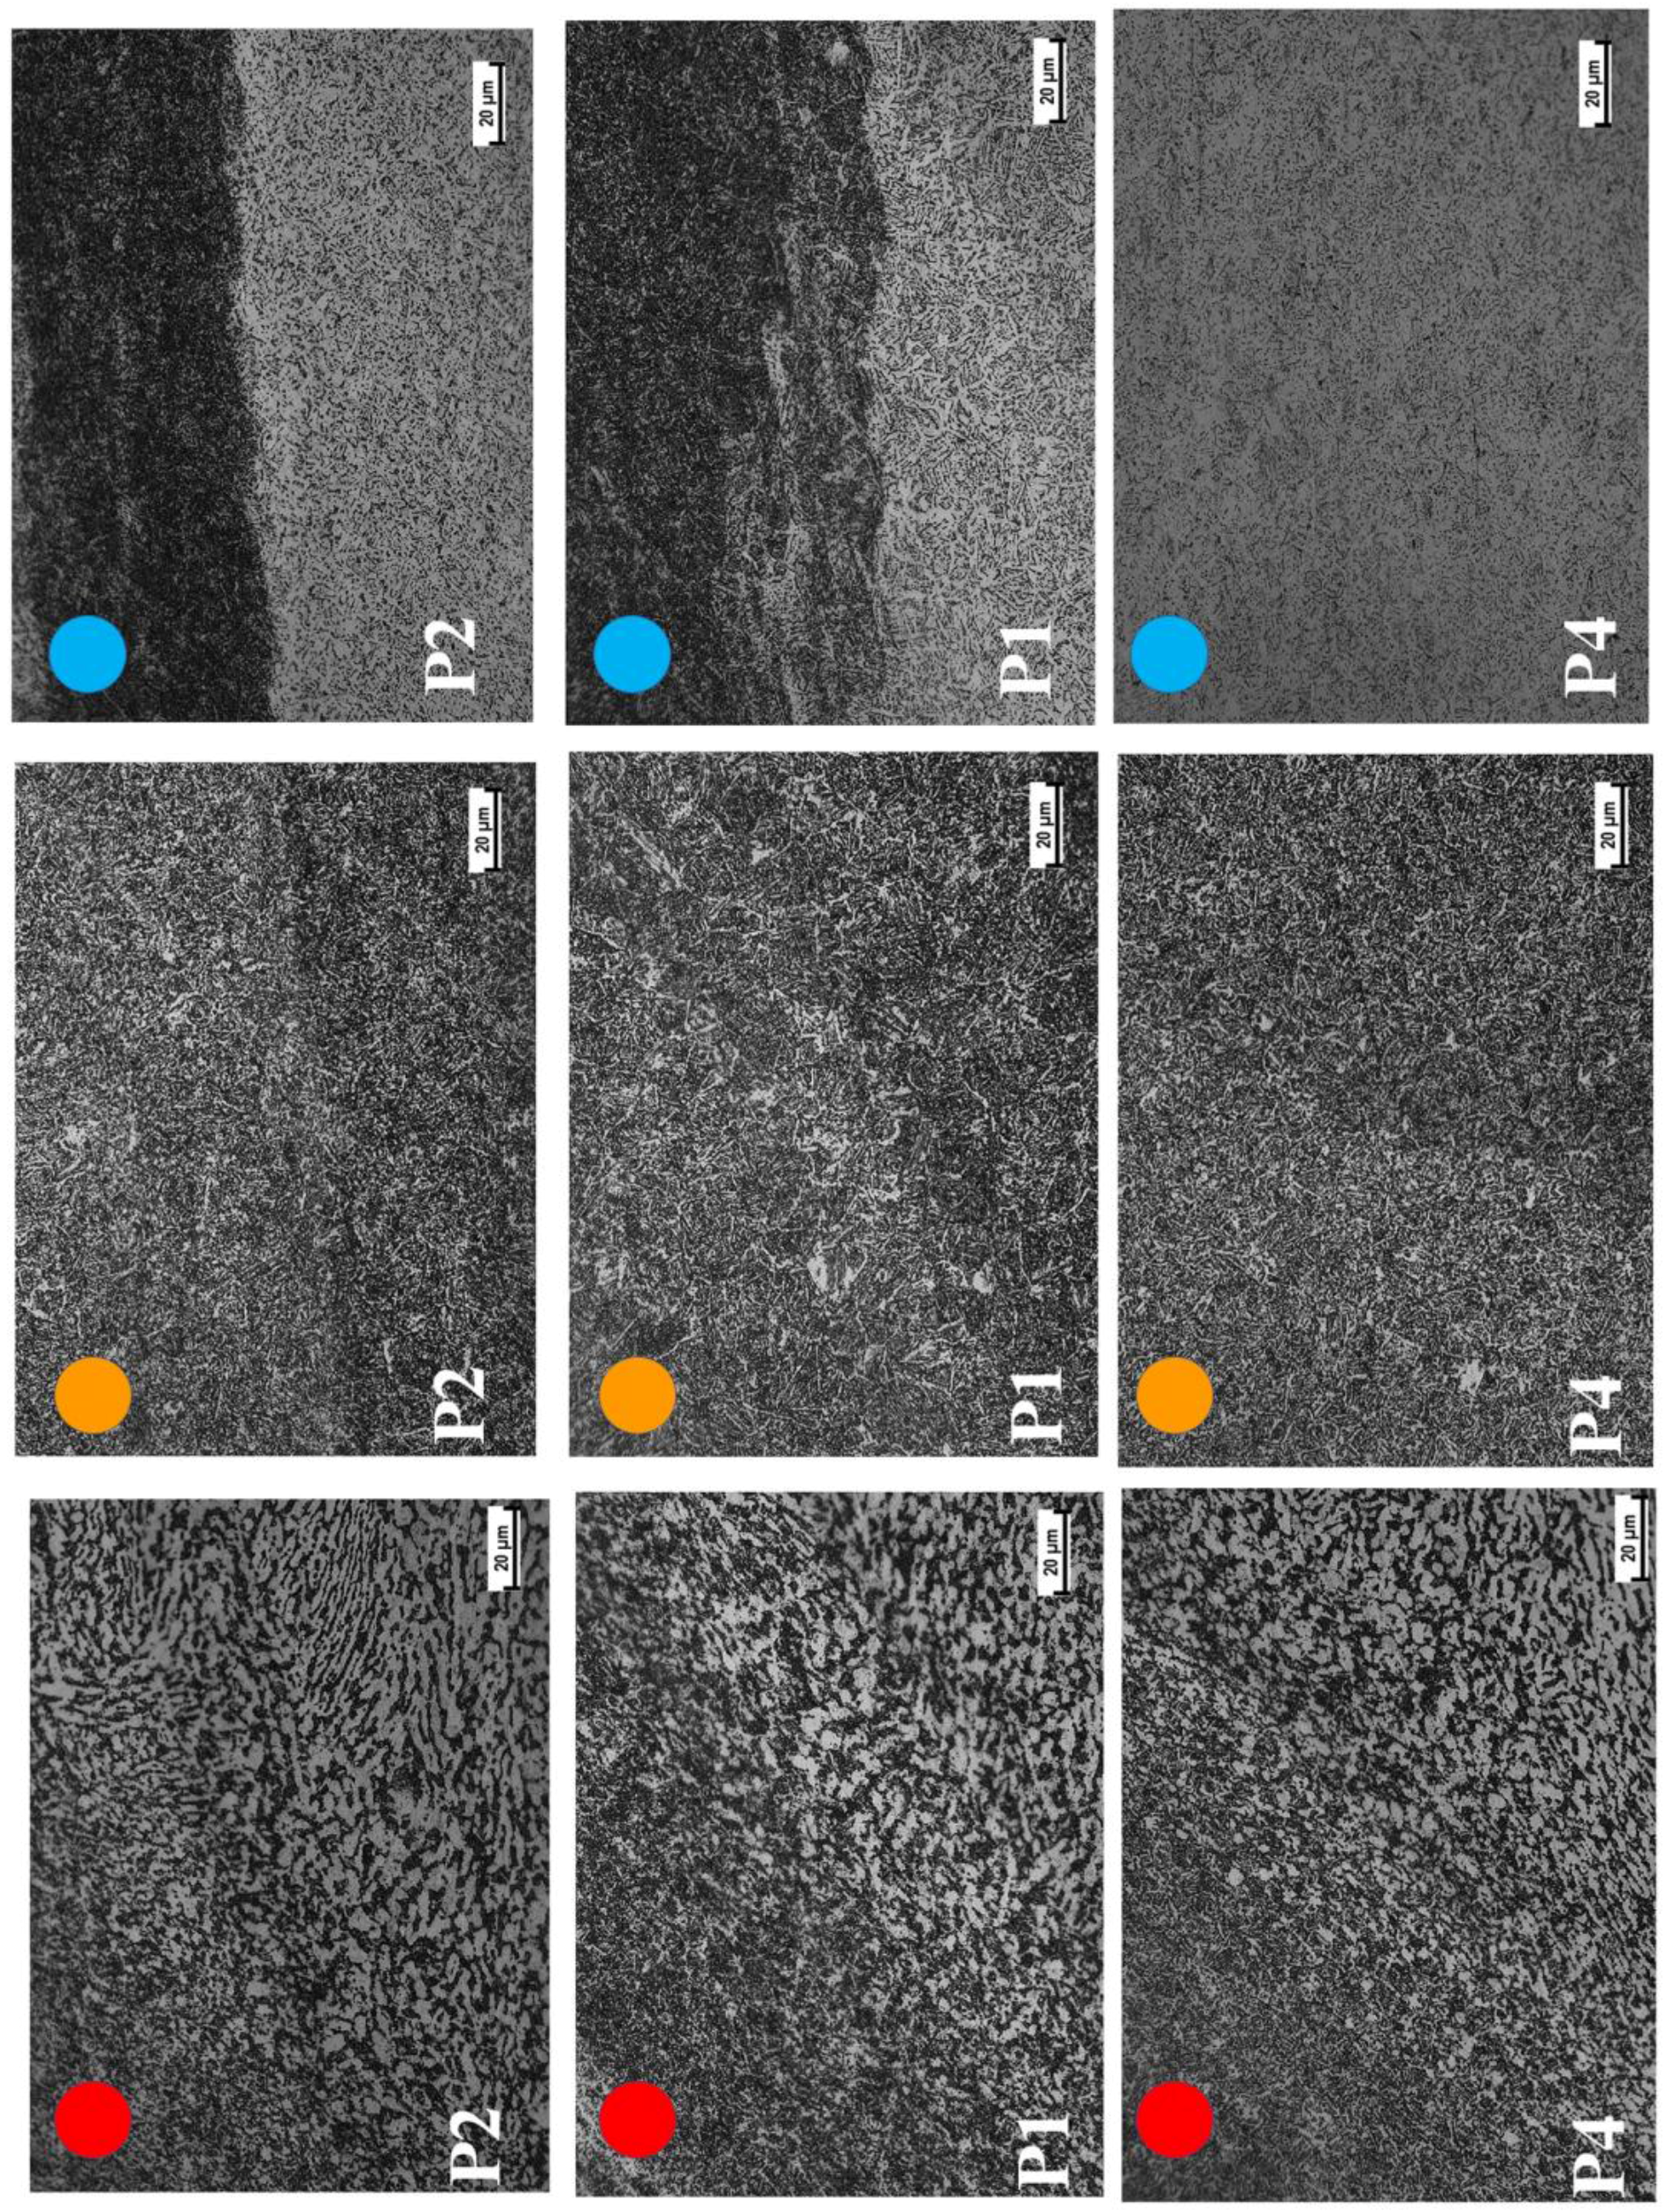
Figure 6 and Figure 7 represents the microstructures as observed on the transverse cross section of the weld at different locations for varying rotation and traverse speed respectively. For prescribed locations please refer to (Figure 2). While exposure time for evolved temperatures decreases as the traverse speed increases (P4 < P1 < P2), temperatures and associated recrystallization increases as the rotation speed is increasing (P5 < P1 < P3). For all the cases refined and partially equiaxed grains of have been observed along with scattered phase of different aspect ratios. For variations in traverse speed, the width of HAZ is decreasing from minimum to highest. In addition, associated temperatures are responsible for corresponding transformation. For increasing rotation speed (constant traverse speed), although temperature is increasing but exposure time is constant for all cases. Therefore, the width of HAZ is nearly constant (due to poor thermal conductivity of titanium and its alloys). Nonetheless, the volume fraction of phase is increasing from P5 < P1 < P3.
As the traverse speed is increasing, width of HAZ on the ADV side is decreasing from P4 to P2. However, as the rotation speed is increasing extent of deformation is increasing from P5 to P3. On the ADV side HAZ majority of the grains are refined and are oriented along the direction of tool rotation. Furthermore, the extent of phase is higher on ADV side in comparison with RET side in all cases.
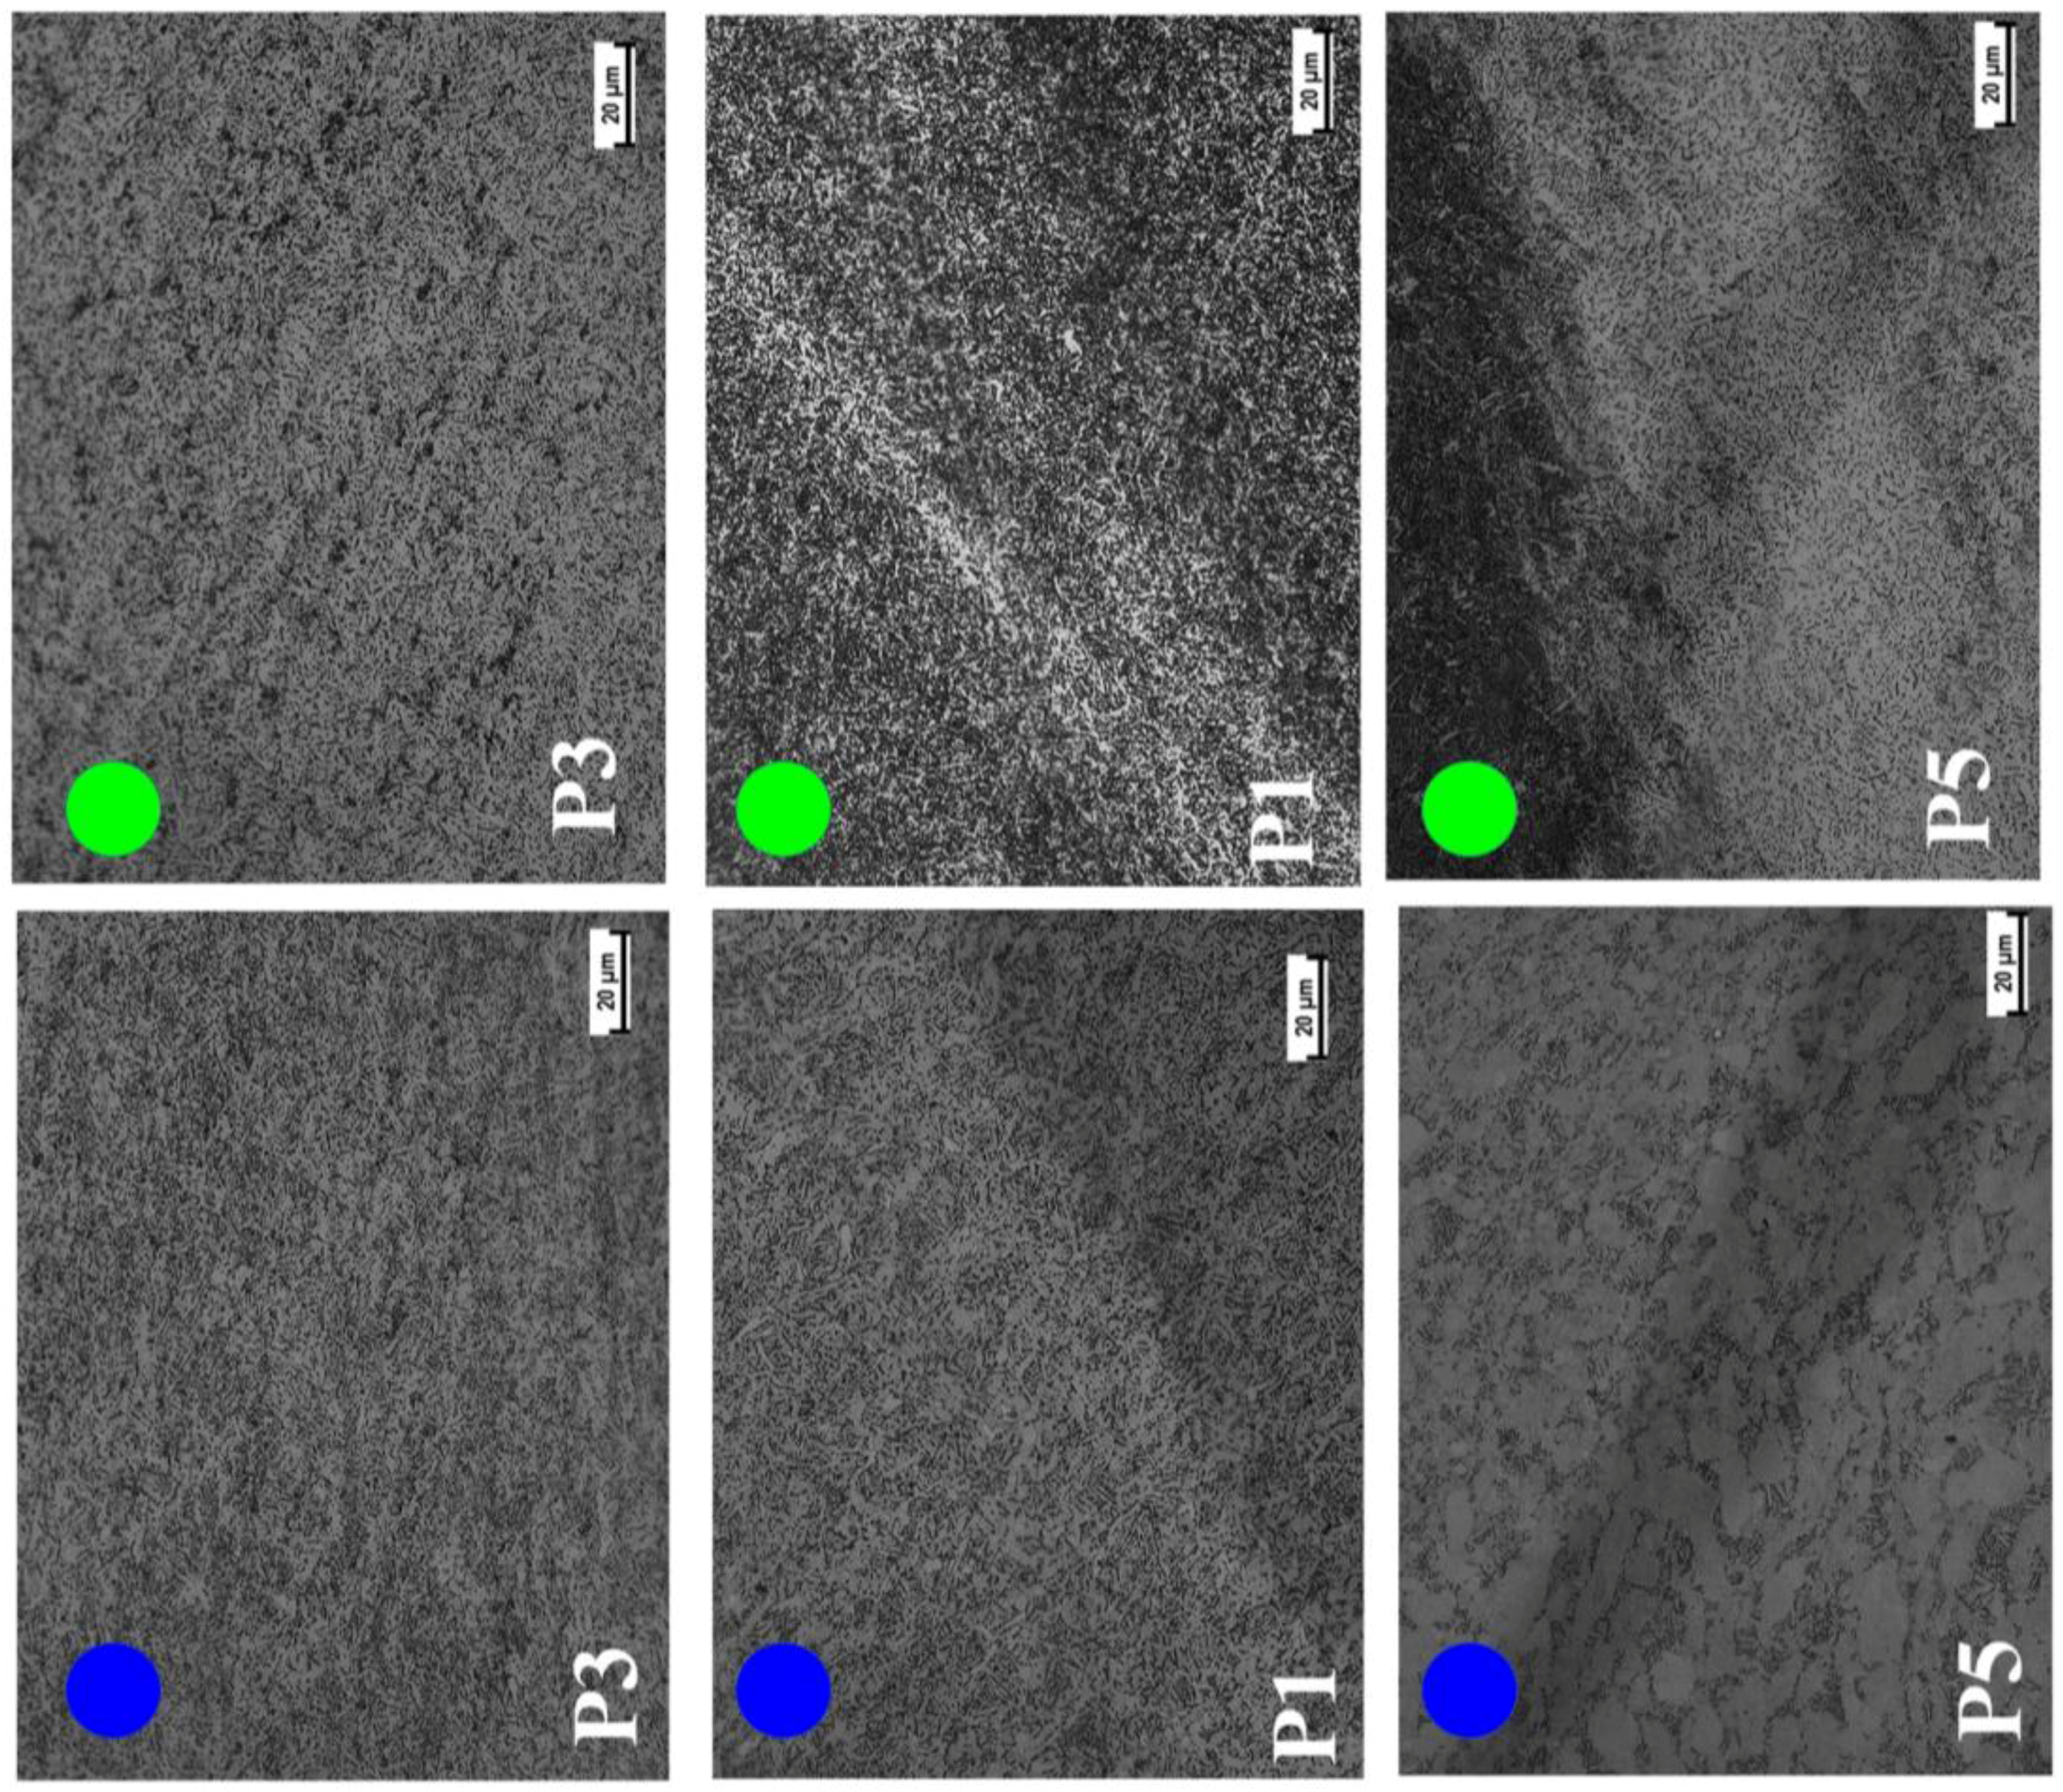
In the top of the weld (WNT) from here we can see that in all cases temperatures have reached above transus temperatures of both alloys indicating a complete transformation of existing phases into. As a result, phase was first consumed to transform completely into phase, which later transformed into as the weld nugget cooled down. Size of prior grains is increasing as the rotation speed is increasing. However, in case of increasing traverse speed, not much difference in the size of prior grains have been observed. Since top of the weld is in contact with shoulder of the tool therefore, likelihood of peak temperatures reaching above transus temperature for both alloys is highest for this location in the weld nugget. Furthermore, as can been in the macrostructures (Figure 4), that the top of the WN consists of Ti-6242 SG ( transus temperature ). Hence, we can say that temperatures in the top of the weld are highest among all the locations considered in this study.
In the center of the WN (WNC), a duplex microstructure has been observed in all the cases. The phase, lighter in appearance, consist of Ti-6242 SG while darker phase is mainly Ti-54M. From the evolution point of view, we can say that at different locations (due to tapered tool) temperatures are above or below transus temperature for individual alloy (Ti-54M and Ti-6242 SG). We can see that in lighter region majority of grains are refined and equiaxed confirming temperatures were below transus temperature for Ti-6242 SG. In darker phase (Ti-54M) temperatures are above transus temperature for Ti-54M. For Ti-54 M, microstructure is mainly with varying aspect ratios of laths.
A behavior like what we observed in the center of the weld nugget has been observed in the bottom of WN (WNB) as well. Sheared and refined grains of for Ti-6242 SG and completely transformed phase in case of Ti-54M has been observed in all cases.
3.4. Microhardness
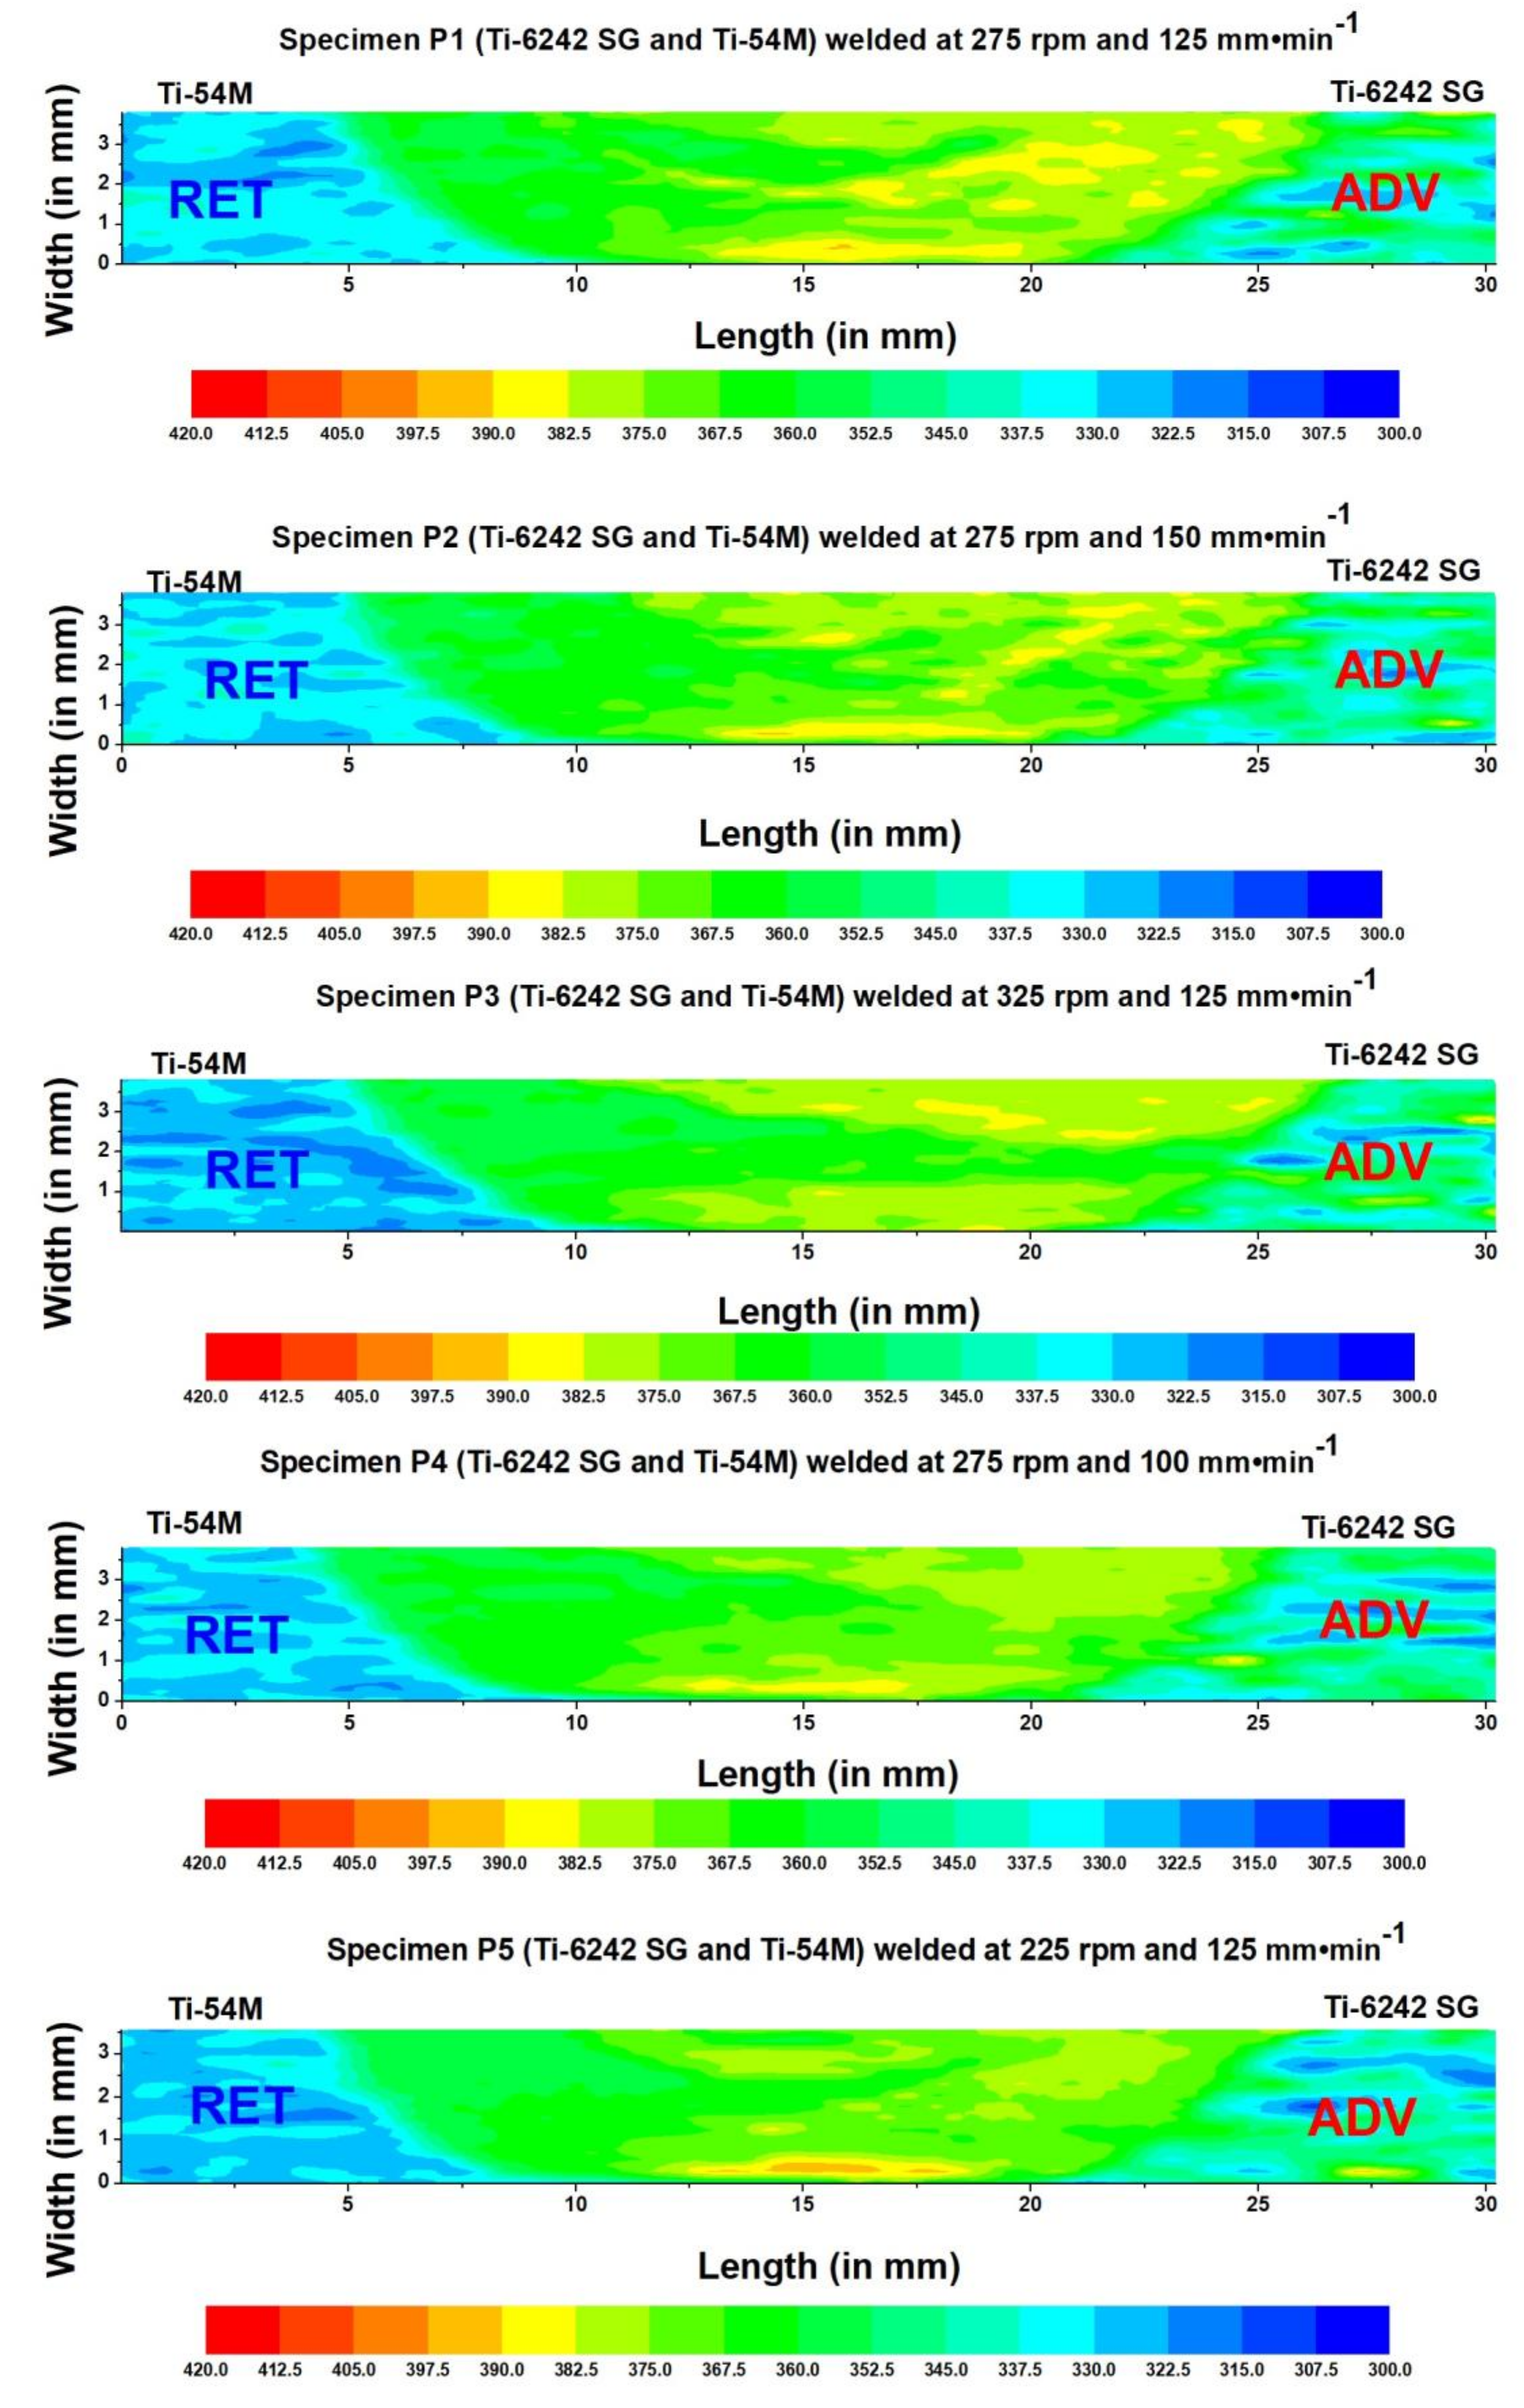
Full field hardness maps on the transverse cross section of the weld, are shown in Figure 8. From the hardness profiles, we can see that the material flow, as shown in Figure 4, corresponds with the emergence of pattern in terms of micrographic appearance. Within the WN, the region that consists of Ti-6242 SG, rather higher values of hardness have been observed in comparison with the region consisting of Ti-54M.
In Figure 8, formation of streaks (in terms of migration of material from RET side) may not appear as distinct as they appear in the macrographs (in terms of spacing between streaks in Figure 4) due to extrapolation of hardness values for two points that are within length of indentation. However, corresponding microstructural evolution, thermal gradient and differences in the diffusivity of each elements is responsible for different values of hardness within the streaks.
As described earlier, the distance between two indents (horizontal and vertical) is therefore, from the hardness profiles on the center of the weld, we may not be able to distinguish between two adjacent streaks if they are separated by a distance. For instance, in case of P1 with wider streaks, we can see a hardness profile nearly identical with the streaking pattern as observed in Figure 4. Conversely, for case of P2 those streaks remain indistinguishable and rather a pool of hardness value has been observed on the ADV side. Another interesting point to observe is the transition of hardness values from BM (either on ADV or RET) to WN. Transition from BM to WN is sharper on the RET side in comparison with what we have observed on the ADV side.
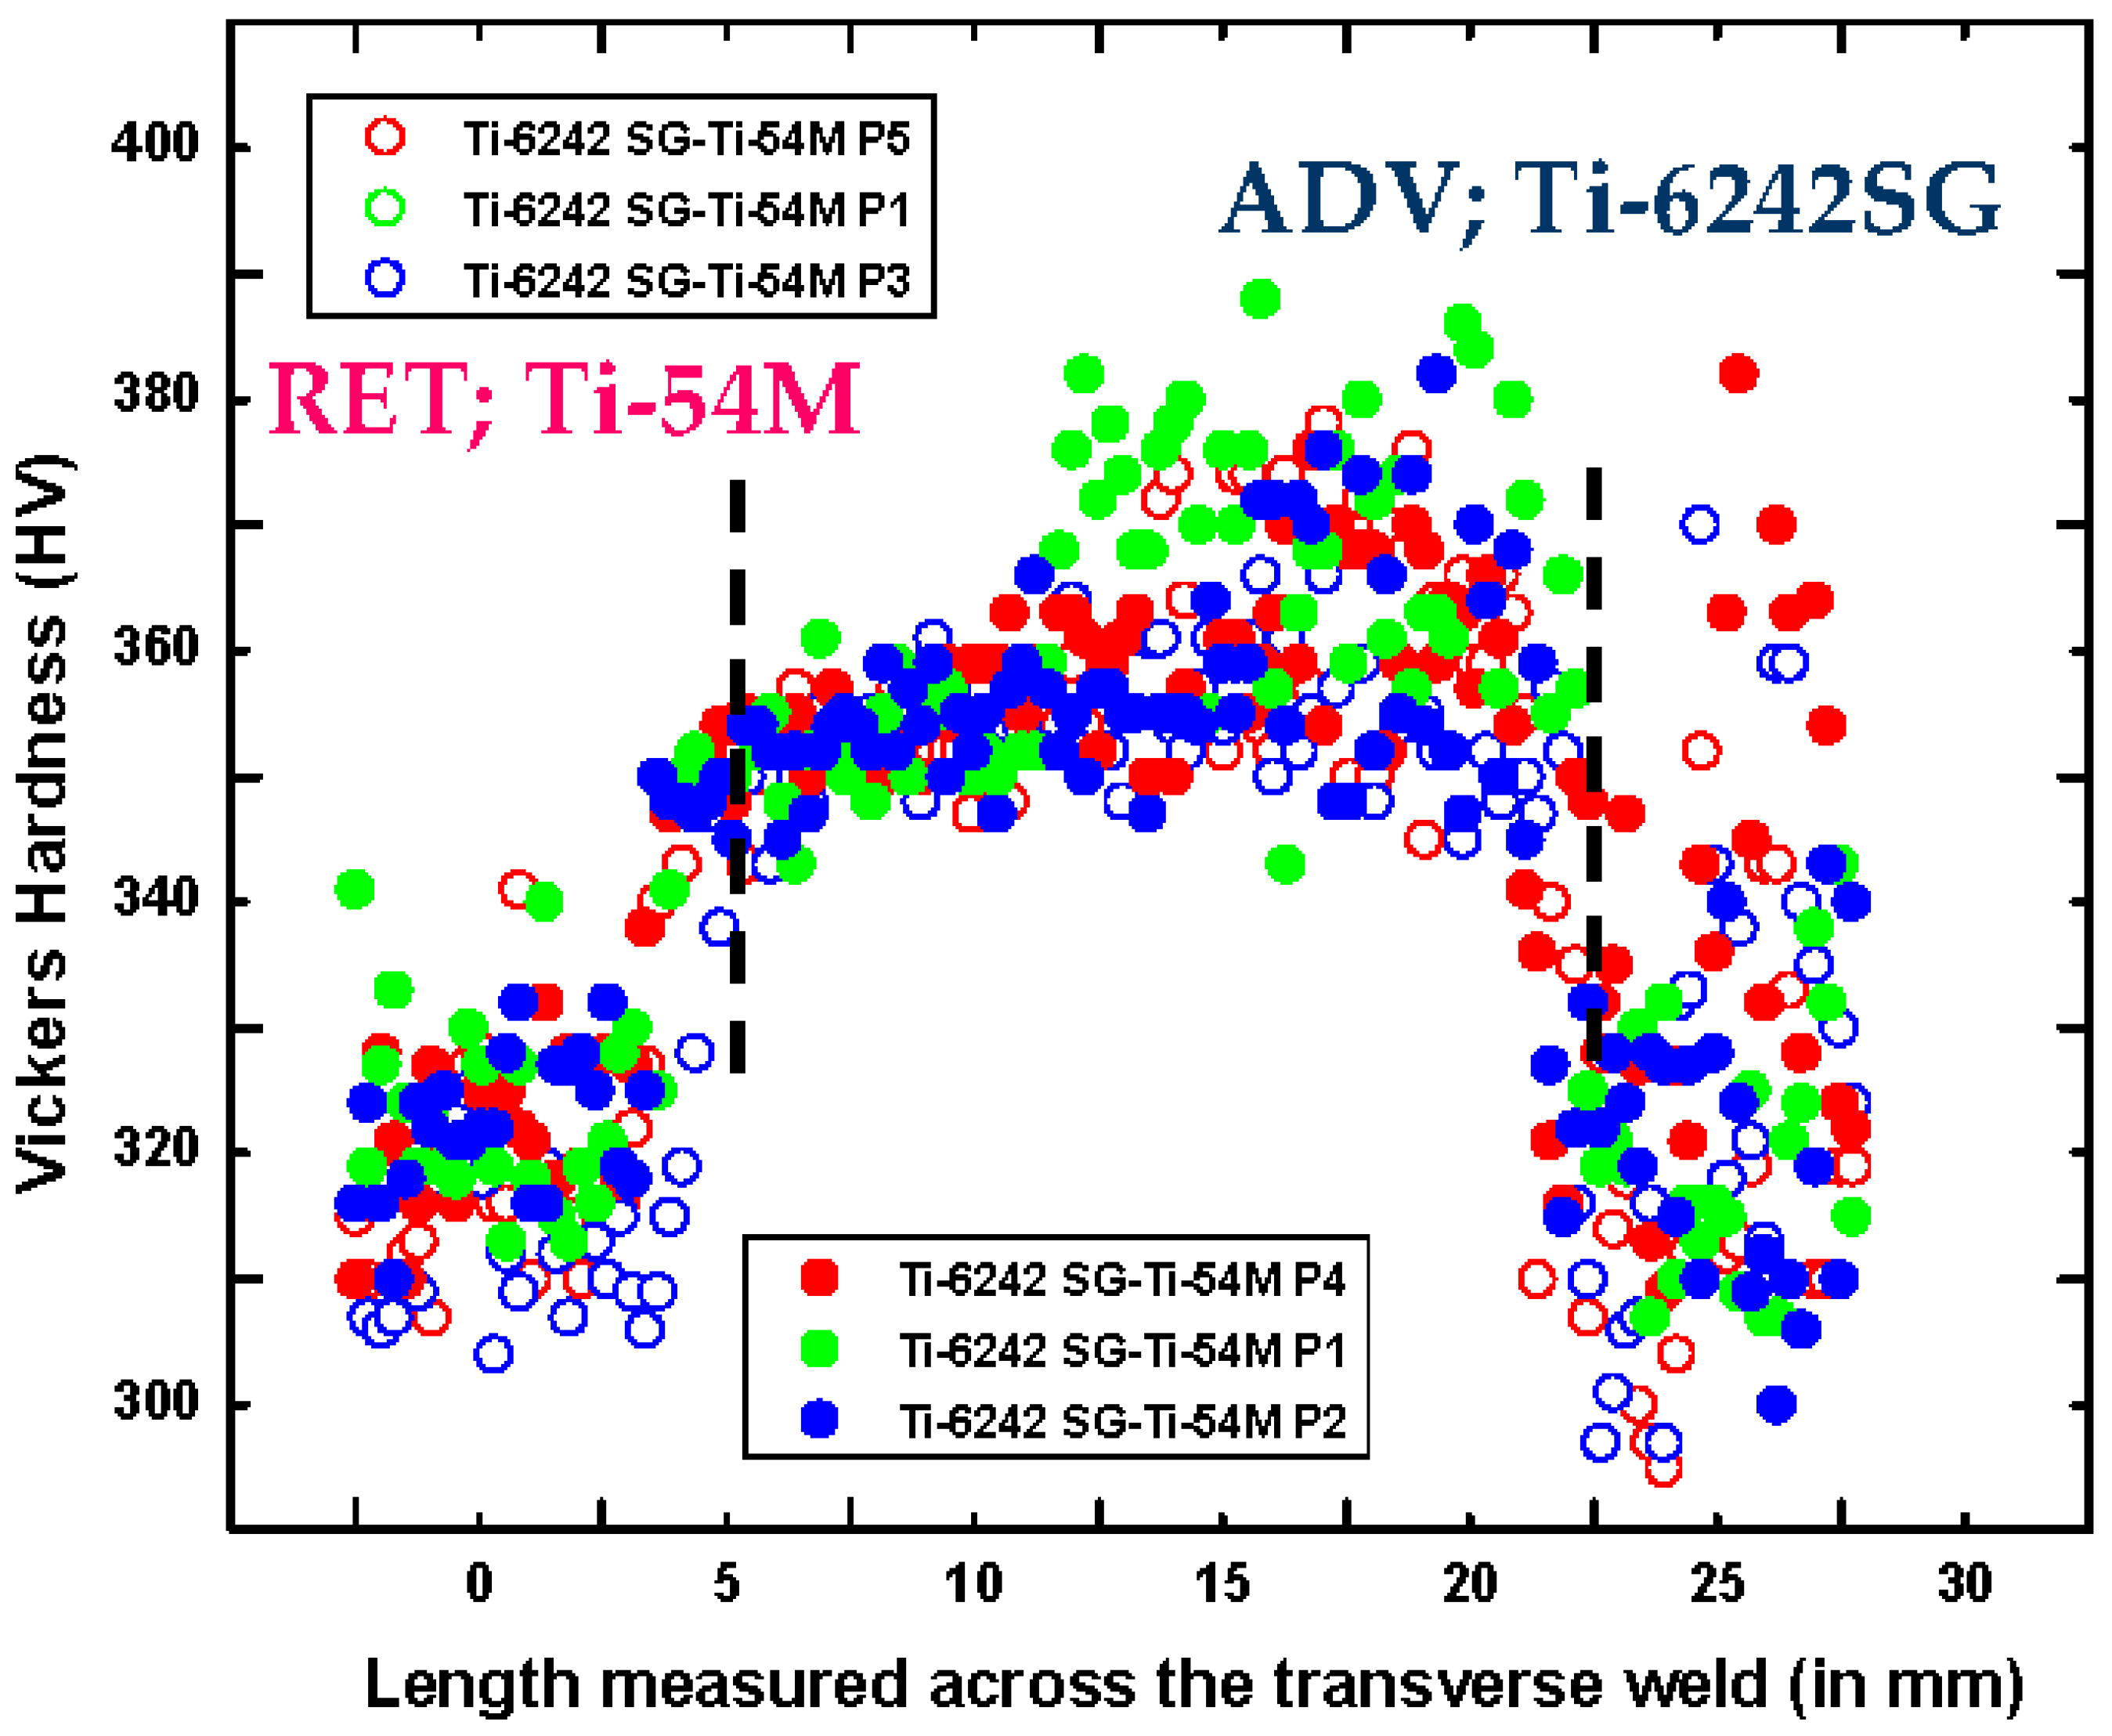
Figure 9 represents the hardness profile on the center of transverse cross section at depth below weld surface for variations in rotation and traverse speed. Hardness of Ti-54M is relatively higher in comparison with Ti-6242 SG. For the cases of varying rotation and traverse speed, hardness pattern suggests that higher values of hardness have been observed in the WN in comparison with BM. Within WN, even higher values of hardness have been observed on the ADV side. Furthermore, the scattering in hardness values on the ADV side is more pronounced in comparison with RET side. On the ADV side, hardness values are highest for the case of P1, and lowest for P3. There is no significant difference in hardness values for varying traverse speed. For most part that consists of Ti-6242 SG higher values of hardness have been observed. Except P1, other two cases P4 and P2 have resulted in rather uniform hardness values in the WN. This variation in case of P1 could be a result of two factors.
- (1)
- These streaks are rather wider and the adopted hardness measurement scheme distance between two indents could be covering more than one point in one streak of P1. While in case of P2 and P4, these streaks are thinner in appearance and possibility of omitting more streaks from one indent to another is higher therefore, rather uniform hardness values have been observed for P1 and P2.
- (2)
- Secondly, difference in exposure time results in varying temperature distribution and evolving microstructures. Slower the traverse speed, higher the exposure time, and slower cooling rate. For the limited amount of time in case of P2, depending on the inherent material flow there was only enough time for microstructure to evolve in such a way that resulted in a hardness profile with variations that depend not only on Hall-Petch relationship but also on the diffusivity of alloying elements in surrounding streaks dictating the dominance of one phase over other in individual streaks of titanium alloys.
3.5. Stress Strain Behavior
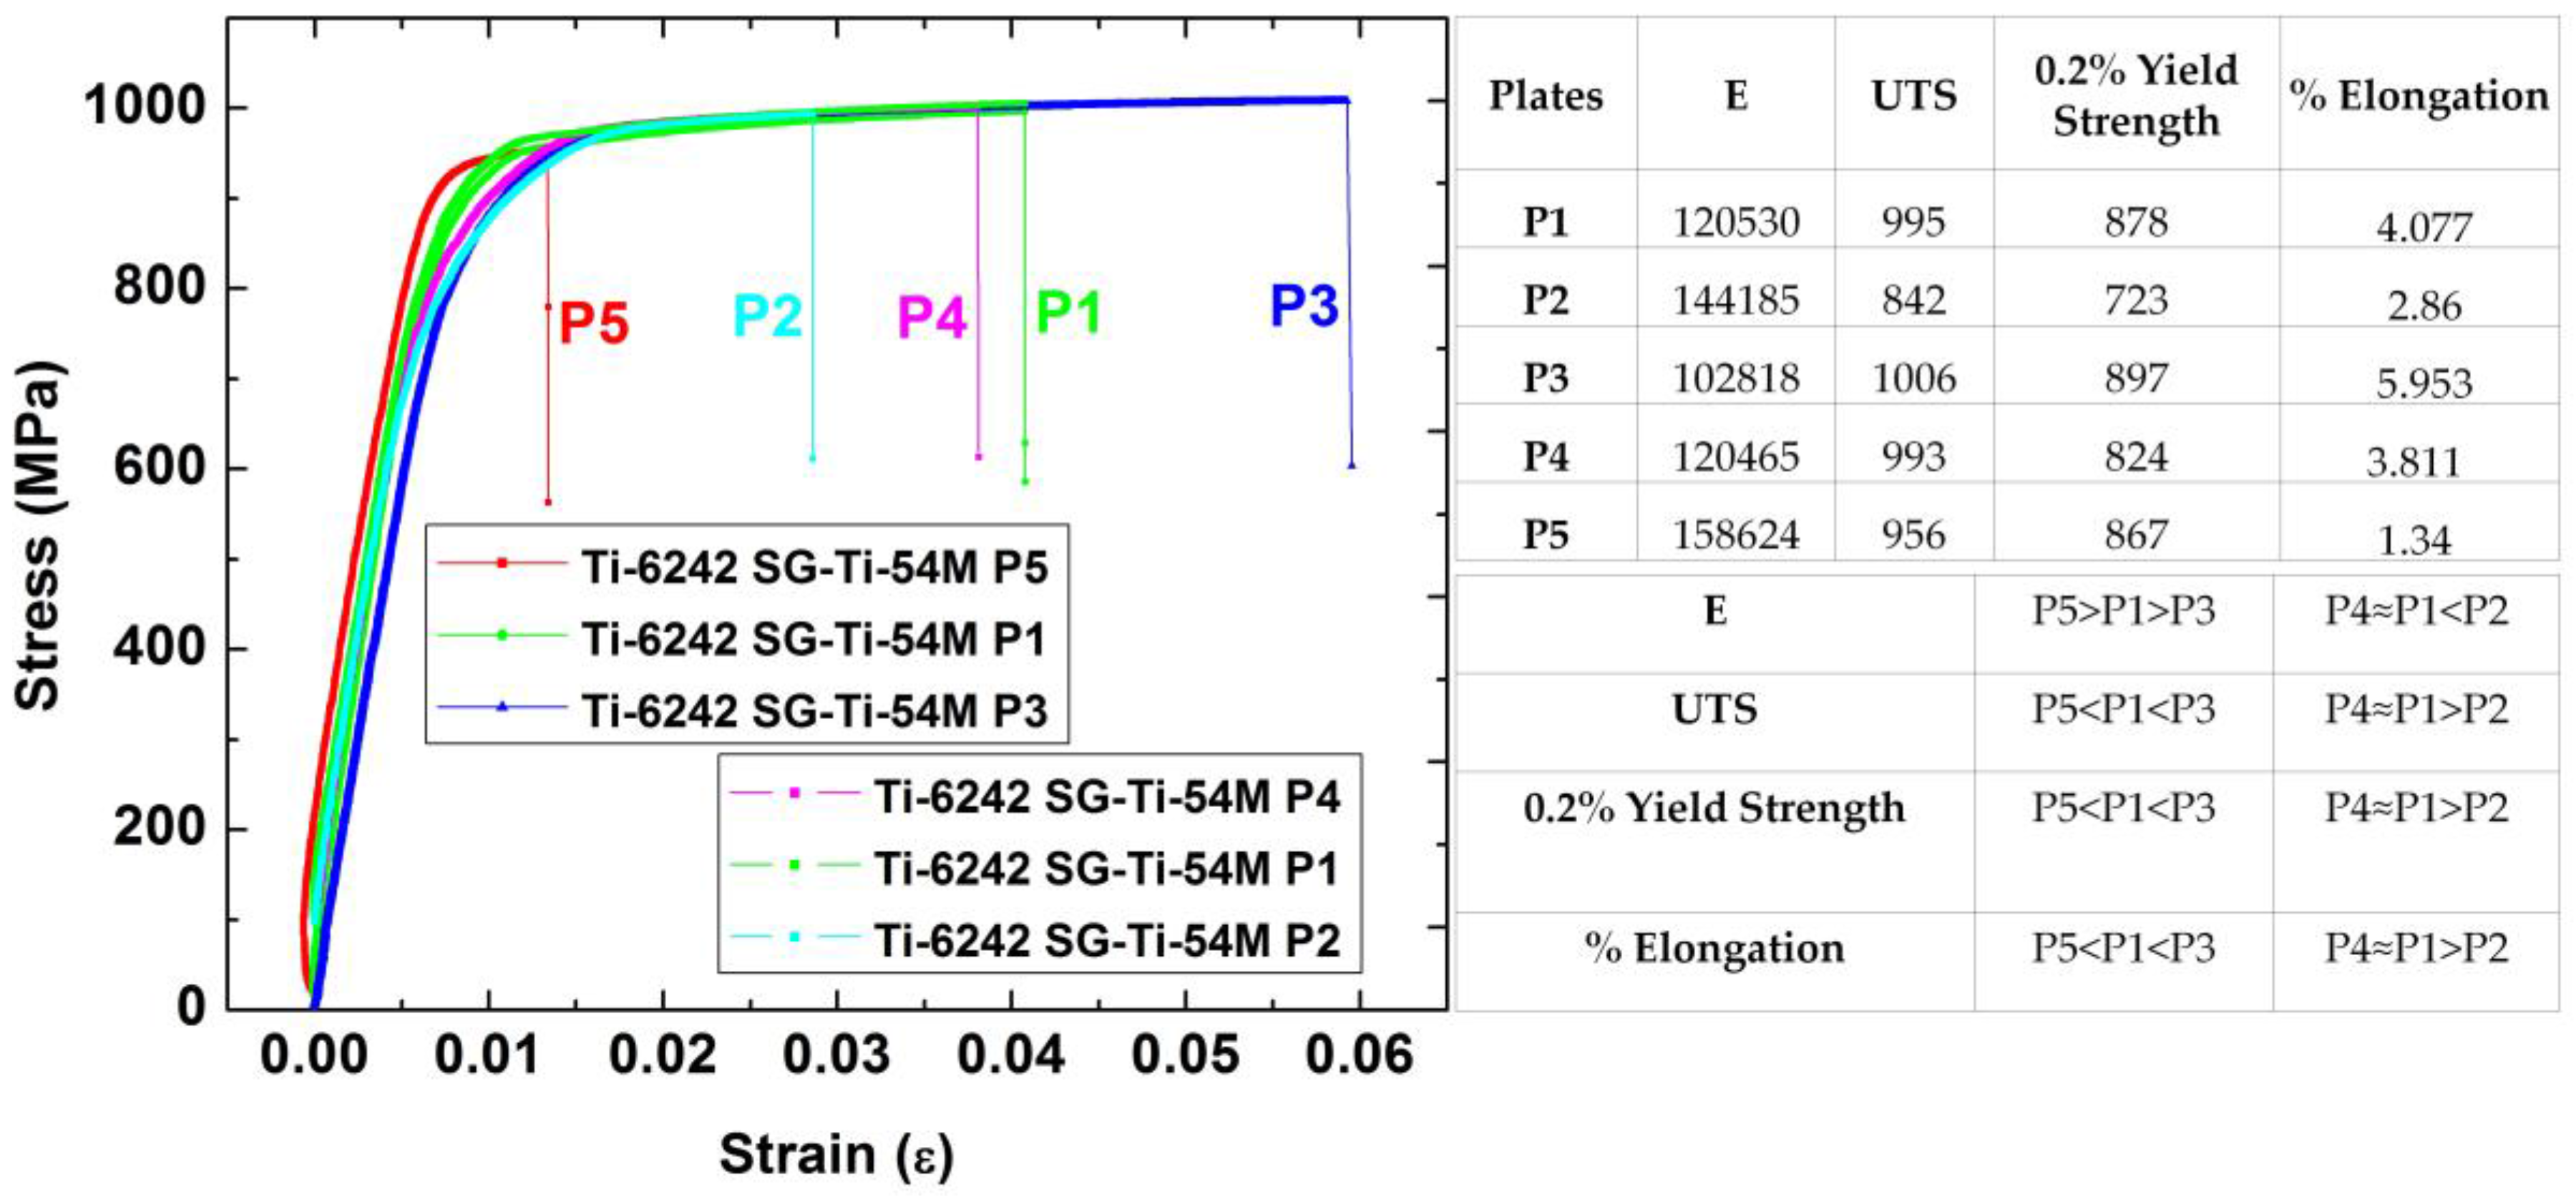
Corresponding engineering stress strain curves and mechanical properties are also shown in Figure 10.
From stress strain curves as shown in Figure 10, it can be see that the global transverse tensile response of welded panel is significantly dependent on welding parameters. However, lower work hardening has been observed for all the cases. From the mechanical response point of view, it can be seen that except elastic modulus, all the mechanical properties improve as the rotation speed is increasing. Effect of traverse speed is not well pronounced if it increases from 100 to 125 mm·min−1. The mechanical properties, except elastic modulus, deteriorates for highest traverse speed; 150 mm·min−1.
3.6. Fractographs
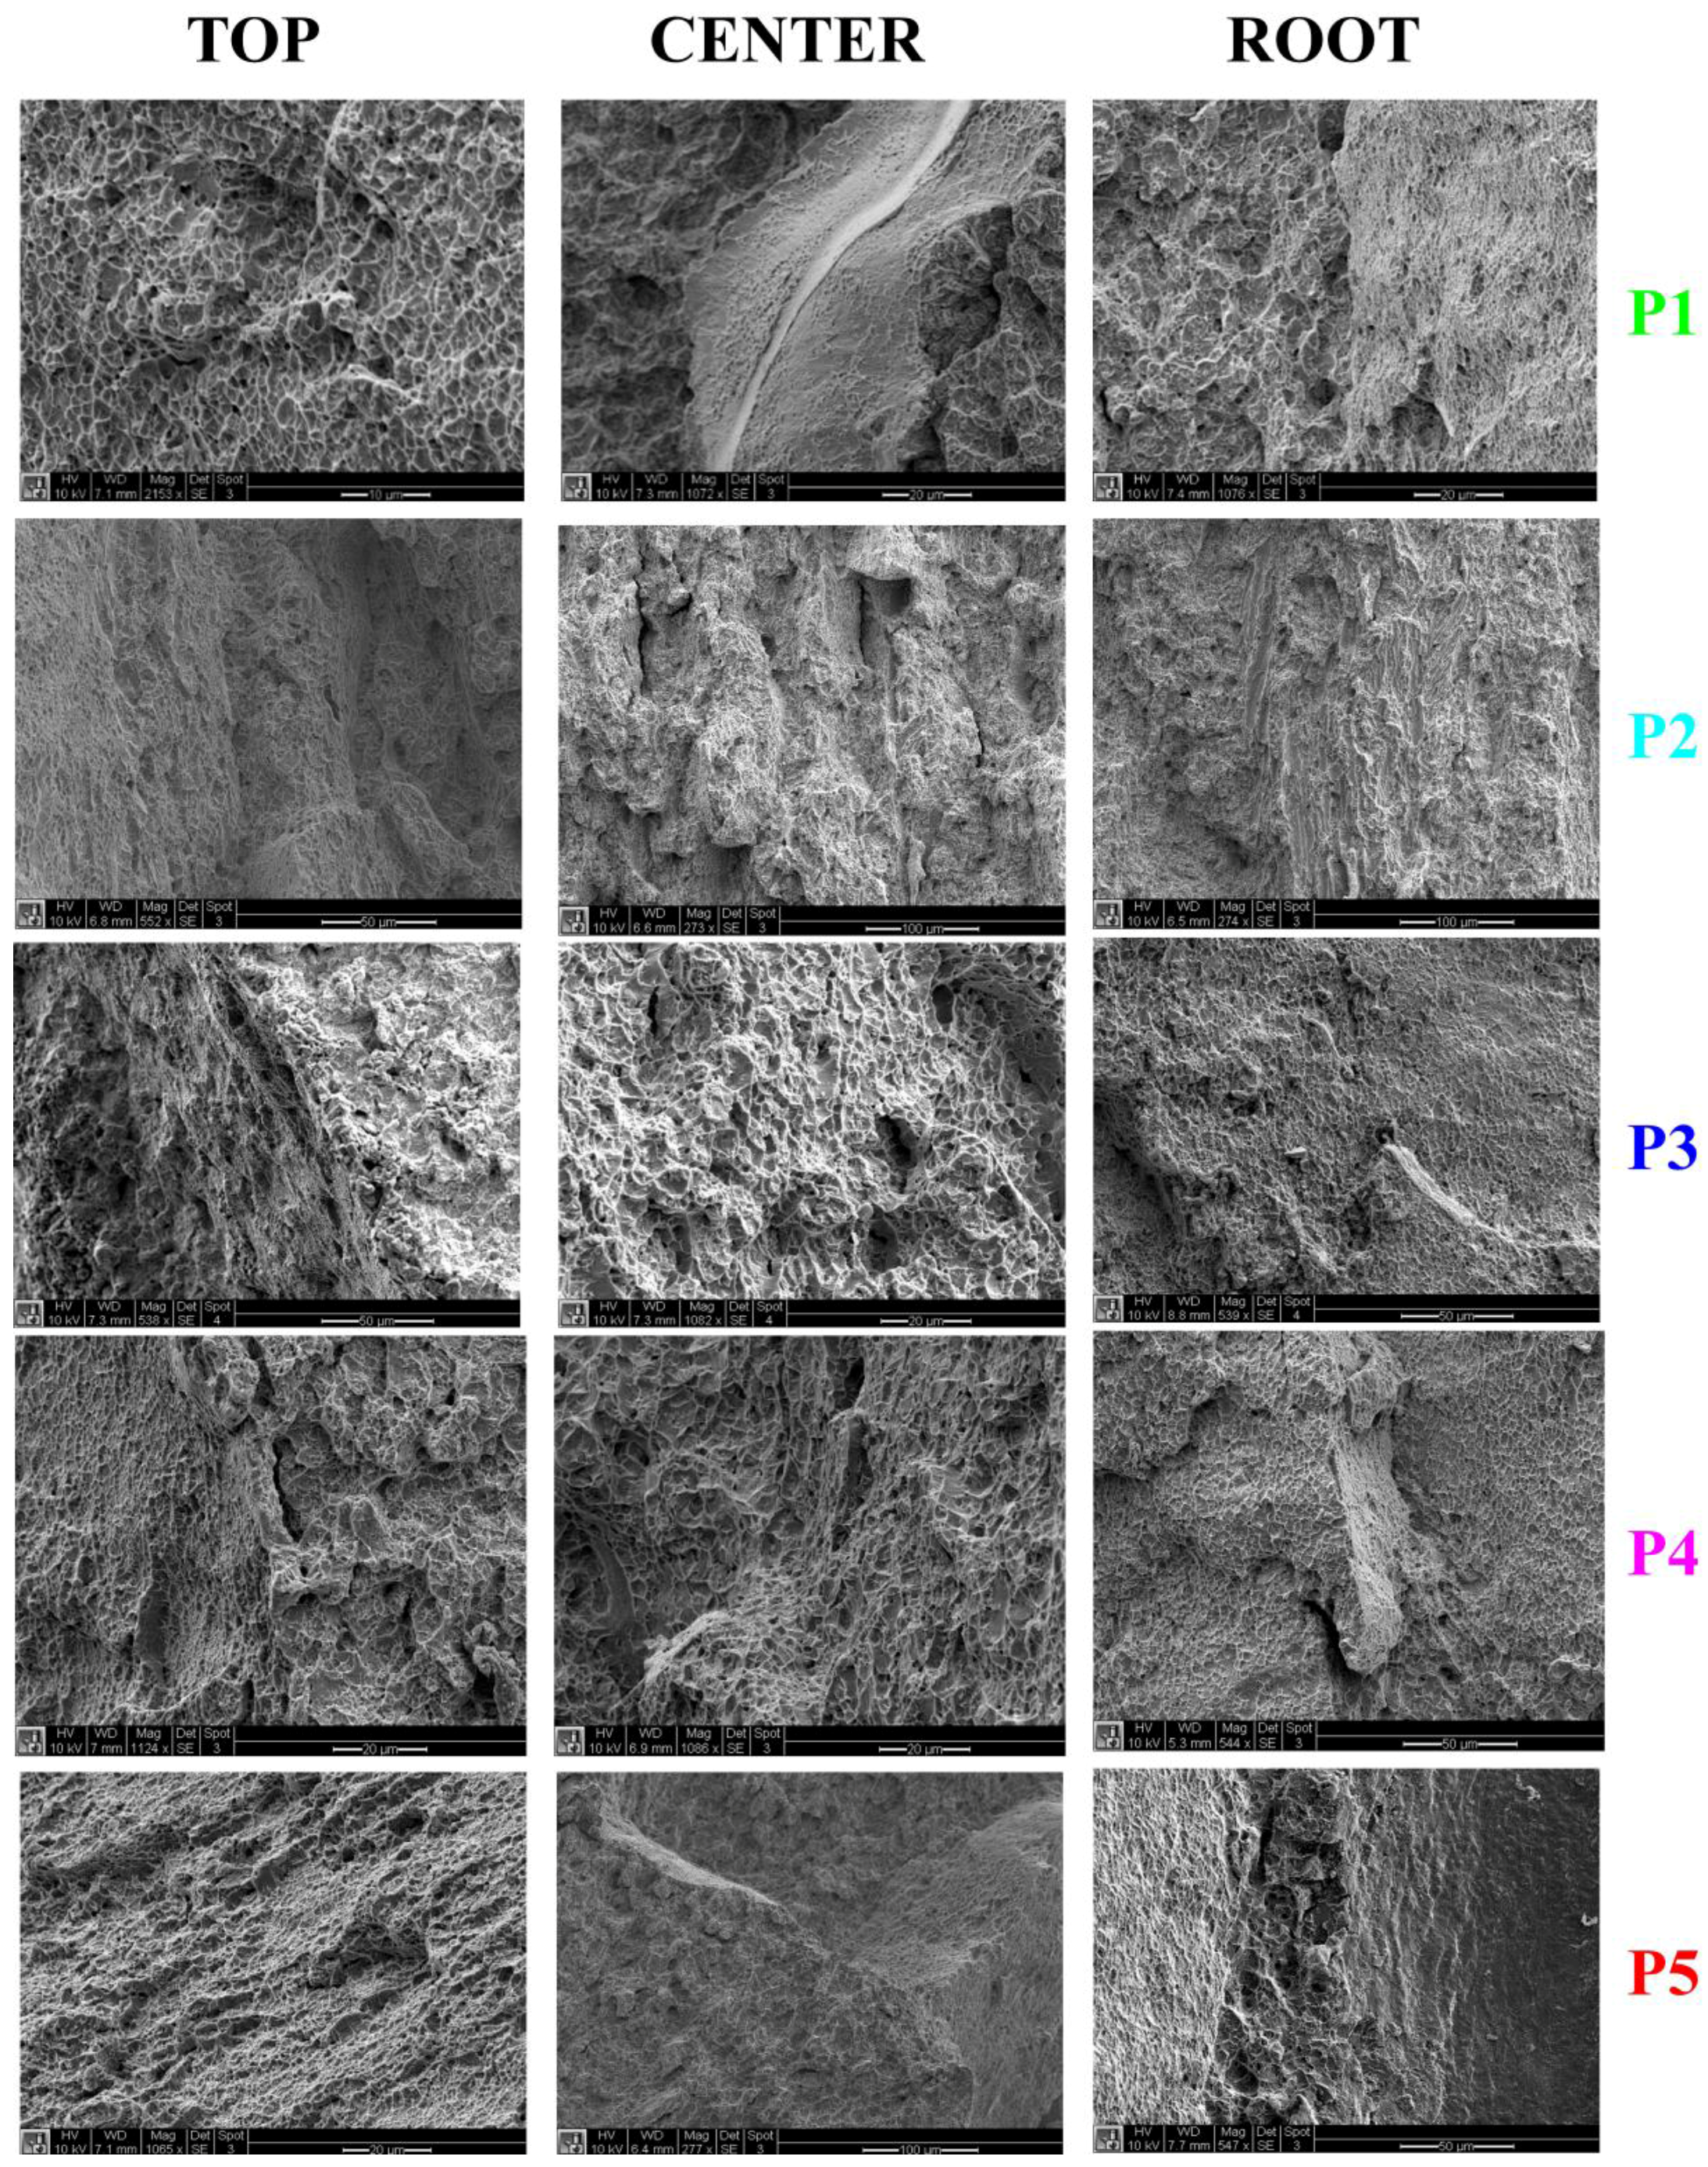
Fractured surfaces were observed and are shown in Figure 11. No definitive pattern is visible on the fractured surfaces. In absence of any significant necking (as deduced from the stress strain curves as shown in Figure 10 with negligible strain hardening) the nature of fracture for most cases appear to be either elastic perfectly plastic or brittle with indistinct locations for crack initiation sites. Based on the corrugated patterns on the fractured surfaces, it appears as if in the entire specimen during transverse loading there are multiple crack initiation sites resulting in a fractured morphology that is either transcryatalline or intercrystalline. It can de deduced that depending on evolved heterogeneous microstructure, crack initiation sites are spread throughout the cross section. Depending on the inherent microstructure and its ability to withstand the applied load depends on the flow stresses of existing phases. In general, higher and lower cooling rates will result in thinner and thicker grain boundary and Widmanstattan plates respectively. Consequently, higher and lower cooling rates will result in intercrystalline and transcrystalline fracture morphology during tensile loading. An interesting pattern has been observed in the center of P1 where it appears as if the streaks (consisting of Ti-54M) and region around it is somewhat ductile in nature depicting a dimple like fracture. P5 on the other hand, especially in the root of the weld appears glass-like fractured morphology suggesting the possible reason for lowest elongation.
4. Discussion
4.1. Weld Surfaces
Appearance of tool marks (Figure 3) suggests that, except P2, all the specimens have resulted in a non-uniform tool mark spacing on the butt-weld surface. For lowest rotation speed (P5), there is a significant amount of sticking of sheared material that in absence of enough shear forces, remains stuck with the tool walls and deposits in the wake of tool in defining periodicity. As the tool rotation speed increases, shear forces and corresponding temperatures are enough to ensure a smooth flow of material (P1 and P3). However, the spacing between two tool marks appear to be same in these cases. Conversely, as the traverse speed increases, the spacing between two tool marks decreases (minimum in case of P2), which is a phenomenon opposite to theory (). These controversial observations purports that in case of dissimilar titanium alloys, flow strength of individual alloy is also a determining factor in assessing the tool marks spacing (or distance between two emerging streaks). Even for P1 (rpm = 275) there seems to a reasonable amount of periodicity in the flow of material at 125 mm·min−1. Based on the appearance of the weld, we can safely assume that for 325 rpm the best traverse speed could have been 150 mm·min−1. Nonetheless, processing parameters associated with P2 remain the best to obtain a smooth surface with uniform spacing between tool marks ensuring minimum stress concentration sites during tensile loading.
4.2. Metallography
From the macrostructures as shown in Figure 4, we can see that rotation speed has significant effect on material migrating from RET side. Ti-54M shows relatively higher hardness values (333 HV) in comparison with Ti-6242 SG (323 HV). For lowest rotation speed, i.e., 225 rpm (P5) shear forces and amount of sheared material on the RET side are lowest in comparison with P1 and P3. Owing to the higher hardness of Ti-54M in comparison with Ti-6242 SG, extent of penetration of sheared material (Ti-54M), on the ADV side is higher for all cases. However, for lowest rotation speed due to uniformly distributed rather lower shear forces (in comparison with P1 and P3) migrating material from RET side deposits in forms of evenly spaced streaks. However, the width and size of these streaks also depends on the tool geometry. It can be deduced that material migrating from RET side moves differently in the vicinity due to different velocity vectors of tapered pin root () and pin diameter attached to shoulder (). For lowest rotation speed, a rather uniform pattern is observed in terms of streaks formation. For P1, with rotation speed 275 rpm, these streaks start agglomerating, and instead of migrating all the way to ADV side, deposition of Ti-54M begins somewhere in the center of WN. For highest rotation speed (P3: 325 rpm), and with highest shear forces, these agglomerated streaks start forming a band-like macrostructure with limited penetration ability (due to decreased surface area of Ti-54M bands) on the ADV side. From macrographic point of view, it is safe to assume that with increase in rotation speed, material in WN primarily consists of alloying material kept on the ADV side. In our case, space occupied by Ti-6242 SG in the WN changed with increasing rotation speed. Furthermore, due to severe plastic deformation grains of Ti-6242 SG starts refining and the resistance (work hardening coefficient, ) provided by migrating material from RET side starts decreasing with increasing rotation speed. As a result, rather hardened material (Ti-6242 SG, in form of Ti-6242 FG; with refined grains) takes place in the WN.
Considering an effect of traverse speed (Figure 4) for P4 < P1 < P2 we see that for lowest traverse speed, migrating Ti-54M was exposed for enough time to consolidate within WN before reaching on the ADV side. An effect of this can also be seen on the welded surface (Figure 3). For most exposed time in case of P4, resulting tool marks are terminating well before reaching on the ADV side indicating that the flow of material from RET to ADV is thwarted by the resistance provided by Ti-6242 SG (through thickness of weld). As the traverse speed increases, exposure time gets shorter and same amount of sheared material finds its occupancy toward ADV side. In case of P2 the welded surface and the morphology of inherent macrostructure on transverse cross section are in accordance indicating a smoother and uniform flow of material from RET to ADV.
Considering Figure 6 and Figure 7 together: Depending on peak temperature and the exposure time some of the phase has been consumed to form followed by subsequent transformation . It has been demonstrated that as the rotation speed increases, temperatures increase giving rise to the possibility of surpassing the transus temperature for individual alloy. In case of FSWed of dissimilar titanium alloys, emerging temperatures and evolving microstructures are subjected to their dependence and possibility of reaching par or remaining below transus temperatures.
For case of P3 with highest temperatures, maximum amount of transformation has been achieved. For case of P3 on RET side HAZ temperatures are above transus temperature. However, due to poor thermal conductivity of titanium alloys, the temperatures even in par transus temperature conditions were confined in a narrow region indicating that the width of HAZ consists of bimodal microstructure.
Furthermore, as a general trend if the heat input it larger, cooling scheme is faster for highest temperatures giving rise to grain growth (a characteristic of re-crystallization). For instance, WNT, since P3 received maximum temperatures, the grain growth in case of P3 is more pronounced in comparison with P1. Smaller prior grains have been observed in case of P5 followed by P1 and P3 respectively. For HAZ on the ADV side (since ADV side receives higher temperatures in comparison with RET side), grain growth in case of P3 is most probable in comparison with P5. From HAZ, ADV we can see that for P5, a darker band with no transformational (not high enough temperature; lowest rpm) characteristic has been observed indicating presence of refined prior grains. As the rpm increases, these grains start growing at the expanse of existing and follow a simple allotropic transformation (i.e., ). However, these transformations, and growth of prior grains remain in competition before reaching an equilibrium. From the microstructure shown in HAZ, ADV we can say that for highest rotation speed these transformations are most likely to occur along with growing grains.
Complexity of friction stir welding associated with dissimilar titanium alloys and corresponding transus temperature poses a concurrent challenge to elucidate evolution of microstructure in WN and HAZ. As a general analogy, we can say that peak temperatures are highest for highest rotation speed, i.e., P3 (325 rpm). Since, traverse speed and thickness of alloying sheets, for all cases (P5, P1 and P3) is constant, therefore, continuous cooling rate and corresponding transformation from is primarily dependent on peak temperature. From microstructure of WNC in case of P5, we can see that for Ti-6242 SG temperatures are below transus temperature of Ti-6242 SG. However, for Ti-54M temperatures have exceeded transus temperature of Ti-54M. As a result, in case of P5, WN reveals sheared and refined grains of Ti-6242 SG that are accompanied by lamella of Ti-54M. For case of P1, with increased ration speed, temperatures are above transus temperature for both alloys, therefore, formation of is probable in both alloys. Due to identical exposure time (constant traverse speed) prior grain size is likely to be bigger for Ti-54M in comparison with Ti-6242 SG due to lower transus temperature of Ti-54M. For case of P3, with highest rotation speed it can be deduced that peak temperature is sufficiently high to not only surpass transus temperatures of both alloys, but also are responsible for producing largest prior grain size before transformation. In HAZ on the RET side (prescribed as location circled blue), effect of peak temperatures is visible from P5 to P1 to P3. As the rotation speed increases, fraction of refined interspersed lamella of increases on the RET side. On the ADV side, HAZ consisting of refined grains of Ti-6242 SG along with transformed has been observed in all cases. Although, microstructures are distinct representation of macrographic appearances, yet the volume fraction of phases remains unclear. Therefore, to understand detailed effect of rotation speed and peak temperature it is essential to characterize phase evolution at critical locations (ADV, CEN and RET).
Conversely, as the traverse speed increase exposure time for allotropic transformation decreases meaning that for increasing traverse speed, transformation from is limited in a narrow region and, also, the size of prior grains decreases. With limited exposure time two phenomenon can take place.
- Less transformation (or lesser volume fraction of ) for highest traverse speed.
- Thinner laths of due to faster cooling for highest traverse speed.
In the bottom of the weld WNB, upon comparing P4, P1, and P2 we see that for lowest traverse speed P4 these temperatures are exposed for the longest time resulting in a microstructure that consists of refined equiaxed grains of with lamella . In the bottom of the WN due to tapered tool geometry it is evident that for Ti-6242 SG temperatures are sub transus resulting in refined grains of. As the traverse speed increases, for P1 for instance, strain rate increases and corresponding transformations are given lesser time. As a result, larger grains along with refined equiaxed grains are observed in Ti-6242 SG. While for Ti-54M these temperatures are par transus therefore, corresponding transformation results in relatively thicker lamella of in comparison with P2 (highest traverse speed).
4.3. Mechanical Properties
4.3.1. Microhardness
For microhardness, had it been the case of similar titanium alloys, higher rotation speed would result in lower hardness values due to increasing prior grain size [20]. However, for the case of dissimilar titanium alloys, especially when temperature is sub transus temperature for one alloy, former statement is not entirely true. Based on full field hardness maps (Figure 8) and hardness profile in the center of the transverse cross section at depth 1.5 mm below weld surface (Figure 9), it can be said that within streaks of Ti-54M this hardness decreases as the rpm increases. In case of Ti-6242 SG (considering P1 and P3), it is evident that the hardness values of P3 are lower than P1. For P5, however, refined grains of Ti-6242 SG results in hardness values nearly equal to P1 but higher than P3.
For highest traverse speed (P2, 150 mm·min−1), spread of lamella microstructure (from Ti-54M), and refined (from Ti-6242 SG) in the CEN of the weld is narrower in comparison with P4 and P1. On the ADV side, as can be seen, that for P4 (with lowest traverse speed; hence, maximum exposure time) a wider range of HAZ is observed in comparison with P1 and P2. However, on the RET side, at this rotation speed, temperatures are not above transus temperature of Ti-54M. As a result, variation in grain sizes has been observed. Intergranular along with increasing interdispersed phase has been observed from P4 to P1. However, for highest traverse speed bimodal microstructure (equiaxed and lamella of ) has been observed on the RET side.
For effect of traverse speed where temperatures are constant (constant rpm) we can rely on the two points highlighted on page 18. For highest traverse speed not only do we have lesser transformation of phase into phase, but also the aspect ratio of lamella decreases. Since phase has higher flow stress in comparison with phase, rather lowest values of hardness have been observed for case of P2 (highest traverse speed, least formation of ). While for case of P1 these hardness values are significantly higher in comparison with P4. Again, this could be an effect of alloying elements and their diffusivity in corresponding phases stabilizing a non-conventional microstructure that results in higher hardness values for P1.
4.3.2. Global Stress Strain Responses
Stress strain curves and mechanical responses of these five specimens has been characterized in terms of rotation and traverse speed. For variations in rotation speed, it is evident that except elastic modulus, all of the mechanical properties () are improving. On the other hand, for increasing traverse speed all mechanical properties except, are nearly identical for P4 and P1 and are significantly higher than P2.
For case of increasing rpm, it appears that the scattered Ti-54M in WN provides sufficient interlocking of Ti-54M and Ti-6242 SG resulting in significantly higher value of for lowest rotation speed, P5. As the rpm increase this interlocking mechanism changes into banded form and results into reduced values of. An identical behavior has been observed for the case of higher traverse speed where evolving streaks of Ti-54M on the ADV side provide an ability to withstand applied load without yielding. As the rpm increases, this interlocking mechanism changes into banded form and results into reduced values of. Considering an effect of traverse speed on P4 and P1, where this interlocking is nearly identical. P2 on the other hand with thin streaks of Ti-54M on ADV side is closely knitted with Ti-6242 SG resulting in higher values of, in comparison with P4 and P1. A close observation of macrographs (Figure 4) of P5 and P2 reveals that these two specimens are similar in appearance (or interlocking of Ti-54M and Ti-6242 SG), therefore, resulting in nearly identical values of
Once the elastic limit is surpassed, these streaks or plates of individual alloys start deforming until fracture. For increasing rpm, with increasing amount of consolidated Ti-54M in WN, these mechanical properties () are increasing. Similarly, for the effect of traverse speed, higher value of () have been achieved for thicker streaks of Ti-54M.
4.3.3. Fractography
Comparing the cases of increasing rotation speed (P5, P1 and P3), Figure 11, we can see that the fractured surfaces for P5, at the root of the weld appears to be mirror like indicating brittle fracture (lowest ductility among P5, P1, and P3). As the amount of Ti-6242 SG in the root of the weld (P1 < P3) increases not only does the ductility improves but also the fractured surfaces emerge as ductile in nature. Furthermore, additional cooling rates of the weld as provided by the backing anvil do not have much influence on the fractured morphology between P1 and P3. Additionally, in the center of the weld, with higher rotation speed, where temperatures are higher, cooling rate is highest for P3 implying that for this case the nature of fracture is ductile intercrystalline while for P1 due to relatively lower cooling rates, the fracture is transcrystalline ductile. In consideration with the stress-strain curve, we can see that P3, due to intercrystalline fracture the ductility is highest. On the top surface of the weld, the fractured morphology remains ductile. It could be an effect of severely refined grains of Ti-6242 SG encountering the shoulder of the tool. As a result, the appearance of fracture remains ductile with transcrystalline for P5 and intercrystalline for P3.
Comparing an effect of traverse speed (P4 < P1 < P2), for highest traverse speed (with lowest exposure time) the ductility is lowest for P2. Additionally, in the root of the weld, the fractured morphology is a composite structure of mirror like and transcrystalline. However, in the center of the weld, for P2, the fractured morphology is intercrystalline which could be a result of fracture along the continuous α layers at the β grain boundary (within multiple streaks of Ti-54M and Ti-6242 SG) at higher cooling rate. In the top of the weld, the fractured surface appears transcrystalline. For the cases of P4 and P1 with cooling rates comparing (P4 < P1), the fractured morphology in the root of the weld for P4 appears as if multiple grains of either Ti-6242 SG or Ti-54M provide enough ductile strength but ultimately fracture individually due to lack of cross linking (or number of streaks) within weld nugget. The magnitude of the effect of these continuous -layers namely the preferential plastic deformation in these areas, depends primarily on the strength difference between these areas, the matrix and on the grain boundary length (grain size of prior ). Another point to notice is that even within the globules of these materials, the material remains ductile showing dimple like fracture. The reason for fractured surface to be uneven is the heterogeneity in the microstructure. Based on the sizes of these clusters of crystal structures it can be said that due to thermal and microstructural gradients in the weld nugget the material of specific volume (shape and size) has somewhat similar microstructure and transformational characteristics () in comparison with another cluster of the material that is being pulled near former one. A correlation between microstructures and fractured morphology can be made by realizing that the untransformed refined flakes and a phase with scattered particles act as a ductile material. Nonetheless, the thermal and microstructural gradient, throughout the weld, in a global tensile test result in an uneven fractured surface with rather severely scattered regions (globules like) showing individual amount of ductility associated with them. Another interesting fact to note here is the evenness of the edges during fracture. While the center of fractured region glimpses an appearance of cup-and-cone-like fracture, the edges of the longitudinal cross section, however, provide a rather lesser (but ductile) elongations. As a result, the overall (global) stress strain behavior is quite different and displays characteristics that are a combination of zone wise characteristics in FSWed joints.
An interesting fact that comes to lights is the effect of boundaries (top and root of the weld) on mechanical properties. Although, crack initiation site is difficult to distinguish yet, based the fractured morphology it appears as if the crack could have started somewhere in the center of the weld (apart from edges). When the cluster of crystals (containing multiple crack initiation sites) was strained enough during tensile loading, fracture of that cluster caused other sites to nucleate and grow in other crystals (either of Ti-54M or of Ti-6242 SG). Based on the fractured morphology and the presence of valley and ridges in case of P4 we can see that the failure is a result of various clusters of crystals within the weld nugget being strained. An interesting point to observe here is the sharp edge on the root of the weld indicating that in comparison with the top of the weld, this region (root of the weld) is more susceptible to fracture. Based on the concave/convex shaped boundary achieved in the macrographs (Figure 4) in the root of the weld, it is quite feasible for a crack to initiate there and propagate along the root of the weld, suggesting that the lack of penetration may result in a possibility of crack initiation at the root of the weld (like P5).
5. Conclusions
In this article, FSWed dissimilar titanium alloys (Ti-6242 SG-ADV; Ti-54M-RET) were characterized for macrostructures, microstructures, microhardness and fractured surfaces under influence of varying rotation and traverse speed. Based on our FSW experimental investigations and observations following conclusions can be derived:
- Defect free welds were produced for 5 mm thick Ti-6242 SG and Ti-54M for a combination of varying rpm (225–325) and traverse speed (100–150 mm·min−1). Additionally, migration of material from retreating to advancing side is primarily dependent on traverse speed.
- Shearing forces, deformational characteristics, transformational mechanisms (either dynamic recrystallization (DRX) or dynamic recovery (DRV) are significantly different from ADV to RET side.
- transus temperature imparts a significant role in the evolution of microstructure on either side of the weld. A notable difference in transus temperature can render different structure and properties. Sensitivity of the results is also direction dependence. Additionally, diffusivity of alloying elements in corresponding phases, results in macro-zones of at multiple locations.
- Variations in microhardness values are dependent on evolution of microstructures and on ability of migrating material (from RET side) to interlock with material (on ADV side).
- In general, we have observed higher values of hardness in the weld nugget with a significant scatter in the data points on the ADV side. On the RET side, however, the variation depends on the width of HAZ or rotation speed (in other words rotation assisted shear forces). In addition, on the ADV side, presence of streaks also governs the variation in the hardness values.
- Mechanical properties (except elastic modulus, ) improve and deteriorate with increasing rpm and traverse speed respectively. Increasing traverse speed has no effect on mechanical properties from 100 to 125 mm·min−1, however, has adverse effect for highest traverse speed 150 mm·min−1.
- From the fractured surface analysis, we can say that due to presence of thermal and microstructural gradient within the weld nugget the individual “zones” act as a separate transcrystalline or intercrystalline ductile material influencing the global appearance of the fractured surface and the stress train curves.
Acknowledgments
The authors are grateful to be supported financially by the Boeing Company.
Author Contributions
Daniel G. Sanders’s lab produced the welded samples, Kapil Gangwar conducted the experiments and microstructural study. Ramulu Mamidala, Kapil Gangwar analyzed the data in consultation with Daniel G. Sanders and contributed to writing and editing the manuscript.
Conflicts of Interest
The authors declare no conflict of interest.
Abbreviations
List of abbreviations and their references used in this article
| ADV | Advancing side |
| BM | Base material |
| CEN | Center |
| EDS | Electron dispersive spectroscopy |
| Elong. | Elongation |
| FSW | Friction stir welding |
| HAZ | Heat affected zone |
| RET | Retreating side |
| SG | Standard grain |
| TMAZ | Thermo mechanically affected zone |
| UTS | Ultimate tensile strength |
| WN | Weld nugget |
| WNB | Weld nugget bottom |
| WNC | Weld nugget center |
| WNT | Weld nugget top |
| YS | Yield strength |
References
- Edwards, P.; Ramulu, M. Fatigue performance of friction stir welded titanium structural joints. Int. J. Fatigue 2015, 70, 171–177. [Google Scholar] [CrossRef]
- Thomas, W.M.; Murch, M.G.; Nicholas, E.D.; Temple-Smith, P.; Needham, J.C.; Dawes, C.J. Improvements Relating to Friction Welding. Google Patents EP 0653265 A2, 17 May 1995. [Google Scholar]
- Ji, S.; Li, Z. Reducing the hook defect of friction stir lap welded Ti-6Al-4V alloy by slightly penetrating into the lower sheet. J. Mater. Eng. Perform. 2017, 26, 921–930. [Google Scholar] [CrossRef]
- Ji, S.; Li, Z.; Zhang, L.; Wang, Y. Eliminating the tearing defect in Ti-6Al-4V alloy joint by back heating assisted friction stir welding. Mater. Lett. 2017, 188, 21–24. [Google Scholar] [CrossRef]
- Rai, R.; De, A.; Bhadeshia, H.K.D.H.; DebRoy, T. Review: Friction stir welding tools. Sci. Technol. Weld. Join. 2011, 16, 325–342. [Google Scholar] [CrossRef]
- Boyer, R.R. An overview on the use of titanium in the aerospace industry. Mater. Sci. Eng. A 1996, 213, 103–114. [Google Scholar] [CrossRef]
- Donachie, M.J. Titanium: A Technical Guide; ASM International: Geauga, OH, USA, 2000. [Google Scholar]
- Lütjering, G.; Williams, J.C. Titanium; Springer: Berlin, Germany, 2007. [Google Scholar]
- Gangwar, K.; Ramulu, M.; Cantrell, A.; Sanders, D.G. Microstructure and mechanical properties of friction stir welded dissimilar titanium alloys: TIMET-54M and ATI-425. Metals 2016, 6, 252. [Google Scholar] [CrossRef]
- Jata, K.; Subramanian, P.; Reynolds, A.; Trapp, T.; Helder, E. Friction Stir Welding of Titanium Alloys for Aerospace Applications: Microstructure and Mechanical Behavior. In Proceedings of the Fourteenth International Offshore and Polar Engineering Conference, Toulon, France, 23–28 May 2004. [Google Scholar]
- Ji, Y.; Wu, S.; Zhao, D. Microstructure and mechanical properties of friction welding joints with dissimilar titanium alloys. Metals 2016, 6, 108. [Google Scholar] [CrossRef]
- Kulkarni, N.R.; Ramulu, M. Experimental and Numerical Analysis of Mechanical Behavior in Friction Stir Welded Different Titanium Alloys. In Proceedings of the ASME 2014 International Mechanical Engineering Congress and Exposition, Montreal, QC, Canada, 14–20 November 2014; p. V02BT02A012. [Google Scholar]
- Kulkarni, N.; Ramulu, M. Experimental Study of Mechanical Performance in Friction Stir Welded Dissimilar Titanium Alloys. In Experimental and Applied Mechanics, Proceedings of the 2015 Annual Conference on Experimental and Applied Mechanics, Costa Mesa, MA, USA, 8–11 June 2015; Sciammarella, C., Considine, J., Gloeckner, P., Eds.; Springer International Publishing: Cham, Switzerland, 2016; Volume 4, pp. 165–171. [Google Scholar]
- Kulkarni, N. Study of the Mechanical Performance of Similar and Dissimilar Titanium Alloy Joints Formed by Diffusion Bonding and Friction Stir Welding. Ph.D. Thesis, Mechanical Engineering, University of Washington, Seattle, WA, USA, 2015. [Google Scholar]
- Krzywinski, M.I.; Schein, J.E.; Birol, I.; Connors, J.; Gascoyne, R.; Horsman, D.; Jones, S.J.; Marra, M.A. Circos: An information aesthetic for comparative genomics. Genome Res. 2009, 19, 1639–1645. [Google Scholar] [CrossRef] [PubMed]
- Gonser, M.J. Microstructure Evolution and Material Flow Behavior in Friction-Stir Welded Dissimilar Titanium Alloys. Ph.D. Thesis, The Ohio State University, Columbus, OH, USA, 2010. [Google Scholar]
- Edwards, P.; Ramulu, M. Peak temperatures during friction stir welding of Ti–6Al–4V. Sci. Technol. Weld. Join. 2010, 15, 468–472. [Google Scholar] [CrossRef]
- Edwards, P.; Ramulu, M. Surface Residual Stresses in Ti-6Al-4V Friction Stir Welds: Pre-and Post-Thermal Stress Relief. J. Mater. Eng. Perform. 2015, 24, 3263–3270. [Google Scholar] [CrossRef]
- Lütjering, G. Influence of processing on microstructure and mechanical properties of (α + β) titanium alloys. Mater. Sci. Eng. A 1998, 243, 32–45. [Google Scholar] [CrossRef]
- Zhang, Y.; Sato, Y.S.; Kokawa, H.; Park, S.H.C.; Hirano, S. Microstructural characteristics and mechanical properties of Ti–6Al–4V friction stir welds. Mater. Sci. Eng. A 2008, 485, 448–455. [Google Scholar] [CrossRef]
Figure 1.
(a) Schematic of friction stir welding, (b) a viewpoint for FSW of dissimilar alloys [15].
Figure 1.
(a) Schematic of friction stir welding, (b) a viewpoint for FSW of dissimilar alloys [15].

Figure 2.
Schematic of locations for microstructures on the transverse cross section of FSWed dissimilar titanium alloys along with specified geometry for tensile specimens.
Figure 2.
Schematic of locations for microstructures on the transverse cross section of FSWed dissimilar titanium alloys along with specified geometry for tensile specimens.

Figure 3.
Typical surface characteristics of FSWed titanium alloys.
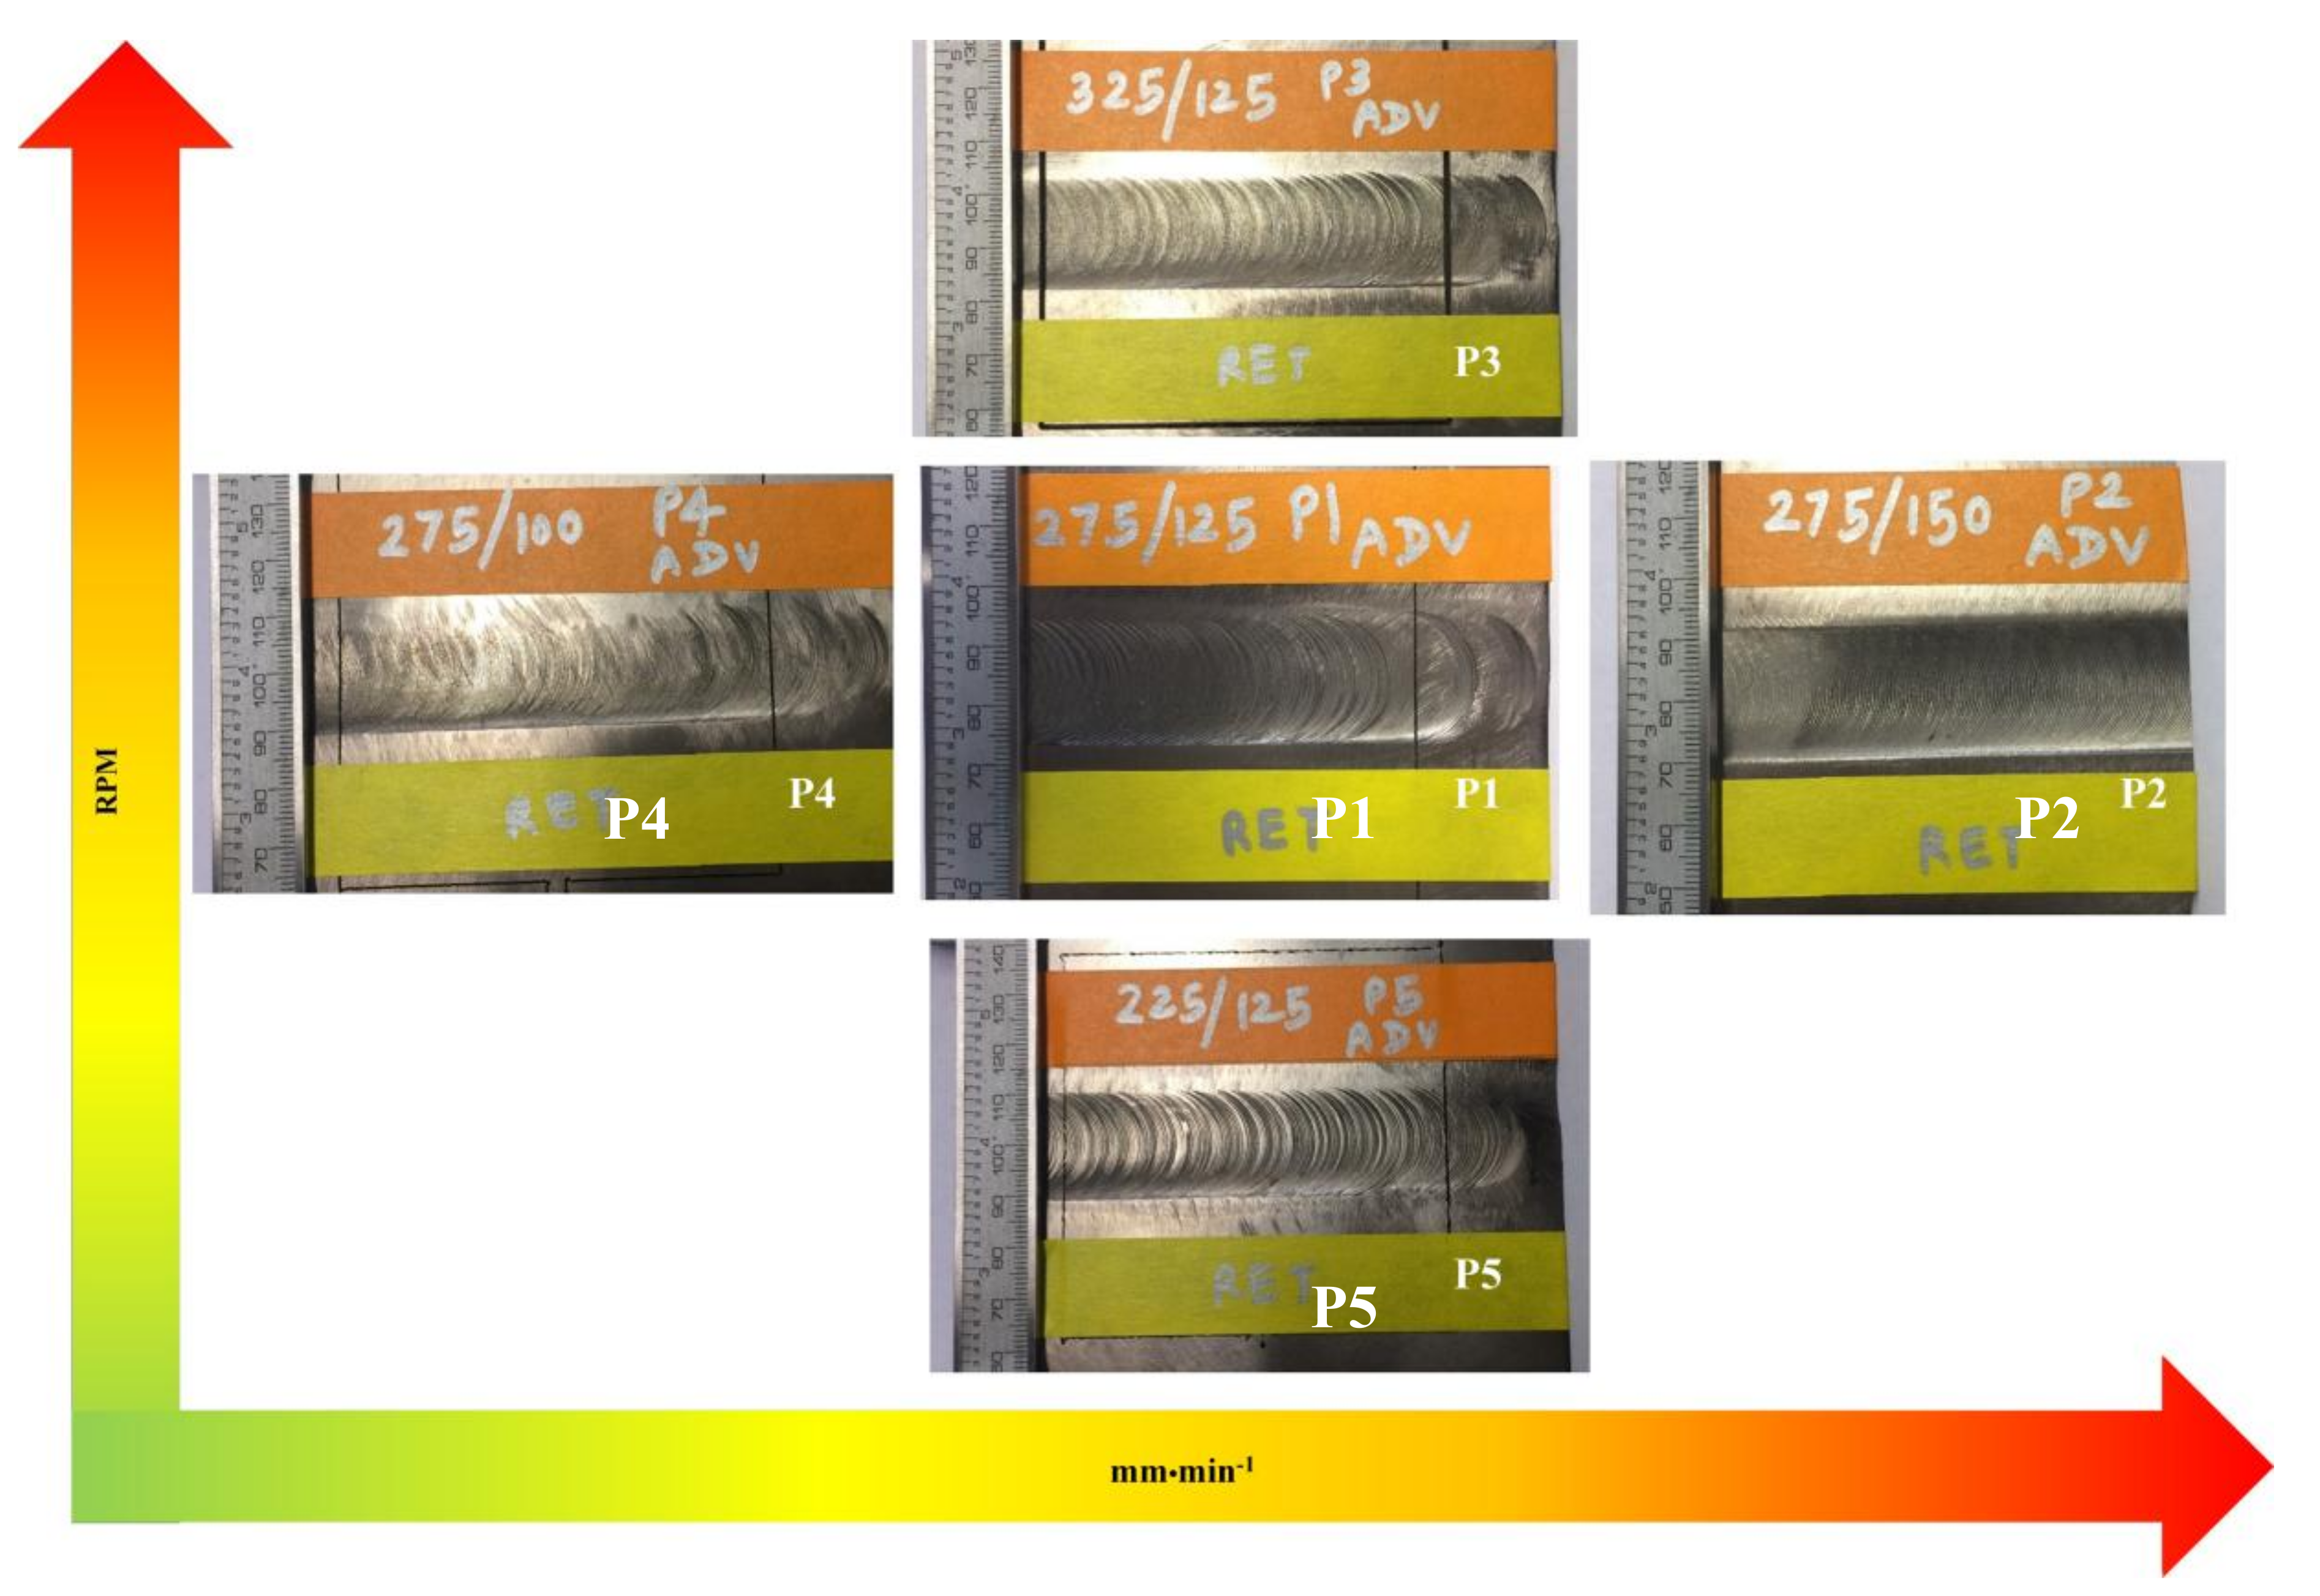
Figure 4.
Macrographs of transverse cross section of FSWed dissimilar titanium alloys as an effect of varying processing parameters.
Figure 4.
Macrographs of transverse cross section of FSWed dissimilar titanium alloys as an effect of varying processing parameters.
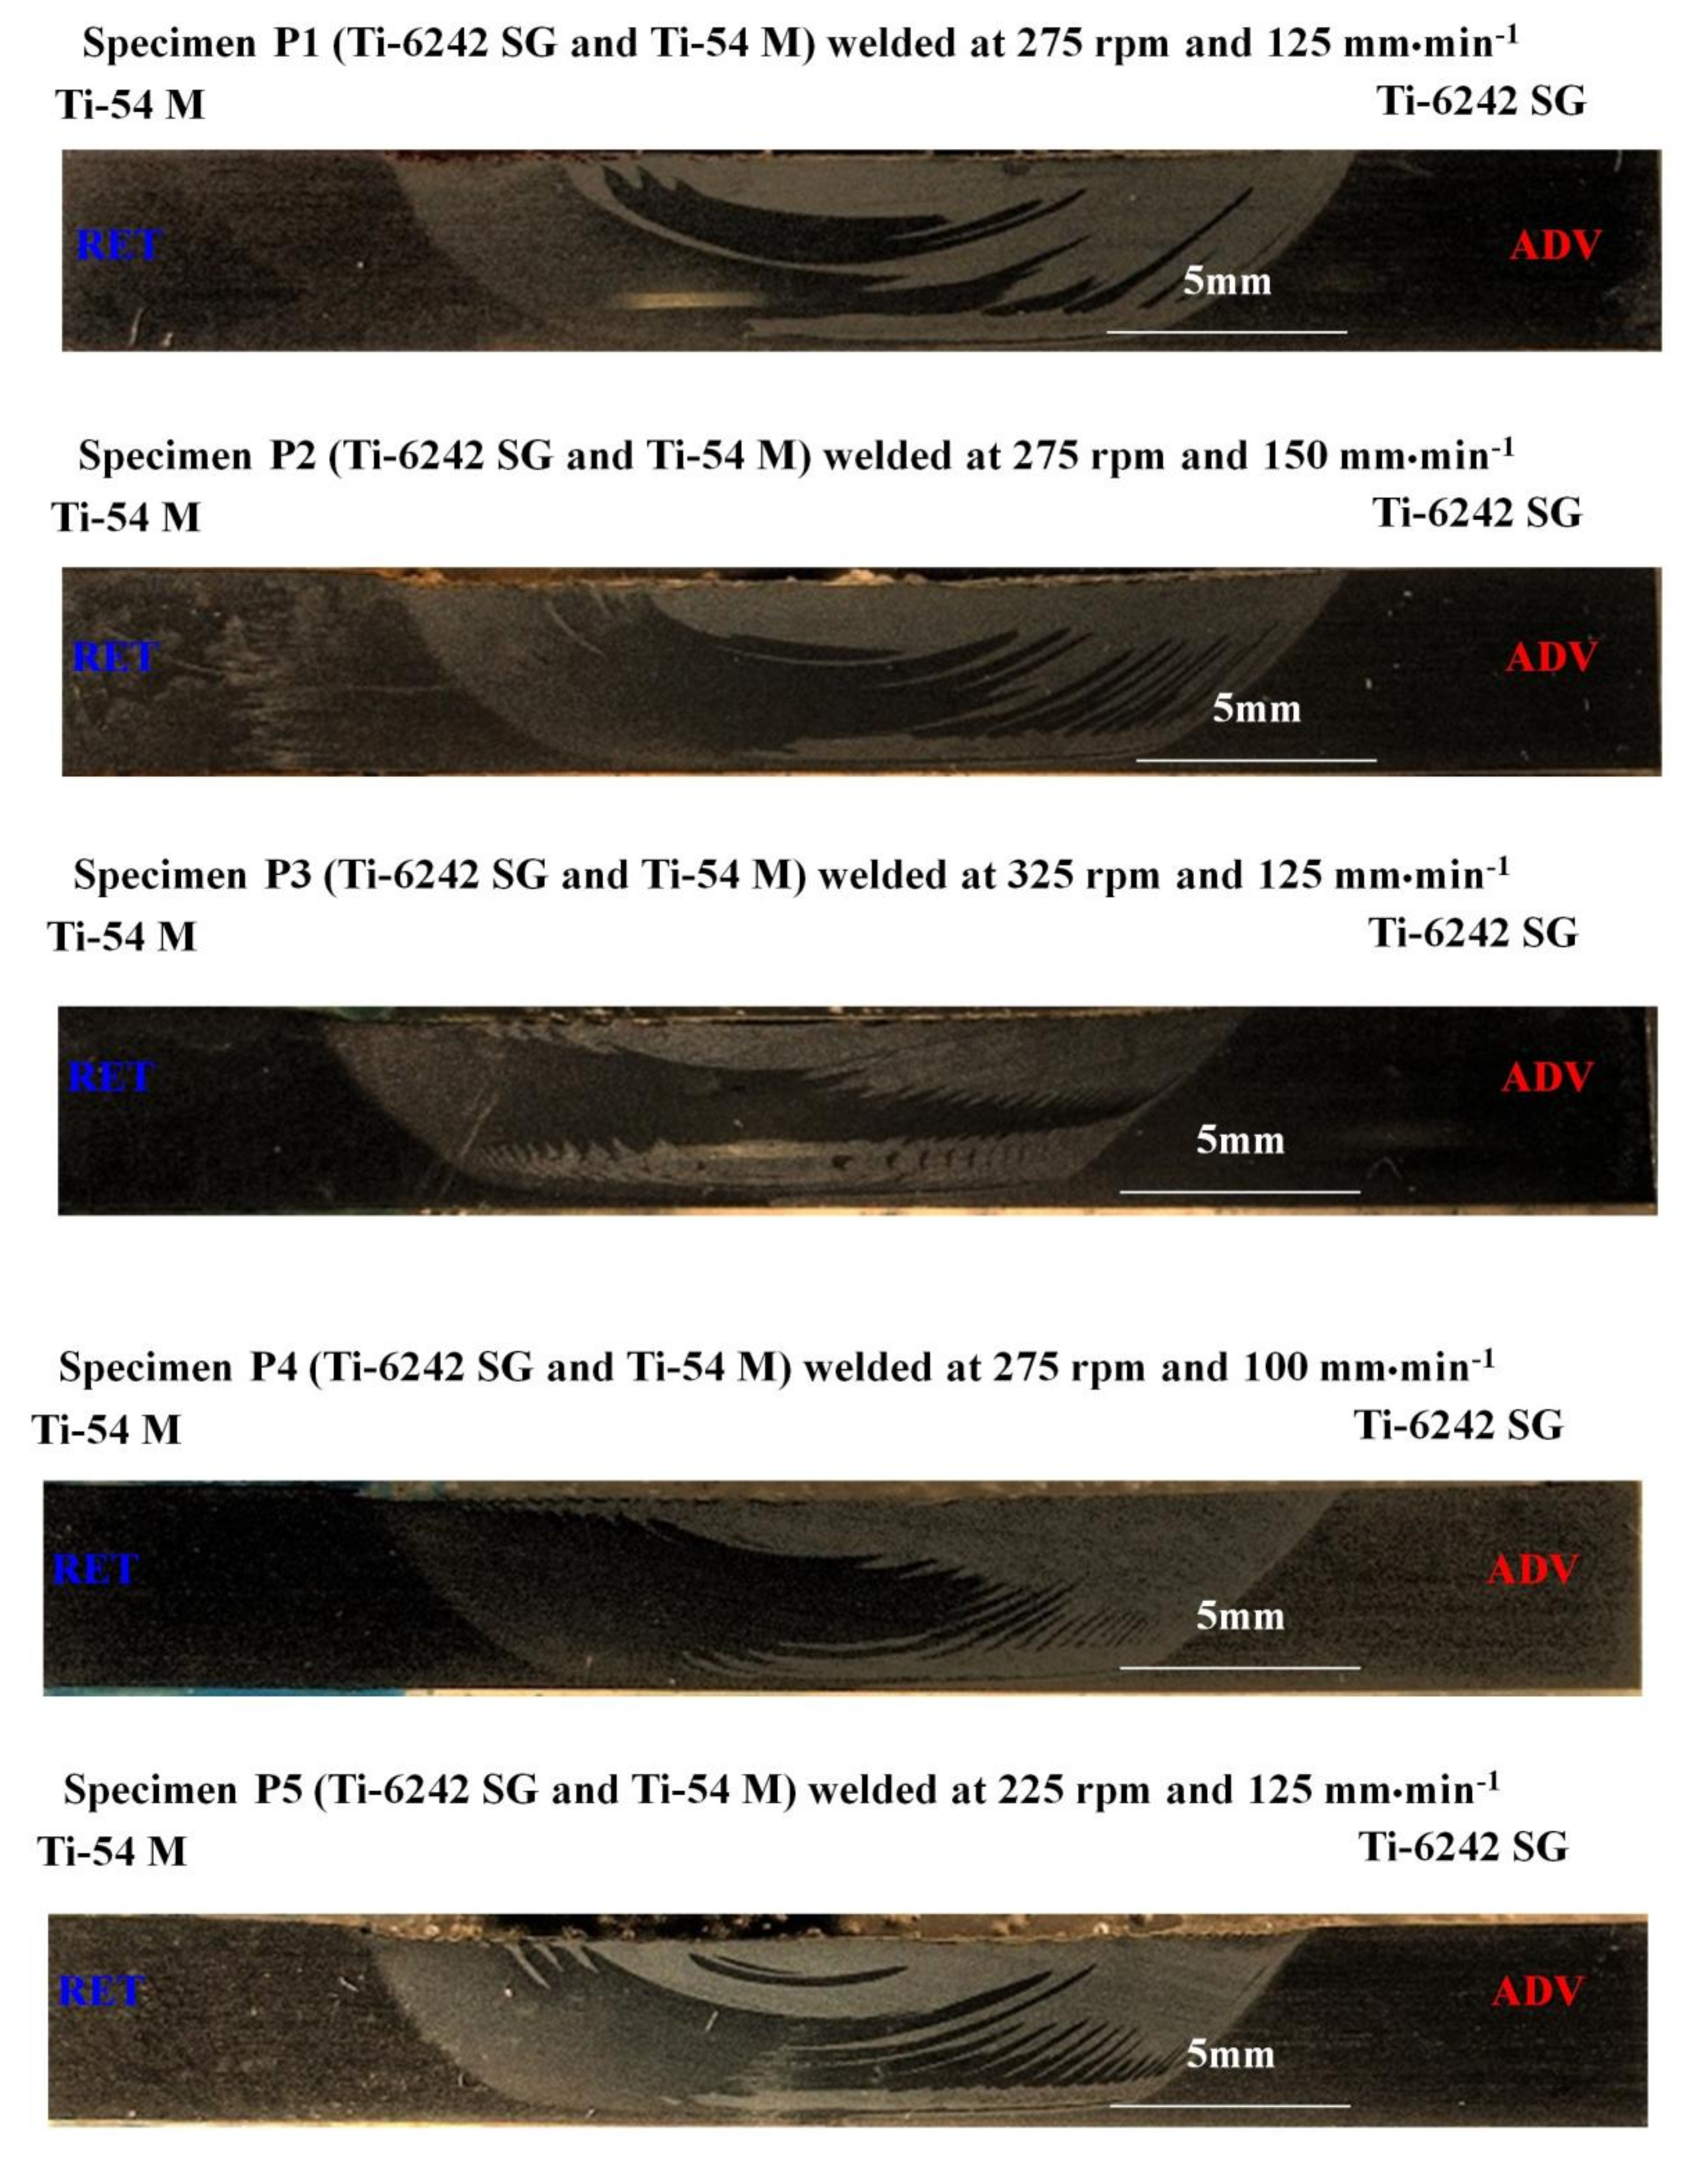
Figure 5.
Base material microstructures. Light and dark phases are and respectively.

Figure 6.
Evolution of microstructure with varying rotation speed (P5 < P1 < P3). For prescribed colors and locations, please refer to Figure 2.
Figure 6.
Evolution of microstructure with varying rotation speed (P5 < P1 < P3). For prescribed colors and locations, please refer to Figure 2.


Figure 7.
Evolution of microstructure with varying traverse speed (P4 < P1 < P2). For prescribed colors and locations, please refer to Figure 2.
Figure 7.
Evolution of microstructure with varying traverse speed (P4 < P1 < P2). For prescribed colors and locations, please refer to Figure 2.

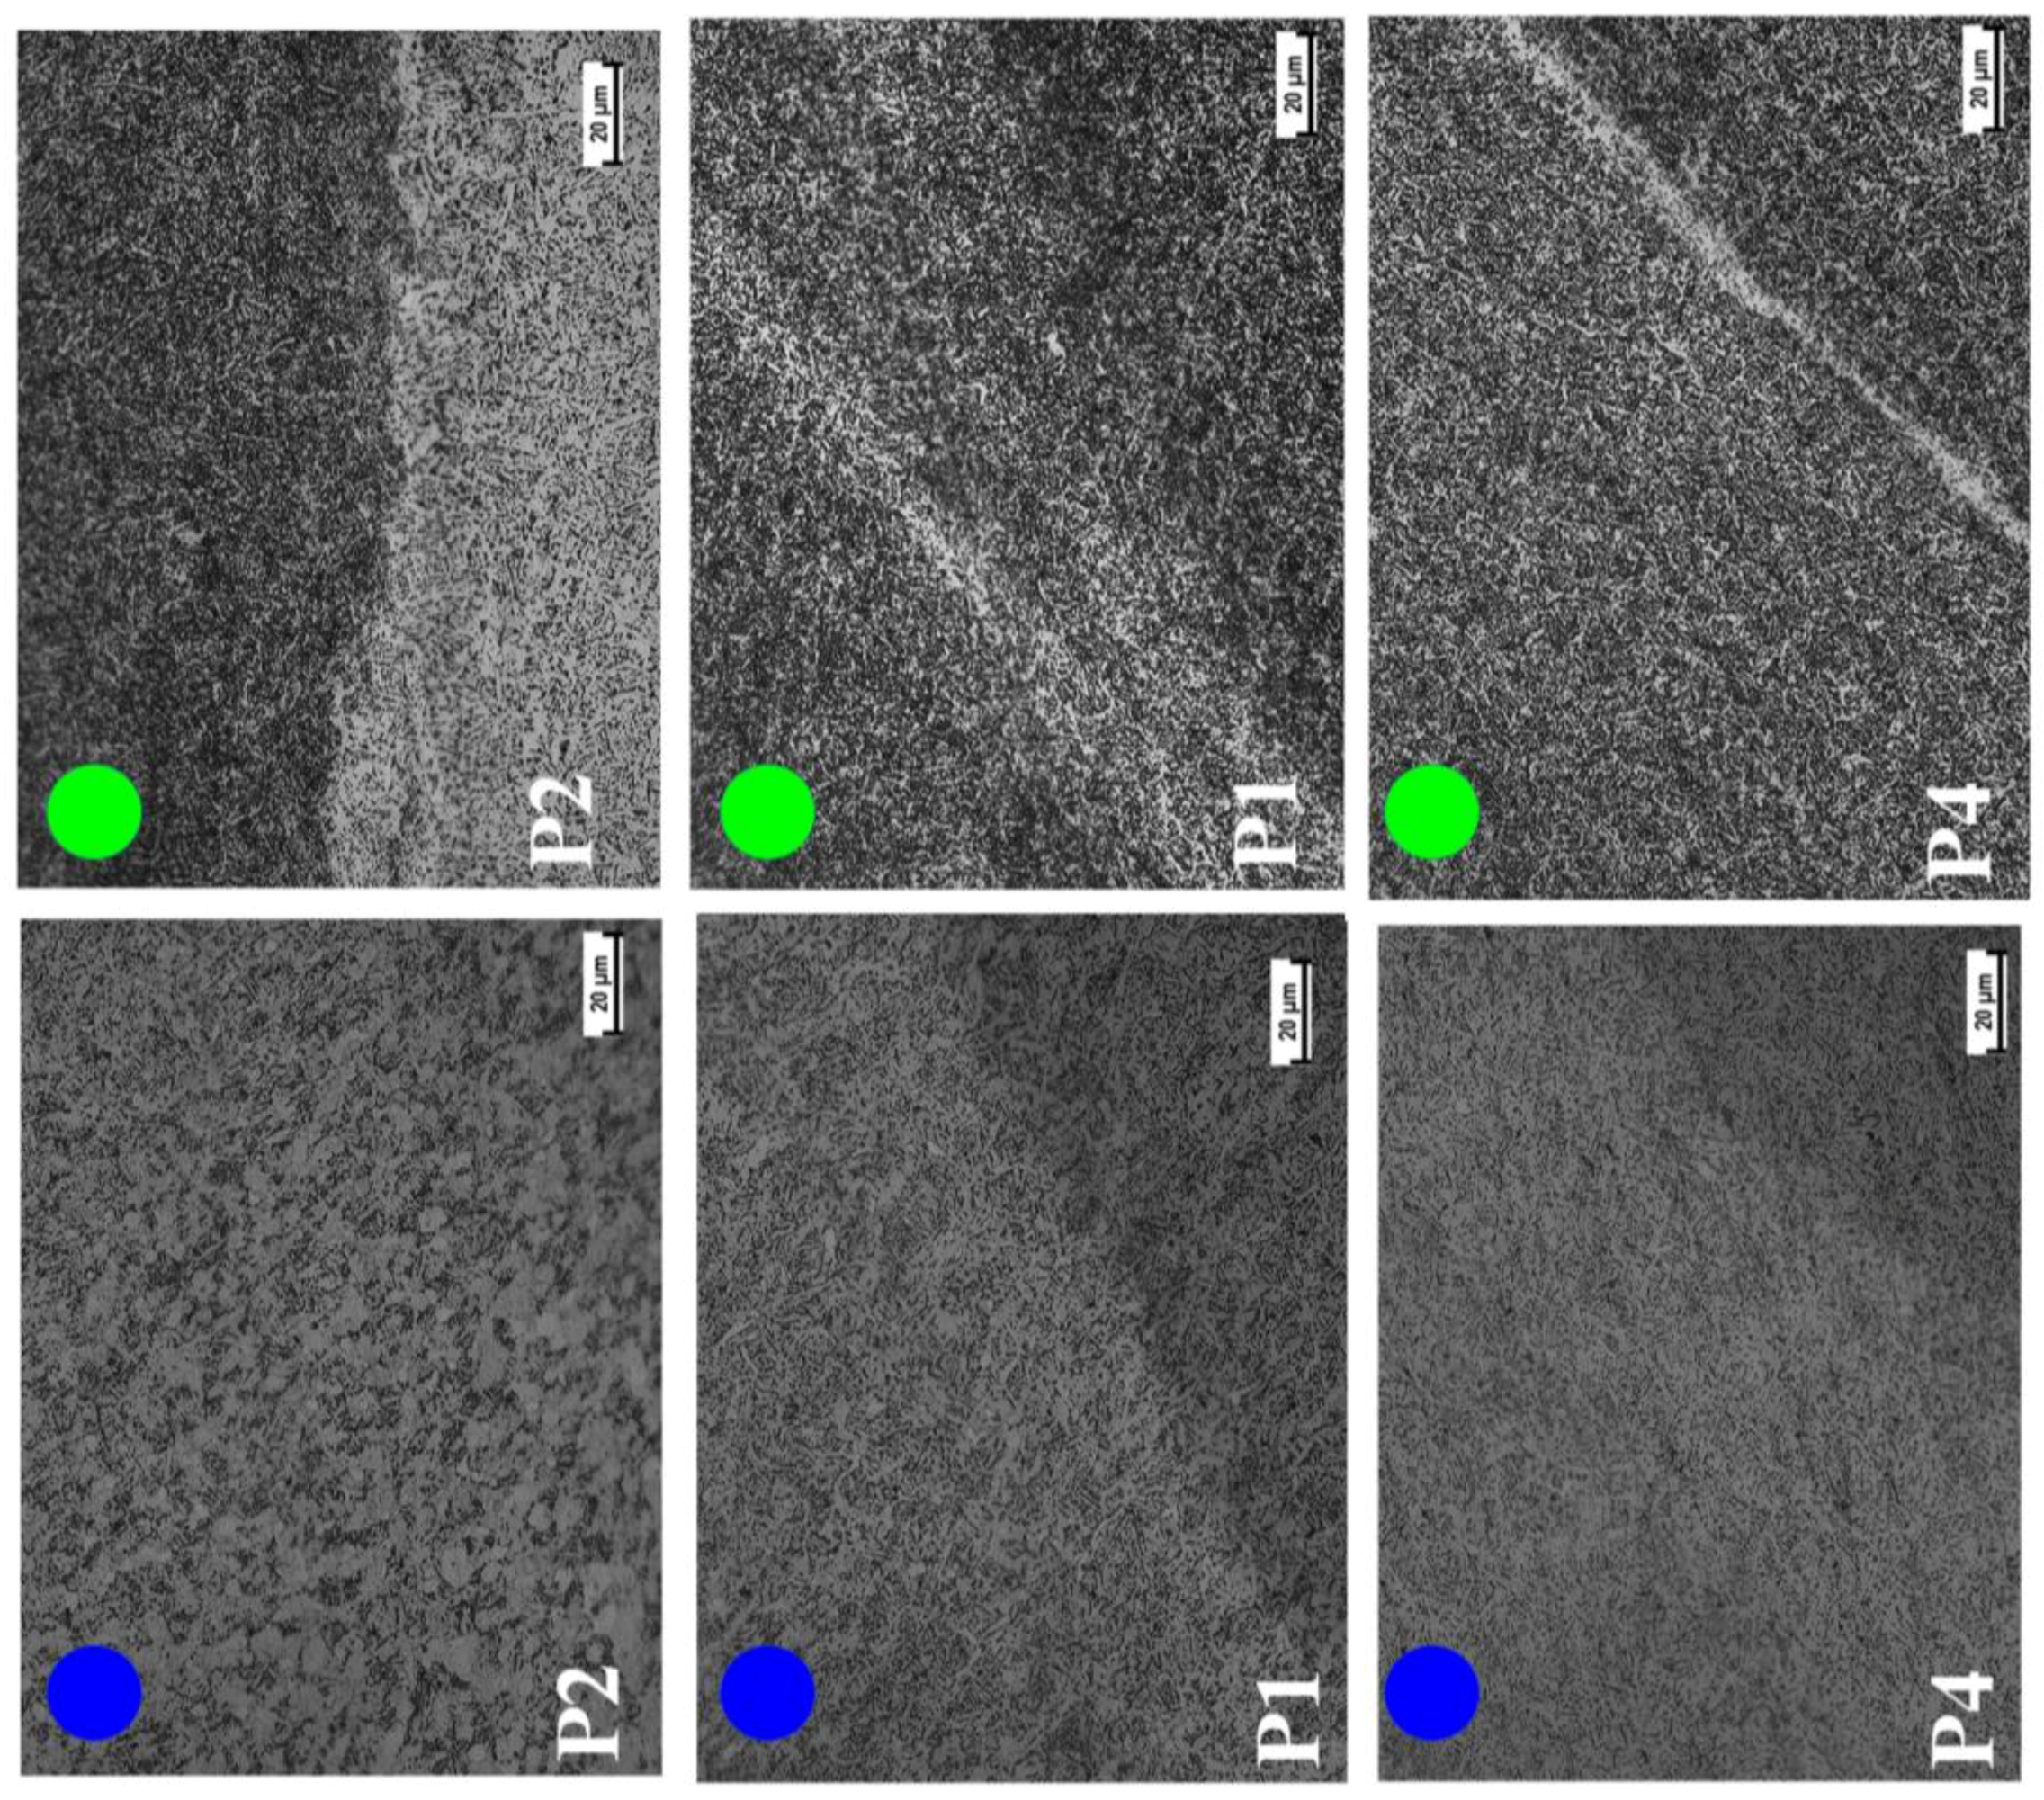
Figure 8.
Full field microhardness profile on transverse cross section of weld.

Figure 9.
Hardness profile observed at the center (1.5 mm below weld surface) of the transverse cross section of the weld for Ti-6242 SG and Ti-54M. Dashed lines (in black) represent the span of WN at 1.5 mm depth from the top of the weld surface.
Figure 9.
Hardness profile observed at the center (1.5 mm below weld surface) of the transverse cross section of the weld for Ti-6242 SG and Ti-54M. Dashed lines (in black) represent the span of WN at 1.5 mm depth from the top of the weld surface.

Figure 10.
Typical engineering stress strain curves and illustration of effect of processing parameters on mechanical properties. For P1–P5 please refer to Table 3.
Figure 10.
Typical engineering stress strain curves and illustration of effect of processing parameters on mechanical properties. For P1–P5 please refer to Table 3.

Figure 11.
Fractured morphology for five specimens at the top, center and in the root of the weld.


Table 1.
List of abbreviations used in Figure 1b.
Table 1.
List of abbreviations used in Figure 1b.
| Anvil | Backing Anvil |
| Ar-Flow | Argon Flow |
| Cyl. | Cylindrical |
| Design | Tool Design |
| Displac. | Displacement Control |
| FSW-A | FSW-Automation |
| FSWed | Friction Stir Welded |
| Load | Load Controlled |
| Mate. | Tool Material |
| Mech. | Mechanical Properties |
| Metall. | Metallurgical properties |
| Power | FSW-A power |
| rpm | Rotation Per Minute |
| Stiffness | Stiffness of FSW-A |
| Strain-R. | Strain Rate |
| T1-ADV | Titanium Alloy 1 kept on Advancing Side |
| T2-RET | Titanium Alloy 2 Kept on Retreating Side |
| Taper | Tapered |
| Temp. | Temperature |
| Thread | Threaded |
| Tilt | Tilt Angle |
| Tool | Tool |
| Traverse | feed Rate (mm·min−1) |
| Wear | Wear |
Table 2.
Composition (wt %) of titanium alloys undertaken in this research work.
| Alloy/Element | Ti | C | Fe | N | Al | O | V | H | Sn | Zr | Mo | Si | H2 (bar) | Other |
|---|---|---|---|---|---|---|---|---|---|---|---|---|---|---|
| Ti-6242 | 85.643 | 0.05 | 0.025 | 0.05 | 6 | 0.12 | 0.0125 | 2 | 4 | 2 | 0.1 | |||
| Ti-54 | 90 | 0.4 | 5 | 4 | 0.6 |
Table 3.
Summary of processing conditions for the friction stir welding of similar and dissimilar titanium alloys.
Table 3.
Summary of processing conditions for the friction stir welding of similar and dissimilar titanium alloys.
| Plate Denomination | RPM | Traverse Speed (mm·min−1) |
|---|---|---|
| P1 | 275 | 125 |
| P2 | 275 | 150 |
| P3 | 325 | 125 |
| P4 | 275 | 100 |
| P5 | 225 | 125 |
© 2017 by the authors. Licensee MDPI, Basel, Switzerland. This article is an open access article distributed under the terms and conditions of the Creative Commons Attribution (CC BY) license (http://creativecommons.org/licenses/by/4.0/).
Share and Cite
MDPI and ACS Style
Gangwar, K.; Mamidala, R.; Sanders, D.G. Friction Stir Welding of near α and α + β Titanium Alloys: Metallurgical and Mechanical Characterization. Metals 2017, 7, 565. https://doi.org/10.3390/met7120565
AMA Style
Gangwar K, Mamidala R, Sanders DG. Friction Stir Welding of near α and α + β Titanium Alloys: Metallurgical and Mechanical Characterization. Metals. 2017; 7(12):565. https://doi.org/10.3390/met7120565
Chicago/Turabian StyleGangwar, Kapil, Ramulu Mamidala, and Daniel G. Sanders. 2017. "Friction Stir Welding of near α and α + β Titanium Alloys: Metallurgical and Mechanical Characterization" Metals 7, no. 12: 565. https://doi.org/10.3390/met7120565
Note that from the first issue of 2016, this journal uses article numbers instead of page numbers. See further details here.