Effect of Weld Current on the Microstructure and Mechanical Properties of a Resistance Spot-Welded TWIP Steel Sheet


Engineering Faculty, Mechanical Engineering Department, Uludag University, 16059 Gorukle-Bursa, Turkey
*
Author to whom correspondence should be addressed.
Metals 2017, 7(12), 519; https://doi.org/10.3390/met7120519
Submission received: 30 September 2017
/
Revised: 1 November 2017
/
Accepted: 14 November 2017
/
Published: 23 November 2017
(This article belongs to the Special Issue Alloy Steels)
Abstract
:In this study the effect of the weld current on the microstructure and mechanical properties of a resistance spot-welded twinning-induced plasticity (TWIP) steel sheet was investigated using optical microscopy, scanning electron microscopy–electron back-scattered diffraction (SEM–EBSD), microhardness measurements, a tensile shear test and fractography. Higher weld currents promoted the formation of a macro expulsion cavity in the fusion zone. Additionally, higher weld currents led to a higher indentation depth, a wider heat-affected zone (HAZ), coarser grain structure and thicker annealing twins in the HAZ, and a relatively equiaxed dendritic structure in the centre of the fusion zone. The hardness values in the weld zone were lower than that of the base metal. The lowest hardness values were observed in the HAZ. No strong relationship was observed between the hardness values in the weld zone and the weld current. A higher joint strength, tensile deformation and failure energy absorption capacity were obtained with a weld current of 12 kA, a welding time of 300 ms and an electrode force of 3 kN. A complex fracture surface with both brittle and limited ductile manner was observed in the joints, while the base metal exhibited a ductile fracture. Joints with a higher tensile shear load (TSL) commonly exhibited more brittle fracture characteristics.
1. Introduction
Due to strict energy-efficiency regulations aimed at reducing exhaust emissions, researchers are making an effort to reduce vehicle weights to enhance vehicle fuel efficiency. Innovative high-strength steels are frequently used to both reduce the vehicle weight and to improve passenger safety. In recent years, considerable efforts have focused on high manganese twinning-induced plasticity (TWIP) steels for car body manufacturing, which are composed of a fully austenitic microstructure with a high amount of manganese and a significant percentage of carbon. The characteristics of TWIP steels, such as their outstanding mechanical properties, including high tensile strength, large ductility, high work-hardening rates, non-magnetism and high impact resistivity, have made these steels attractive to the automobile sector since they fulfil the requirements for safety, energy economy and environmental protection. The predominant deformation mechanism of TWIP steels is twinning, which is determined by the stacking fault energy (SFE) value, depending on the Mn, Al, Si and C content as well as on temperature [1,2,3,4]. Medium SFE values (between 20 and 35 mJ/m2) provide mechanical twinning inside the grains [4,5,6].
Numerous studies have been carried out on the microstructure, mechanical properties and plastic deformation mechanisms of TWIP steels [1,4,5,6,7,8,9,10]. The weldability of TWIP steel sheets is another matter of concern that needs to be studied in more detail since the use of metal sheets in the automobile sector inevitably involves welding. Resistance spot welding (RSW), in which two or three superposed sheets are welded by means of local heating caused by the Joule effect, is the most commonly used method of joining metal sheets in car-body manufacturing because of its low cost, speed, cleanliness and ease of automation [11,12,13,14]. However, the designed microstructure of steel sheets is destroyed during the RSW process due to the welding thermal cycle. As a result, the microstructural evolution during RSW is highly dependent on the welding parameters. The microstructural changes during the RSW process strongly influence the mechanical properties. In previous studies of resistance spot-welded TWIP steels, Saha et al. [15] investigated the heat-affected zone (HAZ) liquation crack and segregation behaviour of resistance spot-welded TWIP steel and reported that the crack length and crack opening widths increased with heat input. Furthermore, Saha et al. [11] reported the microstructure, mechanical properties and fracture morphology of resistance spot-welded TWIP steels. Yu et al. [16] identified the RSW characteristics of 1 GPa grade TWIP steel. Spena et al. [17] investigated the effects of the process parameters on the mechanical and microstructural properties of resistance spot-welded TWIP sheets and reported that an improper clamping force and weld current promoted excessive metal expulsions and the formation of welding defects in the weld spots. Yu et al. [18] considered improvements to the weldability of 1-GPa grade TWIP steel, and found that a larger nugget size (NS) and higher tensile shear strength were obtained in constant power-control welding compared to constant current-control welding. Razmpoosh et al. [19] also evaluated the microstructure and mechanical properties of resistance spot-welded TWIP steel and reported that the HAZ exhibited a significant grain growth in the narrow band, and an increase in the weld current and time led to a significant drop in the peak load during tensile shear tests.
In recent years, TWIP sheet steels have gained popularity in the modern automotive industry. Therefore, the application of these steels requires a more complete understanding of the issues associated with RSW. It is thus important to study the welding behaviour of the resistance spot-welded joints of TWIP sheet steels. In this experimental study, the microstructural changes, microhardness, tensile shear properties and fracture morphologies of TWIP steel sheets welded at different weld currents were investigated in detail.
2. Experimental Procedure
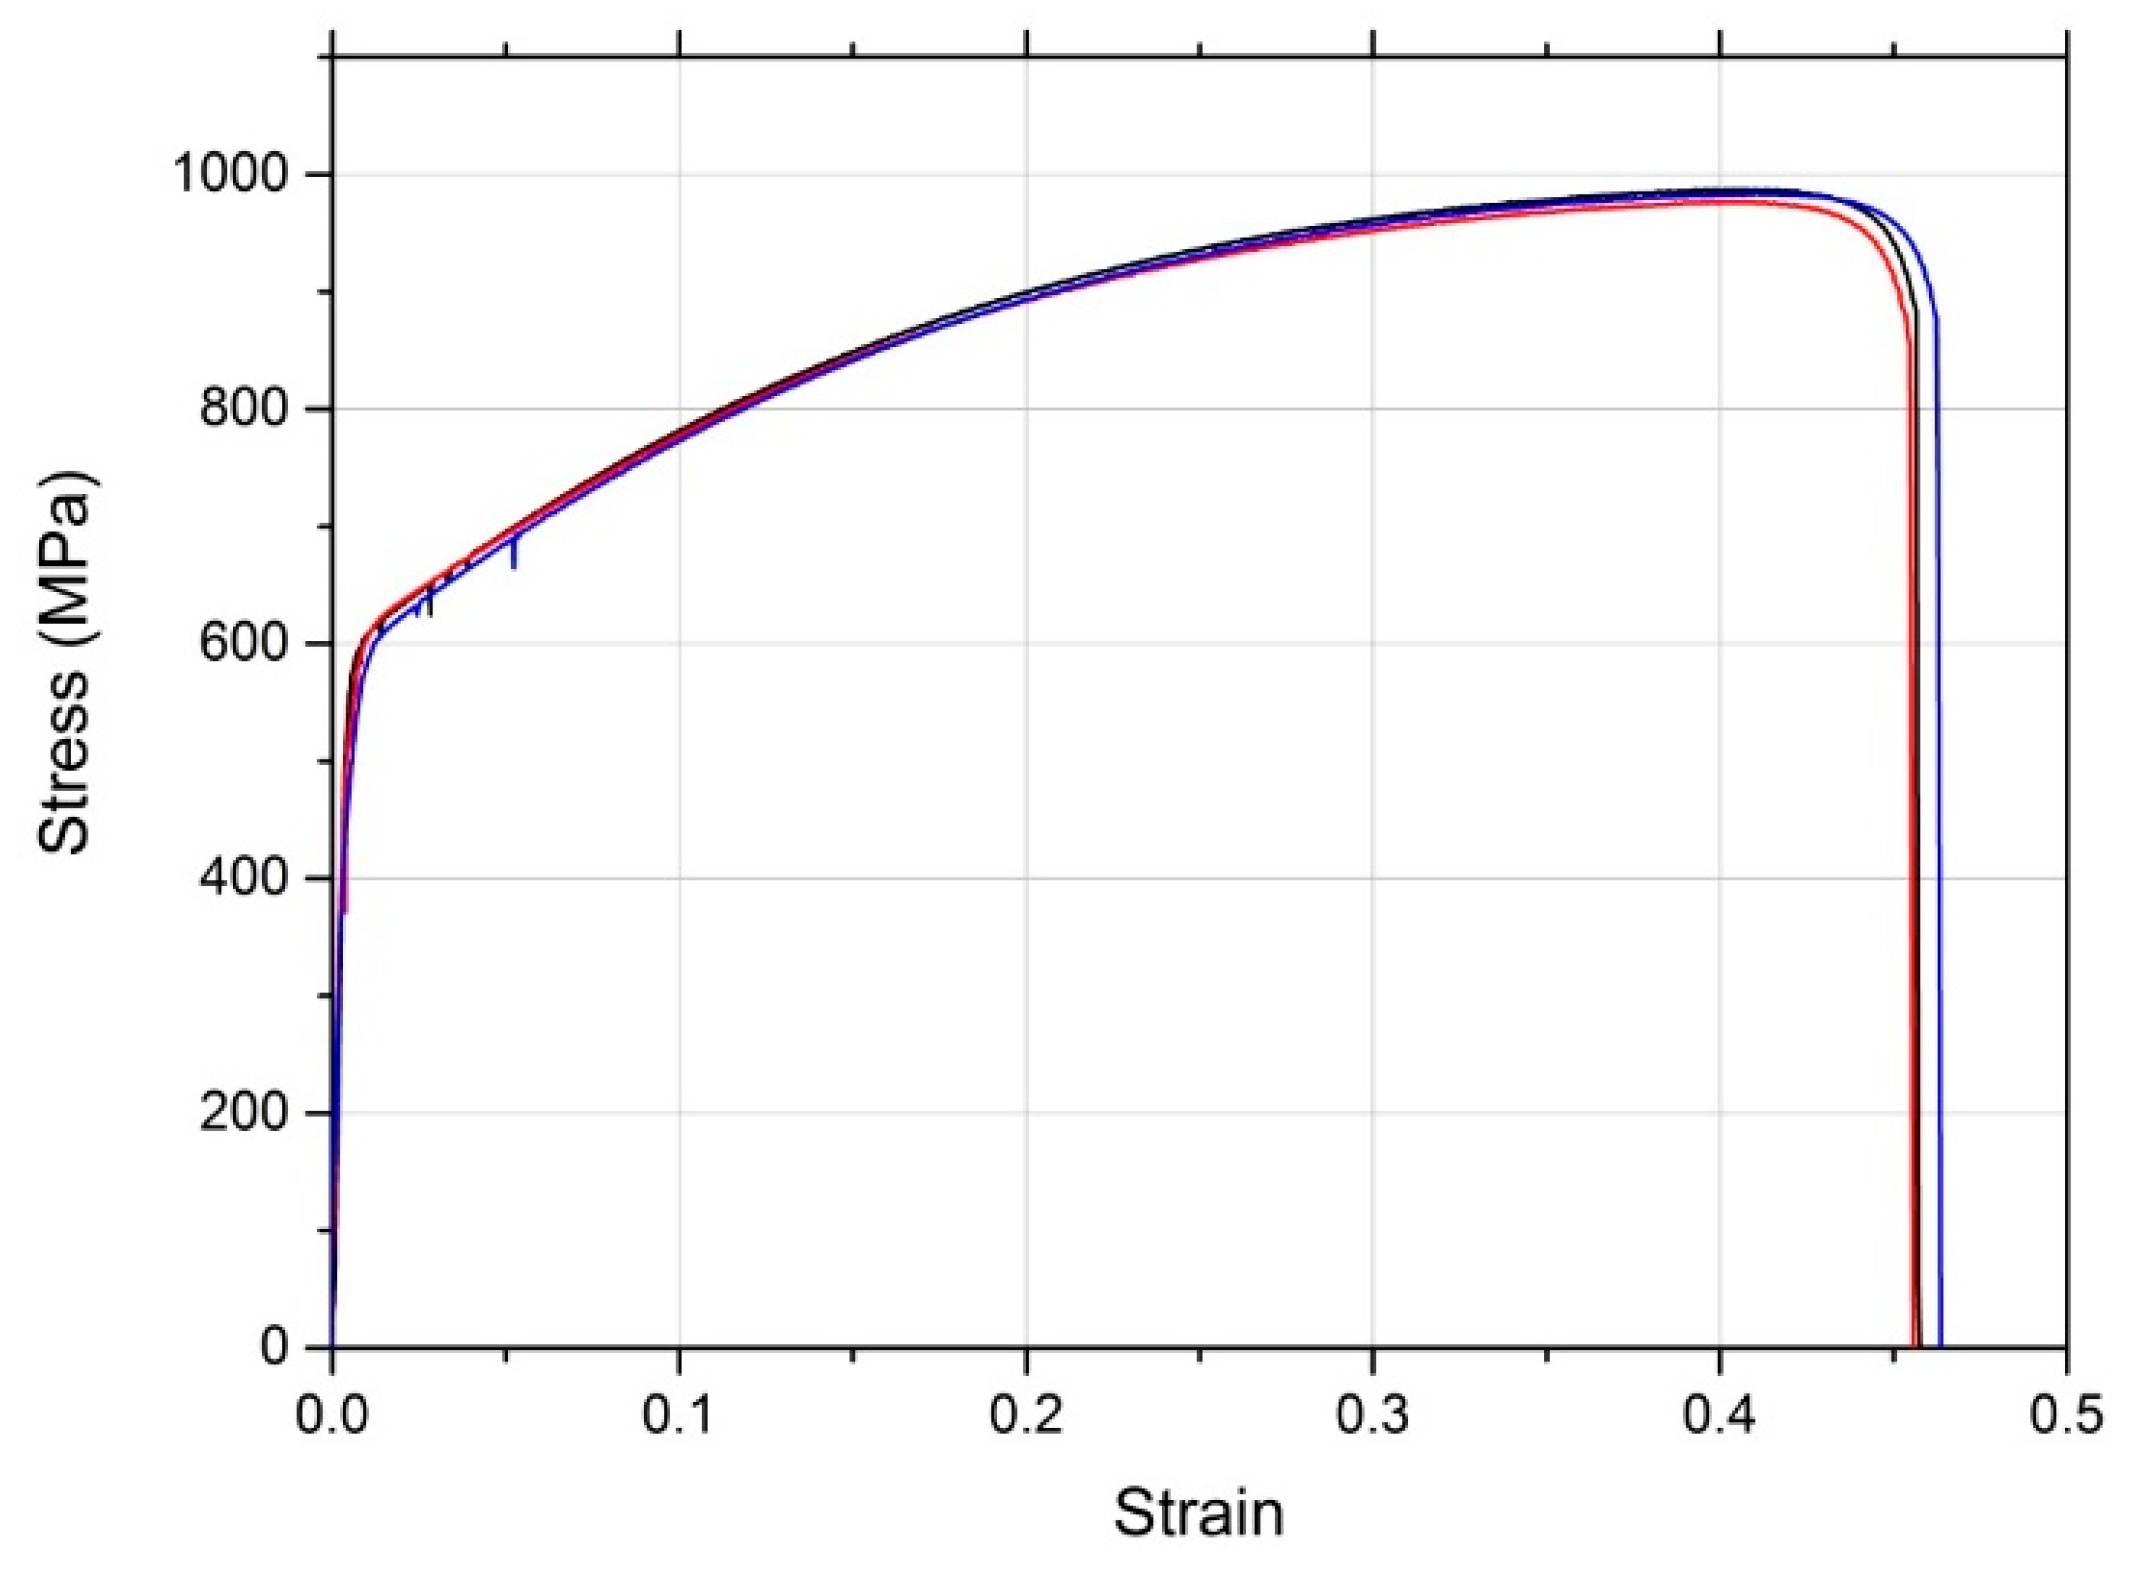
In this study, 1.3 mm thick commercial TWIP steel sheets were used to study the microstructure and mechanical behaviour of resistance spot-welded TWIP steel joints. The chemical composition and tensile properties of the TWIP steel used in this investigation are shown in Table 1 and Table 2, respectively. The tensile properties of the TWIP steel sheets used in this study were determined using a standard tensile test according to the ASTM E8 [20] (Figure 1). The tensile-test curves of the investigated TWIP steel can be seen in Figure 2.
The samples were cut into pieces with dimensions of 50 mm × 20 mm using a laser-cutting machine and RSW was performed by overlapping the sheets (Figure 3). The joining processes were carried out using a medium-frequency direct current (MFDC) RSW machine connected to an ABB robot arm (Figure 4). Copper alloy electrodes with a face diameter of 6 mm were employed. Before welding, the sheets were cleaned with acetone in order to remove oil, oxide and surface scale on both sides of the sheets. The welds were performed with welding currents of 8, 9, 10, 11 and 12 kA, while keeping the other parameters constant (Table 3). A parameter chart of the welding process used in this study can be seen in Figure 5. To avoid effects due to the electrode tip diameter, the electrode tip was changed or subjected to precision machining after each set of 20 welds.
The characterization of the microstructural evolution of the welded specimens was performed using optical microscopy and scanning electron microscopy–electron back-scattered diffraction (SEM–EBSD). The welded joints were cross-sectioned through the weld nugget centre using an electrical-discharge cutting machine. The transverse weld sections were mounted, ground and mechanically polished successively with a 0.25 µm diamond paste. The microstructure was revealed successively with a two-step tint-etching method using Nital (3%) and a Na2S2O5 solution (10 g Na2S2O5 in 100 mL H2O), respectively. The optical microscopy studies of the welded sections were carried out using a Nikon DIC microscope under polarized light with a Clemex image analysis system. For EBSD analyses, the welded sections were polished mechanically with a 1-μm diamond paste. Then, the specimens were polished with an active oxide polishing suspension through 0.05 μm colloidal silica particles for 10 min. Scans with step sizes of 0.1 µm for the base metal (BM) and 0.2 µm for the HAZs were carried out on a Zeiss Merlin FEG-SEM microscope equipped with an EDAX/TSL EBSD system, using a Hikari EBSD camera. An electron beam with a 15 kV accelerating voltage and a beam current of 5 nA was used with a sample working distance of 13 mm. The EBSD data was processed with TSL Orientation Imaging Microscopy (OIM) analysis version 7.2. In the EBSD analyses, initially, the grain confidence index standardization (GCIS) clean-up method was used. Grains with an average GCIS < 0.1 were excluded. Crystallographic data were expressed as inverse pole figure (IPF) maps with image quality (IQ) maps, misorientation angle profiles and the distribution of coincidence site lattice (CSL) type boundaries. The grains in the IPF and IQ maps were defined as clusters of neighbouring points with a misorientation of less than 5° from each other. The CSL-type boundaries and misorientation angles were calculated using only the identified grains.
To describe the mechanical behaviour of the joints, microhardness measurements and tensile–shear tests were conducted. Vickers microhardness tests were performed on the metallographic specimens using a DUROLINE-M microhardness tester with a dwell time of 10 s and an indenter load of 200 g for the HAZ and the BM, and 500 g for the fusion zone (FZ) to avoid inaccurate measurements of the coarse dendritic structure in the FZ-containing micro-pores. The tensile shear tests were performed with a fully computerized UTEST-7014 tensile testing machine in laboratory conditions using a crosshead displacement speed of 5 mm/min. The maximum tensile shear load (TSL), the tensile deformation and the failure energy absorption capacity of the joints were extracted from the TSL-deformation curves of the joints. The fracture surfaces of the joints were also examined using a Zeiss EVO 40 XVP type SEM operated at 20 kV. The NS of the welds was measured through the fractured specimens in all welding conditions using a Mitutoyo digital calliper.
3. Results and Discussion
3.1. Microstructure
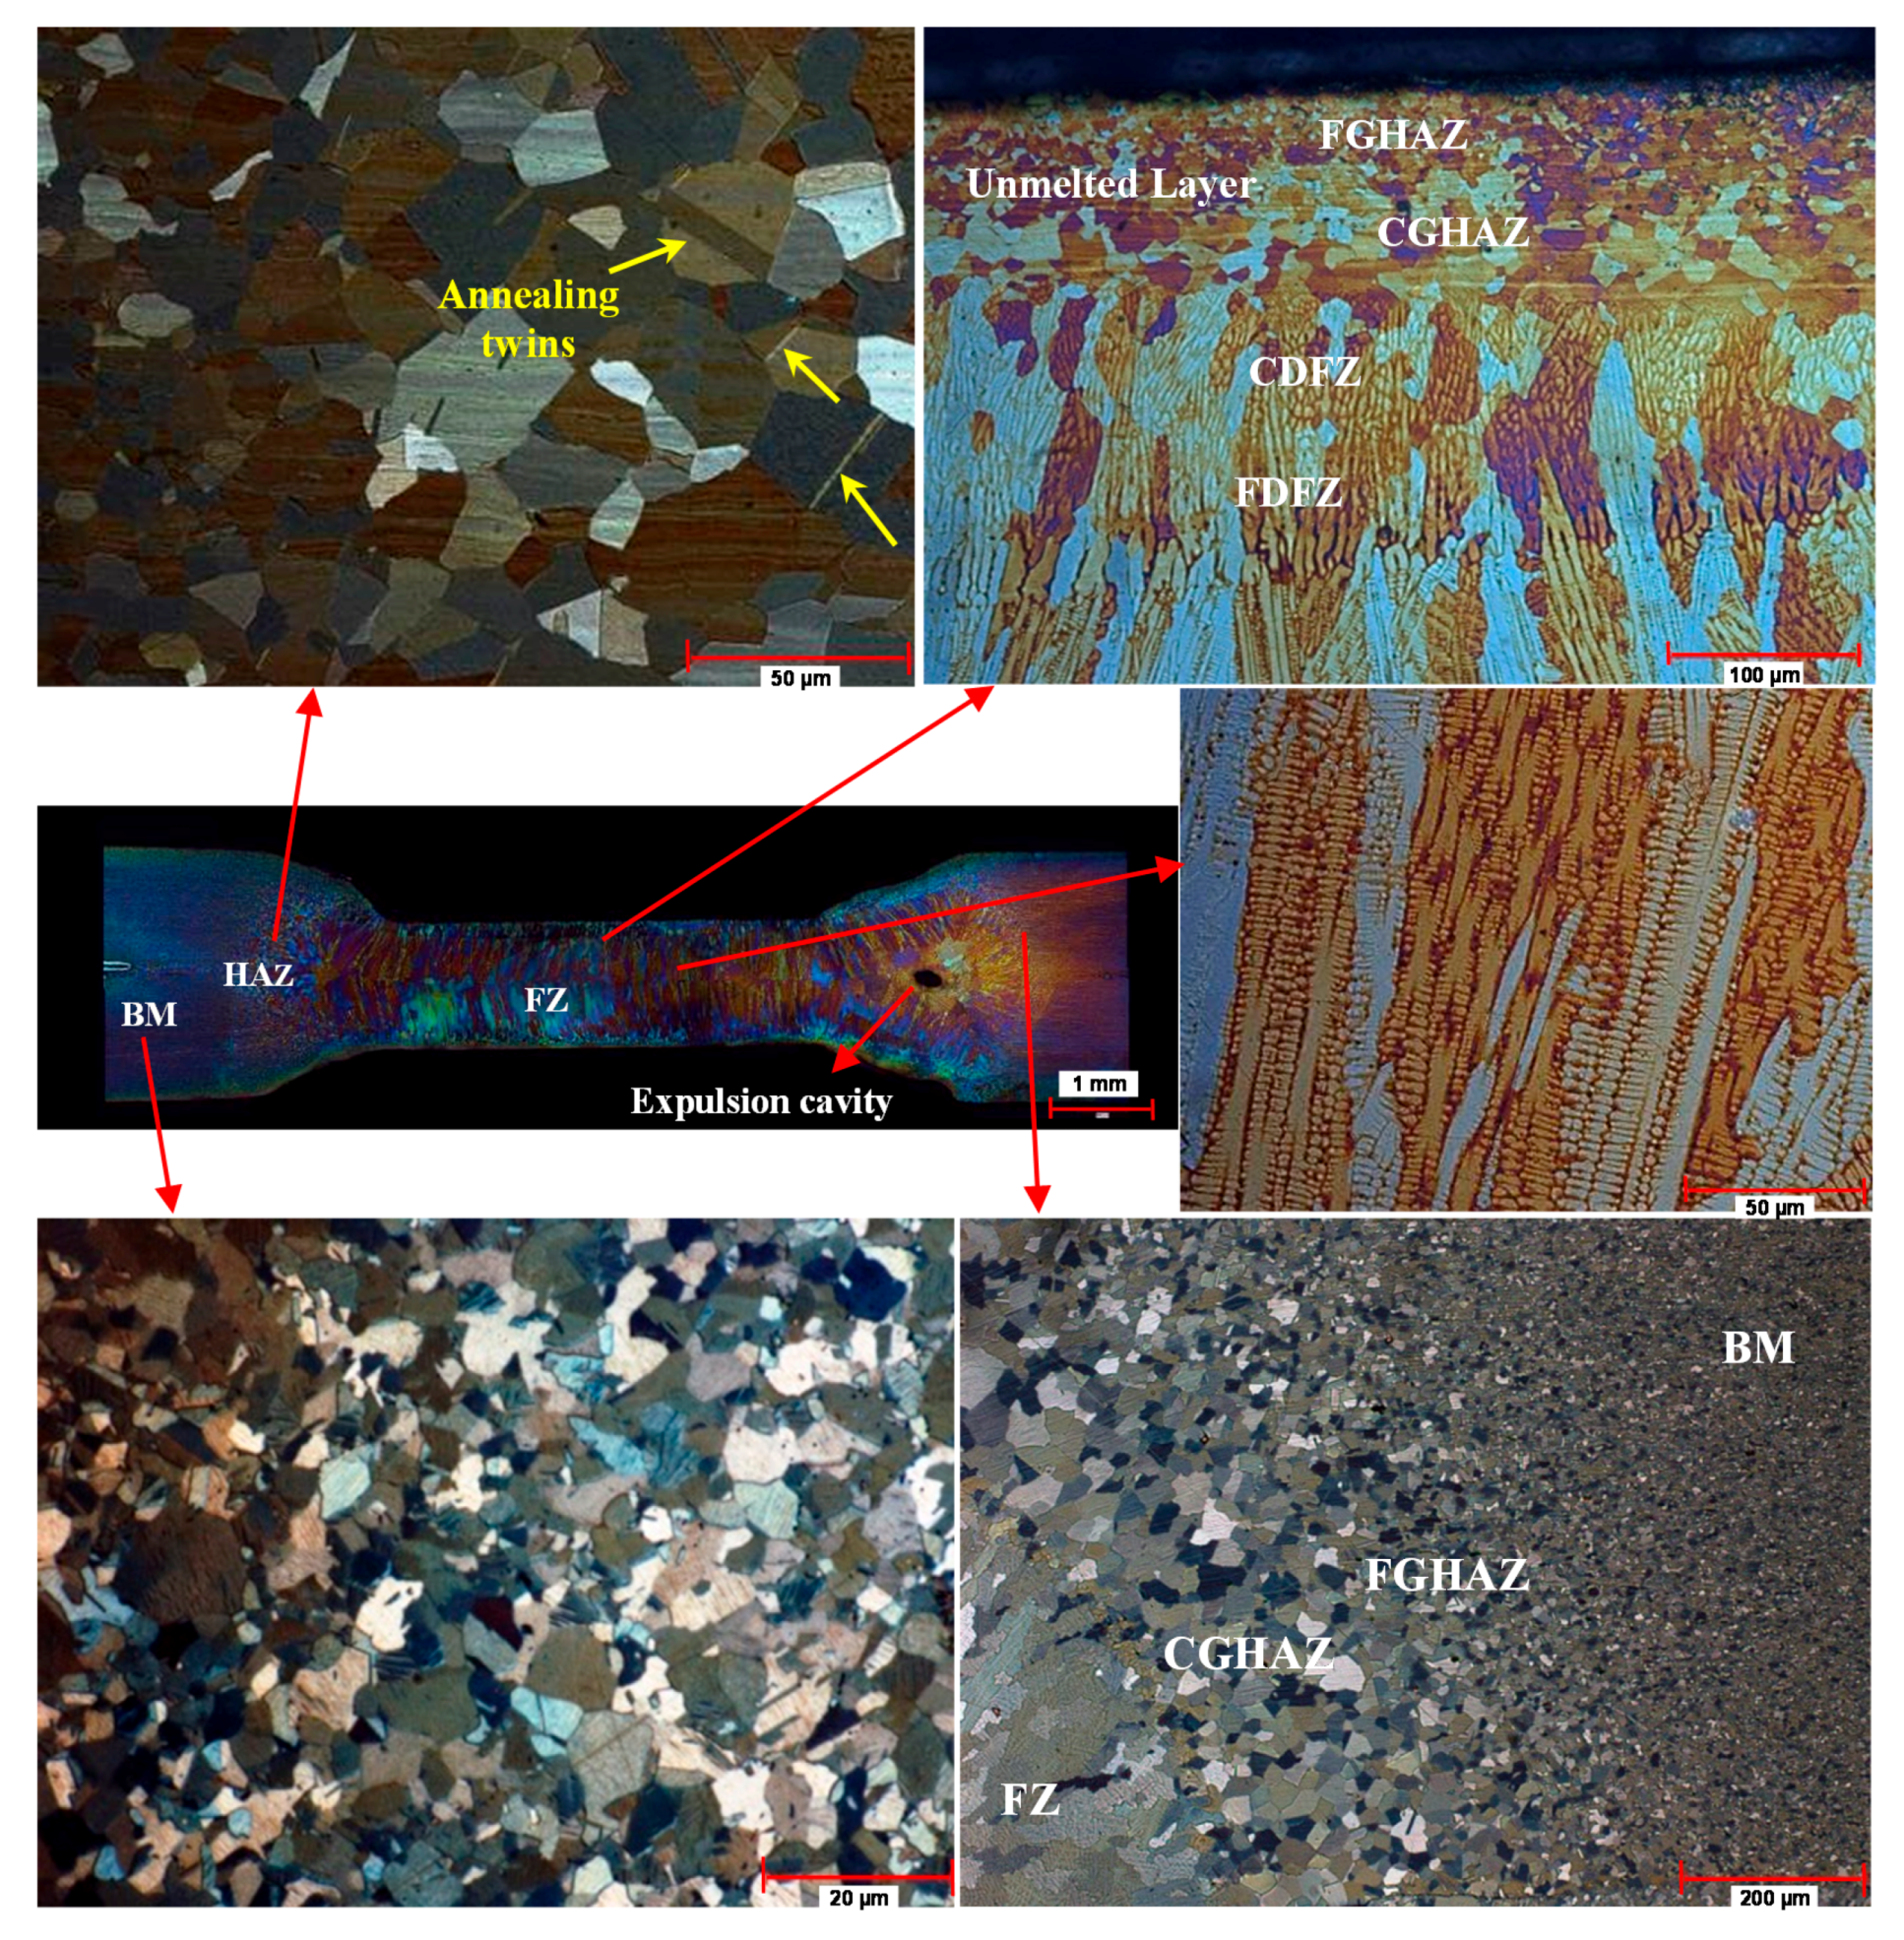
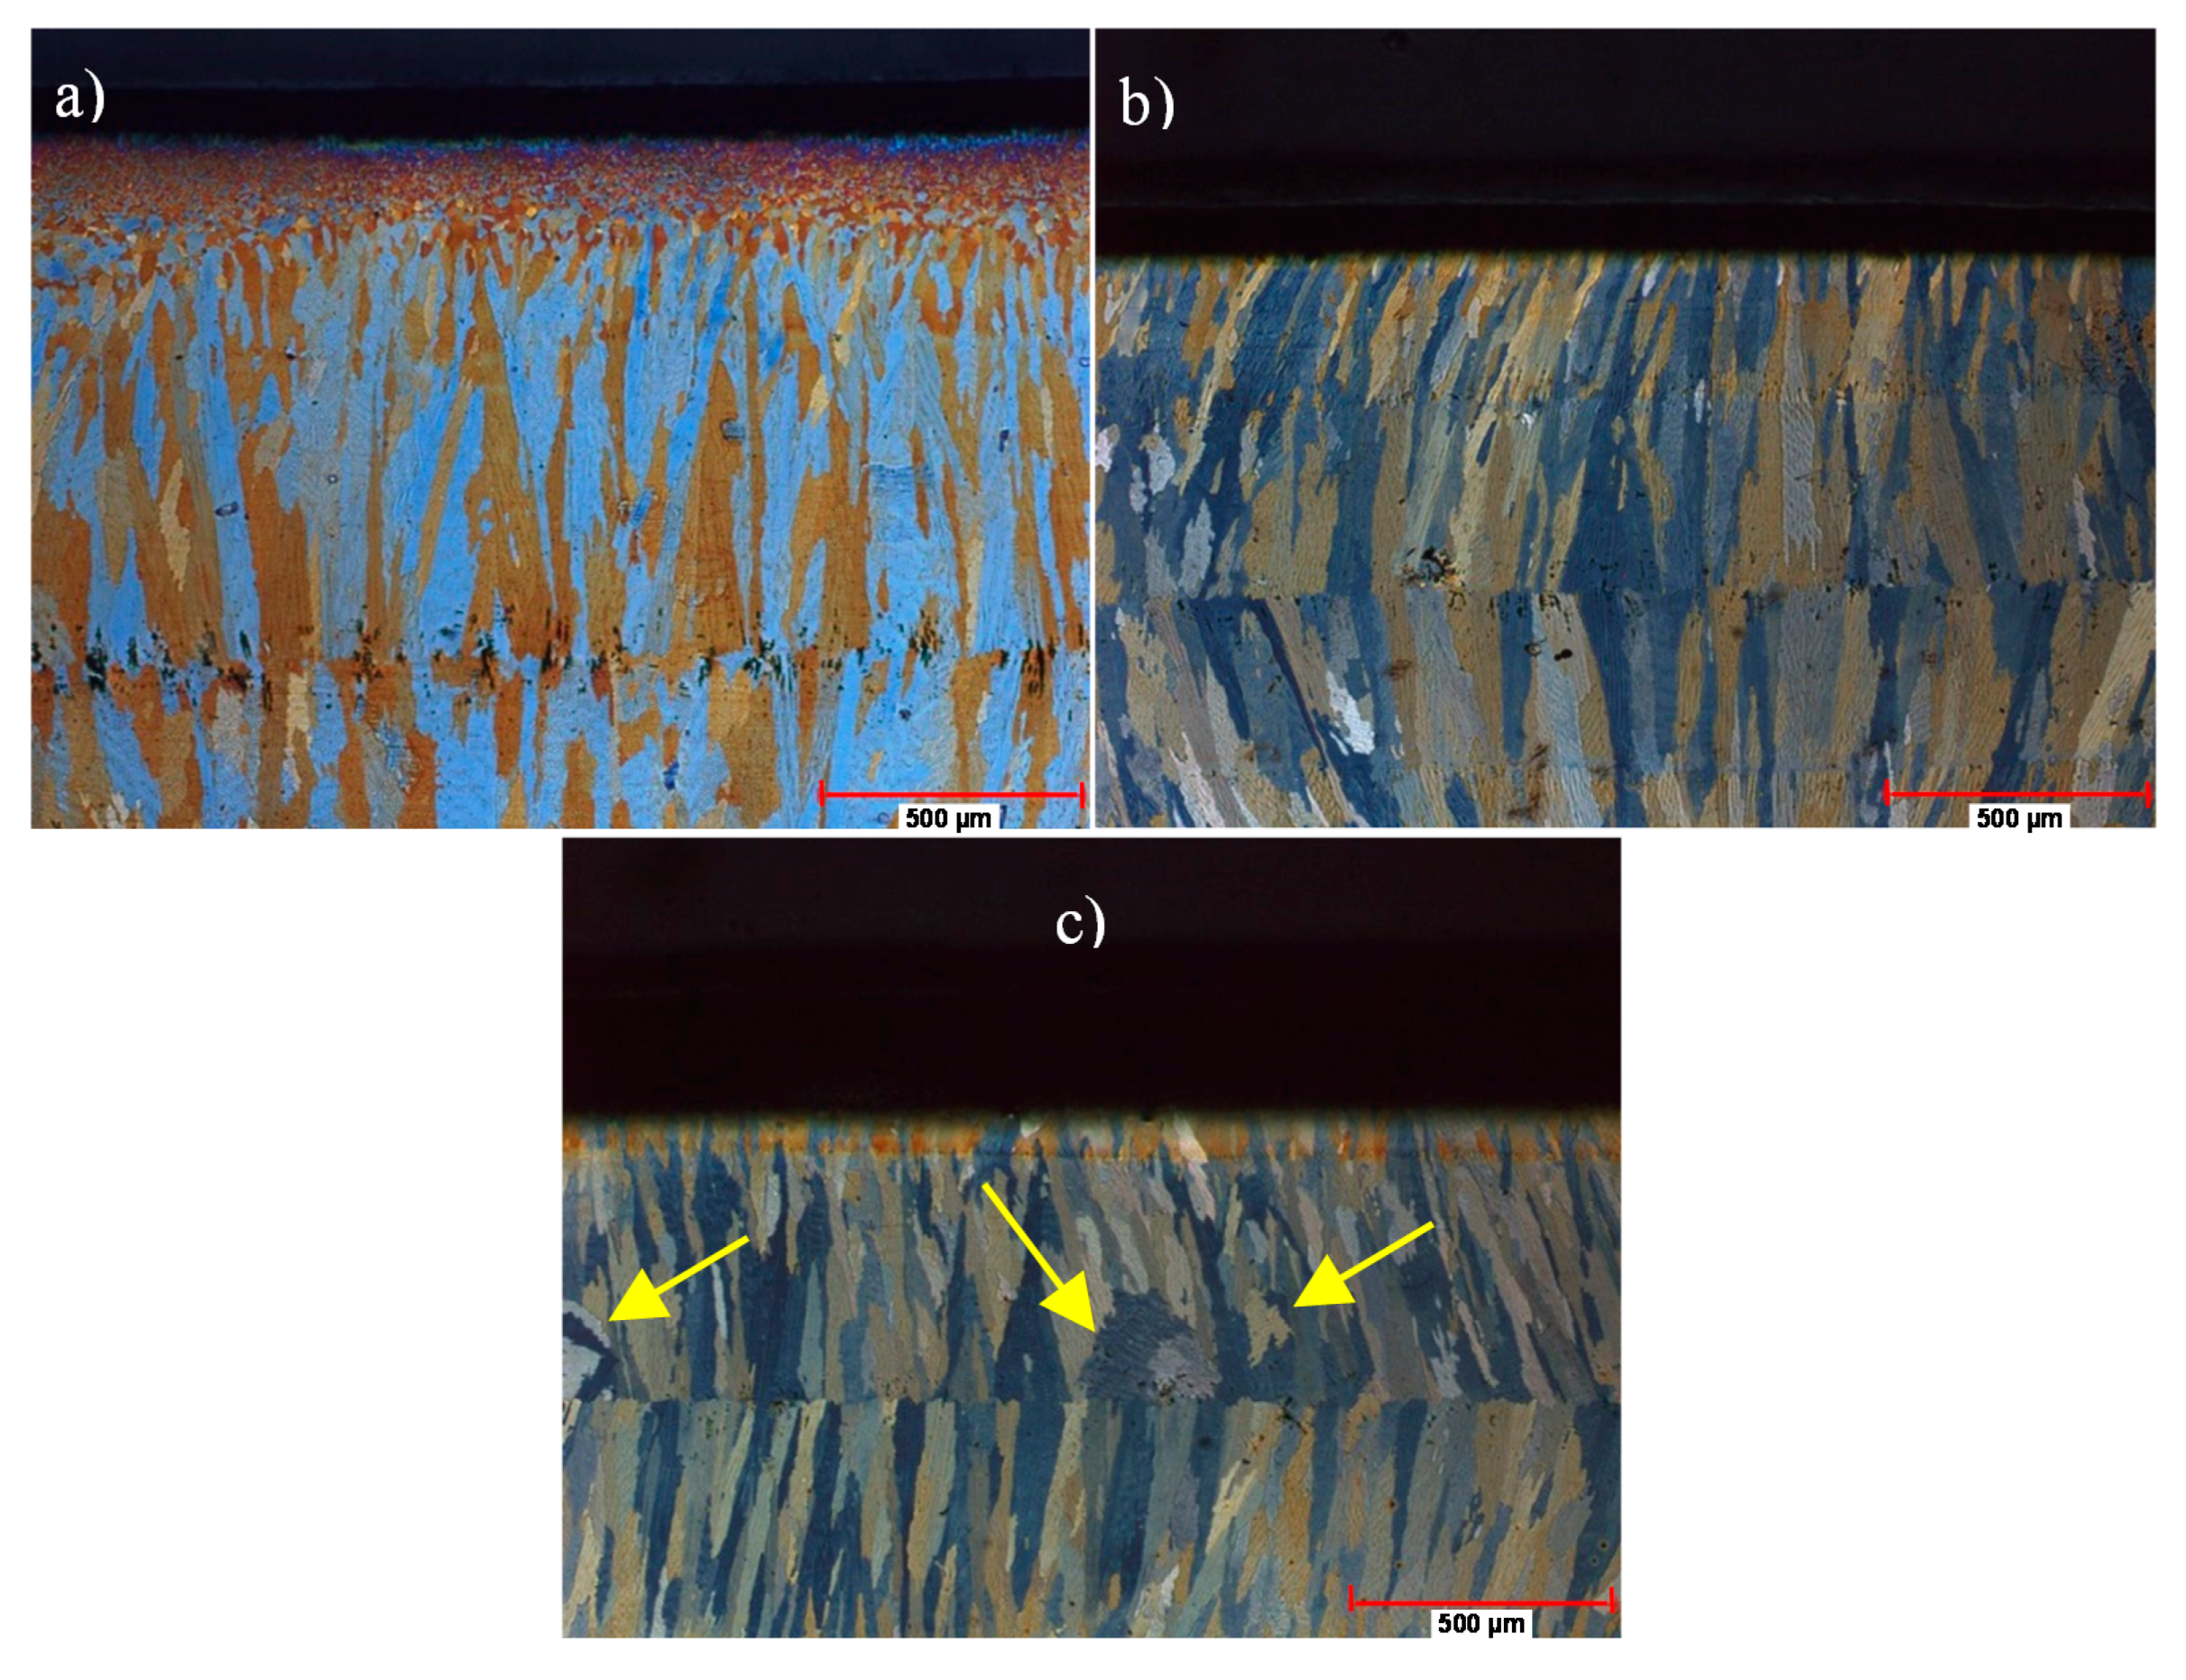
The weld cross-sections of the resistance spot-welded TWIP joints revealed three main distinct microstructural zones, including the BM, the HAZ and the FZ, as shown in Figure 6. The BM microstructure is mainly composed of a fully fine-grained austenite phase with an average grain size of 3–5 µm. It includes mechanical twins as well as a few transgranular annealing twins, which are generally located within relatively large-sized grains. The weld zone consists of a fully austenitic microstructure, which has different morphologies at different zones of the joint depending on the peak temperature of the relevant regions during the RSW process. The FZ microstructure shows a cast microstructure, which was melted during the RSW process and then rapidly resolidified, and has mainly a coarse columnar dendritic structure owing to the directional and columnar solidification from the fusion boundary towards the centre. On the other hand, the welding thermal cycle during the RSW process produced significant grain growth in the HAZ, including annealing twins (Figure 6). Razmpoosh et al. [19] have reported that this extreme grain growth in the HAZ resulted from the low thermal conductivity of TWIP steels. The HAZ can be divided into a coarse-grained heat-affected zone (CGHAZ), which occurs in areas immediately adjacent to the FZ, and a fine-grained heat affected zone (FGHAZ), which is still relatively coarser than the BM (Figure 6). Similarly, the FZ can also be divided into a fine dendritic fusion zone (FDFZ) and a coarse dendritic fusion zone (CDFZ) caused by different cooling rates in different regions of the FZ. Weld imperfections, such as macro-pores, micro-pores and expulsion cavities, may occur in the FZ of the resistance spot-welded TWIP joints [5,21,22]. All the spot-welded joints had interdendritic macro- and micro-pores in the FZ owing to solidification shrinkage in this special material (Figure 7, Figure 8 and Figure 9). Additionally, the highest weld current (12 kA) led to the formation of a macro expulsion cavity in the FZ during the RSW process as a result of an extensive expulsion phenomenon (molten material loss) due to the highest heat input.
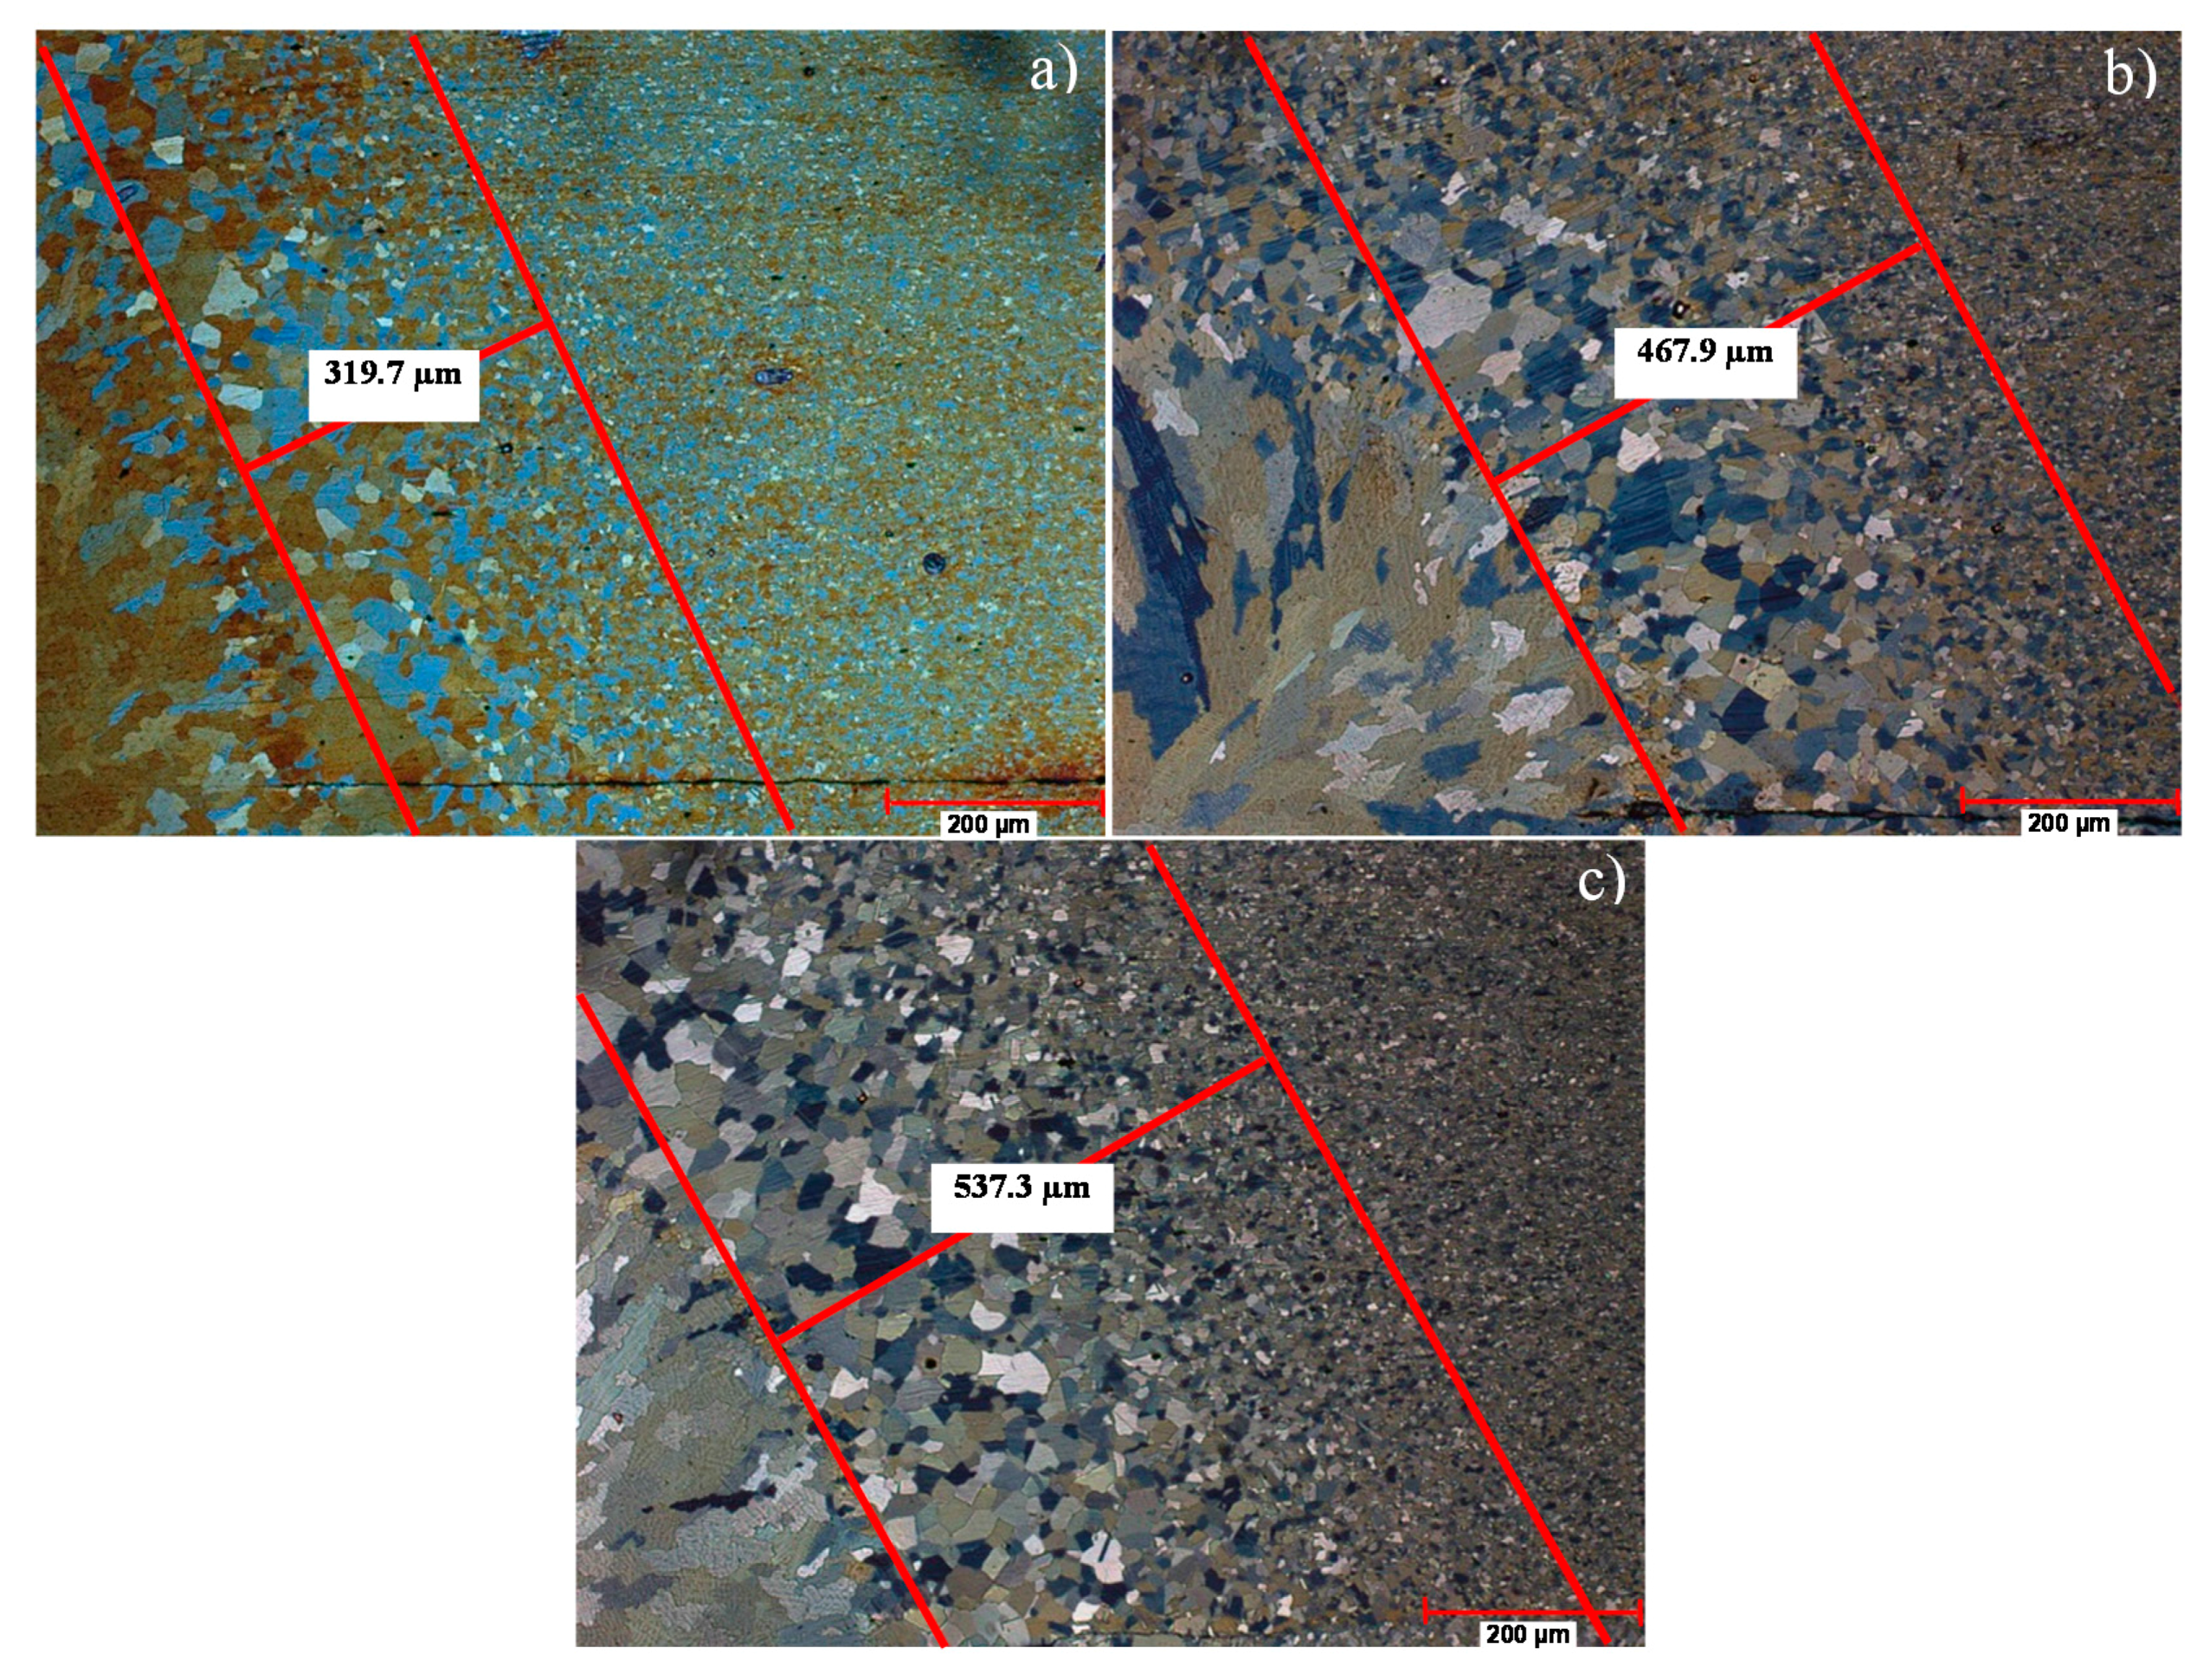
Higher weld currents led to a coarser grain structure and thicker annealing twins in the HAZ, a wider HAZ, and a relatively equiaxed dendritic structure in the centre (interface of the sheets) of the FZ due to higher heat input leading to the slower cooling rate (Figure 9, Figure 10 and Figure 11). The HAZ width increased with increasing weld currents (Figure 12). It should be noted that there is a strong linear correlation between the HAZ width and the weld current. The coefficient of determination (R2) from fitting a linear model using regression analysis to the obtained results for the linear correlation between the HAZ width and the weld current is 0.86.
The evaluation and characterization of the BM and the HAZ microstructures was performed with SEM–EBSD microstructural crystallography (the OIM technique). Due to the limitations of the EBSD technique for resolving nanoscale twins, nano-sized deformation twins in the BM microstructure could not be mapped with this technique. However, the EBSD crystallographic orientation map (IPF + IQ map) given in Figure 13a could be used to analyse deformation twins in the BM microstructure, since the deformed substructures, such as dislocations and deformation twins, in the grains are strongly dependent on the crystallographic orientation [24,25]. In Figure 13a, the grains oriented close to the <001>//rolling directions (RD) in the crystallographic orientation map can be evaluated as grains exhibiting low deformation-twinning activity and a well-developed dislocation substructure, while the grains oriented close to the <111>//RD indicate recovered or recrystallized grains. The EBSD maps of the HAZ of the spot-welded specimens are presented in Figure 13b,c. The HAZ of the specimens showed a fairly coarse-grained structure (secondary recrystallization) near the FZ and a recrystallized grain structure near the BM. From these figures, annealing twins can also be seen in the HAZ. The increase in the HAZ width and grain coarsening in the HAZ with the increase of weld current, due to the higher heat input, can also be seen.
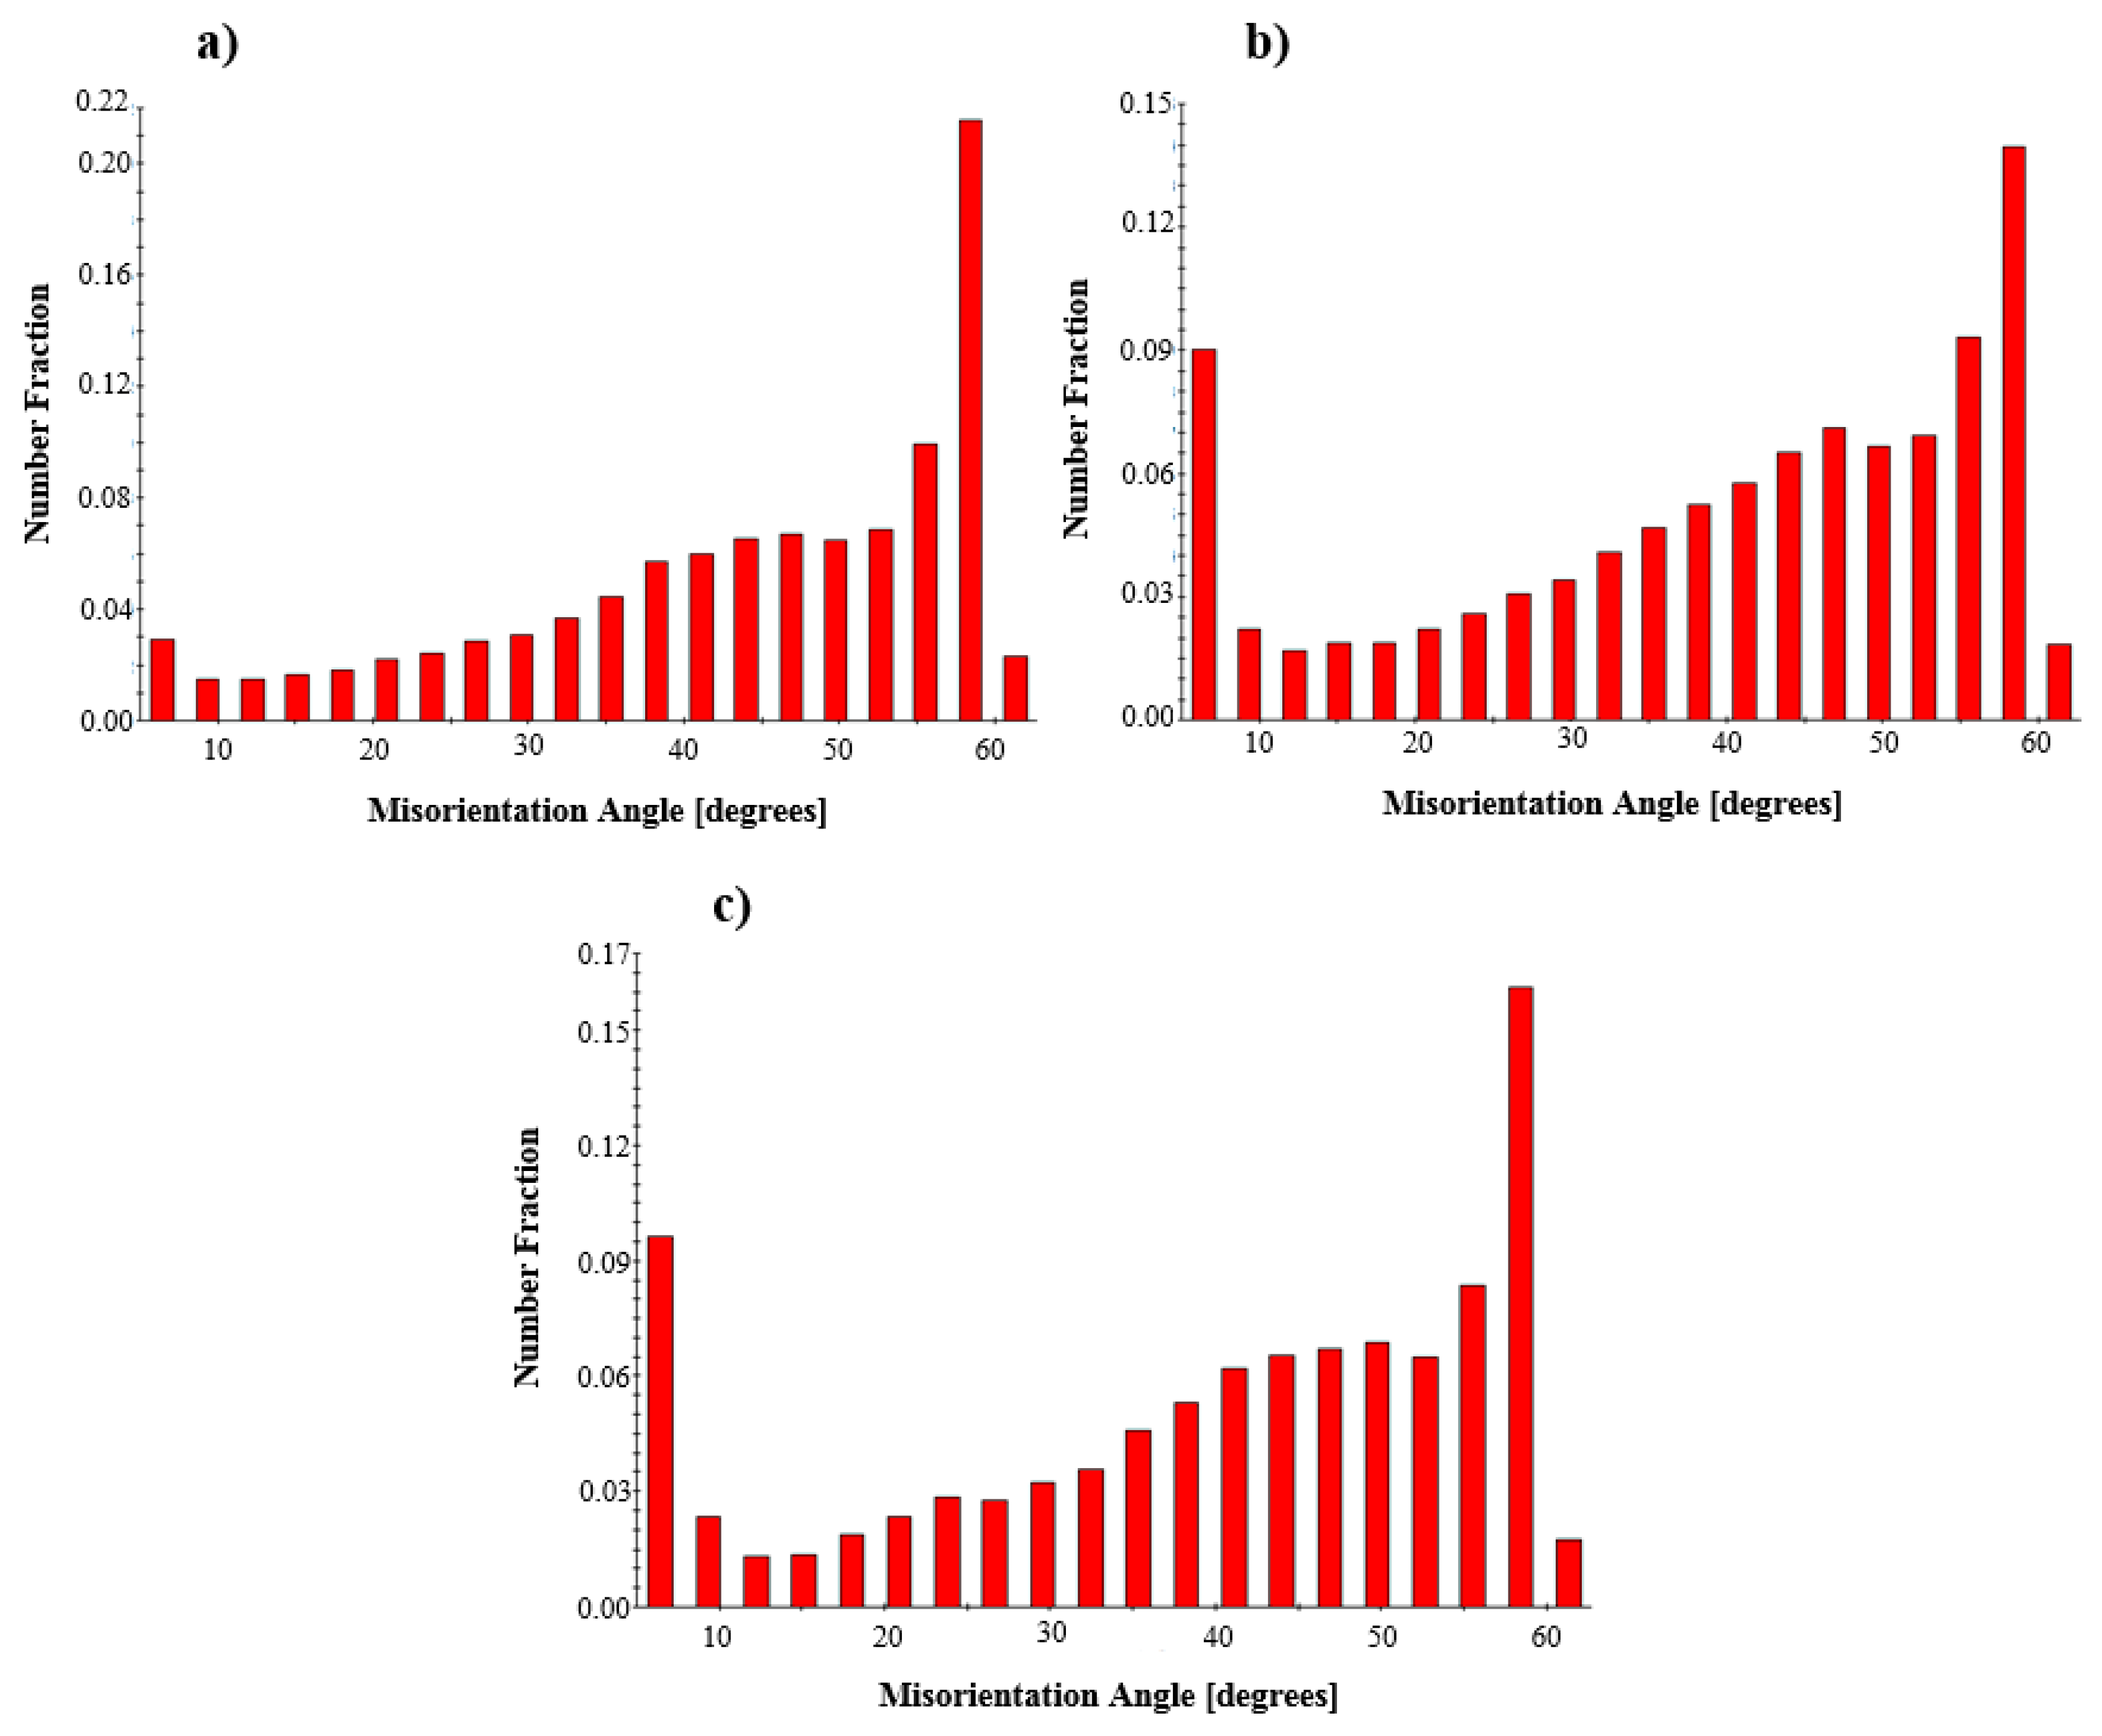
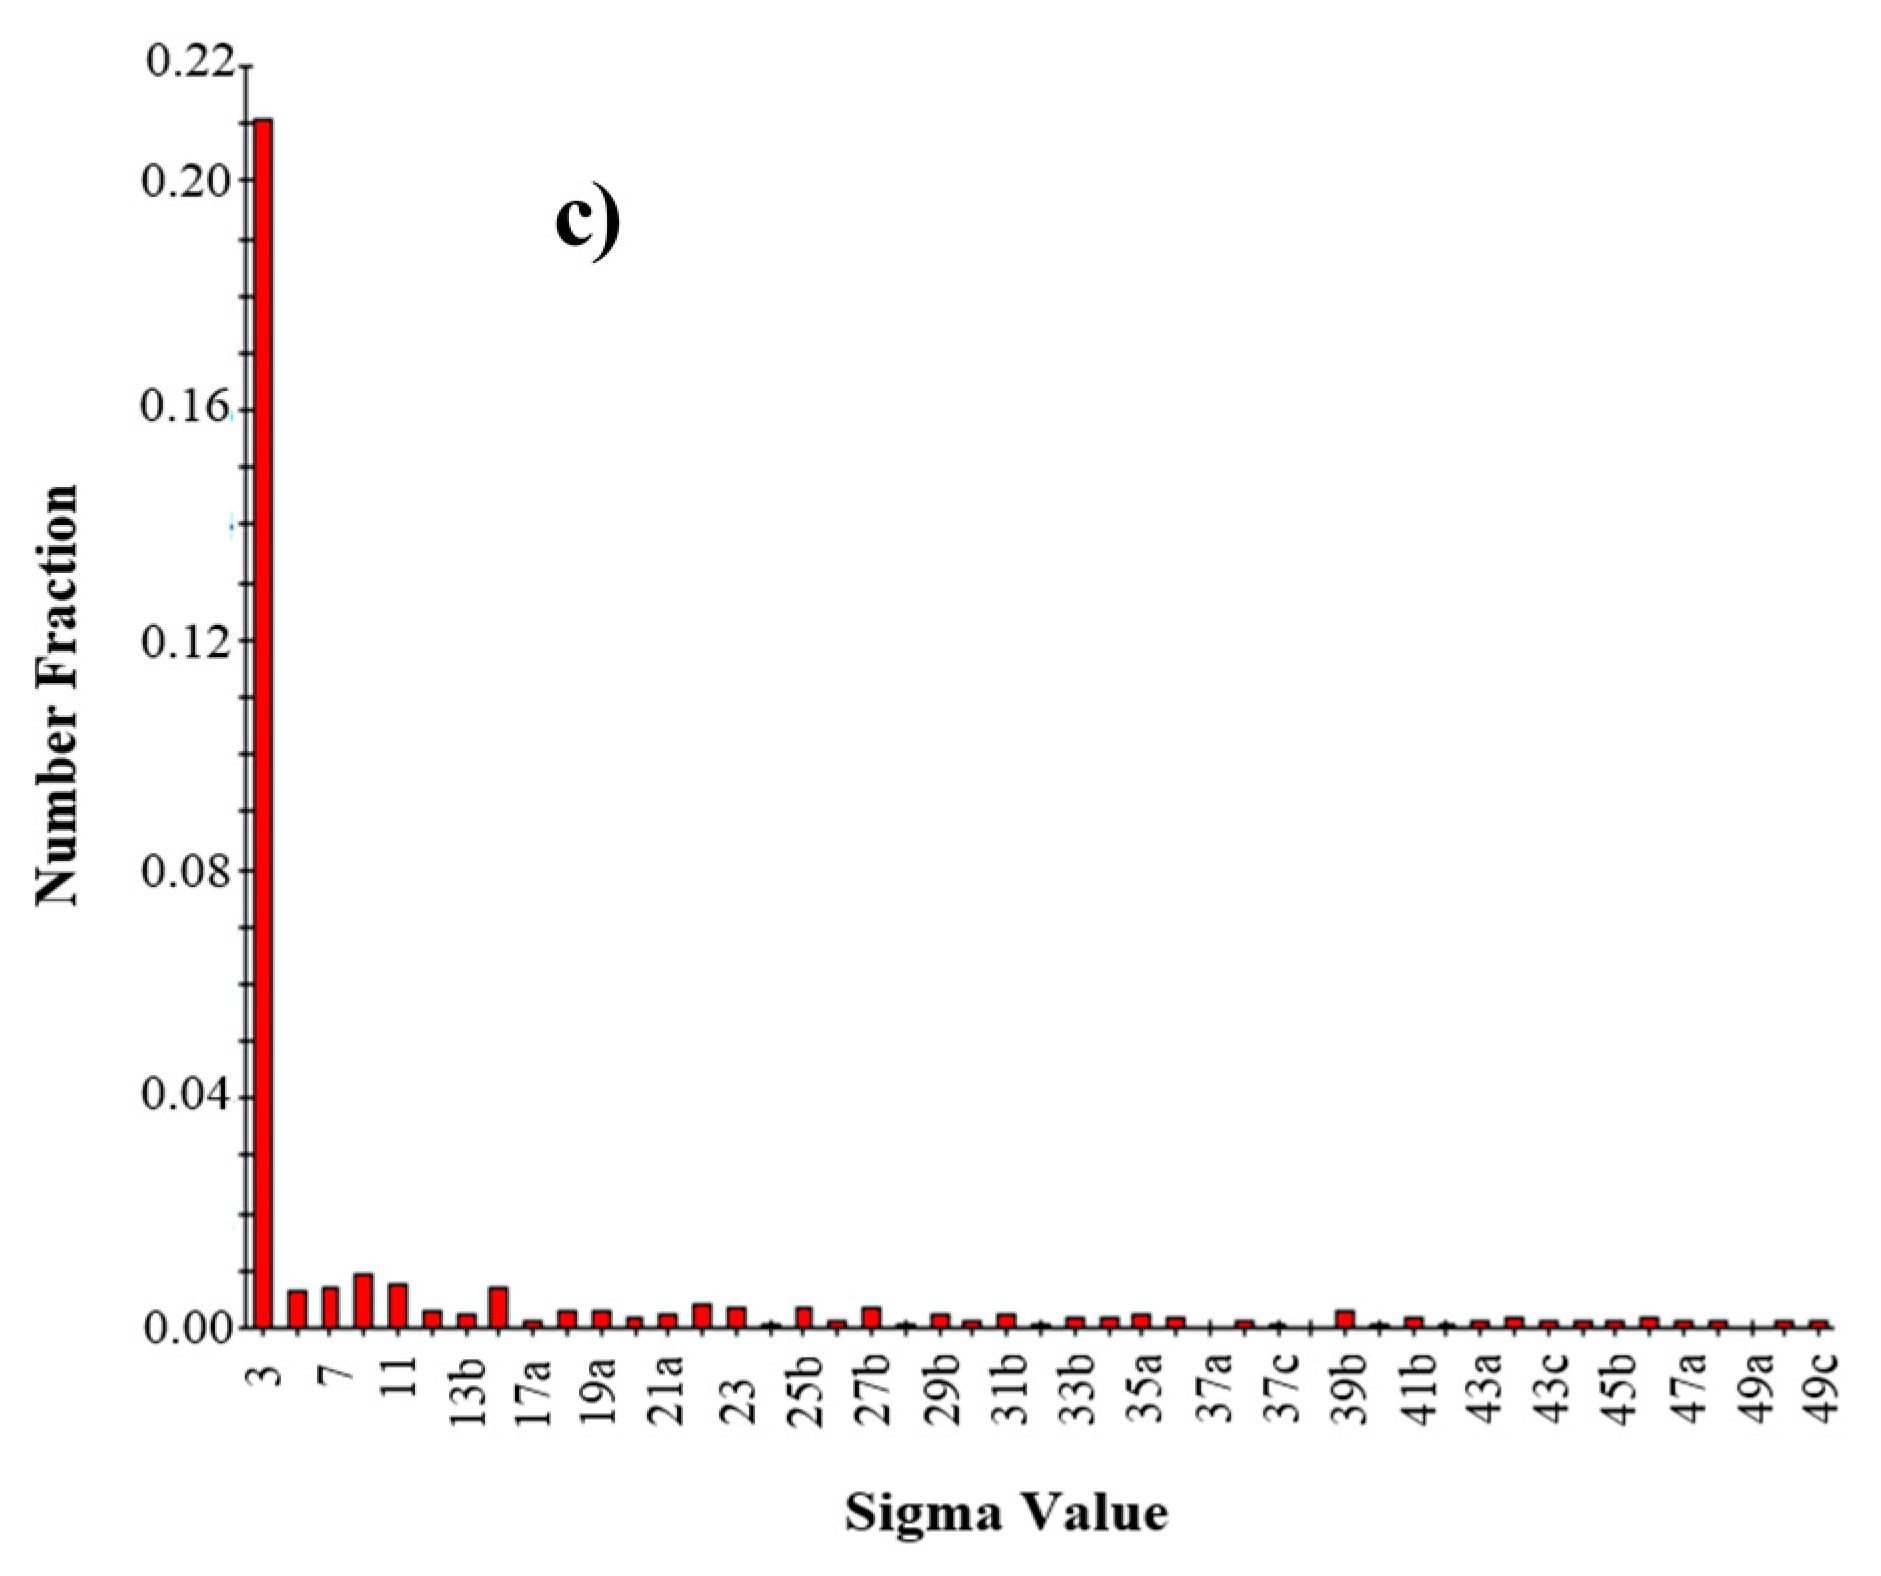
The misorientation angle profiles and the distribution of CSL-type boundaries obtained from the SEM–EBSD studies could also be used to analyse the microstructure and twin-structure. The misorientation angle of 60° (high-angle grain boundaries) in the misorientation profile can be attributed to a twin structure (twin boundaries) or recovered and recrystallized grain structure having high-angle grain boundaries [26,27,28,29,30,31]. The misorientation profile of the BM revealed the presence of a misorientation angle of 60° at a fraction of 23.83%, resulting from recovered or recrystallized grain structures having high-angle grain boundaries and some twin boundaries (annealing and deformation twins) (Figure 14a). The HAZ microstructures of the spot-welded joints revealed a misorientation angle of 60° at fractions of 15.77% in the 8 kA joint and 17.88% in the 12 kA joint, arising from recrystallized grains with high-angle grain boundaries and annealing twins (Figure 14b,c). These values are lower than that of the BM (Figure 14). This may be due to a fairly fine recovered grain structure (more grain boundaries) and the deformation twins in the EBSD map of the BM shown in Figure 13a. On the other hand, although the HAZ EBSD map of the 12 kA joint contains fewer grain boundaries than that of the 8 kA joint, as expected, the higher weld current (12 kA joint) resulted in more annealing twin boundaries and in recrystallized grains having high-angle grain boundaries due to the higher heat input. In addition, from the EBSD maps in Figure 13b,c, no significant difference in the density of annealing twins was observed with heat input variation during the RSW process. Therefore, this may be related to an increase in the length of the annealing twins through grain coarsening in the HAZ rather than an increase of the density of the annealing twins with increasing heat input owing to the higher weld current. Similar data can be seen in the distribution of CSL-type boundaries in the specimens (Figure 15). The fractions of ∑3 type CSL boundaries corresponding to 60°<111> misorientation angles in the BM and the HAZs of the 8 kA and 12 kA joints are 26.97%, 19.4% and 21.07%, respectively. On the other hand, low-angle grain boundaries (2°< θ <10°) in the misorientation profiles may indicate a deformed grain structure or recovery and recrystallized grains having low-angle grain boundaries [26,31]. Low-angle grain boundaries in the BM microstructure occur at a fraction of 4.38%, resulting from low deformation-twinning activity and some recovery and recrystallized grains having low-angle grain boundaries (Figure 13a and Figure 14a). The elongated shape grains, which may possibly be recovered grains having low deformation twinning activity, and recrystallized grains can be observed in Figure 13a. The HAZ microstructures of the spot-welded joints revealed the presence of low-angle grain boundaries at fractions of 11.24% for the 8 kA joint and 11.93% for the 12 kA joint, arising from recovery and recrystallized grains with low-angle grain boundaries, presumably in the HAZs near the BM (Figure 14b,c). As expected, these values are higher than that of the BM due to heat exposure during the RSW process. Higher weld currents lead to more recovery and recrystallized grains having low-angle grain boundaries.
To ensure safe design standards for the durability and crashworthiness of vehicles, there are various industrial standards that recommend a minimum NS for a given sheet thickness. The following equation is suggested by the American Welding Society (AWS) standard [32]:
where D and t are the NS and the sheet thickness, respectively.
D = 4t1/2
In the present study, the minimum NS obtained was approximately 5.5 mm and all the joints exhibited a pullout failure (PO) mode, ensuring high load-bearing capacity. For the 1.3-mm thick TWIP sheets used in this study, this minimum value is compatible with the AWS. The NS is closely related to the generated heat energy at the sheet interface during the RSW process. The relationship between the NS and the weld current can be seen in Figure 16a. For a welding current of up to 11 kA, the NS varied within a relatively narrow range (between 5.5 and 6.0 mm). The maximum NS was obtained with the highest weld current (12 kA) owing to the increased heat input [23]. The relationship between the indentation depth and the weld current is shown in Figure 16b. The indentation depth of the joints increased with increasing weld current due to the increased heat input during the RSW process.
3.2. Microshardness
Vickers microhardness tests were performed on the FZ, the HAZ and the BM of the welded specimens. The BM hardness of the TWIP sheets used in this study was approximately 260 HV0.2. In general, the hardness of the weld zone, including the FZ and the HAZ, is lower than that of the BM (Figure 17). This can be attributed to the coarser grains in the weld zone (HAZ and FZ), segregation of the alloying elements in these zones, and a lower carbon percentage in the FZ due to decarbonisation during the RSW process [11,22,33]. The lowest hardness values for all the specimens were obtained at the HAZ. This is considered to be caused by the significant coarsening of the austenitic grains and the decrease of dislocations and deformation twins in the HAZ owing to the heat input during the welding process. The HAZ hardness increased slightly with increasing weld current. This may be attributed to the effect of annealing twins owing to the increased heat input [34,35,36]. On the other hand, as expected, the hardness of the FDFZ was always higher than that of the CDFZ. However, no relationship was obtained between the hardness values in the FZ and weld current.
3.3. Tensile Shear Properties and Fractography
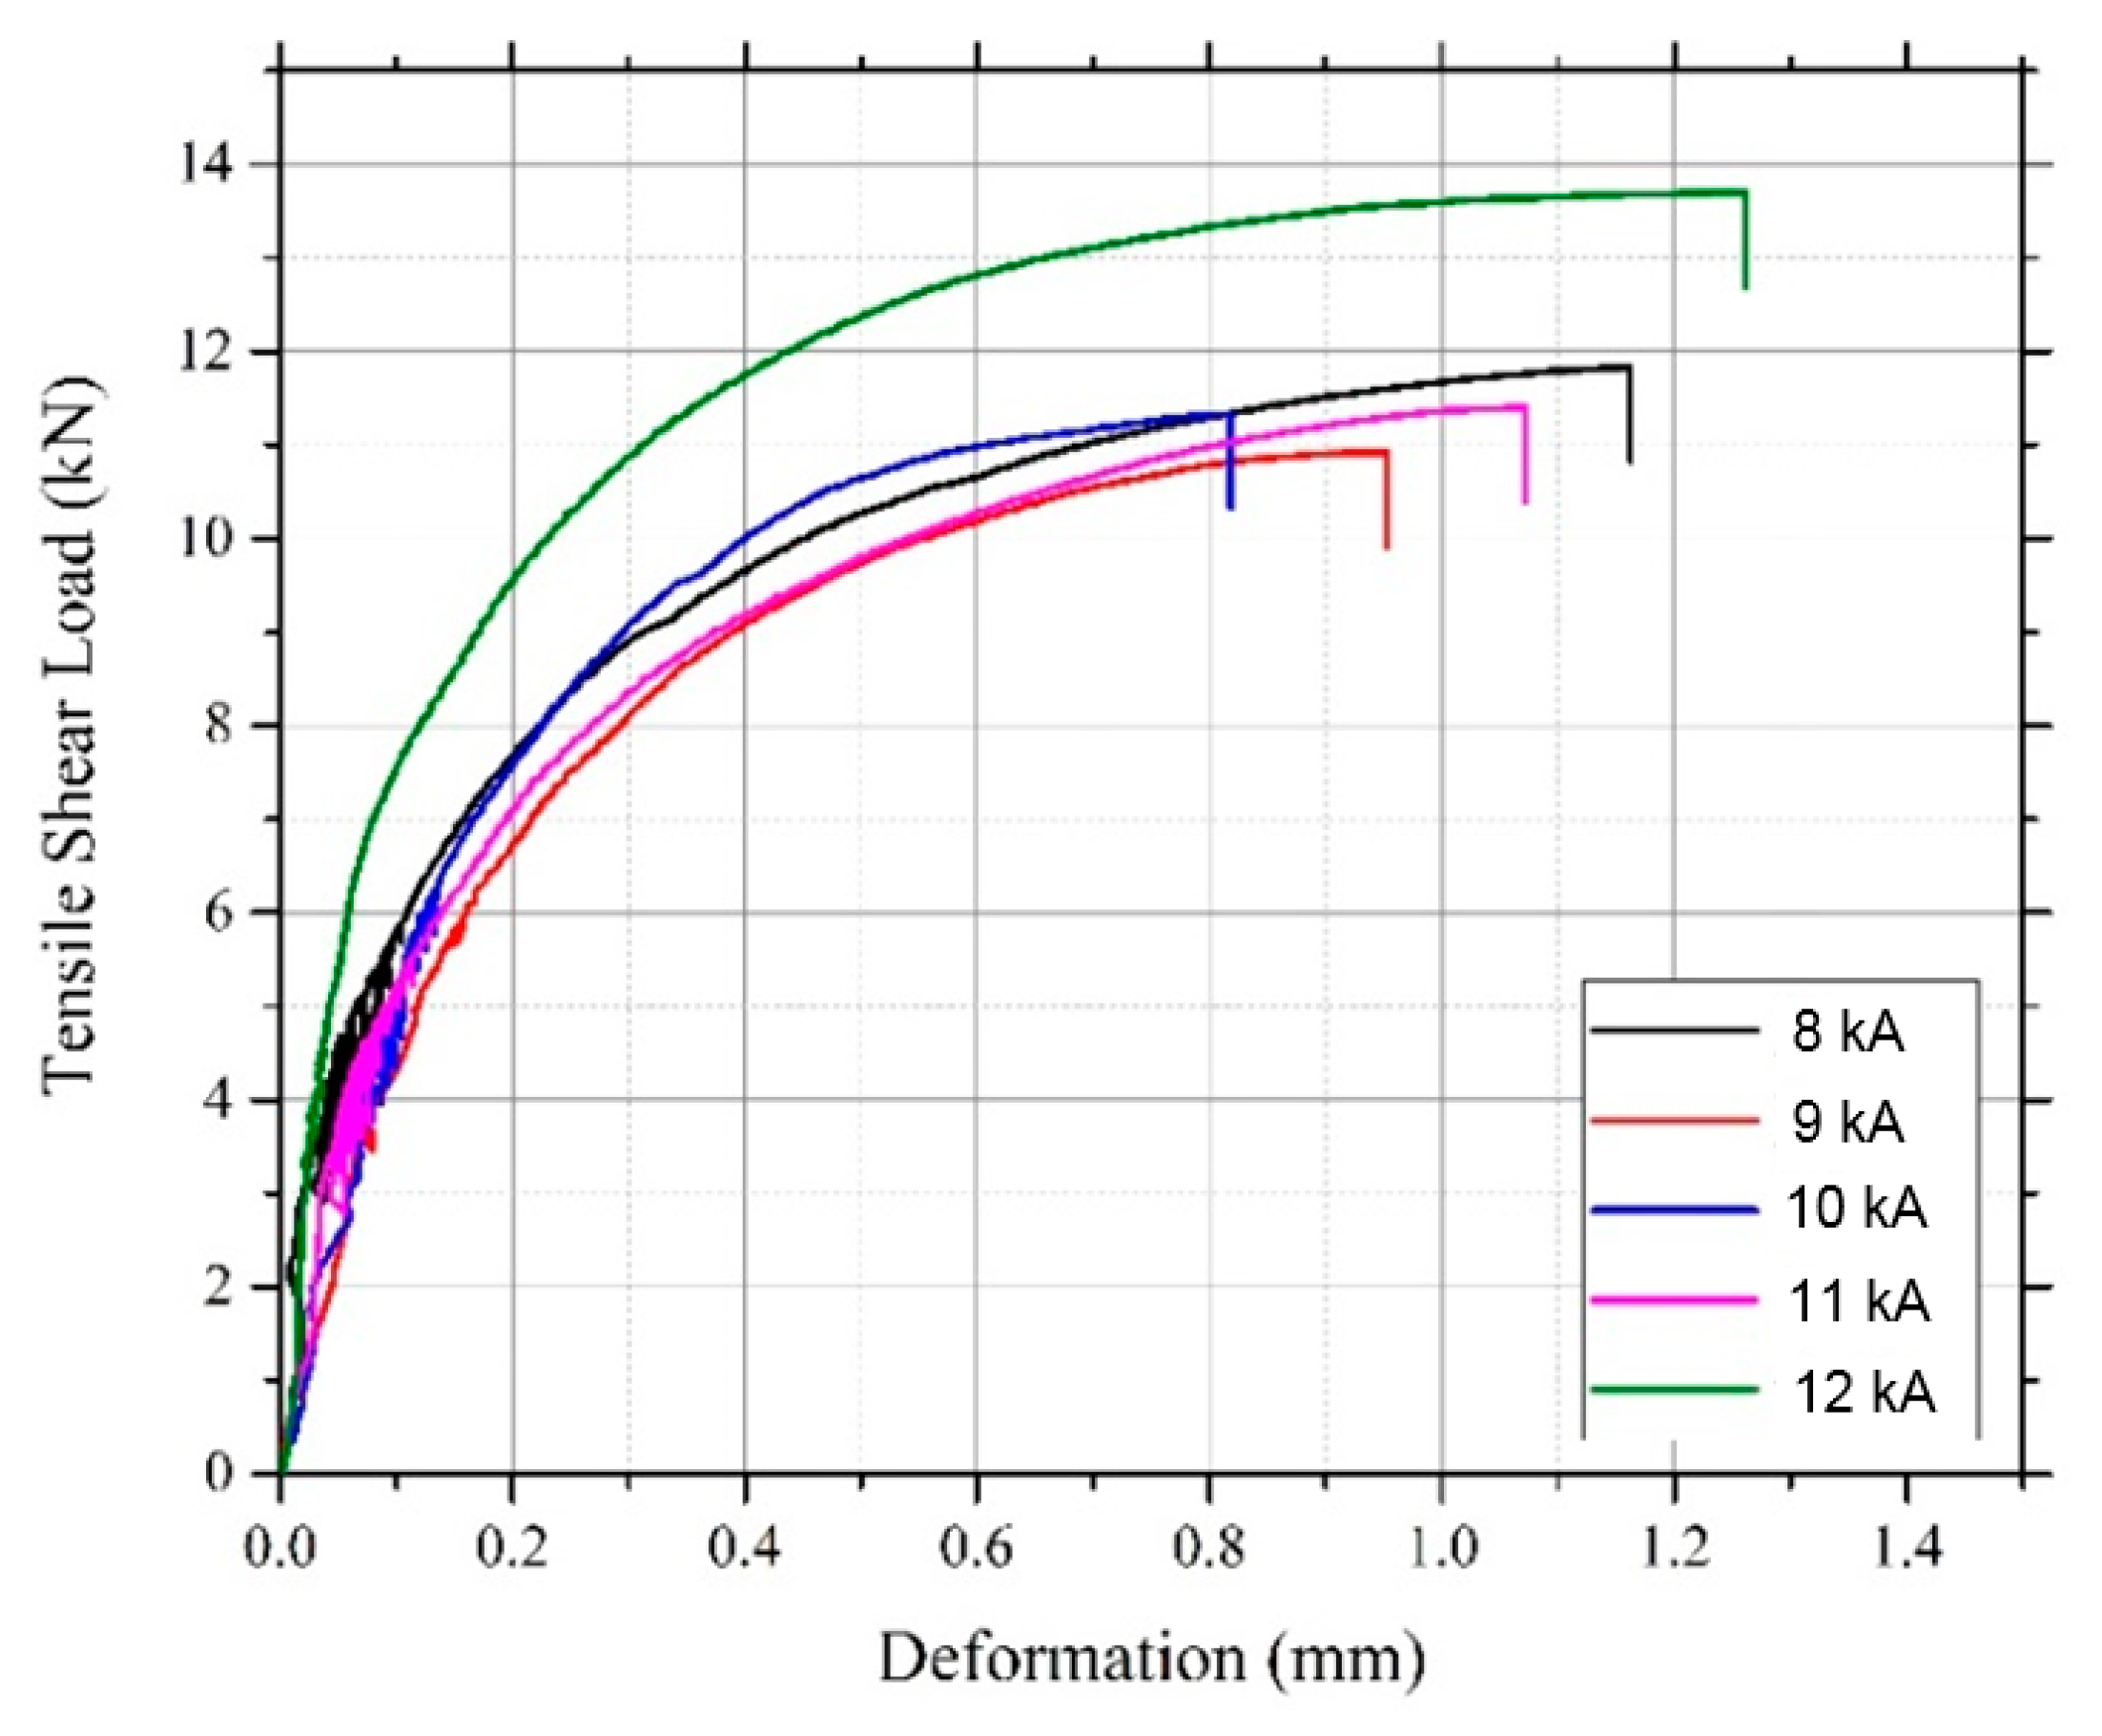
In the quality evaluation of resistance spot-welded joints, the static load-carrying capability of the welds, which is determined by tensile shear testing, is an important parameter. The tensile shear curves of the spot welds fabricated with different weld currents are shown in Figure 18. The average values of the tensile properties and the failure energy absorption capacities of the joints can be seen in Table 4. The acceptable tensile shear load (ATSL) of the welded specimens, according to AWS D8.1 M, can be calculated using following function [37]:
where UTS is the ultimate tensile strength, and t is the thickness of the sheets. An ATSL of 9.94 kN can be calculated by considering the UTS and the thickness of the sheets, 982 MPa and 1.3 mm, respectively. The TSLs of all the fabricated joints were roughly 12–38% higher than the ATSL due to the optimization studies performed before this study.
ATSL = [(−6.36 × 10⁻⁷ × UTS2 + 6.58 × 10⁻⁴ × UTS + 1.674) × UTS × 4 × t1.5]/1000 [kN]
The weld current significantly affected the tensile properties of the resistance spot-welded TWIP joints (Figure 19). For a weld current of up to 11 kA, the TSLs of the joints varied within a relatively narrow range of 11.13–11.83 kN. The maximum TSL of 13.72 kN was obtained when the weld current was 12 kA. This significant increase can be explained by the significant increase in the NS due to the higher heat input [23]. The TSLs obtained with different weld currents are in good agreement with the NS values (Figure 16a and Figure 19). Interestingly, the joint that had a macro expulsion cavity in the FZ had the highest TSL (Figure 6, Figure 8 and Figure 18). This demonstrates that the presence of this macro defect did not profoundly affect the shear–tension strength of the spot welds. The effect of the weld current on the tensile shear deformation of the resistance spot-welded TWIP joints is shown in Figure 19 and Table 4. For a weld current of up to 10–11 kA, the tensile shear deformations of the joints decreased with increasing weld current. This may be attributed to the NS, the increased brittleness in the HAZ (relatively lower plastic deformation) due to grain coarsening and the formation of annealing twins with the higher weld current owing to the higher heat input. The peak tensile shear deformation was obtained with 12 kA. The joint having the highest TSL had the highest tensile deformation. The effect of the weld current on the failure energy absorption capacity of the spot-welded TWIP joints can be seen in Figure 19 and Table 4. The failure energy decreased with increasing weld currents up to 10 kA, then it increased with increasing weld current. This behaviour is almost completely consistent with the tensile deformation values.
The tensile shear fracture modes of the joints are presented in Figure 20. As is well known, the failure mode is a good quantitative indicator of the quality of the spot welds. Resistance spot welds fail with two major failure modes, the interfacial failure (IF) mode and the pullout failure (PO) mode. To ensure the durability and crashworthiness of vehicles, the welding parameters in the RSW should be adjusted so that the pullout failure mode, in which the fracture occurs in the HAZ at the edge of the spot weld, is guaranteed. In this study, all joints exhibited a full button pullout failure mode due to the higher deformation energy. Additionally, expulsion phenomena were observed in all the joints and increased with increasing weld currents (Figure 20).
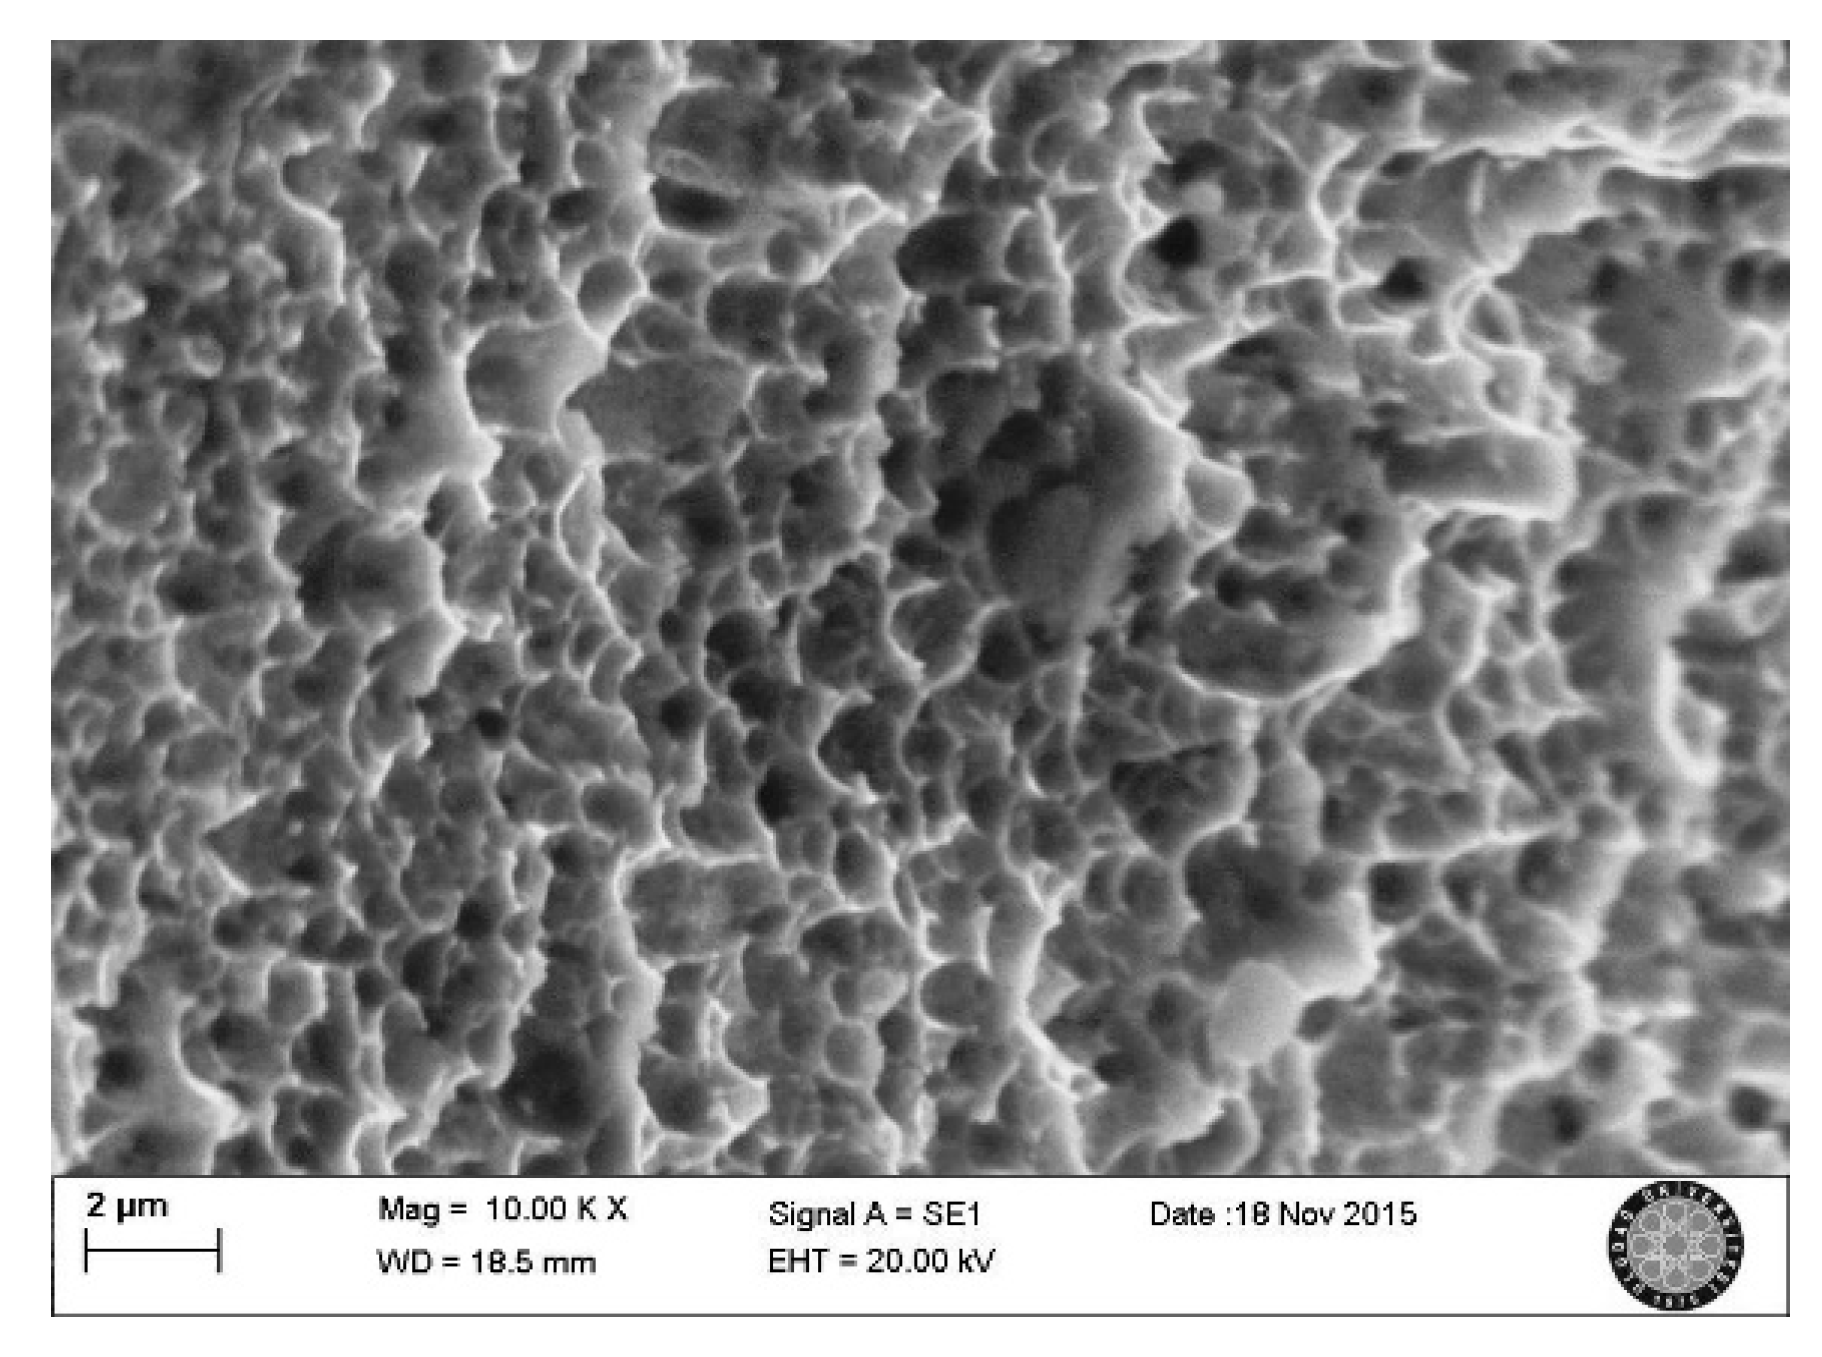
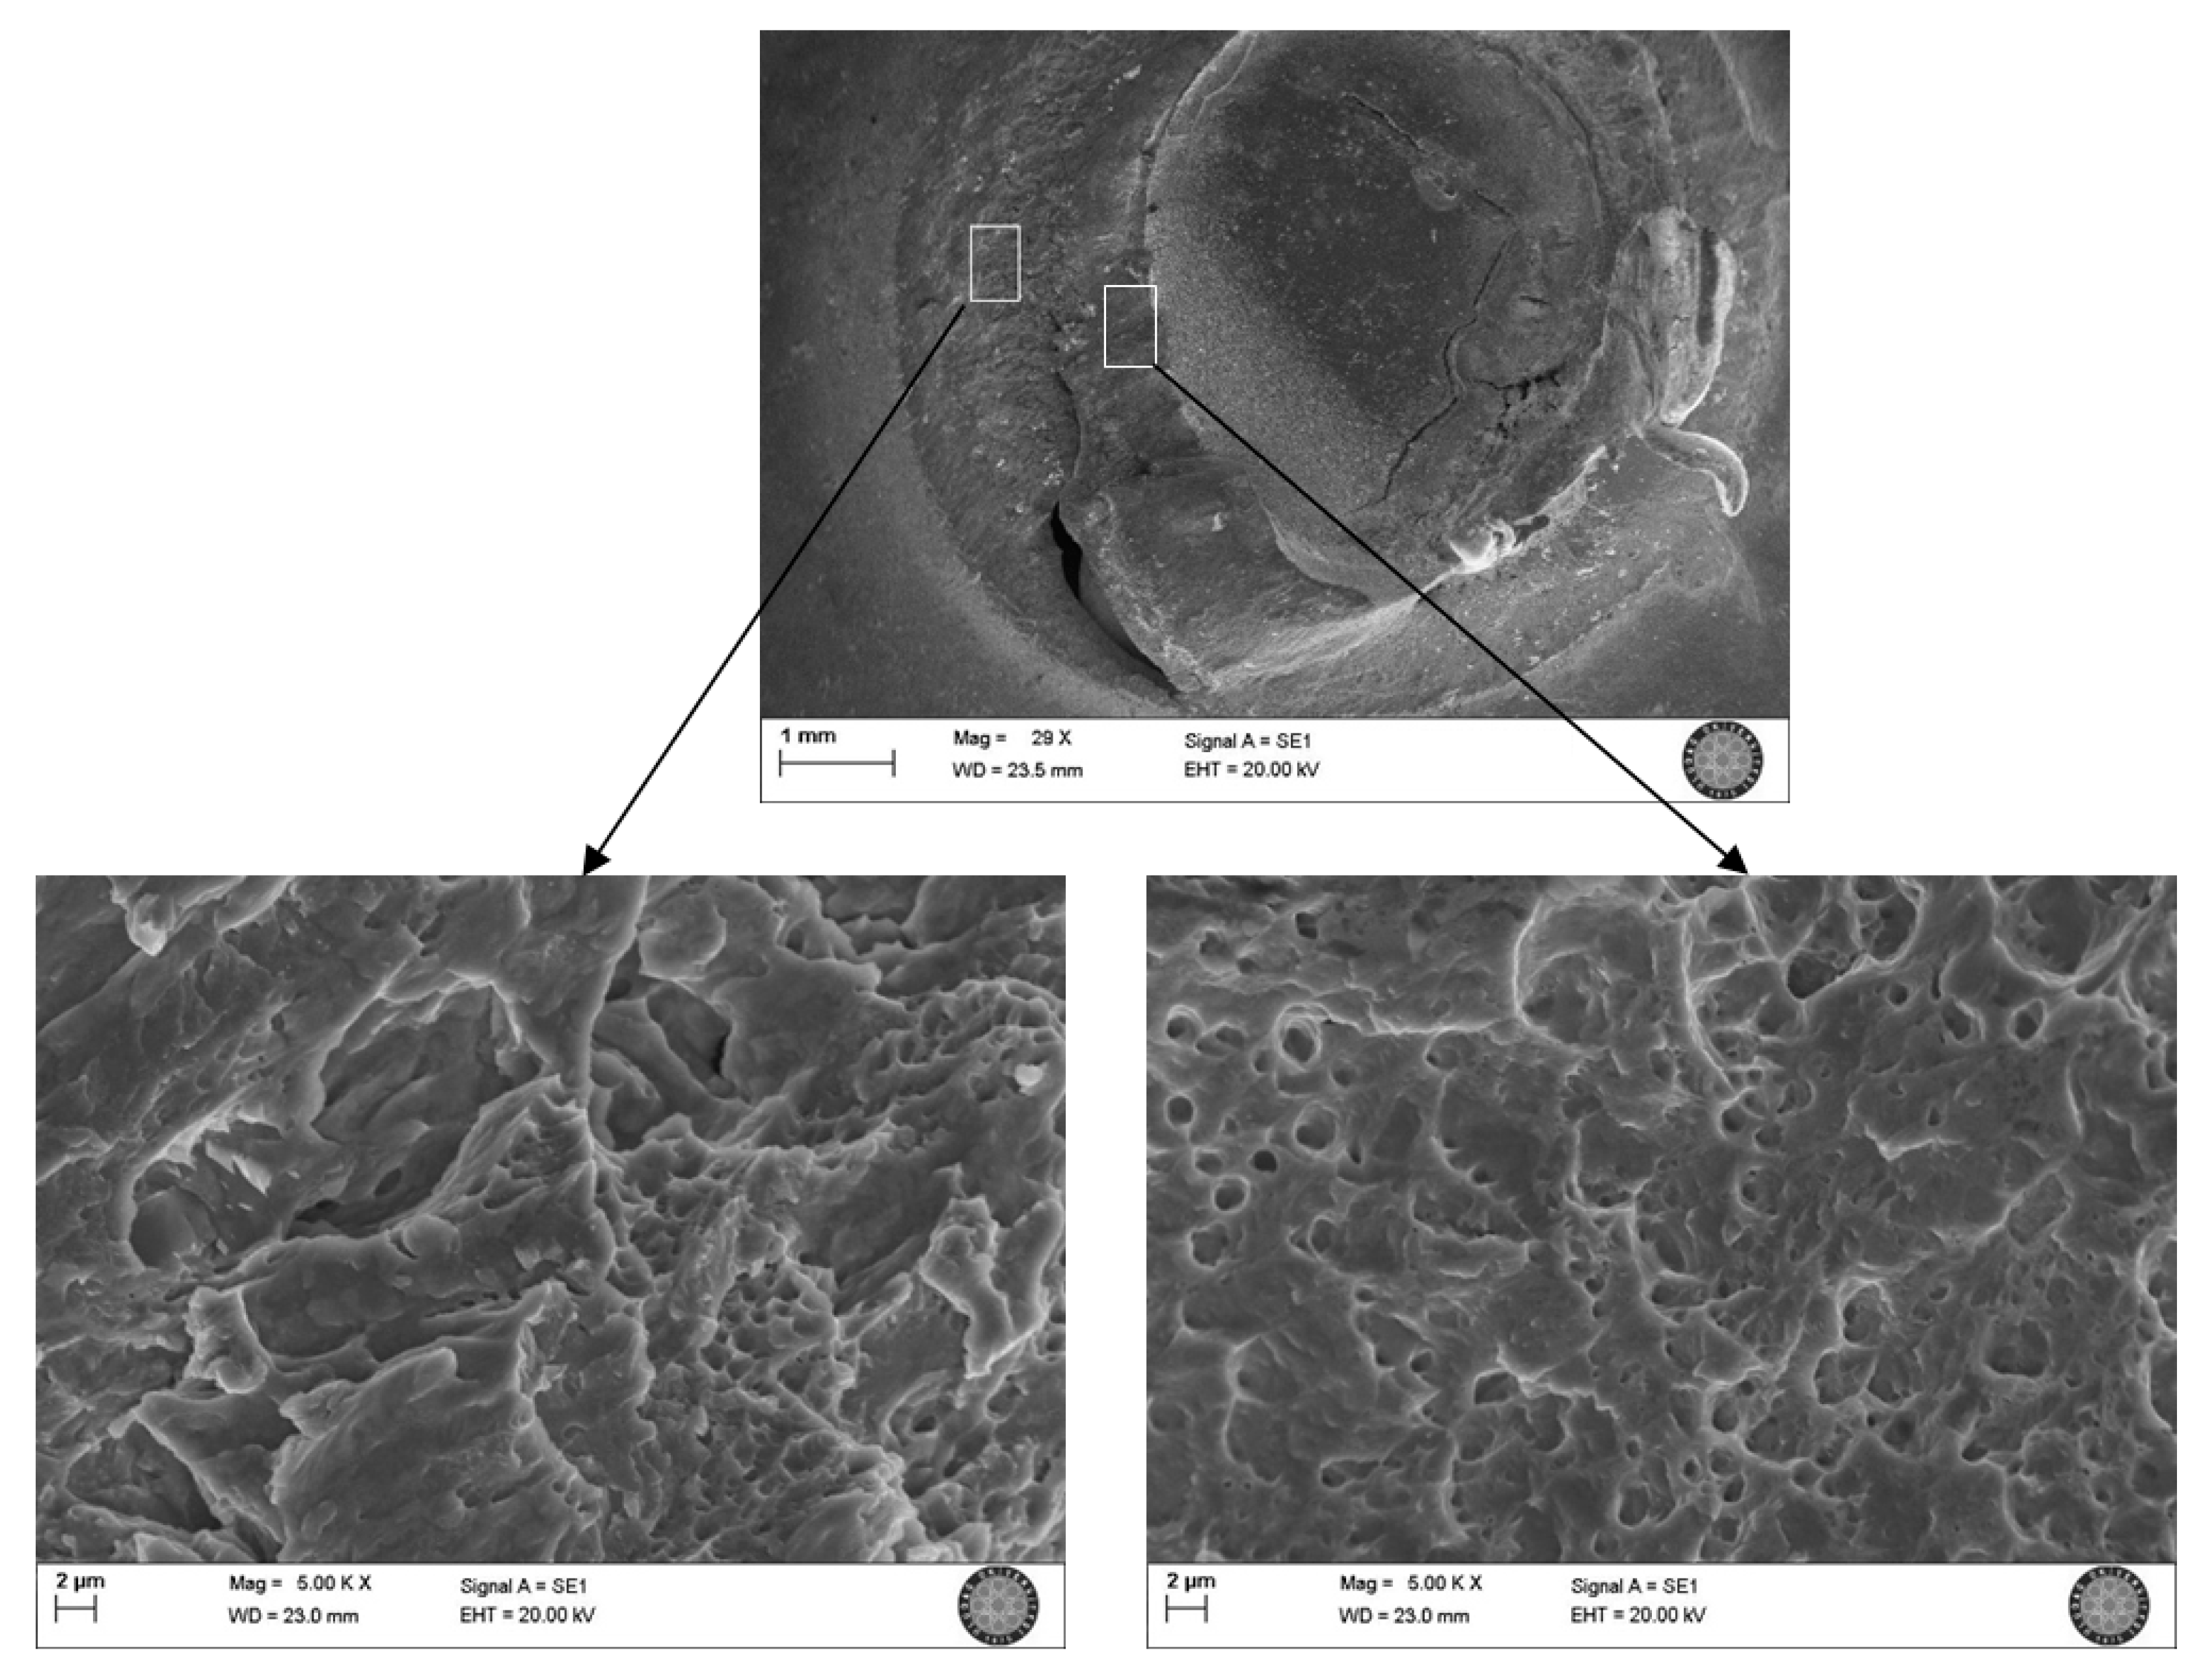
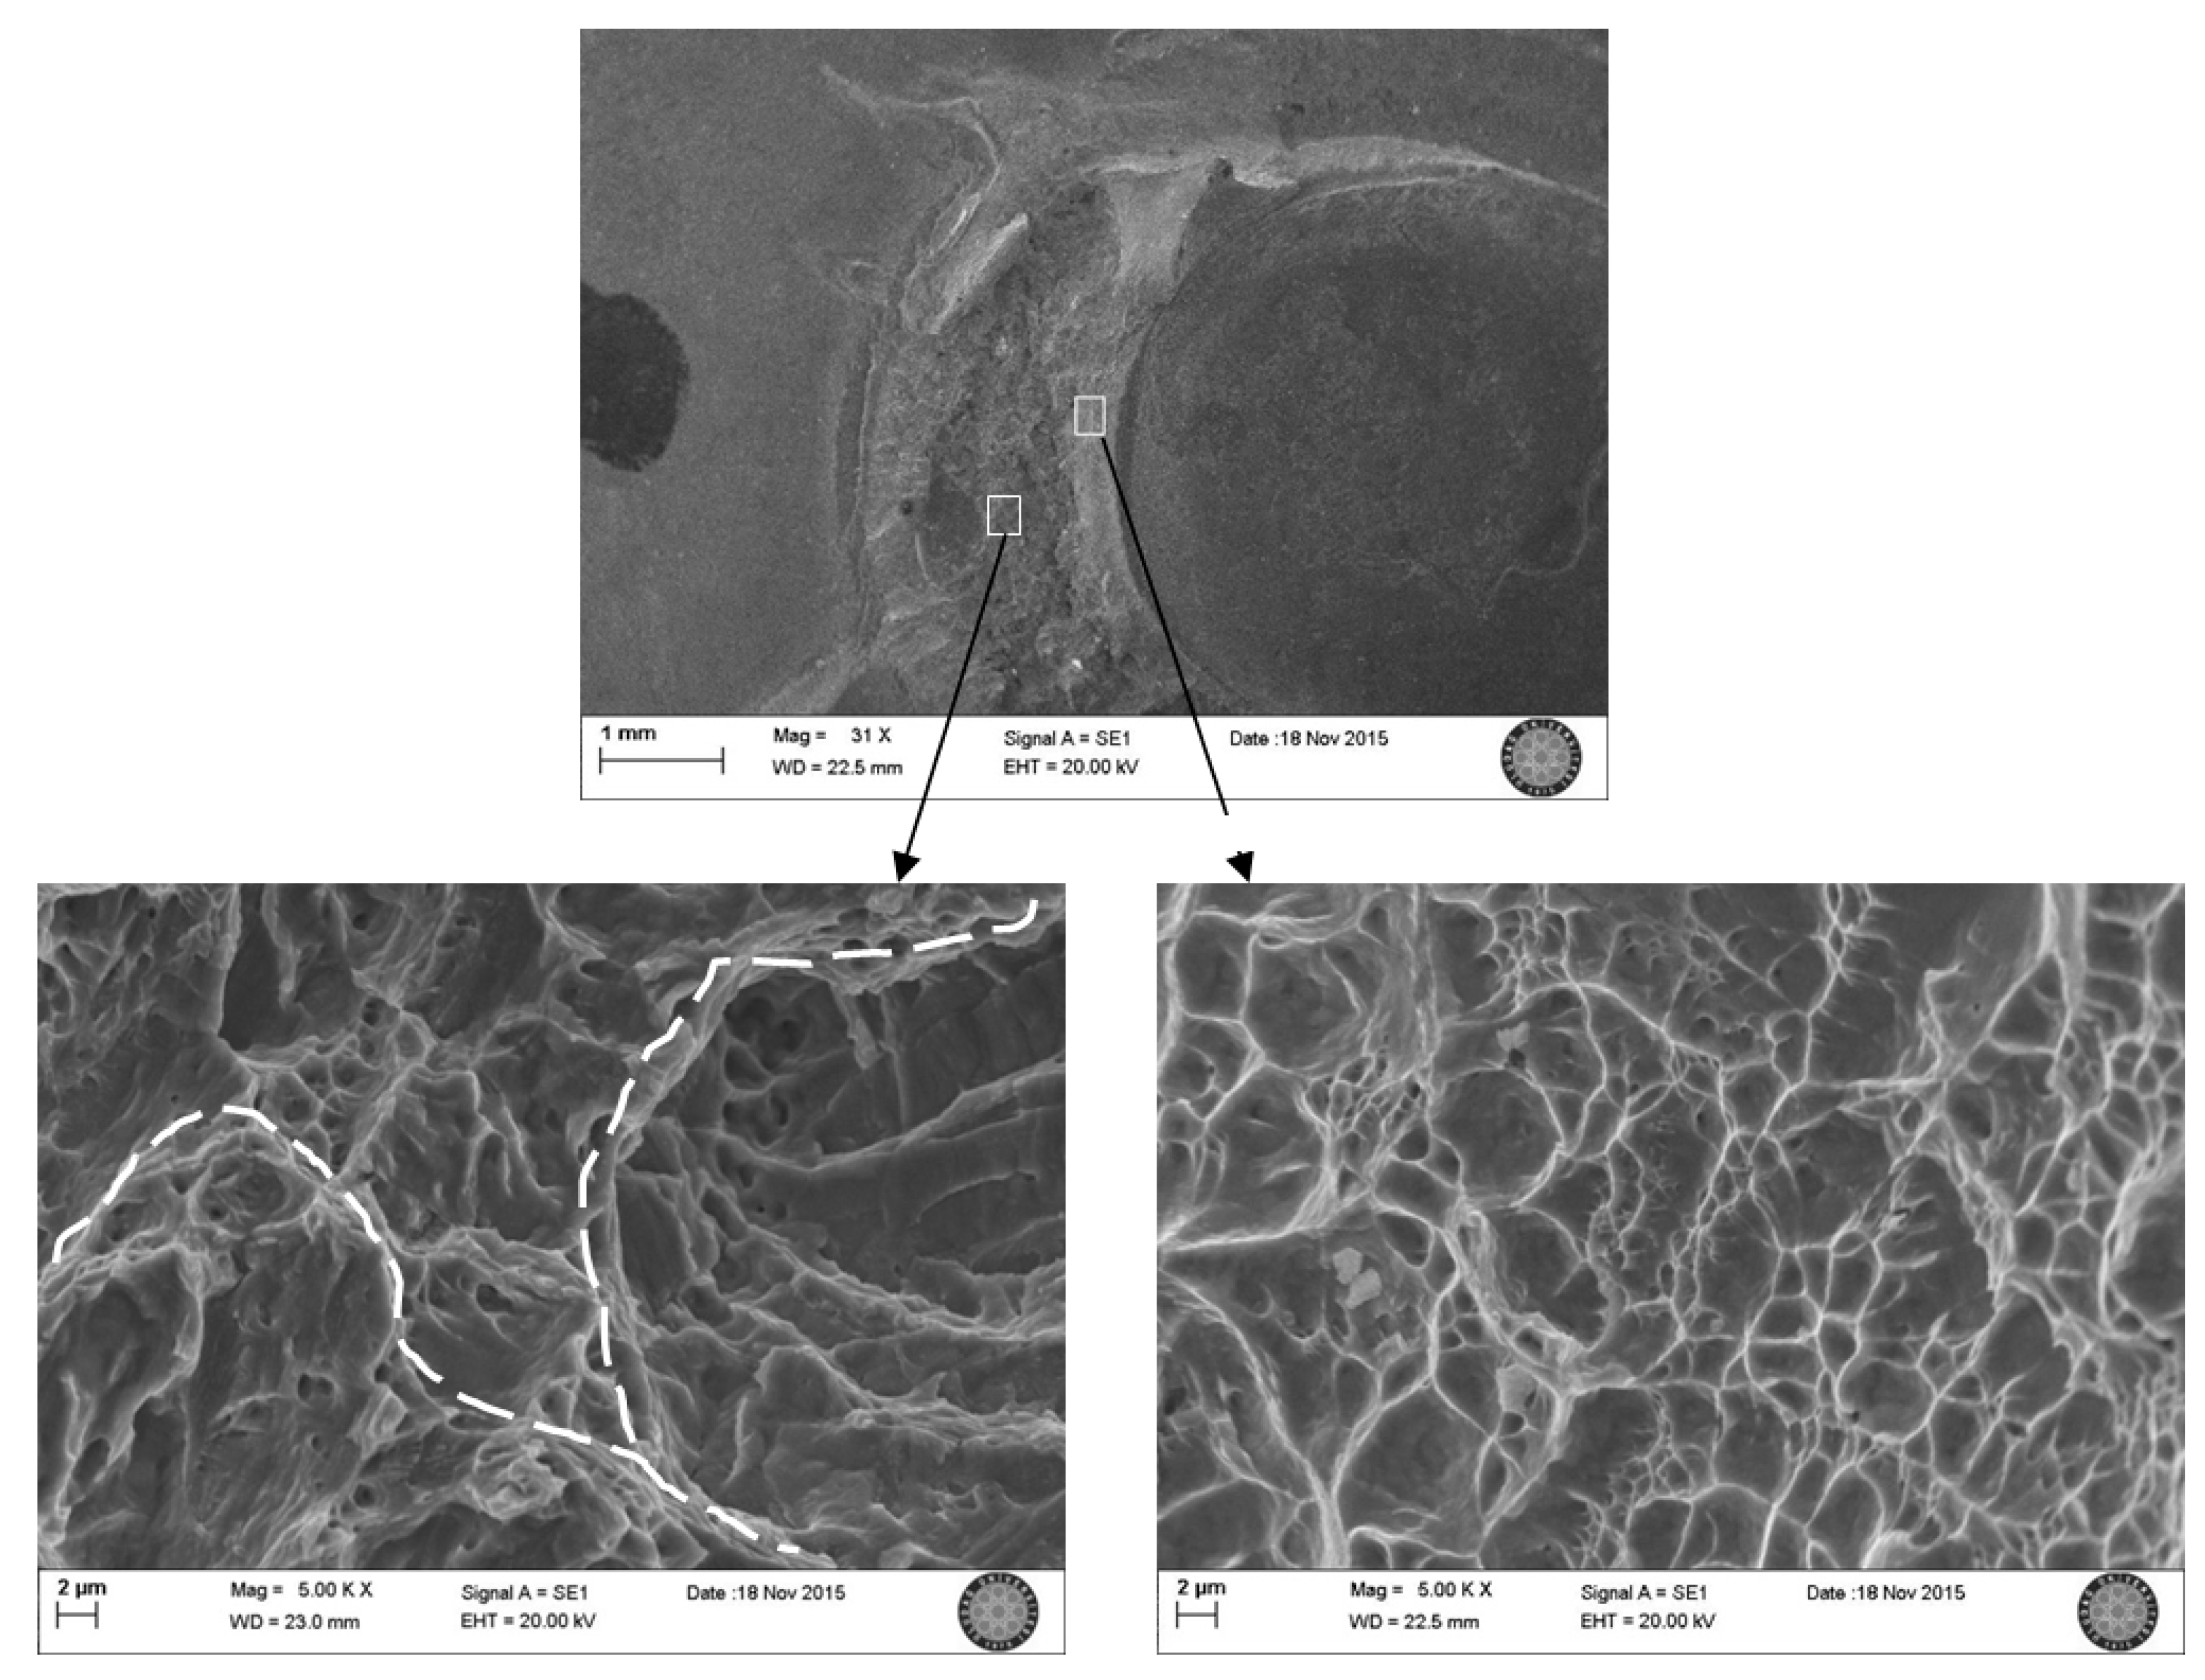
The fracture surface of the BM shows a ductile manner with the formation of fairly equaxial and deep dimples with conical shapes (without any cleavage facets) elongated along the direction of the tensile load (Figure 21). The dimple structure is relatively finer than the BM grain structure, predominantly suggesting that microcracks and micro-void nucleation during tensile testing mostly initiates at the small discontinuities formed at the twin boundaries and inclusions [6]. The SEM images of the fracture surfaces of the spot-welded joints are shown in Figure 22 and Figure 23. A brittle fracture surface with areas of fairly limited ductility was observed in the flank side of the 11 kA joint which had the low fracture load (Figure 22). It should also be emphasized that the intra-layered fractures in this zone are quite brittle. The fracture surface near the weld nugget consists of some shallow voids, exhibiting some characteristics of a ductile failure, and facets among voids in a larger area, indicating a relatively brittle fracture (Figure 22). In the 12 kA joint with the highest fracture load, the fracture surface near the weld nugget indicates a brittle cleavage fracture with a few shallower small voids (Figure 23). On the flank side, brittle intra-layered fractures with some void areas of fairly limited ductility were observed. The boundaries, shown as the dashed lines in Figure 23, with dense deformation streaks may be associated with the extreme grain growth in the HAZ. The joints that had higher strength commonly showed more brittle fracture characteristics, especially on the fracture surface near the weld nugget.
4. Conclusions
The present study focused on the microstructure and the mechanical properties of resistance spot-welded TWIP sheet steels fabricated at different weld currents. From this investigation, the following conclusions can be derived:
- Higher weld currents lead to the formation of a macro expulsion cavity in the fusion zone, a coarser grain structure and thicker annealing twins in the HAZ, a wider HAZ, a higher indentation depth, and a relatively equiaxed dendritic structure in the centre of the fusion zone.
- The HAZ width increases almost linearly with increasing weld current.
- The hardness values in the weld zone are lower than that of the base metal. The HAZ has the lowest hardness values. However, there is no significant relationship between the hardness values in the weld zone and the weld current.
- A higher joint strength, tensile deformation and failure energy absorption capacity can be obtained using the following welding parameters: a weld current of 12 kA, a welding time of 300 ms, and an electrode force of 3 kN.
- The joints exhibit a complex fracture surface with both brittle and limited ductile manners, while the base metal shows a ductile fracture. Joints with the highest strength commonly show more brittle fracture characteristics.
Acknowledgments
The authors are grateful to the Scientific and Technological Research Council of Turkey (TUBITAK) for its financial support to this research (Project number: MAG 213M597). The authors are also grateful to Ermetal Inc. for providing facilities for the resistance spot-welding processes.
Author Contributions
Mumin Tutar, Hakan Aydin and Ali Bayram conceived and designed the experiments; Mumin Tutar and Hakan Aydin performed the experiments; Mumin Tutar, Hakan Aydin and Ali Bayram analyzed the data; and Hakan Aydin and Mumin Tutar wrote the paper.
Conflicts of Interest
The authors declare no conflict of interest.
References
- Reyes-Calderón, F.; Mejía, I.; Boulaajaj, A.; Cabrera, J.M. Effect of microalloying elements (Nb, V and Ti) on the hot flow behavior of high-Mn austenitic twinning induced plasticity (TWIP) steel. Mater. Sci. Eng. A 2013, 560, 552–560. [Google Scholar] [CrossRef]
- Saeed-Akbari, A.; Imlau, J.; Prahl, U.; Bleck, W. Derivation and Variation in Composition-Dependent Stacking Fault Energy Maps Based on Subregular Solution Model in High-Manganese Steels. Metall. Mater. Trans. A 2009, 40, 3076–3090. [Google Scholar] [CrossRef]
- Allain, S.; Chateau, J.P.; Bouaziz, O.; Migot, S.; Guelton, N. Correlations between the calculated stacking fault energy and the plasticity mechanisms in Fe-Mn-C alloys. Mater. Sci. Eng. A 2004, 387–389, 158–162. [Google Scholar] [CrossRef]
- Hamada, A.S. Manufacturing, Mechanical Properties and Corrosion Behaviour of High Mn TWIP Steels; University of Oulu: Oulu, Finland, 2007; Volume 281, ISBN 9789514285837. [Google Scholar]
- Saha, D.C.; Park, Y. Do Weldability and liquation cracking characteristics on resistance-spot-welded high-Mn austenitic steel. In Proceedings of the ASM International Conference: Trends in Welding Research, Chicago, IL, USA, 4–8 June 2012; pp. 330–335. [Google Scholar]
- Ma, L.; Wei, Y.; Hou, L.; Yan, B. Microstructure and Mechanical Properties of TWIP Steel Joints. J. Iron Steel Res. Int. 2014, 21, 749–756. [Google Scholar] [CrossRef]
- Busch, C.; Hatscher, A.; Otto, M.; Huinink, S.; Vucetic, M.; Bonk, C.; Bouguecha, A.; Behrens, B.A. Properties and Application of High-manganese TWIP-steels in Sheet Metal Forming. Procedia Eng. 2014, 81, 939–944. [Google Scholar] [CrossRef]
- Dan, W.J.; Liu, F.; Zhang, W.G. Mechanical behavior prediction of TWIP steel in plastic deformation. Comput. Mater. Sci. 2014, 94, 114–121. [Google Scholar] [CrossRef]
- Grässel, O.; Krüger, L.; Frommeyer, G.; Meyer, L.W. High strength Fe-Mn-(Al, Si) TRIP/TWIP steels development-properties-application. Int. J. Plast. 2000, 16, 1391–1409. [Google Scholar] [CrossRef]
- Ghasri-Khouzani, M.; McDermid, J.R. Effect of carbon content on the mechanical properties and microstructural evolution of Fe-22Mn-C steels. Mater. Sci. Eng. A 2015, 621, 118–127. [Google Scholar] [CrossRef]
- Saha, D.C.; Cho, Y.; Park, Y. Metallographic and fracture characteristics of resistance spot welded TWIP steels. Sci. Technol. Weld. Join. 2013, 18, 711–720. [Google Scholar] [CrossRef]
- Grässel, O.; Rommeyer, G.; Derder, C.; Hofmann, H. Phase Transformations and Mechanical Properties of To cite this version. J. Phys. IV Fr. 1997, 7, 383–388. [Google Scholar] [CrossRef]
- Aydin, H. The mechanical properties of dissimilar resistance spot-welded DP600-DP1000 steel joints for automotive applications. Proc. Inst. Mech. Eng. Part D J. Automob. Eng. 2014, 229, 599–610. [Google Scholar] [CrossRef]
- Aydin, H.; Durgun, İ.; Tutar, M.; Bayram, A. Correlations between welding time and mechanical properties of spot welded dissimilar joints for high strength steels. In Proceedings of the 7th Congress of Automotive Technologies, OTEKON, Bursa, Turkey, 26–27 May 2014. [Google Scholar]
- Saha, D.C.; Chang, I.; Park, Y.D. Heat-affected zone liquation crack on resistance spot welded TWIP steels. Mater. Charact. 2014, 93, 40–51. [Google Scholar] [CrossRef]
- Yu, J.; Shim, J.; Rhee, S. Characteristics of Resistance Spot Welding for 1 GPa Grade Twin Induced Plasticity Steel. Mater. Trans. 2012, 53, 2011–2018. [Google Scholar] [CrossRef]
- Russo Spena, P.; De Maddis, M.; Lombardi, F.; Rossini, M. Investigation on Resistance Spot Welding of TWIP Steel Sheets. Steel Res. Int. 2015, 86, 1480–1489. [Google Scholar] [CrossRef]
- Yu, J.; Choi, D.; Rhee, S. Improvement of weldability of 1 GPa grade twin-induced plasticity steel. Weld. J. 2014, 93, 78s–84s. [Google Scholar]
- Razmpoosh, M.; Shamanian, M.; Esmailzadeh, M. The microstructural evolution and mechanical properties of resistance spot welded Fe-31Mn-3Al-3Si TWIP steel. Mater. Des. 2015, 67, 571–576. [Google Scholar] [CrossRef]
- American Society for Testing and Materials. ASTM E8/E8M standard test methods for tension testing of metallic materials. Annu. Book ASTM Stand. 2010, 4, 1–27. [Google Scholar]
- Zhang, H.; Senkara, J. Resistance Welding: Fundamentals and Applications; CRC Press Taylor & Francis Group: Boca Raton, FL, USA, 2006; ISBN 0-8493-2346-0. [Google Scholar]
- Saha, D.C.; Han, S.; Chin, K.G.; Choi, I.; Park, Y. Do Weldability evaluation and microstructure analysis of resistance-spot-welded high-Mn steel in automotive application. Steel Res. Int. 2012, 83, 352–357. [Google Scholar] [CrossRef]
- Tutar, M.; Aydin, H.; Bayram, A. Weld Current Effect on the Mechanical Properties of Resistance Spot Welded TWIP980 Steel Sheets. In Proceedings of the International Research Symposium on Recent Innovations in Engineering Science and Technology, Paris, France, 9–10 March 2016. [Google Scholar]
- Gutierrez-Urrutia, I.; Zaefferer, S.; Raabe, D. The effect of grain size and grain orientation on deformation twinning in a Fe-22 wt. % Mn-0.6 wt. % C TWIP steel. Mater. Sci. Eng. A 2010, 527, 3552–3560. [Google Scholar] [CrossRef]
- Gutierrez-Urrutia, I.; Raabe, D. Study of Deformation Twinning and Planar Slip in a TWIP Steel by Electron Channeling Contrast Imaging in a SEM. Mater. Sci. Forum 2011, 702–703, 523–529. [Google Scholar] [CrossRef]
- Haase, C.; Barrales-Mora, L.A.; Molodov, D.A.; Gottstein, G. Tailoring the mechanical properties of a twinning-induced plasticity steel by retention of deformation twins during heat treatment. Metall. Mater. Trans. A Phys. Metall. Mater. Sci. 2013, 44, 4445–4449. [Google Scholar] [CrossRef]
- Kumar, B.R.; Das, S.K.; Mahato, B.; Das, A.; Ghosh Chowdhury, S. Effect of large strains on grain boundary character distribution in AISI 304L austenitic stainless steel. Mater. Sci. Eng. A 2007, 454–455, 239–244. [Google Scholar] [CrossRef]
- Saleh, A.A.; Gazder, A.A.; Pereloma, E.V. EBSD observations of recrystallisation and tensile deformation in twinning induced plasticity steel. Trans. Indian Inst. Met. 2013, 66, 621–629. [Google Scholar] [CrossRef]
- Hielscher, R.; Bachmann, F.; Schaeben, H.; Mainprice, D. Features of the Free and Open Source Toolbox MTEX for Texture Analysis; Géosciences Montpellier: Montpellier, France, 2014. [Google Scholar]
- Lee, S.Y.; Chun, Y.B.; Han, J.W.; Hwang, S.K. Effect of thermomechanical processing on grain boundary characteristics in two-phase brass. Mater. Sci. Eng. A 2003, 363, 307–315. [Google Scholar] [CrossRef]
- Yuan, X.; Chen, L.; Zhao, Y.; Di, H.; Zhu, F. Influence of annealing temperature on mechanical properties and microstructures of a high manganese austenitic steel. J. Mater. Process. Technol. 2015, 217, 278–285. [Google Scholar] [CrossRef]
- American Welding Society (AWS) D8 Committee on Automotive Welding. SAE D8.9M: Recommended Practice for Test Methods for Evaluating the Resistance Spot Welding Behavior of Automotive Sheet Steel Materaials; American Welding Society: Miami, FL, USA, 2002. [Google Scholar]
- Pouranvari, M.; Marashi, S.P.H. Critical review of automotive steels spot welding: Process, structure and properties. Sci. Technol. Weld. Join. 2013, 18, 361–403. [Google Scholar] [CrossRef]
- Razmpoosh, M.H.; Zarei-Hanzaki, A.; Heshmati-Manesh, S.; Fatemi-Varzaneh, S.M.; Marandi, A. The Grain Structure and Phase Transformations of TWIP Steel during Friction Stir Processing. J. Mater. Eng. Perform. 2015, 24, 2826–2835. [Google Scholar] [CrossRef]
- Tang, Z.Y.; Misra, R.D.K.; Ma, M.; Zan, N.; Wu, Z.Q.; Ding, H. Deformation twinning and martensitic transformation and dynamic mechanical properties in Fe-0.07C-23Mn-3.1Si-2.8Al TRIP/TWIP steel. Mater. Sci. Eng. A 2015, 624, 186–192. [Google Scholar] [CrossRef]
- Abadi, M.M.K.; Najafizadeh, A.; Kermanpur, A.; Mazaheri, Y. Effect of annealing process on microstructure and mechanical properties of high manganese austenitic TWIP steel. Int. J. ISSI 2011, 8, 1–4. [Google Scholar]
- AWS D8.1M. Specification for Automotive Weld Quality–Resistance Spot Welding of Steel; American Welding Society (AWS): Miami, FL, USA, 2013. [Google Scholar]
Figure 1.
Tensile-test specimen for the base metal (unit: mm).
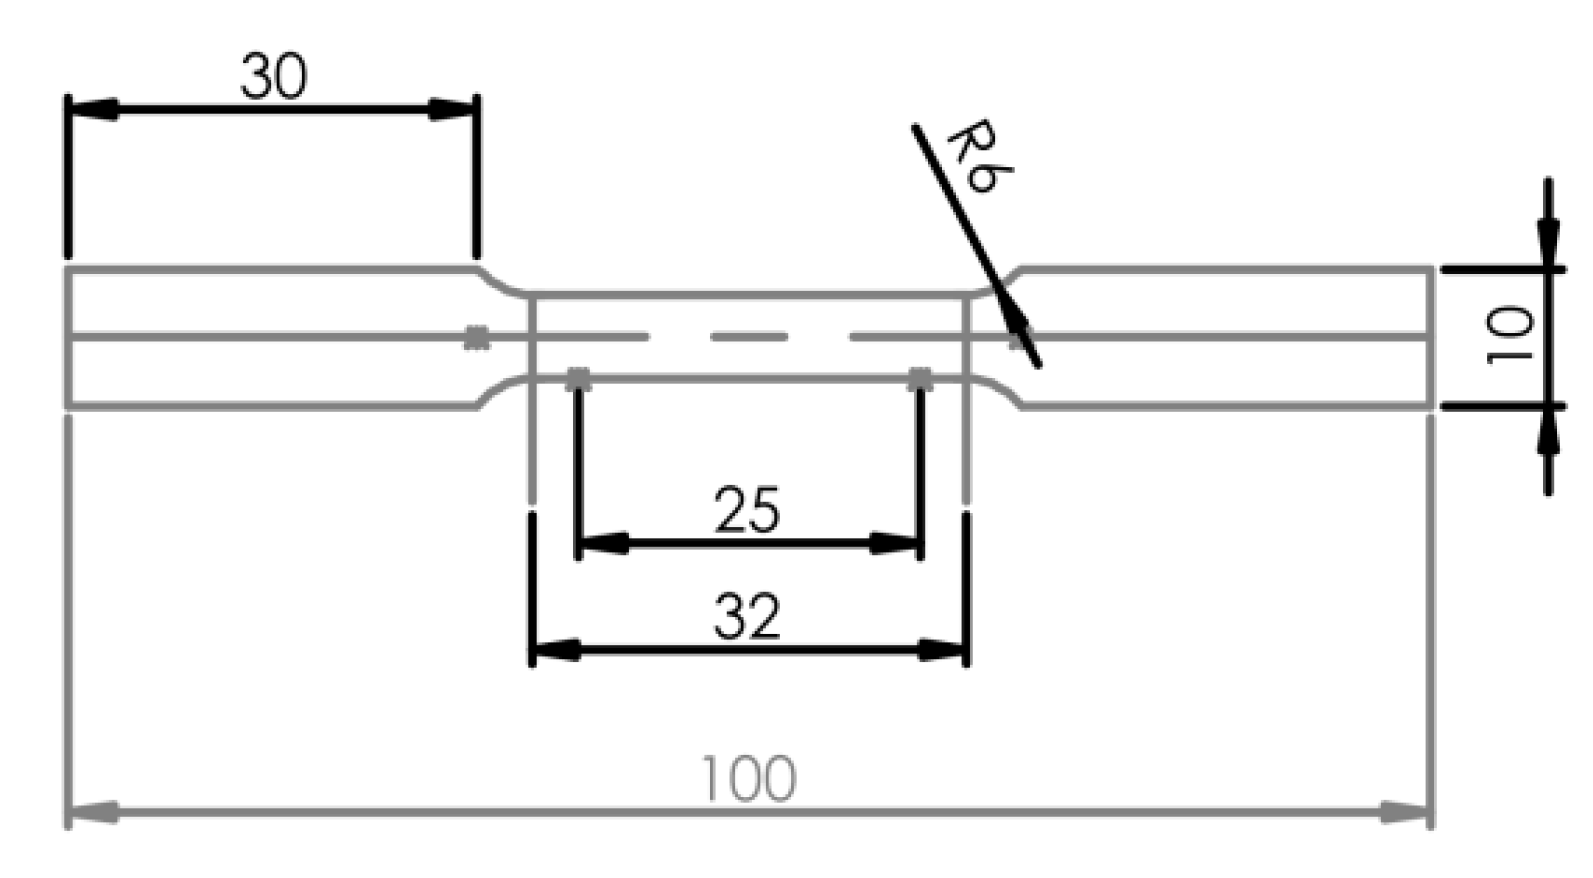
Figure 2.
Tensile-test curves for the twinning-induced plasticity (TWIP) steel used in this investigation (three TWIP samples with the same characteristics were tested).
Figure 2.
Tensile-test curves for the twinning-induced plasticity (TWIP) steel used in this investigation (three TWIP samples with the same characteristics were tested).

Figure 3.
The welding sample installed with overlapping (unit: mm).
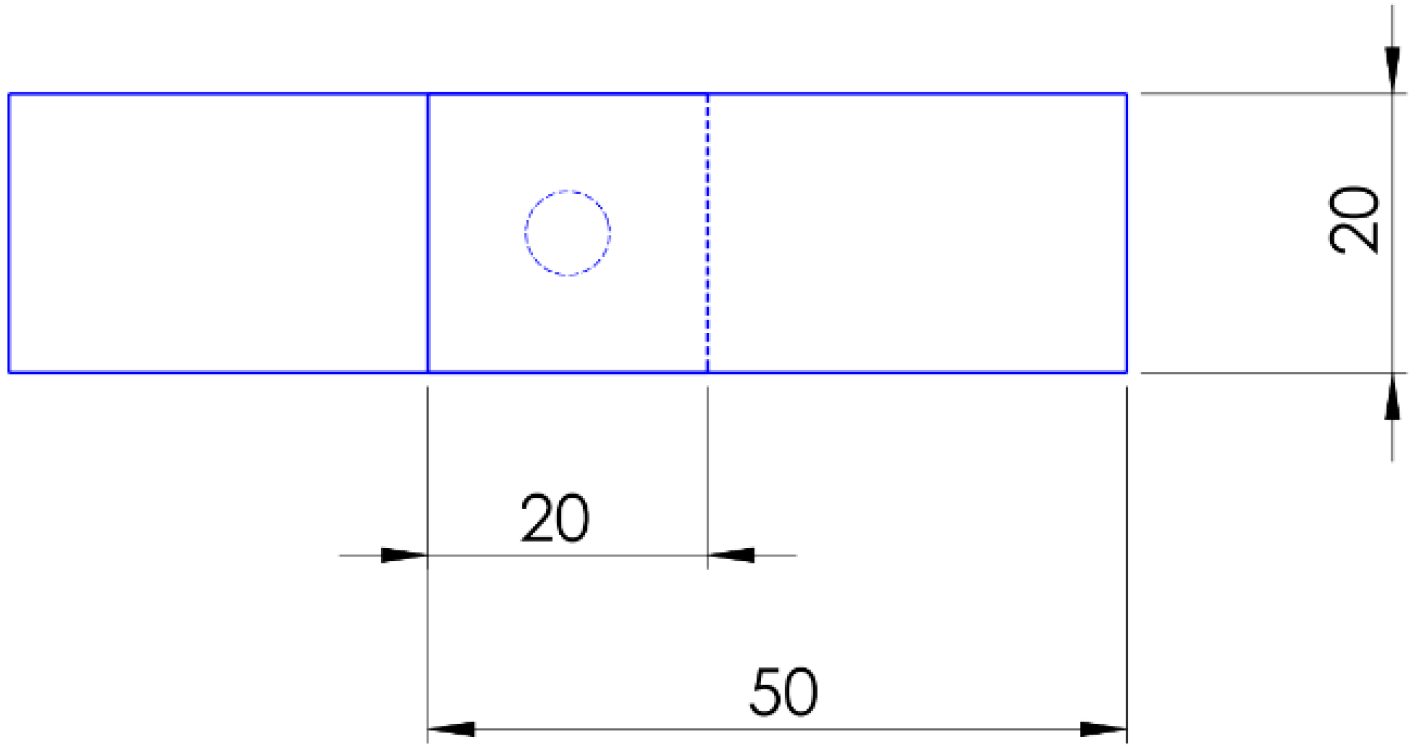
Figure 4.
The medium-frequency direct current (MFDC) resistance spot-welding (RSW) machine connected to the ABB robot arm used in this investigation.
Figure 4.
The medium-frequency direct current (MFDC) resistance spot-welding (RSW) machine connected to the ABB robot arm used in this investigation.
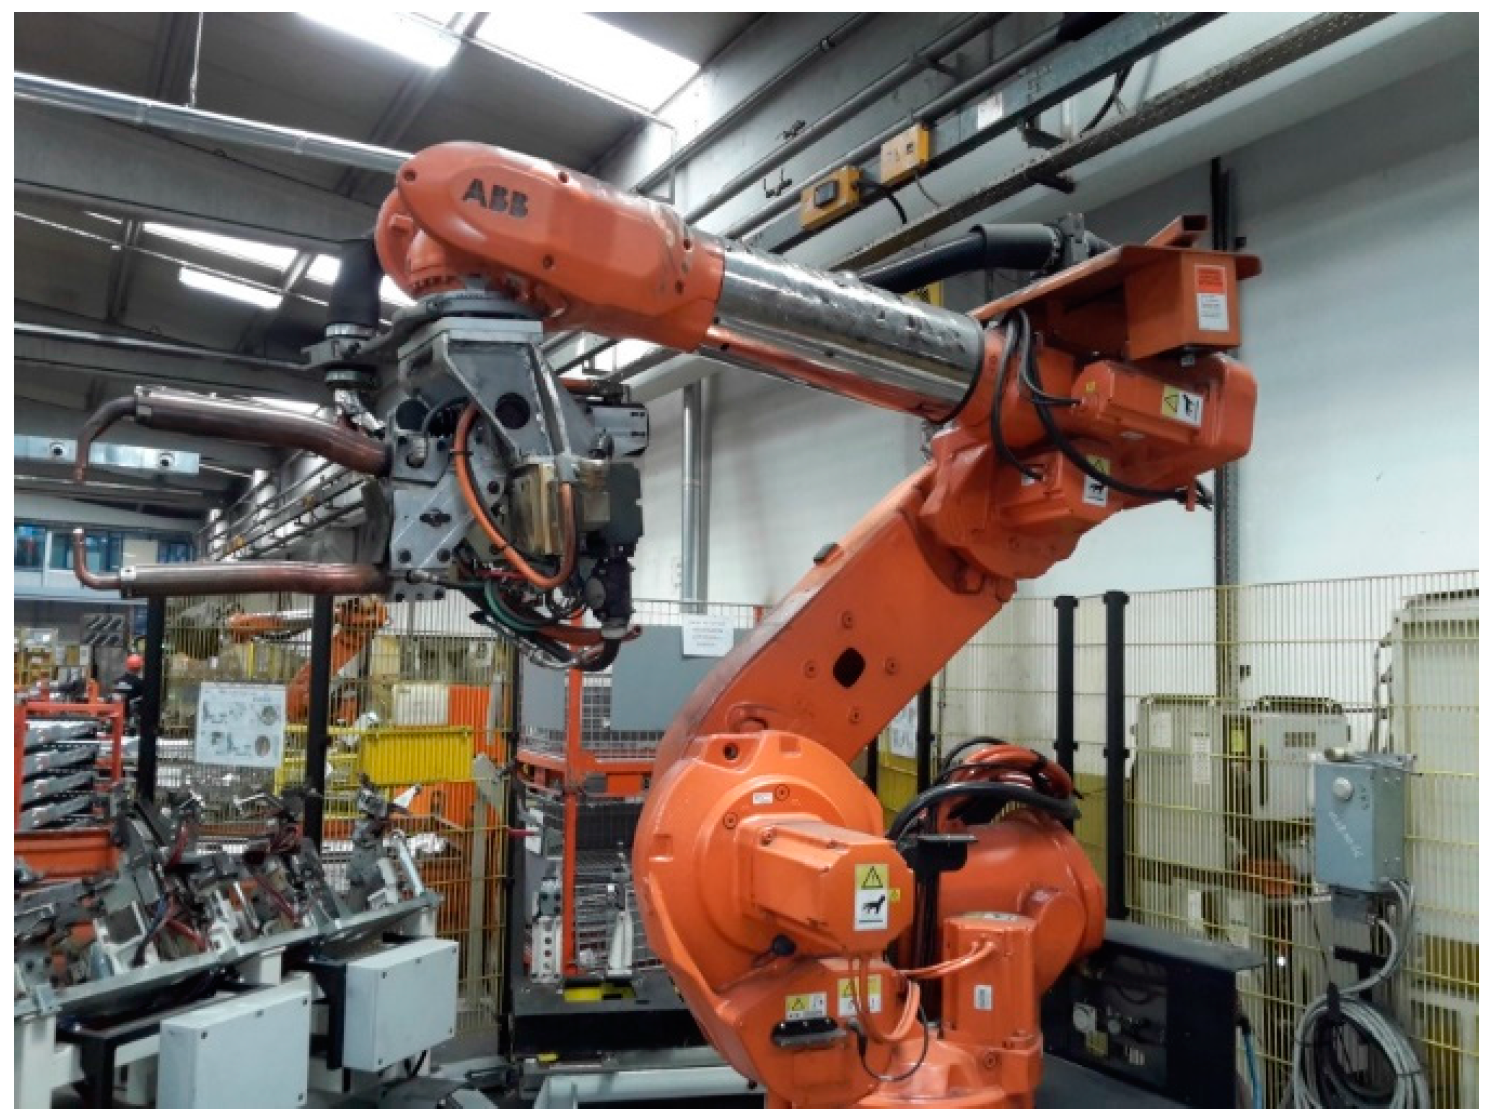
Figure 5.
A parameter chart of the welding process used in this study.
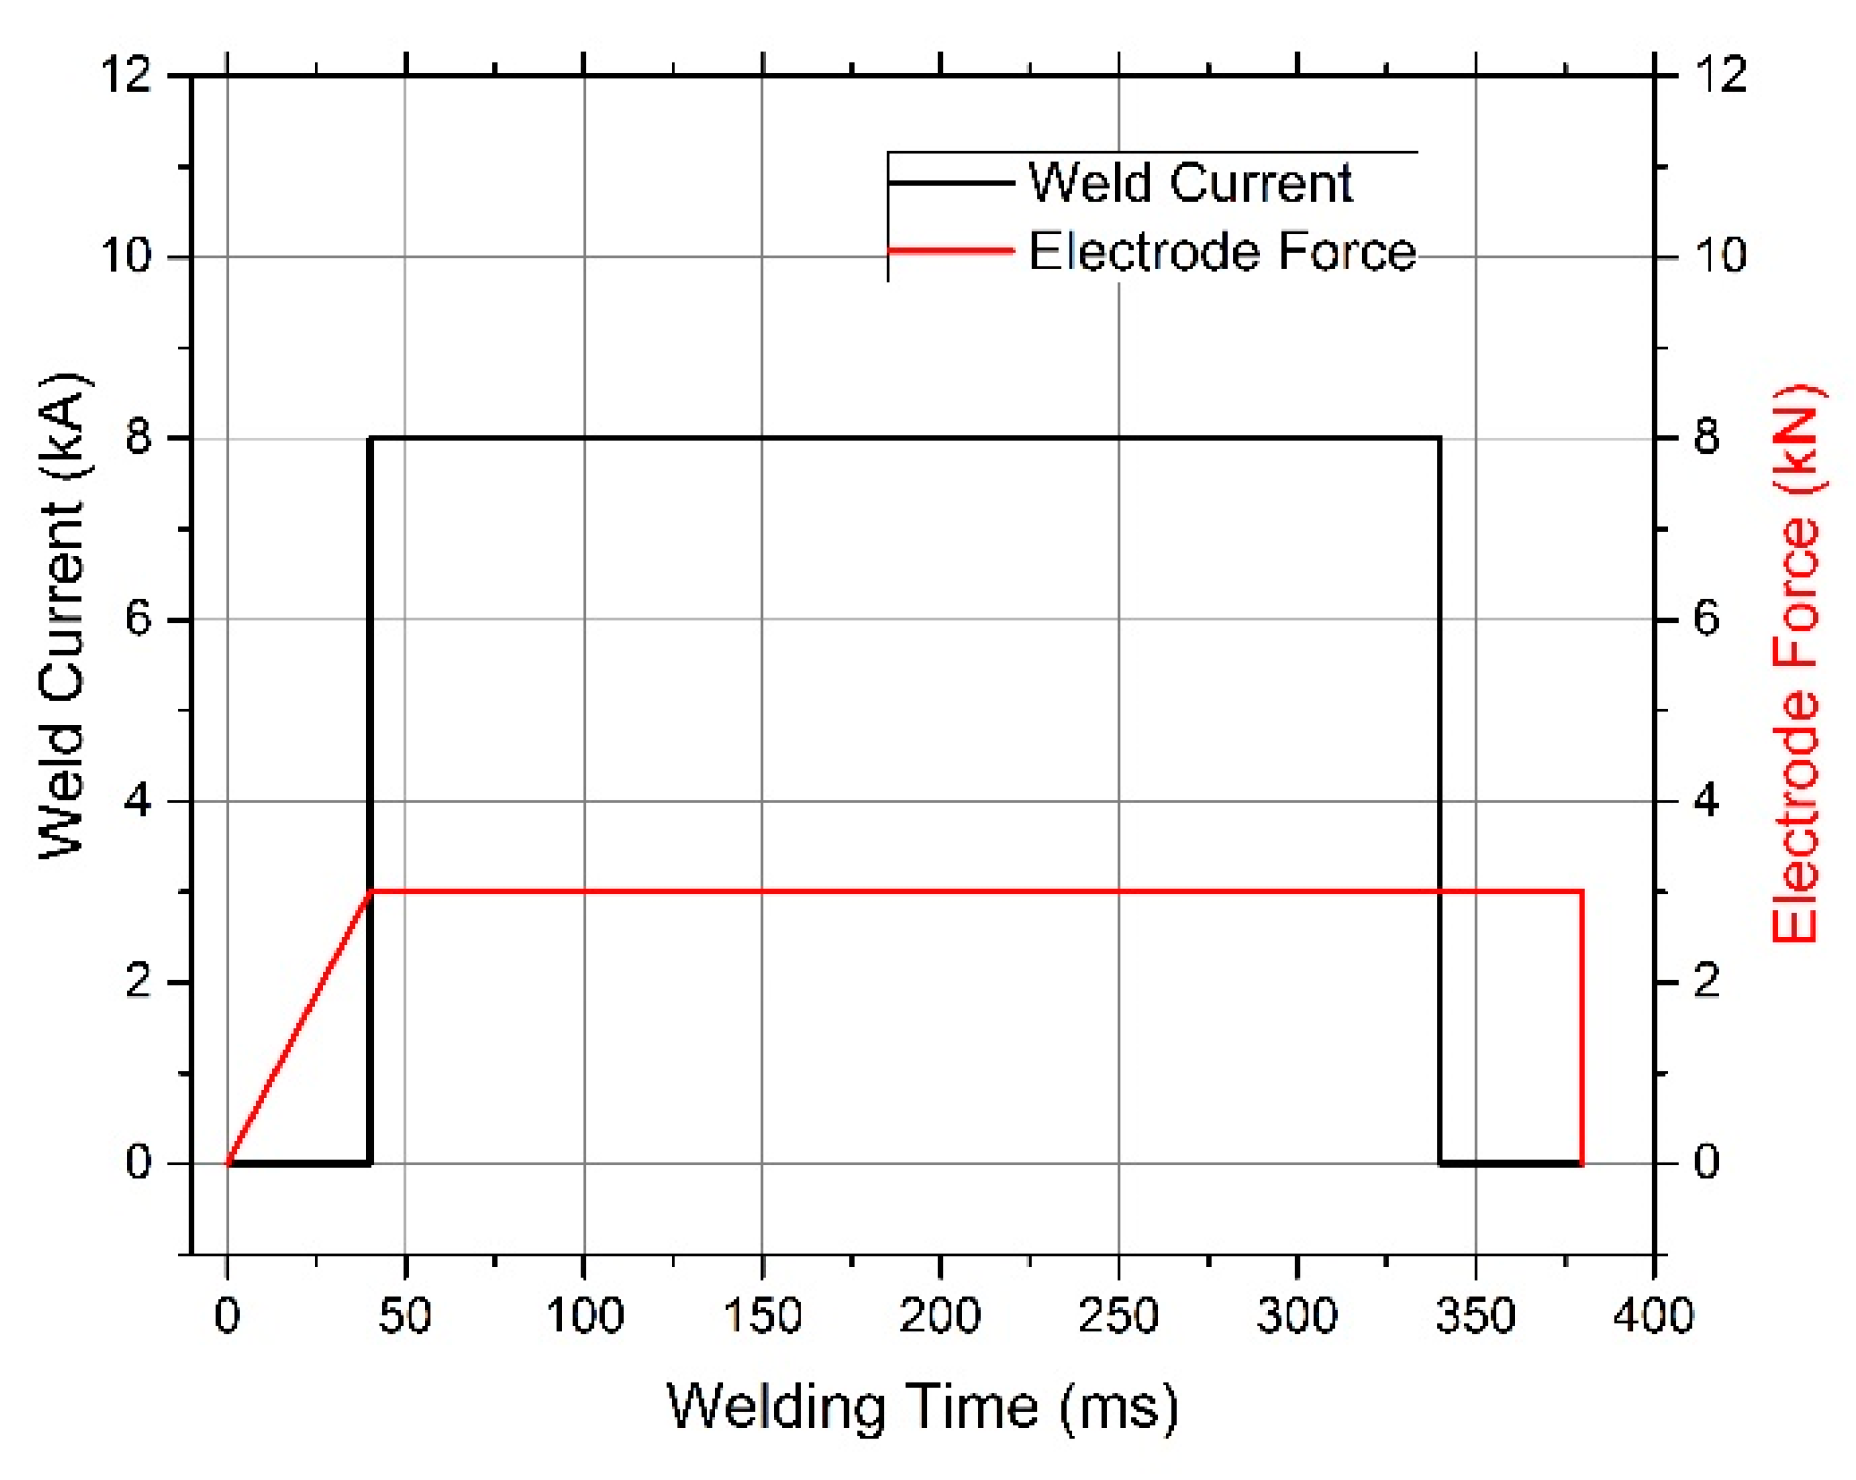
Figure 6.
The typical macrostructure and microstructures of a resistance spot-welded TWIP steel joint (12 kA). (CDFZ: coarse dendritic fusion zone, FDFZ: fine dendritic fusion zone, FGHAZ: fine-grained heat-affected zone, CGHAZ: coarse-grained heat affected zone).
Figure 6.
The typical macrostructure and microstructures of a resistance spot-welded TWIP steel joint (12 kA). (CDFZ: coarse dendritic fusion zone, FDFZ: fine dendritic fusion zone, FGHAZ: fine-grained heat-affected zone, CGHAZ: coarse-grained heat affected zone).

Figure 7.
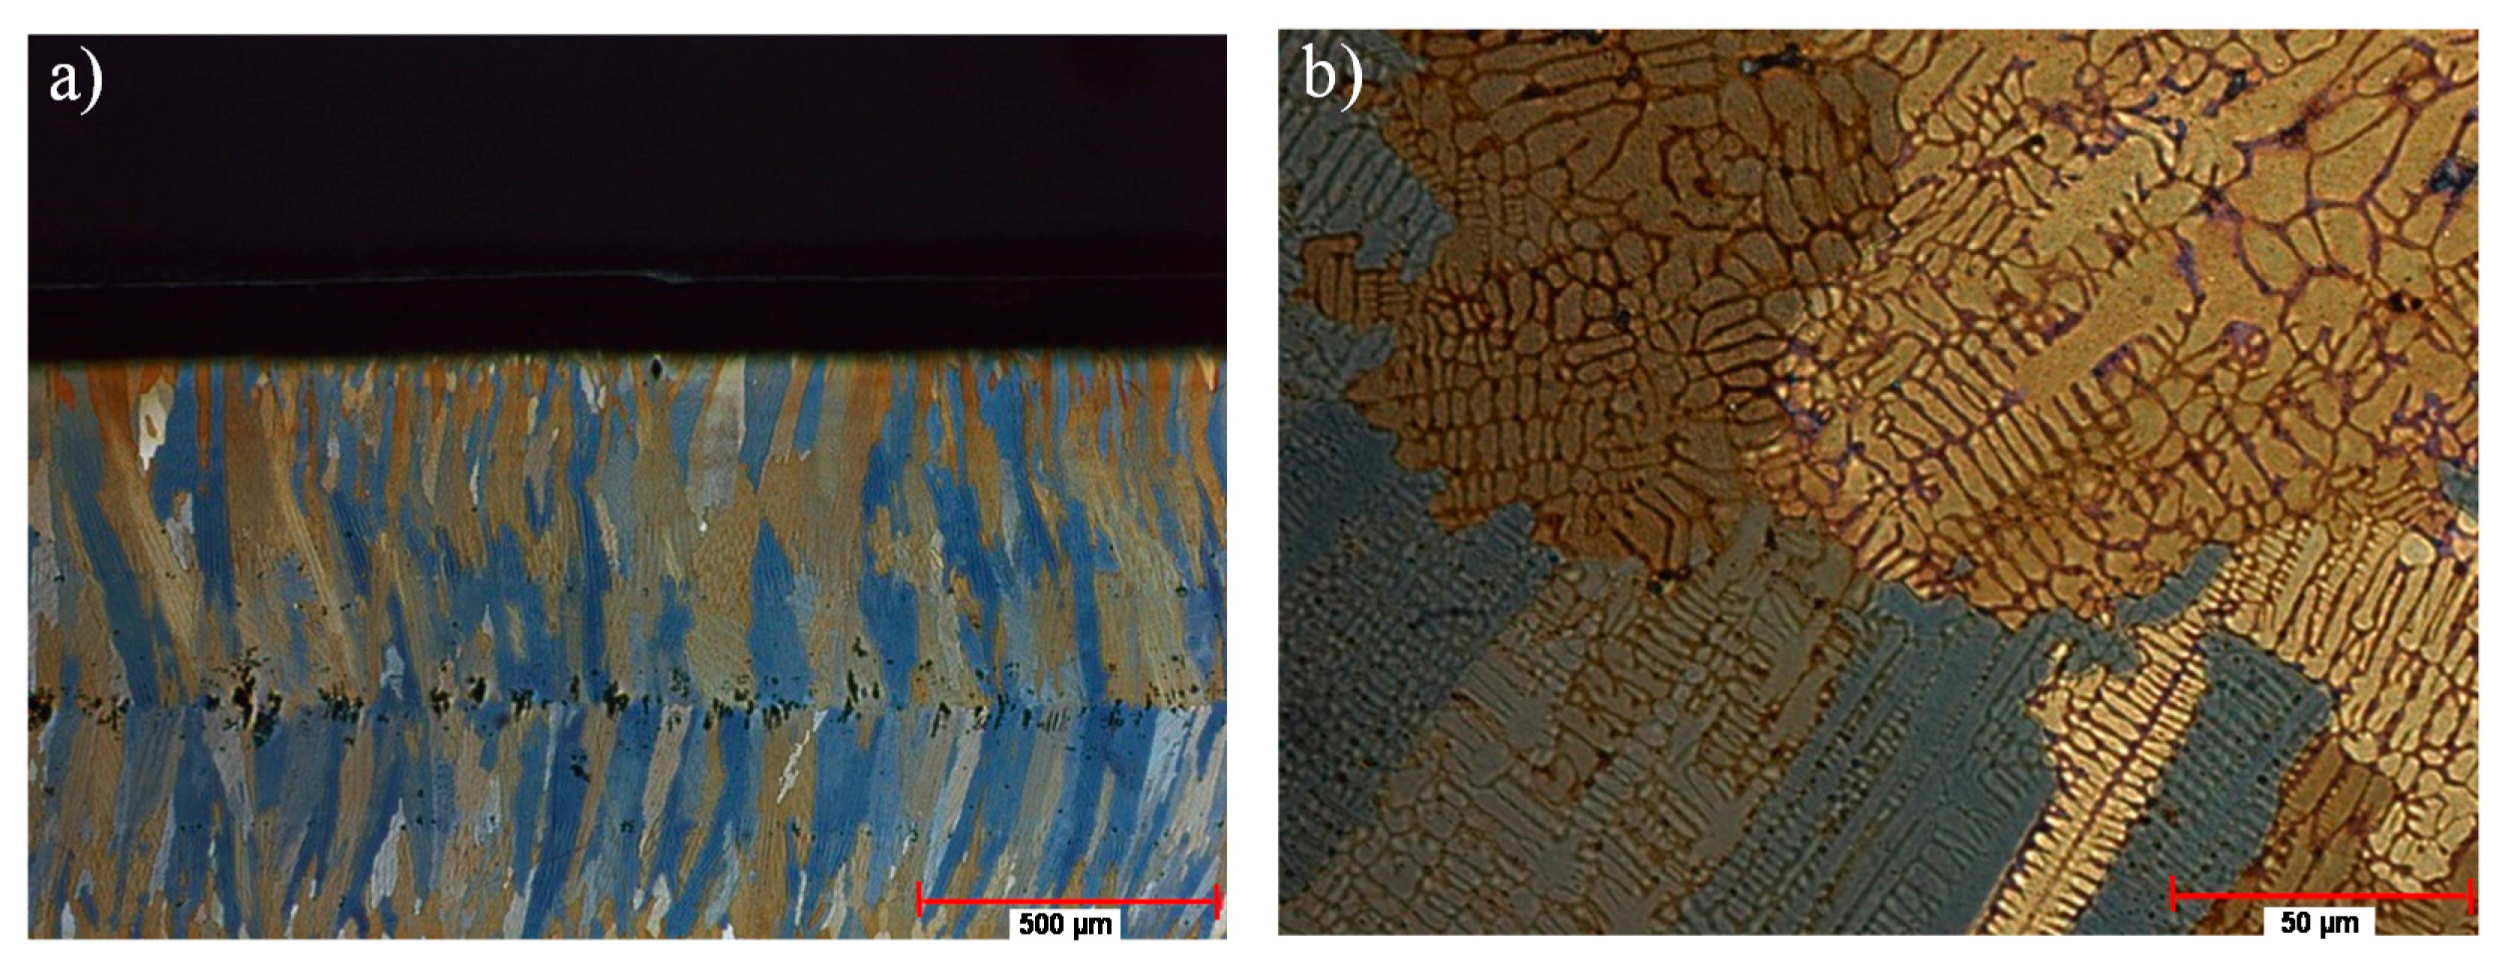
Interdendritic macro-pores (a) and micro-pores (b) in the fusion zone (FZ) of a resistance spot-welded TWIP steel joint ((a) 9 kA, (b) 12 kA).
Figure 7.
Interdendritic macro-pores (a) and micro-pores (b) in the fusion zone (FZ) of a resistance spot-welded TWIP steel joint ((a) 9 kA, (b) 12 kA).

Figure 8.
The effect of the weld current on the formation of a macro expulsion cavity [23]: (a) 8 kA, (b) 12 kA.
Figure 8.
The effect of the weld current on the formation of a macro expulsion cavity [23]: (a) 8 kA, (b) 12 kA.
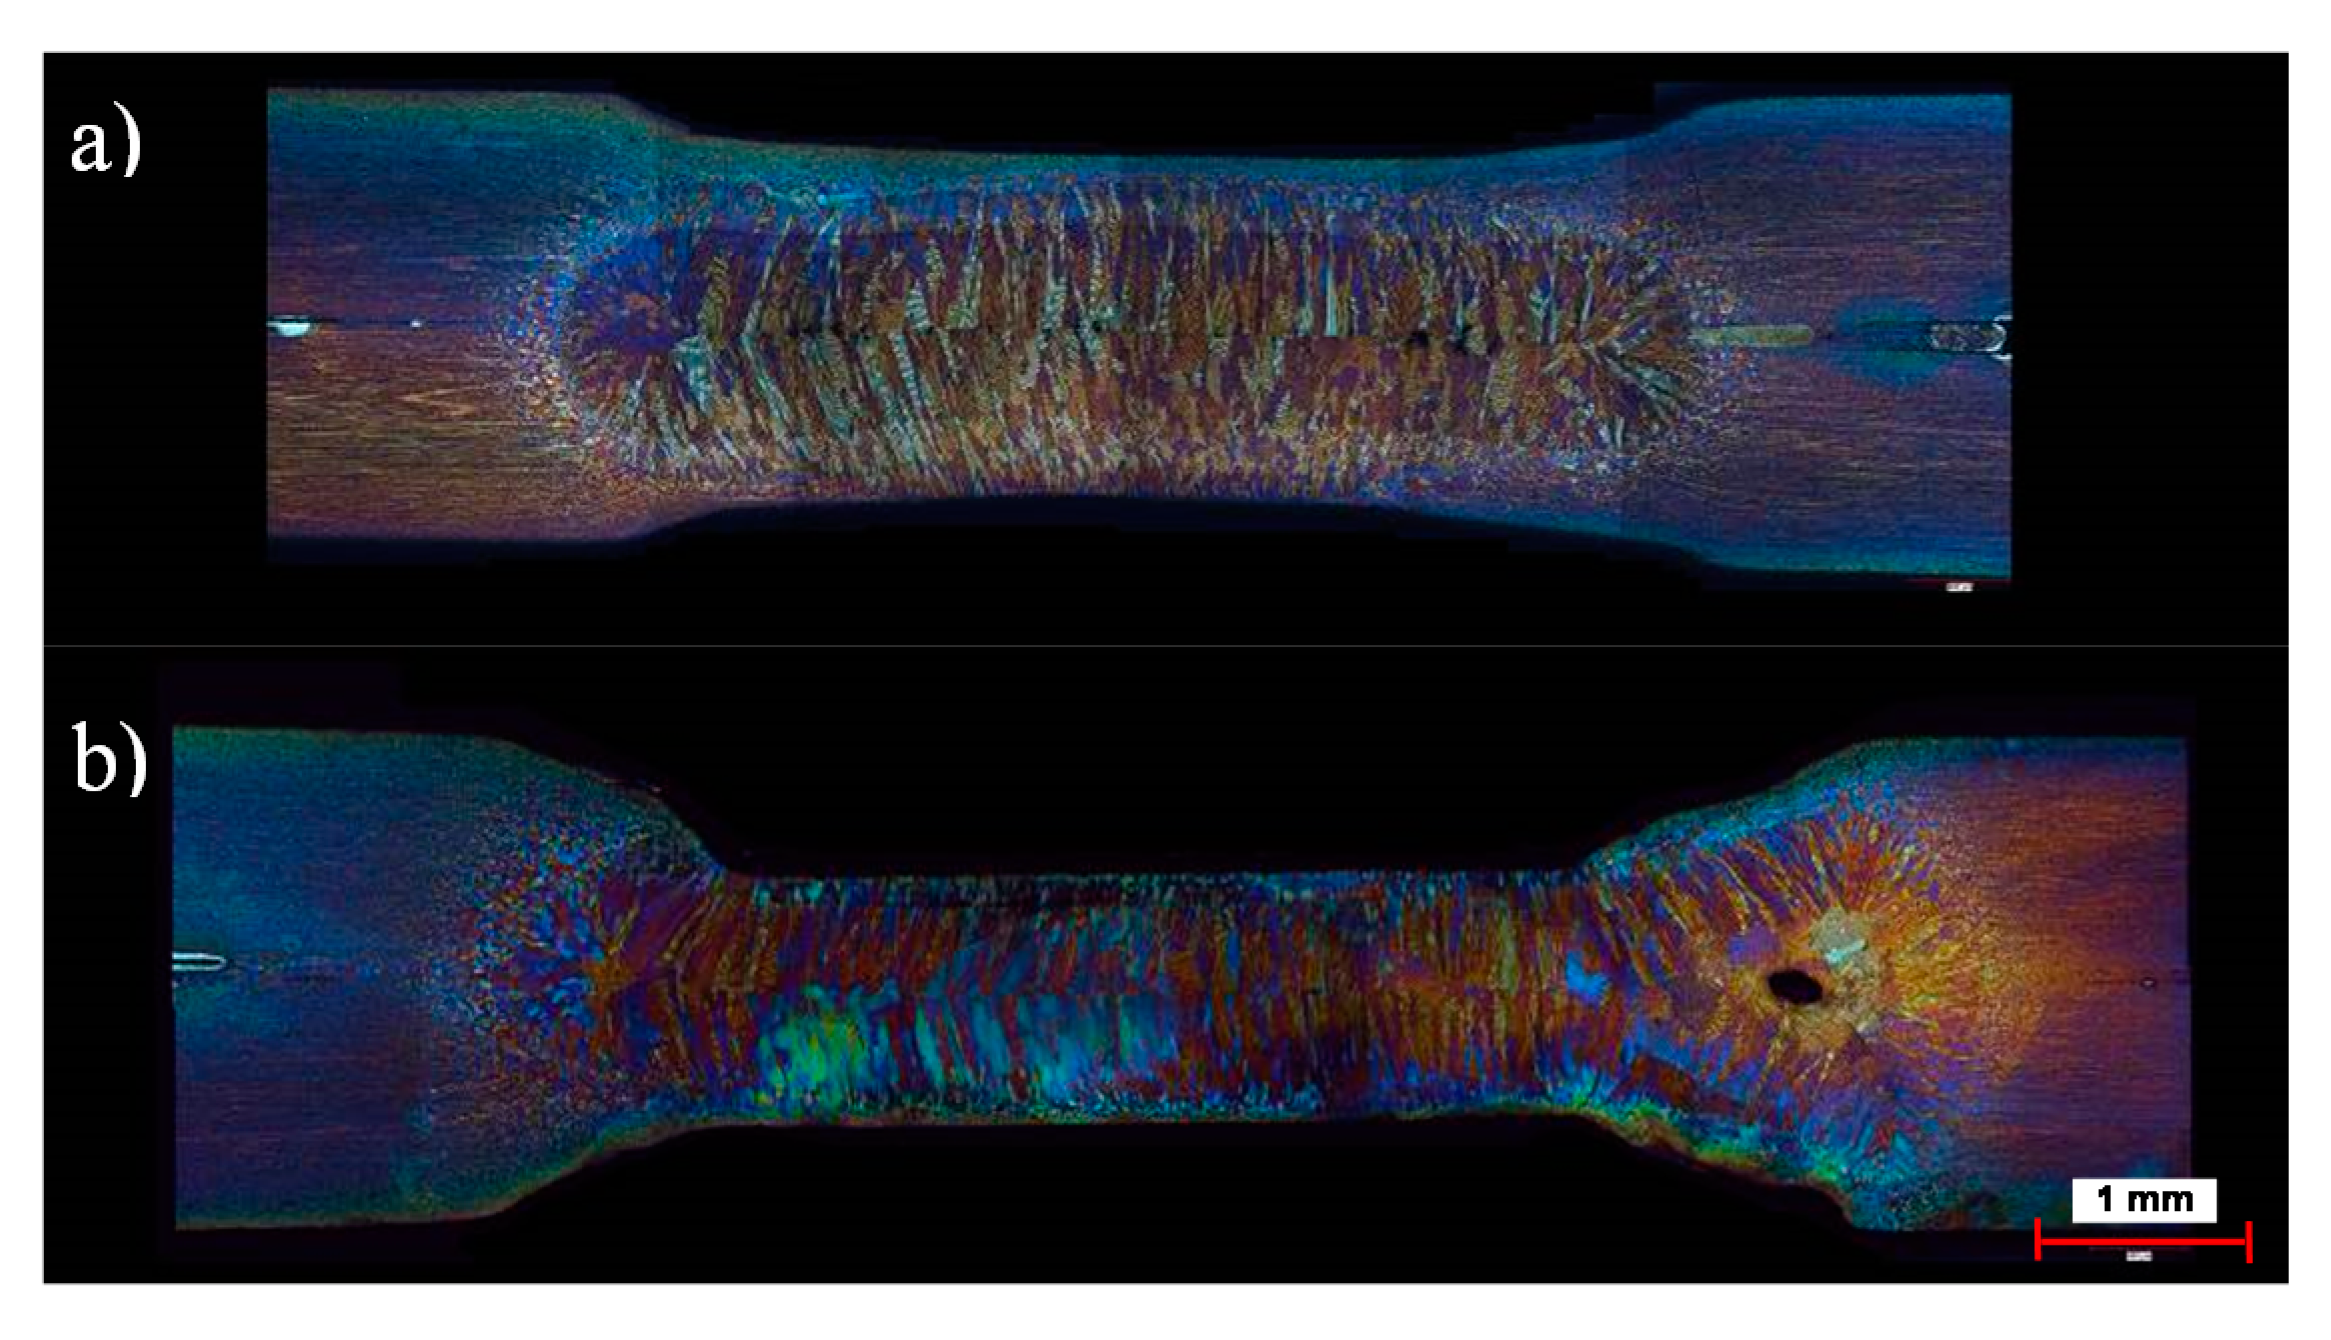
Figure 9.
The FZs of the resistance spot-welded TWIP joints: (a) 8 kA; (b) 10 kA; (c) 12 kA.

Figure 10.
The heat-affected zones (HAZs) of the resistance spot-welded TWIP joints: (a) 8 kA; (b) 10 kA; (c) 12 kA.
Figure 10.
The heat-affected zones (HAZs) of the resistance spot-welded TWIP joints: (a) 8 kA; (b) 10 kA; (c) 12 kA.

Figure 11.
The HAZ microstructures of the resistance spot-welded TWIP joints: (a) 8 kA; (b) 10 kA; (c) 12 kA.
Figure 11.
The HAZ microstructures of the resistance spot-welded TWIP joints: (a) 8 kA; (b) 10 kA; (c) 12 kA.
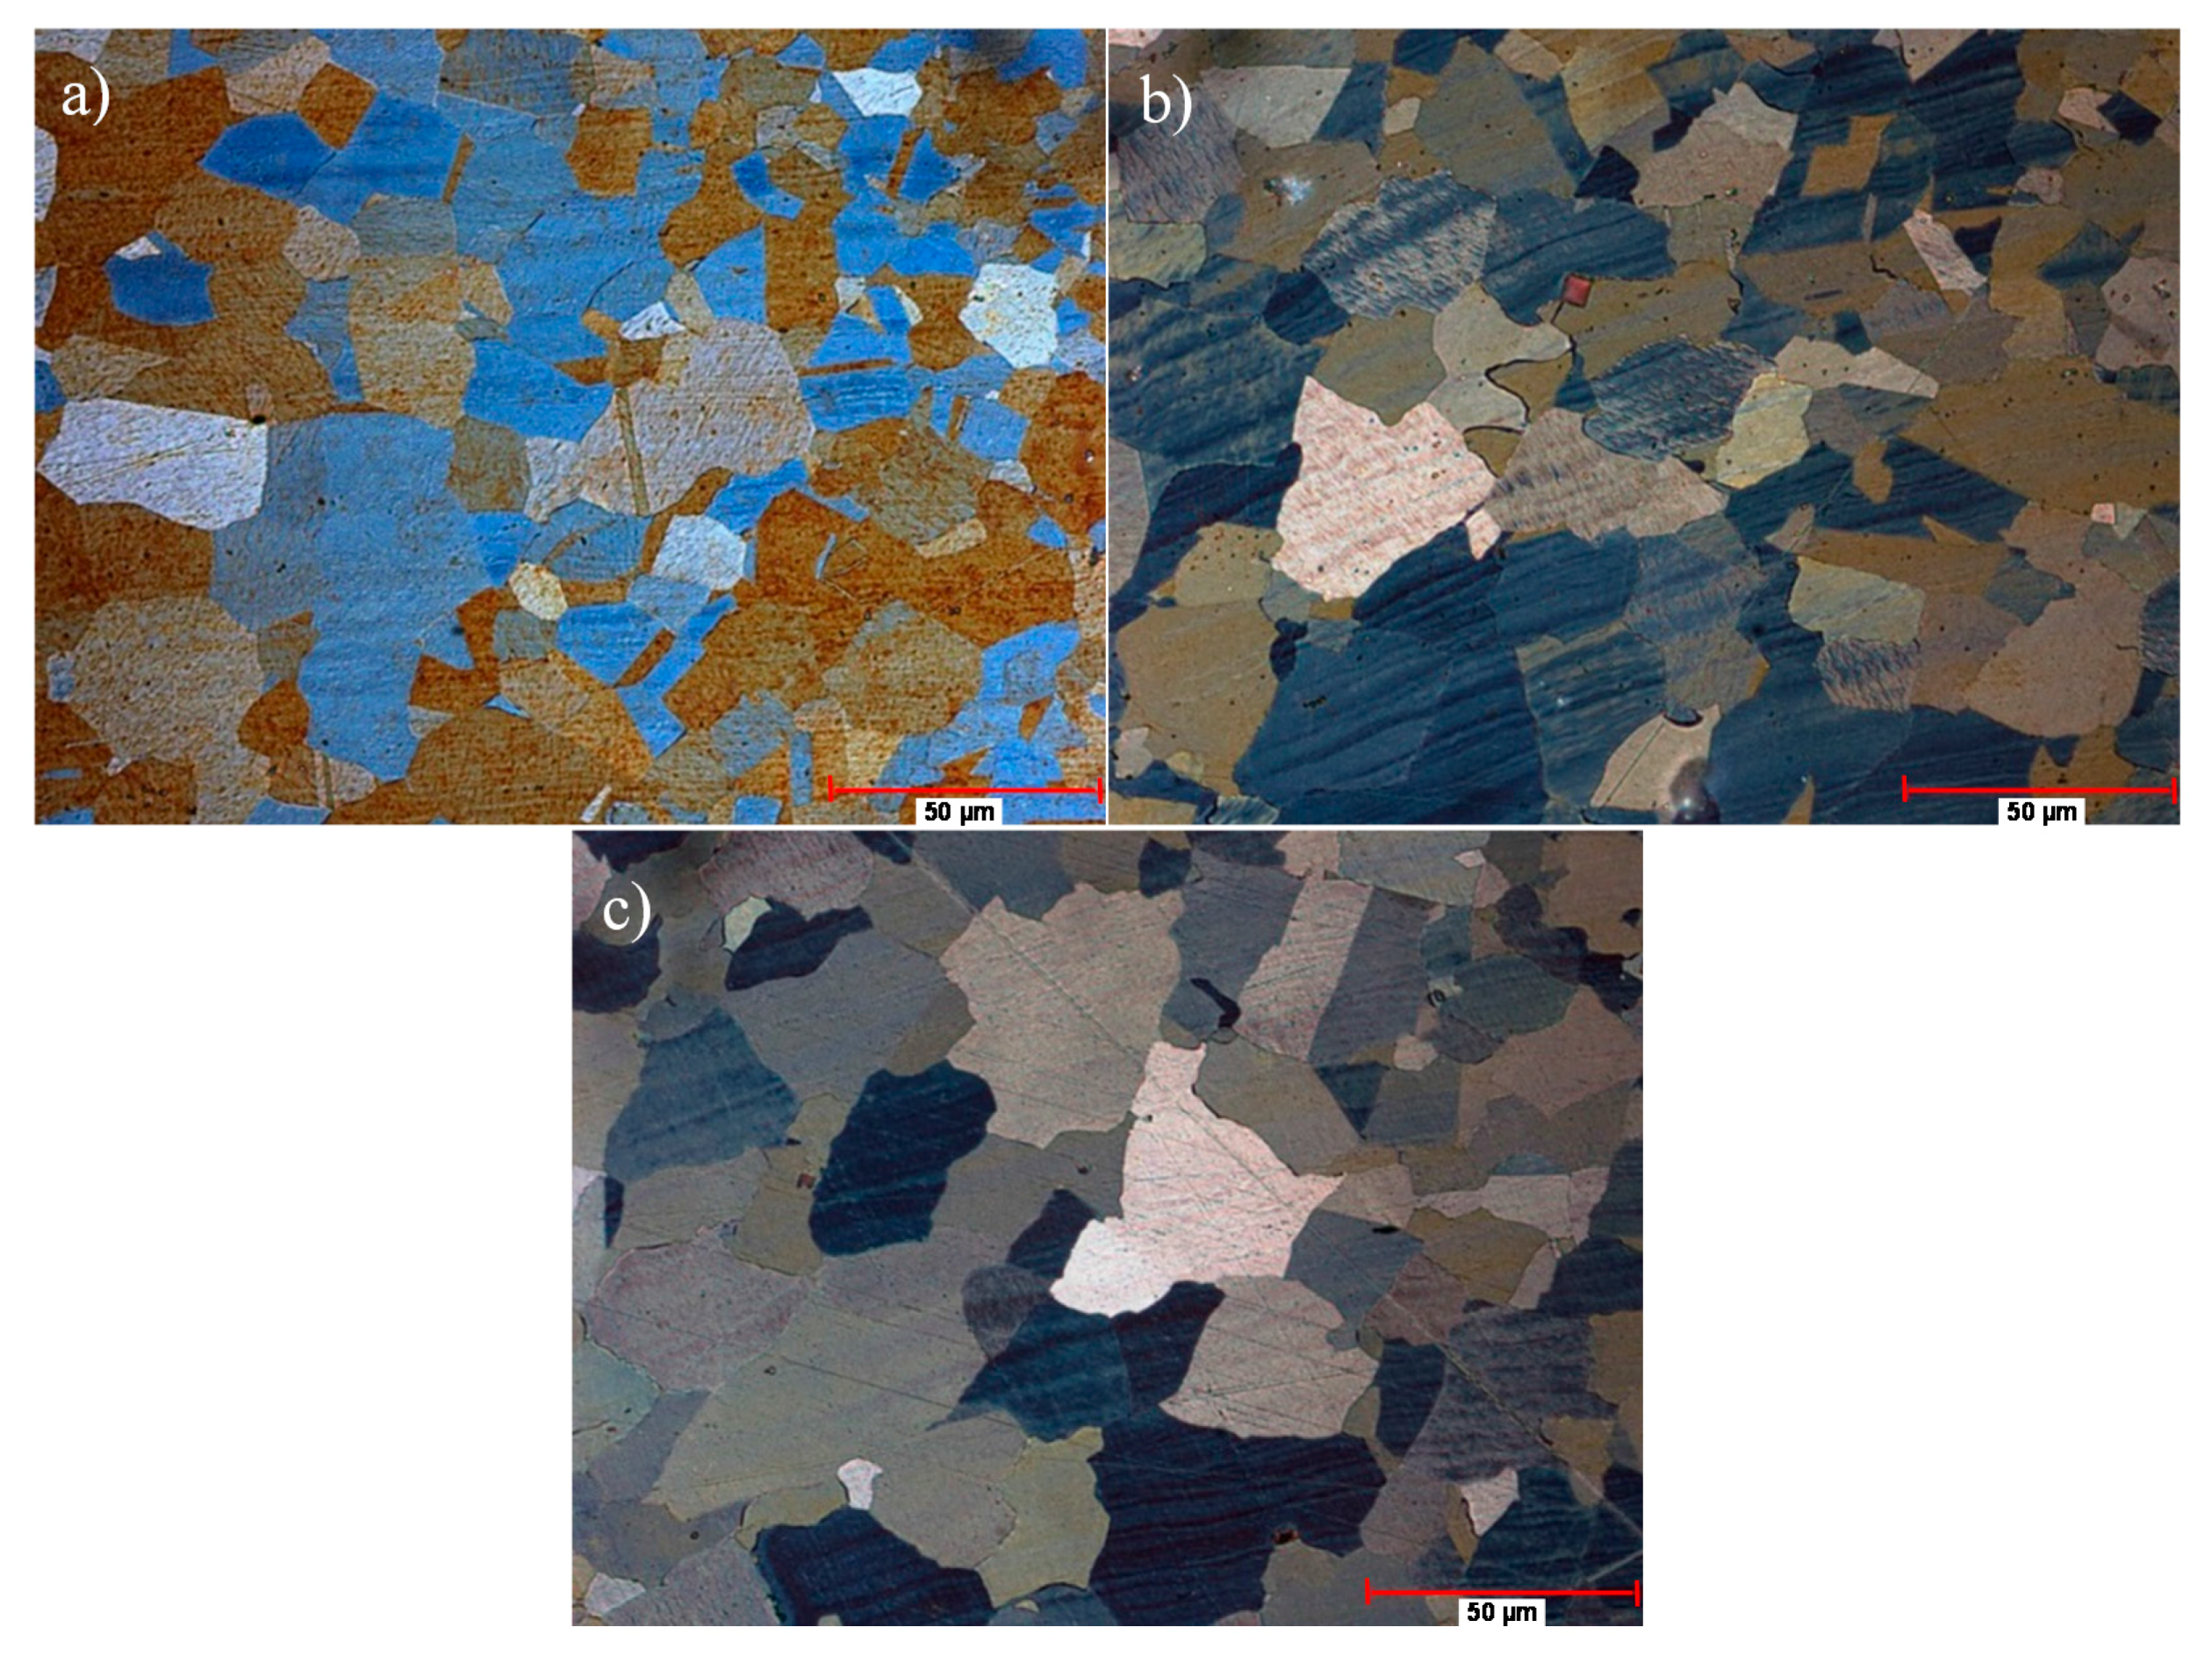
Figure 12.
The HAZ width of the resistance spot-welded TWIP joints versus the weld current.
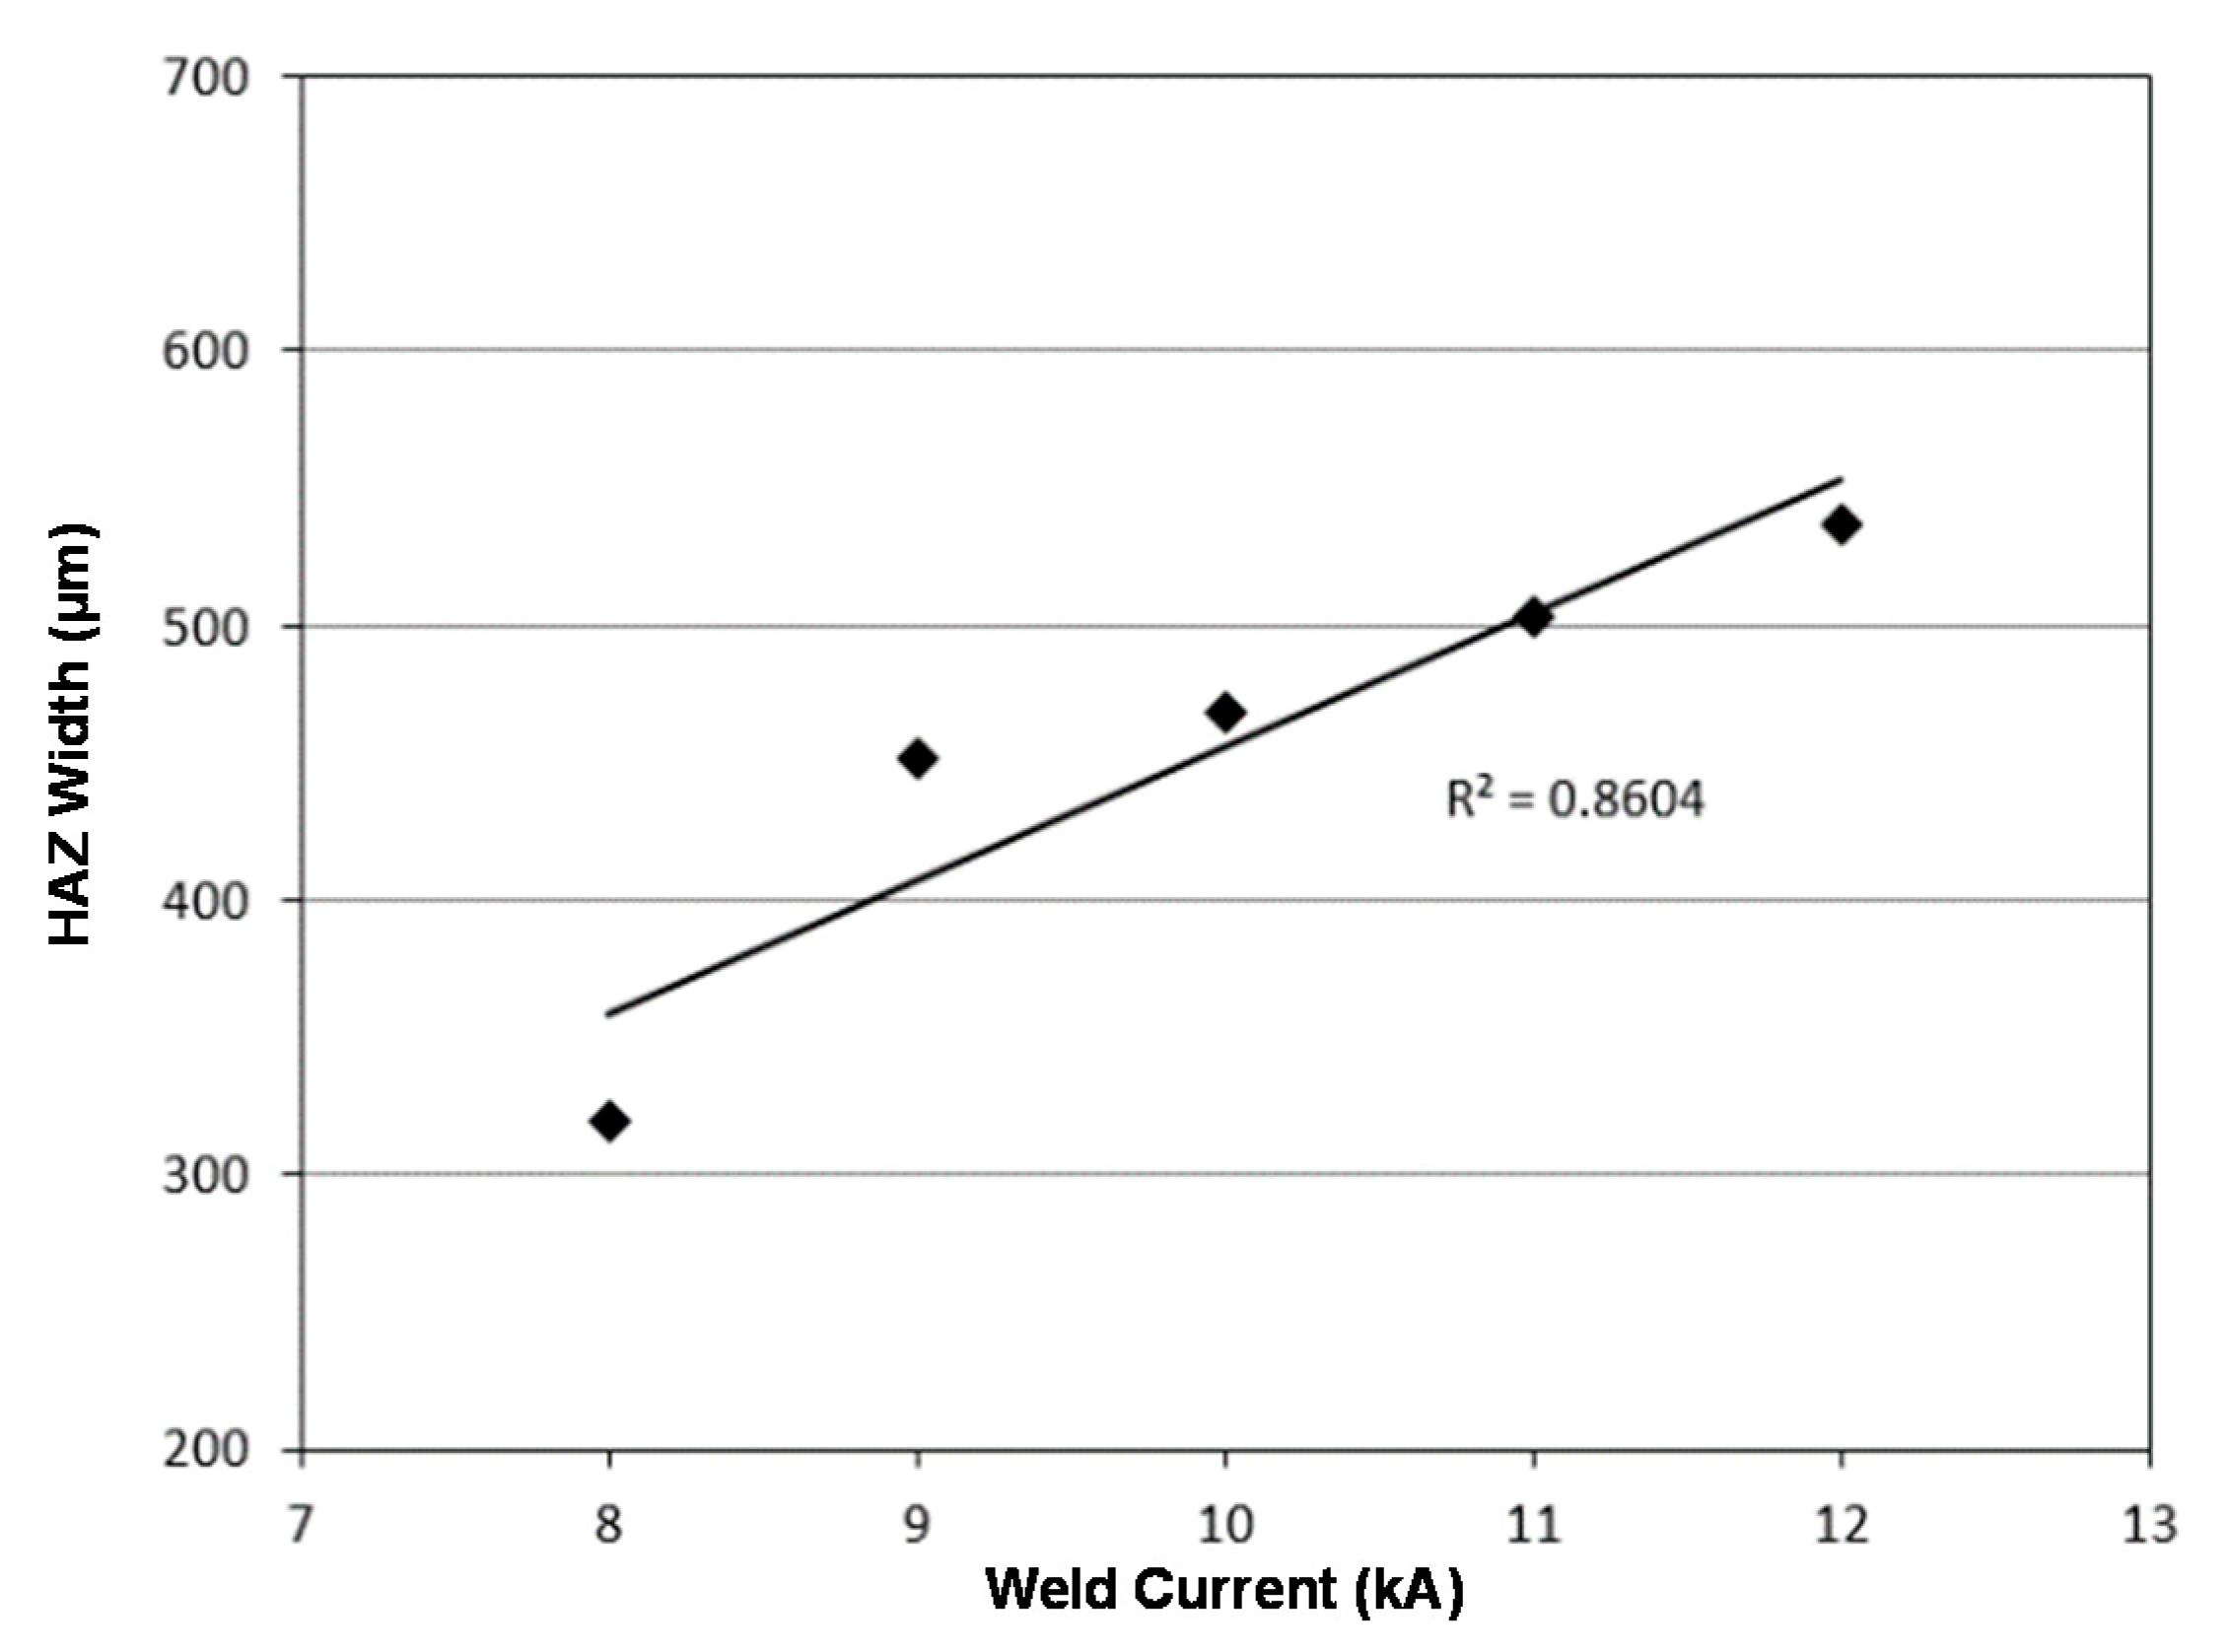
Figure 13.
The IPF + IQ maps obtained from the scanning electron microscopy–electron back-scattered diffraction (SEM–EBSD) technique: (a) the base metal; (b) the HAZ of the joint welded at 8 kA; (c) the HAZ of the joint welded at 12 kA. (RD: Rolling Direction; ND: Normal Direction)
Figure 13.
The IPF + IQ maps obtained from the scanning electron microscopy–electron back-scattered diffraction (SEM–EBSD) technique: (a) the base metal; (b) the HAZ of the joint welded at 8 kA; (c) the HAZ of the joint welded at 12 kA. (RD: Rolling Direction; ND: Normal Direction)
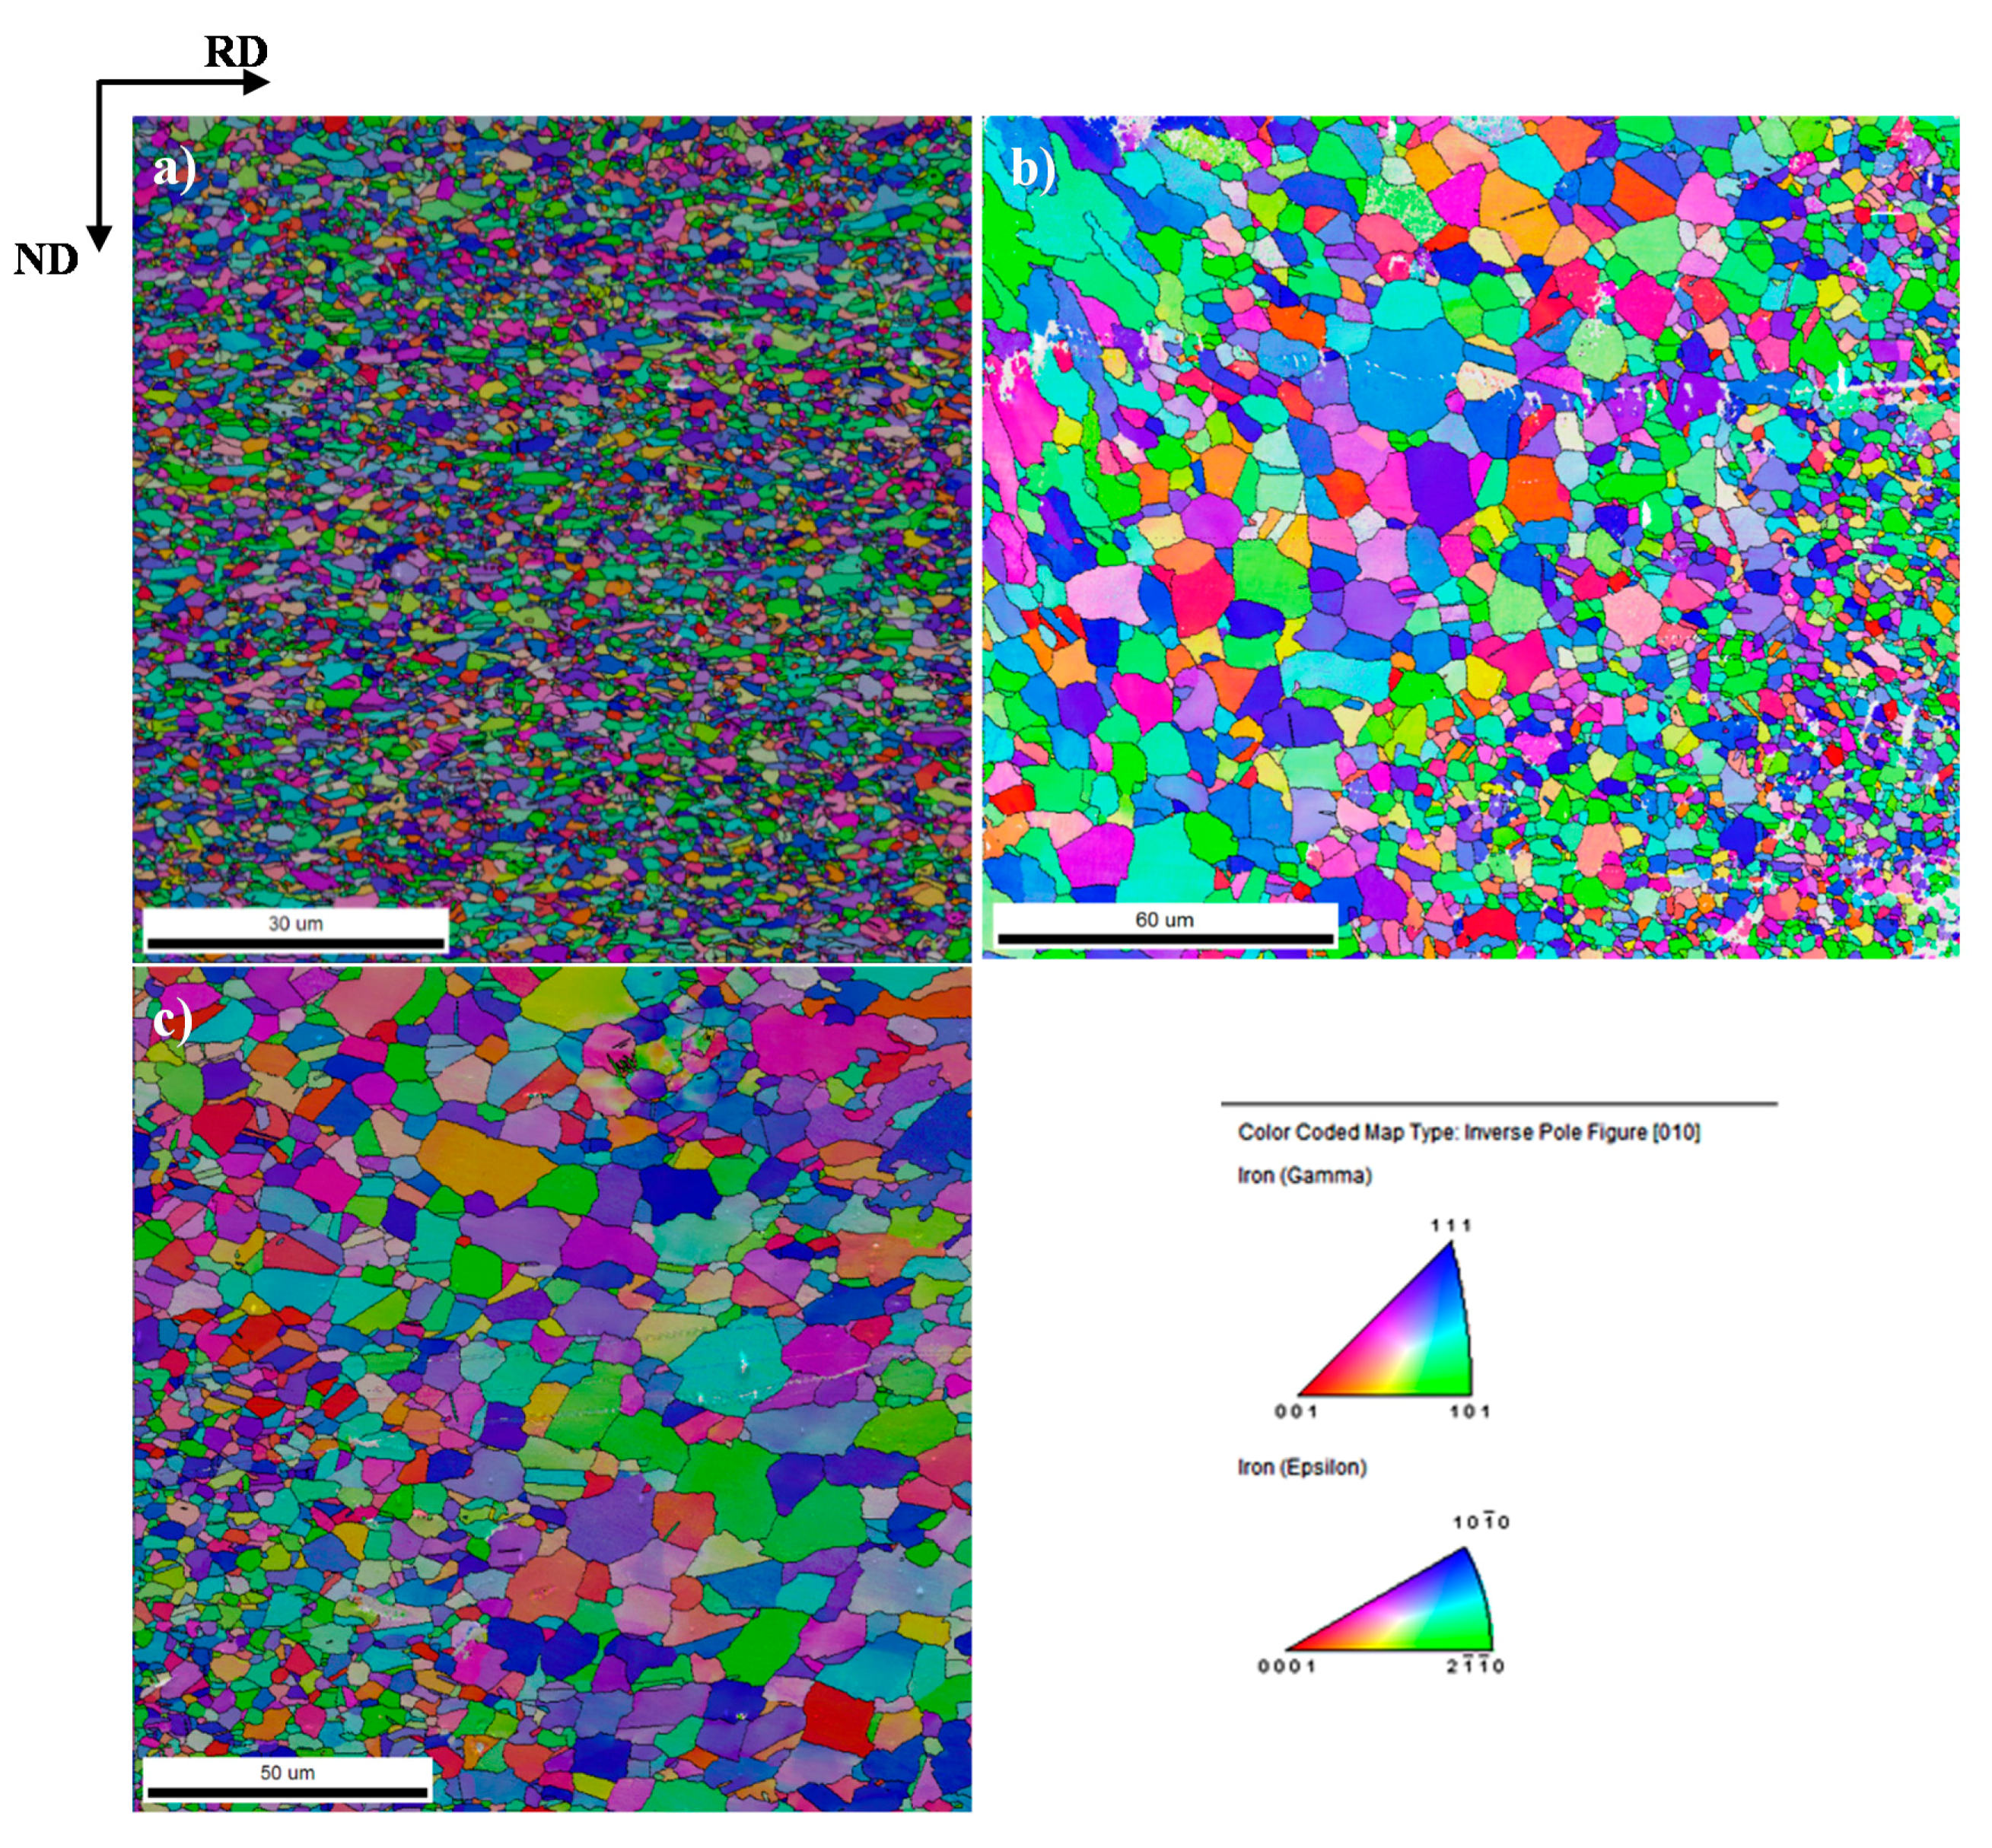
Figure 14.
The misorientation angle profiles obtained from the SEM–EBSD analysis: (a) the base metal; (b) the HAZ of the joint welded at 8 kA; (c) the HAZ of the joint welded at 12 kA.
Figure 14.
The misorientation angle profiles obtained from the SEM–EBSD analysis: (a) the base metal; (b) the HAZ of the joint welded at 8 kA; (c) the HAZ of the joint welded at 12 kA.

Figure 15.
The distribution of coincidence site lattice (CSL) type boundaries obtained from the SEM–EBSD analysis: (a) the base metal; (b) the HAZ of the joint welded at 8 kA; (c) the HAZ of the joint welded at 12 kA.
Figure 15.
The distribution of coincidence site lattice (CSL) type boundaries obtained from the SEM–EBSD analysis: (a) the base metal; (b) the HAZ of the joint welded at 8 kA; (c) the HAZ of the joint welded at 12 kA.
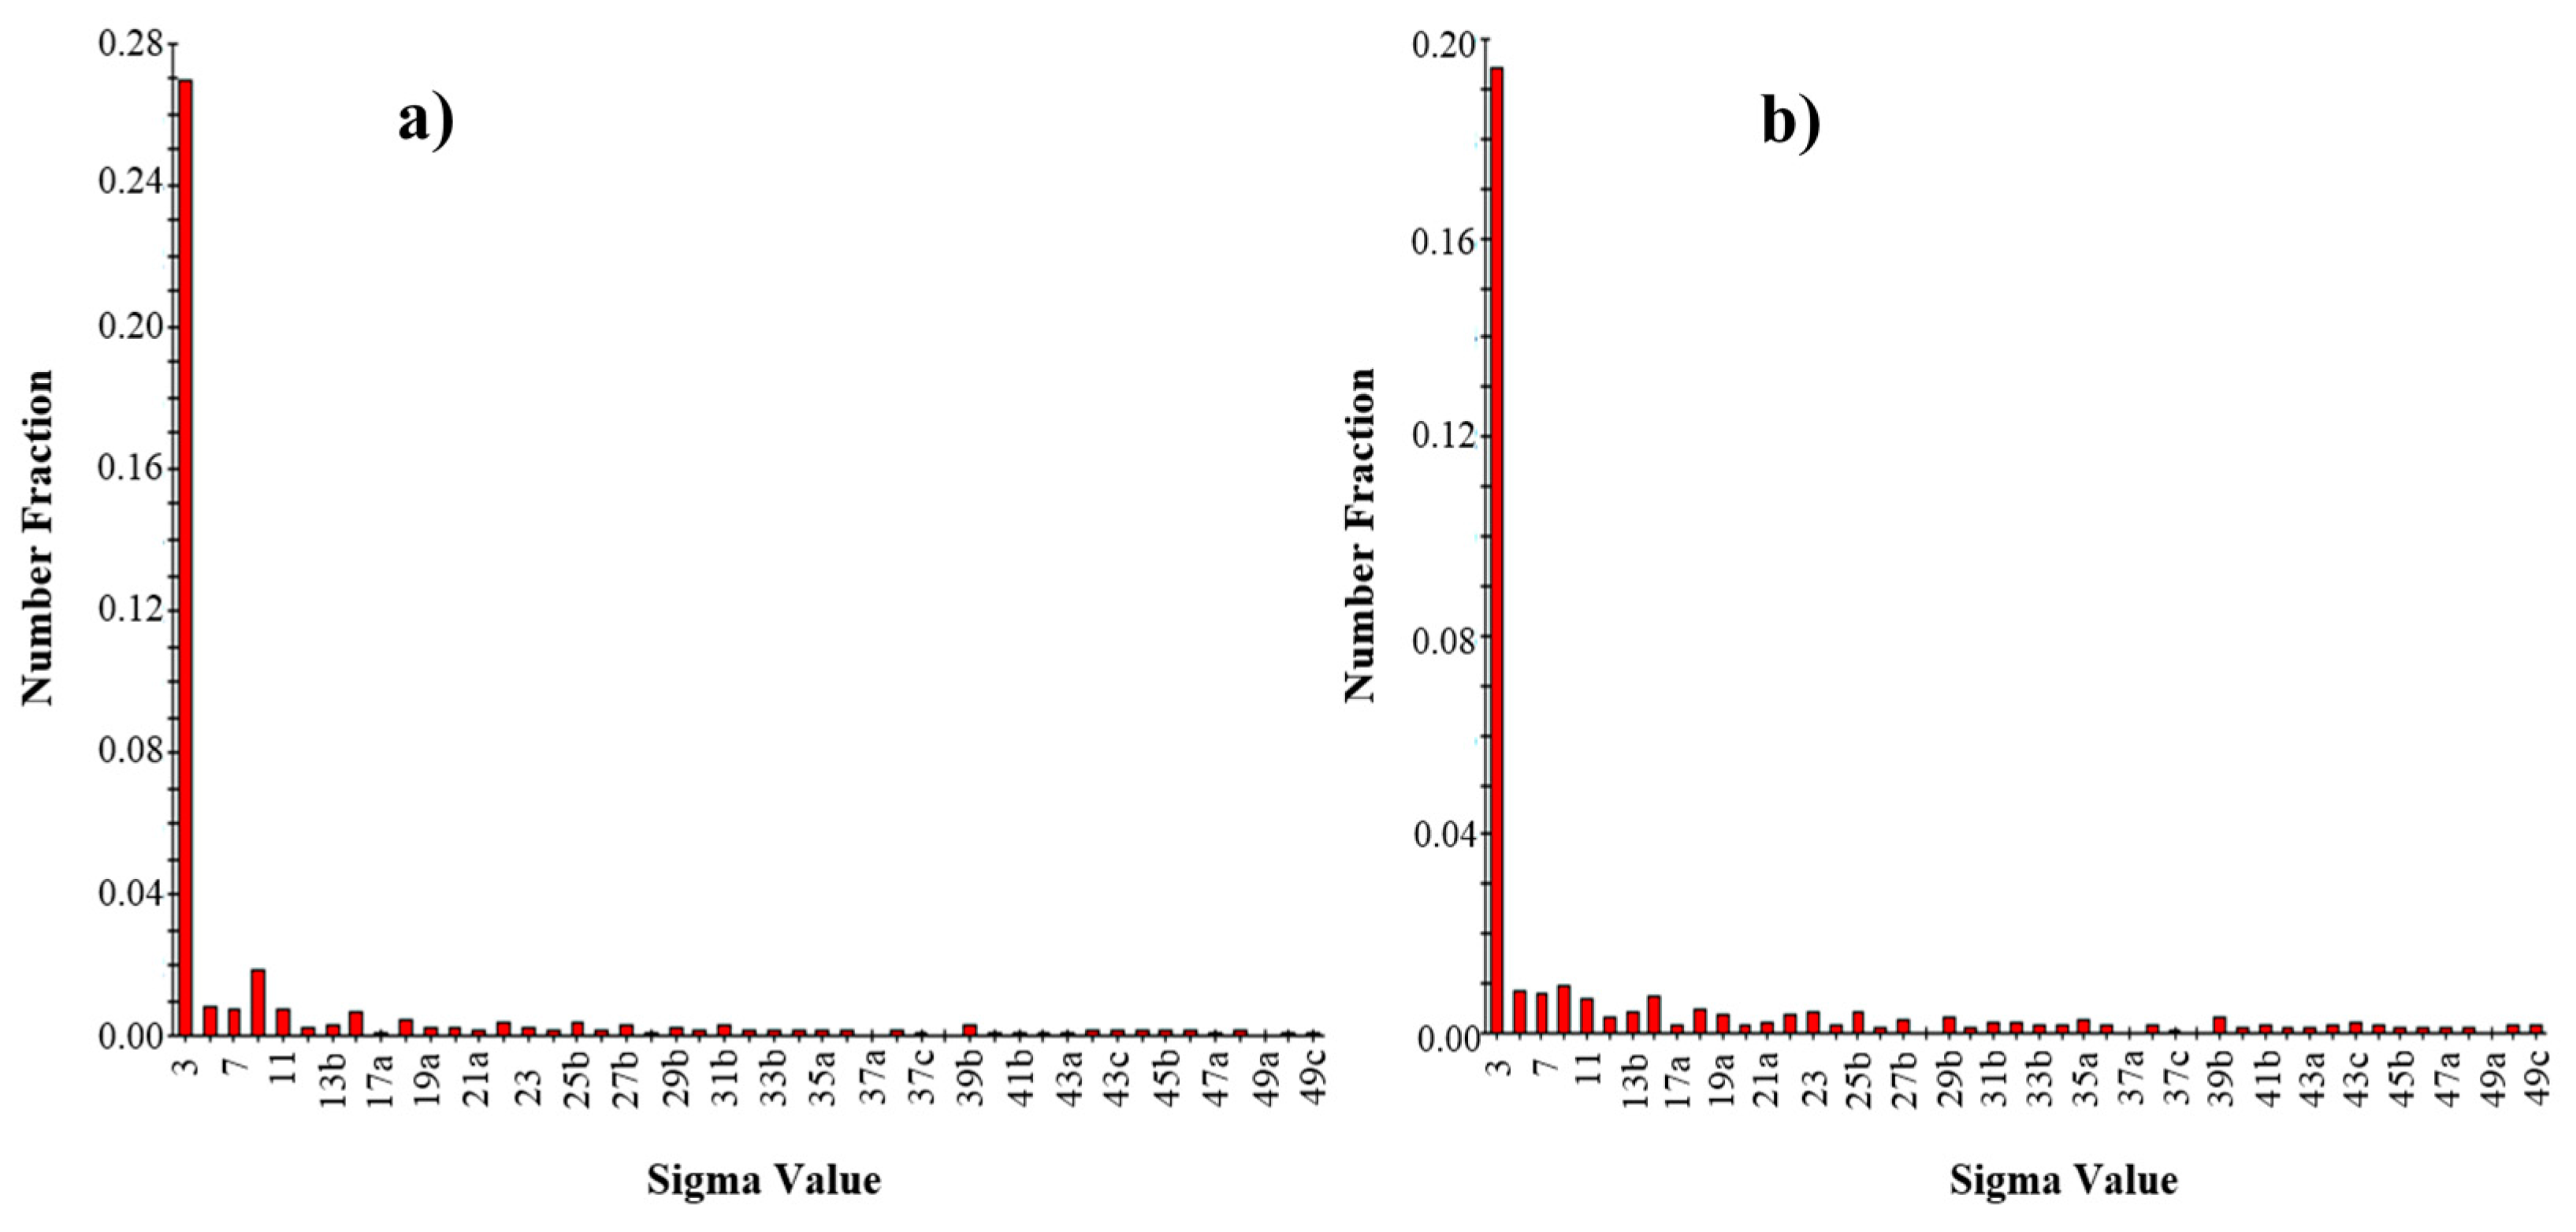

Figure 16.
Nugget size (a) and indentation depth (b) of the resistance spot-welded TWIP joints versus the weld current [23].
Figure 16.
Nugget size (a) and indentation depth (b) of the resistance spot-welded TWIP joints versus the weld current [23].
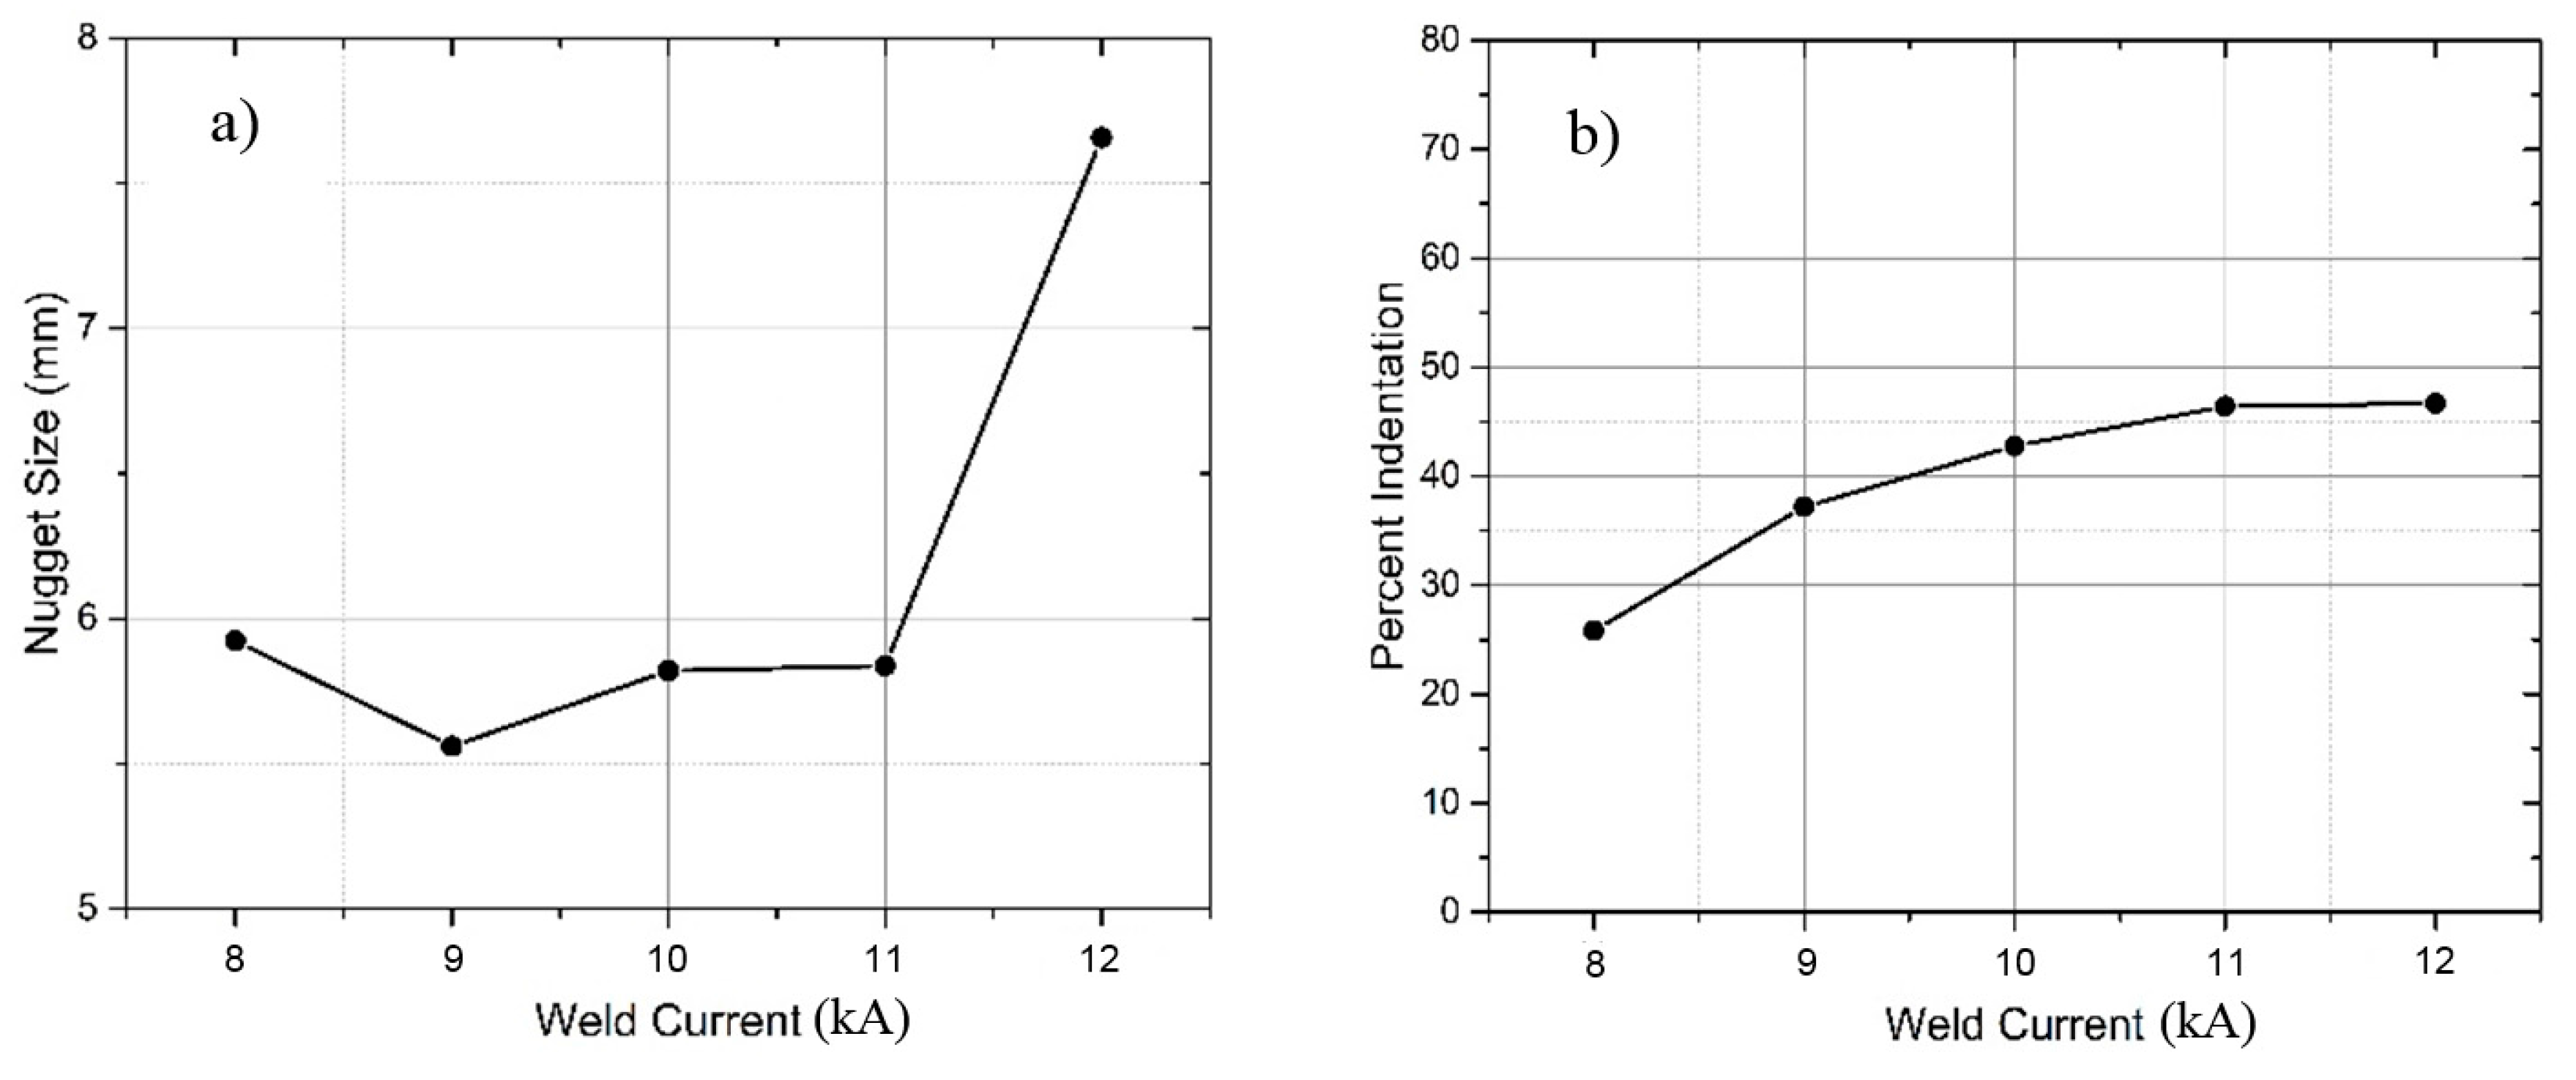
Figure 17.
The effect of the weld current on the hardness of the distinct microstructural zones in the weld regions of the spot-welded TWIP joints.
Figure 17.
The effect of the weld current on the hardness of the distinct microstructural zones in the weld regions of the spot-welded TWIP joints.
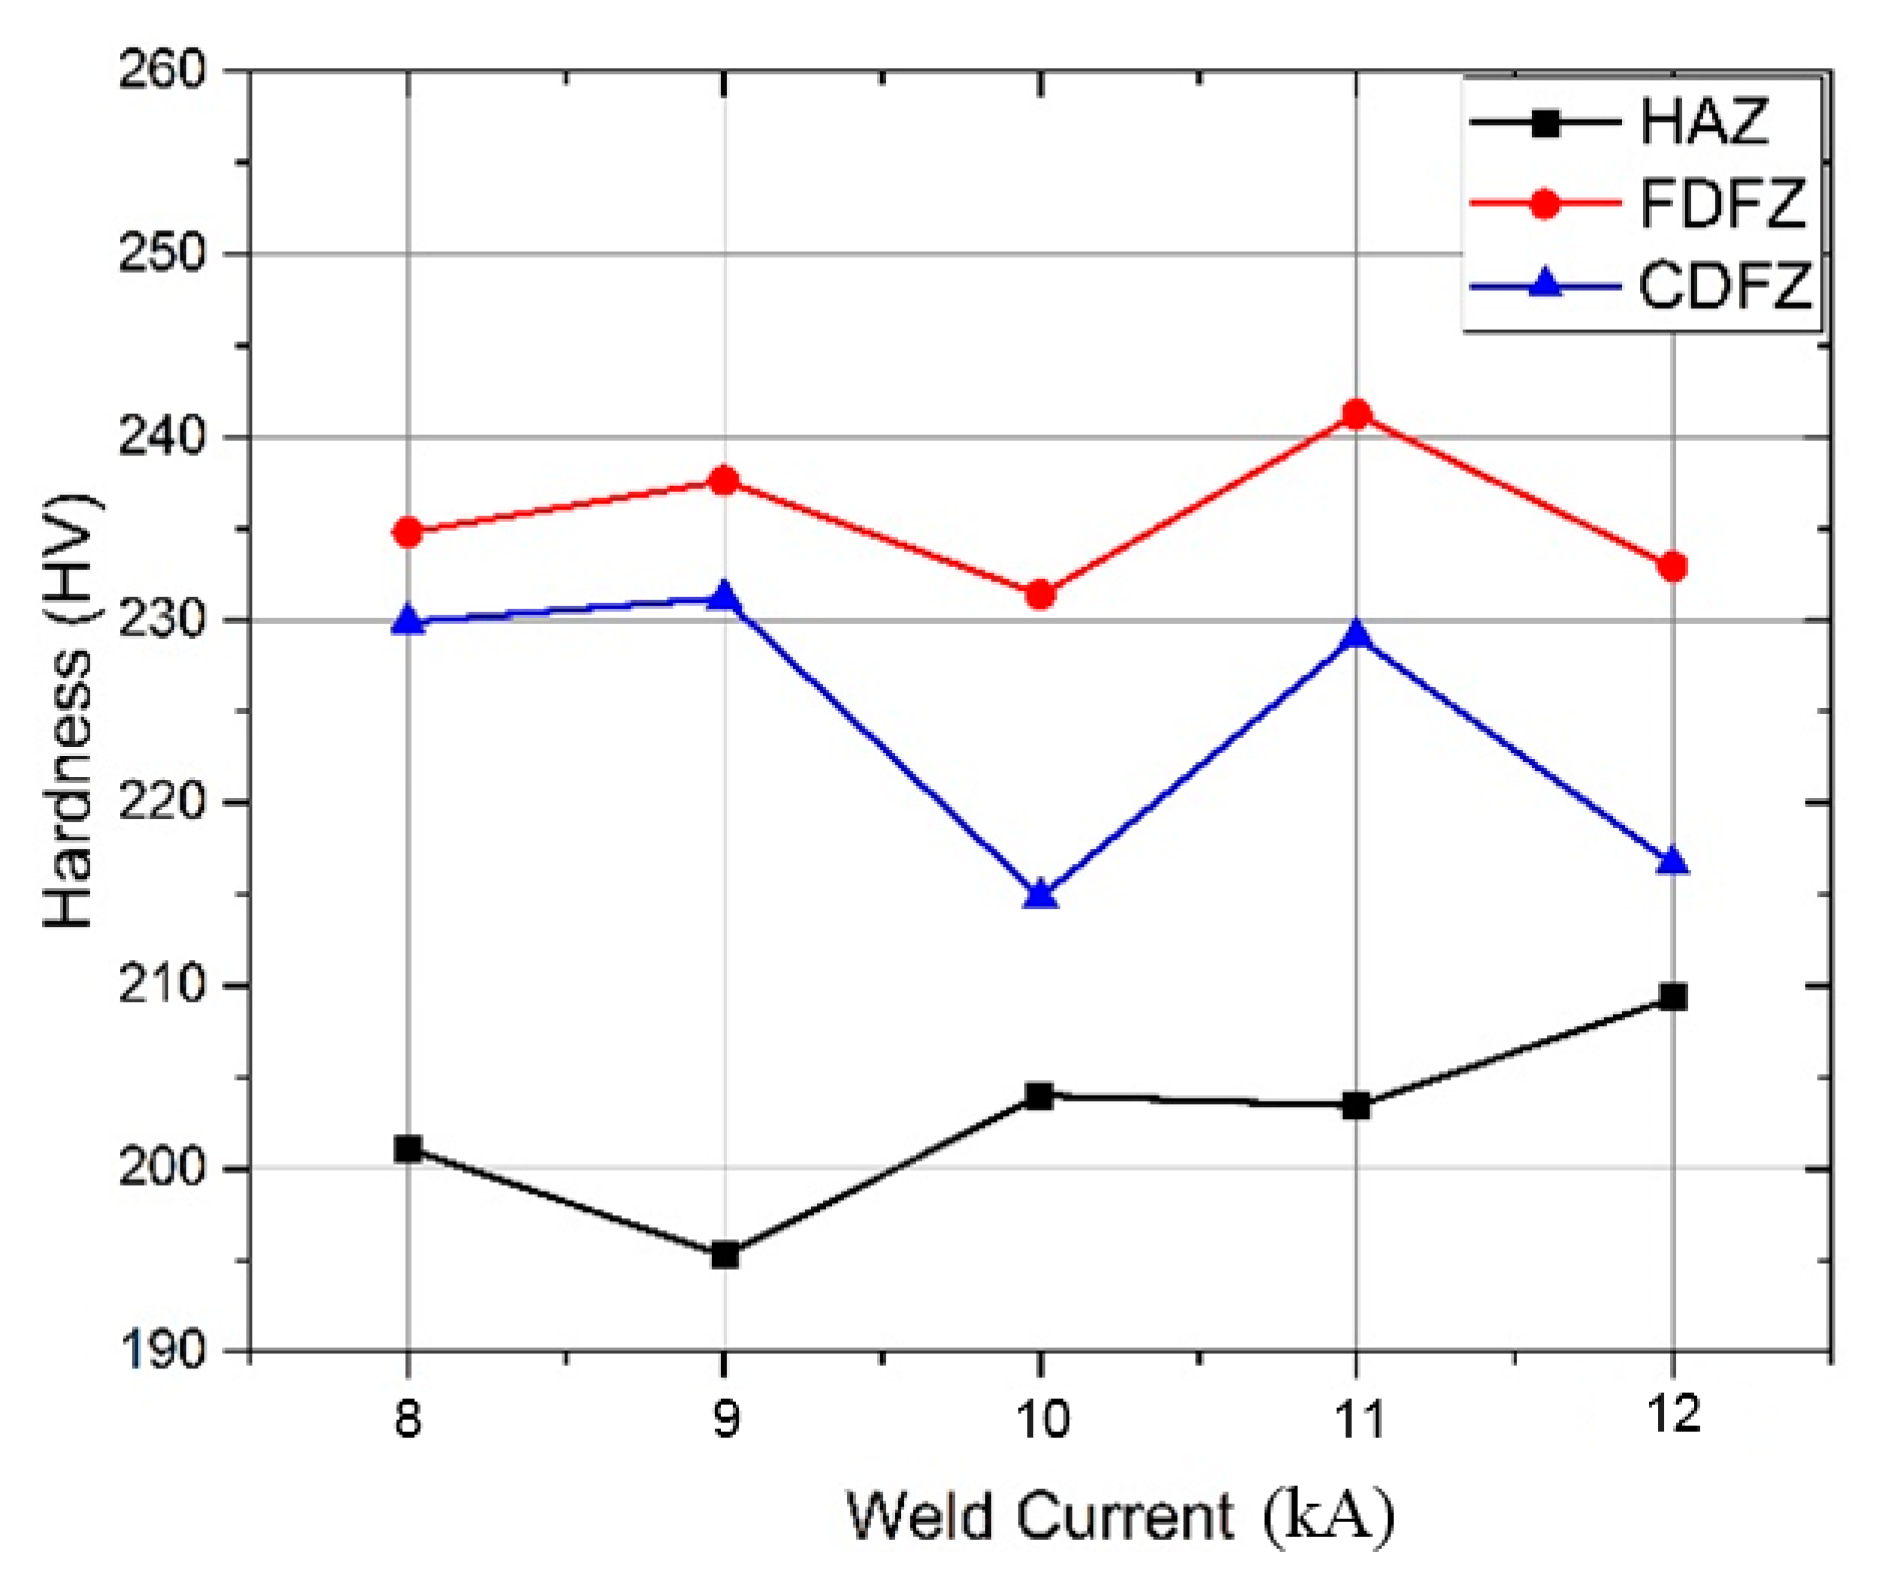
Figure 18.
The effect of the weld current on the tensile curves of the resistance spot-welded TWIP joints.
Figure 18.
The effect of the weld current on the tensile curves of the resistance spot-welded TWIP joints.

Figure 19.
The tensile shear properties of the resistance spot-welded TWIP joints versus the weld current.
Figure 19.
The tensile shear properties of the resistance spot-welded TWIP joints versus the weld current.
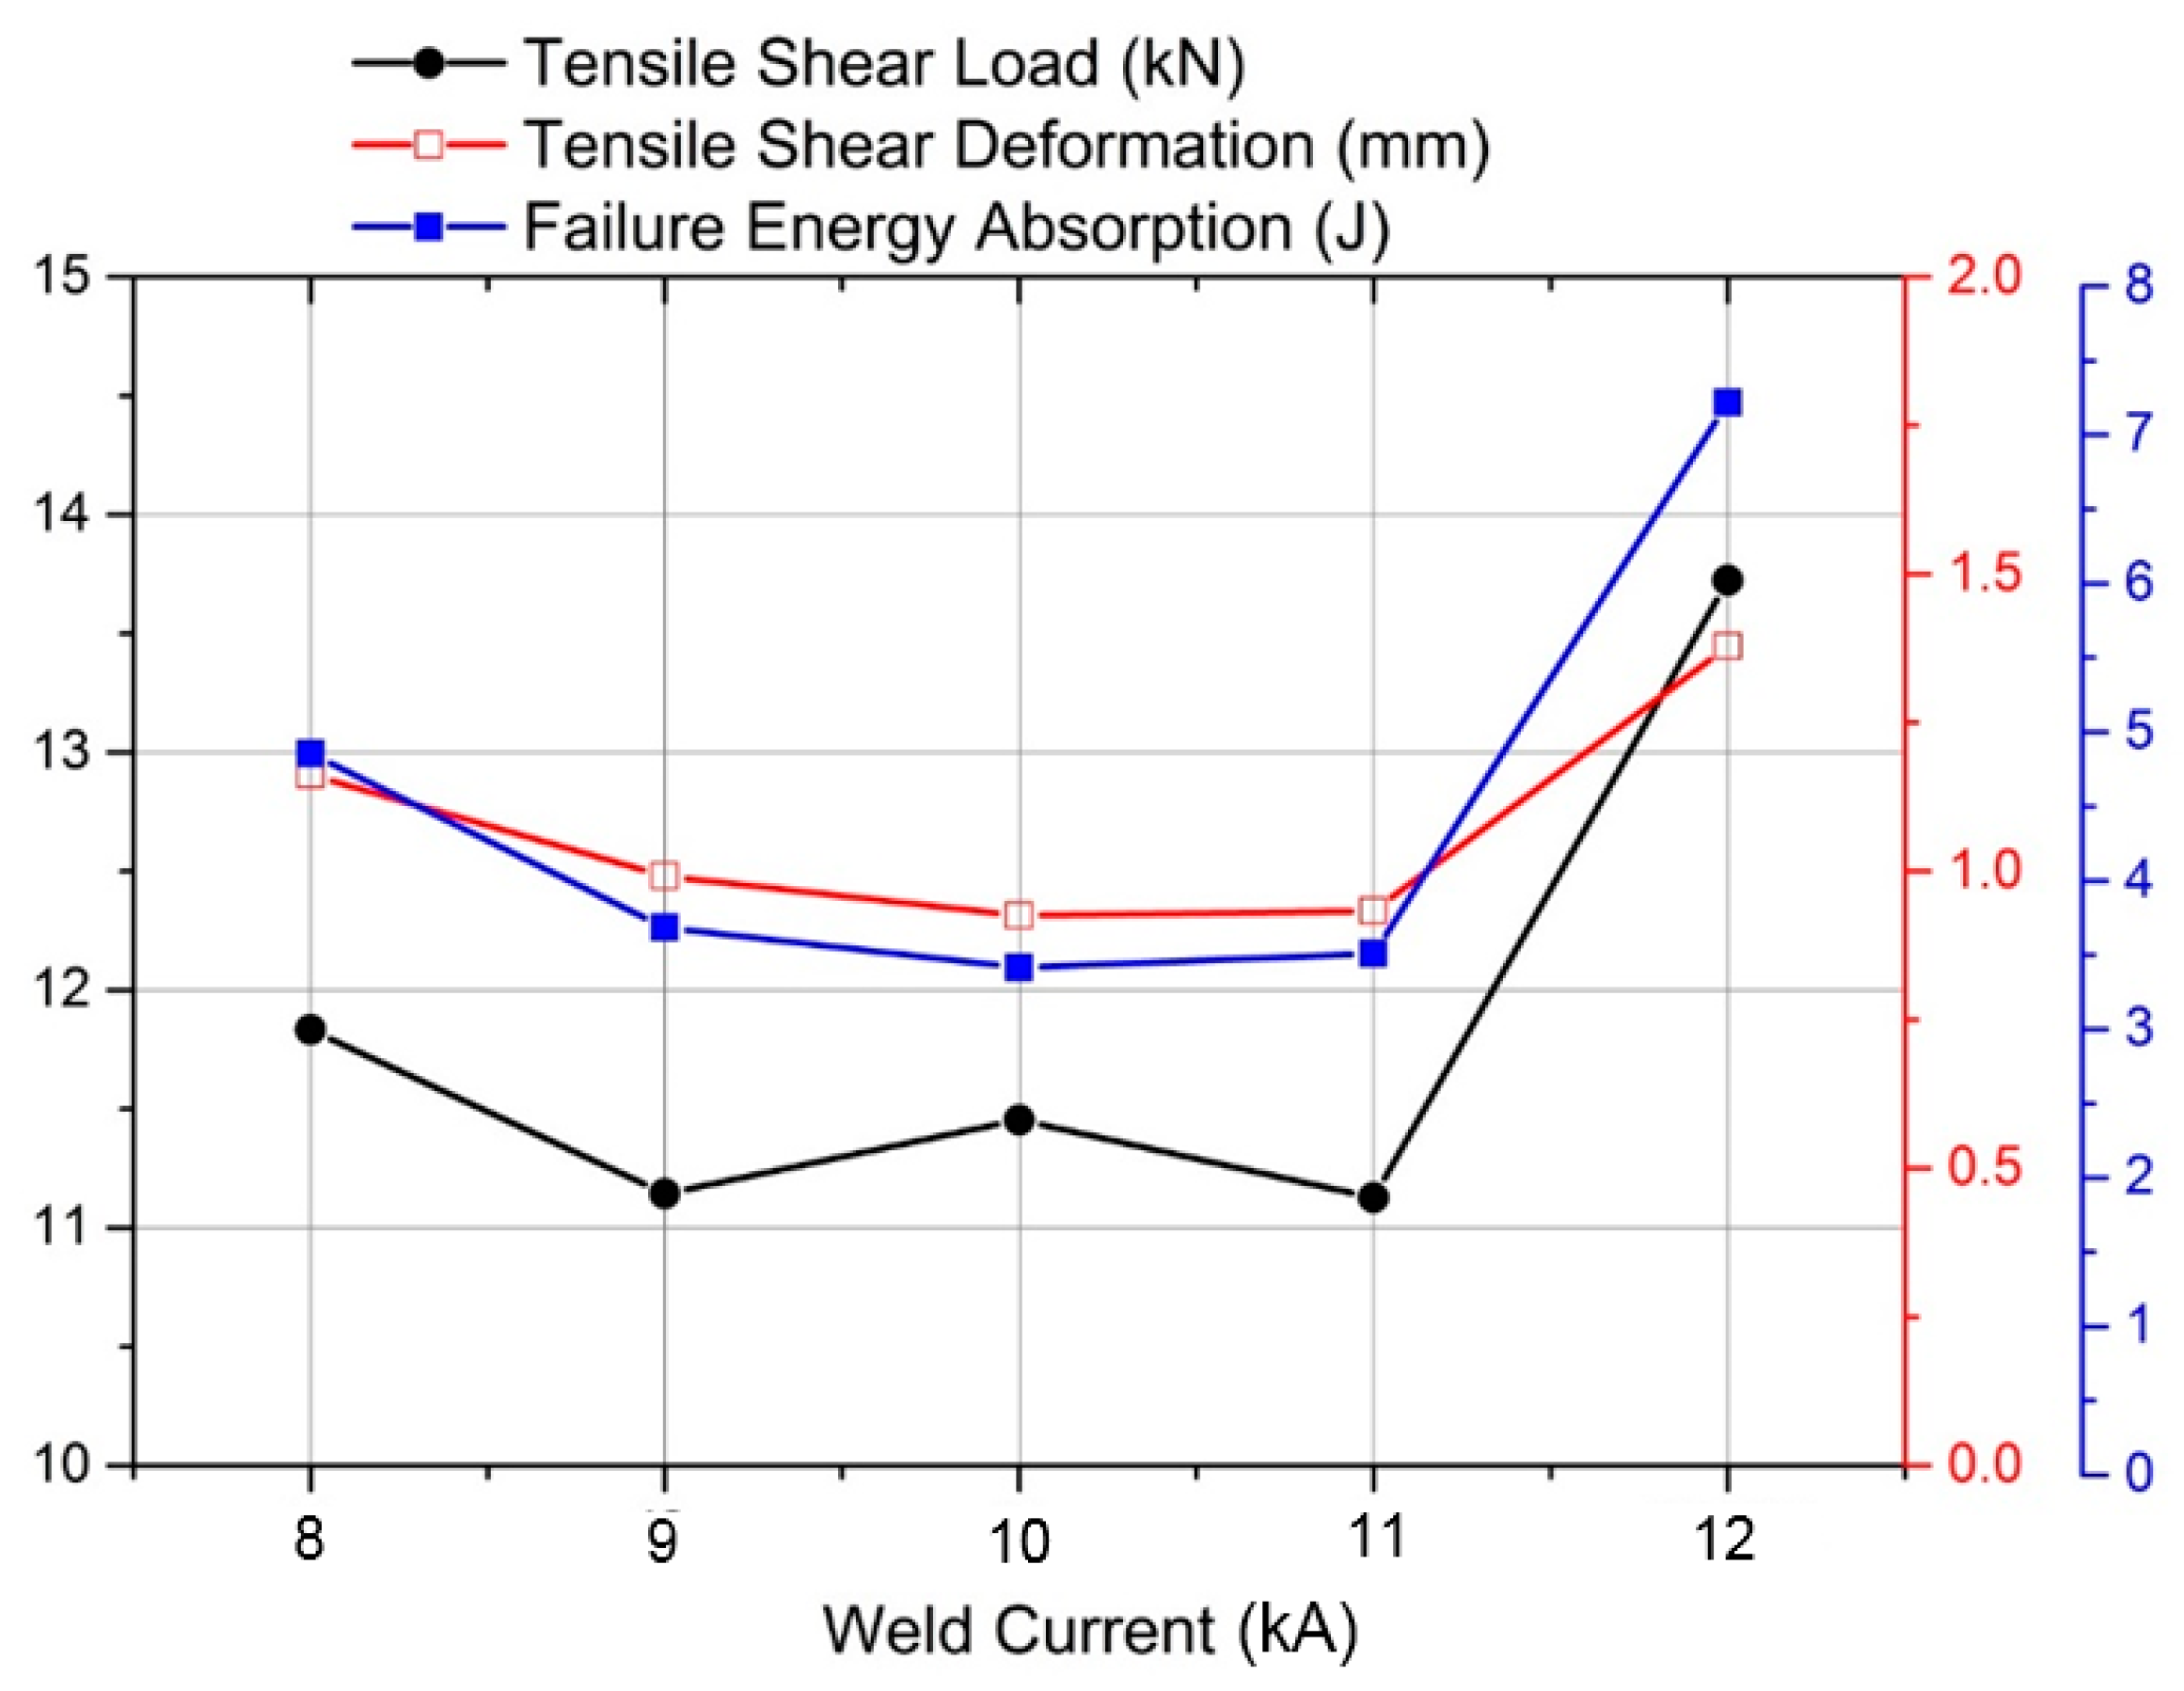
Figure 20.
The fracture modes of the tensile shear test samples: (a) 9 kA; (b) 11 kA; (c) 12 kA.
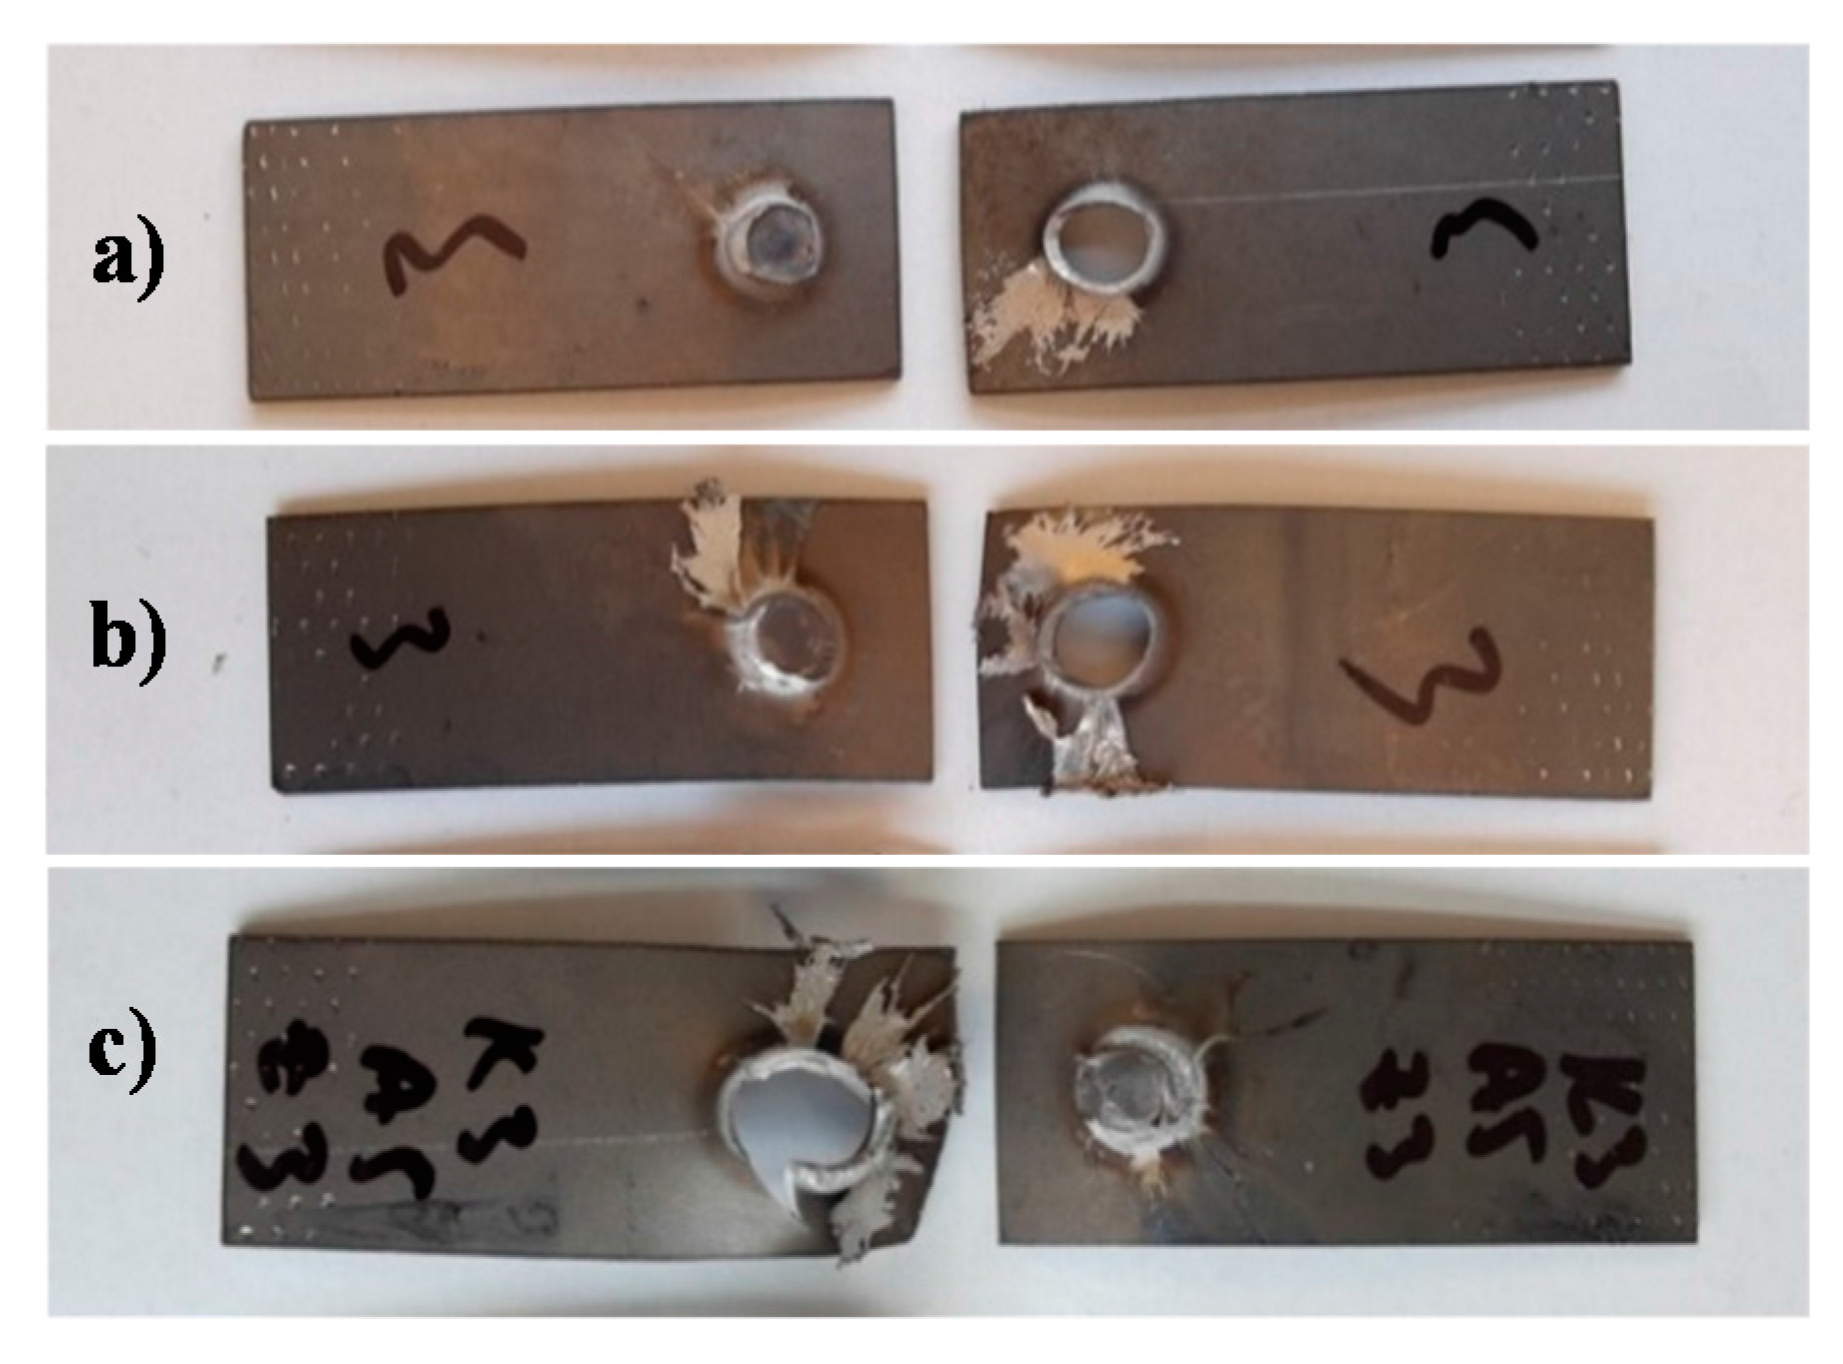
Figure 21.
SEM image of the fracture surface of the base metal.

Figure 22.
SEM images of the fracture surface of the joint welded at 11 kA.

Figure 23.
SEM images of the fracture surface of the joint welded at 12 kA.


Table 1.
The chemical composition (wt. %) of the experimental sheet steel used in this investigation.
Table 1.
The chemical composition (wt. %) of the experimental sheet steel used in this investigation.
| Steel | Fe | C | Mn | Si | Al | Cr | Ti |
|---|---|---|---|---|---|---|---|
| TWIP | Balance | 0.28 | 15.6 | 1.06 | 1.89 | 0.564 | 0.1 |
Table 2.
The tensile properties of the experimental steel sheet used in this investigation.
| Base Metal | 0.2% Proof Strength (MPa) | Ultimate Tensile Strength (MPa) | Total Elongation (%) |
|---|---|---|---|
| TWIP Steel | 640 | 982 | 46 |
Table 3.
The fixed welding parameters used in this study.
| Welding Time (ms) | Electrode Force (kN) | Squeeze Time (ms) | Holding Time (ms) | Weld Atmoshere |
|---|---|---|---|---|
| 300 | 3 | 40 | 40 | Ambient |
Table 4.
The tensile properties and failure energy absorption capacities of the resistance spot welds fabricated with different weld currents (average values). (SD: Standard Deviation).
Table 4.
The tensile properties and failure energy absorption capacities of the resistance spot welds fabricated with different weld currents (average values). (SD: Standard Deviation).
| Welding Current (ms) | Tensile Shear Load (kN) | SD | Tensile Shear Deformation (mm) | SD | Failure Energy Absorption (J) | SD |
|---|---|---|---|---|---|---|
| 8 | 11.83 | 0.17 | 1.16 | 0.10 | 4.86 | 0.54 |
| 9 | 11.14 | 0.40 | 0.99 | 0.04 | 3.68 | 0.56 |
| 10 | 11.45 | 0.59 | 0.93 | 0.16 | 3.42 | 0.69 |
| 11 | 11.13 | 0.50 | 0.93 | 0.19 | 3.51 | 1.02 |
| 12 | 13.72 | 0.17 | 1.38 | 0.17 | 7.22 | 1.43 |
© 2017 by the authors. Licensee MDPI, Basel, Switzerland. This article is an open access article distributed under the terms and conditions of the Creative Commons Attribution (CC BY) license (http://creativecommons.org/licenses/by/4.0/).
Share and Cite
MDPI and ACS Style
Tutar, M.; Aydin, H.; Bayram, A. Effect of Weld Current on the Microstructure and Mechanical Properties of a Resistance Spot-Welded TWIP Steel Sheet. Metals 2017, 7, 519. https://doi.org/10.3390/met7120519
AMA Style
Tutar M, Aydin H, Bayram A. Effect of Weld Current on the Microstructure and Mechanical Properties of a Resistance Spot-Welded TWIP Steel Sheet. Metals. 2017; 7(12):519. https://doi.org/10.3390/met7120519
Chicago/Turabian StyleTutar, Mumin, Hakan Aydin, and Ali Bayram. 2017. "Effect of Weld Current on the Microstructure and Mechanical Properties of a Resistance Spot-Welded TWIP Steel Sheet" Metals 7, no. 12: 519. https://doi.org/10.3390/met7120519
Note that from the first issue of 2016, this journal uses article numbers instead of page numbers. See further details here.