2. Materials and Methods
In order to prepare alloy samples, we used high purity elements: Al (99.999%, Hydro Aluminum Deutschland GmbH, Bonn, Germany), Si (Crystal Growth Laboratory, Berlin, Germany), Fe (ferroaluminum 50 wt. % Al-50 wt. % Fe, Goodfellow Cambridge Ltd., Huntingdon, UK) and Mn (from Manganese Flake 99.95%, Goodfellow Cambridge Ltd., Huntingdon, UK). The study considered hypoeutectic aluminum alloys with 0.2, 0.4 and 1.0 wt. % Fe and 0.2, 0.4 and 1.0 wt. % Mn and with 5 wt. % Si. The values of Si, Fe and Mn were chosen to be similar to industrial quality casting alloys. From the given values of silicon, iron and manganese we prepared and processed five samples that allowed analysis of the effect of each element individually on the mushy zone microstructure.
Specimens with 120 mm length and 8 mm diameter were directionally solidified under controlled conditions [
18,
19,
20] in Bridgman-type furnace Artemis-3 (German Aerospace Center, Cologne, Germany). Specimens were solidified within crucibles made of silica aerogel, and thermal conditions were generated by a lower heater (equipped with an active cooling system) and by upper heater [
18,
20]. Due to the construction of the cooling system and lower and upper heaters, solidification can proceed with velocity in the range
v = 0.02–0.12 mm/s and with a temperature gradient reaching
G = 3 K/mm. In order to allow an extended period of melt stirring to affect the mushy zone, specimens were processed with solidification velocity
v = 0.04 mm/s and a temperature gradient
G = 3 K/mm. Fluid flow was generated by a rotating magnetic field (RMF) induced through three pairs of coils placed near to the sample. The measured RMF can reach 3 mT or 6 mT at a frequency of 50 Hz. In the current study RMF of 6 mT was chosen, generating stirring with first azimuthal flow and secondary flows in axial and radial directions [
21,
22,
23], and producing specimens with enrichment of eutectics or intermetallics in the center.
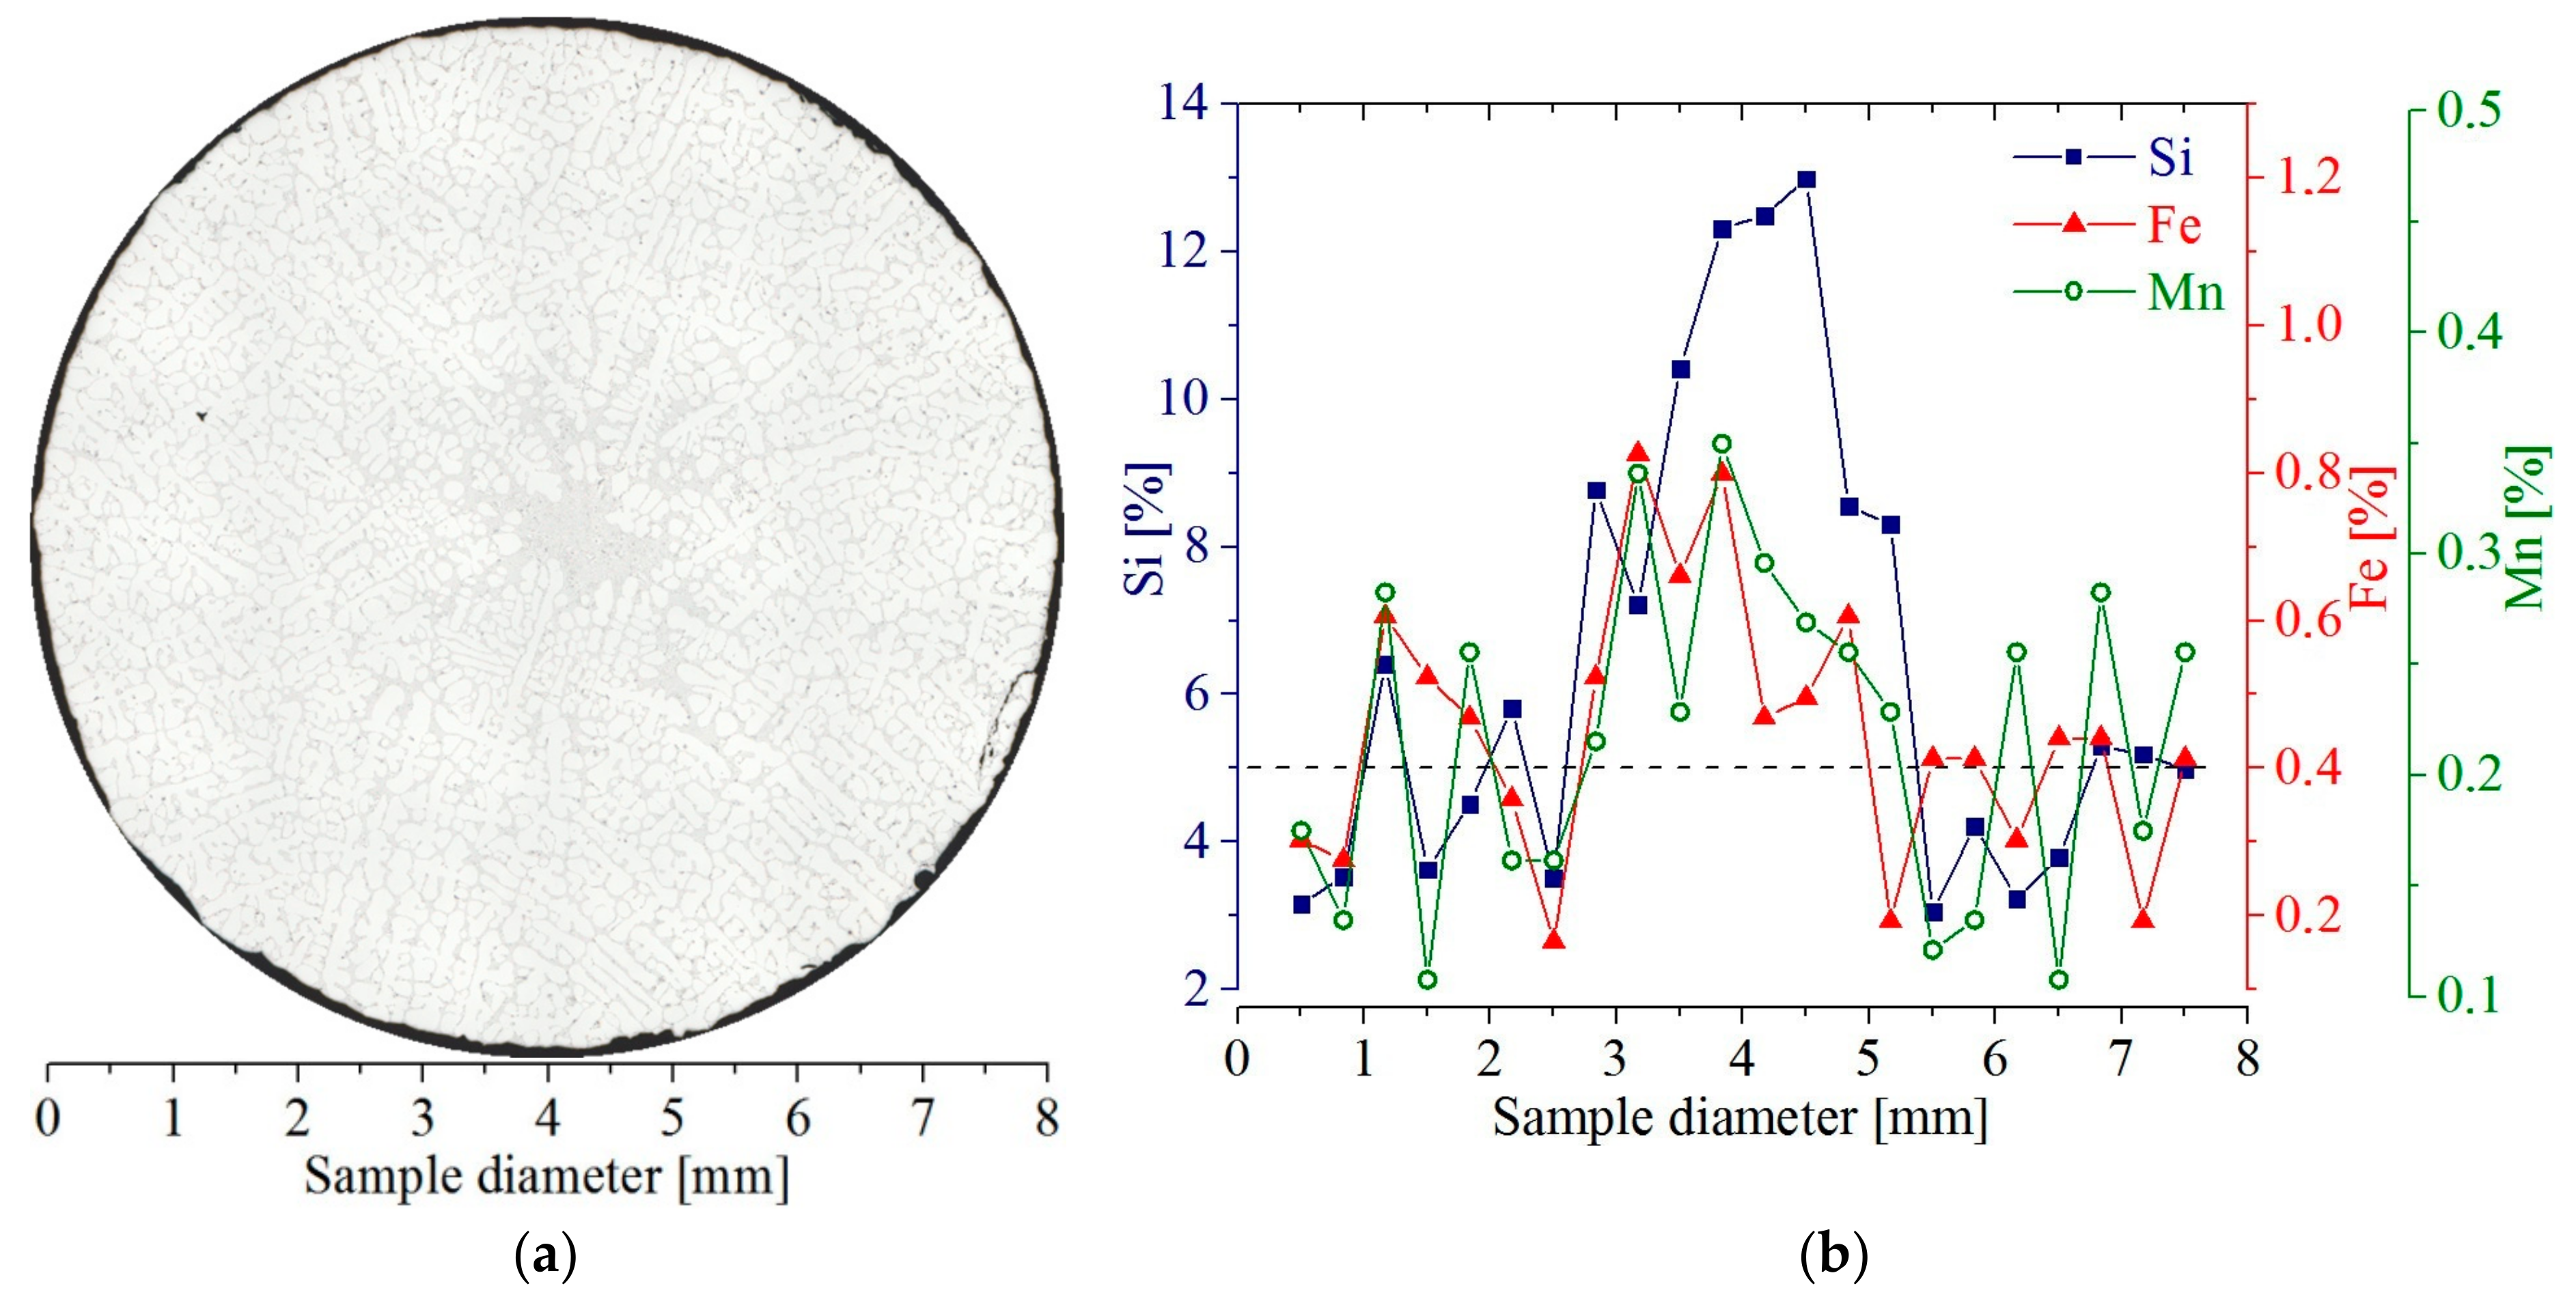
The transverse cross-sections (
Figure 1 and
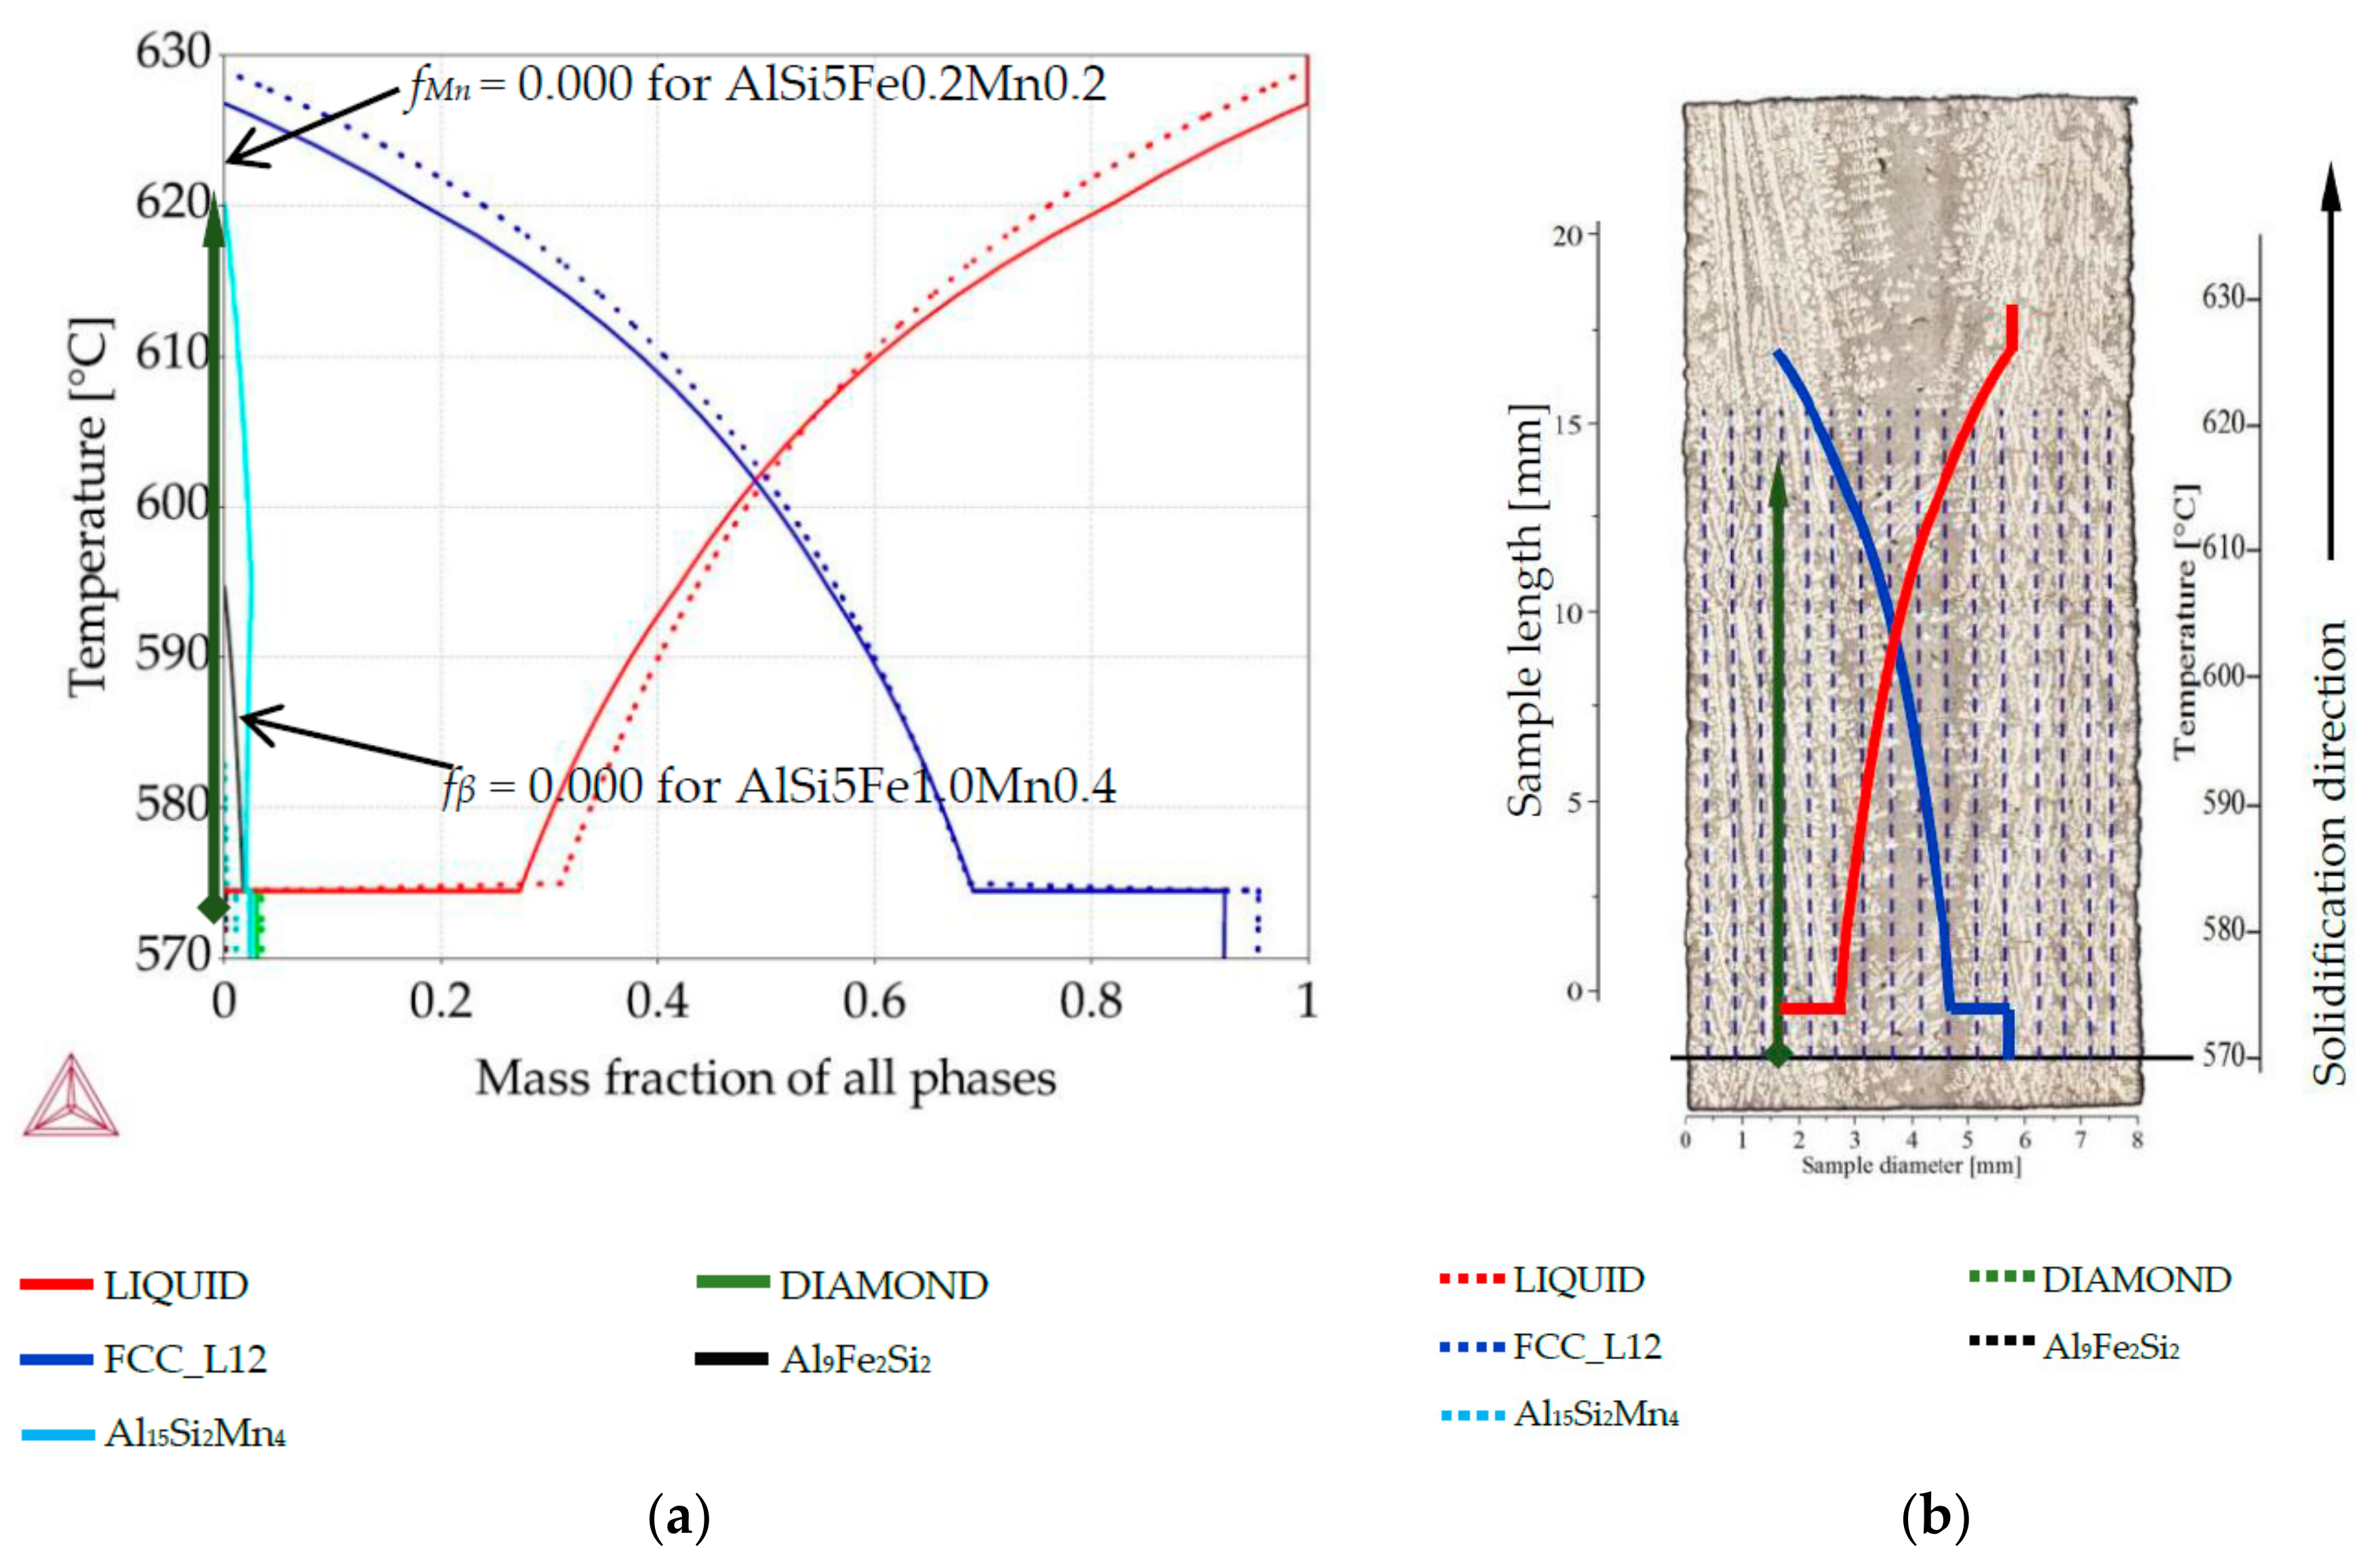
Figure 2) were extracted from the middle region of the whole sample at a height of 45 mm (Isocut 4000, Buehler, Lake Bluff, IL, USA) from the lower heater. A solidification distance of 45 mm corresponds to the position where the specimen was cut and to the coordinate 0 mm (
Figure 2b) on the longitudinal section. The chemical composition was investigated using EDS (Princeton Gamma-Tech Instruments Inc., Princeton, NJ, USA) in Vega Tescan SEM (Tescan, Brno, Czech Republic) on the cross-sections (
Figure 1a). Each EDS measurement was performed at 22 points (
Figure 1b) spaced 0.363 mm apart. The composition profiles of silicon, iron and manganese created with EDS (
Figure 1b) show some increase toward the center, which is also visible (
Figure 1a) as the enrichment in AlSi-eutectic in the specimen center.
We have investigated five samples, one for each alloy. The first had composition with nominal values (nominal composition) Al-5 wt. % Si-0.2 wt. % Fe-0.2 wt. % Mn, which we will refer to as AlSi5Fe0.2Mn0.2. Using the same naming convention, the other four samples had nominal compositions AlSi5Fe0.2Mn0.4, AlSi5Fe0.4Mn0.2, AlSi5Fe0.4Mn1.0, and AlSi5Fe1.0Mn0.4. All were solidified with fluid flow induced by RMF as described above. The transverse cross-sections (
Figure 1a) and longitudinal sections (
Figure 2b) showed segregation across the diameter as an enrichment in AlSi-eutectic [
21,
24] and increase in Si, Fe and Mn content (
Figure 1b). For each specimens’ nominal composition, Thermo-Calc was used to create phase mass fraction diagrams (so-called “property diagrams”) (
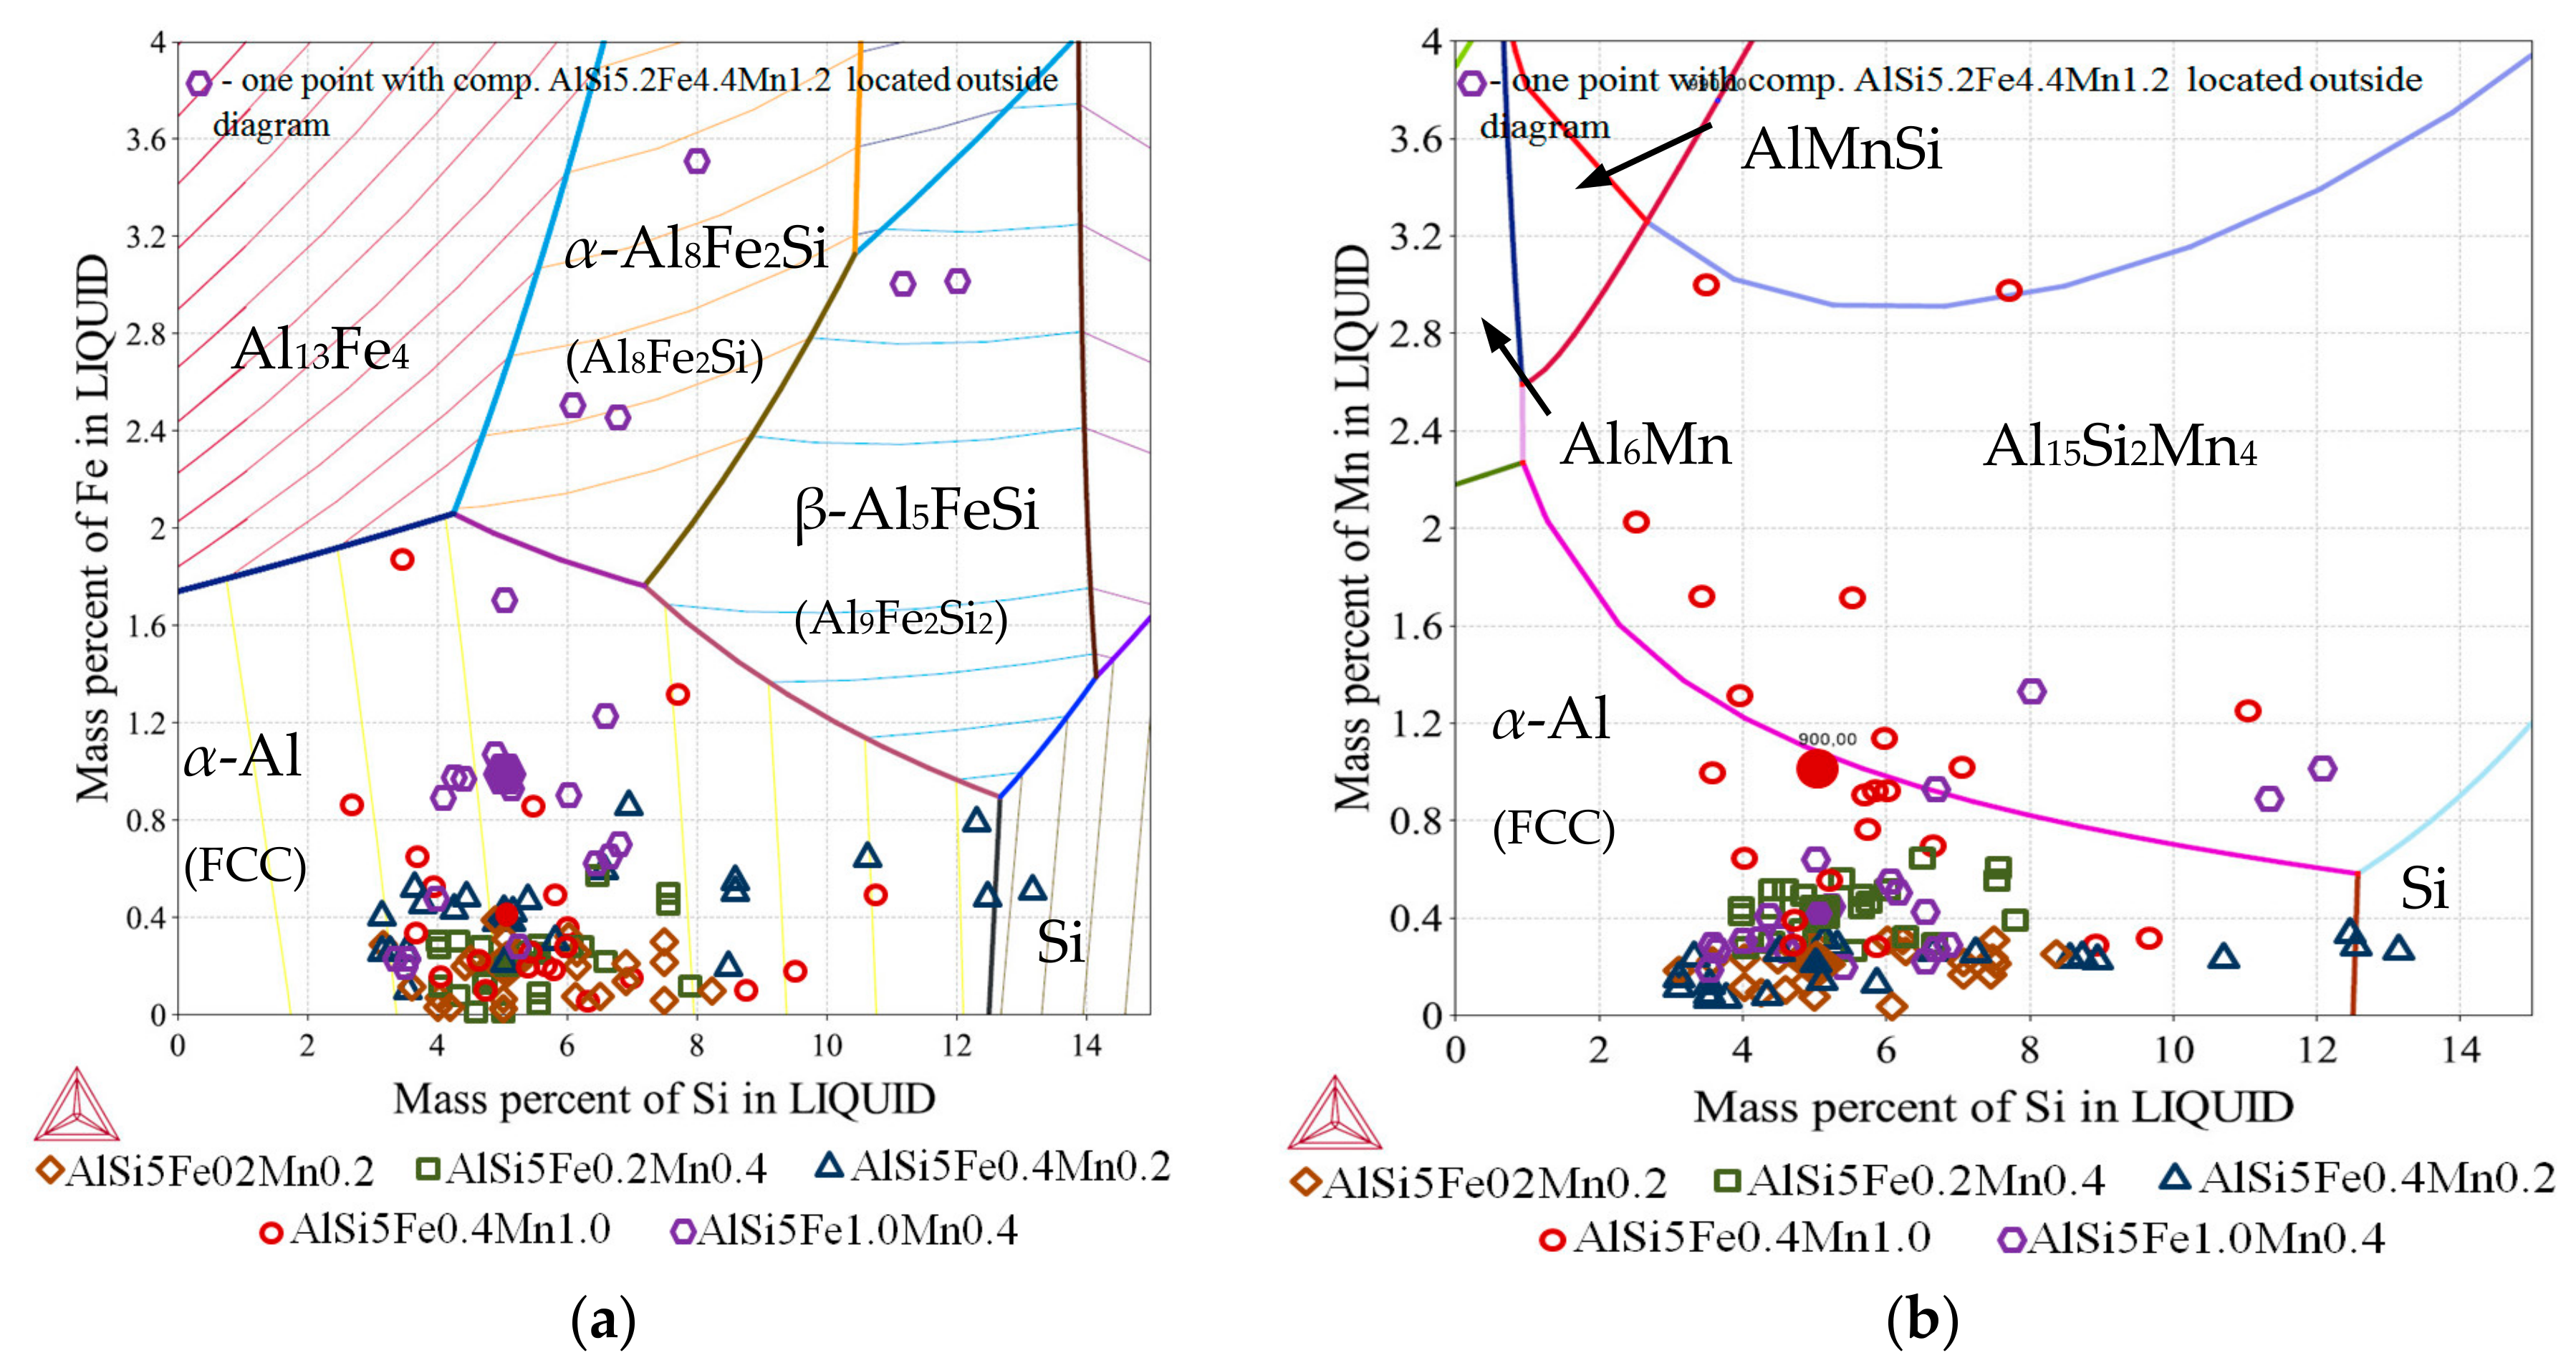
Figure 2a), which show the evolving phase fractions as a function of decreasing temperature for a specific composition. The measured chemical compositions for quaternary alloys were graphed onto three ternary phase diagrams Al-Si-Fe (
Figure 3a), Al-Si-Mn (
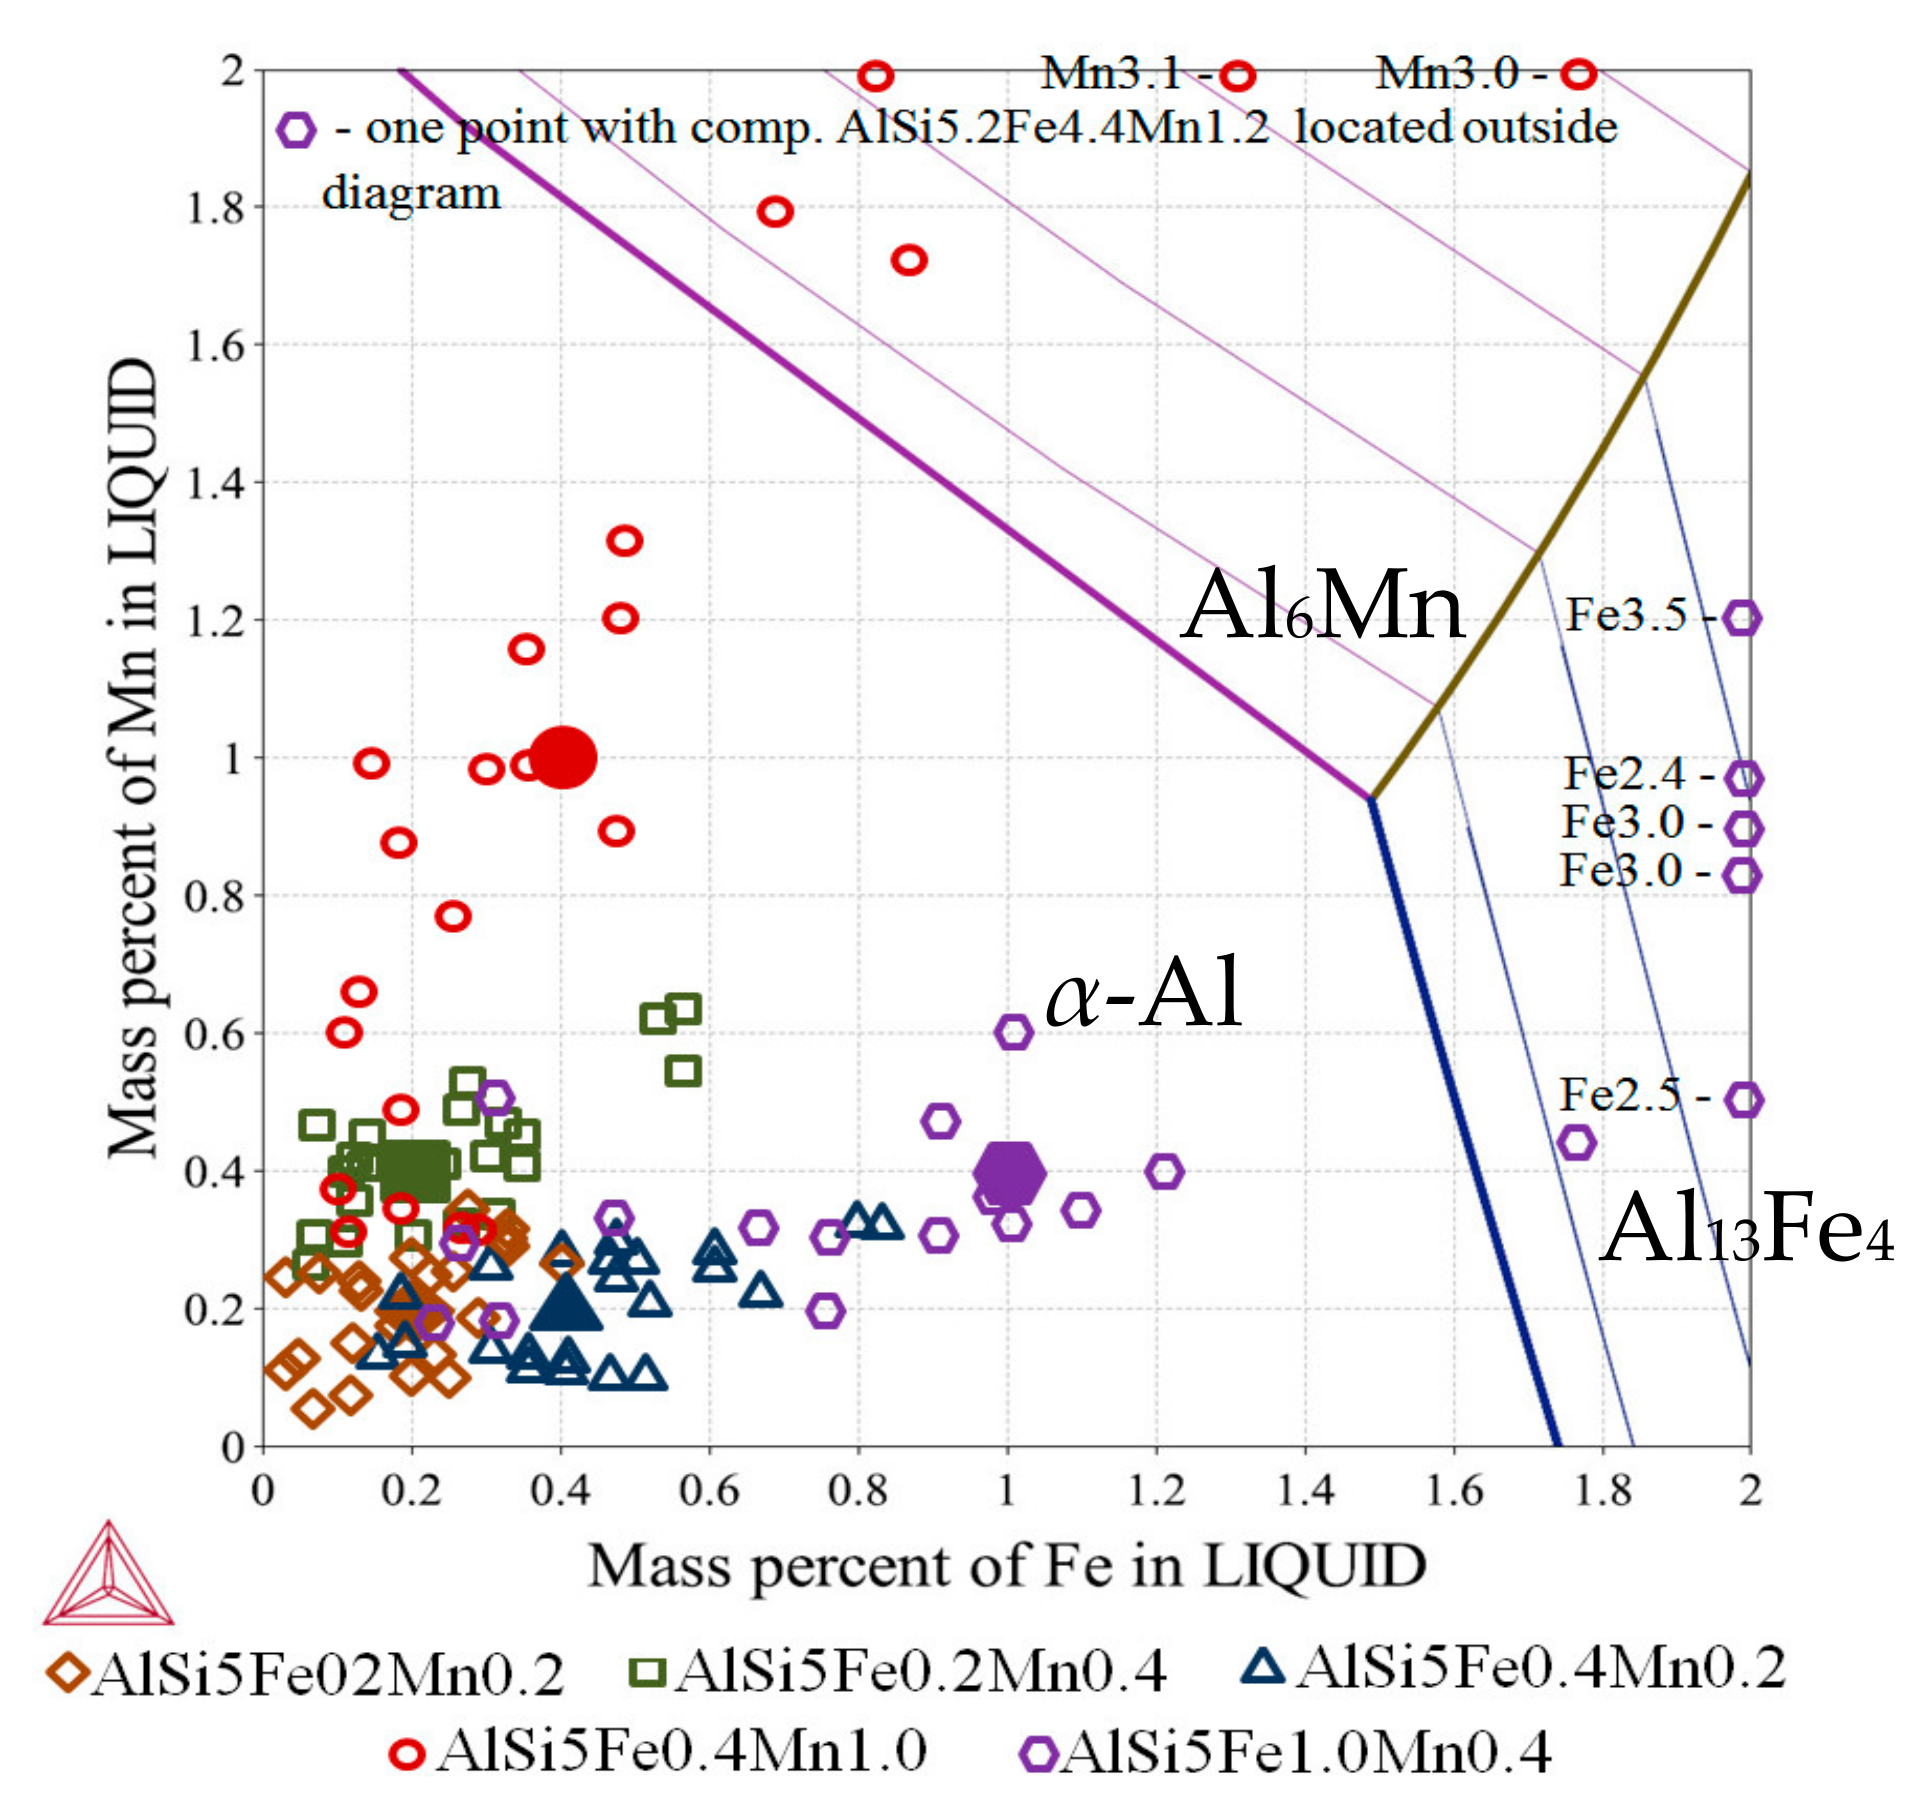
Figure 3b) and Al-Fe-Mn (
Figure 4) and were considered as independent alloys solidifying in specific areas inside each specimen. All calculations were done with Thermo-Calc 4.1 [
17] software and databases TCAl3 (TCS Al-based alloys database v.3) and MOBAl3 (TCS Al-alloys mobility database v.3) were applied.
From the 22 chemical compositions recorded across the diameter of each specimen (
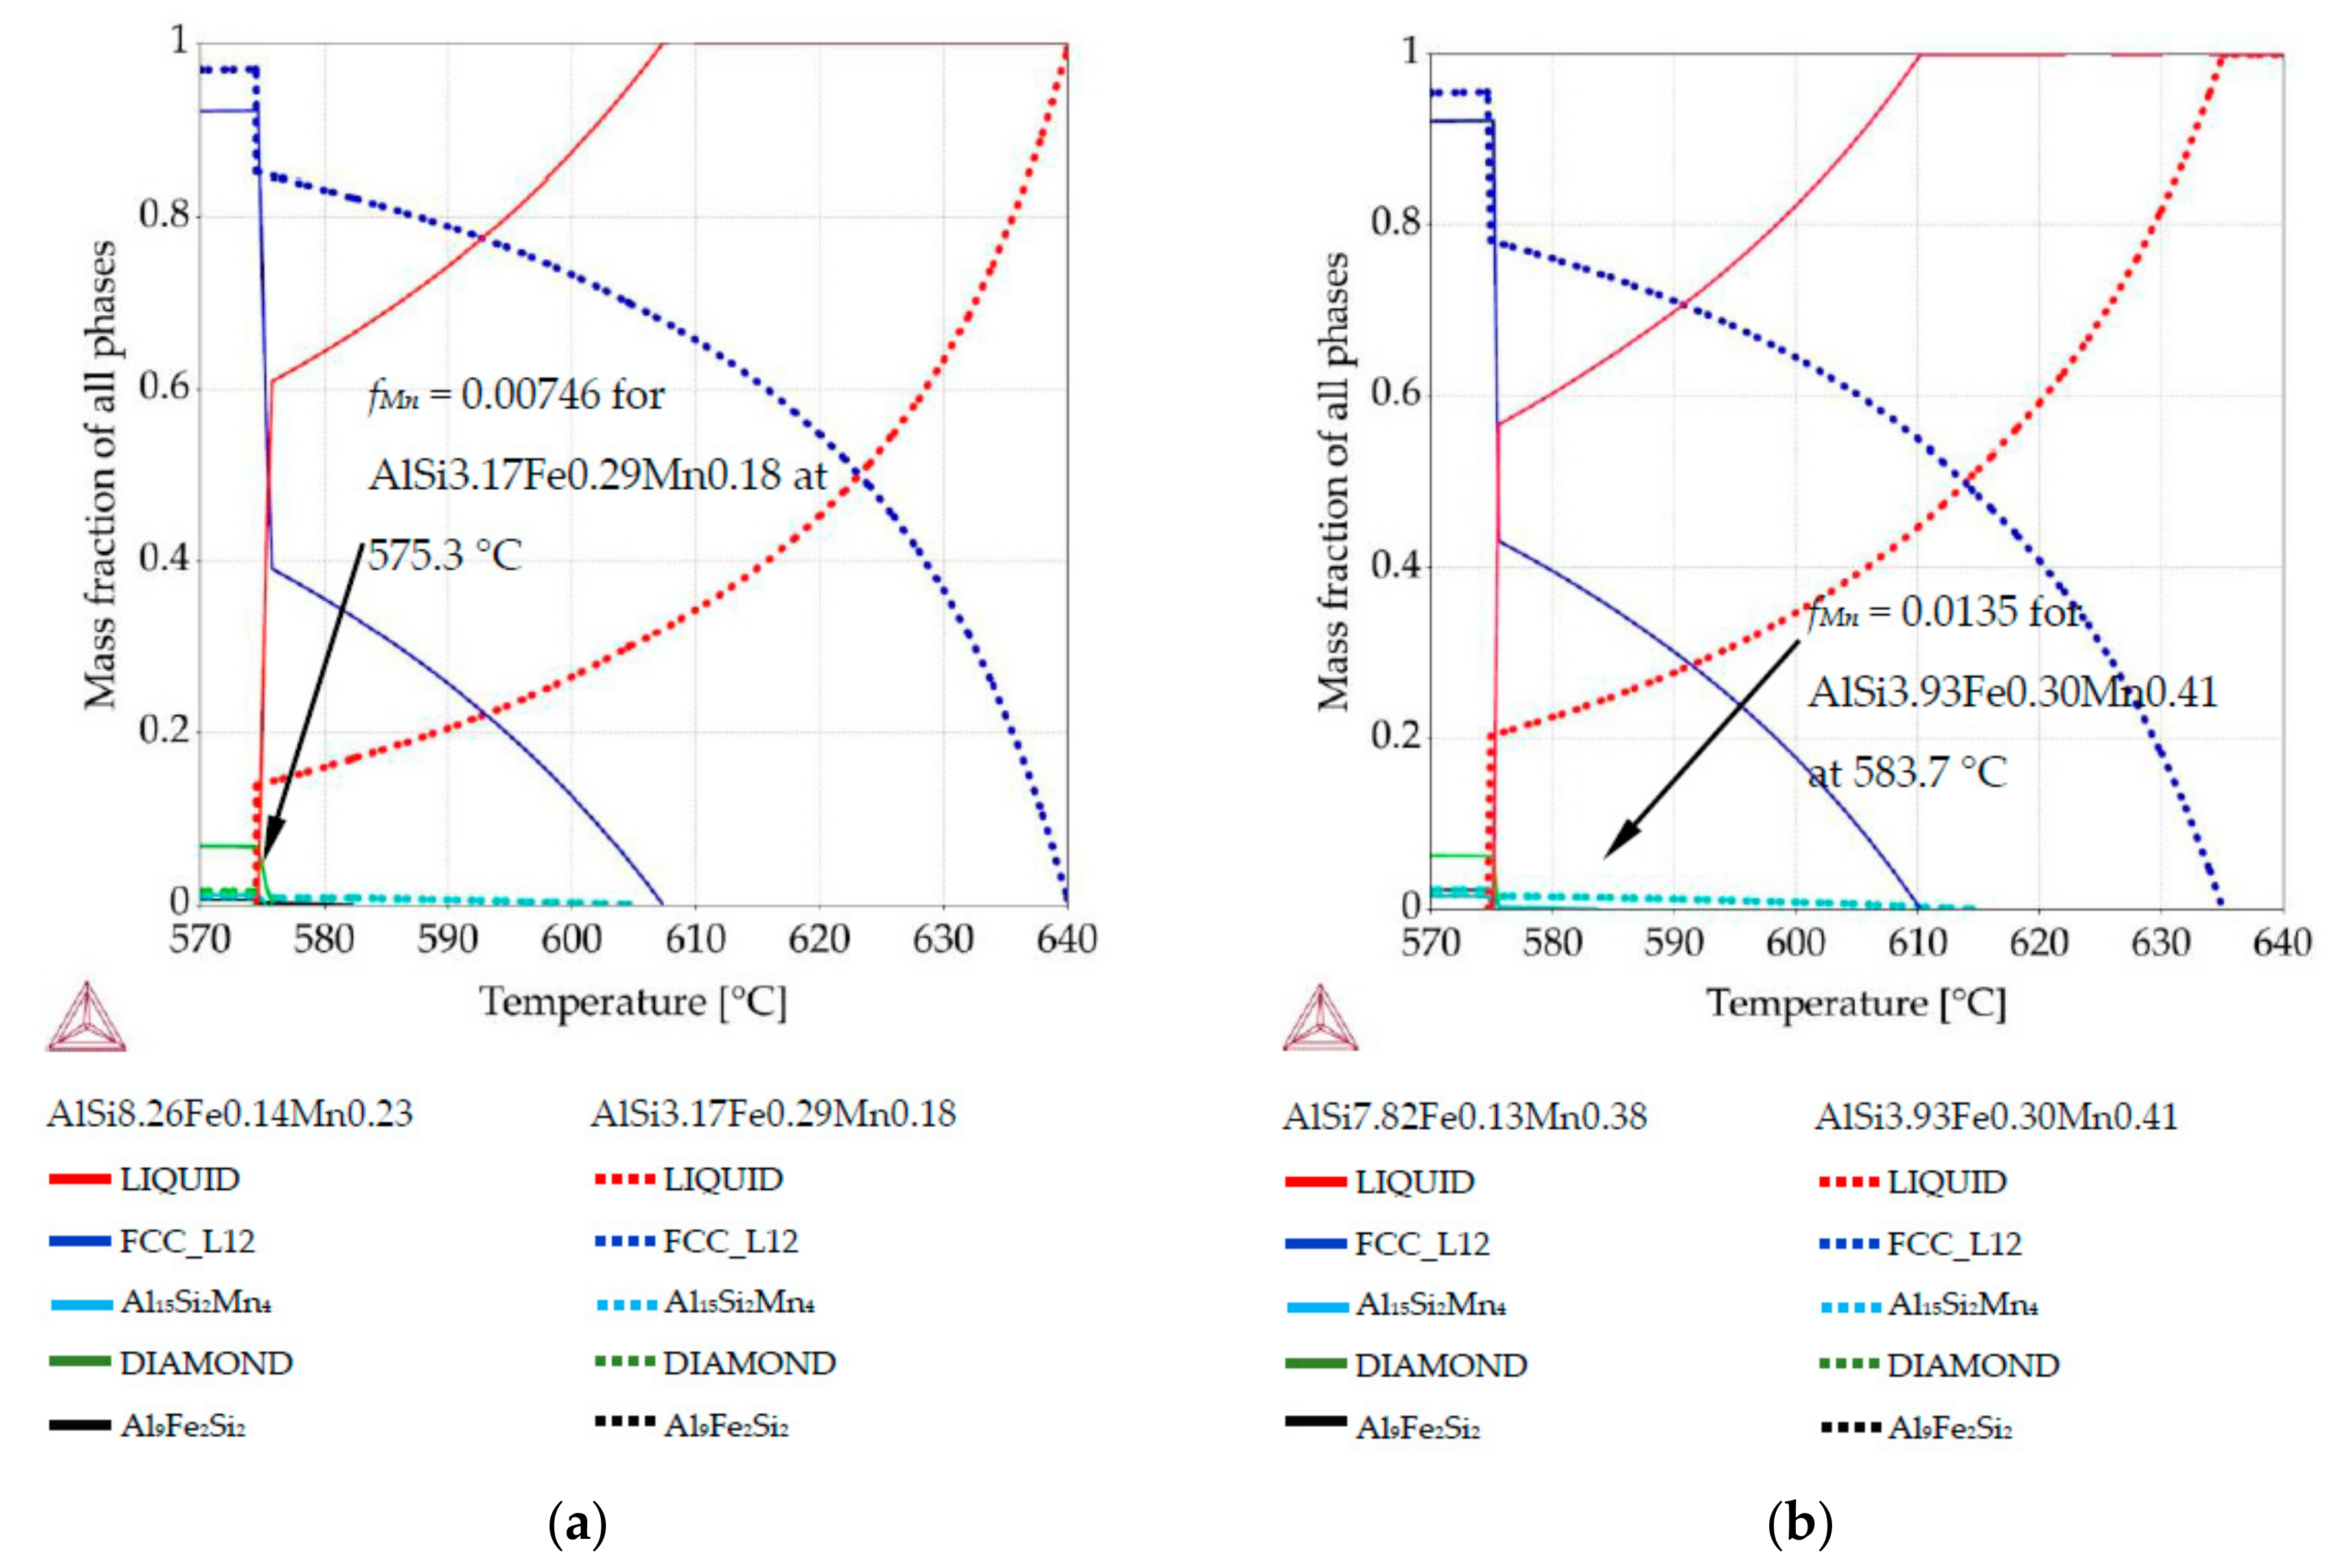
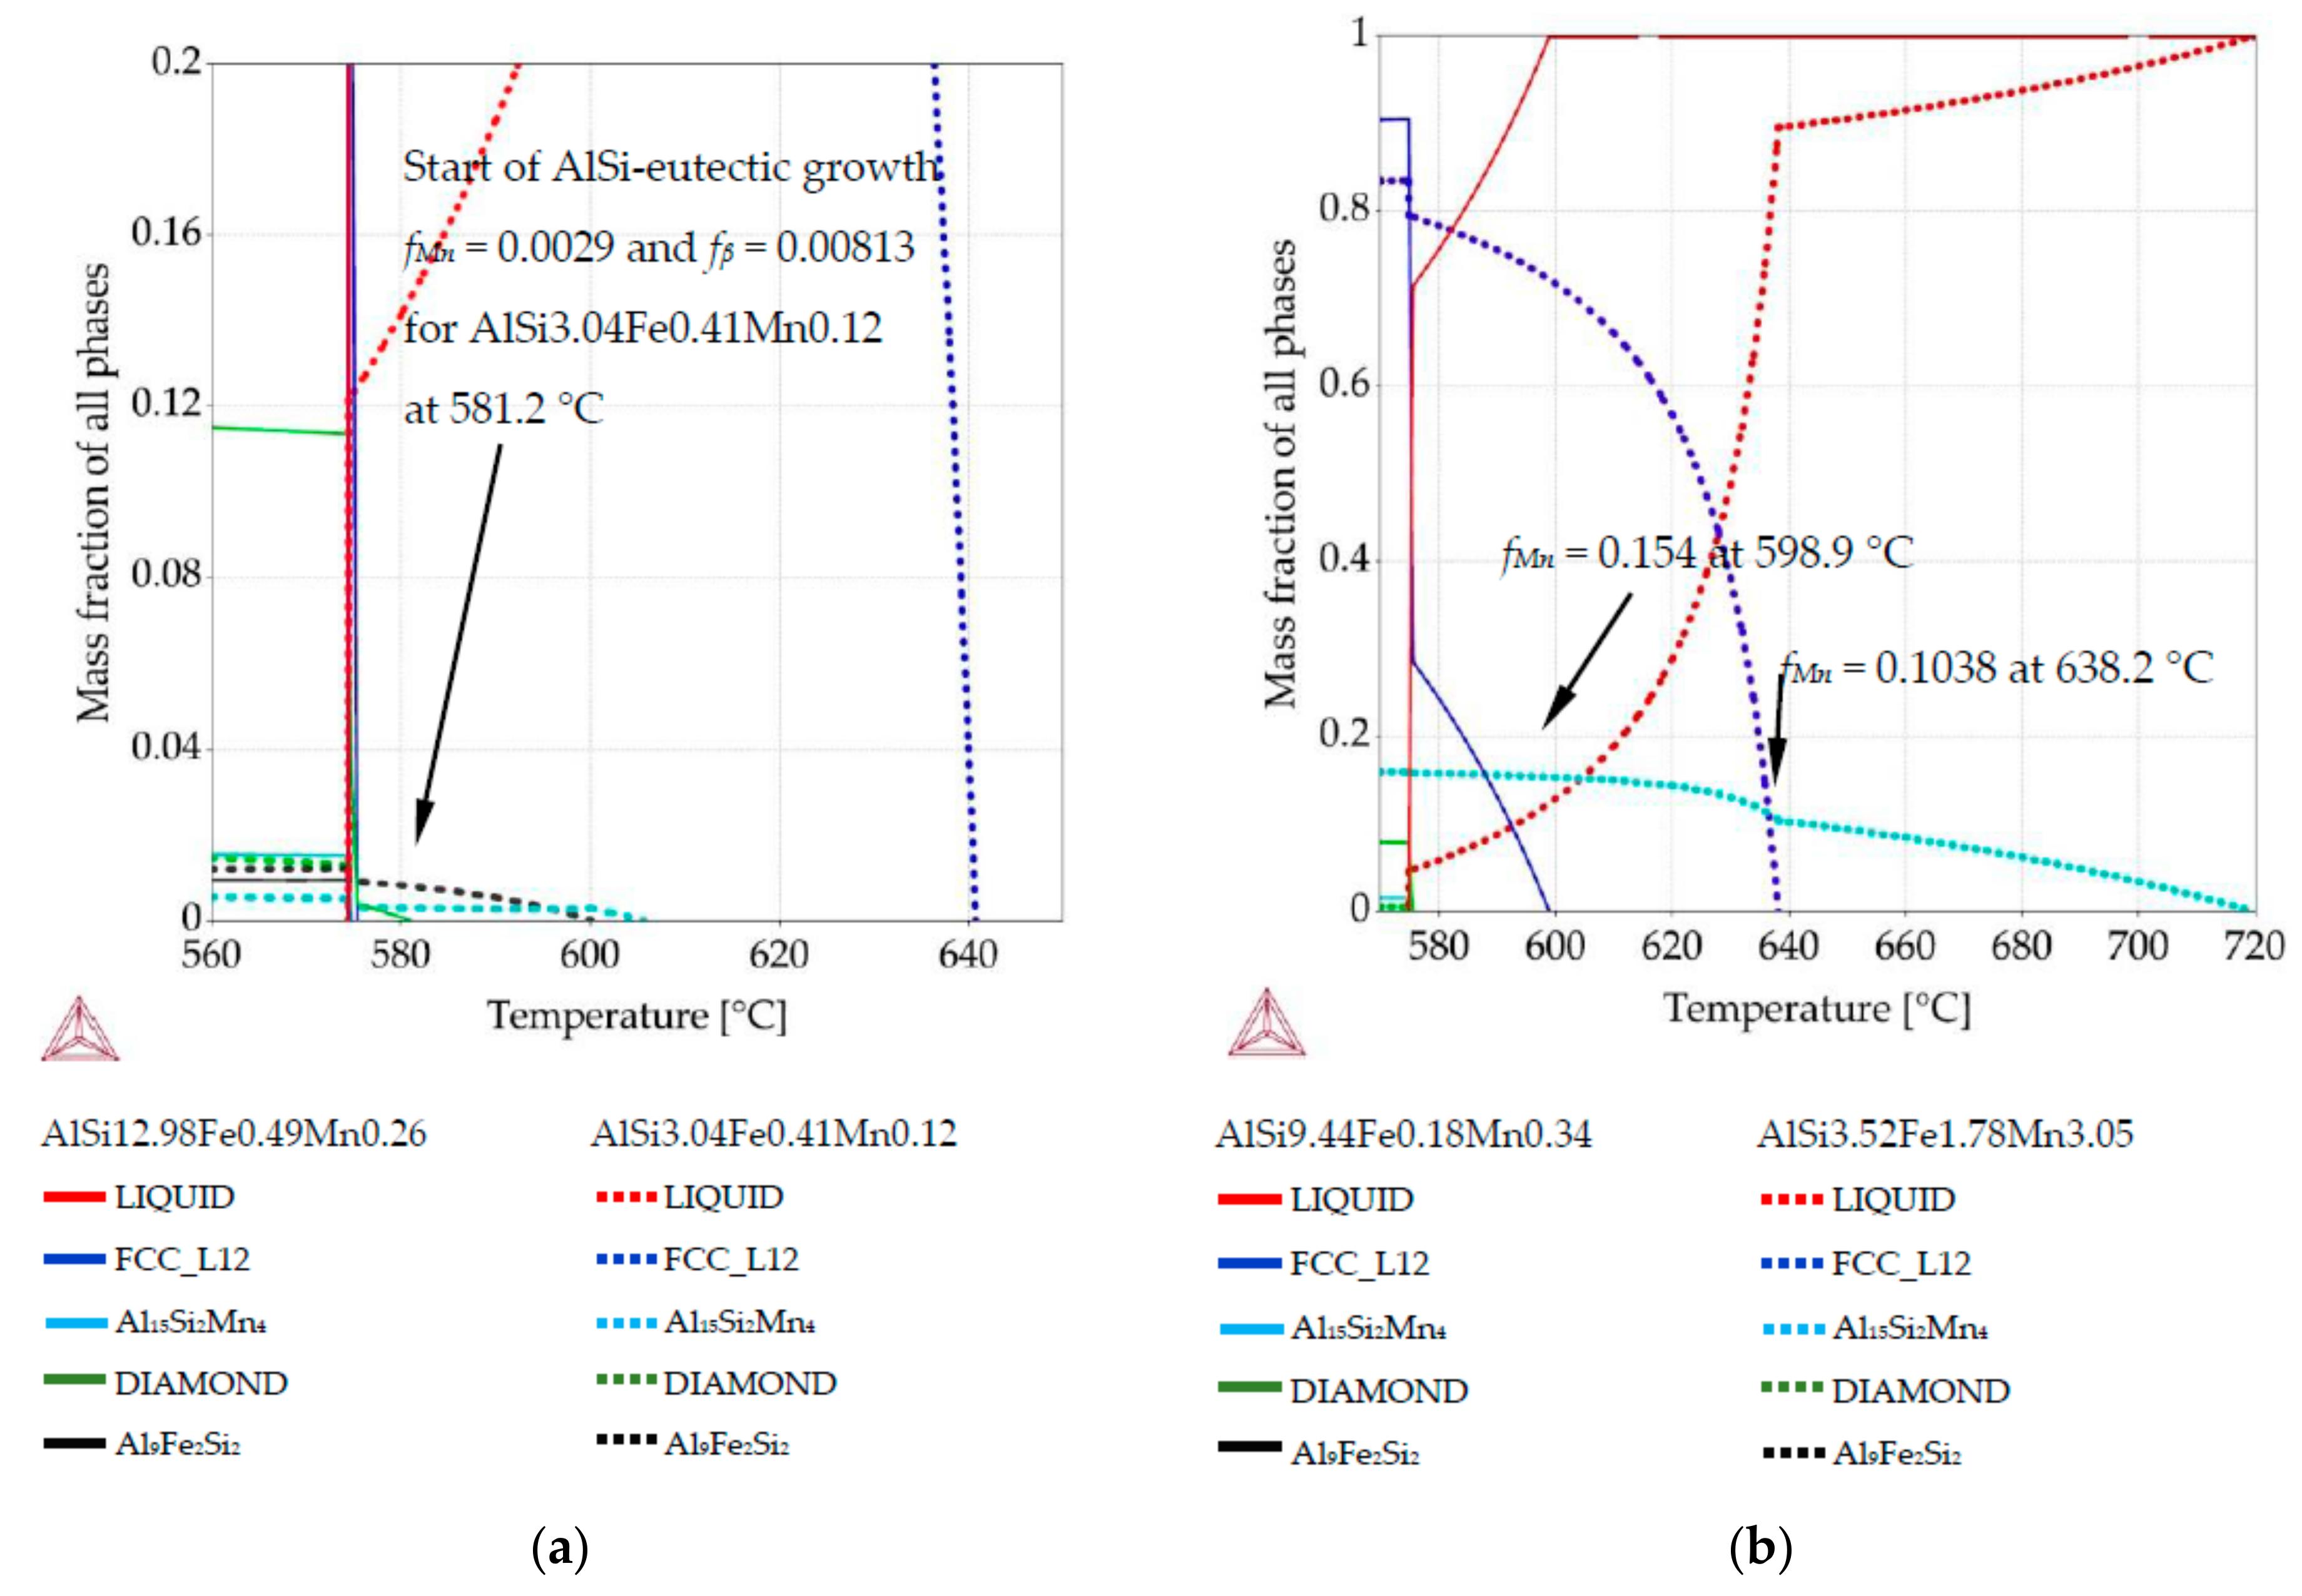
Figure 1b), two compositions per sample were selected. For those compositions, Thermo-Calc was used to create phase fraction diagrams in order to determine the fraction of solidified phases and the precipitation sequence at those particular compositions. For example, for the AlSi5Fe0.2Mn0.2 specimen, we analyzed the compositions AlSi3.17Fe0.29Mn0.18 (measured at position 3.1 mm) and AlSi8.26Fe0.14Mn0.23 (coordinate 7.8 mm). The specific compositions were selected to represent the extremes of solidification behavior possible within each sample.
For all specimens (five alloys) and all twenty-two measured compositions, phase mass fraction diagrams were calculated in Thermo-Calc (labeled in the software as “property diagrams”). These phase mass fraction diagrams (called in current study also phase fraction diagrams) were applied to create 2D maps. Each map presents mass fraction of precipitating phases including
β-Al
5FeSi, Al
15Si
2Mn
4 and
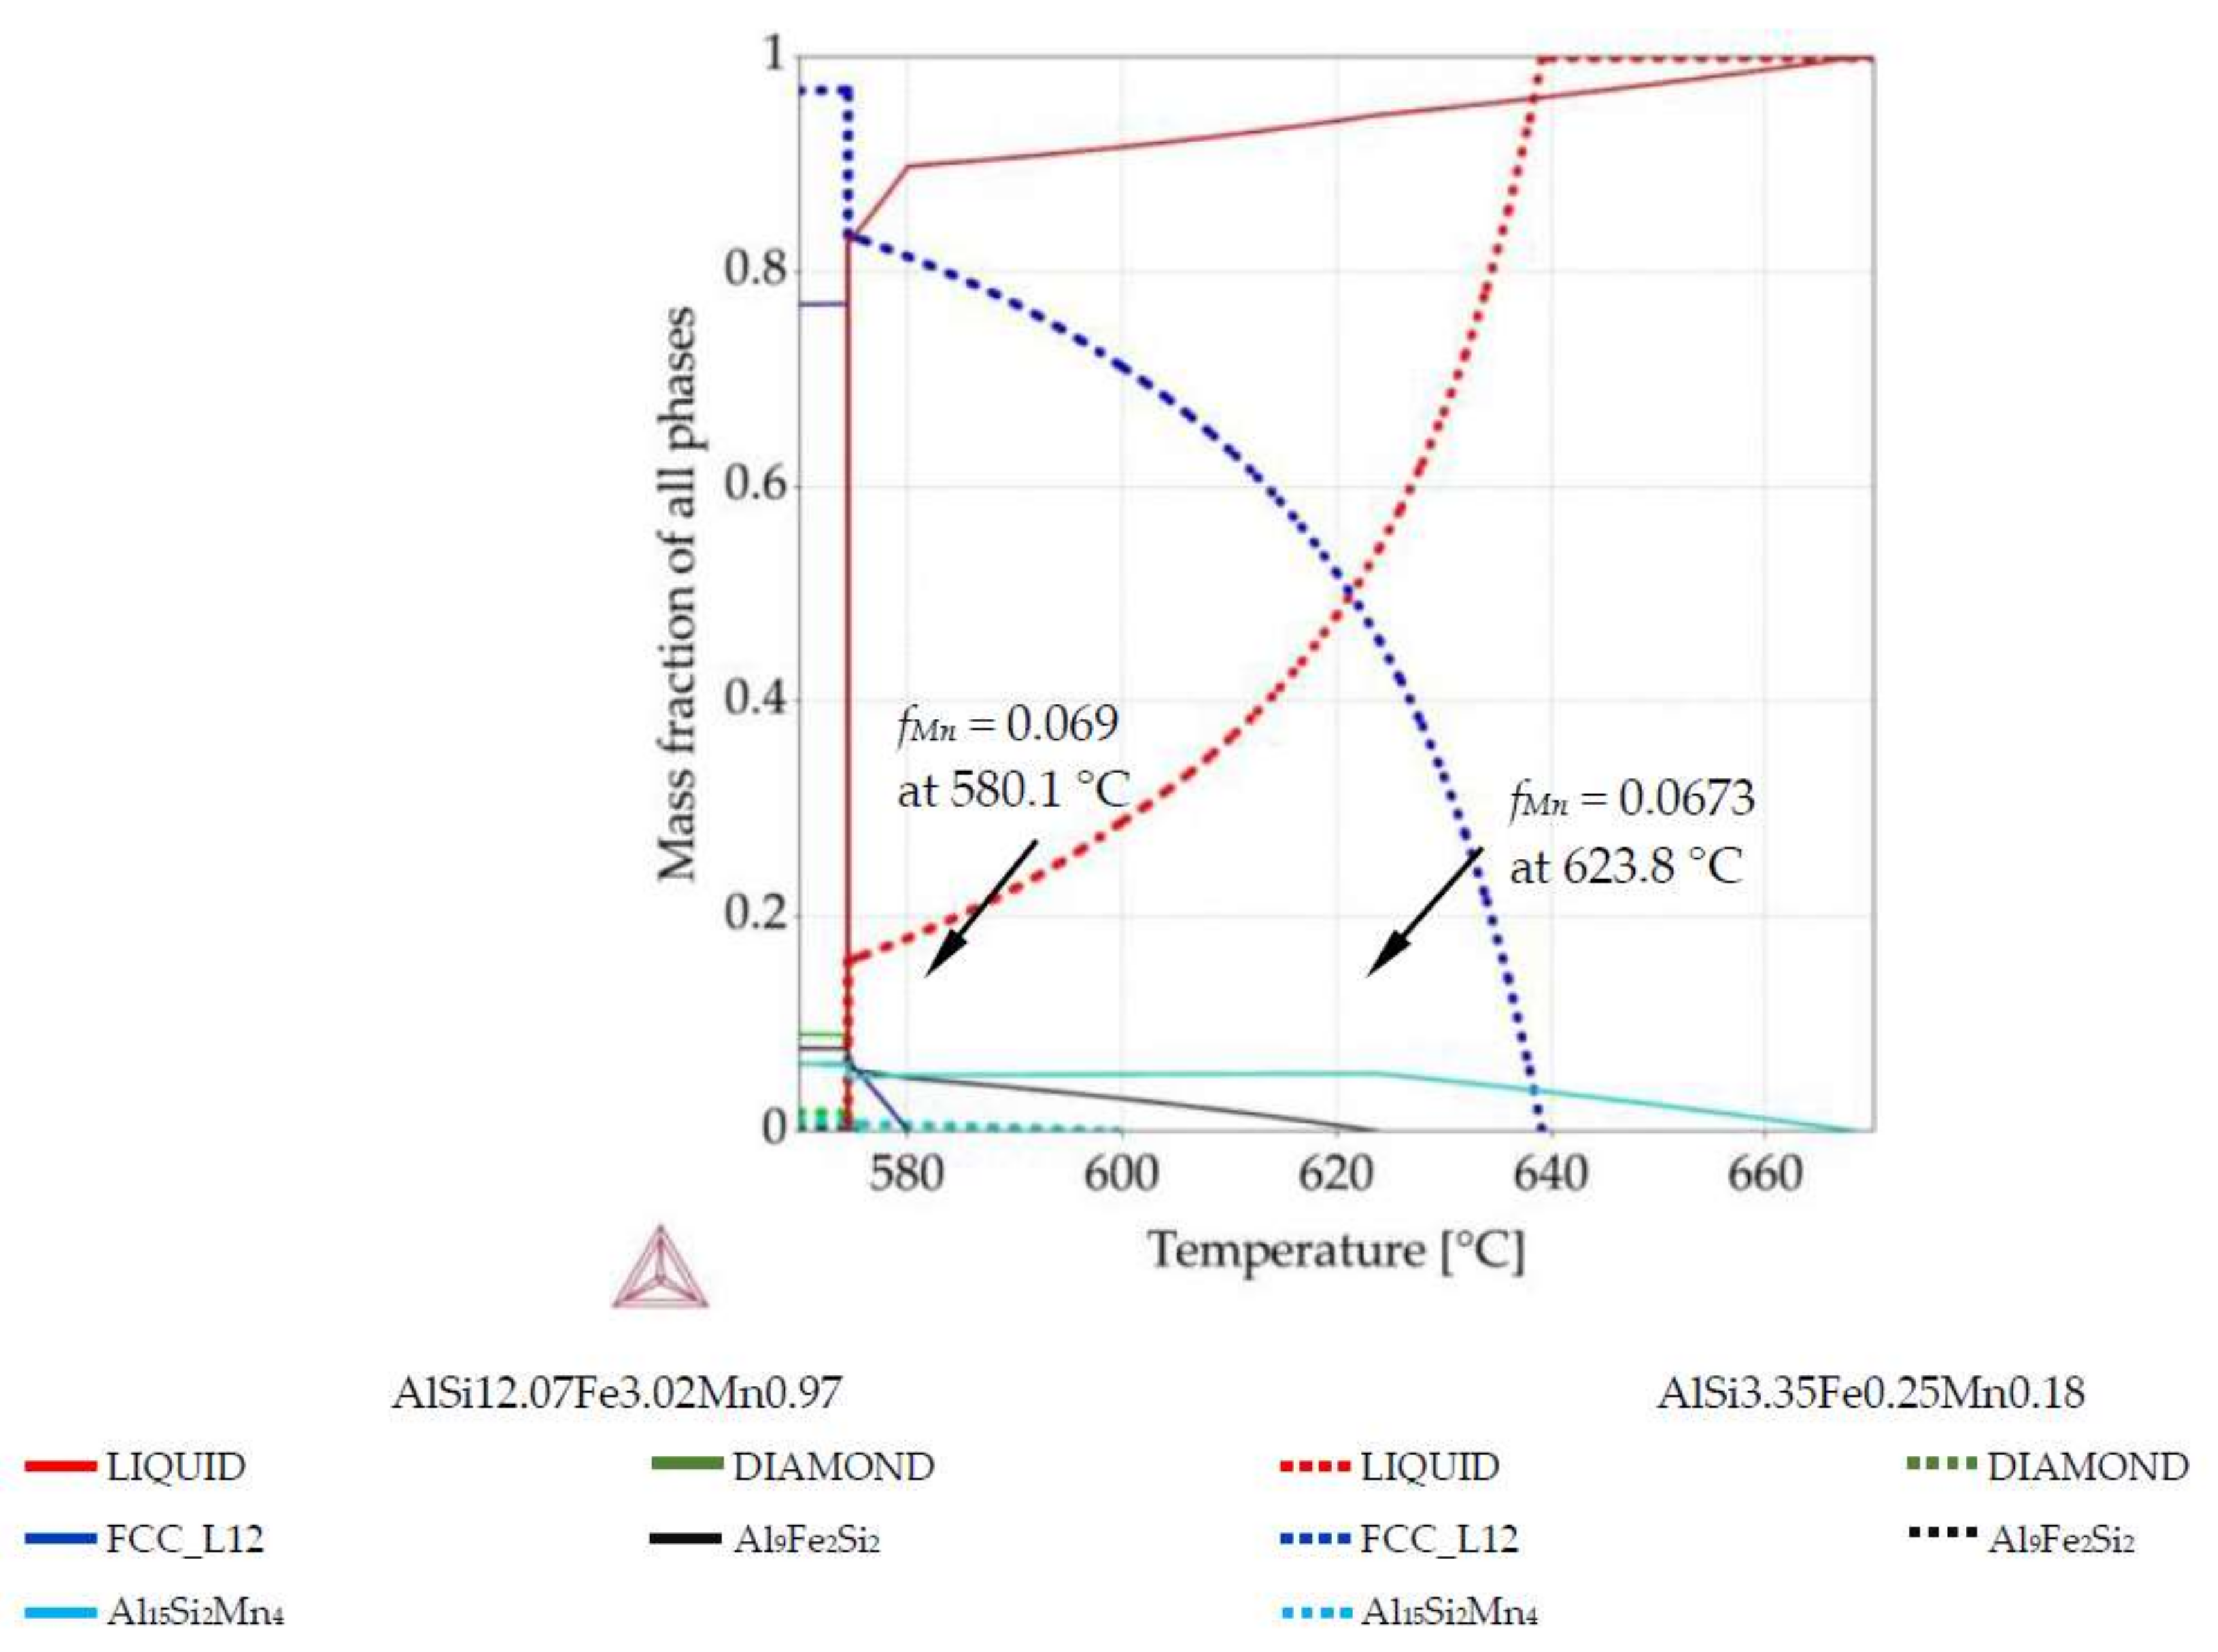
α-Al dendrites as a function of longitudinal position, which shows both the temperature of phase precipitation and general shape and density of the mushy zone. Considering each of the twenty-two points and processing them as a separate alloy with its own composition, the phase fraction diagrams were linked to a position on the longitudinal section (across the specimen diameter). This linking method is shown on
Figure 2, where green arrow (diagram’s axis) moved from diagram was placed in chosen position together with phases fraction course (red and blue courses). EDS measurements were performed on rectangle areas with length and width of about 0.36 mm and placed side by side, at distances of 0.36 mm. The values of mass fraction from the phase fraction diagrams were transformed using graphical software into 0.36 mm wide belts and positioned side by side with 0.36 mm spacing. The length of 0.36 mm wide belts was determined by temperature range and oriented along the temperature axis on samples longitudinal section (
Figure 2b). Knowing the solidification velocity (0.04 mm/s) and Artemis-3’s construction based on a linear temperature field, it was possible to transform temperature into length. Based on thermal macro-scale modeling, of course it would also be possible to apply nonlinear temperature field, and make similar plots. The 2D maps presenting mass fraction of the three solid phases as a function of location across the sample and temperature (or sample length) were prepared for each specimen, based on data included in phase fraction diagrams (
Figure 2). The rescaling of temperature axis into a length axis was possible thanks to controlled solidification conditions (front velocity and temperature gradient) in the applied Bridgman-type furnace, and allowed preparation of 2D maps of the mushy zone.
Thermo-Calc [
17] was used to calculate ternary phase diagrams (
Figure 3 and
Figure 4) as liquidus projections by interval 2 °C for temperature range 550–900 °C. Phase fraction diagrams (
Figure 2 and
Figure 5,
Figure 6 and
Figure 7) were prepared by interval 2 °C and mass fraction interval 0.00017–0.00148 (for
β-Al
5FeSi), 0.00017–0.00148 (for Al
15Si
2Mn
4), 0.017–0.059 (for
α-Al) and 0.017–0.059 (for liquid).
4. Discussion
In materials science the application of phase diagrams and phase mass fraction diagrams is very broad, however, this utilization of phase fraction diagrams is a new application, which seems to supply interesting information on the course of solidification.
The depiction of the mushy zone shown in the 2D maps (
Figure 8,
Figure 9,
Figure 10,
Figure 11 and
Figure 12) results from chemical composition mostly solidified at 575 °C and resulting from Si, Fe and Mn release by intensive stirring (RMF). The real structures are likely to differ slightly from what is shown in the figures. Nevertheless, the technique is able to provide some insight otherwise unavailable into the solidification process.
The use of aerogel as a crucible allowed the direct measurement of the intensity of radiation from samples’ surface. Aerogel [
19,
32] is a transparent materials with very low thermal conductivity (5–20 mW/m·K). By using the recorded intensity, it was possibly to evaluate the intensity curves with characteristic peak-effect by solidus temperature and calculate directly the front velocity. Steinbach and Ratke [
32] developed the method for mass fraction determination applicable in Artemis-3 but only for solidification with a planar front, without melt stirring. In the current study due to very small amounts of
β-Al
5FeSi and Al
15Si
2Mn
4 and intensive stirring which disturbed the planar front, it was impossible to compare mass fraction of Fe- and Mn-intermetallics and also
α-Al dendrites. The authors therefore decided to validate mass fraction according to simulation results [
23].
Hainke [
23] developed and applied simulation software for directional solidification with electromagnetic stirring. In calculations for AlSi7 (
G = 4 K/mm,
B = 3 mT) velocity isolines formed the deep area in the specimen center where isolines for mass fraction
fL = 0.325 descend 7.15 mm, showing a non-planar front. In [
31] maps similar to those calculated in [
23] were presented with 12–15 mm deep liquid channel in an AlSi7Fe1.0 alloy and for AlSi7Fe0.5 the depth reached 9–13 mm. Study [
33] (specimen AlSi7Mn1.0) showed 13 mm long
α-Al area and liquid channel (575–615 °C) and 28 mm long area (575–660 °C) for Al
15Si
2Mn
4 with Mn-phases growing above dendrites and in the channel. Current results conducted for 5% Si are similar to [
31,
33] for the same Si content (AlSi5Fe1.0 and AlSi5Mn0.2/0.4/1.0 respectively) with all showing a liquid channel where the
α-Al dendrite area was about 20 mm long (575–635 °C).
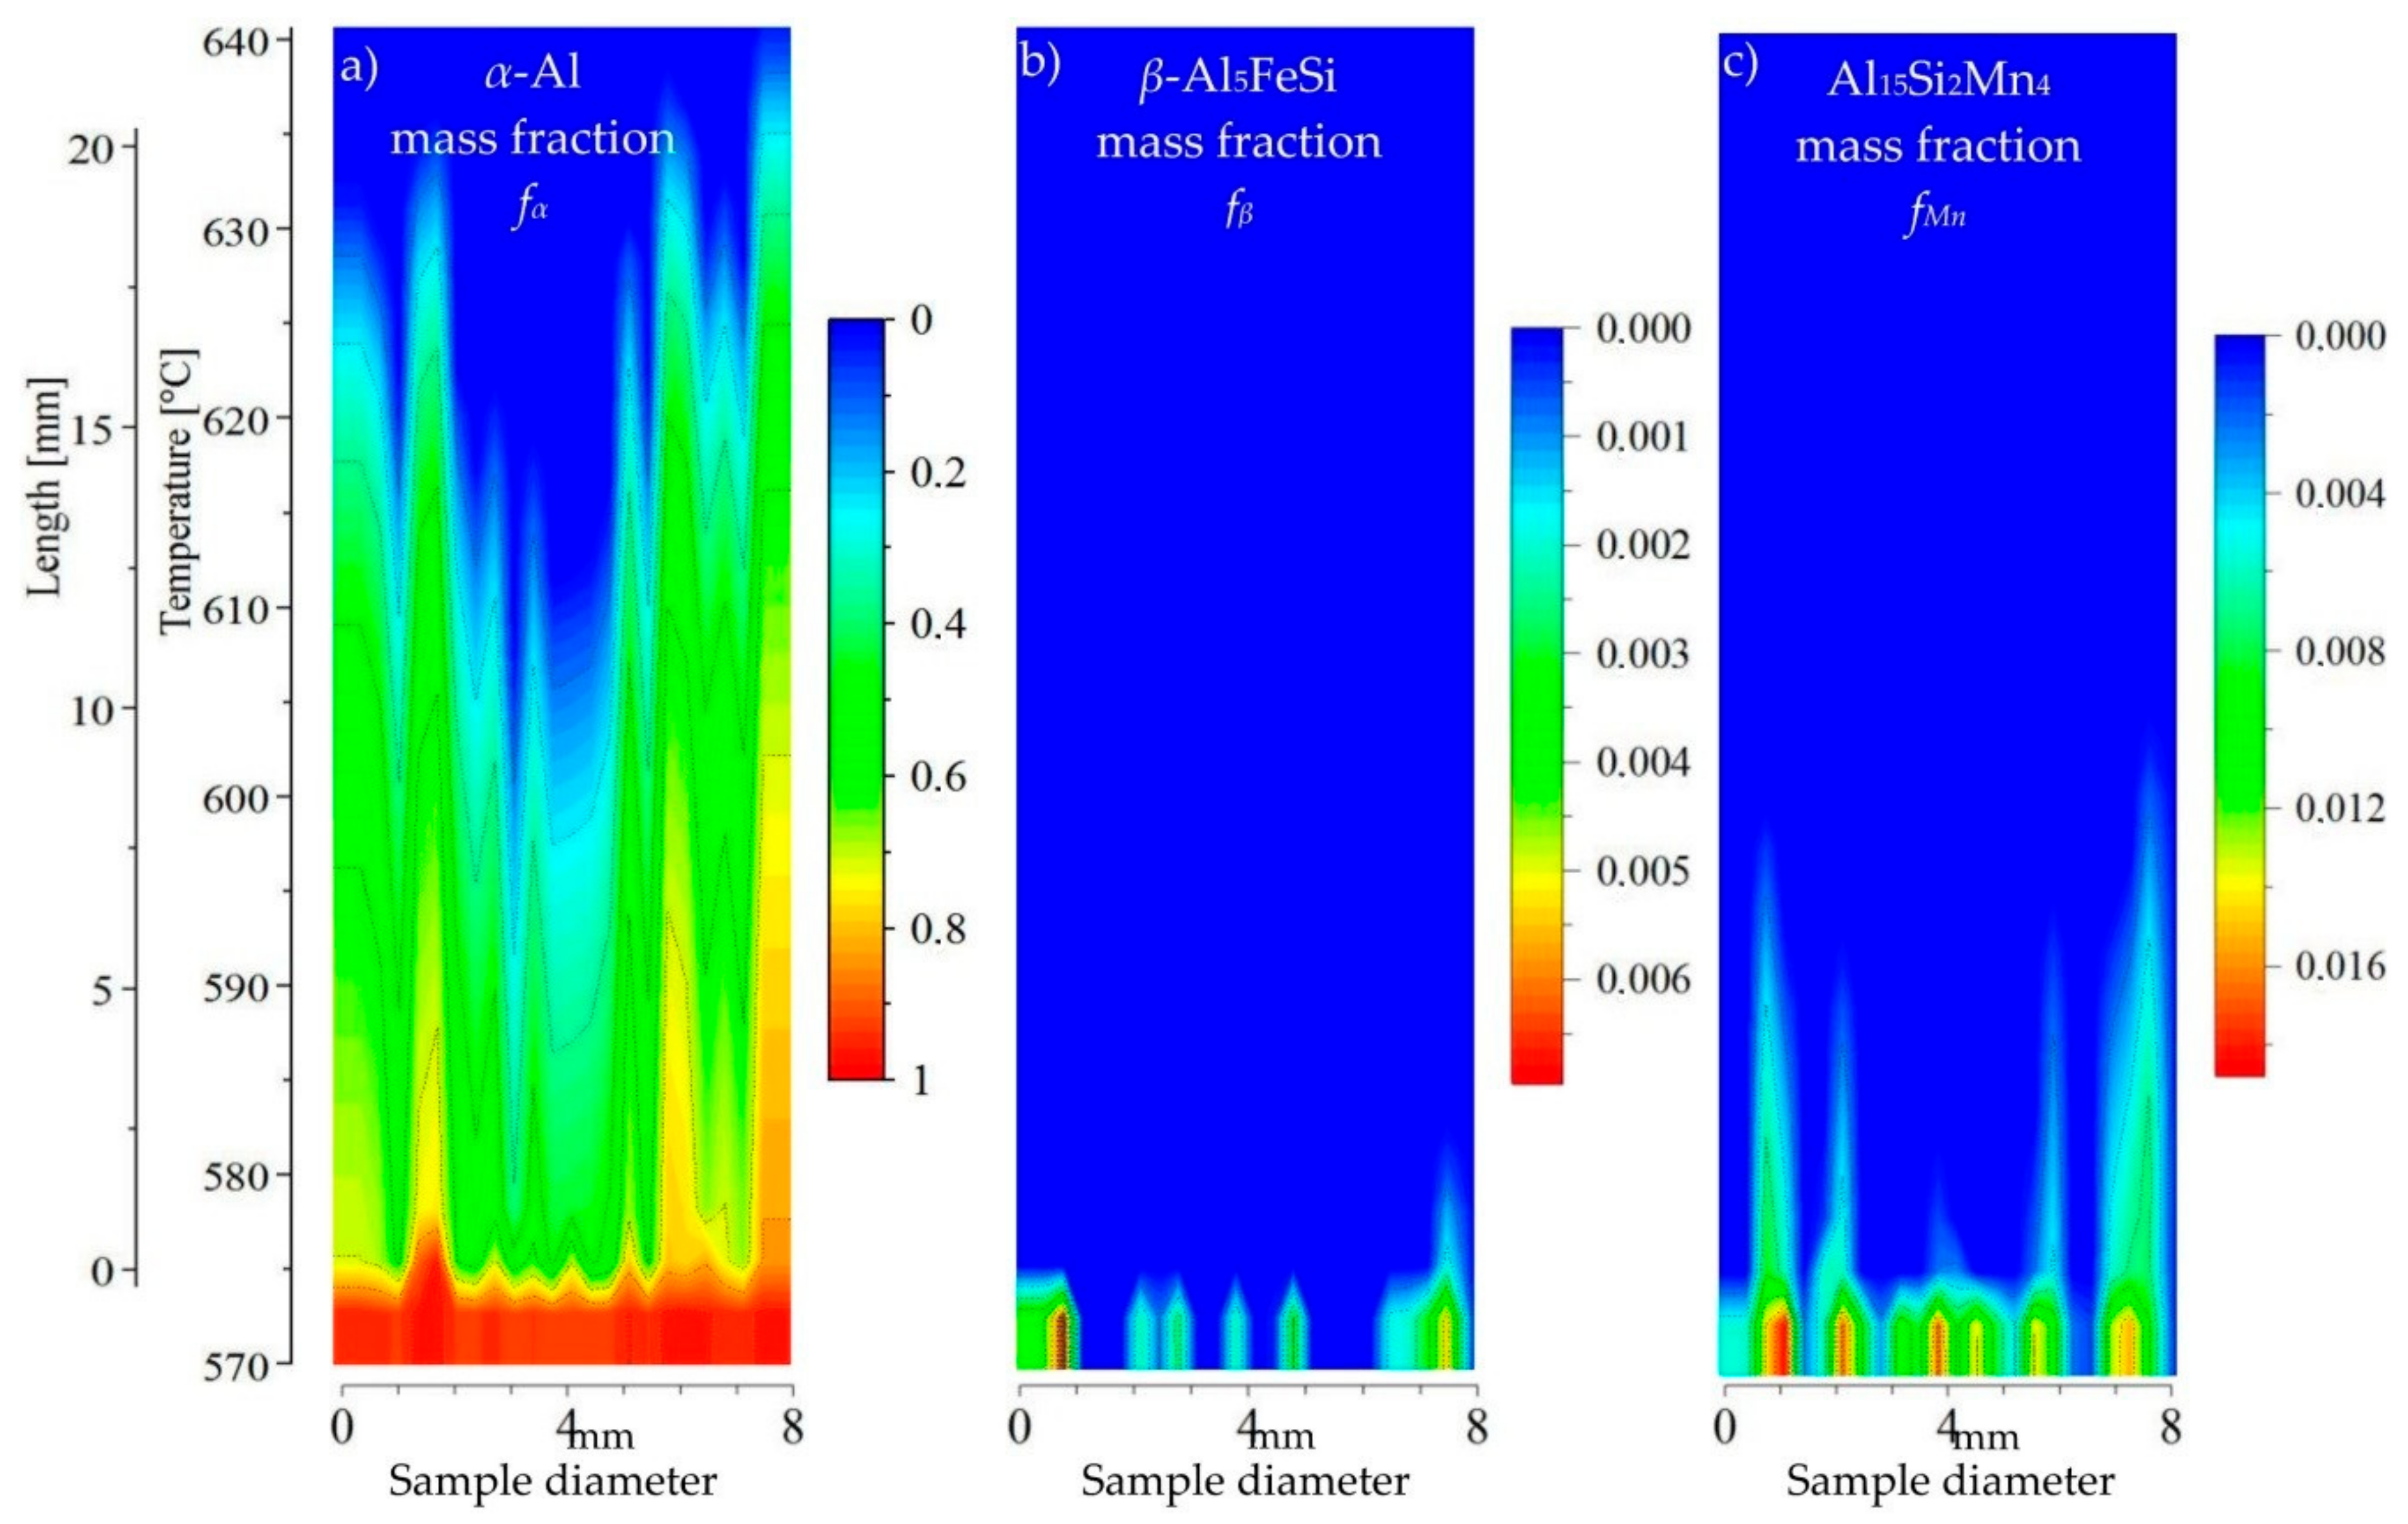
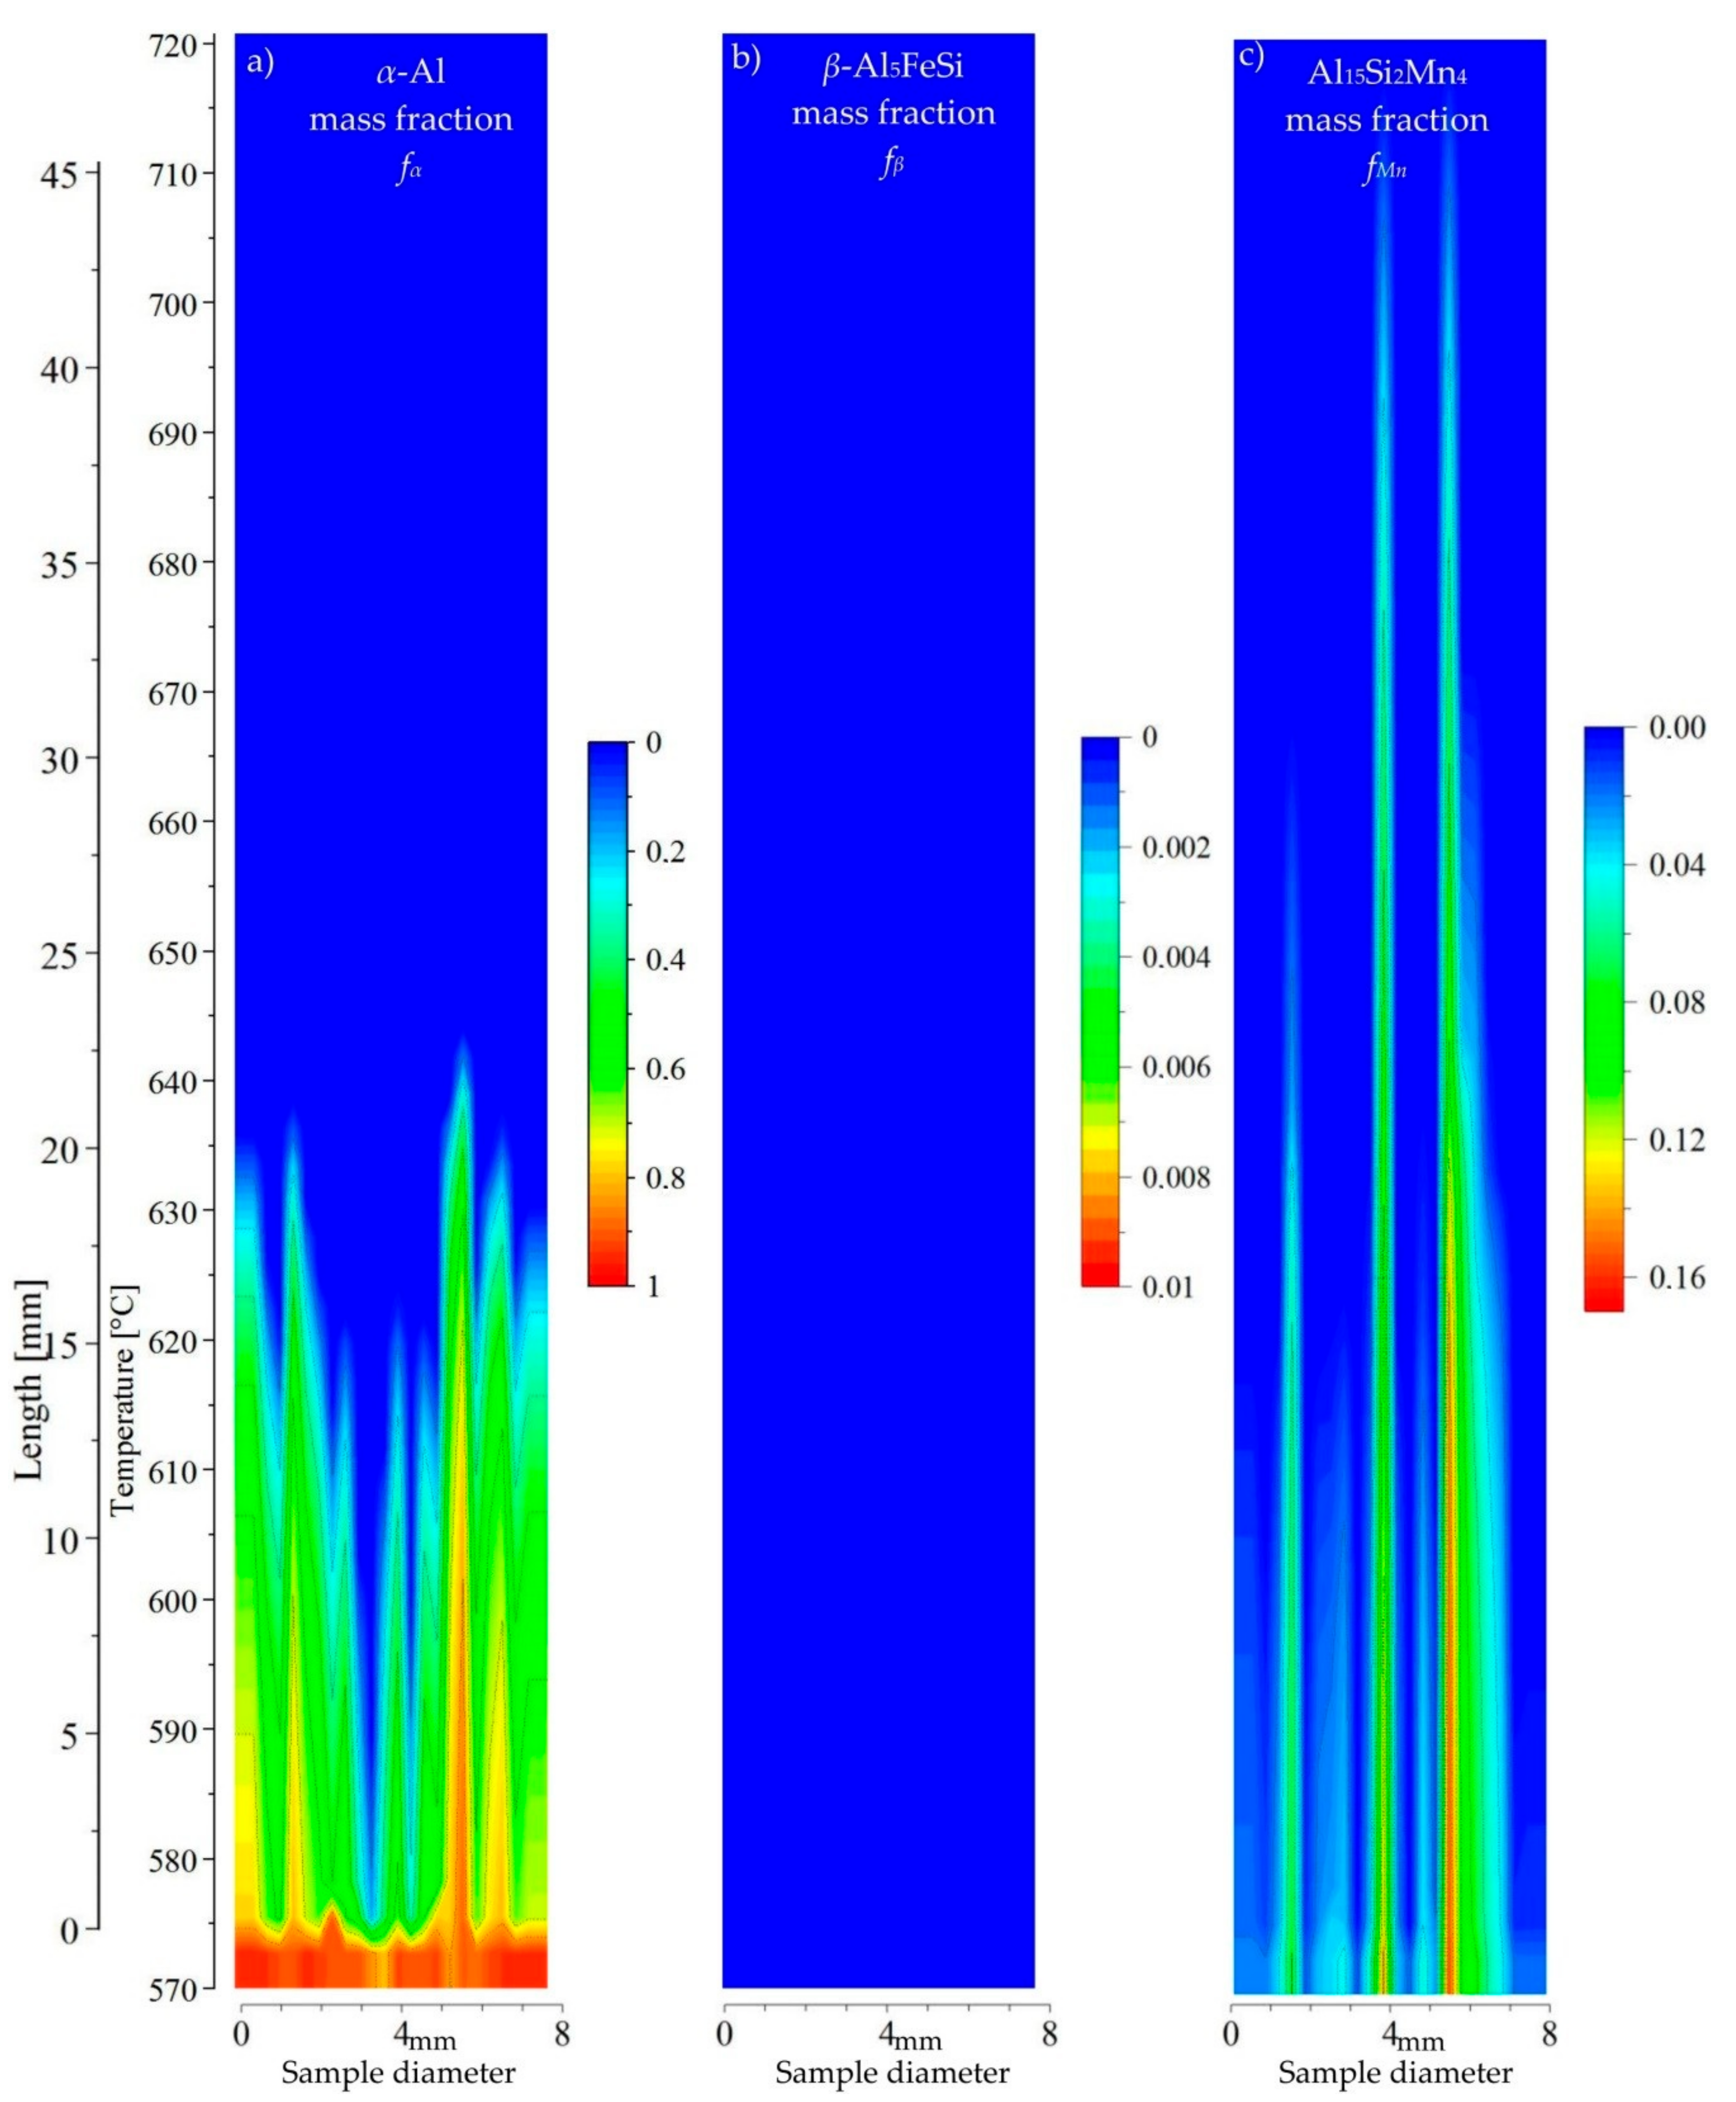
For the AlSi5Fe0.2Mn0.2 specimen (
Figure 8), the 2D maps showed precipitation of
β-Al
5FeSi and Al
15Si
2Mn
4 after the
α-Al dendrites, where Mn-phases appeared second and Fe-rich phases third near temperature 575 °C. The liquid channel, reaching 600 °C in length, and the liquid area above the dendrite tips seems to be empty of intermetallics. In the AlSi5Fe0.2Mn0.4 (
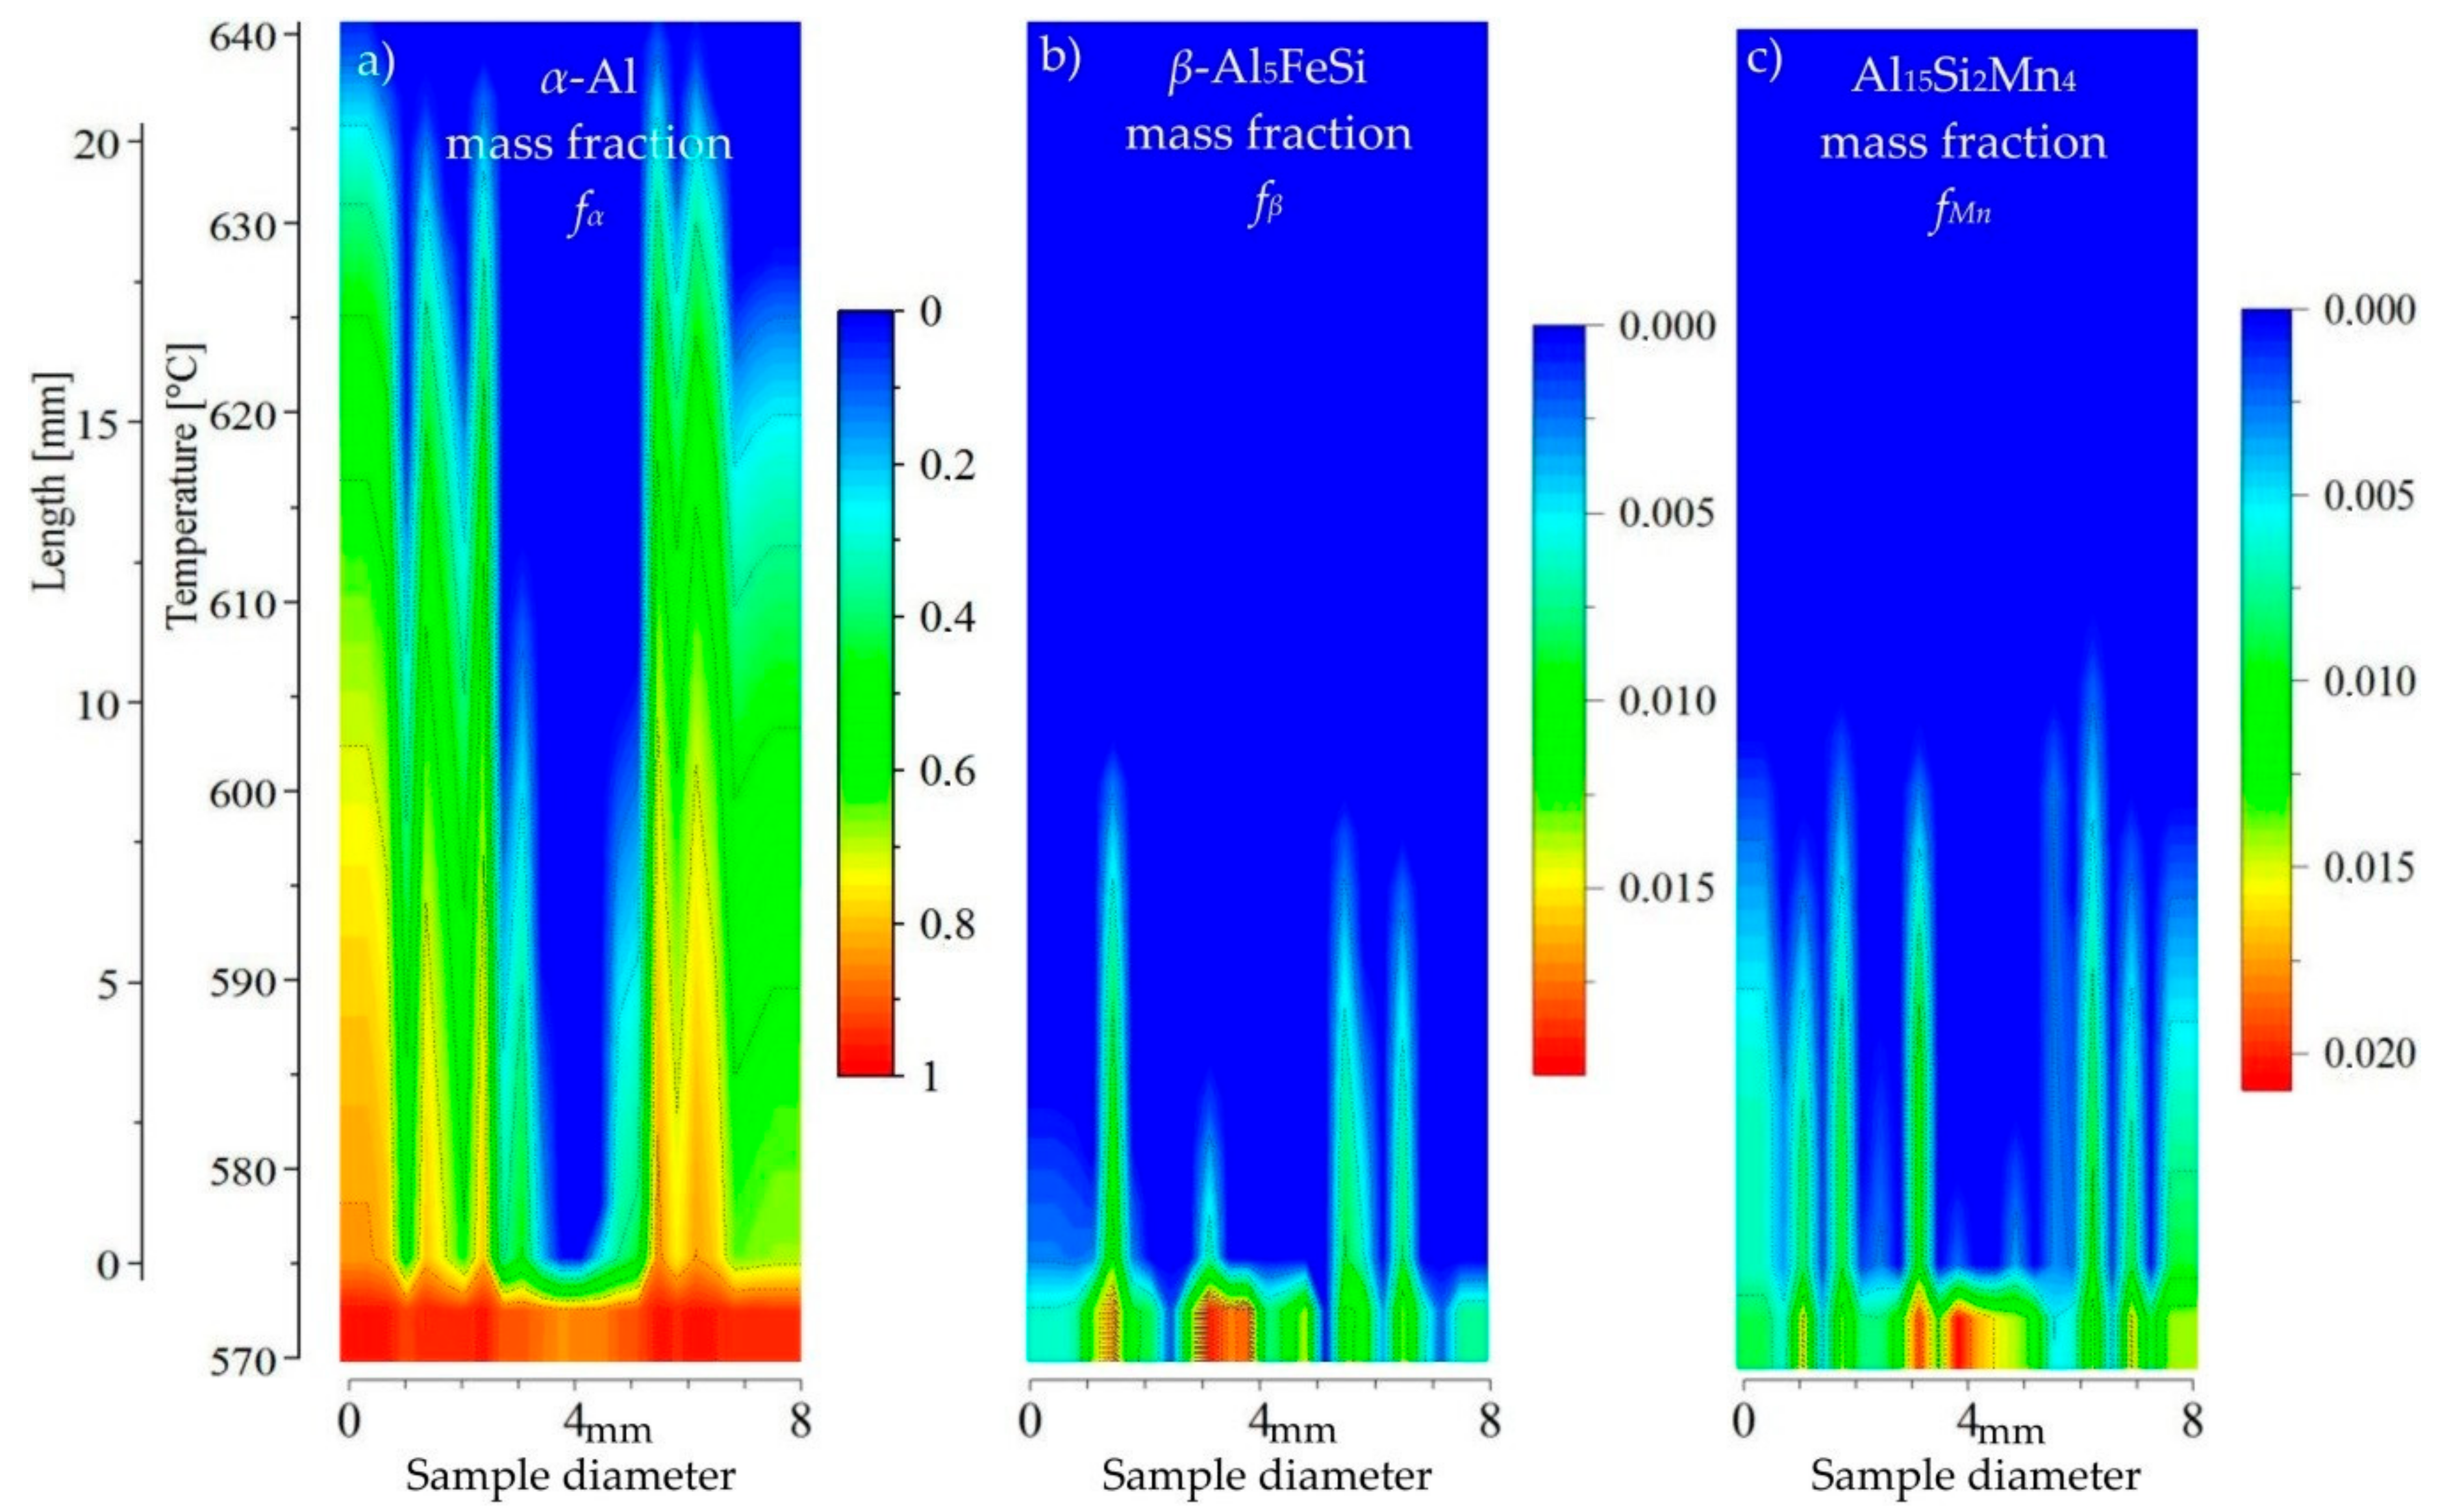
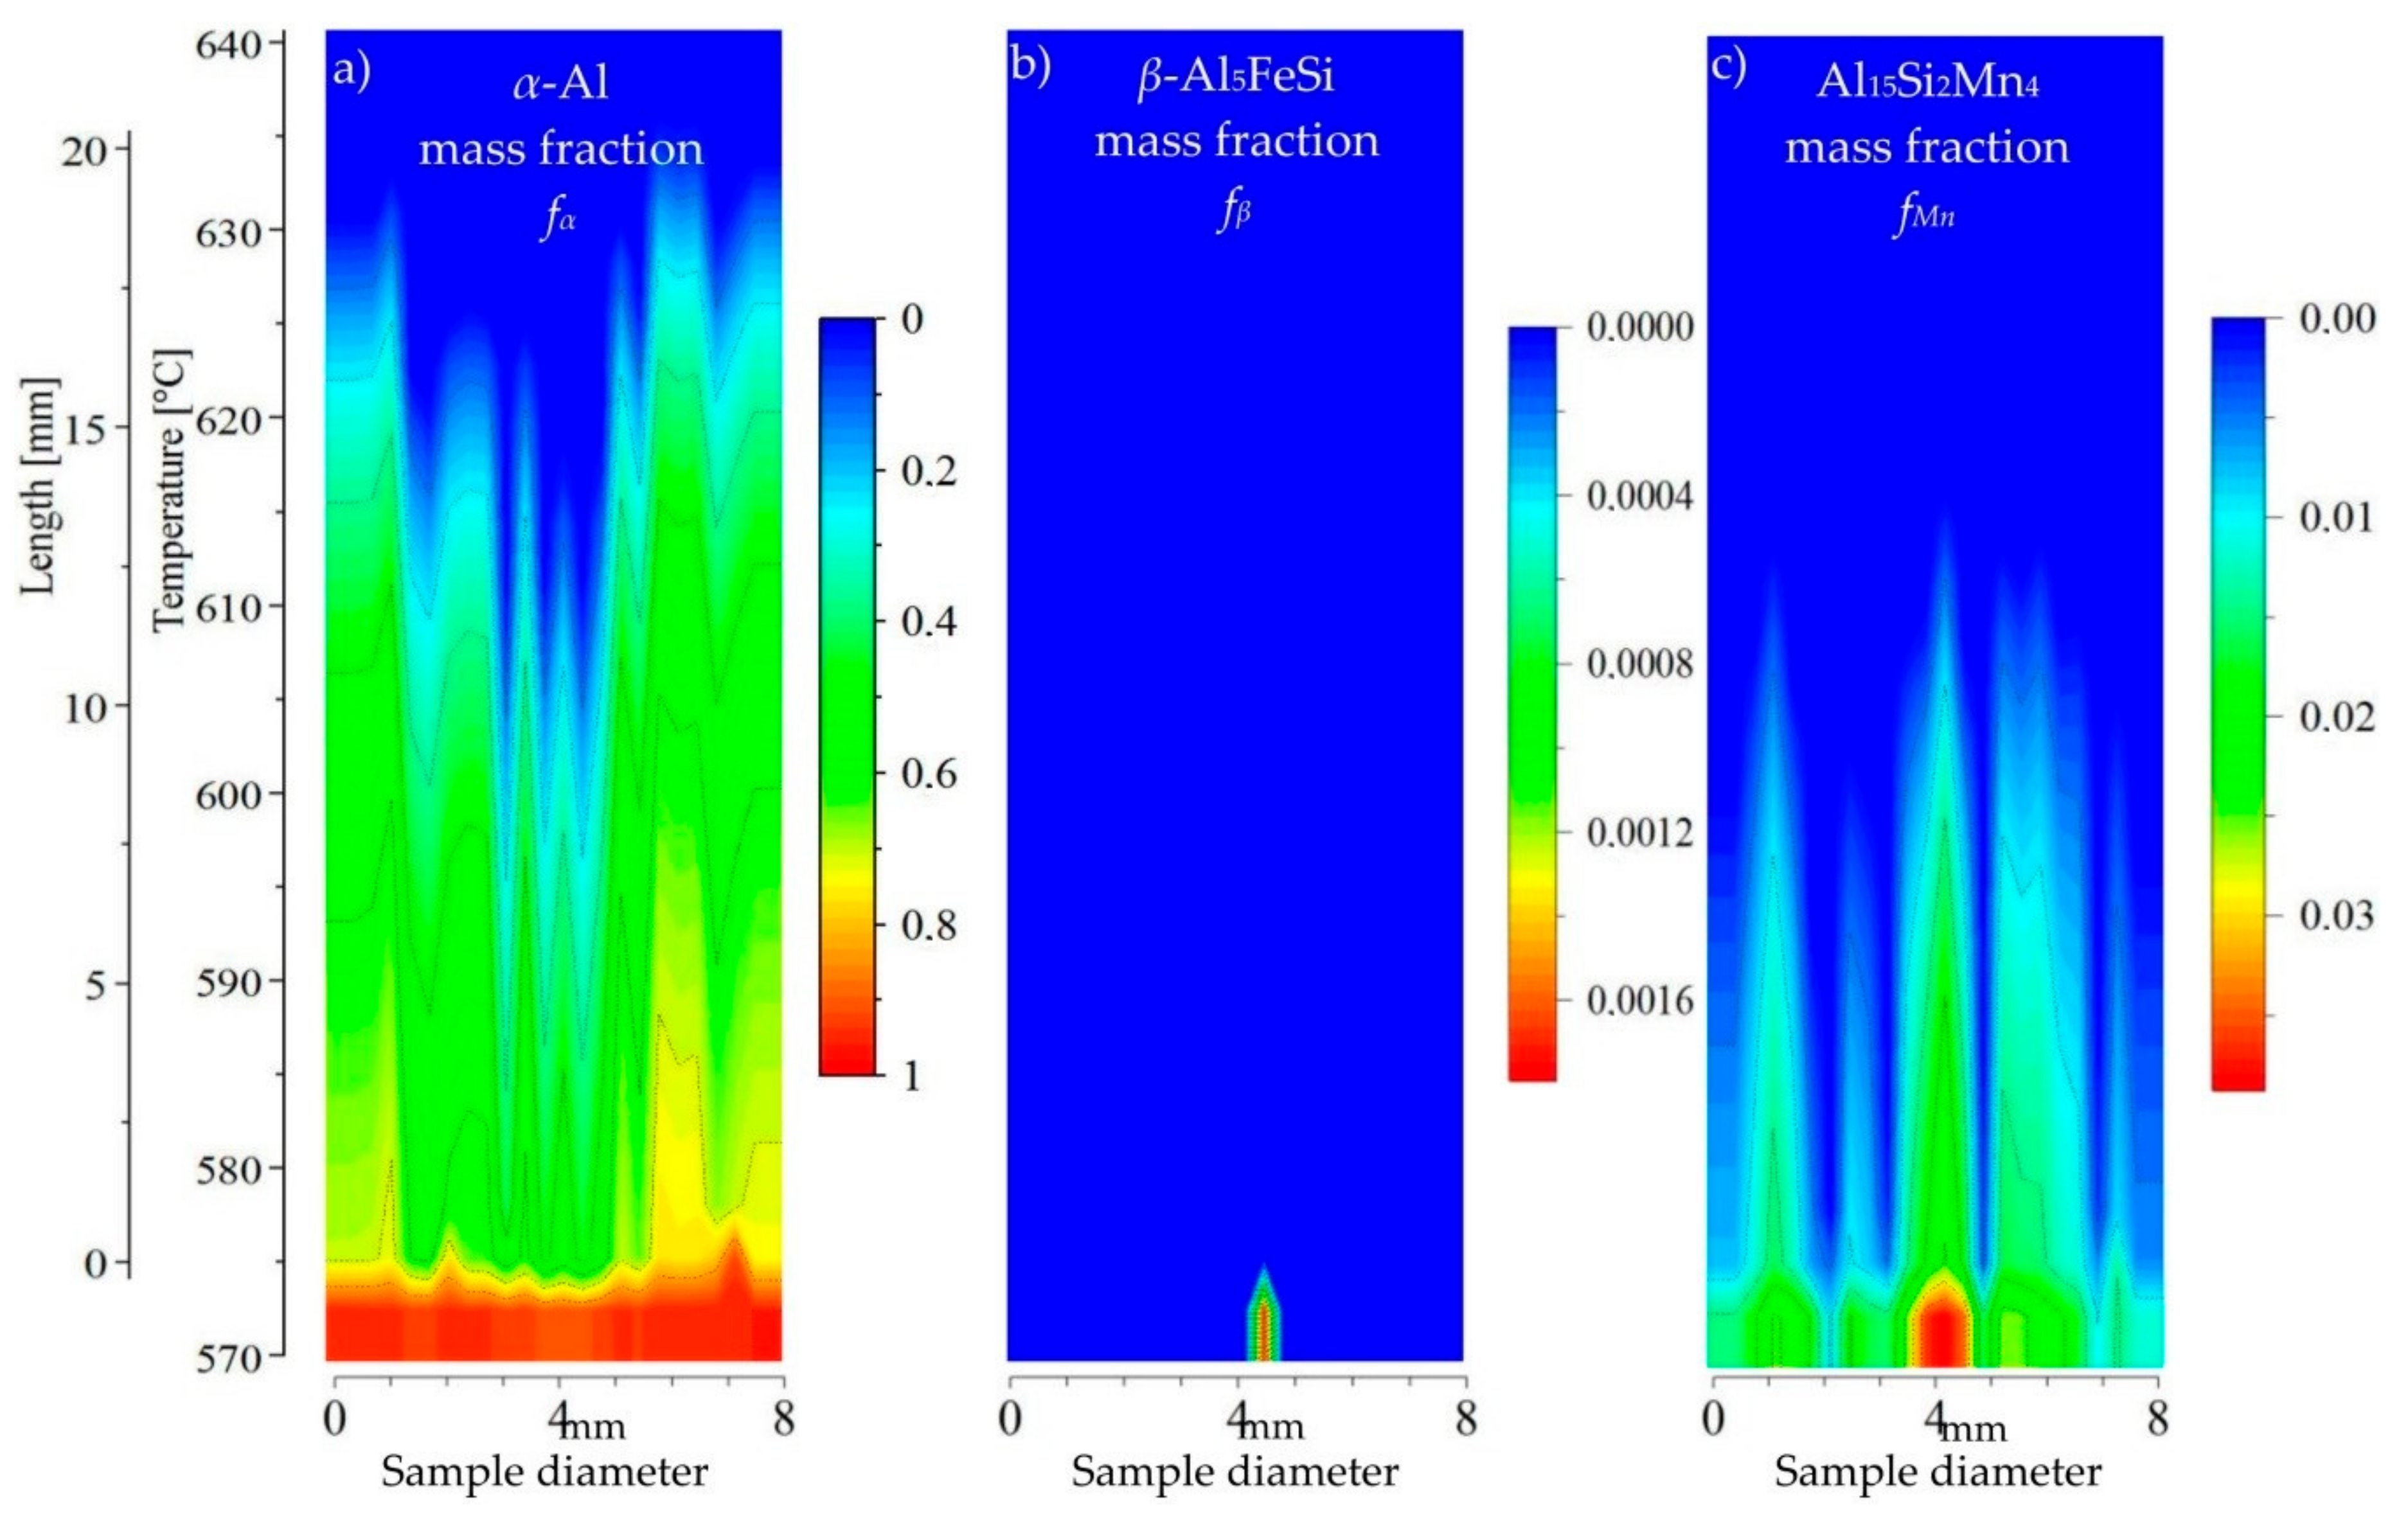
Figure 9) as well, dendrites start to grow first, but only in a narrow area of the liquid channel (600 °C) may Al
15Si
2Mn
4 precipitate in small amount. The presence of Mn has reduced the precipitation of
β and Mn-rich phases at least in the liquid channel. For AlSi5Fe0.4Mn0.2 (
Figure 10) the growth area of the dendrites is longer than for
β-Al
5FeSi and Al
15Si
2Mn
4 but with a wide and deep liquid channel. In that liquid channel Fe- and Mn-phases precipitate before dendrites, and it seems that they flow and may reach the liquid area above dendrites. For the AlSi5Fe0.4Mn1.0 (
Figure 11) specimen, 1% of manganese has strongly reduced precipitation of
β-Al
5FeSi and caused earlier precipitation of Mn-phases. At three points, Al
15Si
2Mn
4 precipitates before the dendrites in the liquid channel as well as above the
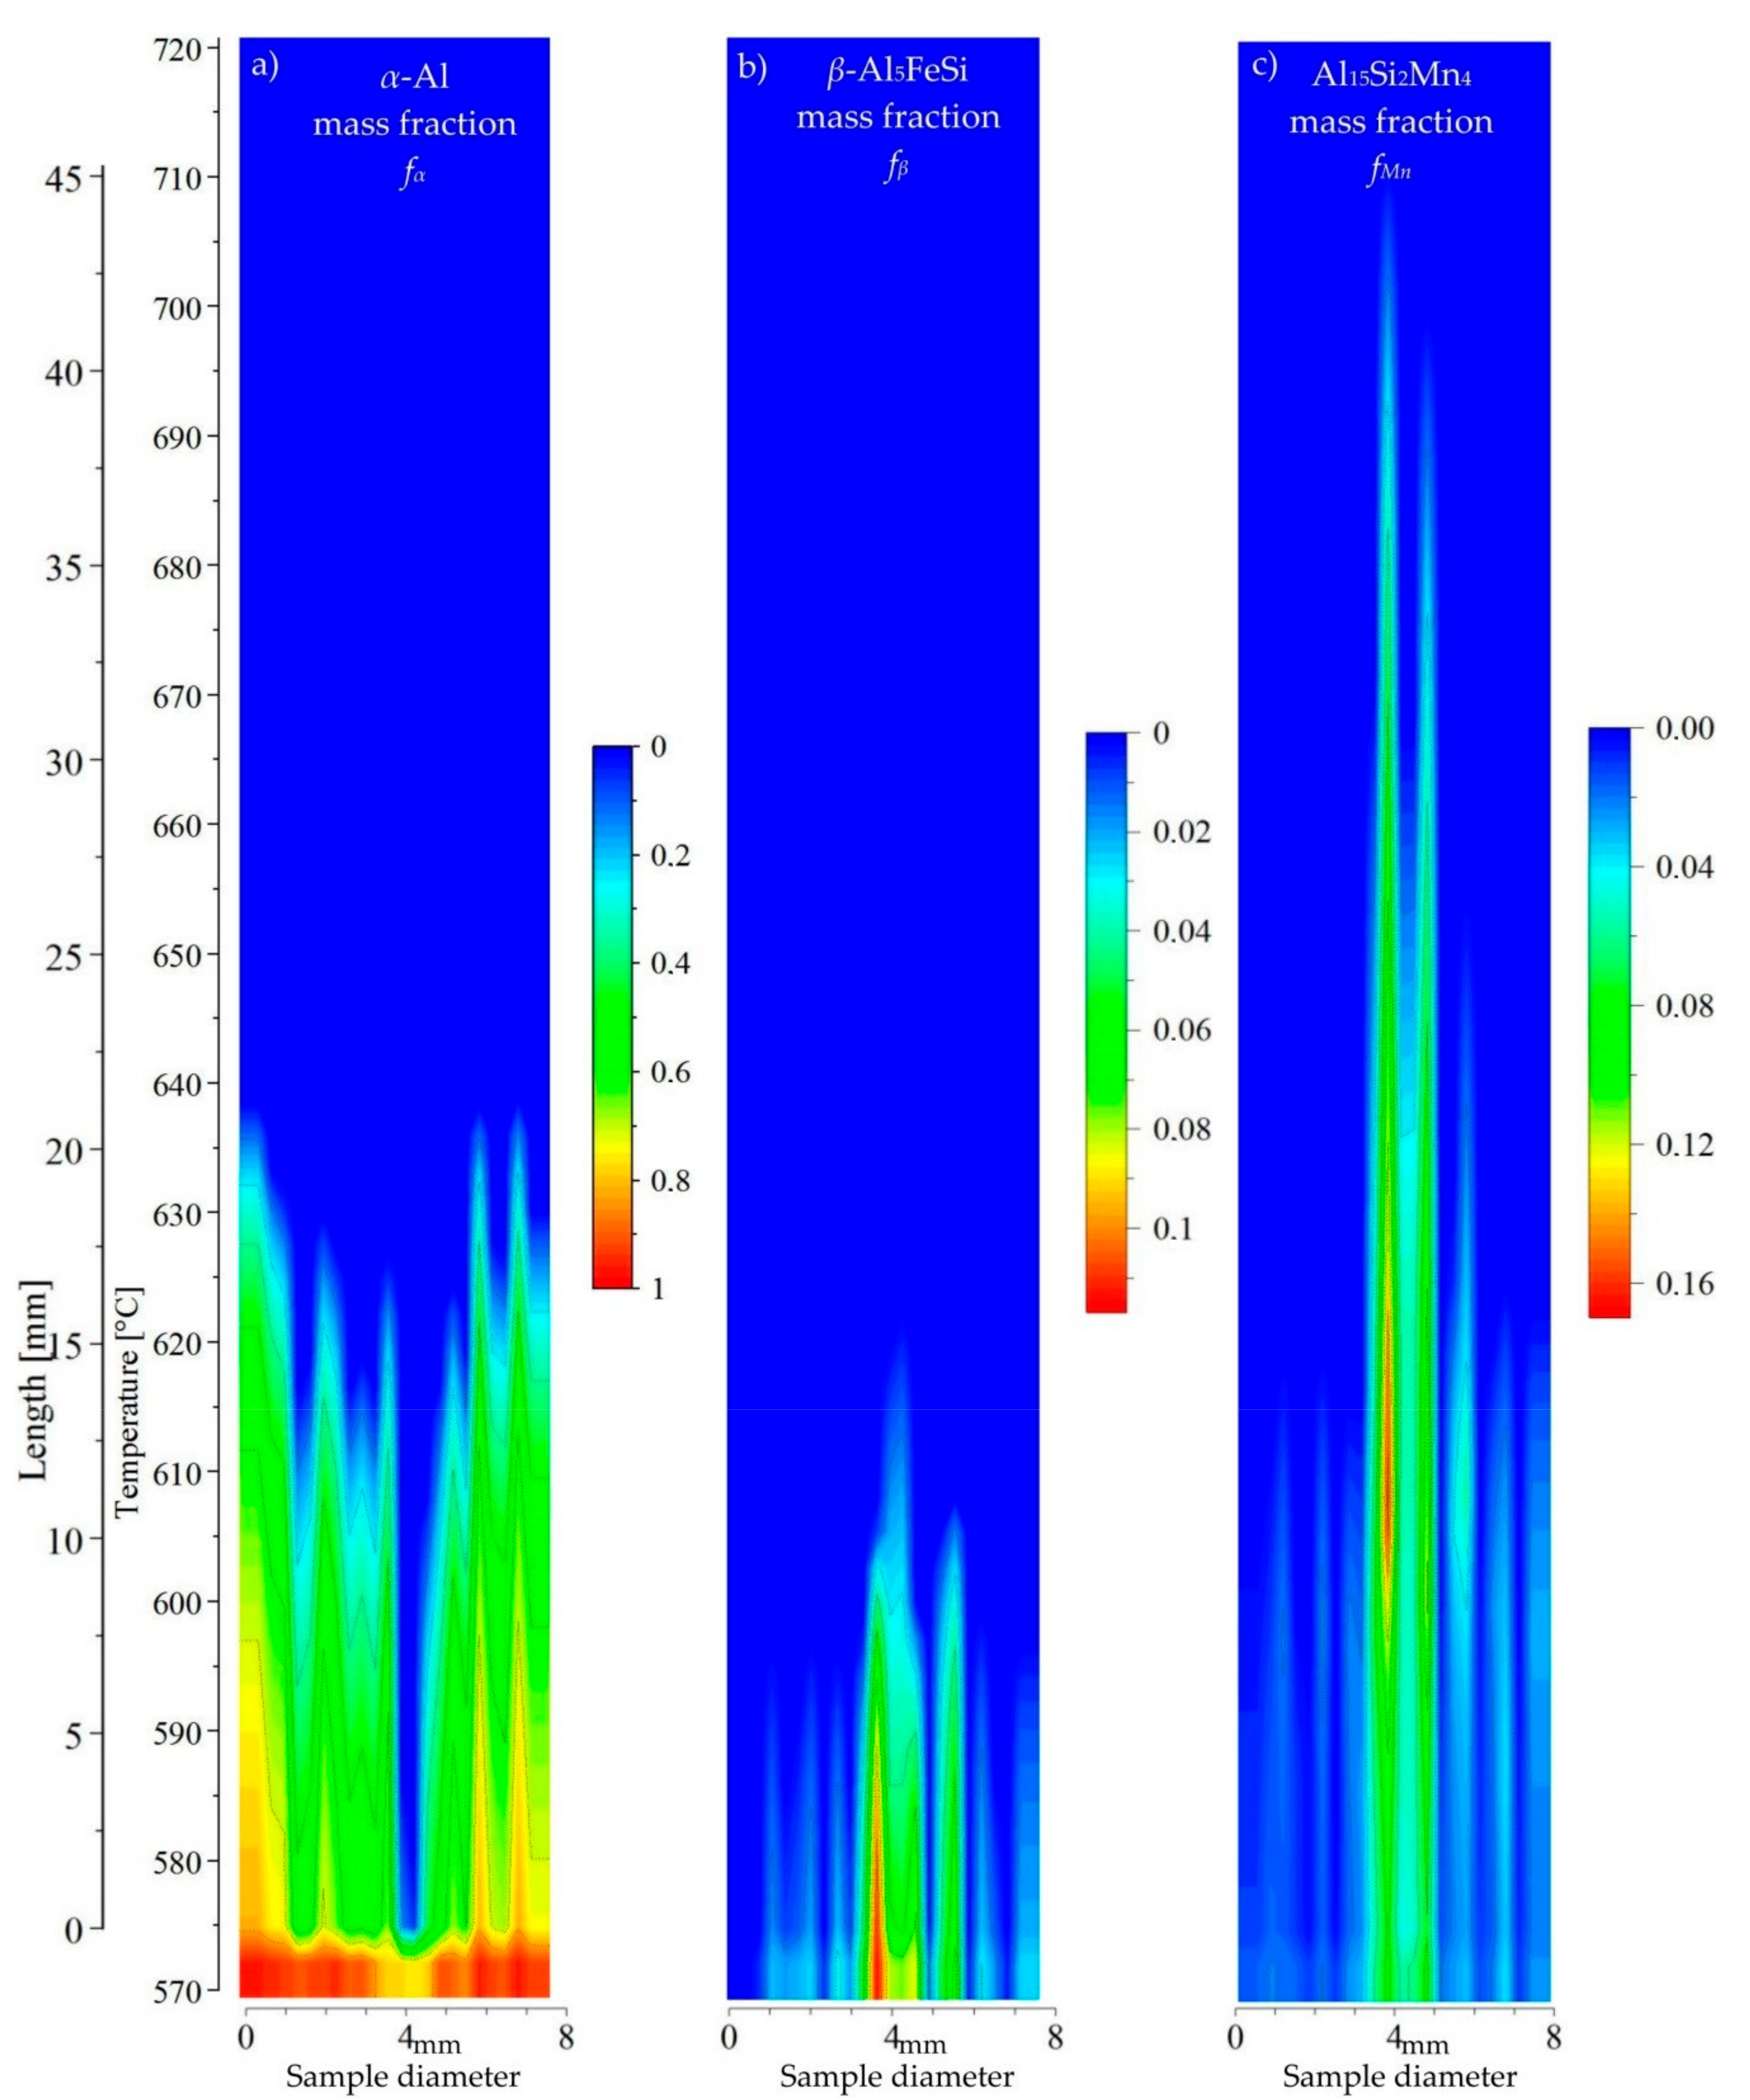
α-Al, and intermetallic phases may freely flow in the liquid area. For AlSi5Fe1.0Mn0.4 (
Figure 12), in the specimen center Mn-phases precipitate first in the liquid channel formed by the
α-Al dendrites; the
β phase regions appear second. In this way, Mn-phases may flow above the dendrites tips and in liquid channel Fe- and Mn-phases form, with the possibility of flowing into the liquid area above the
α-Al dendrites.
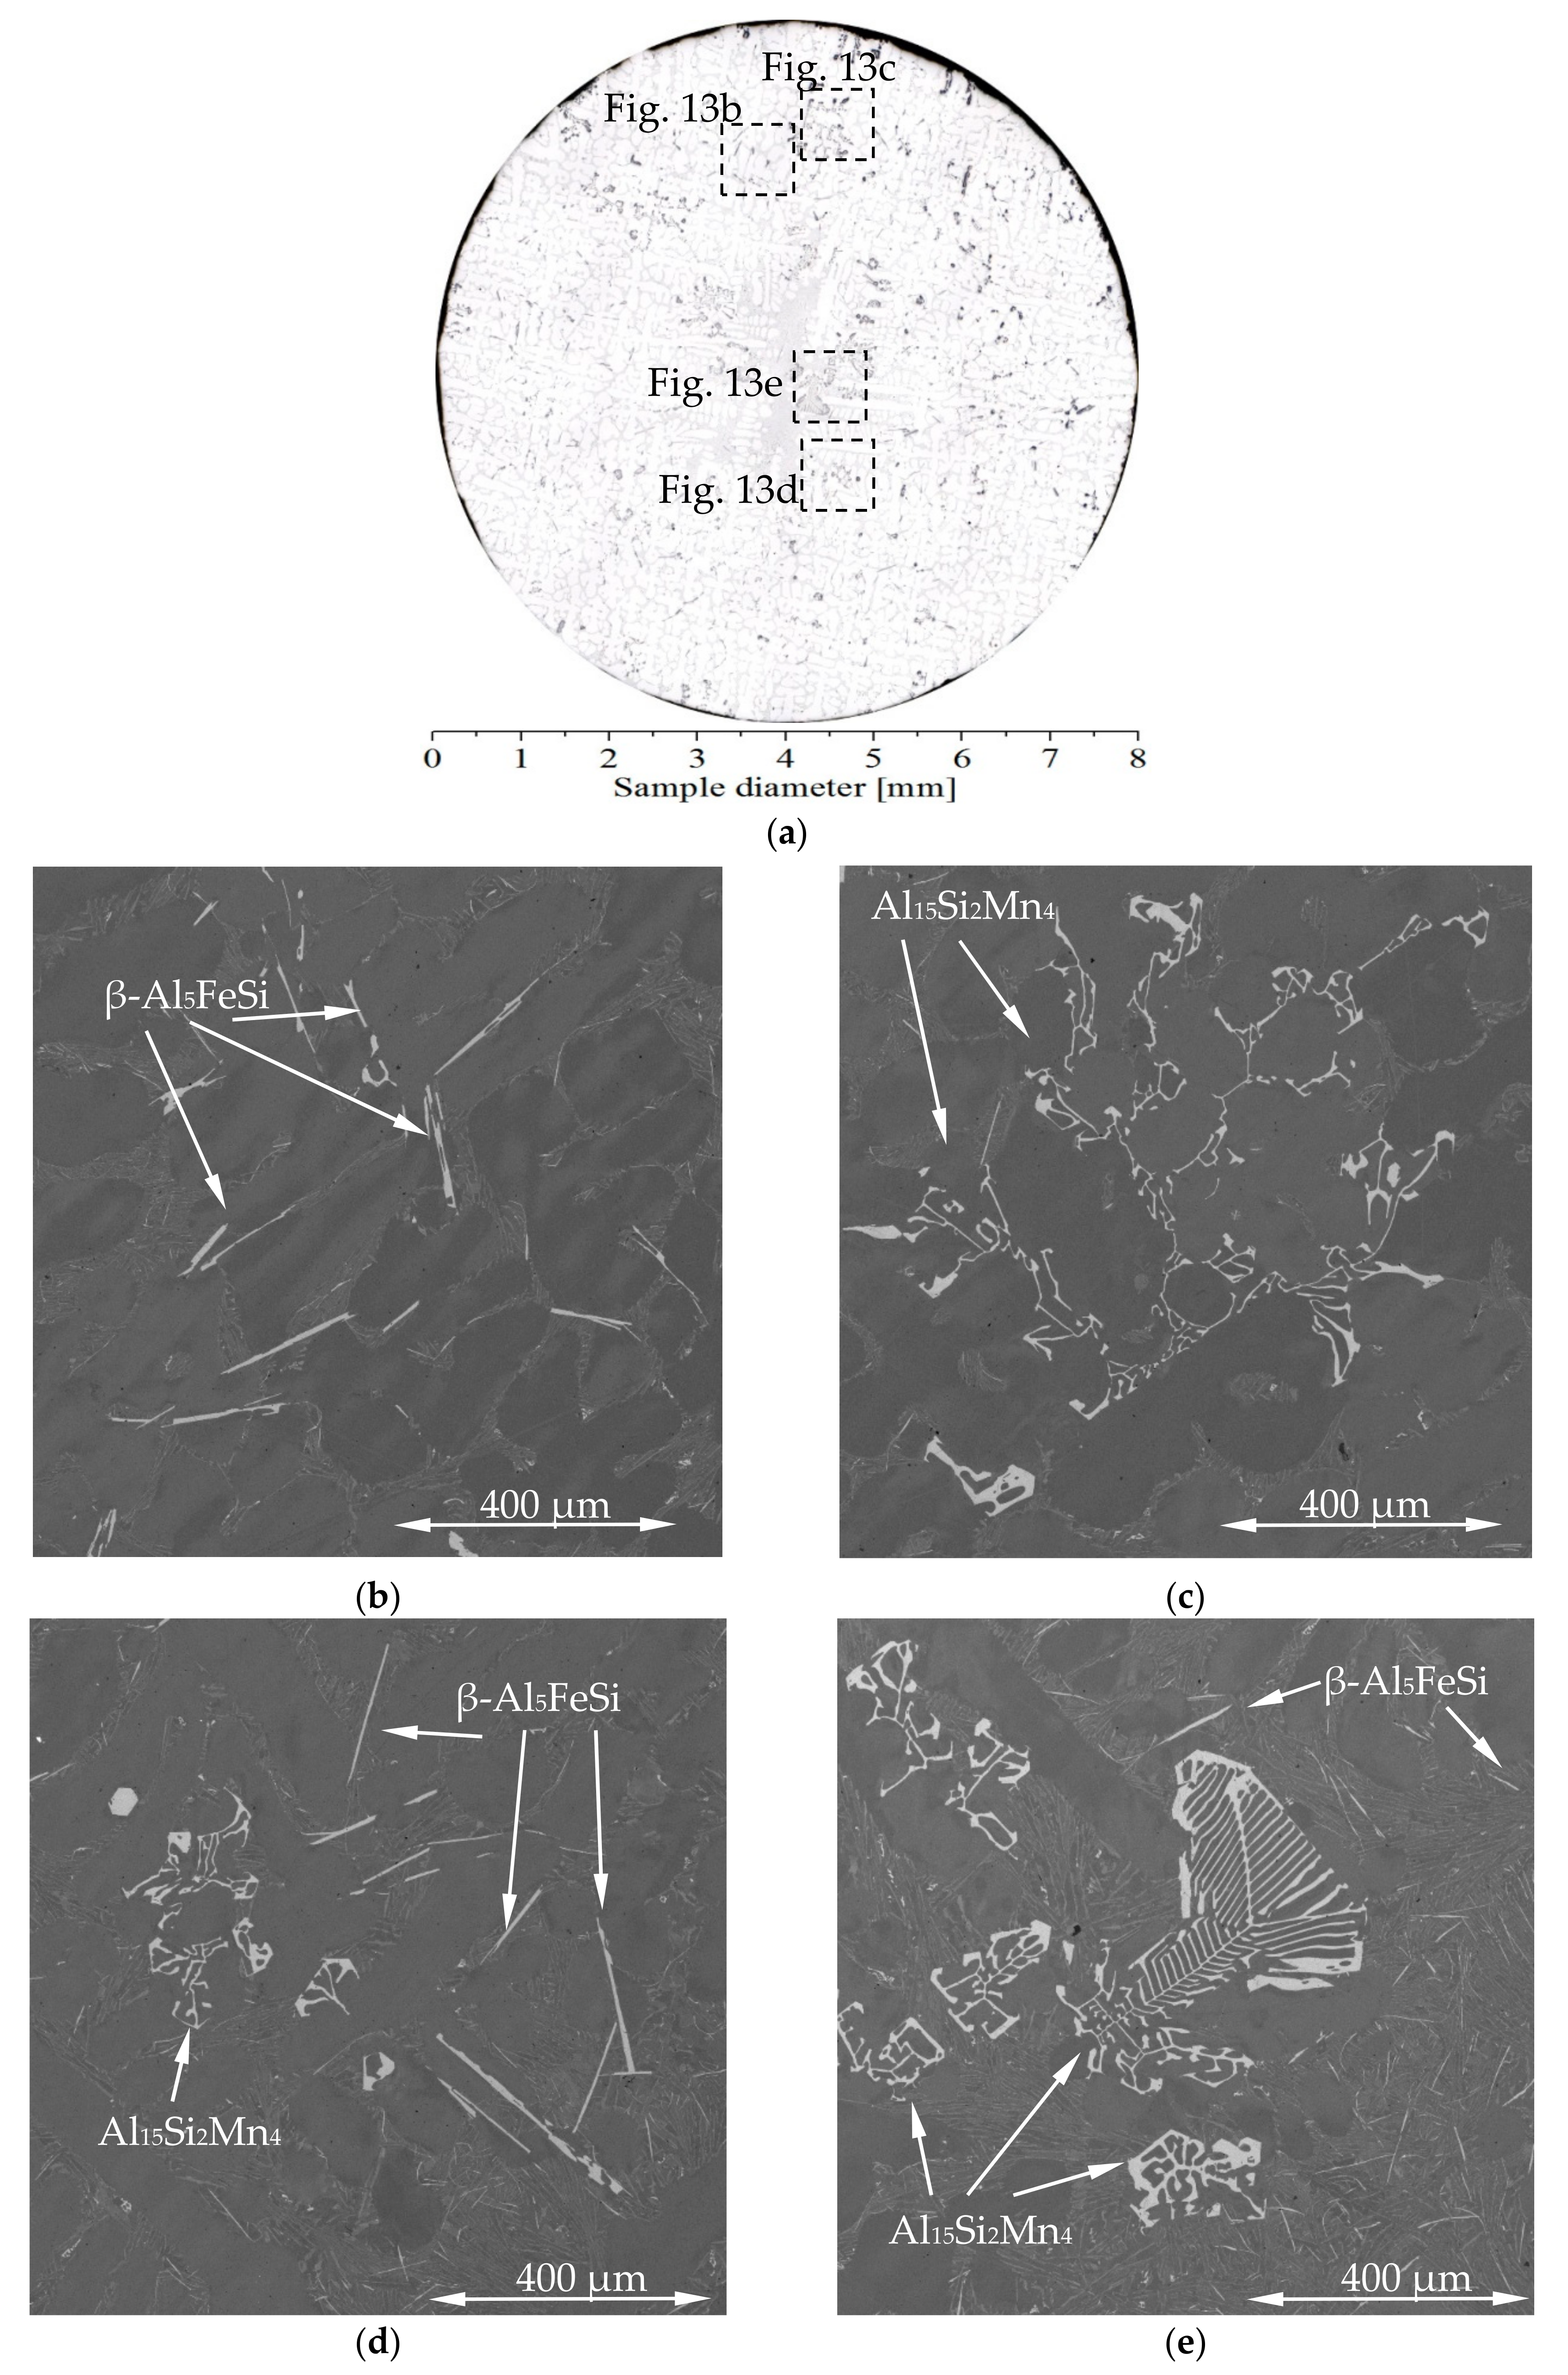
The possibility of Fe- or Mn-phases moving through the liquid depends strongly on the morphology and dimension of intermetallic Fe- and Mn-phases, and the differences in the shape are well visible on
Figure 13. Iron intermetallics form platelets [
22] with various dimensions from a few micrometers to 1 mm, while Mn-rich phases [
34] may take a shape ranging from compacted cubes (100 μm) to a large complex colony of cubes reaching above 1 mm. The fluidity of the solidifying melt might be decreased by the growth of other phases, e.g., Mg
2Si in Mg containing alloys [
35]. In current study by
G = 3 K/mm,
v = 0.04 mm/s and cooling rate
R = 0.12 K/s only crystalline phases are considered, but flow conditions can change significantly by glassy structure for some alloys like Pd
40Cu
30N
10P
20 [
36], where by also lower cooling rate (0.016 K/s, Table 4 in [
36]) amorphous phases can precipitate. Amorphous structure is the domain of highly undercooled bulk glassy complex alloys, but surprising also possible to obtain even with only two elements e.g., Zr
65Ni
35 [
37,
38].
In previous papers predictions of the mushy zone have been presented for AlSiFe [
31] and AlSiMn [
33] alloys. The comparison of the AlSi5Fe1.0 (Figure 11 in [
31]) and AlSi5Mn1.0 (Figure 11 in [
33]) showed that by the same 1% amount of Fe or Mn,
β-Al
5FeSi may precipitate only in the liquid channel (Figure 11 in [
31]), while Al
15Si
2Mn
4 may precipitate in the liquid channel and above dendrites tips (Figure 11 in [
33]). Similar observations apply to AlSi7Fe1.0 (Figure 12 in [
31]) and AlSi7Mn1.0 (Figure 12 in [
33]) only with a shorter mushy zone. The addition of Mn to AlSi5Fe1.0 (Figure 11 in [
31]) caused the formation of Al
15Si
2Mn
4 (
Figure 12, specimen AlSi5Fe1.0Mn0.4) in the liquid channel and between dendrites, while the area of
β-Al
5FeSi and
α-Al are parallel. The comparison of AlSi5Mn0.2 (Figure 9 in [
33]) and AlSi5Fe0.2Mn0.2 (
Figure 8) showed that the addition of 0.2% Fe has not caused the formation of a significant amount of
β because of the reduction in manganese. The formation of Mn-phases is similar in both specimens, but the dendritic area does not form such clear liquid channel (Figure 9 in [
33]) as in AlSi5Fe0.2Mn0.2 (
Figure 8).
The sample with AlSi5Fe0.4Mn0.2 (
Figure 10) in comparison to AlSi5Mn0.2 (Figure 9 in [
33]) showed this time that the addition of 0.4% Fe is enough to form
β phases and Al
15Si
2Mn
4 and due to the presence of the liquid channel, the flow of both intermetallics in channel and above the dendrites is possible. In AlSi5Mn0.2 (Figure 9 in [
33]) Mn phases form as the second phase between
α-Al, and intermetallics do not flow in liquid area. In the specimens AlSi5Mn1.0 (Figure 11 in [
33]) and AlSiFe0.4Mn1.0 (
Figure 11) the growth area for
α-Al dendrites has a similar temperature range (575–640 °C) and liquid channel. The addition of 0.4% Fe in the presence of 1% Mn has caused the formation of a very small amount of
β-Al
5FeSi. Manganese intermetallics precipitate in both specimens in the liquid channel and high above the dendrite tips. The presence of iron has caused the temperature range for Al
15Si
2Mn
4 growth to be about 710 °C for AlSi5Fe0.4Mn1.0 and 670 °C for AlSi5Mn1.0 (Figure 11 in [
33]), but the amount of intermetallics is smaller.
The mushy zone length varies according to the composition. The dendritic area is about 20 mm (575–635 °C) long for all specimens, but the whole predicted mushy zone differs according to Fe and Mn content. According to [
39], the flow by rotating electromagnetic field 3 mT in axial direction may enclose the mushy length on 12 mm and flow velocities in axial direction 2.5 mm/s, while in the current experiment the applied field of 6 mT may cause a velocity of 10.5 mm/s. It seems that these velocities concern only about 12 mm area, but the flow generated by the field also propagates outside it and may cause stirring in that region. There is no indication that increased flow velocities and more intensive rotation (of liquid alloy and flowing solid precipitates) resulting from increased field strength (from 3 to 6 mT) may point on the longer area with included stirring.
In our analysis we considered there to be a fixed composition along the sample length, and of course the changes occurring across sample diameter presented by EDS measurements. However, fluid flow may change composition due to segregation. The almost constant chemical composition along sample length in similar studies [
40] was presented for AlSi7Fe1.0 alloy (120 mm long and 8 mm diameter specimens) solidified directionally without stirring. The segregation was found both across and along the sample for experiments with temperature gradient 7 K/mm and high rotating magnetic field (HRMF) of 150 mT. From the specimen beginning (coordinate 1 mm, 2.5 wt. % Si and 0.6 wt. % Fe), the amount of alloying elements increased almost linearly to the sample end (coordinate 100 mm, 12.8 wt. % Si and 1.7 wt. % Fe). Considering similar changes, by the length of our dendritic area (about 20 mm), between 575 °C isoline and dendrite tips, the Si content might increase to about 1.2 wt. %. Such changes might move the composition on the Al-Si-Fe (
Figure 3a) or on the Al-Si-Mn (
Figure 3b) phase diagram (
Figure 3) to the right, and the 7 °C decrease of liquidus and might cause dendrites to be about 2.3 mm shorter and the liquid channel to be slightly wider. Because solidification by HRMF [
40] were carried out with 150 mT and current studies by RMF only 6 mT, it can be stated that results presented here would be much less than a 10% reduction, as an effect of segregation across the sample diameter.
The main cause for the liquid channel is segregation of Si and results are similar to [
23,
31,
33]. The segregation of Mn and Fe is not so uniform as in Fe-containing AlSi alloys [
31]. Specimens with iron and manganese show slightly irregular values across the sample, with some enrichment in the center (e.g., AlSi5Fe1.0Mn0.4), but also near the outside (e.g., AlSi5Fe0.2Mn0.2). The morphologies of platelet-shaped
β-Al
5FeSi and complex Mn-rich intermetallics seems to be the primary factor influencing the enrichment in the center and some outside [
34].
α-Al dendrites form a skeleton structure with a liquid channel in the center. By the time the mass fraction reaches about
fα = 0.9, the dendrites may stay fixed in the fully solidified bottom part of the specimen and not move. Fe- and Mn-phases with dimensions about 0.001–2 mm and mass fraction 0.0–0.15 do not form an immovable structure. Especially the results for Mn-phase precipitating above the dendrites tips and seen on the 2D map figures as high vertical pillars, present only a probability of the intermetallics location and not the stable frame. The shape, density and location of phases (
α-Al,
β, Al
15Si
2Mn
4) are factors strongly determining permeability of mushy zone and the fluid flow that occurred should be analyzed carefully.

