Article

Crystal Plasticity Modeling and Experimental Validation with an Orientation Distribution Function for Ti-7Al Alloy

Aerospace Engineering, University of Michigan, Ann Arbor, MI 48109, USA
*
Author to whom correspondence should be addressed.
Metals 2017, 7(11), 459; https://doi.org/10.3390/met7110459
Submission received: 31 August 2017 / Revised: 23 October 2017 / Accepted: 24 October 2017 / Published: 28 October 2017
(This article belongs to the Special Issue Microstructure based Modeling of Metallic Materials)

Abstract

:
An orientation distribution function based model is used for micromechanical modeling of the titanium-aluminum alloys, Ti-0 wt % Al and Ti-7 wt % Al, which are in demand for many aerospace applications. This probability descriptor based modeling approach is different than crystal plasticity finite element techniques since it computes the averaged material properties using upper bound averaging. A rate-independent single-crystal plasticity model is implemented to compute the effect of macroscopic strain on the polycrystal. An optimization problem is defined for calibrating the basal, prismatic, pyramidal slip system and twin parameters using the available tension and compression experimental data. The crystal plasticity parameters of Ti-7 wt % Al are not studied extensively in literature, and therefore the optimization results for the crystal plasticity model realization produce unique data, which will be beneficial to future studies in the field. The sensitivities of the slip and twin parameters to the design objectives are also investigated to identify the most critical slip system parameters. Using the optimum design parameters, the microstructural textures, during the tension test, are predicted by the crystal plasticity finite element simulations, and compared to the available experimental texture and scanning electron microscope—digital image correlation data.

1. Introduction

Integrated Computational Materials Engineering (ICME) (Allison et al. [1]) models for titanium alloys are essential for understanding the effect of crystal plasticity parameters to micromechanical modeling and engineering outputs. Some of the modeling efforts concentrate on discrete aggregate models based on finite element (FE) analysis or Taylor models [2,3,4,5,6]. Discrete aggregate models are slower since grains are explicitly sampled. Instead, texture can be interpolated over an orientation space without modeling grains. Some of the newer studies quantify the microstructure with probability descriptors [7,8,9,10,11,12,13,14,15,16,17,18,19,20] such as the orientation distribution function (ODF), which is faster and better suited, particularly for the optimization of crystal plasticity parameters (the 20 parameters in this work). The microstructure modeling in the present work is also based on the ODF representation. The ODF based crystal plasticity model is different than the conventional crystal plasticity FE since it predicts the features using an upper bound averaging. The present work addresses the inverse problem of identifying the optimum slip system parameters of Ti-Al alloys (Ti-0 wt % Al (Ti-0Al) and Ti-7 wt % Al (Ti-7Al)) given the experimental tension and compression stress-strain data. The ODF represents the volume fractions of the crystals of different orientations in the microstructure. It is defined based on a parameterization of the crystal lattice rotation. Popular representations include Euler-angles [21,22] and classes of angle-axis representations, with the most popular being the Rodrigues parameterization [23]. Conversion of continuous orientation space to finite degrees of freedom requires discretization techniques. Discretization schemes either focus on a global basis (e.g., Fourier space or spherical harmonics [11,12,13]) or a local basis using an FE discretized Rodrigues space with polynomial shape functions defined locally over each element [24,25]. Kalidindi et al. [11,12,13] employ sampling within the property hull similar to this work, but employ a Fourier basis for discretizing the ODF. However, the Fourier/spectral methods cannot represent sharp textures due to the use of a global basis.
One important aspect in modeling is to determine which slip systems are active during tension and compression tests. The number of the slip systems determines the design variables here since the optimization is performed for the parameters of all active slip systems. Metals having a hexagonal close-packed (HCP) crystal structure, such as titanium (Ti), are expected to display easy < a > slip, either on the prismatic or basal plane [26]. The observed slip systems in pure HCP titanium (HCP-Ti) are the three equivalent basal 0001 < 11 2 ¯ 0 > , three equivalent prismatic 10 1 ¯ 0 < 11 2 ¯ 0 > and six equivalent pyramidal 10 1 ¯ 1 < 11 2 ¯ 0 > slip systems [27]. All these three slip systems share a common slip direction, < 11 2 ¯ 0 > , or < a > . The slip on these basal, prismatic and pyramidal slip systems is denoted as < a > -slip. In order to accommodate a strain that is parallel to the c-axis of the hexagonal system other slip or twinning deformation modes are required. One of these additional modes slips on pyramidal planes with < 11 2 ¯ 3 > , or < c + a > slip directions [27]. In addition, twinning is commonly observed in Ti and other metals with an HCP crystal structure, and it has a strong effect on the overall behavior of a polycrystal material [27]. The deformation behavior of HCP-Ti and Ti alloys has been studied in literature extensively [26,27,28,29,30,31,32,33]. These studies revealed that the Ti alloys have complex slip and twinning modes. These complexities are mostly because of the crystallographic nature of the alpha ( α ) phase and addition of alloying elements such as Aluminum (Al) [28]. The effect of Al is not fully understood yet since there is still an ongoing debate in literature about the effect of Al to twinning [28,29,30,31,32,33]. Some references claim that Al addition is effective in suppressing twinning [28,29,30]. Williams et al. [28] observed that the frequency of twinning rapidly decreases when the Al content increases to 5% and 6.6% from 1.4% and 2.9%, respectively. They found the compression twins to be very difficult to nucleate in Ti-Al single crystals when the Al content is more than 5 wt %. Khan et al. [31] discussed that the Ti-Al alloy with 6 wt % Al does not twin even at temperatures as low as 100 K. On the other hand, some references [26,32,33] claim that Al addition has an increasing effect up to a peak level and then after this point the further Al addition suppresses the twinning effect. Fitzner et al. [33] performed a detailed experimental study to investigate the effect of Al addition to twinning activity in Ti-Al alloys, and they found that at around 7 at % Al there is a turning point in twinning activity and a further increase in Al reduced the twinning activity because of short range ordering and signs of Ti3 Al formation in case of the highest Al content they observed (13 at %). They discussed the 10 1 ¯ 2 < 1 ¯ 011 > tensile twin and concluded that it provides a near 90 degrees rotation of the c-axis from a tensile to a compressive stress condition, and increases the intensity of basal texture during compression loading. The authors also analyzed the EBSD data and observed an increasing fraction of 10 1 ¯ 2 < 1 ¯ 011 > twins until 7 at % Al, which then drops suddenly with further Al addition. As a secondary twinning mode 4% of 11 2 ¯ 2 < 11 2 ¯ 3 ¯ > compression twins were observed, only in the Ti-0Al case. Due to the small effect of the secondary twinning mode, only the 10 1 ¯ 2 < 1 ¯ 011 > twin mechanism is considered in this study when modeling the Ti-Al alloys.
The present work introduces the ODF based methodology using a local basis [34] and focuses on an inverse problem for crystal plasticity modeling of Ti-Al alloys (Ti-0Al and Ti-7Al) using the technique. The single crystal constitutive model presented by Anand and Kothari [35] is used to model the crystal plasticity of the microstructure, and the ODF evolution is modeled using a conservation equation. The crystal plasticity parameters are computed using an inverse problem. The objective of this problem is to match the global tensile and compression stress-strain curve behavior, which is known through experiments, and the model is validated by comparing against experimentally measured ODFs after compression. Compared to the other alloys, such as Ti-6Al-4V [36,37,38], the parameters of Ti-7Al are not studied extensively in literature. Therefore the optimization results for the crystal plasticity model realization produce unique data, which will be beneficial to future studies in the field. The sensitivities of the optimum variables to the design objectives are also investigated to identify the most critical slip system parameters. The microstructural textures during the tension test are predicted by the crystal plasticity finite element (CPFE) simulations inputting the optimum slip system and twin parameters, and are compared to the available experimental texture and scanning electron microscope (SEM)—digital image correlation (DIC) data. The organization of the paper is as follows. Section 2 briefly introduces the ODF approach, probability update and the rate independent single crystal constitutive model. The optimization problem is defined for the slip system parameters identification of Ti-0Al and Ti-7Al, and the optimum results are discussed in Section 3. A sensitivity analysis is performed to analyze the optimum design variables, and the results are presented in Section 3. Next, the optimum parameters are used to predict the microstructural texture during the compression test, and the additional CPFE and SEM-DIC comparison is performed with the optimum design parameters of Ti-7Al. A summary of the paper is given in Section 4.

2. Multi-Scale Modeling of Microstructures

This section discusses the crystal plasticity modeling framework, which is based on the ODF approach. Crystal plasticity modeling with the ODF approach is an efficient alternative to computationally expensive FE methods. The ODF, denoted by A ( r ) , is a one-point probability measure, which quantifies the volume fractions of the crystals in the orientation space, r. The ODF is defined based on a parameterization of the crystal lattice rotation. In this study, an FE technique was implemented to discretize the ODFs over the Rodrigues space. This is based on the unique association of an orientation with a rotation axis, and an angle of rotation about the axis. The computation procedure for the ODF representation and material property matrices using the volume averaging approach can be found in details in our earlier works [7,8,9].
When deformed, the ODF changes due to reorienting of grains. The probabilities are evolved from time t = 0 , corresponding to an initial ODF, which is defined to represent a random texture (all the ODF values are equal to each other) in this paper. The initial orientation r o of a crystal reorients during deformation and maps to a new orientation r t at time t. The evolution of the ODF is given by the conservation equation, and more details about this procedure can be found in [39]. In this work, a rate-independent single-crystal plasticity model developed and, in Anand and Kothari [35], is used to compute the effect of macroscopic strain on the polycrystal. The details about the single crystal plasticity model, as well as its implementation to the ODF approach, can be found in details in [35,40].
The slip system hardening model used in the calibration study is given below:
h α β = [ q + ( 1 q ) δ α β ] h β ( no   sum   on   β )
where h β is a single slip hardening rate, q is the latent-hardening ratio and δ α β is the Kronecker delta function. The parameter q is taken to be 1.0 for coplanar slip systems and 1.4 for non-coplanar slip systems. For the single-slip hardening rate, the following specific form is adopted:
h β = h o ( 1 s β s s ) a
where h o , a, and s s are slip hardening parameters. The ODF model is examined for tensile and compression stress-strain behavior of Ti-0Al and Ti-7Al alloys. Basal < a > , prismatic < a > , pyramidal < a > and pyramidal < c + a > slip systems are modeled as well as the 10 1 ¯ 2 < 1 ¯ 011 > twinning mechanism. The elastic parameters are taken as [41]: C 11 = C 12 = 175 GPa, C 33 = 220 GPa, C 12 = 88 . 7 GPa, C 13 = C 23 = 62 . 3 GPa, C 44 = C 55 = 62 . 2 GPa, and C 66 = ( C 11 C 12 ) / 2 .

3. Optimization for Slip System Parameters Identification of Ti-Al Alloys

The fundamental goal of this study is to identify the slip system parameters of Ti-Al alloys, Ti-0Al and Ti-7Al, using crystal plasticity modeling with the ODF approach. For this study, a genetic algorithm, Non-Dominated Sorting Genetic Algorithm (NSGA-II) [42], is implemented with a global sampling method, Incremental Space Filler (ISF) [43], to calibrate the computational model according to the available experimental data. The optimization is performed to identify 20 design variables, which are four slip system parameters ( s 0 , h 0 , s s and a) of five different slip systems taken into consideration. These slip systems are basal < a > , prismatic < a > , pyramidal < a > and pyramidal < c + a > as well as the 10 1 ¯ 2 < 1 ¯ 011 > twinning mechanism (please note that the reorientation is not modeled). The optimization problem is defined similarly for both alloys, and the objective functions are determined to minimize the L 2 norm errors between the true stress - true strain curves of the experimental data and ODF simulation for both tension and compression tests. The slip system parameters, which are obtained by Salem et al. [44] for basal < a > , prismatic < a > , pyramidal < a > , pyramidal < c + a > slip systems and twinning, are used to define the lower bounds of the optimization variables. The initial texturing of the material is assumed to be random. The mathematical formulation of the multi-objective optimization problem is given below:
m i n ϵ t , m i n ϵ c
s = ( s 0 , h 0 , s s , a )
In Equation (3), ϵ t and ϵ c show the L 2 norm errors between true stress points of the experimental data and ODF simulation for tension (denoted by t) and compression (denoted by c) tests. The experimental data is available up to 15 % strain, and therefore the ODF simulations are performed for the same strain level. The strain rate is defined as 2 . 5 × 10 4 , and a quadratic interpolation is implemented to match the experimental and computational strain points. In Equation (4), s shows the vector representation of 20 optimization variables for five slip systems.

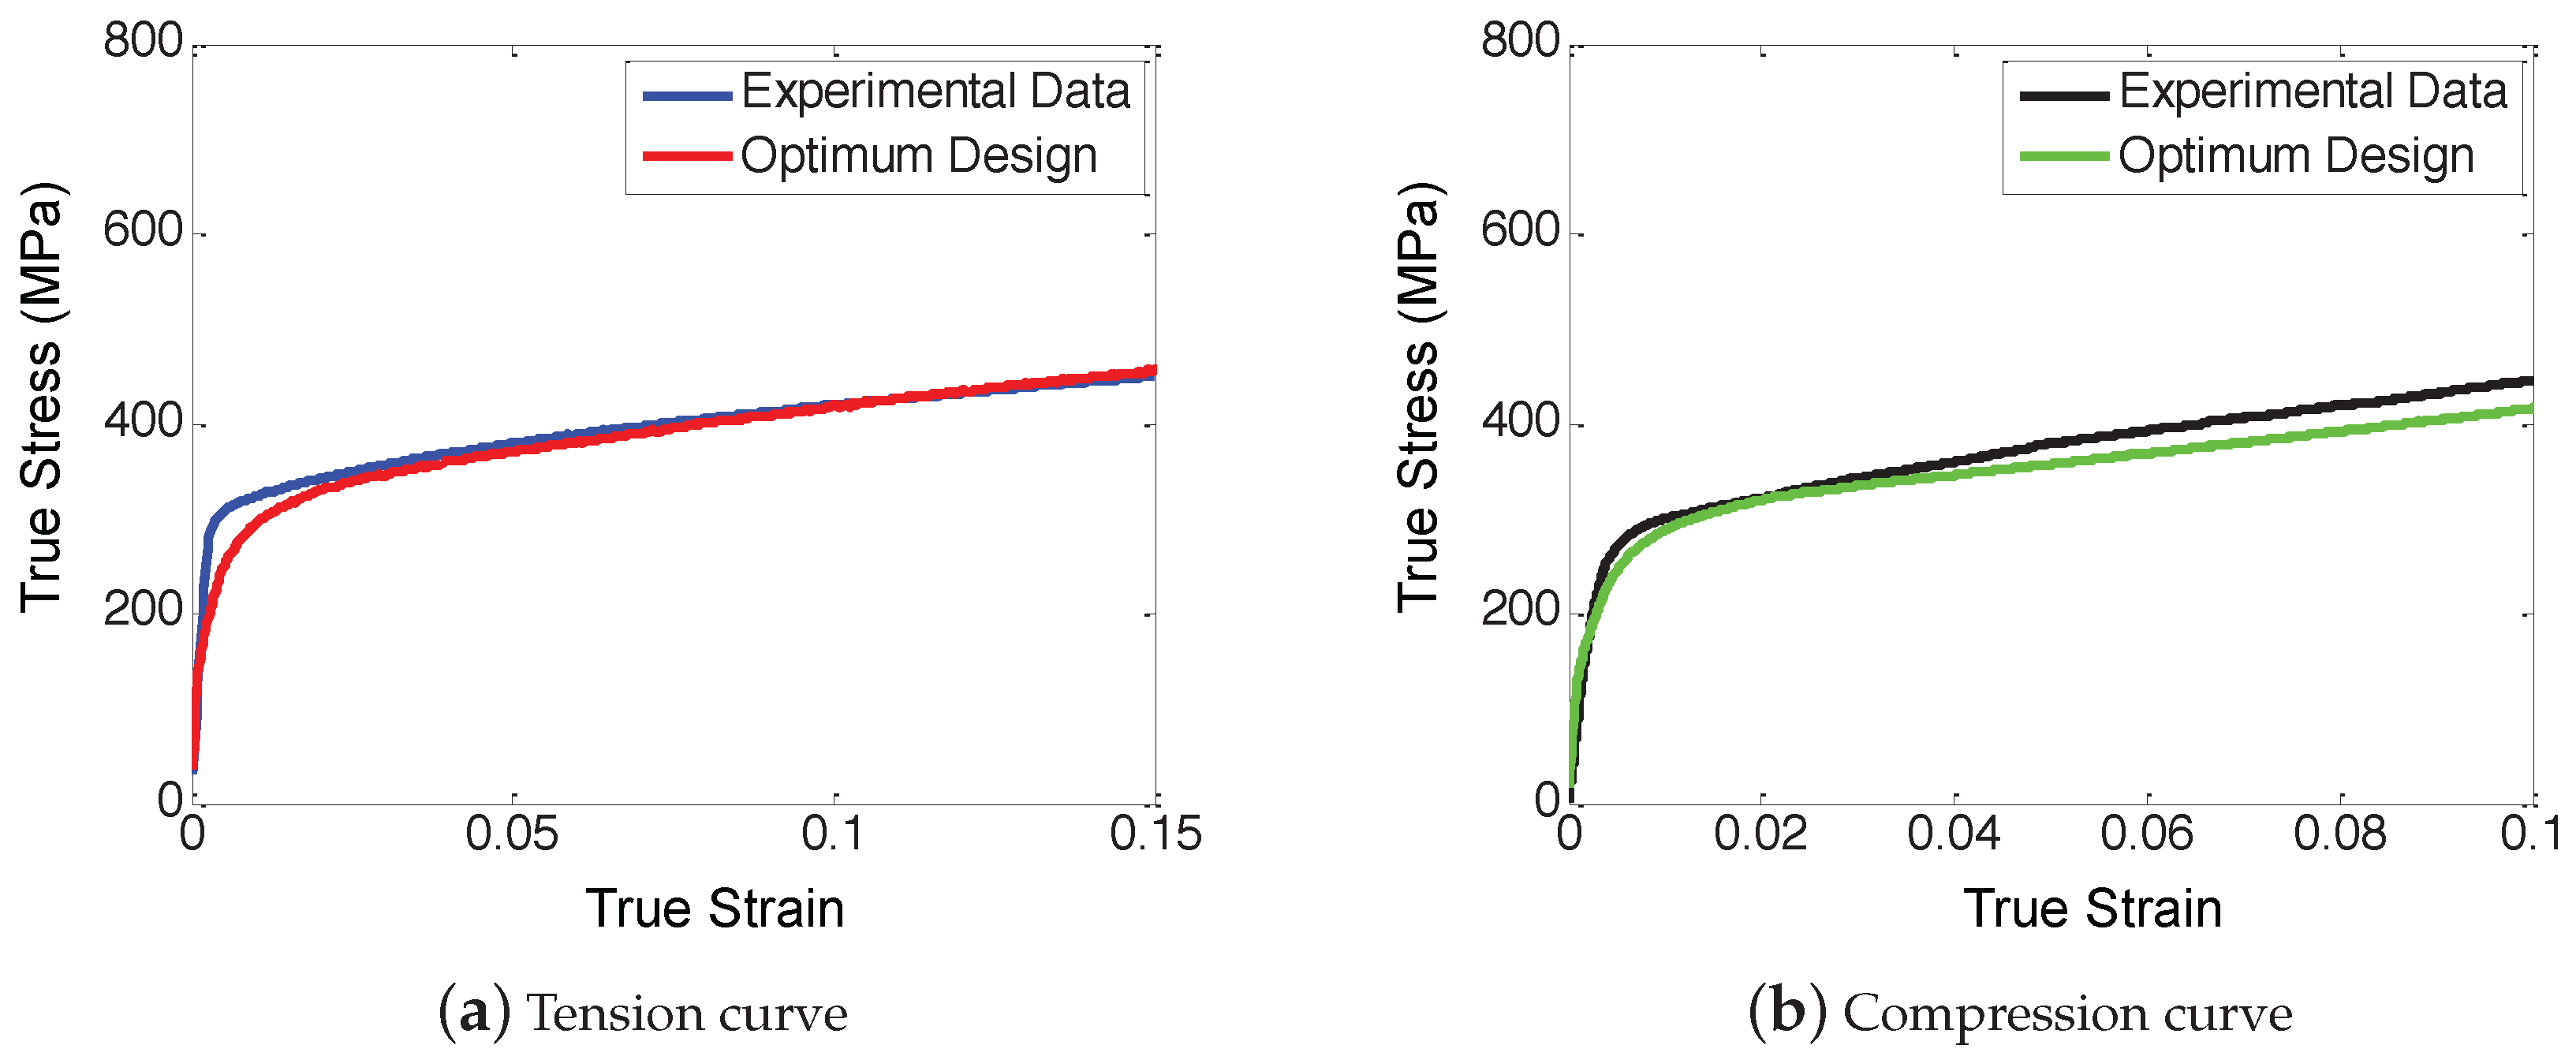
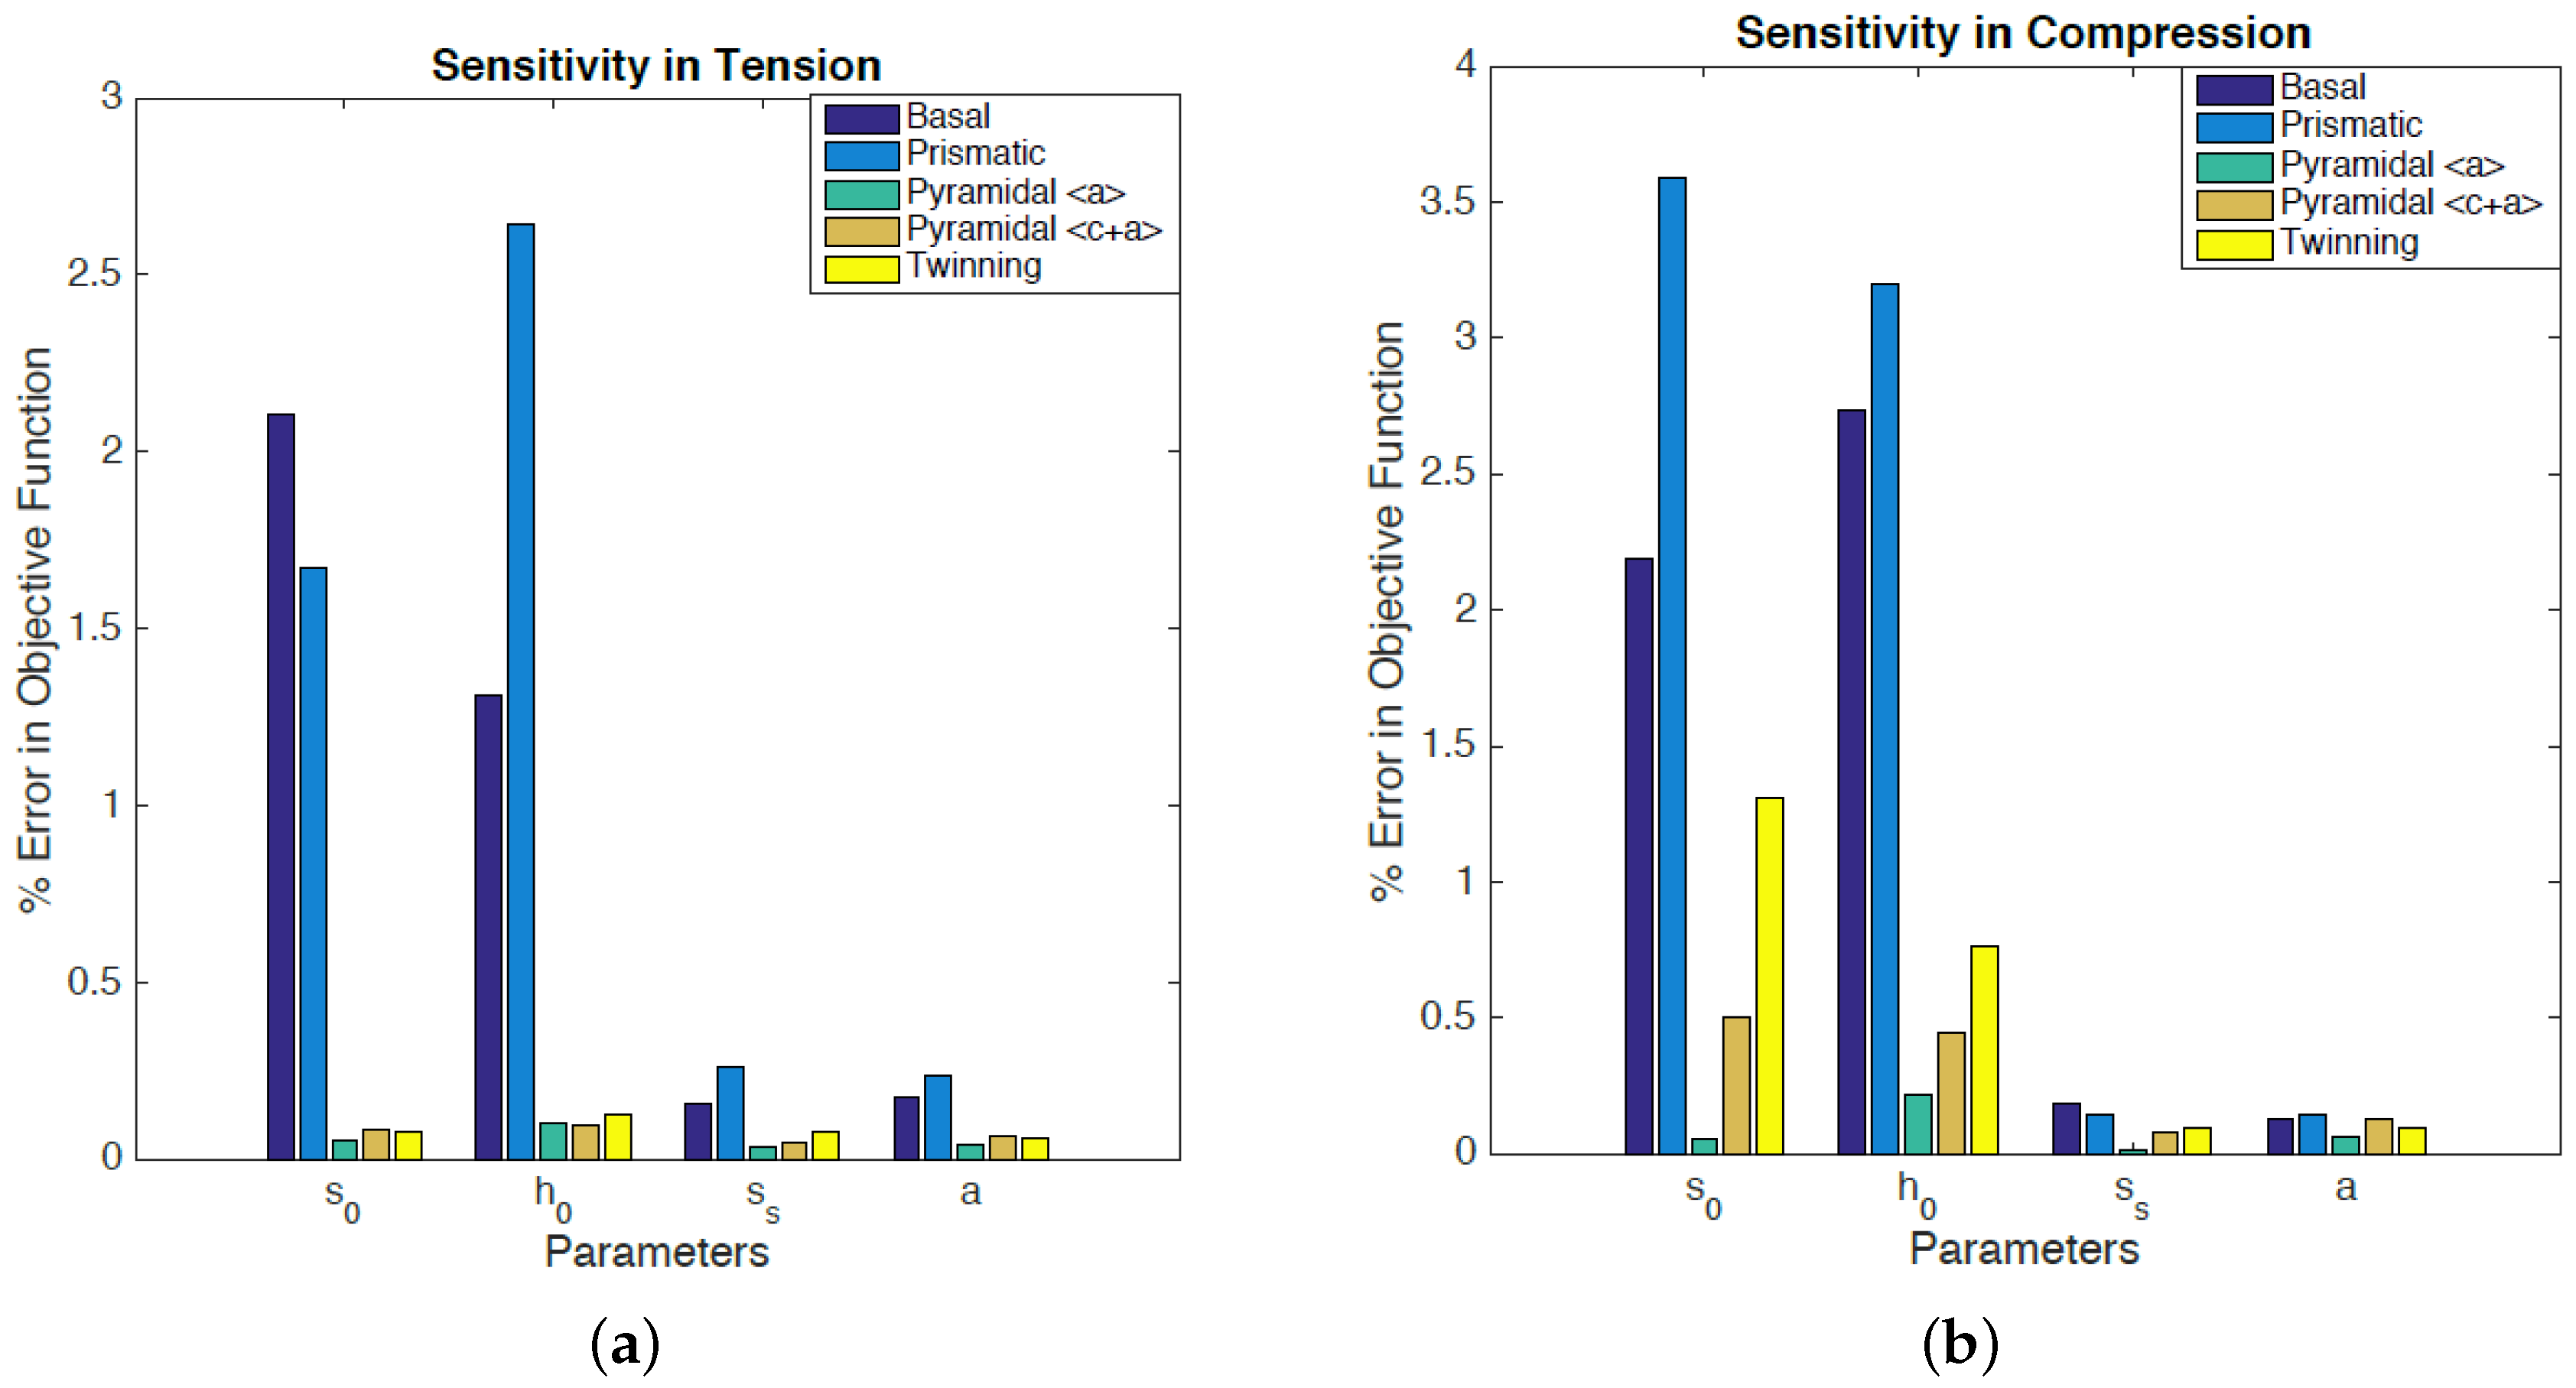
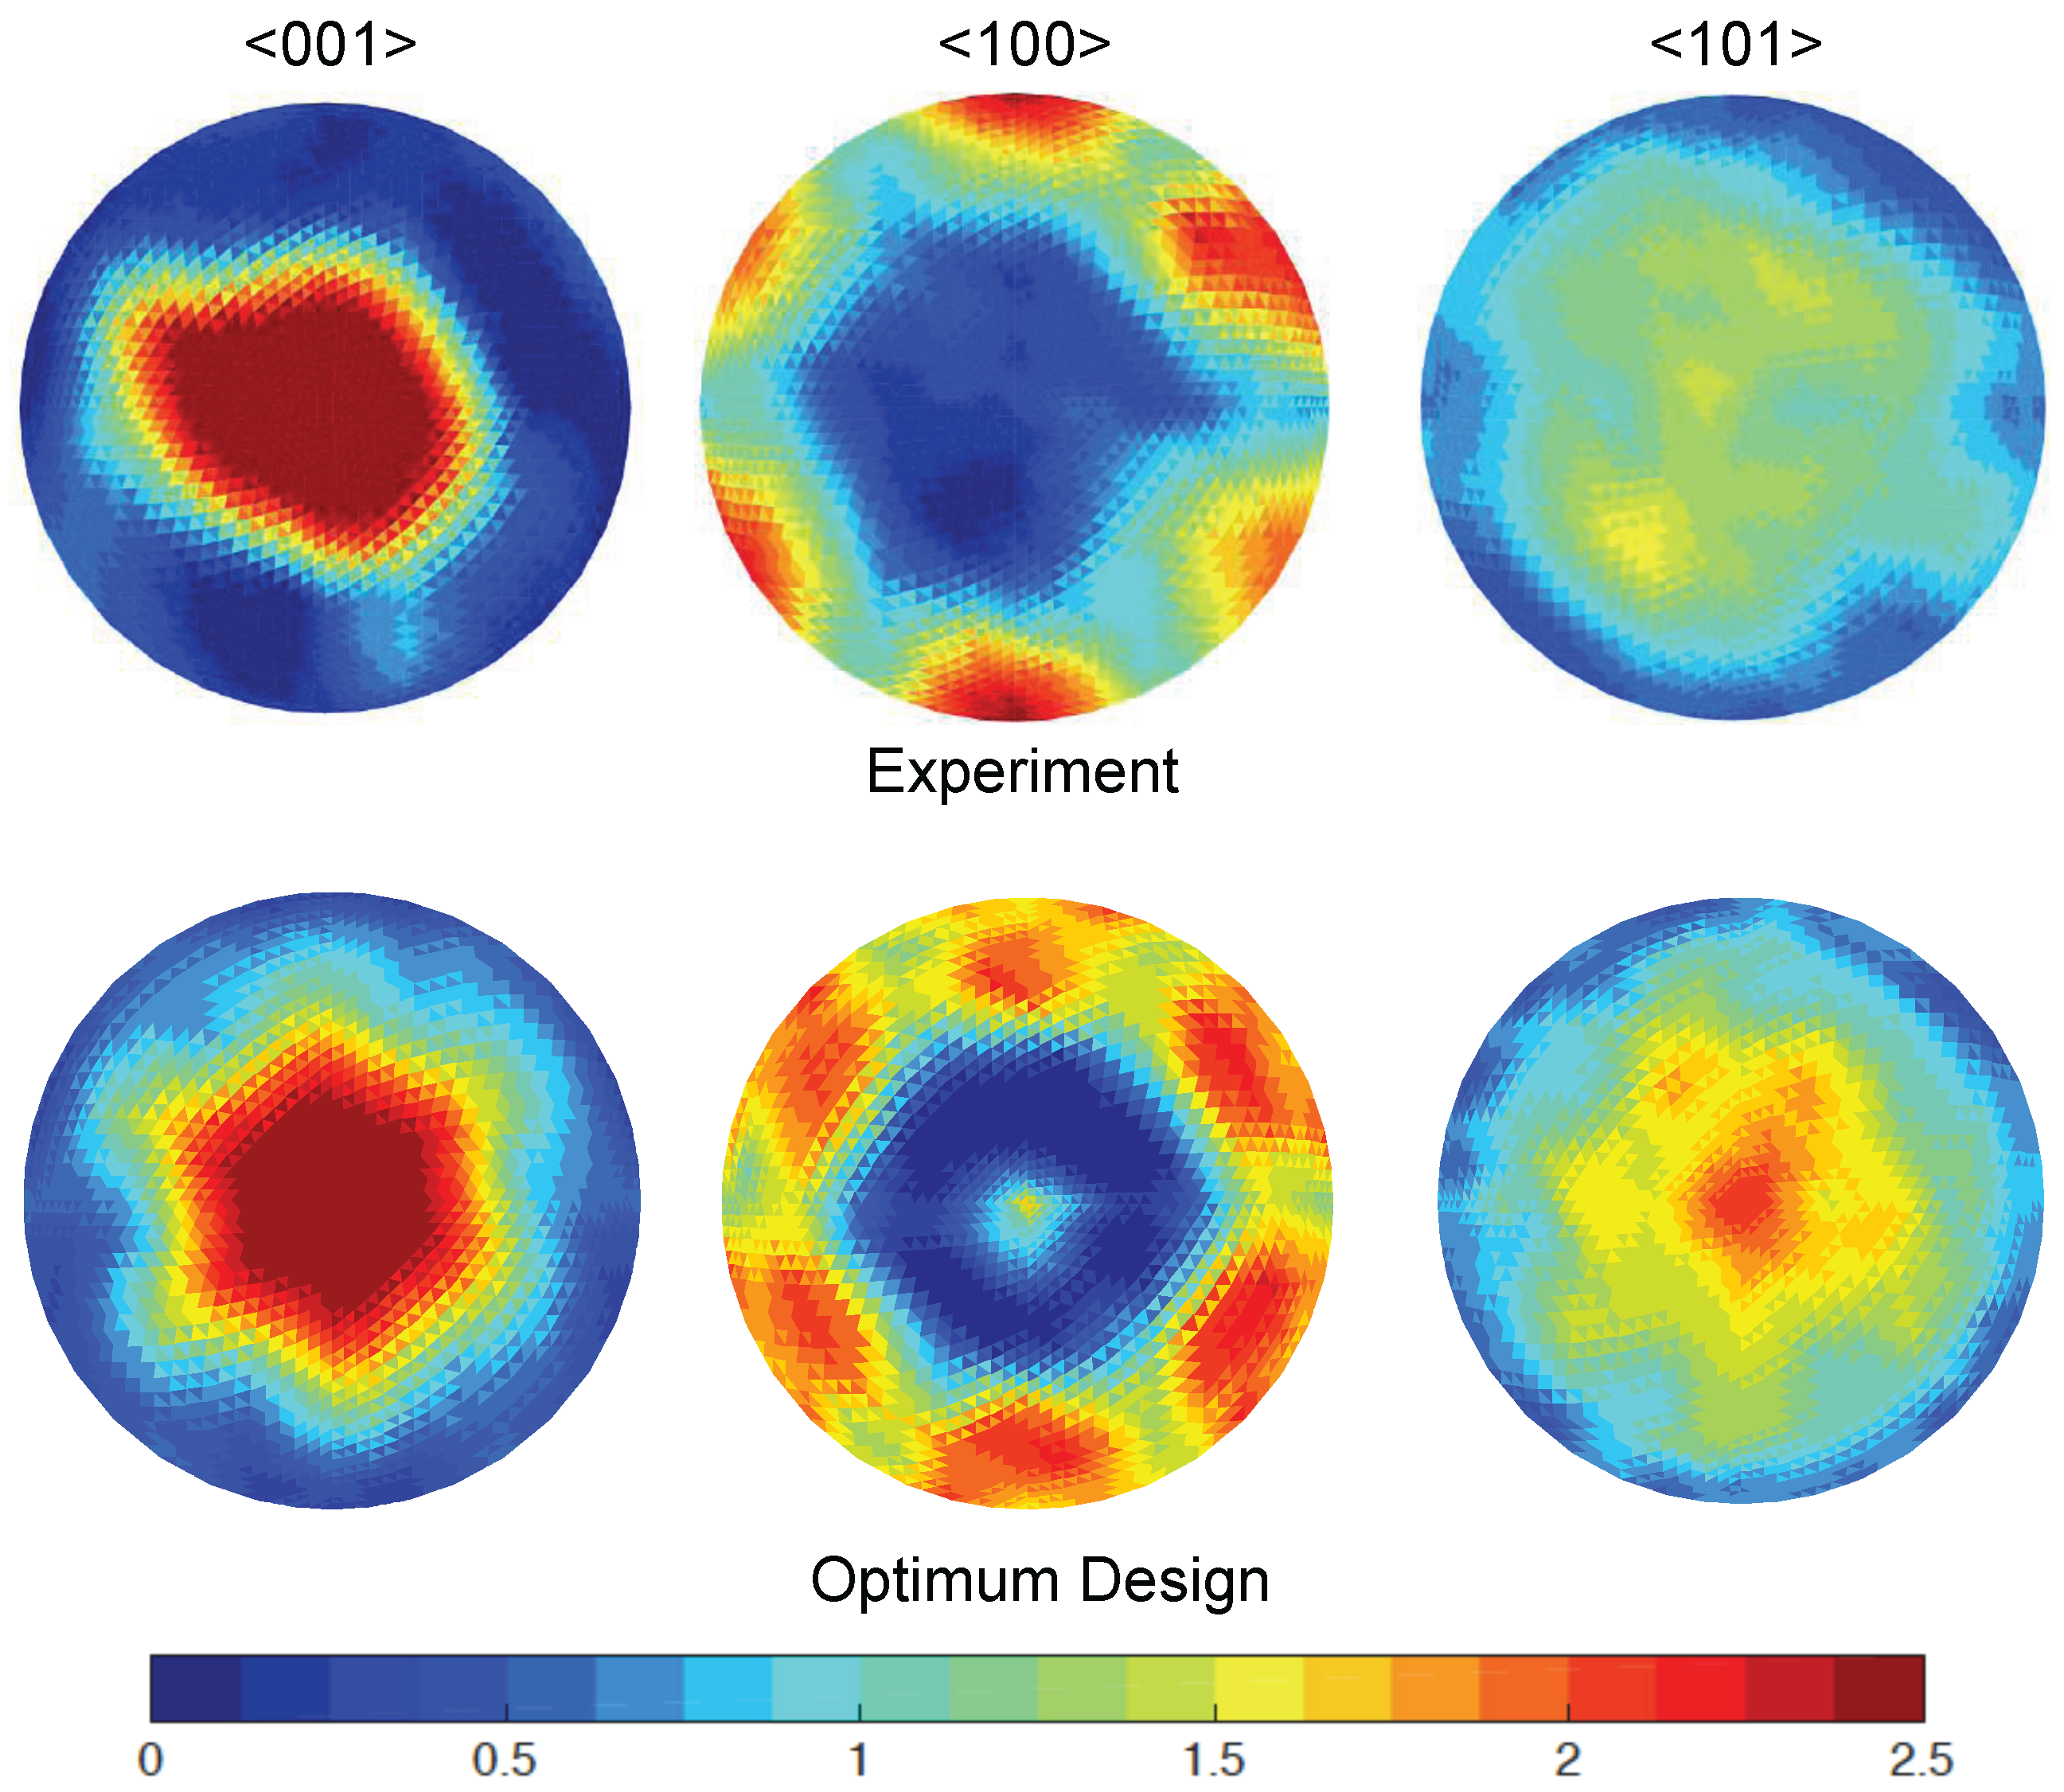
3.1. Optimization of Slip System Parameters for Ti-0Al

The optimization problem defined in Equations (3) and (4) is solved using NSGA-II as the optimization algorithm, and ISF as the global sampling algorithm in Modefrontier software (by Esteco, Trieste, Italy). The optimum slip system parameters of Ti-0Al are shown in Table 1. The only information in literature [26], to the best of the author’s knowledge, discusses that the s 0 value of the pyramidal < c + a > slip system should be three to five times higher than the s 0 value of the prismatic < a > slip system. This statement in Reference [26] is supported by the optimization results reported in Table 1. The true stress - true strain curves, which are predicted using the optimum slip system parameters of the ODF based crystal plasticity model, are compared to the experimental data in Figure 1 for tension and compression respectively. Three sets of tension and compression experimental data are available for Ti-0Al, and the mean values of these experimental curves are used in the optimization study. Another experimentally available comparison metric is the < 002 > and < 100 > pole figures (PFs) measured at 9% strain in the compression test, which is presented by Fitzner [32]. The texture is also predicted by the ODF based crystal plasticity simulation using the optimum slip system parameters, and compared to the experimental data in Figure 2.
As shown by the true stress - true strain curve results in Figure 1, the optimum slip system parameters generate an accurate computational model according to the available tension and compression test data for Ti-0Al. The difference between the experimental and computational stresses during the small strain levels is because of the initial texture uncertainties. The crystal plasticity simulations are performed with the random texture assumption to model the initial texture. However, in reality, the experimental texture slightly varies from the random texture and corresponds to a weakly basal texture. The important point here is that it is still possible to identify the optimum parameters under the effect of initial texture uncertainties since they are more effective when the strain is small, and then the computational model tends to converge to the experimental data when the strain is higher. The uncertainties also cause small differences in PFs as shown in Figure 2.
The sensitivities of the optimum parameters to the tension and compression design objectives (min ϵ t and min ϵ c respectively) are investigated using sample points generated with Latin Hypercube Sampling (LHS) [45]. Ten sample points per each variable, and therefore 200 sample points in total are generated. Each parameter is assumed to vary up to ± 10 % around its optimum value with a Gaussian distribution, and the others remain constant at their optimum values. The sensitivities are represented as a percent bar graph in Figure 3 which shows the average % change in the design objective given up to 10% changes around the optimum values of the variables. The sensitivity analysis is performed for both tension and compression tests.
According to the sensitivity results shown in Figure 3, the most critical slip systems are determined as the basal and prismatic slip systems. The objective function values are also more sensitive to the changes in s 0 and h 0 parameters rather than the changes in s s and a in both tension and compression. The tension test is sensitive to both basal and prismatic slip systems, however, in compression, the prismatic slip system is determined to be more effective. The remaining slip systems do not play a dominant role in tension and it can be assumed that they have negligible effects, however, twinning and pyramidal < c + a > becomes more effective in compression compared to their negligible sensitivities in tension. This is an expected results since the twinning was assumed to be active during compression.

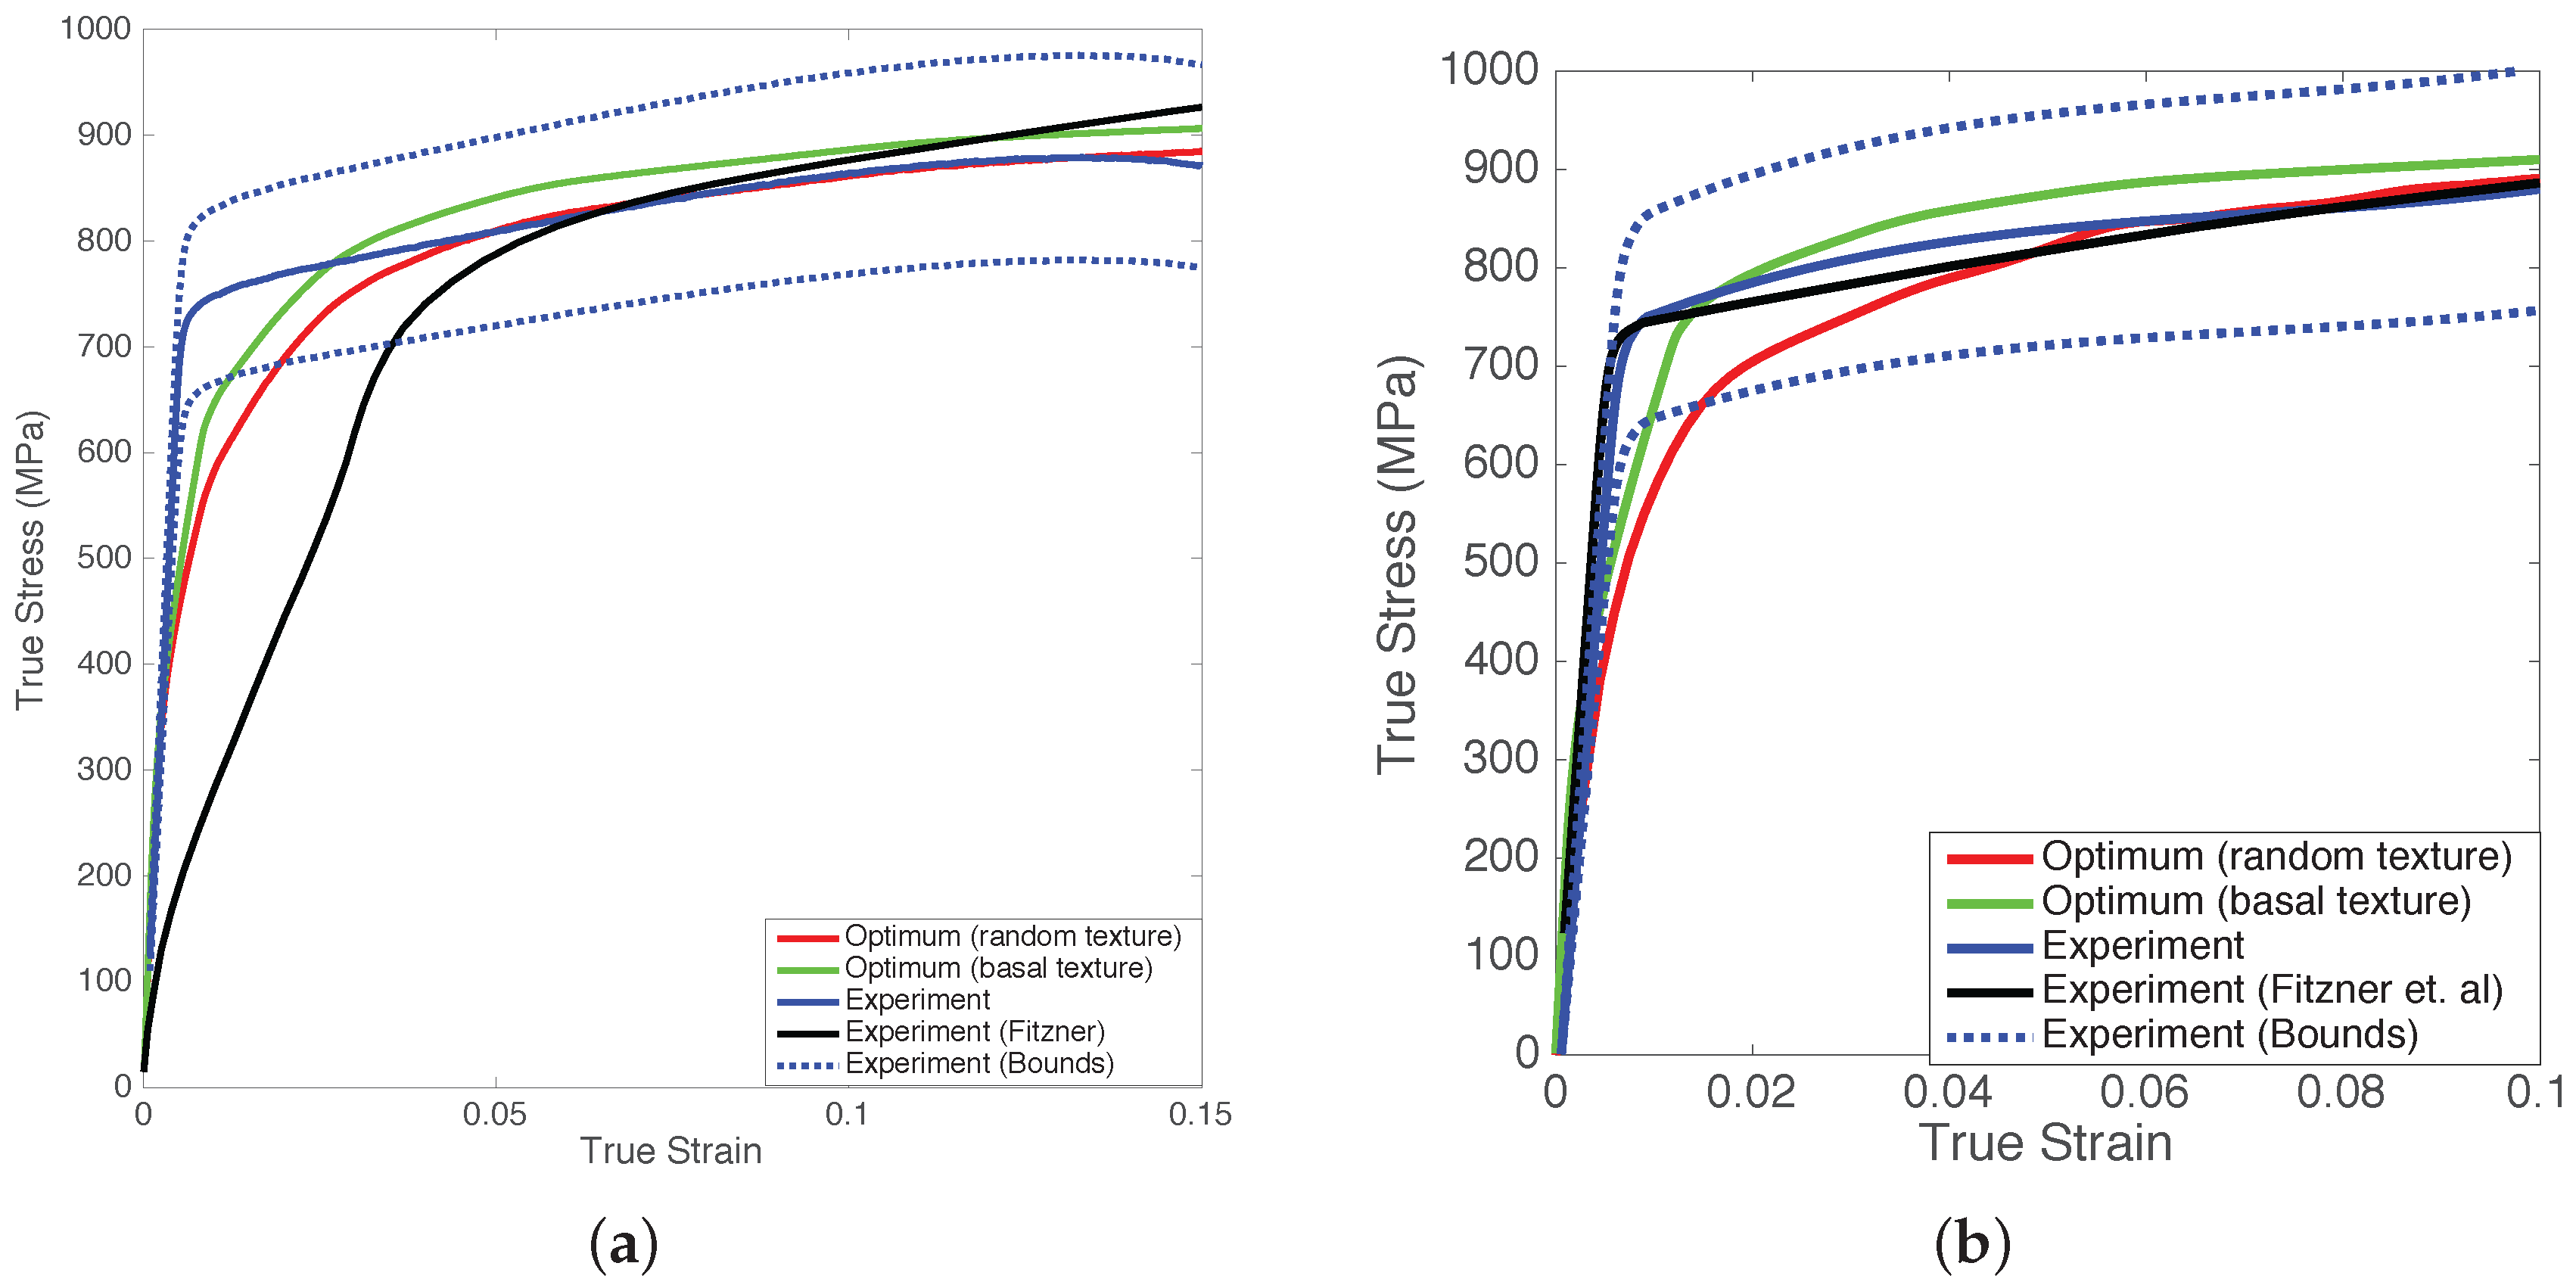
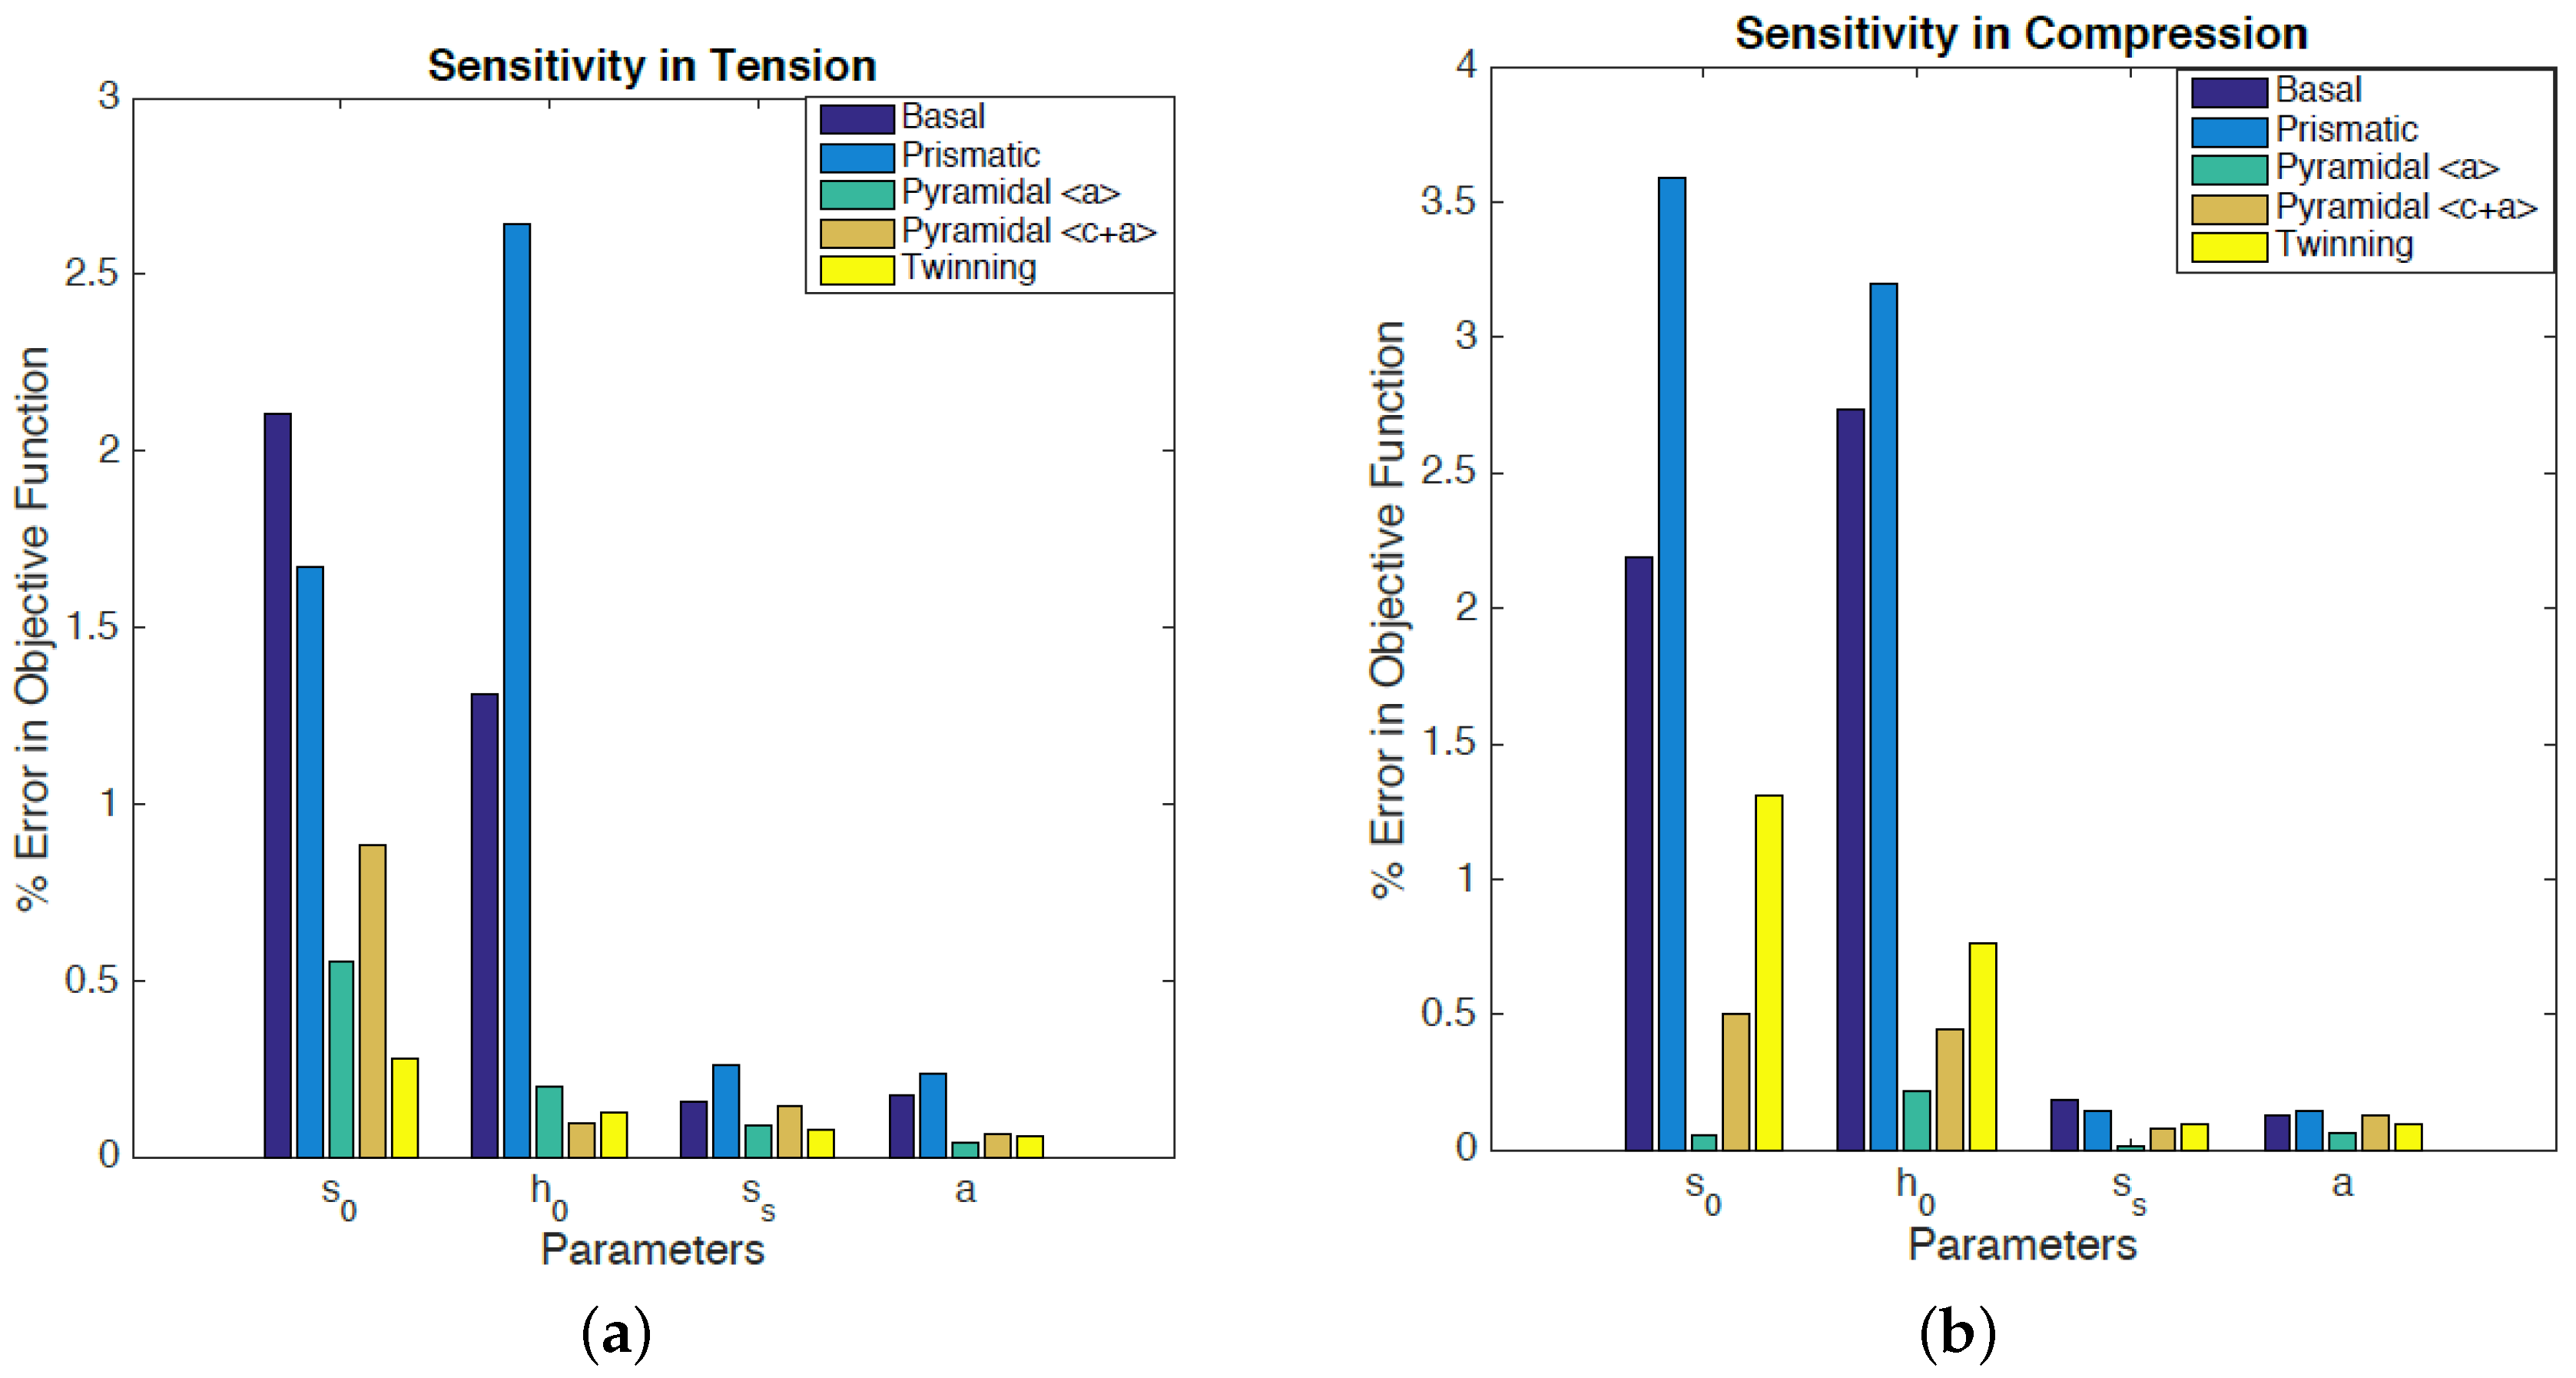
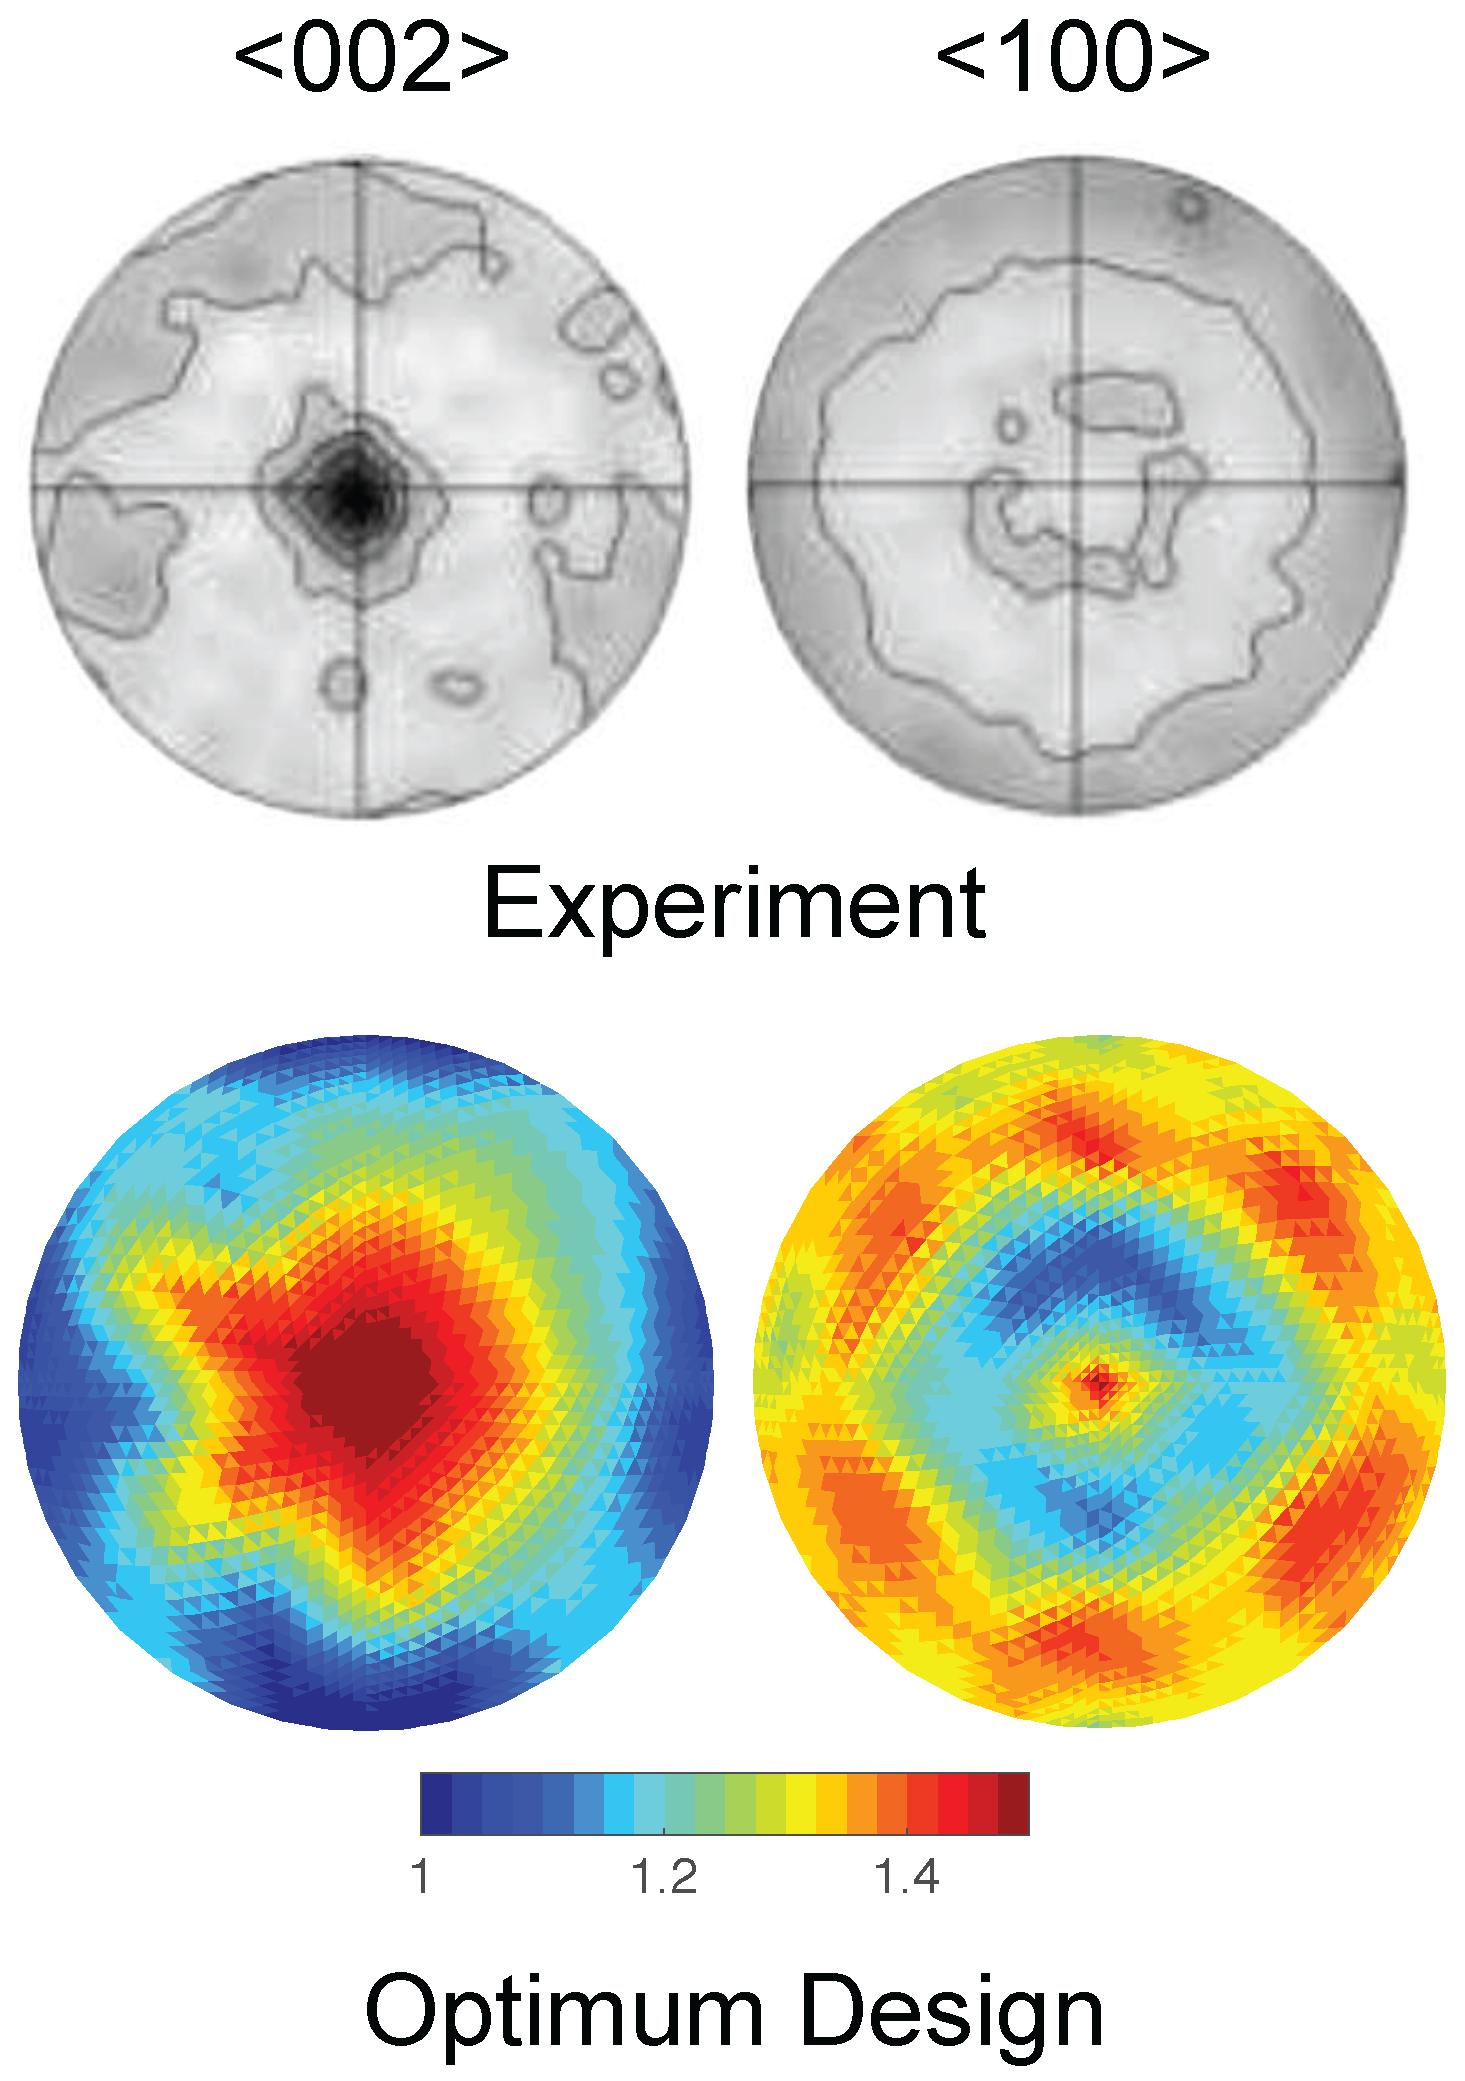
3.2. Optimization of Slip System Parameters for Ti-7Al

The same optimization problem, which is defined in Equations (3) and (4), is solved for Ti-7Al using NSGA-II as the optimization algorithm, and ISF as the global sampling method. The optimum slip system parameters of Ti-7Al are shown in Table 2. These parameters are also compared to the available information in literature regarding the critical resolved shear stress (CRSS) values of different slip systems of Ti-7Al in Table 3. The optimum CRSS results match with the information provided in literature as can be seen in Table 3. However, there is no information regarding the CRSS values of twinning and pyramidal < a > slip system. The optimization problem in this study is unique in this sense since it is the first time all the CRSS and hardening parameters are identified. The tension and compression curves obtained through the ODF simulation using the optimum slip system parameters is compared to the experimental data in Figure 4. Please note that the experimental curves in Figure 4 correspond to the mean values which are calculated using three sets of tension and 21 sets of compression test data. The microstructural texture at 20% compressive strain is predicted by using the optimum design parameters, and compared to the experimental data in Figure 5. Another texture comparison is made through comparing the < 001 > , < 100 > and < 101 > PFs at 20% compressive strain as shown in Figure 6.
Similarly, the true stress-true strain curve results in Figure 4 indicates an accurate computational representation to the available tension and compression experimental data. The initial texture uncertainties affect the computational result as the difference between the computational and experimental stresses is larger when the strain has smaller values. However, the effect of initial texture uncertainties is not important when the strain has higher values as shown in Figure 4. The different experimental data with basal initial textures are shown. Fitzner and Fitzner et al. data in Figure 4 was obtained from References [32,33] in Figure 4. Please note that the experimental plots given by Fitzner [32] and Fitzner et al. [33] show the Al concentration in terms of the at %. Ti-7Al alloy of interest in this study has 7 wt % Al. Therefore the experimental curves provided by Fitzner [32] and Fitzner et al. [33] for Ti-13 at % Al is used for the comparison (Ti-13 at % Al ≈ Ti-7.3 wt % Al). The uncertainty bounds of the aforementioned measurements (three measurements in tension and 21 measurements in compression test) and the experimental data available in literature (Fitzner [32] and Fitzner et al. [33]) clearly indicate how the stress-strain behavior can be affected by the measurement uncertainties as shown in Figure 4. To understand the initial texture uncertainties better, a simulation is also performed by inputting a basal initial texture and using the same optimum slip system parameters, and the simulation result with the basal initial texture in Figure 4 provides a better match to the experimental data as expected.
The uncertainties in experimental texture can also be observed in Figure 5 and Figure 6.
A similar sensitivity study, which implements LHS for sampling, is performed to analyze the effect of optimum variables to design objectives using 10 samples per variable, 200 samples in total. The sensitivities are represented as a percent bar graph in Figure 7 which shows the average % change in the design objective given up to 10% changes around the optimum values of the variables. The sensitivity analysis is performed for both tension and compression tests.
According to the sensitivity results shown in Figure 7, the most critical slip systems are determined as the basal and prismatic slip systems. The objective function values are also more sensitive to the changes in s 0 and h 0 parameters rather than the changes in s s and a in both tension and compression. The tension test is sensitive to both basal and prismatic slip systems, however, in compression, the prismatic slip system is determined to be more effective. Twinning was expected to be active during compression, and as the sensitivity results indicate it becomes more effective in the compression test. After basal and prismatic slip systems, the third most dominant slip system is found to be pyramidal < c + a > in tension, and it is followed by pyramidal < a > and finally by twinning. However, the third most dominant system is twinning in compression. This also clearly indicates the necessity of including twinning in crystal plasticity modeling of Ti-Al alloys.

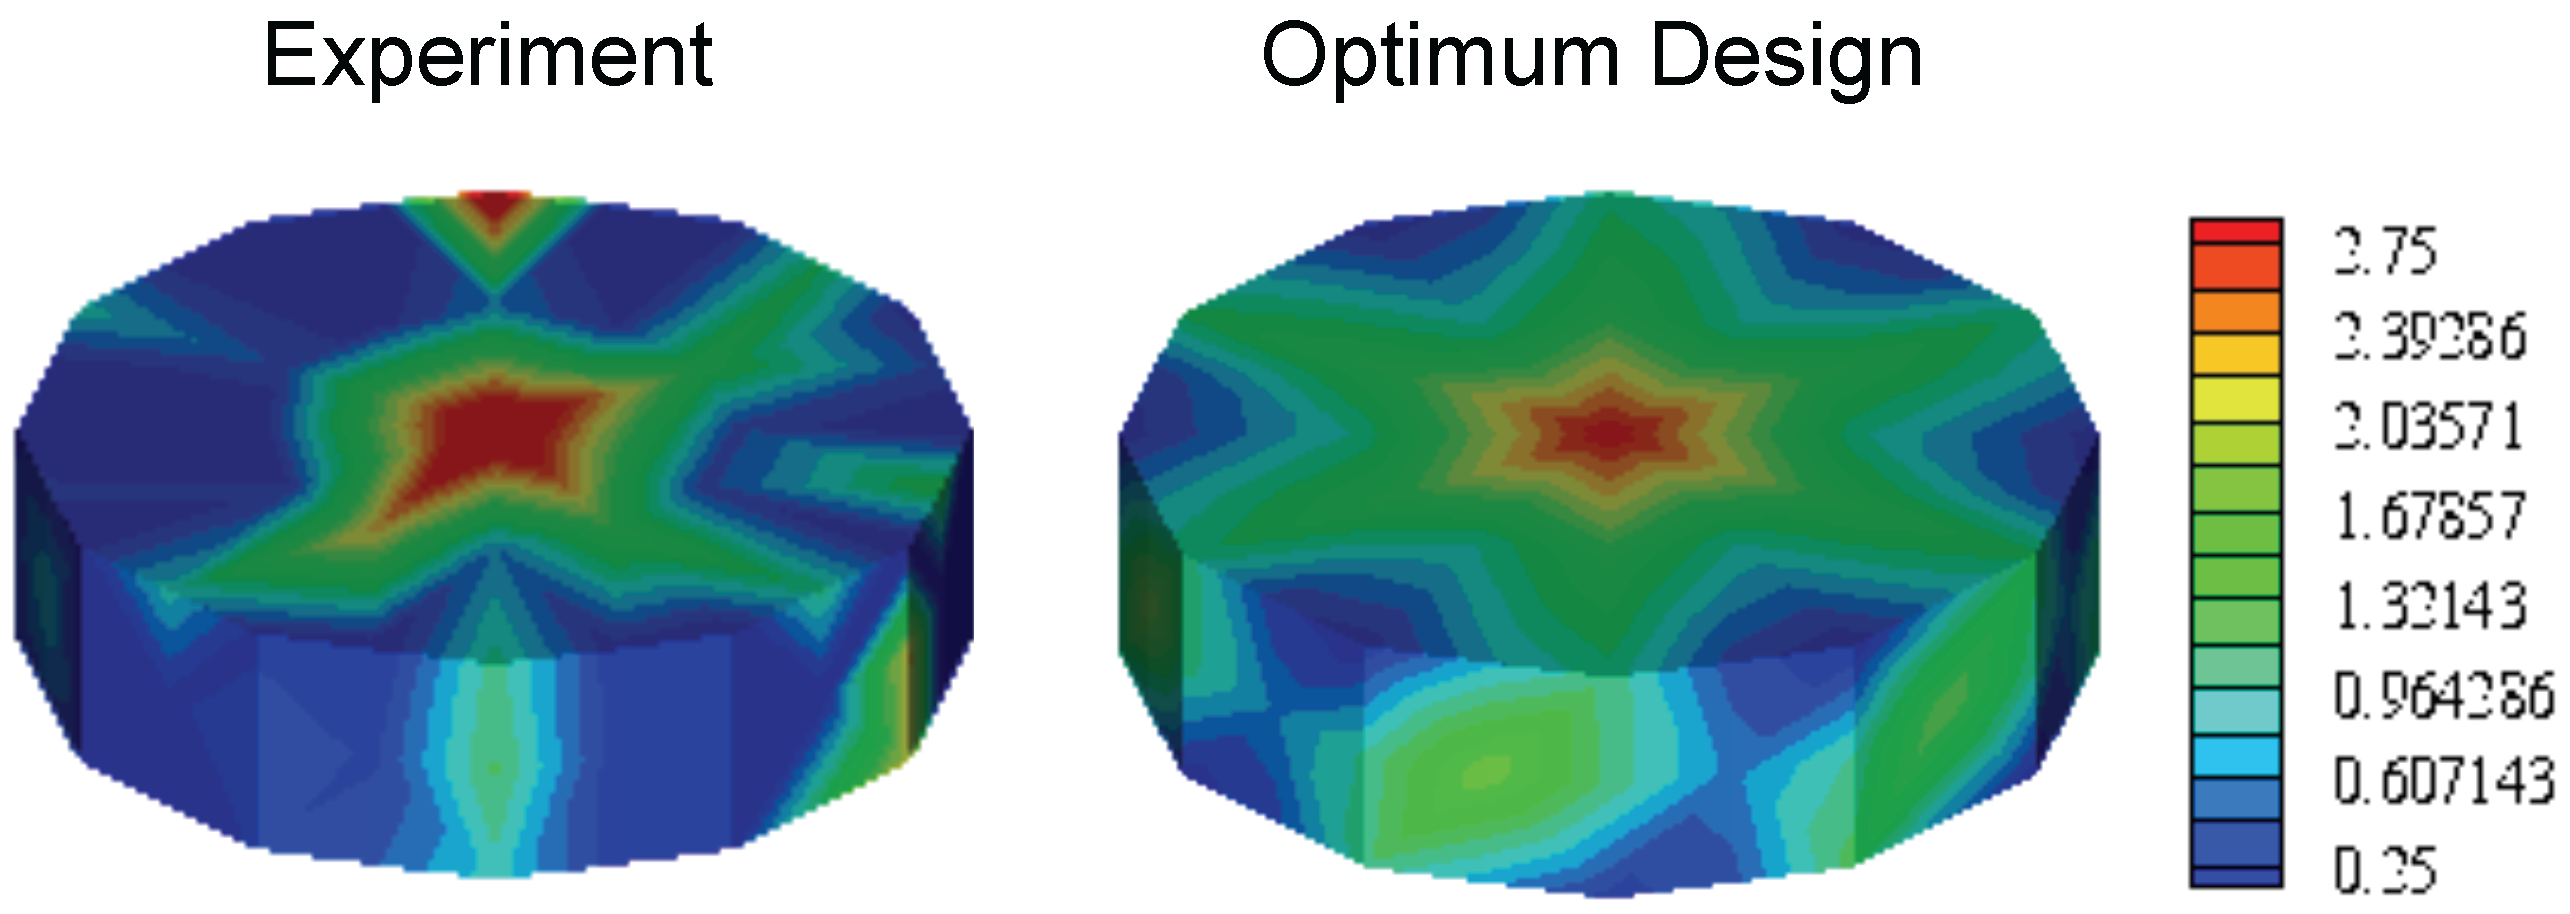
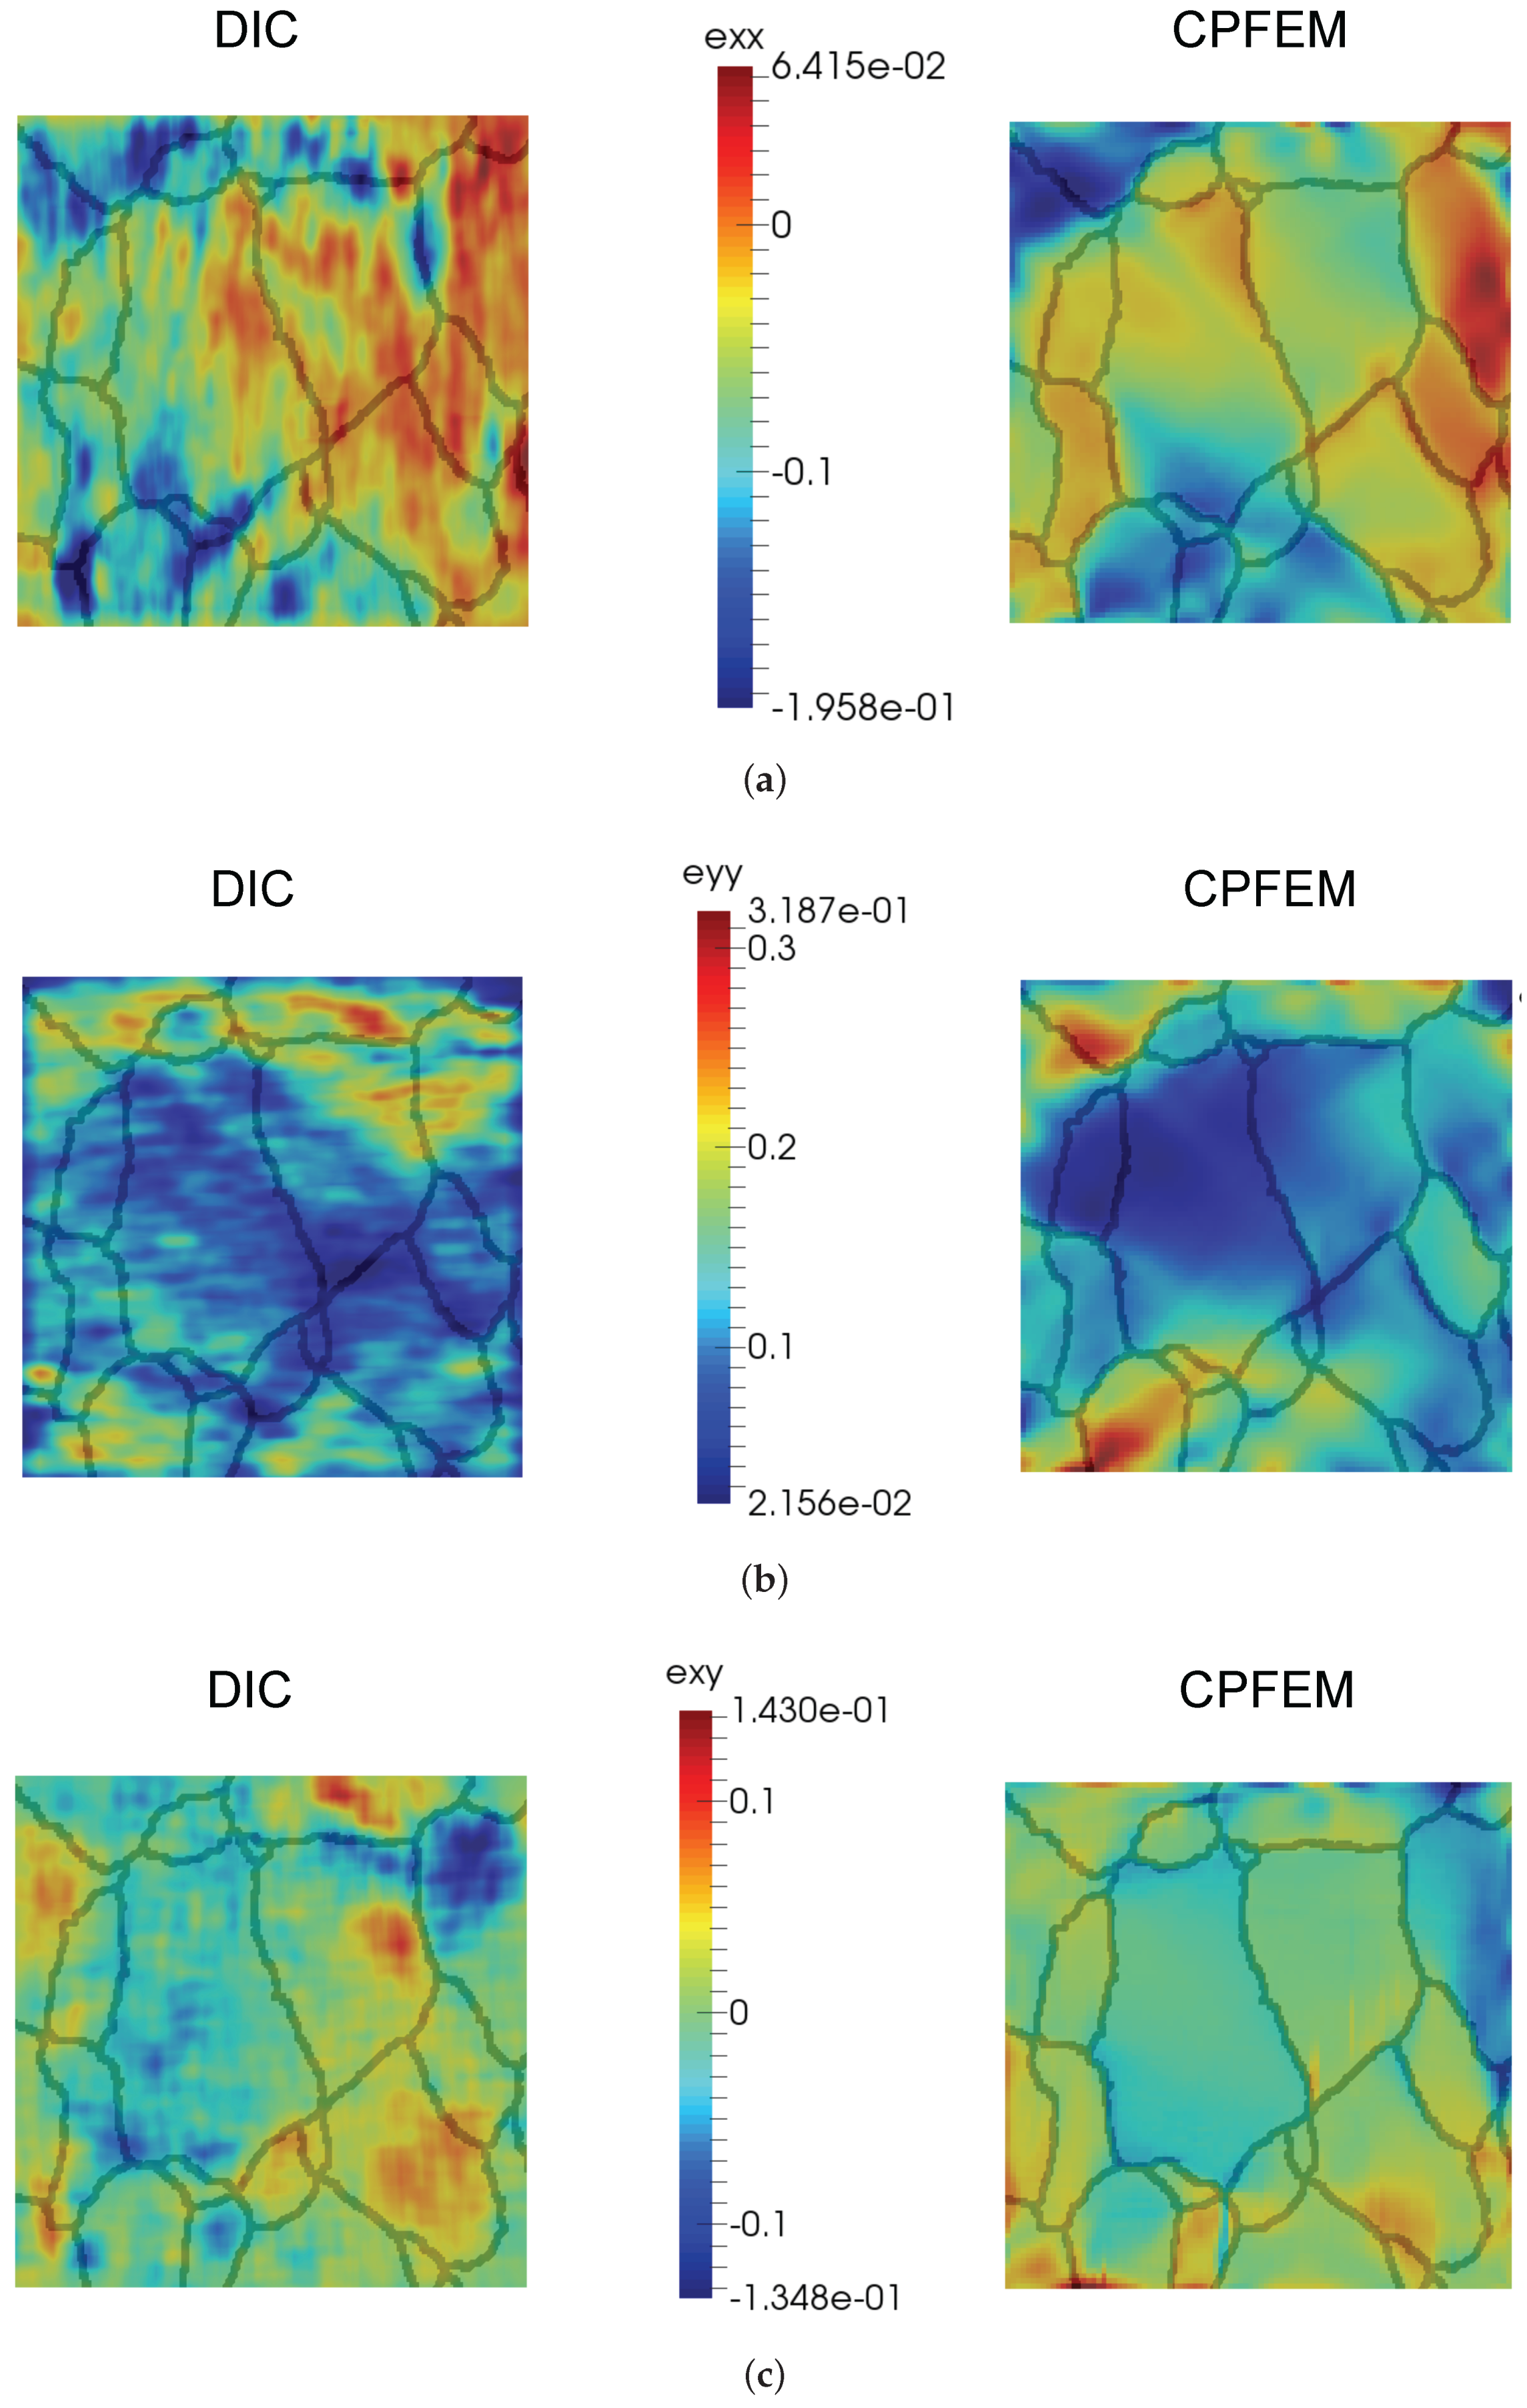
3.3. CPFE Analysis for Ti-7Al

The optimum slip system parameters of Ti-7Al are used to perform a CPFE analysis, and the strain field results are compared to the available experimental SEM-DIC data. The comparison with SEM-DIC experiments is performed by setting up a boundary value problem using the electron backscatter image of the microstructure within the SEM-DIC window. The measurements are made on the surface of the sample, which is traction-free, and therefore the plane-stress case is assumed for the simulation. Since the slip and twin systems are 3D the plane-stress assumption is applied to 3D plate with a very small thickness value (thickness/length ratio is taken 0.1). The simulation is performed using a 40 × 40 microstructural window meshed with 10,000 elements along z-direction, and the strain fields ( e x x , e y y and e x y strains) are computed. The SEM-DIC data is available at 13.5% tensile strain, it is compared to the CPFE results in Figure 8 for e x x , e y y and e x y strain fields respectively.
The CPFE results inputting the optimum slip system parameters are sufficiently accurate compared to the available SEM-DIC data. This result is important since the SEM-DIC data provides the actual strain fields, and it is a more accurate experimental measure compared to the global stress-strain curves.

4. Conclusions

An optimization study is performed to identify the slip system parameters of Ti-Al alloys (Ti-0Al and Ti-7Al) using the available tension and compression experimental data showing the true stress - true strain curves of the alloys. The microstructure is modeled using the ODF approach and a rate independent single crystal constitutive model is implemented for crystal plasticity analysis. The optimum results provide an accurate computational representation in comparison with the experimental data. Additional experimental data, which illustrates the microstructural texture at 9% and 20% strains in compression test, is used as an another metric for verification of the optimum design. The predicted microstructures using the optimum variables show similarities to the experimental data. The differences, which are seen in the stress - strain curves and microstructural texture, stem from the uncertainties in the measurements and initial texture. The computational model inputs both a random and basal initial texture, however, the experiments were performed with a texture, which was slightly different than the random texture, a weakly basal texture. Not only the stress - strain curves but also the microstructural texture comparisons show a good agreement. A CPFE simulation is performed to compute the strain fields of Ti-7Al in different directions, and the results are compared to the available experimental data at 13.5% tensile strain. The crystal plasticity system realization for Ti-0Al and Ti-7Al is significant since these slip system parameters have not been studied extensively in literature. There are studies to identify the slip system parameters of other Ti-Al alloys, such as Ti-6Al-4V, however, there has not been published any study focusing on the parameter identification for modeling Ti-7Al alloy to the best of the author’s knowledge. The present work is the first attempt to identify all the slip system parameters of the Ti-Al alloys of interest. Future work may address computational techniques to quantify the experimental uncertainties, and develop a stochastic optimization framework to solve similar inverse problems under the effect of uncertainties.

Acknowledgments

The experimental work presented here was funded by Office of Naval Research (ONR) grant N00014-12-1-0013 and was performed by Anna Trump and John Allison (Materials Science and Engineering) at University of Michigan, and Zhe Chen and Samantha Daly (Mechanical Engineering) at University of California, Santa Barbara. The computations have been carried out as part of research supported by the U.S. Department of Energy, Office of Basic Energy Sciences, Division of Materials Sciences and Engineering under Award No. DE-SC0008637 that funds the PRedictive Integrated Structural Materials Science (PRISMS) Center at the University of Michigan. The crystal plasticity finite element simulations were conducted by Sriram Ganesan and Veera Sundararaghavan (Aerospace Engineering) at University of Michigan.

Author Contributions

Pınar Acar performed the tension and compression simulations as well as the optimization runs. Ali Ramazani and Veera Sundararaghavan analyzed and discussed the findings.

Conflicts of Interest

The authors declare no conflict of interest.

References

  1. Allison, J.; Backman, D.; Christodoulou, L. Integrated Computational Materials Engineering: A New Paradigm for the Global Materials Profession. J. Miner. Met. Mater. Soc. 2006, 58, 25–27. [Google Scholar] [CrossRef]
  2. Taylor, G. Plastic strain in metals. J. Inst. Met. 1938, 62, 307–324. [Google Scholar]
  3. Asaro, R.J.; Needleman, A. Texture development and strain hardening in rate dependent polycrystals. Acta Metall. 1985, 33, 923–953. [Google Scholar] [CrossRef]
  4. Canova, G.R.; Kocks, U.F.; Jonas, J.J. Theory of torsion texture development. Acta Metall. 1984, 32, 211–226. [Google Scholar] [CrossRef]
  5. Molinari, A.; Canova, G.R.; Ahzi, S. A self consistent approach of the large deformation polycrystal viscoplasticity. Acta Metall. 1987, 35, 2983–2994. [Google Scholar] [CrossRef]
  6. Tiem, S.; Berveiller, M.; Canova, G.R. Grain shape effects on the slip system activity and on the lattice rotations. Acta Metall. 1986, 34, 2139–2149. [Google Scholar] [CrossRef]
  7. Acar, P.; Sundararaghavan, V. Uncertainty Quantification of Microstructural Properties due to Variability in Measured Pole Figures. Acta Metall. 2017, 124, 100–108. [Google Scholar] [CrossRef]
  8. Acar, P.; Sundararaghavan, V. Utilization of a Linear Solver for Multiscale Design and Optimization of Microstructures in an Airframe Panel Buckling Problem. In Proceedings of the 57th AIAA/ASCE/AHS/ASC Structures, Structural Dynamics, and Materials Conference, San Diego, CA, USA, 4–8 January 2016. [Google Scholar]
  9. Acar, P.; Sundararaghavan, V. Uncertainty Quantification of Microstructural Properties due to Experimental Variations. AIAA J. 2017, 55, 2824–2832. [Google Scholar] [CrossRef]
  10. Sundararaghavan, V.; Zabaras, N. On the synergy between texture classification and deformation process sequence selection for the control of texture-dependent properties. Acta Metall. 2005, 53, 1015–1027. [Google Scholar] [CrossRef]
  11. Adams, B.L.; Henrie, A.; Henrie, B.; Lyon, M.; Kalidindi, S.R.; Garmestani, H. Microstructure-Sensitive Design of a Compliant Beam. J. Mech. Phys. Solids 2001, 49, 1639–1663. [Google Scholar] [CrossRef]
  12. Kalidindi, S.R.; Houskamp, J.; Lyons, M.; Adams, B.L. Microstructure Sensitive Design of an Orthotropic Plate Subjected to Tensile Load. Int. J. Plast. 2004, 20, 1561–1575. [Google Scholar] [CrossRef]
  13. Fast, T.; Knezevic, M.; Kalidindi, S.R. Application of microstructure sensitive design to structural components produced from hexagonal polycrystalline metals. Comput. Mater. Sci. 2008, 43, 374–383. [Google Scholar] [CrossRef]
  14. Liu, R.; Kumar, A.; Chen, Z.; Agrawal, A.; Sundararaghavan, V.; Choudhary, A. A predictive machine learning approach for microstructure optimization and materials design. Nat. Sci. Rep. 2015, 5, 11551. [Google Scholar] [CrossRef] [PubMed]
  15. Sarma, G.B.; Dawson, P.R. Effects of interactions among crystals on the inhomogeneous deformations of polycrystals. Acta Mater. 1996, 44, 1937–1953. [Google Scholar] [CrossRef]
  16. Raabe, D.; Roters, F. Using texture components in crystal plasticity finite element simulations. Int. J. Plast. 2004, 20, 339–361. [Google Scholar] [CrossRef]
  17. Matthies, S.; Wenk, H.-R.; Vinel, G.W. Some basic concepts of texture analysis and comparison of three methods to calculate orientation distributions from pole figures. J. Appl. Cryst. 1988, 21, 285–304. [Google Scholar] [CrossRef]
  18. Dawson, P.R.; Marin, E.B. Computational Mechanics for Metal Deformation Processes Using Polycrystal Plasticity. Adv. Appl. Mech. 1997, 34, 77–169. [Google Scholar]
  19. Zheng, Q.S.; Zou, W.N. Orientation distribution functions for microstructures of heterogeneous materials (I)—Directional distribution functions and irreducible tensors. Appl. Math. Mech. 2001, 22, 865–884. [Google Scholar] [CrossRef]
  20. Pospiech, J.; Lucke, K.; Sztwiertnia, K. Orientation Distribution and Orientation Correlation Functions for Description of Microstructures. Acta Metall. Mater. 1993, 41, 305–321. [Google Scholar] [CrossRef]
  21. Bunge, H.J. Texture Analysis in Materials Science; Butterworths: London, UK, 1982. [Google Scholar]
  22. Kocks, U.F.; Tome, C.N.; Wenk, H.R. Texture and Anisotropy; Cambridge University Press: Cambridge, UK, 2000. [Google Scholar]
  23. Heinz, A.; Neumann, P. Representation of Orientation and Disorientation Data for Cubic, Hexagonal, Tetragonal and Orthorhombic Crystals. Acta Crystallogr. 1991, A47, 780–789. [Google Scholar] [CrossRef]
  24. Kumar, A.; Dawson, P.R. Computational Modeling of F.C.C. Deformation Textures over Rodrigues’ Space. Acta Mater. 2000, 48, 2719–2736. [Google Scholar] [CrossRef]
  25. Kumar, A.; Dawson, P.R. Modeling Crystallographic Texture Evolution with Finite Elements over Neo-Eulerian Orientation Spaces. Comput. Methods Appl. Mech. Eng. 2000, 153, 259–302. [Google Scholar] [CrossRef]
  26. Nervo, L.; King, A.; Fitzner, A.; Ludwig, W.; Preuss, M. A study of deformation twinning in a titanium alloy by X-ray diffraction contrast tomography. Acta Mater. 2016, 105, 417–428. [Google Scholar] [CrossRef]
  27. Balasubramanian, S. Application to Deformation Processing of Lightweight Metals. Ph.D. Dissertation, Massachusetts Institute of Technology, Cambridge, MA, USA, February 1998. [Google Scholar]
  28. Williams, J.C.; Baggerly, R.G.; Paton, N.E. Deformation Behavior of HCP Ti-Al Alloy Single Crystals. Metall. Mater. Trans. A 2002, 33, 837. [Google Scholar] [CrossRef]
  29. Lienert, U.; Brandes, M.C.; Bernier, J.V.; Weiss, J.; Shastri, S.V.; Mills, M.J.; Miller, M.P. In-situ single-grain peak profile measurements on Ti-7 Al during tensile deformation. Mater. Sci. Eng. A 2009, 524, 46–54. [Google Scholar] [CrossRef]
  30. Lutjering, G.; Williams, J. Introduction. In Titanium, 2nd ed.; Springer: Berlin, Germany, 2007. [Google Scholar]
  31. Khan, A.S.; Kazmia, R.; Farrokha, B.; Zupana, M. Effect of oxygen content and microstructure on the thermo-mechanical response of three Ti–6Al–4V alloys: Experiments and modeling over a wide range of strain-rates and temperatures. Int. J. Plast. 2007, 23, 1105–1125. [Google Scholar] [CrossRef]
  32. Fitzner, A.G. Effects of Alloying Elements on Twinning in Alpha-Titanium Alloys. Ph.D. Dissertation, University of Manchester, Manchester, UK, 2014; p. 261. [Google Scholar]
  33. Fitzner, A.G.; Prakash, D.G.L.; Fonseca, J.Q.; Thomas, M.; Zhang, S.; Kelleher, J.; Manuel, P.; Preuss, M. The effect of aluminum on twinning in binary alpha-Titanium. Acta Mater. 2016, 103, 341–351. [Google Scholar] [CrossRef]
  34. Acar, P.; Sundararaghavan, V. Utilization of a Linear Solver for Multiscale Design and Optimization of Microstructures. AIAA J. 2016, 54, 1751–1759. [Google Scholar] [CrossRef]
  35. Anand, L.; Kothari, M. A computational procedure for rate-independent crystal plasticity. J. Mech. Phys. Solids 1996, 44, 525–558. [Google Scholar] [CrossRef]
  36. Galan-Lopez, J.; Naghdy, S.; Verleysen, P.; Kestens, L.A.I.; Coghe, F.; Rabet, L.; Degrieck, J. Mechanical behavior and texture prediction of Ti-6Al-4V based on elastic viscoplastic self-consistent modelling. IOP Conf. Ser. Mater. Sci. Eng. 2015, 82, 012027. [Google Scholar] [CrossRef]
  37. Wu, Z.-H.; Kou, H.-C.; Tang, B.; Shao, J.; Han, F.-B.; Li, J.-S. Crystal Plasticity Finite-element Simulation of Ti-6Al-4V Alloy with 3D Polycrystalline Models. In Proceedings of the 2nd Annual International Conference on Advanced Material Engineering (AME 2016), Wuhan, China, 15–17 April 2016. [Google Scholar]
  38. Thomas, J.; Groeber, M.; Ghosh, S. Image-based crystal plasticity FE framework for microstructure dependent properties of Ti-6Al-4V alloys. Mater. Sci. Eng. A 2012, 553, 164–175. [Google Scholar] [CrossRef]
  39. Sundararaghavan, V.; Kumar, A. Probabilistic modeling of microstructure evolution using finite element representation of statistical correlation functions. Int. J. Plast. 2012, 30–31, 62–80. [Google Scholar] [CrossRef]
  40. Sundararaghavan, V.; Zabaras, N. A multi-length scale sensitivity analysis for the control of texture-dependent properties in deformation processing. Int. J. Plast. 2008, 24, 1581–1605. [Google Scholar] [CrossRef]
  41. Sha, W.; Malinov, S. Titanium Alloys: Modelling of Microstructure, Properties and Applications; Elsevier: Amsterdam, The Netherlands, 2009. [Google Scholar]
  42. Deb, K.; Pratap, A.; Agarwal, S.; Meyarivan, T. A Fast Elitist Multiobjective Genetic Algorithm: NSGA-II. IEEE Trans. Evol. Comput. 2002, 6, 182–197. [Google Scholar] [CrossRef]
  43. Rigoni, E.; Turco, A. Metamodels for fast Multi-Objective Optimization: Trading Off Global Exploration and Local Exploitation. In Proceedings of the SEAL 2010 LNCS, Kanpur, India, 1–4 December 2010; Volume 6457, pp. 523–532. [Google Scholar]
  44. Salem, A.A.; Kalidindi, S.R.; Semiatin, S.L. Strain hardening due to deformation twinning in α-titanium: Constitutive relations and crystal-plasticity modeling. Acta Mater. 2005, 53, 3495–3502. [Google Scholar] [CrossRef]
  45. McKay, M.D.; Beckman, R.J.; Conover, W.J. A comparison of three methods for selecting values of input variables in the analysis of output from a computer code. Technometrics 1979, 21, 239–245. [Google Scholar]
  46. Shahba, A.; Ghosh, S. Crystal plasticity FE modeling of Ti alloys for a range of strain-rates. Part I: A unified constitutive model and flow rule. Int. J. Plast. 2016, 87, 48–68. [Google Scholar] [CrossRef]
Figure 1. True strain-true stress curve comparison of experimental data and optimum design for Ti-0Al.
Metals 07 00459 g001
Figure 2. < 002 > and < 100 > PFs at 9% compressive strain (Experimental data is given by Fitzner [32]).
Metals 07 00459 g002
Figure 3. Sensitivity analysis results for optimum design parameters of Ti-0Al. (a) Tension results; (b) Compression curve.
Metals 07 00459 g003
Figure 4. True strain-true stress curve comparison of experimental data and optimum design for Ti-7Al. (a) Tension curve; (b) Compression curve.
Metals 07 00459 g004
Figure 5. Comparison of Ti-7Al microstructures at 20% compressive strain.
Metals 07 00459 g005
Figure 6. < 001 > , < 100 > and < 101 > PFs at 20% compressive strain.
Metals 07 00459 g006
Figure 7. Sensitivity analysis results for optimum design parameters of Ti-7Al. (a) Tension results; (b) Compression curve.
Metals 07 00459 g007
Figure 8. CPFE simulation and SEM-DIC data comparison for e x x , e y y and e x y strain fields. (a) e x x strain field; (b) e y y strain field; (c) e x y strain field.
Metals 07 00459 g008
Table 1. Optimum slip system parameters of Ti-0Al.
Slip System s 0 h 0 s s a
Basal < a > 88 . 11 MPa 215 . 58 MPa 1175 . 9 MPa0.25
Prismatic < a > 89 . 49 MPa 215 . 58 MPa 1175 . 9 MPa0.25
Pyramidal < a > 161 . 13 MPa 215 . 58 MPa 1175 . 9 MPa0.25
Pyramidal < c + a > 355 . 17 MPa 215 . 58 MPa 1175 . 9 MPa0.25
Twinning 507 . 63 MPa 200 . 11 MPa 1175 . 9 MPa0.25
Table 2. Optimum slip system parameters of Ti-7Al.
Slip System s 0 h 0 s s a
Basal < a > 215 . 51 MPa 216 . 18 MPa 1534 . 20 MPa1.38
Prismatic < a > 250 . 00 MPa 216 . 18 MPa 1534 . 20 MPa1.38
Pyramidal < a > 991 . 40 MPa 216 . 18 MPa 1534 . 20 MPa1.38
Pyramidal < c + a > 999 . 30 MPa 216 . 18 MPa 1534 . 20 MPa1.38
Twinning 783 . 37 MPa 1049 . 70 MPa 1534 . 20 MPa3.96
Table 3. Critical Resolved Shear Stress (CRSS) values of different slip systems in Ti-7Al.
Reference s 0 basal s 0 prism s 0 pyr ( < c + a > ) s 0 pyr ( < a > ) s 0 twin
Nervo et al. [26]-- 3 5 × s 0 prism --
Williams et al. [28] s 0 prism s 0 basal ---
Lutjering and Williams [30]∼200 MPa∼200 MPa∼800 MPa--
Shahba and Ghosh [46]230 MPa205 MPa610 MPa--
Present study 215 . 51 MPa 250 . 00 MPa 999 . 30 MPa 991 . 40 MPa 783 . 37 MPa
1: The critical resolved shear stress (CRSS) value is different in this study [46] since the authors modeled two pyramidal < c + a > slip systems (1st and 2nd order).

