Article

Correlation between Zn-Rich Phase and Corrosion/Oxidation Behavior of Sn–8Zn–3Bi Alloy

1
Tianjin Key Lab of Composite and Functional Materials, School of Materials Science and Engineering, Tianjin University, Tianjin 300350, China
2
School of Mechanical, Materials and Mechatronic Engineering, University of Wollongong, Wollongong, New South Wales 2522, Australia
*
Author to whom correspondence should be addressed.
Metals 2016, 6(8), 175; https://doi.org/10.3390/met6080175
Submission received: 13 June 2016 / Revised: 13 July 2016 / Accepted: 20 July 2016 / Published: 25 July 2016
(This article belongs to the Special Issue Process-Structure-Property Relationships in Metals)

Abstract

:
The microstructure of Sn–8Zn–3Bi alloy was refined by increasing the solidification rate and the correlation between Zn-rich phase and the corrosion/oxidation behavior of the alloy was investigated. The Zn-rich phase transforms from coarse flakes to fine needles dispersed in the β-Sn matrix with the increase of the cooling rate. The transformation of Zn-rich precipitates enhances the anticorrosive ability of Sn–8Zn–3Bi alloy in 3.5 wt.% NaCl solution. On the contrary, Sn–8Zn–3Bi alloy with a fine needle-like Zn-rich phase shows poor oxidation resistance under air atmosphere, due to the fast diffusion of Zn atoms in Sn matrix.

Graphical Abstract

1. Introduction

Sn–Pb alloys have long been extensively used in microelectronic packaging industries due to their good wettability, excellent physical properties, low cost and low melting point [1]. However, in recent years, solder materials design has shifted focus to lead-free solder due to lead toxicity and its harmful effects on human health and the environment [2]. Accordingly, many lead-free Sn-based alloys with the addition of alloying elements have been investigated, such as Zn, Ag, Cu, Bi, In, Ni. Also, their microstructures, mechanical properties and solderability have been reported [3,4,5,6,7,8,9,10].
Among these lead-free solder alloys, the Sn–Zn based solder alloy has been found to be a promising candidate to replace the existing Sn–Pb eutectic solder, due to its relatively low melting temperature, superior mechanical properties at room temperature and relatively low cost [11,12,13,14,15]. Moreover, Bi is a surface active element and can reduce surface tension and eutectic temperature of the Sn–Zn system. So it has been added to the Sn–Zn alloy to form the ternary eutectic Sn–8Zn–3Bi with improved wettability and lower melting point [16,17].
To achieve high reliability in the long-term use process, solder materials are also required to exhibit high resistance to corrosion and oxidation conditions such as moisture, air pollutants and oceanic environments. In addition, relatively limited studies addressing their corrosion and oxidation behaviors are available [18,19,20,21]. So in the present work, the microstructure of Sn–8Zn–3Bi was manipulated by changing the solidification rate. We also concentrated on the relationship between the Zn-rich phase and the corrosion/oxidation behavior of the Sn–8Zn–3Bi alloy. These results provide crucial experimental input as a guide for fabricating Sn–Zn–Bi alloys in various harsh environments. It may be of reference value for researching the corrosion/oxidation behavior of other lead-free Sn-based alloys.

2. Experimental Procedures

The Sn–8Zn–3Bi alloy was prepared from the commercial pure Sn, Zn and Bi (Sn, Zn and Bi ingots with purity of 99.9%). Required quantities of the ingot were melted at 450 °C in a 25 kW medium frequency induction furnace under an inert argon atmosphere. The molten Sn–8Zn–3Bi alloy was homogenized at 500 °C, and then poured in a steel mold and porcelain crucible to prepare the chill cast ingot with rapid cooling rate (about 8 °C/S) and slow cooling rate (about 1 °C/S), respectively. Metallographic specimens were polished by a standard procedure. The microstructure characteristics of the specimens were observed using scanning electron microscope (Hitachi Model No. S4800).
Corrosion test was performed with samples in 3.5 wt.% NaCl solution, and its results were evaluated according to weight loss measurement. For the weight loss-measuring test, the samples (30 mm × 30 mm × 1 mm) were immersed in the NaCl solution for three, five, seven days. All electrochemical measurements were performed at room temperature (25 ± 2 °C) in a conventional three-electrode cell, a platinum plate as the counter electrode (CE) and a saturated calomel electrode (SCE) as the reference electrode (RE). The polarization curves were recorded in the anodic direction in the range of −1500 mV to 2000 mV at a scan rate of 0.5 mV/s. The oxidation property of the Sn–8Zn–3Bi solder alloy was conducted by a thermal gravimetric analyzer (TGA). The specimens were heated to 170 °C at a heating rate of 10 °C/min and hold for 2 h under air atmosphere.
Auger electron spectroscopy (AES) sputtering was used to analyze the distribution of Sn, Zn, Bi and O on the solder surface. The sputtering speed was 4 nm/m. Both the compositions and the chemical valence states of the elements in the corroded alloy were examined by using X-ray photoelectron spectroscopy (XPS) technique. And the calculation of the data was performed using XPS Peak 4.1 peak-fitting software.

3. Results and Discussion

Figure 1 shows the microstructures of slow cooling (SC) and rapid cooling (RC) Sn–8Zn–3Bi alloy. As shown in Figure 1a,c, it can be seen that coarse, long, flake-like Zn-rich phase uniformly distributes in the β-Sn matrix in the SC Sn–8Zn–3Bi alloy. Due to the large solid solubility of Bi in Sn, the addition of 3 wt.% Bi forms a solid solution of Bi in the Sn matrix, resulting in the invisibility of Bi in the microstructure. Notably, the rapid cooling rate obviously refines the solidification microstructure of Sn–8Zn–3Bi alloy (Figure 1b,d). The Zn-rich phase transforms to fine, short, needle-like precipitates dispersed in the β-Sn matrix in the rapid cooling Sn–8Zn–3Bi alloy.
Figure 2 shows the weight loss of the samples as a function of the duration time in 3.5 wt.% NaCl solution. For the slow cooling and rapid cooling Sn–8Zn–3Bi alloy, the weight loss increased with the duration time. Moreover, it needs to be pointed out that compared to Sn–8Zn–3Bi (SC), the alloy with the rapid cooling rate suffers from comparatively less corrosion attack and shows better corrosion resistance. The open circuit potential (OCP) against time (Eocp-t) curves of both alloys measured in NaCl 3.5 wt.% solution are shown in Figure 3. As seen from Figure 3, the values of OCP (EOCP) of Sn–8Zn–3Bi alloy gradually tend to be constant. From a comparison of curves, a positive shift in the EOCP was clearly found when the cooling rate was increased, which reveals that RC Sn–8Zn–3Bi alloy provides better protection.
Moreover, polarization curves for the samples are given in Figure 4, and related values extrapolated from the polarization curves are summarized in Table 1. The corrosion potentials (Ecorr) are −1.047 (SC) and −0.999 VSCE (RC) for the Sn–8Zn–3Bi alloys, respectively. It indicates that the value of Ecorr shifts towards the noble value with the increase of the cooling rate. The values of corrosion current density (Icorr) and polarization resistance (Rp) indicate that RC Sn–8Zn–3Bi alloy presents a lower corrosion rate and enhanced corrosion resistance compared to the SC alloy. Due to the same composition of the alloy, these results indicate that the better anticorrosive ability of the RC Sn–8Zn–3Bi alloy is strongly dependent on the transformation of the Zn-rich phase.
To better reveal the correlation between the Zn-rich phase and the corrosion behavior of Sn–8Zn–3Bi alloy, SEM micrographs are displayed in Figure 5. The pronounced degradation of the surface morphology with immersion time can be observed. At 5 h of immersion in NaCl 3.5 wt.% solution, the corrosion reactions occurred along the large plate-like Zn-rich precipitates in SC Sn–8Zn–3Bi (Figure 5a). Notably, the fine needle-like Zn-rich particles in RC alloy showed no obvious change (Figure 5b). When further increasing the duration time to 12 h in 3.5% NaCl solution, a concomitantly low level of surface attack was observed for RC Sn–8Zn–3Bi alloy (Figure 5d). In addition, many pits and grooves could be observed, but shorter and shallower in depth compared to those in SC alloy (Figure 5c).
During the process of Sn–8Zn–3Bi immersed in 3.5% NaCl solution, the Cl can adsorb onto the passive film, followed by penetration through intergranular boundaries of the oxides [22]. Also, the Cl can migrate to the film/alloy interface to react with Zn to form chloride complexes [23]. Continuous growth of these complexes gives rise to internal stress at the interface due to volume expansion, and thus results in the breakdown of localized regions, followed by pit initiation at the initial Zn sites. Moreover, because of the large solid solubility of Bi in Sn, Bi forms a solid solution of Sn matrix in Sn–8Zn–3Bi alloy, which is expected to affect the difference of the corrosion potential between the Zn-rich phase and the Sn matrix to some extent. So, in the case of corrosion susceptibility, Zn still exhibits a more negative corrosion potential value than Sn, and preferentially dissolves due to galvanic coupling and thus promotes the pitting process inwards in the alloys. This is consistent with the observation in Figure 5. Figure 6 depicts the XPS peak-fitting analysis for Zn2p3/2 obtained from SC and RC Sn–8Zn–3Bi in 3.5 wt.% NaCl solution, which confirms that the Zn element exists as Zn2+ and Zn° on the surface of corroded Sn–8Zn–3Bi alloy. These results indicate that the amount of Zn has been preferentially dissolved. The formation of pits and grooves (Figure 5) is attributed to the removal of active materials, particularly Zn.
In addition, Cl anions further migrate along the intergranular boundaries between Zn-rich precipitates and the Sn matrix, where the boundaries can provide an efficient diffusion path to the transport of Cl and promote the pitting process. Coarse, long, Zn-rich precipitates distribute in SC Sn–8Zn–3Bi, corresponding to larger intergranular boundaries with lower activation energy for the dissolution of Zn, compared to the fine, needle-like Zn-rich phase [22,24]. The corrosion oxide films around the boundaries show high activity and more defects may be formed in those regions due to the weakening of the bond between Zn-rich precipitates and the Sn matrix, which could promote the transport of Cl inwards in the alloy. Consequently, the pitting susceptibility of Sn–8Zn–3Bi increases with the increase of the size of the Zn-rich precipitates. In other words, the Sn–8Zn–3Bi alloy with fine Zn-rich precipitates shows superior protective behavior against the transport of Cl and pitting. Sn–8Zn–3Bi alloys with a fine Zn-rich phase are highly beneficial for the solder fabrication industries to achieve a superior anticorrosion behavior.
On the other hand, oxidation resistance also plays a significant role in the practical application of the lead-free solder. Figure 7 shows two samples of the time-dependence of the oxidized weight gain for Sn–8Zn–3Bi exposed to air atmosphere by TGA analysis. The weight gain of the alloy increases due to the oxidation of the solder. Interestingly, a more rapid increase is observed for the RC Sn–8Zn–3Bi alloy with a fine Zn-rich phase compared to the SC alloy.
To understand the mechanism of the oxidation of the Sn–8Zn–3Bi solder, the oxidation surfaces of the samples were investigated by Auger analysis and scanning electron microscope. Figure 8 shows the results of the Auger analysis and Auger depth profiles of the two samples. In both specimens, only Zn and O elements were observed on the oxide surface without Bi and Sn. After etching a certain depth (44 nm), Bi and Sn were detected, as shown in Figure 8a,c. The result implies that the oxide ZnO prefers to form on the free surface of the samples.
The standard Gibbs free energies of the formation of ZnO and SnO2 are −300 kJ/mol and −237 kJ/mol, respectively [25]. As the samples were exposed to air atmosphere at 170 °C, the Zn on the free surface soon reacted with oxygen and formed ZnO on the free surface. The phase transformation from Zn to ZnO is accompanied by a volume expansion and the stress is induced by the volume expansion of ZnO. As a result, cracks occurred on the surface of the Zn-rich phase, as shown in Figure 9. Moreover, Zn massively diffused in the Sn matrix and exhibited strong segregation from the Sn grain boundaries to form oxides [26,27]. Fast diffusion of Zn or O dominated the oxidation process. As a result, an oxide ZnO layer was formed as a uniform layer, and Sn and Bi were not segregated on the oxide surface (Figure 8a,c). As shown in Figure 8b,d, the oxygen concentration tends to reduce gradually with the increase of the sputtering time, indicating that the oxidation propagation takes place from the free surface to the inside of the alloy. Bi can dissolve into the Sn matrix, forming a solid solution, which causes the Sn matrix to become liable to form cracks and promotes the diffusion of Zn [27]. Furthermore, a high distortion energy is expected in the Sn lattice due to the solid solution formation. The high distortion energy of the Sn matrix can also promote Zn diffusion [28].
Moreover, the oxidized layer thickness is also evaluated by the product of the sputtering time and sputtering rate. The RC Sn–8Zn–3Bi alloy has a thicker oxide layer (16.3 nm) than the SC alloy (10 nm). In the RC Sn–8Zn–3Bi alloy, the Zn-rich phase has a smaller size, higher density and more uniform distribution, in comparison to that in the SC alloy (Figure 9). Therefore, fast diffusion of Zn atoms in the Sn matrix with a short diffusion distance can be expected. Meanwhile, because the oxygen diffused along the interfaces between the Zn particles and the Sn matrix [26,27], the interdiffusion of O atoms is also accelerated, thus increasing the oxidation rate of the alloy. As a result, Sn–8Zn–3Bi alloy with a fine needle-like Zn-rich phase shows poor oxidation resistance under air atmosphere. However, there is no reference data for diffusion coefficients obtained at the corresponding exposure condition. The detail kinetics and behavior of the Sn–8Zn–3Bi alloy remain a topic to be researched and determined.

4. Conclusions

The increase of the cooling rate significantly refines the solidification microstructure of Sn–8Zn–3Bi alloy. The Zn-rich phase transforms from coarse, long flakes to fine, short needles distributed in the β-Sn matrix. In the case of corrosion susceptibility in 3.5% NaCl solution, Zn exhibits a more negative corrosion potential value and presents preferential dissolution. The transformation of the Zn-rich precipitates results in the Sn–8Zn–3Bi alloy exhibiting a superior protective performance. On the contrary, as the alloy is exposed to air atmosphere at 170 °C, diffusion of Zn or O dominates the oxidation process, and the Zn on the free surface reacts with oxygen and forms ZnO on the free surface. As a result, the refined Zn-rich phase weakens the oxidation resistance of the Sn–8Zn–3Bi alloy, due to the fast diffusion of Zn atoms in the Sn matrix.

Acknowledgments

This work was supported by a grant from National Science Fund for Distinguished Young Scholars of China (No. 51325401), the National Natural Science Foundation of China (No. 51404169) and the Natural Science Foundation of Tianjin (No. 15JCQNJC03200).

Author Contributions

Chong Li, Yongchang Liu and Huijun Li conceived and designed the experiments; Xin Zhang performed the experiments and wrote the manuscript; Zhiming Gao, Zongqing Ma and Liming Yu analyzed the data and revised the manuscript.

Conflicts of Interest

The authors declare no conflicts of interest.

References

  1. Tu, K.N.; Zeng, K. Tin-lead (SnPb) solder reaction in flip chip technology. Mater. Sci. Eng. R 2001, 34, 1–58. [Google Scholar] [CrossRef]
  2. Wood, E.P.; Nimmo, K.L. In search of new lead-free electronic solders. J. Electron. Mater. 1994, 23, 709–713. [Google Scholar] [CrossRef]
  3. Guang, R.; Wilding, I.J.; Collins, M.N. Alloying influences on low melt temperature SnZn and SnBi solder alloys for electronic interconnections. J. Alloy. Compd. 2016, 665, 251–260. [Google Scholar]
  4. Fawzy, A. Effect of Zn addition, strain rate and deformation temperature on the tensile properties of Sn–3.3 wt.% Ag solder alloy. Mater. Charact. 2007, 58, 323–331. [Google Scholar] [CrossRef]
  5. Pereira, P.D.; Spinelli, J.E.; Garcia, A. Combined effects of Ag content and cooling rate on microstructure and mechanical behavior of Sn–Ag–Cu solders. Mater. Des. 2013, 45, 377–383. [Google Scholar] [CrossRef]
  6. El-Daly, A.A.; Desoky, W.M.; Saad, A.F.; Mansor, N.A.; Lotfy, E.H.; Abd-Elmoniem, H.M.; Hashem, H. The effect of undercooling on the microstructure and tensile properties of hypoeutectic Sn–6.5Zn–xCu Pb-free solders. Mater. Des. 2015, 80, 152–162. [Google Scholar] [CrossRef]
  7. Osório, W.R.; Peixoto, L.C.; Garcia, L.R.; Noël, N.M.; Garcia, A. Microstructure and mechanical properties of Sn–Bi, Sn–Ag and Sn–Zn lead-free solder. J. Alloy. Compd. 2013, 572, 97–106. [Google Scholar] [CrossRef]
  8. Liu, J.C.; Zhang, G.; Wang, Z.H.; Ma, J.S.; Suganuma, K. Thermal property, wettability and interfacial characterization of novel Sn–Zn–Bi–In alloys as low-temperature lead-free solders. Mater. Des. 2015, 84, 331–339. [Google Scholar] [CrossRef]
  9. Spinelli, J.E.; Silva, B.L.; Garcia, A. Assessment of tertiary dendritic growth and its effects on mechanical properties of directionally solidified Sn-0.7Cu-xAg solder alloys. J. Electron. Mater. 2014, 43, 1347–1361. [Google Scholar] [CrossRef]
  10. Silva, B.L.; Cheung, N.; Garcia, A.; Spinelli, J.E. Sn–0.7 wt%Cu–(xNi) alloys: Microstructure–mechanical properties correlations with solder/substrate interfacial heat transfer coefficient. J. Alloy. Compd. 2015, 632, 274–285. [Google Scholar] [CrossRef]
  11. Garcia, L.R.; Osório, W.R.; Peixoto, L.C.; Garcia, A. Mechanical properties of Sn–Zn lead-free solder alloys based on the microstructure array. Mater. Charact. 2010, 61, 212–220. [Google Scholar] [CrossRef]
  12. Lin, S.; Xue, S.B.; Xue, P.; Luo, D.X. Present status of Sn–Zn lead-free solders bearing alloying elements. J. Mater. Sci. Mater. Electron. 2015, 26, 4389–4411. [Google Scholar]
  13. El-Daly, A.A.; Hammad, A.E.; Al-Ganainy, G.S.; Ibrahiem, A.A. Design of lead-free candidate alloys for low-temperature soldering applications based on the hypoeutectic Sn–6.5Zn alloy. Mater. Des. 2014, 56, 594–603. [Google Scholar] [CrossRef]
  14. Garcia, L.R.; Peixoto, L.C.; Osório, W.R.; Garcia, A. Globular to needle Zn-rich phase transition during transient solidification of a eutectic Sn–9% Zn solder alloy. Mater. Lett. 2009, 63, 1314–1316. [Google Scholar] [CrossRef]
  15. Garcia, L.R.; Osório, W.R.; Peixoto, L.C.; Garcia, A. Wetting behavior and mechanical properties of Sn-Zn and Sn-Pb solder alloys. J. Electron. Mater. 2009, 38, 2405–2414. [Google Scholar] [CrossRef]
  16. Zhou, J.; Sun, Y.S.; Xue, F. Properties of low melting point Sn–Zn–Bi solders. J. Alloy. Compd. 2005, 397, 260–264. [Google Scholar] [CrossRef]
  17. Song, J.M.; Wu, Z.M. Variable eutectic temperature caused by inhomogeneous solute distribution in Sn–Zn system. Scr. Mater. 2006, 54, 1479–1483. [Google Scholar] [CrossRef]
  18. Marcus, P.; Maurice, V.; Strehblow, H.H. Localized corrosion (pitting): A model of passivity breakdown including the role of the oxide layer nanostructure. Corros. Sci. 2008, 50, 2698–2704. [Google Scholar] [CrossRef]
  19. Liu, N.S.; Lin, K.L. Effect of Ga on the Oxidation properties of Sn–8.5Zn–0.5Ag–0.1Al–xGa solders. Oxid. Met. 2012, 78, 285–294. [Google Scholar] [CrossRef]
  20. Kim, S.H.; Hui, K.N.; Kim, Y.J.; Lim, T.S.; Yang, D.Y.; Kim, K.B.; Kim, Y.J.; Yang, S. Oxidation resistant effects of Ag2S in Sn–Ag–Al solder: A mechanismfor higher electrical conductivity and less whisker growth. Corros. Sci. 2016, 105, 25–35. [Google Scholar] [CrossRef]
  21. Nazeri, M.F.M.; Mohamad, A.A. Corrosion resistance of ternary Sn–9Zn–xIn solder joint in alkaline solution. J. Alloy. Compd. 2016, 661, 516–525. [Google Scholar] [CrossRef]
  22. Liu, J.C.; Park, S.W.; Nagao, S.; Nogi, M.; Koga, H.; Ma, J.S.; Zhang, G.; Suganuma, K. The role of Zn precipitates and Cl anions in pitting corrosion of Sn–Zn solder alloys. Corros. Sci. 2015, 92, 263–271. [Google Scholar] [CrossRef]
  23. Burstein, G.; Liu, C.; Souto, R.; Vines, S. Origins of pitting corrosion. Corros. Eng. Sci. Technol. 2004, 39, 25–30. [Google Scholar] [CrossRef]
  24. Liu, J.C.; Zhang, G.; Ma, J.S.; Suganuma, K. Ti addition to enhance corrosion resistance of Sn–Zn solder alloy by tailoring microstructure. J. Alloy. Compd. 2015, 644, 113–118. [Google Scholar] [CrossRef]
  25. Barin, I. Thermochemical Data of Pure Substances; VCH: New York, NY, USA, 1995; Volume 2, p. 1549. [Google Scholar]
  26. Lee, J.E.; Kim, K.S.; Inoue, M.; Jiang, J.X.; Suganuma, K. Effects of Ag and Cu addition on microstructural properties and oxidation resistance of Sn–Zn eutectic alloy. J. Alloy. Compd. 2008, 454, 310–320. [Google Scholar] [CrossRef]
  27. Jiang, J.X.; Lee, J.E.; Kim, K.S.; Suganuma, K. Oxidation behavior of Sn–Zn solders under high-temperature and high-humidity conditions. J. Alloy. Compd. 2008, 462, 244–251. [Google Scholar] [CrossRef]
  28. Mrowec, S. Defects and Diffusion in Solids: An Introduction; Elsevier Scientific: New York, NY, USA, 1980. [Google Scholar]
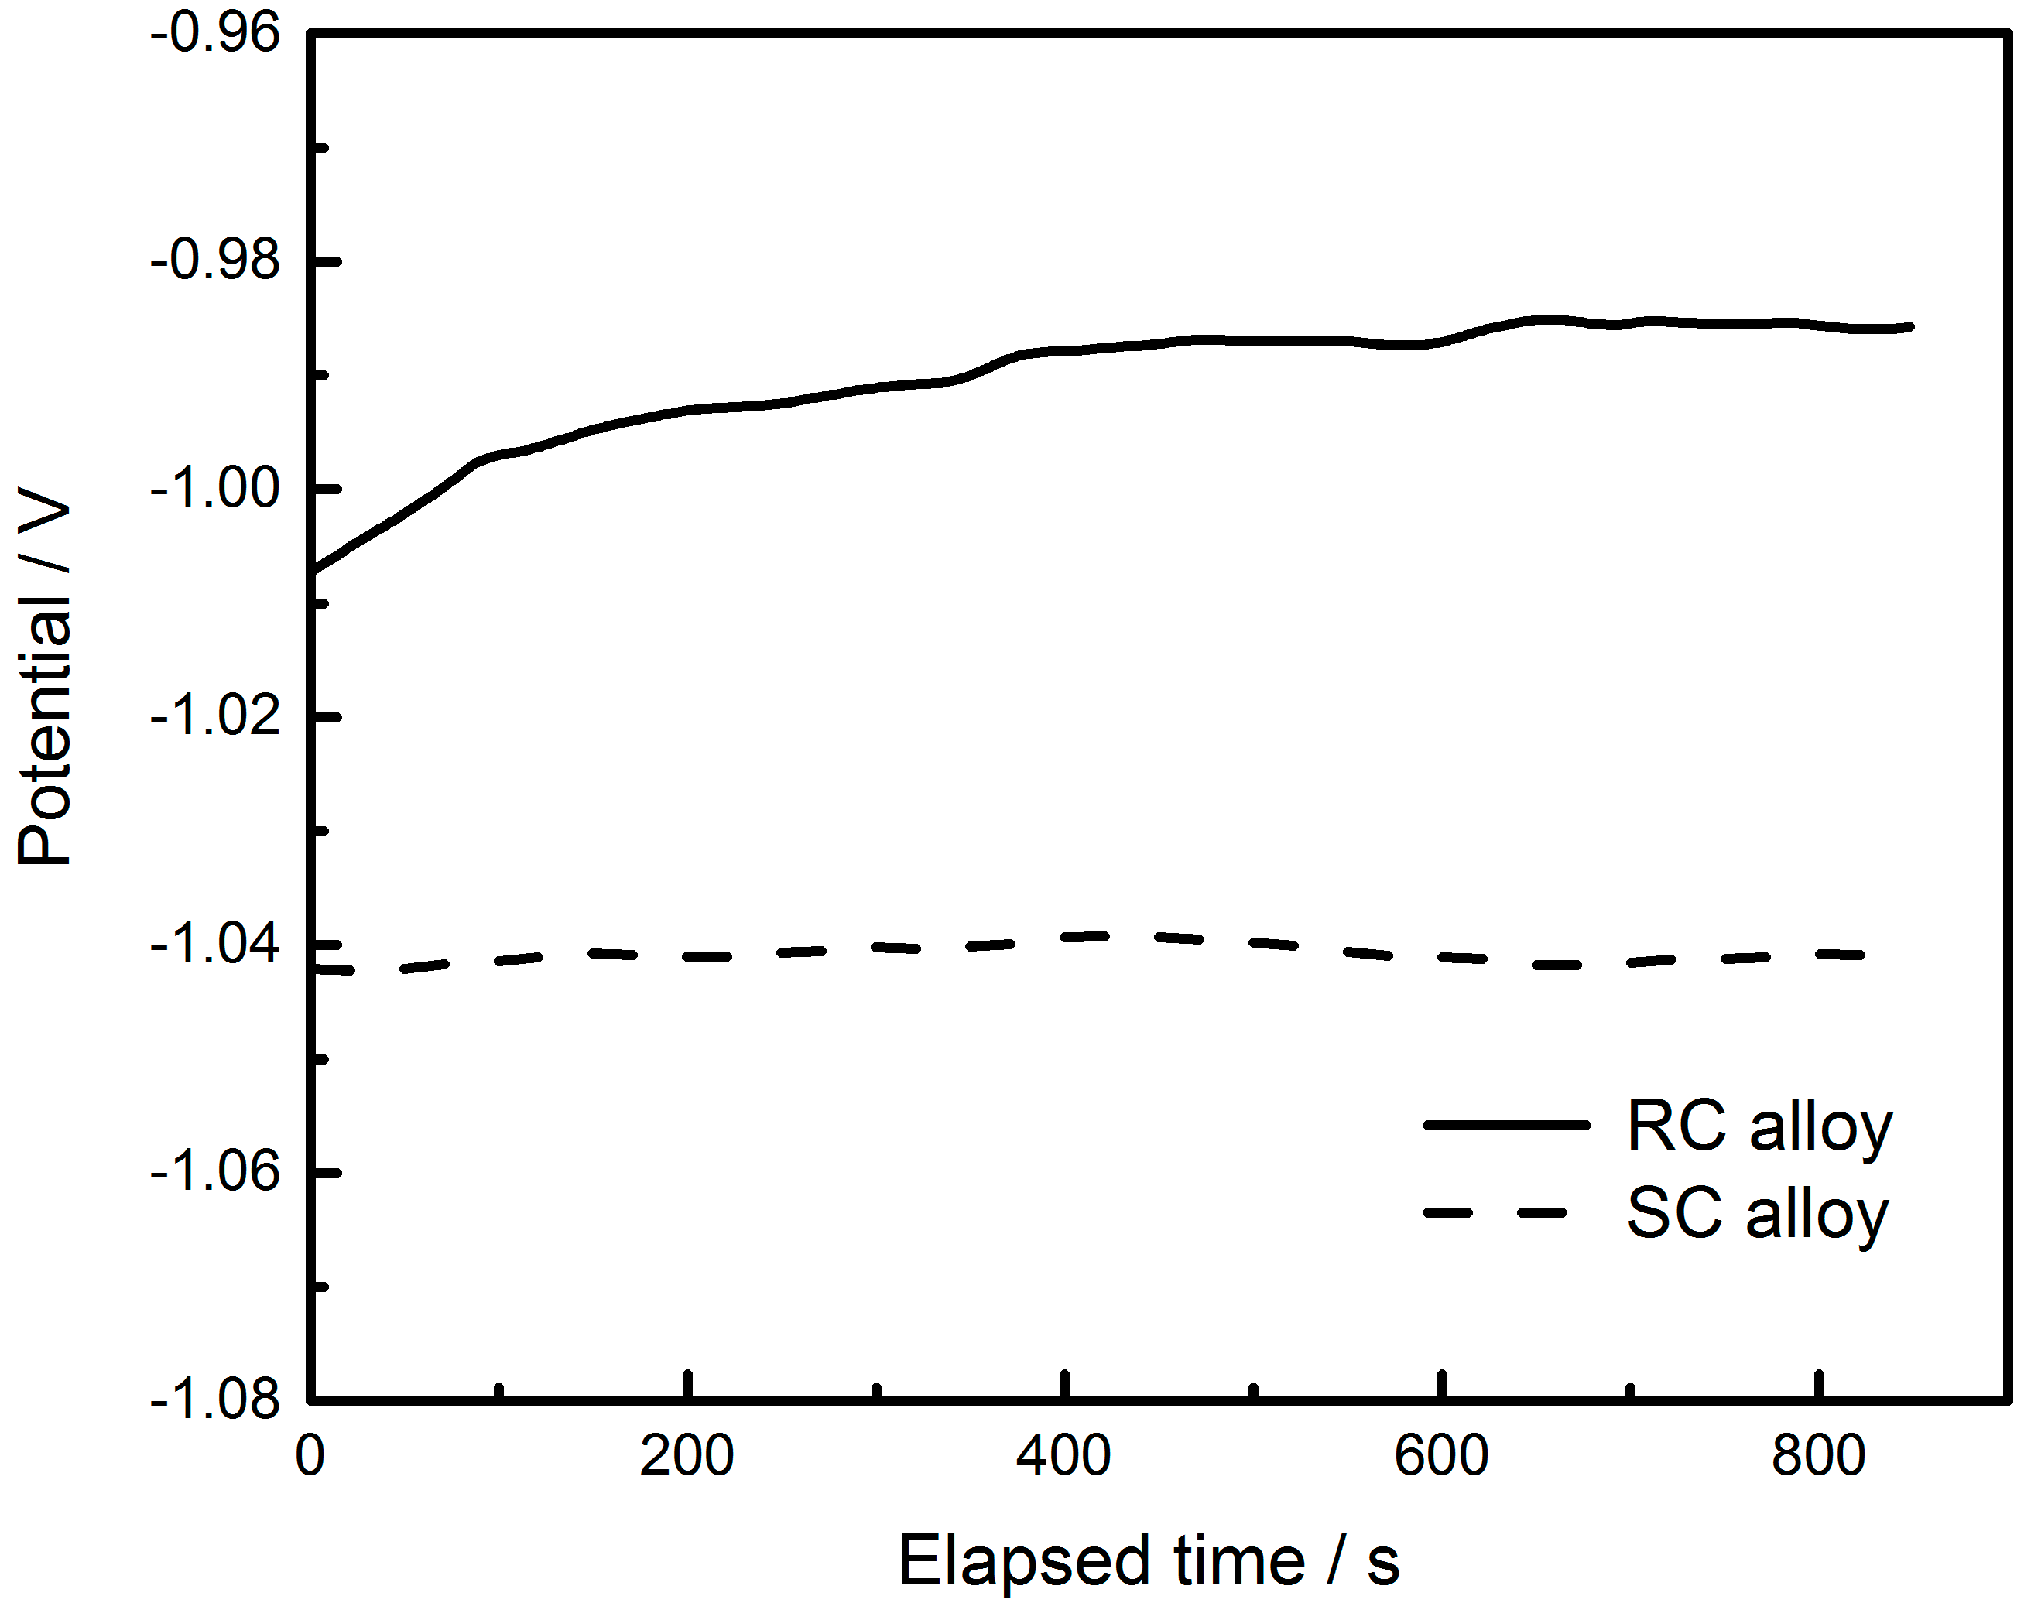
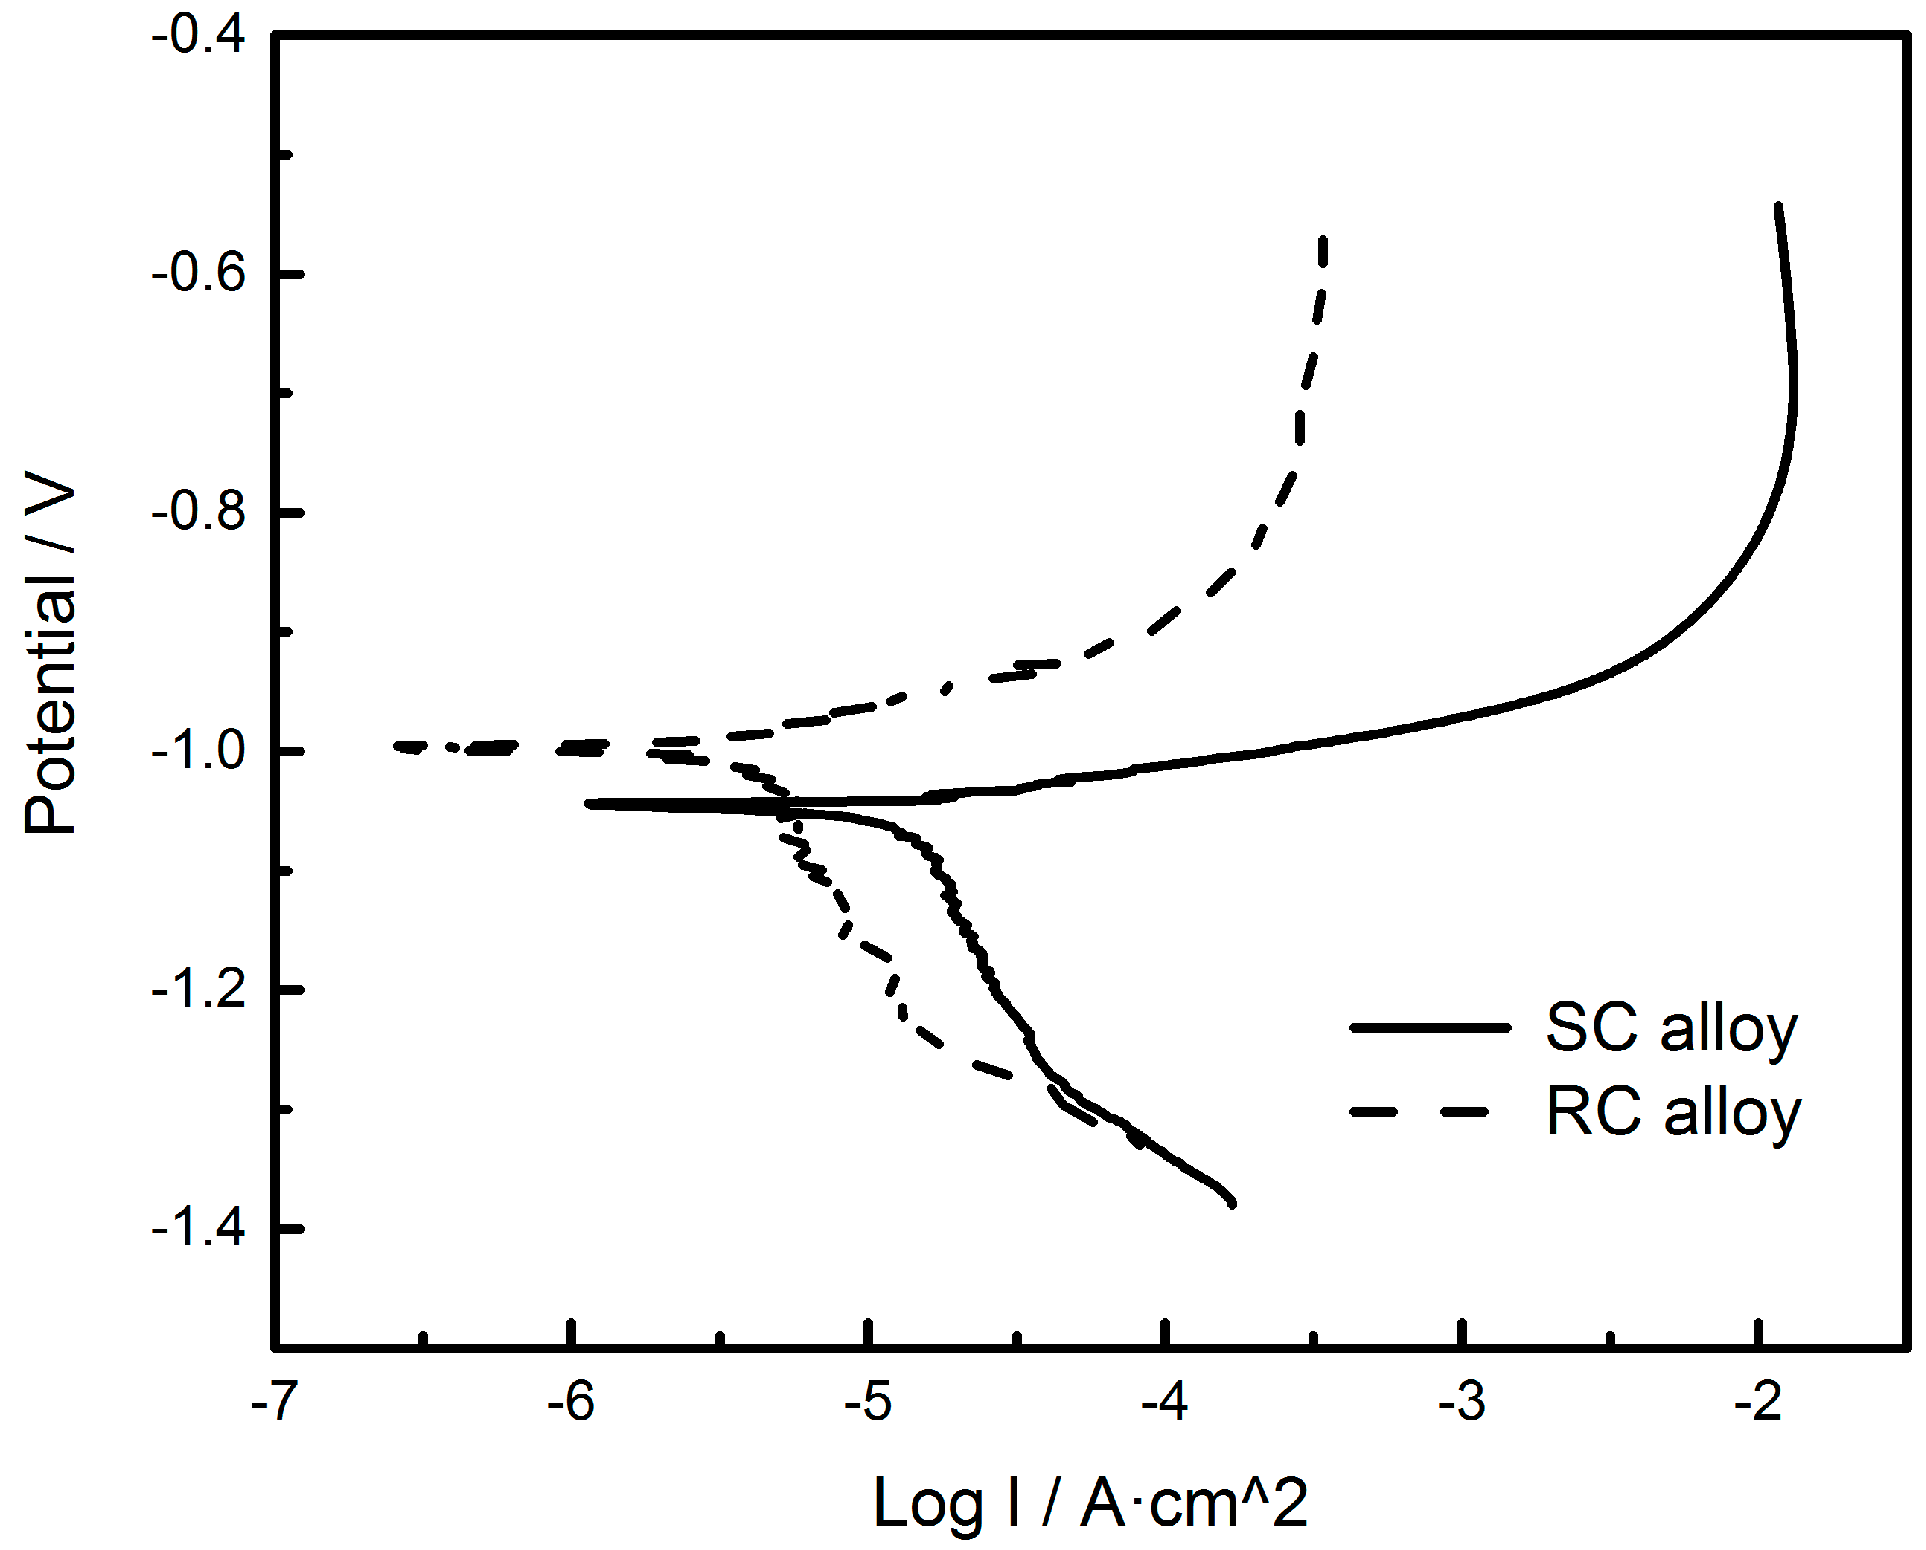
Figure 1. Microstructures of Sn–8Zn–3Bi alloy: (a) slow cooling rate (SC); (b) rapid cooling rate (RC); (c) enlarged morphology of Zn-rich phase in (a); (d) enlarged morphology of Zn-rich phase in (b).
Metals 06 00175 g001
Figure 2. Weight loss of Sn–8Zn–3Bi alloy with two solidification rates as a function of duration time in 3.5% NaCl environment.
Metals 06 00175 g002
Figure 3. Open circuit potential curves for Sn–8Zn–3Bi solder alloy.
Metals 06 00175 g003
Figure 4. Potentiodynamic polarization curves of Sn–8Zn–3Bi solder alloy with two cooling rates in 3.5 wt.% NaCl solution.
Metals 06 00175 g004
Figure 5. SEM images of Sn–8Zn–3Bi solder alloy after immersed in 3.5% NaCl solution for 5 h ((a): SC alloy; (b): RC alloy) and 12 h ((c): SC alloy; (d): RC alloy).
Metals 06 00175 g005
Figure 6. XPS spectrum for Zn2p3/2 obtained from Sn–8Zn–3Bi solder alloy in 3.5 wt.% NaCl solution at room temperature: (a) SC alloy; (b) RC alloy.
Metals 06 00175 g006
Figure 7. TGA curves of lead-free Sn–8Zn–3Bi solder alloy.
Metals 06 00175 g007
Figure 8. Auger surface analysis of RC alloy (a) and SC alloy (c); Auger depth profiles of RC alloy (b) and SC alloy (d) (from surface to etching about 20 nm).
Metals 06 00175 g008
Figure 9. SEM images of Sn–8Zn–3Bi solder alloy after 170 °C 2 h exposure under air atmosphere: (a) SC alloy; (b) RC alloy.
Metals 06 00175 g009
Table 1. Corrosion parameters of the studied Sn–8Zn–3Bi solder in 3.5 wt.% NaCl solution at room temperature.
SampleEcorr vs. SCE/ (V)Icorr (A·cm−2)Rp/(Ω·cm2)OCP/(V)
SC−1.0471.298 × 10−51490.5−1.042
RC−0.9993.907 × 10−69832.9−0.985

