Article

In Vitro Analysis of the Tribological Behaviour of Different Material Combinations for Telescopic Crowns

Department of Prosthetic Dentistry, Faculty of Medicine, TU Dresden, Fetscherstr. 74, Dresden 01307, Germany
*
Author to whom correspondence should be addressed.
Metals 2016, 6(7), 149; https://doi.org/10.3390/met6070149
Submission received: 24 May 2016 / Revised: 15 June 2016 / Accepted: 17 June 2016 / Published: 30 June 2016

Abstract

:
Telescopic crowns are used to connect removable dental prostheses with the remaining dentition. Several material combinations are used for manufacturing primary and secondary crowns. The present experimental study analysed the influence of different material combinations on the long-term development of surface roughness and pull-off forces. Six different material combinations were tested. Secondary crowns were manufactured either by casting or electroforming. Each material combination was tested with n = 10 specimens. A material testing device with integrated power sensors was used for 10,000 cycles per test. Signs of wear were identified by surface roughness measurements, and visualized by a scanning electron microscope (SEM) and X-ray spectroscopy (EDX) technologies. Statistical significances were tested by using the U-Test with Bonferroni correction. The choice of materials and the manufacturing process were found to influence the long-term development of pull-off forces as well as wear-associated surface roughness. Combinations of different groups of materials for primary and secondary crowns showed favourable results. Worse results were found for the combination pure titanium and pure titanium and the combination high gold alloy and electroformed gold. Wear-associated surface roughness was higher for combinations of similar or identical groups of materials. For manufacturing telescopic crowns, combinations of different groups of materials are preferred. For secondary crown manufacturing, electroforming is superior to casting.

1. Introduction

Telescopic crowns are widely used elements [1] for a safe and secure connection between removable dental prostheses and the remaining dentition [2,3,4,5,6,7]. Also, subjective evaluations by patients are positive [8,9]. Telescopic crowns can also be used for connecting implant-supported and tooth-implant-supported removable dental prostheses [10]. Focussing on the clinical performance of cylindrical telescopic crowns, a reduction of pull-off (and retentive) forces during their operating life had to be stated [6,11,12]. This often led to a significant reduction of denture retention. There was the attempt to renew retention by laser welding alloy particles into the secondary crown [7], but this remained mostly unsuccessful. The introduction of modern ceramic materials and modern computer aided design/computer aided manufacturing (CAD-CAM) technologies in dentistry offered new material options, including for telescopic crowns.
Therefore, the aim of this study was to evaluate the influence of different material combinations and different manufacturing technologies on the long-term development of pull-off forces and wear resistance in a close-to-practice in vitro environment. The following hypotheses were stated:
  • The choice of the material combination for primary and secondary crown affects the pull-off forces at the beginning of the period of use.
  • At the beginning of the period of use, pull-off forces for combinations of different groups of materials are smaller compared to combinations of similar or identical groups.
  • Combinations of similar or identical groups of materials show a higher long-term reduction of retentive forces compared to combinations of different groups.
  • Pull off forces are influenced by the secondary crowns’ manufacturing technology—the variability of pull-off forces is smaller for electroformed secondary crowns compared to casted ones.
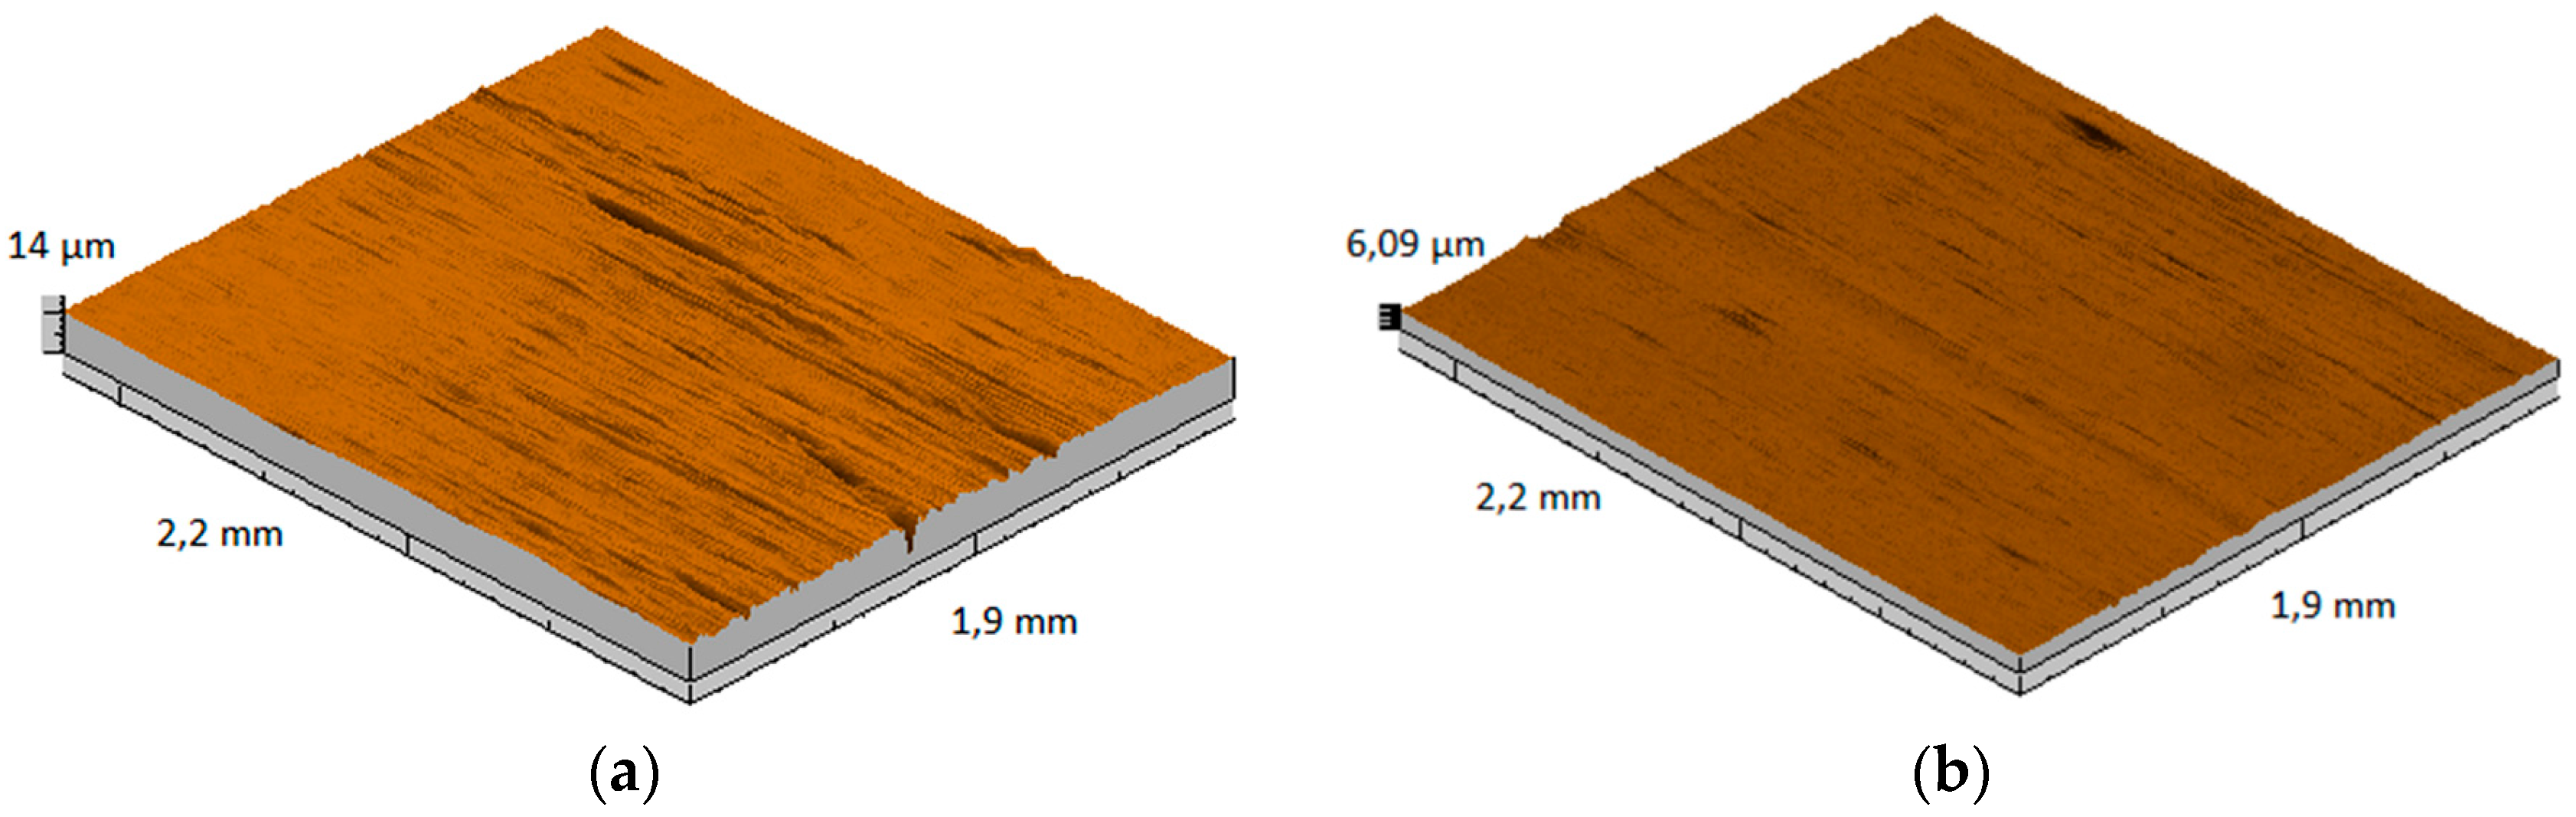
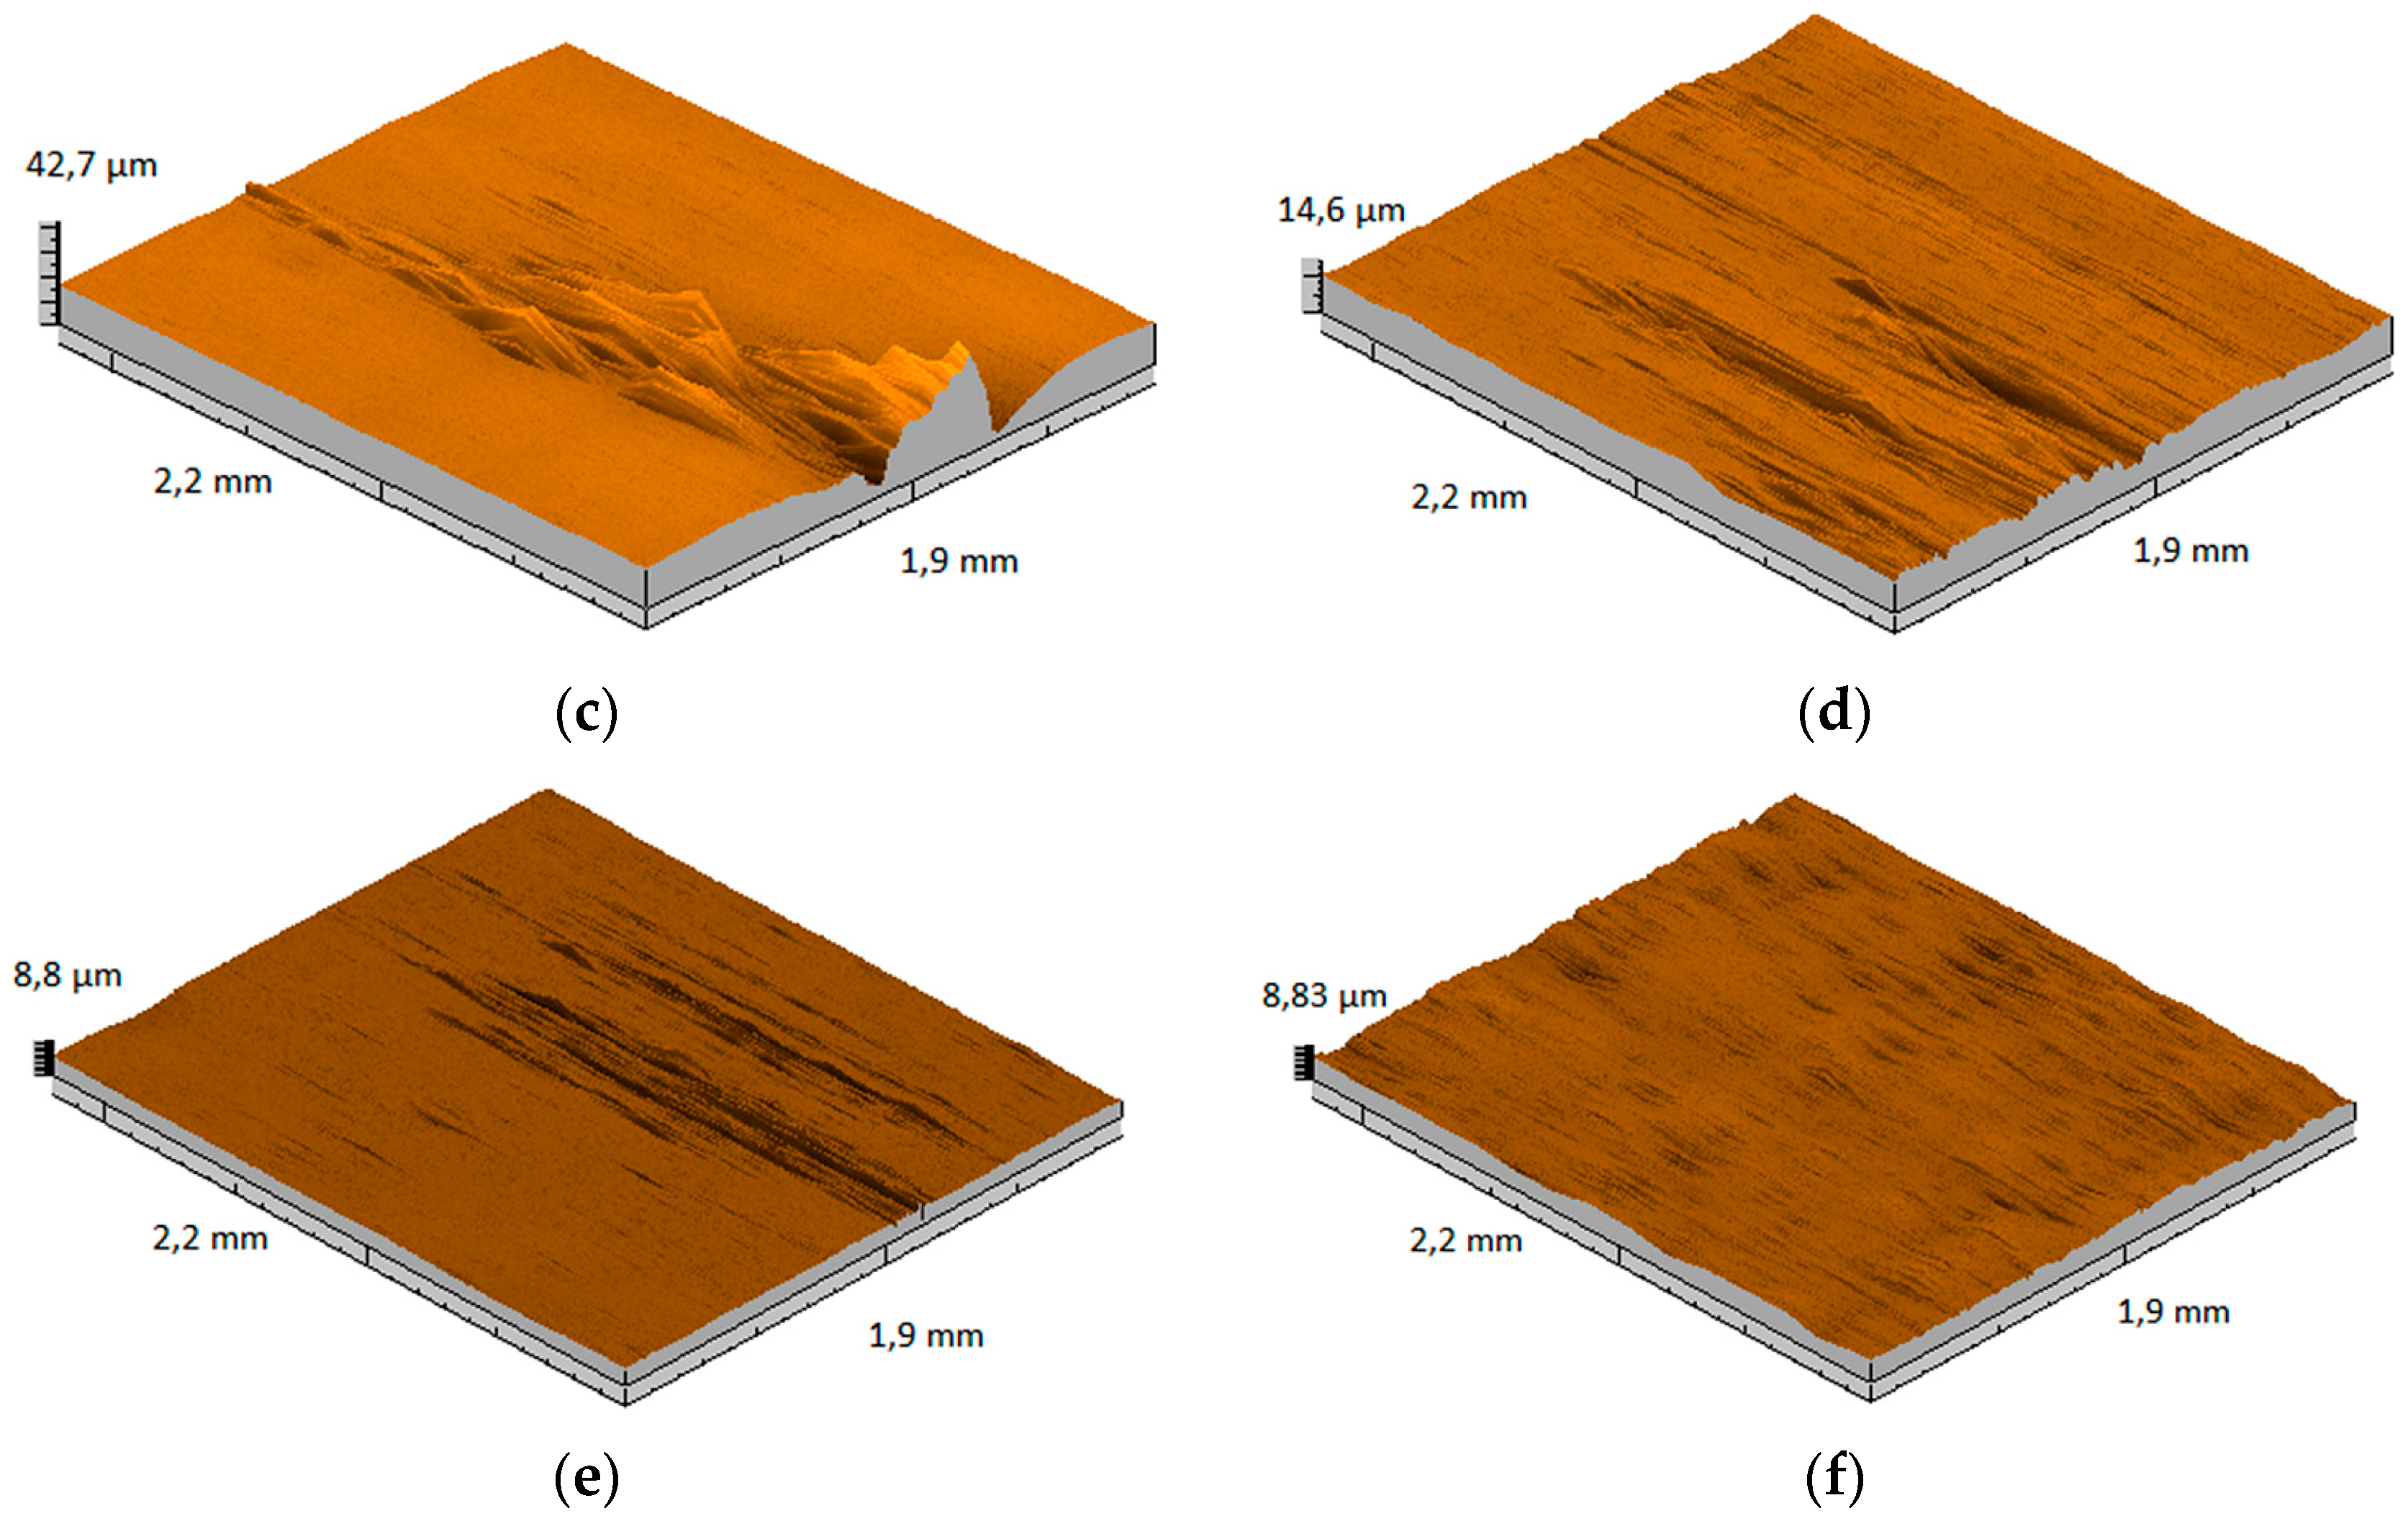
  • Wear-associated surface roughness on primary crowns’ surfaces are larger for combinations of similar or identical groups of materials compared to combinations of different groups.

2. Experimental Section
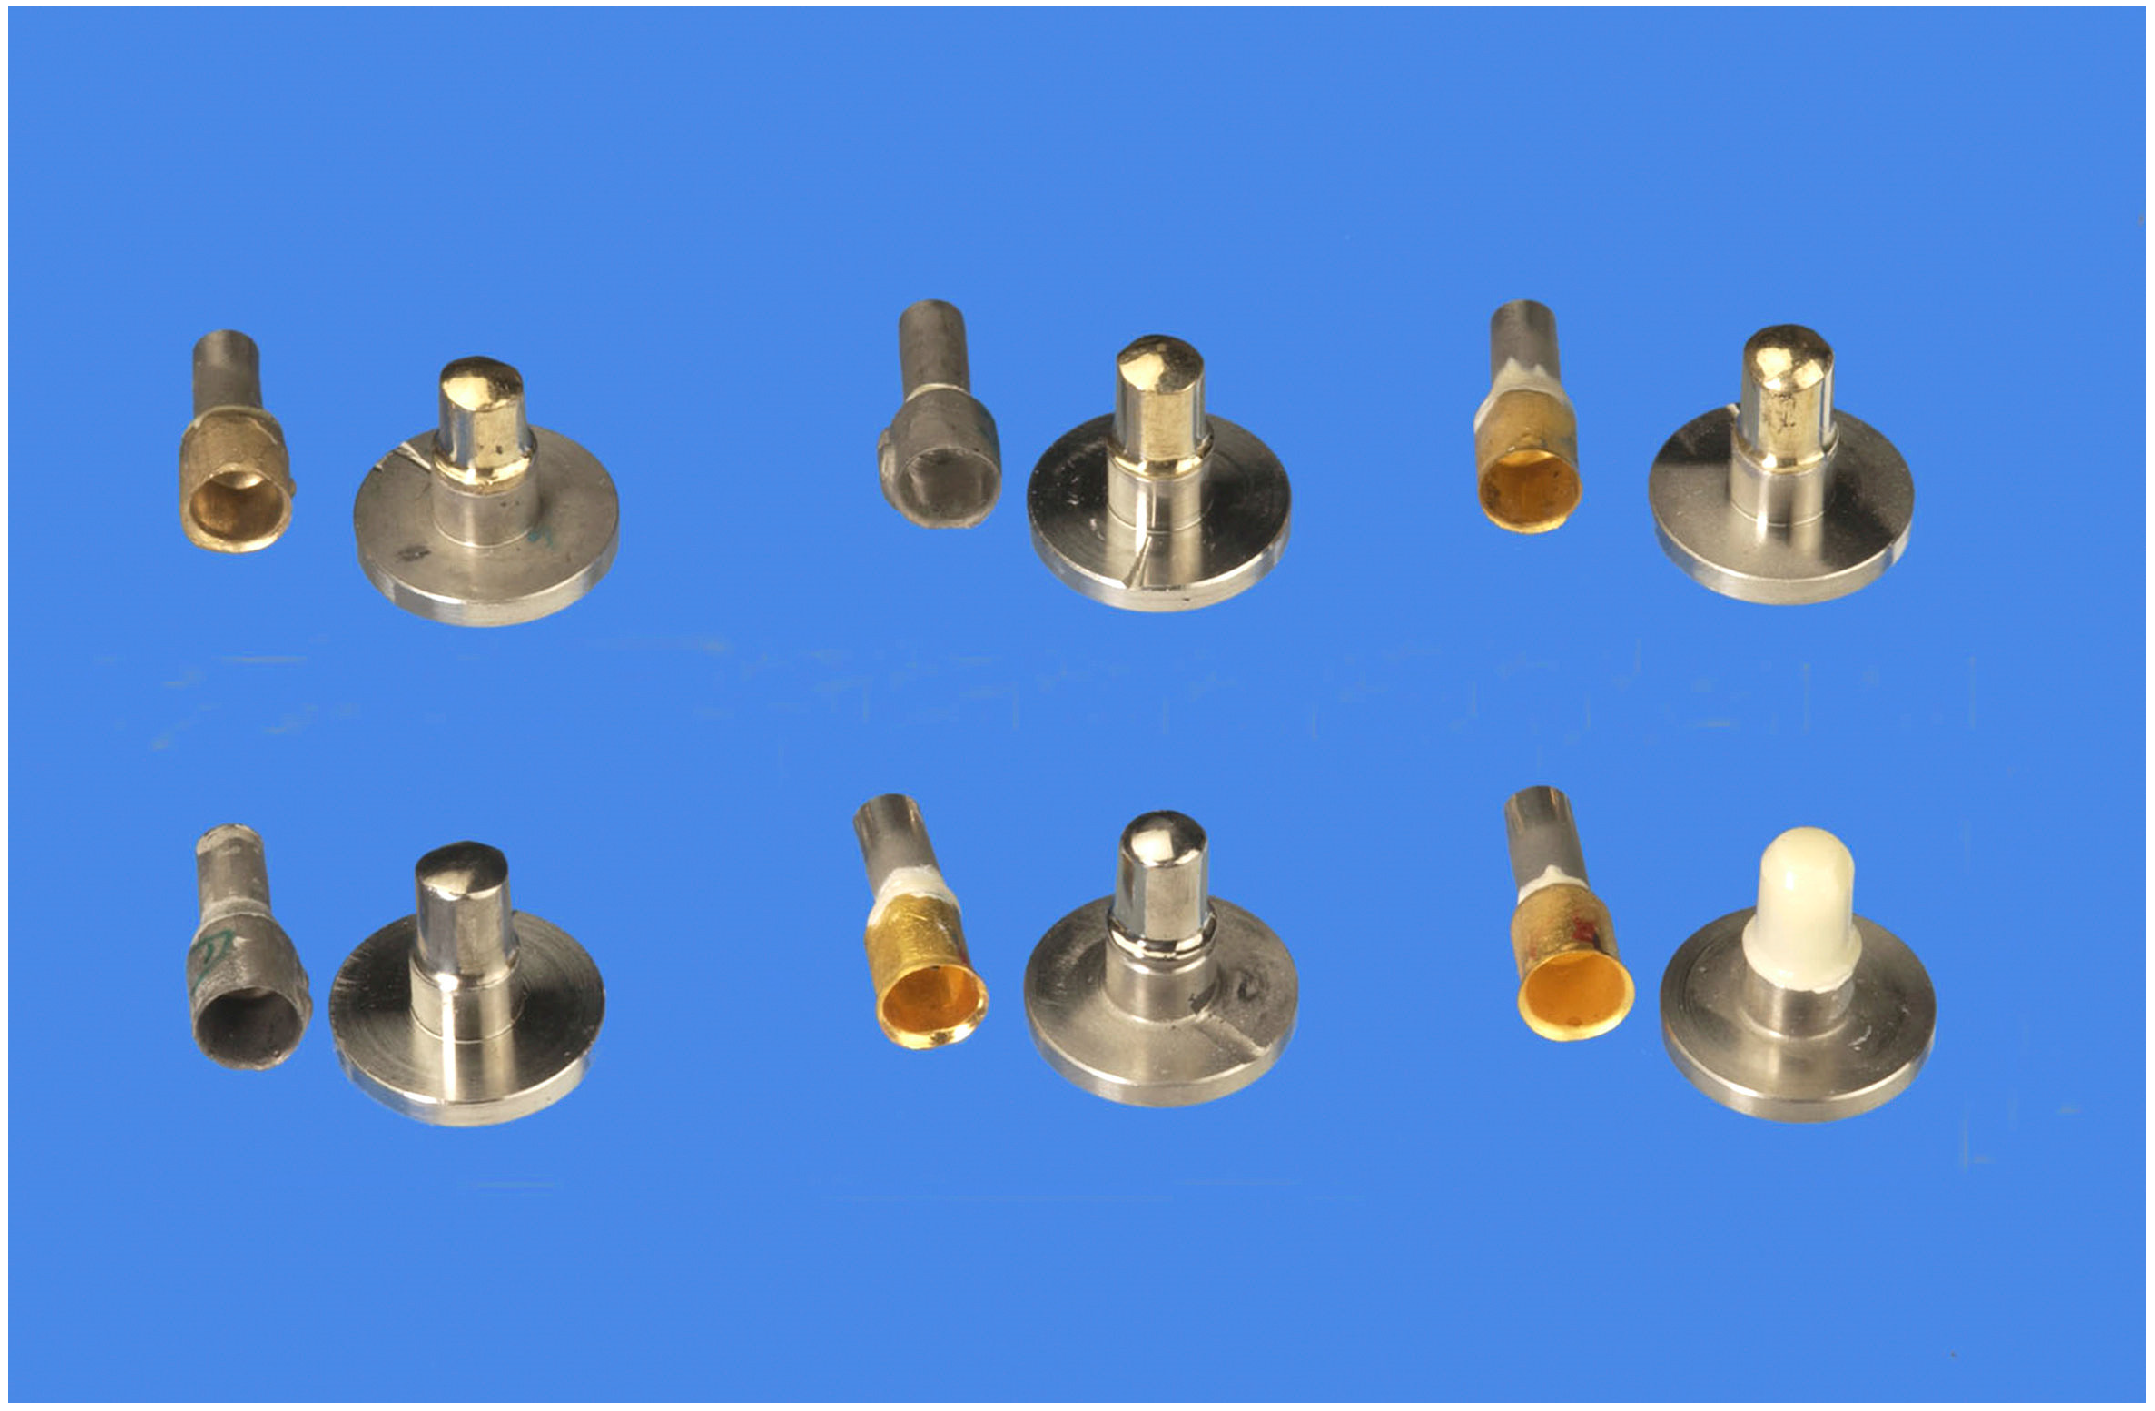
2.1. Materials

Only cylindrical telescopic crowns with identical sizes and dimensions were part of this analysis. The choice of the different material combinations for this study was influenced by the practical importance of the combinations (Table 1). The different materials, machines, and manufacturing technologies are summarized in Table 2. For manufacturing the cylindrical telescopic crowns, a framework based on a clinically prepared tooth was made from stainless steel. For each test, a new framework with identical form and dimensions was available (Figure 1). The upper part was used for fixing the primary crown, the lower part was fixed on the testing table. Each series of tests consisted of n = 10 single tests. For each test series, Figure 2 shows one set of test specimens.

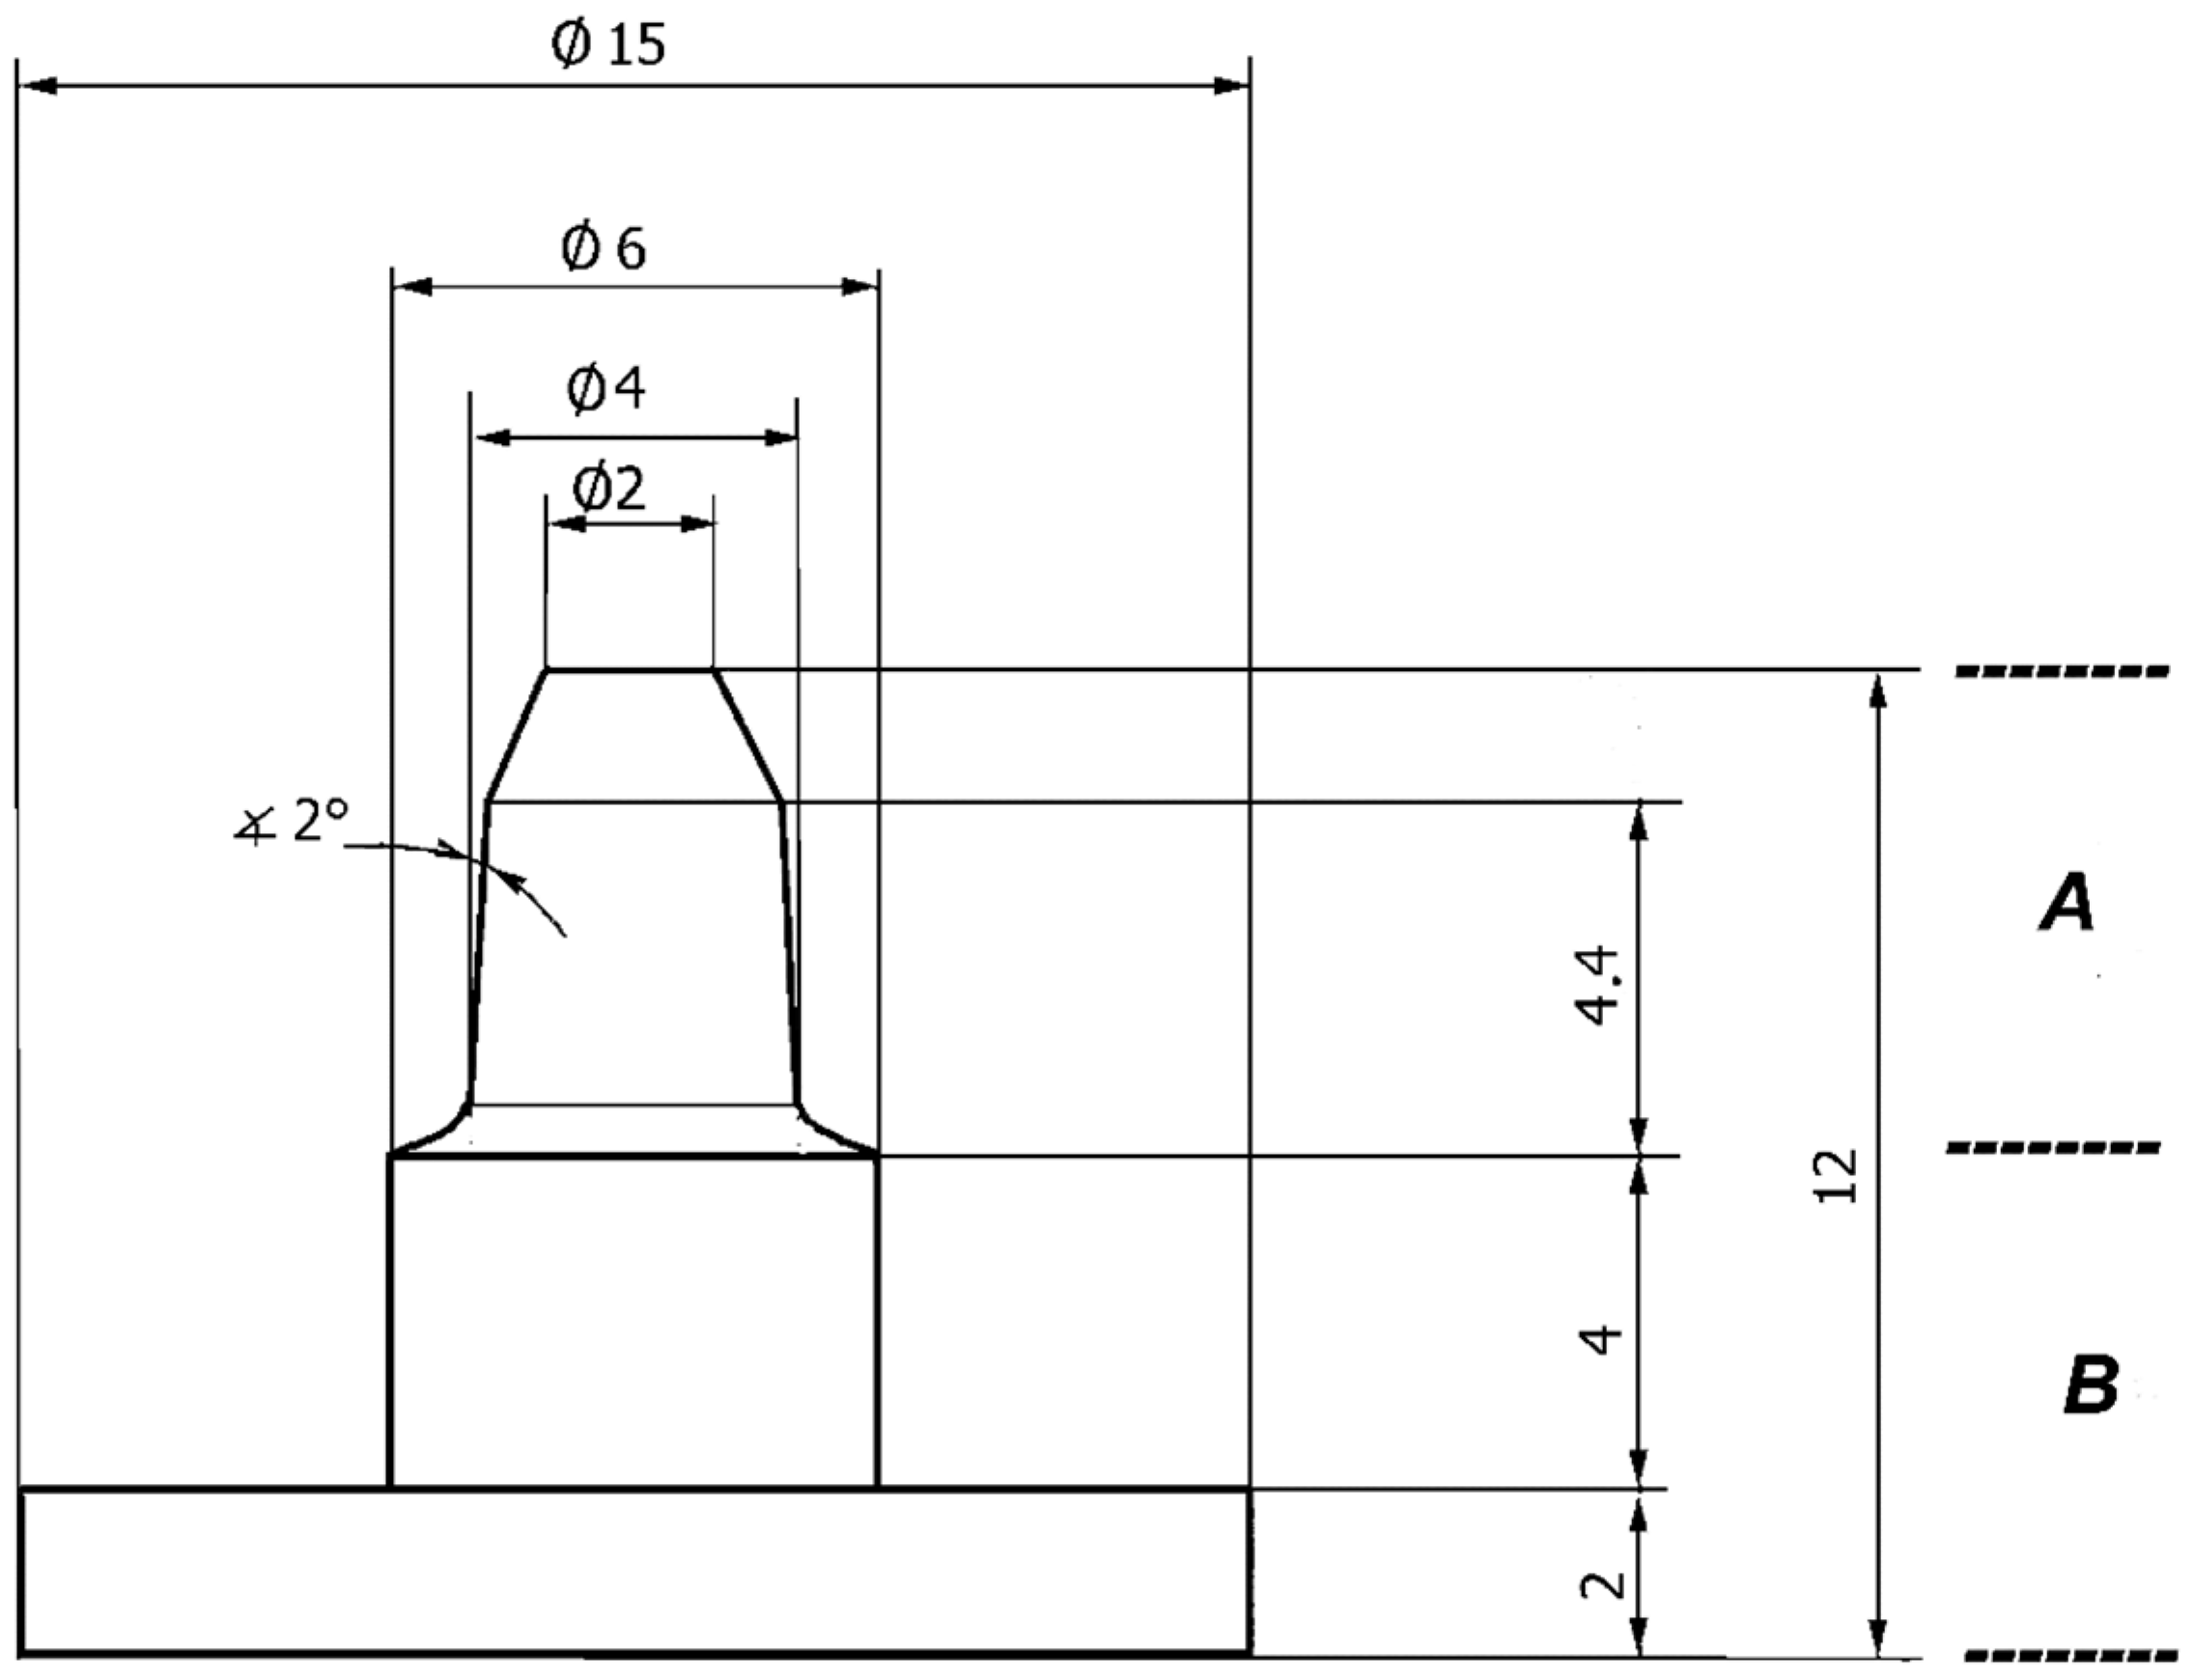
2.2. Manufacturing of the Specimens

The materials used for manufacturing all test specimens—primary and secondary telescopic crowns—were processed according to the respective producers’ instructions. Metallic and ceramic primary crowns were used.
All metallic primary crowns were first manually modelled using a millable modelling wax (Thowax, Yeti, Engen, Germany), were then milled using a milling machine (F1, Degudent, Hanau, Germany), and, finally, were embedded and casted (Table 2). After casting, they were sandblasted with 110 μm aluminium oxide and 50 μm aluminium oxide (Korox®, Bego, Bremen, Germany). All primary crowns were again milled parallel using the same milling machine and a special milling tool set. A zero-degree inclination of the shell surfaces was realized. No rubber polishers or polishing compounds were used in order not to affect the parallel wall design. Instead, the final surfaces were treated with fine-grained sand paper (sandpaper for Konator-Flex-System, grain level: 800; Degudent, Hanau, Germany) used with the milling machine.
For manufacturing ceramic primary crowns (test series F), a pressable lithium-disilicate-ceramic (IPS Empress 2, Ivoclar-Vivadent, Schaan, Liechtenstein) was used [13]. The matching type of ceramic bars was Ingot 200, type 2, class 1. These primary crowns were treated with a special grinder tool set (Ceramic art set 4369, Komet, Lemgo, Germany).
Secondary crowns were manufactured either by casting or by electroforming technology.
Casted secondary crowns were directly modelled on the respective primary crown using a burnout resin material (Pattern Resin®, GC Dental Products, Aichi, Japan). After casting, the outer surfaces were sandblasted using 110 μm and 50 μm aluminium oxide (Korox®, Bego, Bremen, Germany). The inner surfaces were sandblasted using 50 μm glass beads (Bego, Bremen, Germany).
For manufacturing the electroformed secondary crowns, the primary crown was directly coated by a conductive silver lacquer [14]. The layer thickness was between 3 μm and 5 μm. This lacquer coating was omitted for test series E because of the electrical conductivity of titanium. The electroforming process was realized with an electroforming machine (AGC-Mikro, Wieland, Pforzheim, Germany) and the corresponding gold liquid (Wieland, Pforzheim, Germany). This machine was operated on level 5 at a working temperature of 60° Celsius for a working time of 4 h and 15 min (plus 60 min heating time).
After manufacturing, the test specimens underwent orientating surface roughness measurements in a vertical (occlusal to cervical) direction. This was done in order to guarantee comparable initial values for surface roughness. These RZ values were only increased for ceramic materials due to manufacturing reasons (Table 3). To avoid porosities, all metallic test specimens were x-rayed. Test specimens with porosities were excluded from the study.

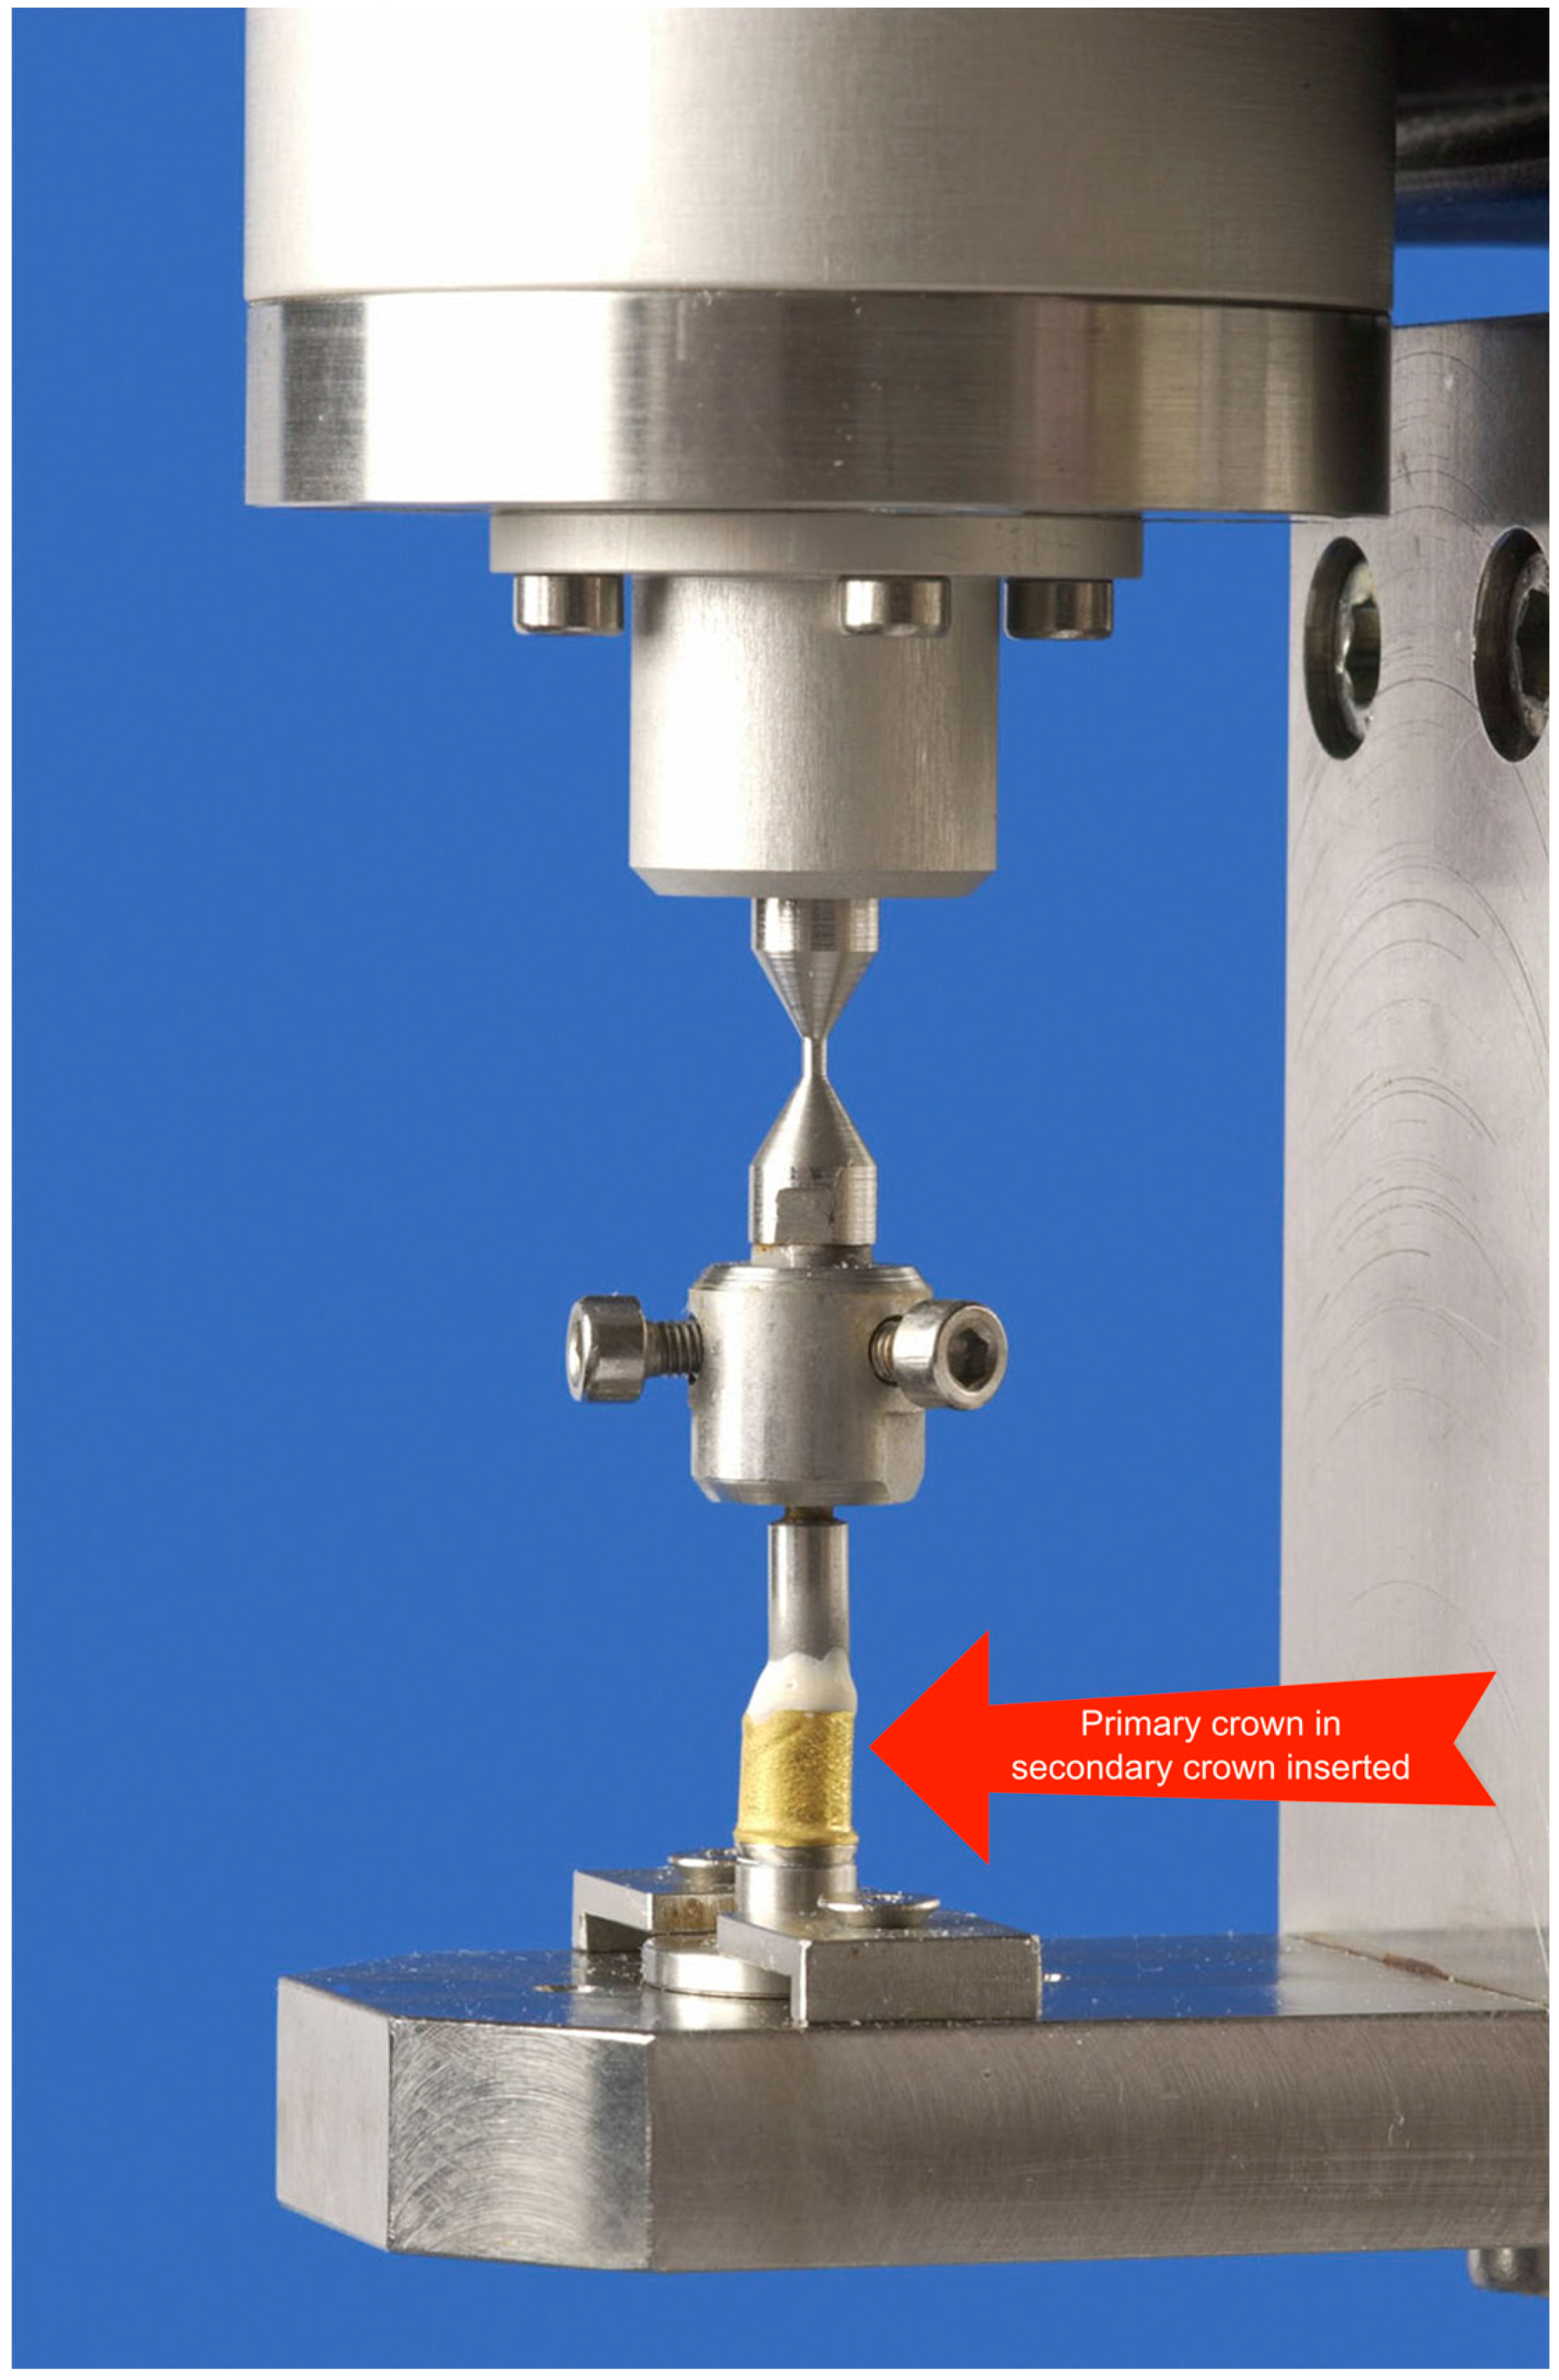
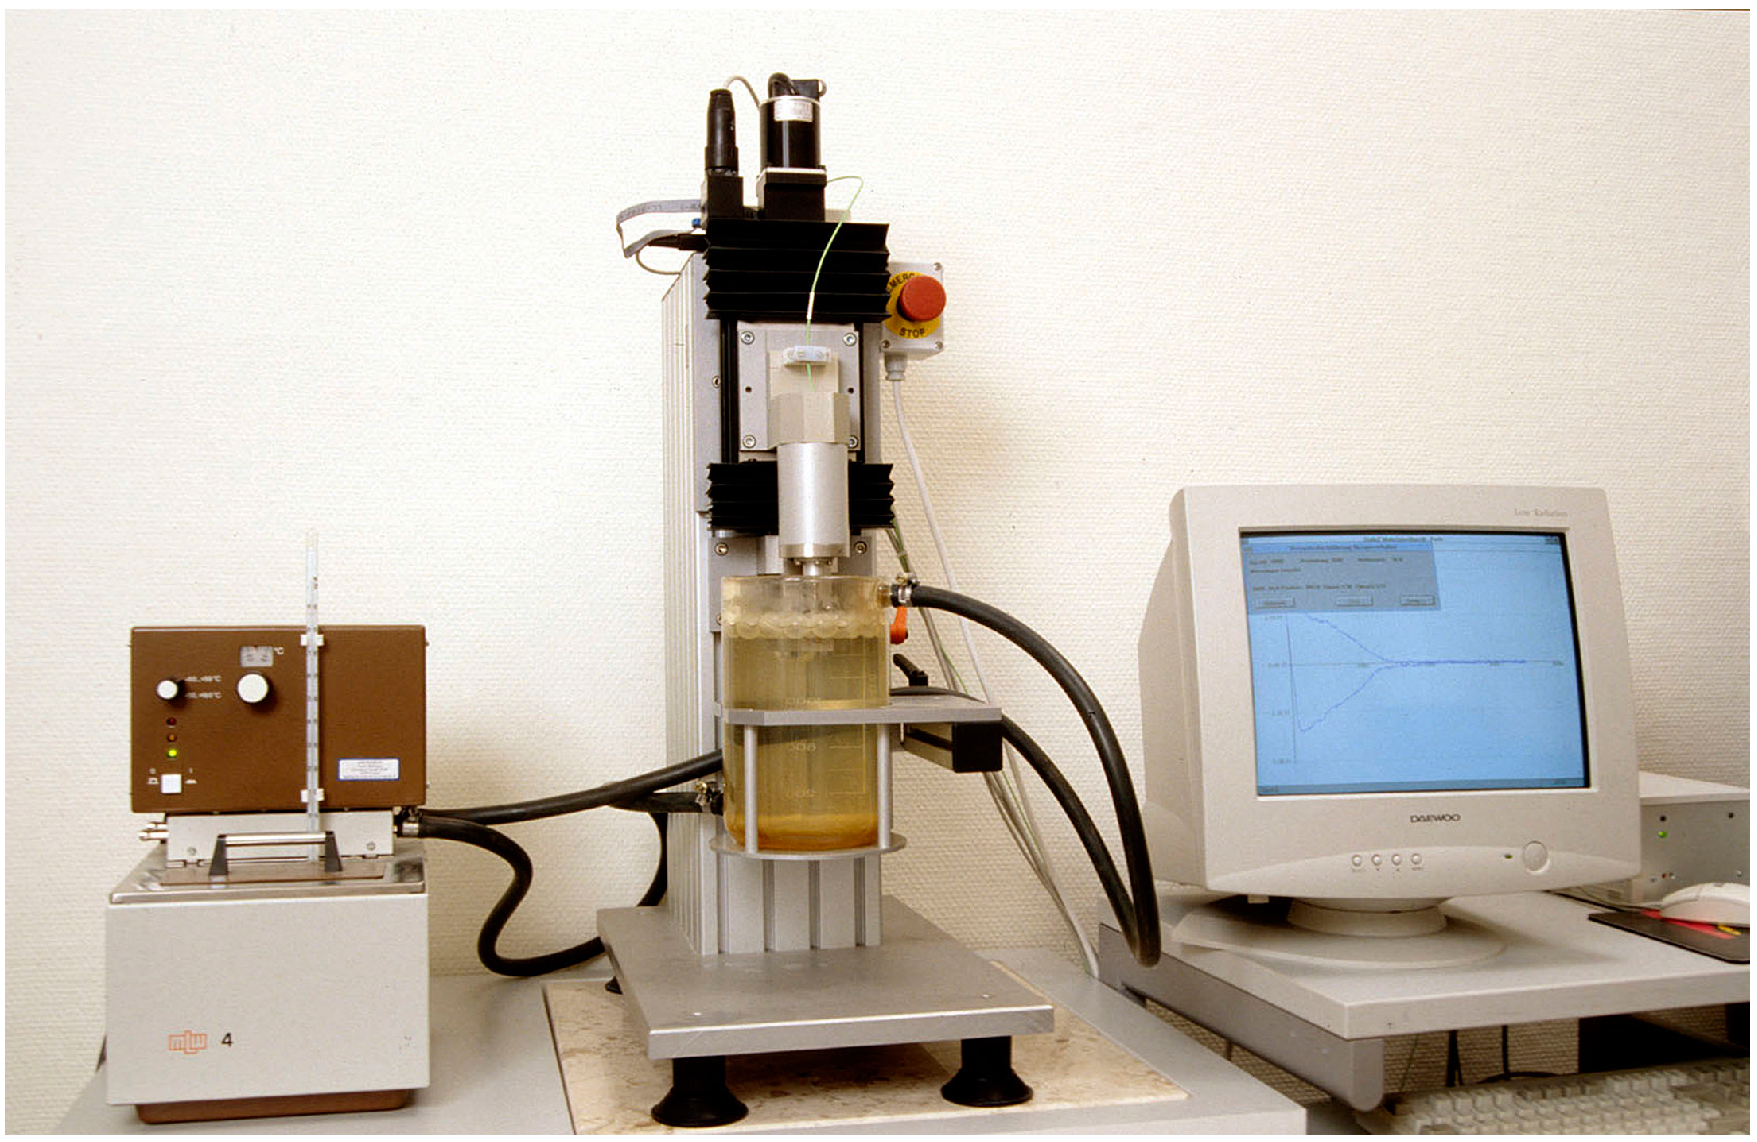
2.3. Testing Procedures

This manuscript uses the term “pull-off force” as a synonym for the forces for (a) pulling off the secondary crown from the primary crown; (b) putting on the secondary crown on the primary crown, and (c) keeping the secondary crown on the primary crown (retentive force). The long-term measurement of pull-off forces was realized using two identical test devices (Hado 2, H&H Gerätetechnik, Dresden, Germany). Both were installed vibration-free. The testing device was supplemented by a personal computer, a stepper motor controller, an amplifier, and an upstream voltage stabilizer (VD 1000; Konzept-Energietechnik, Eutin, Germany). It worked with a movable compression-tension slide with integrated power sensors. The electronically controlled stepper motor produced the vertical movement of the slide. To protect the sensors, the connecting area between the test specimen and the testing device was secured by a predetermined breaking point which was triggered by forces over 50 N. The personal computer controlled the testing and registered the measurements (Figure 3). The primary crowns were fixed by cementing with zinc-phosphate cement (Harvard Zement, Richter und Hoffmann-Harvard Dental, Berlin, Germany) on a base similar to a tooth stump. The secondary crowns were fixed to the slide adapter by luting with Nimetic Cem (3M Espe, Seefeld, Germany). Figure 4 shows the fixing procedure in the testing device with both primary and secondary crowns put together.
For testing the wear resistance, a long-term use testing simulation was programmed; 10,000 load change cycles corresponded to a ten-year use. The moving distance for putting on and pulling off the secondary crown was 3.0 mm each way. The intermediate stopping time was programmed to 0.5 s. The compression-tension slide moved at a speed of 15.0 mm per minute. Both crowns were stored in 36° Celsius-tempered, distilled water during the tests.
The two identical testing devices were used to realize all tests in an appropriate period of time. Within one test series, test specimens were randomly assigned to the two testing devices. Therefore, test specimens were always split between the two machines, with five test specimens tested with machine one and five test specimens tested with machine two. To avoid a systematic bias by using two testing devices, both devices were finally compared.
After the pull-off tests, the surface roughness of the primary crowns were evaluated by using a “Hommeltester T 8000” (Hommelwerke, Schwenningen, Germany) type testing device. An effective size of 1.9 mm × 2.2 mm per crown surface was measured. Measurements were done in “roughness mode”. A Gaussian filter (cut-off: 80 µm) was used to illustrate roughnesses three-dimensionally. Because roughness had to be measured at a 90-degree angle to the direction of work or wear, the scan direction before the pull-off testing was vertical and the scan direction after the pull-off testing was horizontal. This fact unfortunately does not allow for a direct comparison. The different directions of work and wear are illustrated in Figure 5.
The measurements of surface roughness were supplemented by scanning electron microscope (SEM) analyses (Philips XL 30 ESEM, Philips, Eindhoven, The Netherlands). X-ray spectroscopy (Energy Dispersive X-ray (EDX)) analyses in humidor mode under low-vacuum conditions were able to detect secondary crown particles on the primary crown surface.

2.4. Data Collection

Pull-off forces were measured during the load change cycles. The software that was used, “Hado 2” (H&H Gerätetechnik, Dresden, Germany), collected the data and measured the maximum pull-off force per cycle. The data from the surface roughness measurements were processed directly in the Hommeltester T 8000 testing device.

2.5. Statistics

First, all data were analysed using descriptive statistical procedures. Medians, means, and standard deviations were calculated. After registering the pull-off forces over the whole testing time, the initial and the final values were used to determine the tendency. The percentage amount of pull-off force which remained after the testing was calculated. Differences between the pull-off forces of each test series (stepwise per 1000 cycles) were tested for statistical significance by using the U-test with Bonferroni correction (α = 0.05). This was supported by a graphical illustration of the pull-off force development over time. Surface roughness values were also tested for significant differences by the U-test with Bonferroni correction.

3. Results

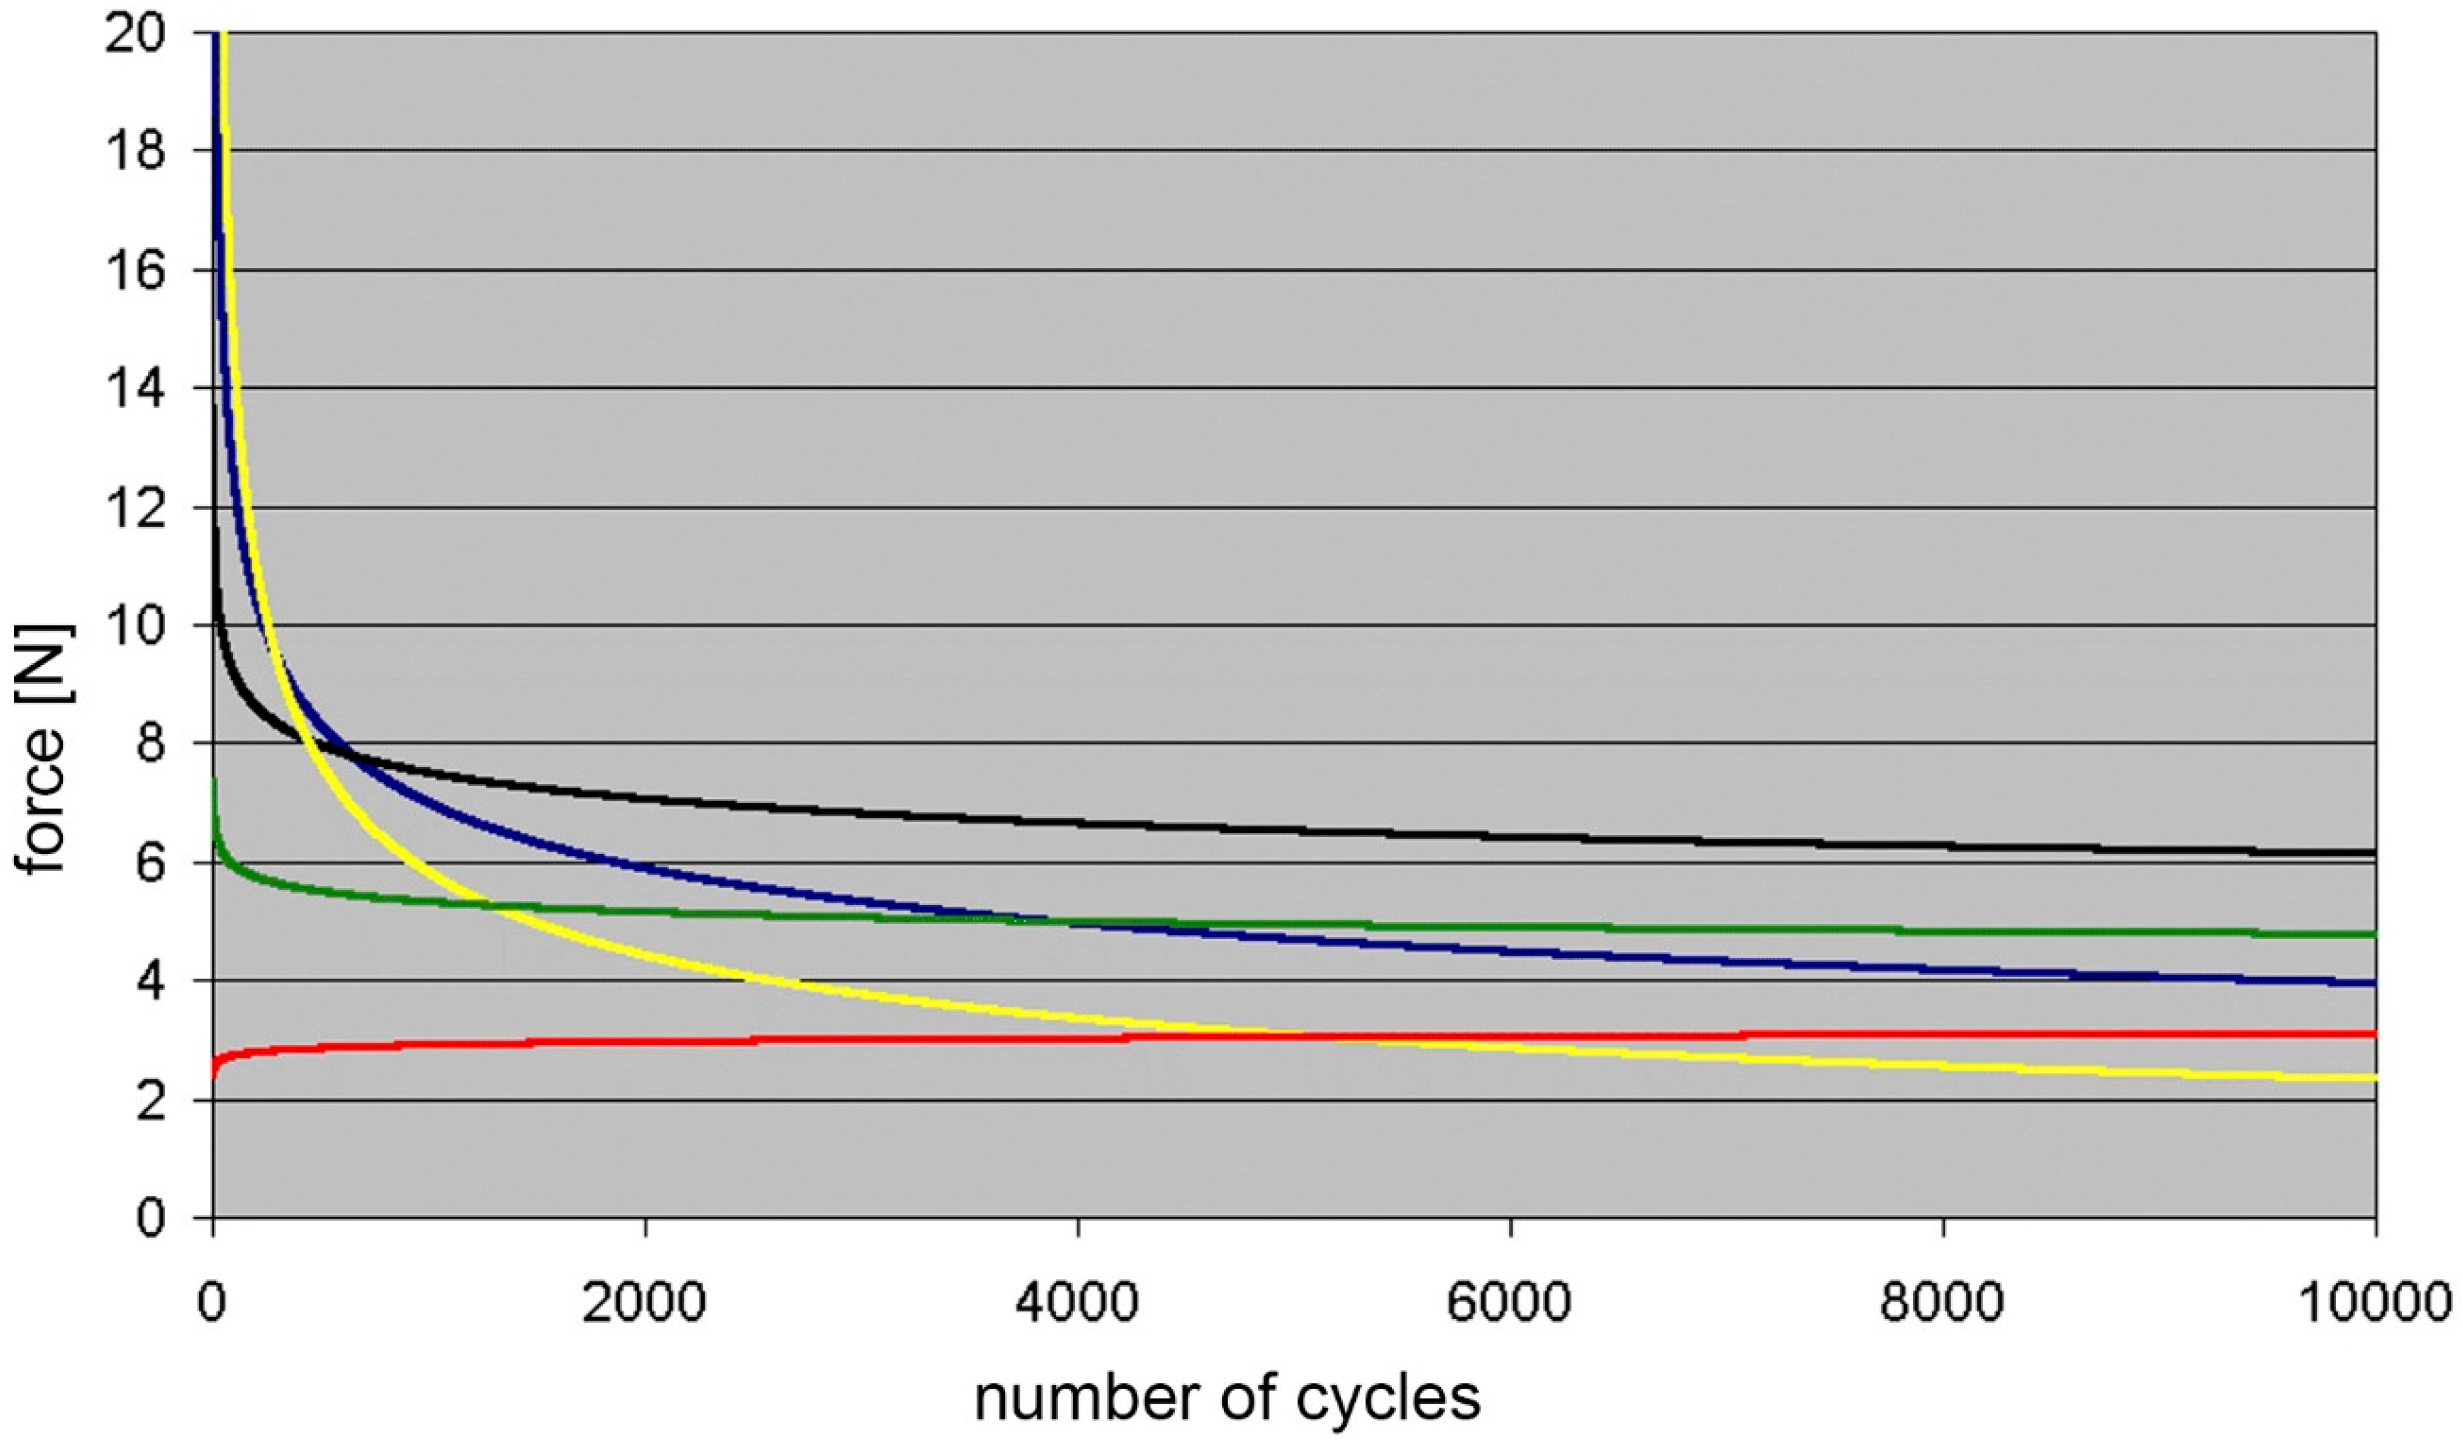
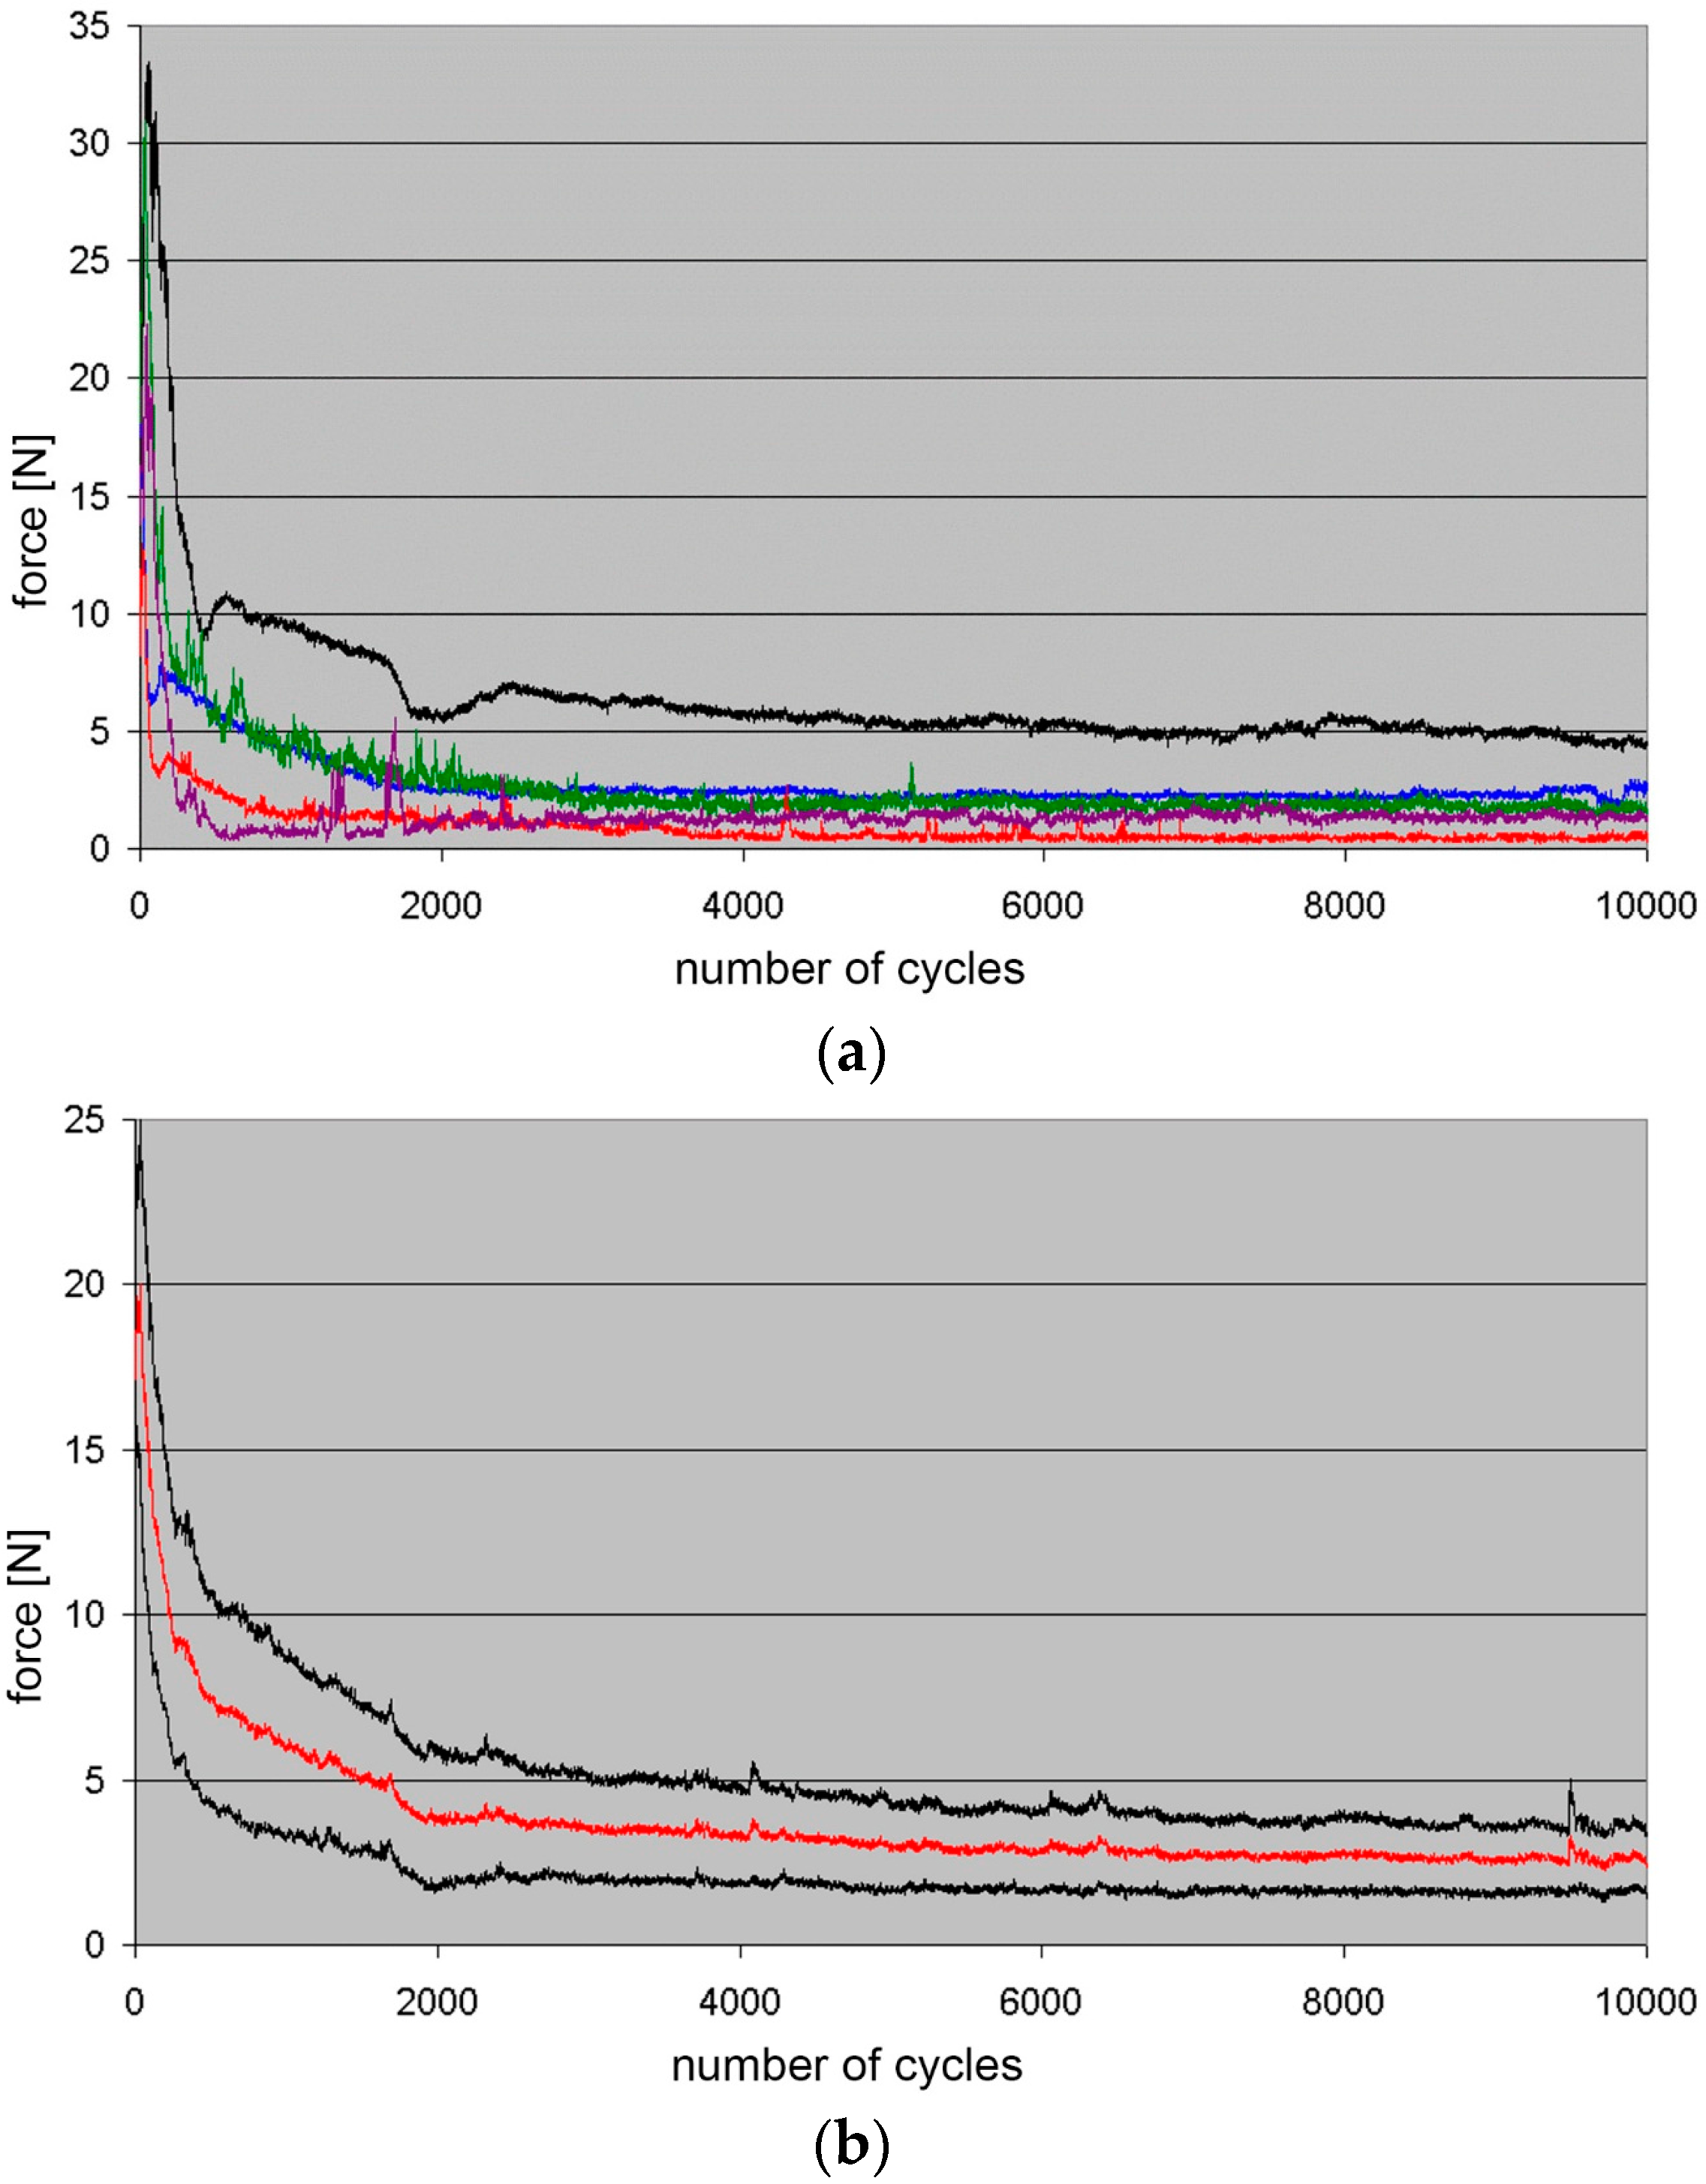
3.1. Pull-Off Forces

Only five of the six material combinations were eligible for completing the pull-off tests. The material combination C (Degunorm®/AGC Gold®) showed extremely high pull-off forces over 50 N during the tests. Therefore, material combination C was excluded from further analyses concerning pull-off forces.
All other material combinations showed a different decrease of pull-off forces over the scheduled 10,000 cycles (Table 4). The highest pull-off force reduction of 88% was measured for the material combination D (pure titanium/pure titanium). However, the initial value in question was comparably high at 18.2 N. The smallest pull-off force reductions were measured for material combination E (pure titanium/AGC Gold®) and material combination F (Empress 2®/AGC Gold®). The respective final pull-off forces were 4.4 N and 2.8 N, corresponding to 90% and 75% of the initial values.
The decrease of the pull-off forces was more homogeneous for material combinations including an electroplated gold surface for the secondary crown (material combination E and material combination F) compared to the material combinations A, B, and D. The p-values in question are shown in Table 5. Significant differences for nearly all stages of the test were found for the comparison between material combination B and D, material combination B and F, material combination D and E, and material combination E and F.
The averaged pull-off force development over time was calculated stepwise. This is shown by the example of the test series for material combination D. Figure 6a shows the raw data of five randomly selected pull-off force development curves over time. The averaged pull-off force development over time and the respective 95% confidence intervals are the result from all ten pull-off force development curves of this test series (Figure 6b). After that, the moving average was used.
For all material combinations, the development of the averaged pull-off forces over time is demonstrated in Figure 7. The material combinations A, B, and D showed a remarkable quick pull-off force reduction starting from over 10 N. Combinations of different groups of materials (B and E) instead showed only a slight pull-off force reduction after an initial decrease.

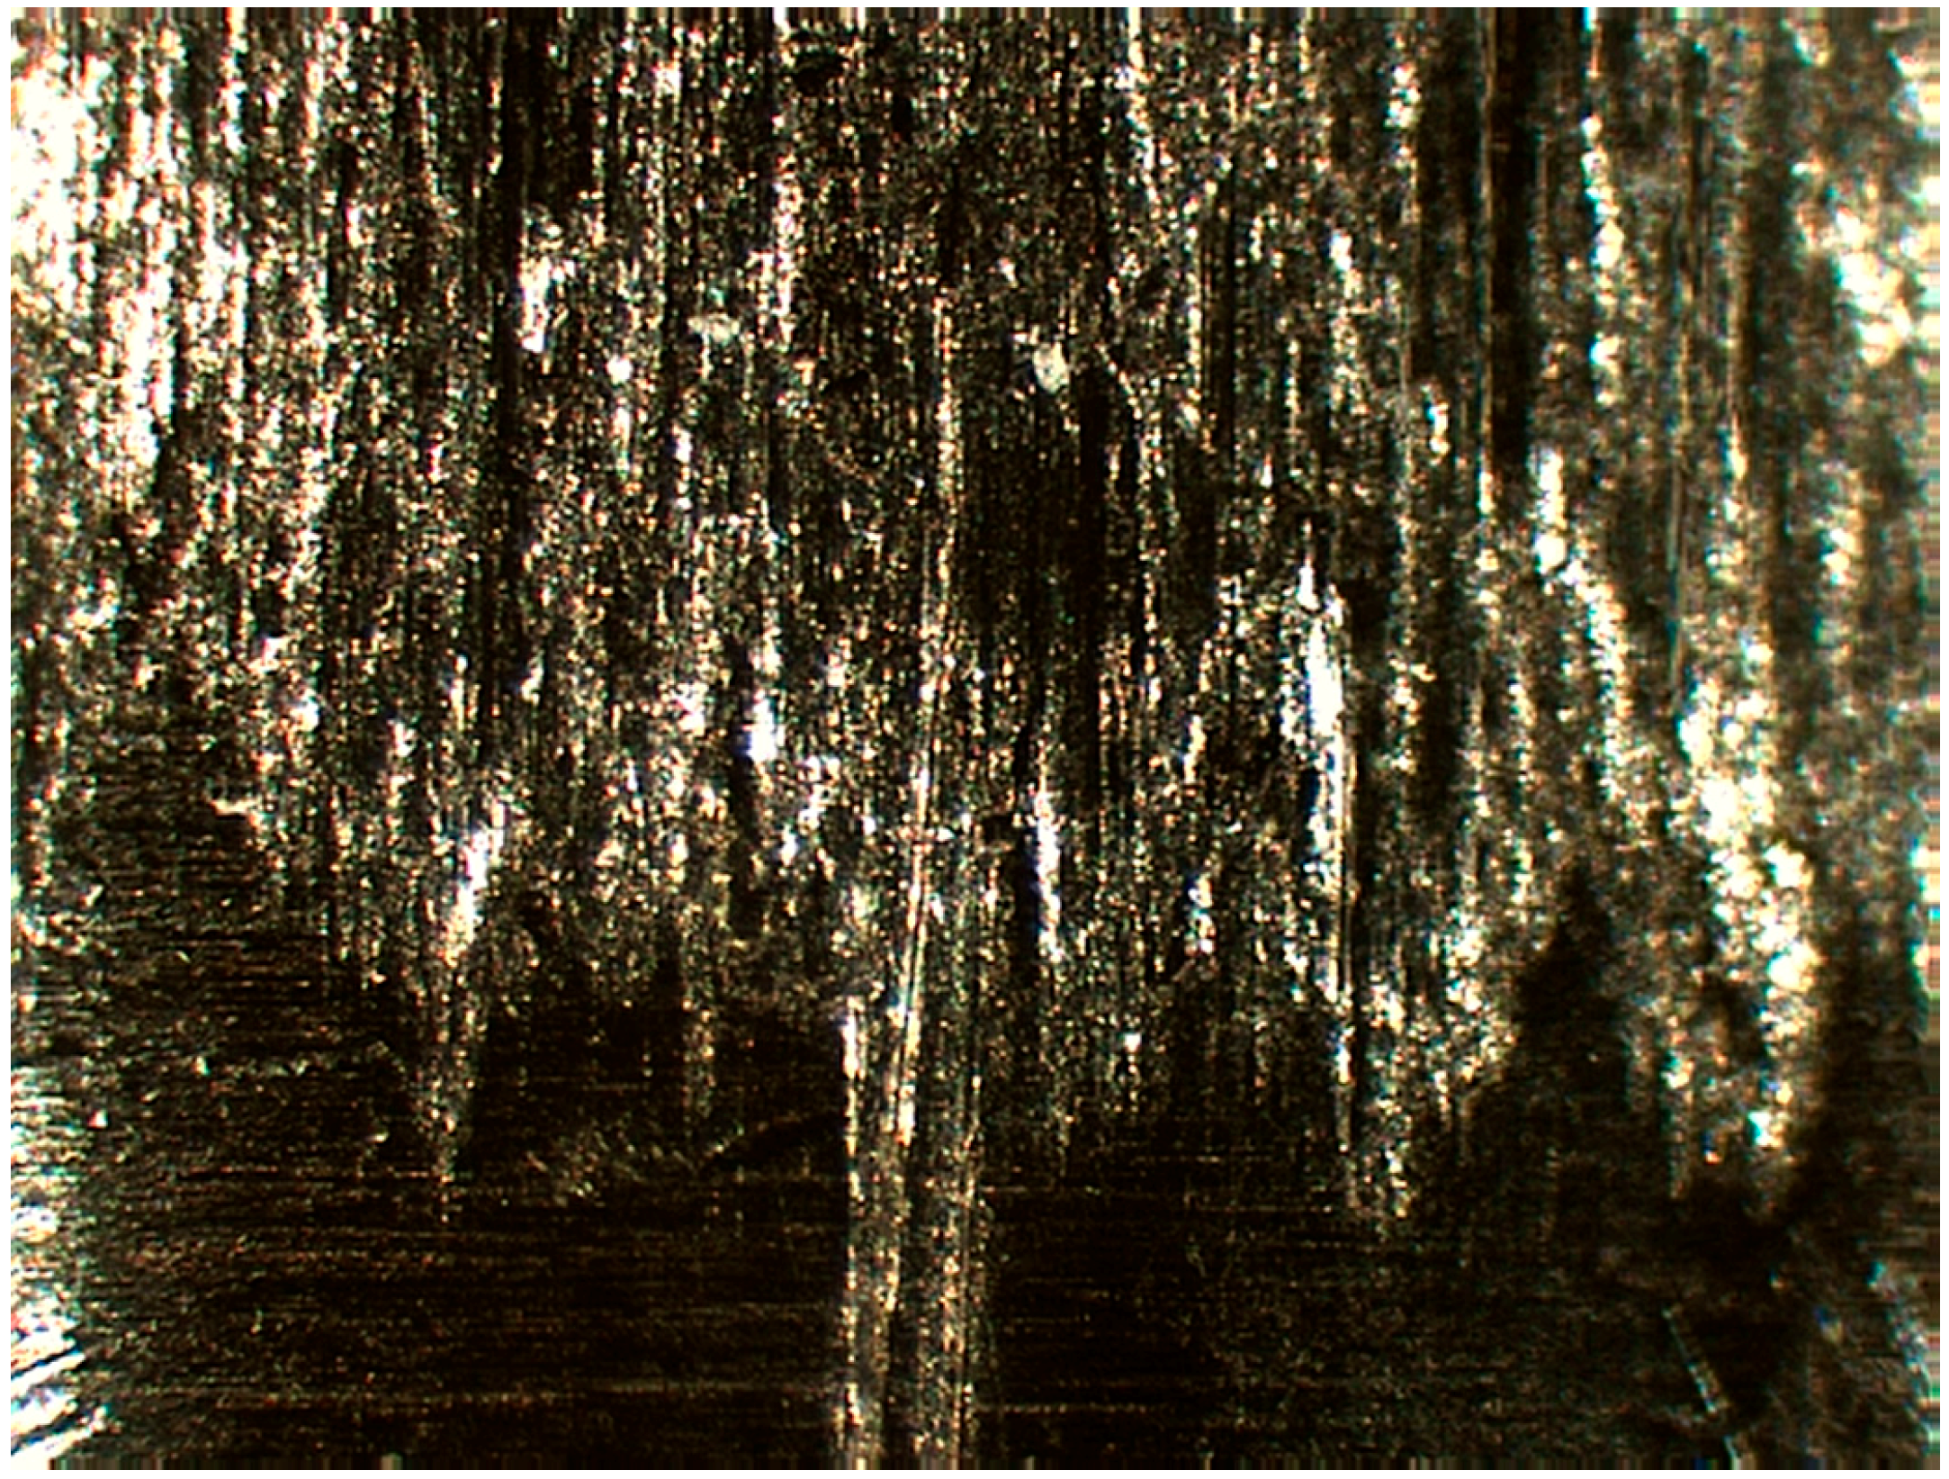
3.2. Surface Roughness

The surface roughness measured after the pull-off tests are shown in Table 6. The highest median values of surface roughness (SZ) were measured for combinations of similar or identical groups of materials (material combination A, material combination C, material combination D). They were two to three times higher compared to combinations of different groups of materials which showed the smallest surface roughness values. The Figure 8a–f illustrates typical three-dimensional surfaces after long-term testing. Statistical tests revealed only a few individual differences between surface roughness measurements as being significant (Table 7).

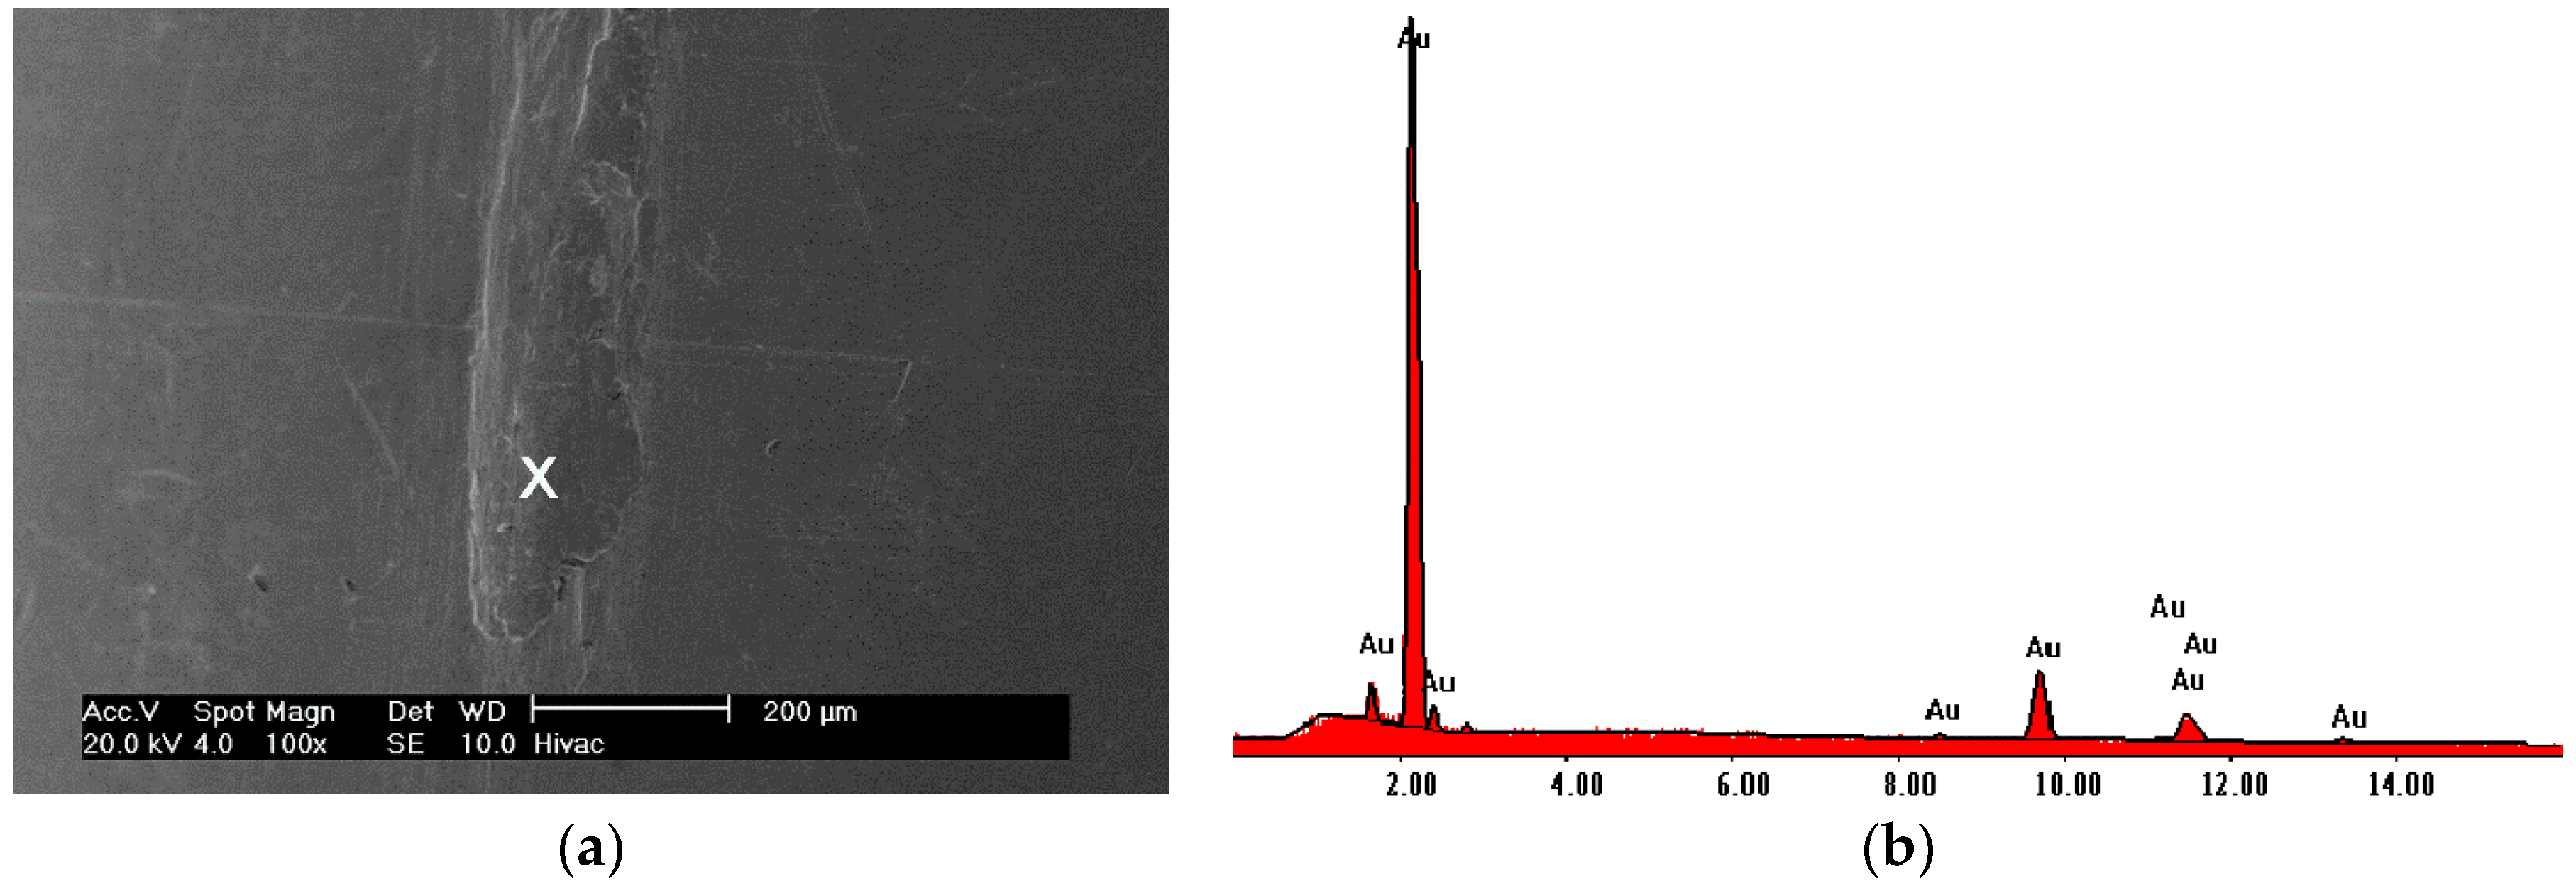
3.3. SEM and EDX Analyses

As mentioned, extremely high pull-off forces—temporarily above 50 N—were measured for material combination C. The reason for these unexpected values was found by using scanning electron microscope techniques. Single cold welding connection spots between primary and secondary crowns were detected. The surfaces of the primary crowns showed nearly unworn areas as well as areas that included particles of the secondary crown material (AGC Gold®). Those cold welding connection spots were found on all primary crown surfaces of this material combination. An example is shown in Figure 9a. After analysing this area by energy dispersive X-ray spectroscopy (EDX), only AGC Gold® material was found (Figure 9b).

4. Discussion

4.1. Methodical Limitations

The “Hado 2” testing device used in this study worked in a vertical direction. Working in a horizontal direction would have meant negotiating potential influences of gravity [15]. The moving speed of the compression-tension slide was lower than in comparable studies. This study used a speed of 15 mm (2 cycles) per minute while other studies used speeds up to 1000 mm per minute [16]. However, a lower speed can avoid friction heat, which may be associated with higher wear.
The present study only evaluated the cylindrical telescopic crown system itself. Other influences, for instance forces induced by denture saddles, cannot be evaluated with this study design [17]. Other studies did not focus on cylindrical telescopic crowns, but on conical telescopic crowns with different inclination angles for different tooth types [18]. The present study focussed on evaluating influences of material combinations and manufacturing technologies. Therefore, an identical cylindrical design was used for all test specimens.
Concerning the two identical testing devices, a U-test was calculated and showed no significant differences (α = 0.05). The p-values for each testing series were p = 0.754 (series A); p = 0.465 (series B); p = 0.251 (series D); p = 0.602 (series E) and p = 0.754 (series F). Variance analyses only showed significant differences between different testing series (p = 0.012), not between testing devices (p = 0.859) or a combination of device and testing series (p = 0.977).

4.2. Influence of Material Combinations

Primary and secondary crowns made from similar or identical groups of materials (for example high gold alloys in test series A) show a high decrease of pull-off forces after initially high values. A clinical study using high gold alloys reported initially high and variable pull-off forces [19]. High initial retentive forces may cause debonding or decementation of a primary telescopic crown. This complication was amongst the most frequently reported technical complications in two further clinical studies [20,21] observing different types of telescopic crowns. In some cases, the loss of retention was so high that alloy particles had to be welded into the inner surface of the secondary crown. However, this can only be done randomly and only be seen as a temporary solution.
Our study showed very unfavourable results for the combination of high gold alloys (primary crown) with electroformed gold (secondary crown). Highest pull-off forces up to 50 N and extremely high surface roughnesses were measured. Clinically, long-term pull-off forces up to 50 N are inacceptable because of potential negative influences on the periodont [17].
Several authors describe in vitro pull-off forces between 3 N and 7 N as acceptable [22]. Final values of all our test series were in this range except for one test series (titanium/titanium). Zirconium dioxide, which was used as a material for primary crowns in combination with several other secondary crown materials, also showed favourable results in a recent study [23].
All in all, combinations of different groups of materials without a high-gold alloy primary crown can be judged as being favourable.

4.3. Influence of Manufacturing Technologies

Retention between casted telescopic crowns is based on surface friction [24]. The present study revealed differences between different methods of manufacturing secondary crowns—casting and electroforming. Material combinations with casted secondary crowns showed high reductions of initially high pull-off forces. The standard deviation of means showed higher values for the test series with casted secondary crowns (65% (A), 42% (B), 63% (D)) compared to test series with electroformed secondary crowns (32% (E), 28% (F)). Within all test series with casted secondary crowns, test series B showed the smallest spread. This can be explained by the “negative” effect of a casted secondary crown and the “positive” effect of a combination of different groups of materials. The spread of measuring values can be judged as comparable with other studies. The electroforming technology itself is able to produce precise and reproducible secondary crowns [25]. Secondary crowns casted combined with cast metal upper denture frameworks resulted in deficiencies concerning the accuracy of the crown fit [26]. Electroformed secondary crowns used as a mesostructure within the cast metal denture framework avoid this deficiency [27] and showed good accuracies of fit.
For the test series C and D, identical alloy types of metals were used. The tribological behaviour was different. In series D, the secondary crown was also cast from pure titanium. When titanium is cast, an α-case-layer appears at the surface mainly due to reactions with the embedding compound. Close to this surface, the titanium texture is very fine grained [28]. In this area, the tribological behaviour is only a mechanical abrasion.
If the secondary crowns are made from electroformed gold (test series C), this is done directly on the primary crown. The resulting gaps are quite thin. During the usage, particles from the marginal layer are sheared off and fixed on the gliding plane of the corresponding partner with a higher hardness. The resulting “cold welding spots” of the partner material are also called “scabs” [29,30,31].

4.4. Surface Roughness

SEM graphics are able to visualize surface roughness. However, they are less efficient in quantifying surface roughness. For this purpose, surface roughnesses have to be measured [23,32]. The present study preferred the use of the linear surface parameter (RZ) and other surface-related parameters to the use of the arithmetical mean deviation of the profile (Ra) because of its better potential for differentiating the measurements [33].

5. Conclusions

Concerning the previously formulated hypotheses, the following conclusions must be drawn:
The choice of the material combination for primary and secondary crown had an influence on initially measured pull-off values. Combinations of different groups of materials showed initially lower pull-off forces compared to combinations of similar or identical groups of materials. The tendency towards a decrease of pull-off forces was higher for combinations of different groups of materials. Pull-off forces were also related to the manufacturing procedure. Electroformed secondary crowns showed a lower spread of pull-off forces compared to crowns made by casting technology. Wear associated surface roughnesses inside the primary crowns were higher for combinations of similar or identical groups of materials compared to combinations of different groups of materials. Therefore, all hypotheses can be affirmed.
Based on the results of this study, the authors would recommend using combinations of different groups of materials for primary and secondary cylindrical telescopic crowns. For manufacturing the secondary crowns, electroforming technologies seem to be superior to casting technologies. These recommendations are based on the in vitro long-term development of pull-off forces as well as wear-associated surface roughnesses on primary crown surfaces.

Acknowledgments

The authors would like to thank the manufacturers DeguDent (DeguDent, Hanau, Germany), Ivoclar (Ivoclar-Vivadent, Schaan, Liechtenstein), and Wieland (Wieland, Pforzheim, Germany) for providing study materials free of charge. We also thank Mr. Arndt (Jenoptik/Hommelwerke, Jena) for supporting the surface roughness analysis. Furthermore, we appreciate that statistics were supported by Range (Institute for Medical Informatics and Biometry, TU Dresden).

Author Contributions

Wigbert Linek: contributed substantially to conception, study design, data acquisition, data analysis, and data interpretation. Gert Richter: contributed substantially to conception, study design, and data acquisition. Michael Raedel: contributed substantially to data analysis and data interpretation. Michael Walter: contributed substantially to data analysis and data interpretation. Bernd Reitemeier: contributed substantially to conception, study design, and data interpretation.

Conflicts of Interests

The authors declare that there is no conflict of interest.

References

  1. Öwall, B.; Bieniek, K.W.; Spiekermann, H. Removable partial denture production in western Germany. Quintessence Int. 1995, 26, 621–627. [Google Scholar] [PubMed]
  2. Bergman, B.; Ericson, A.; Molin, M. Long-term clinical results after treatment with conical crown-retained dentures. Int. J. Prosthodont. 1996, 9, 533–538. [Google Scholar] [PubMed]
  3. Igarashi, Y.; Goto, T. Ten-year follow-up study of conical-crown-retained dentures. Int. J. Prosthodont. 1997, 10, 149–155. [Google Scholar] [PubMed]
  4. Minagi, S.; Natsuak, N.; Nishigawa, G.; Sato, T. New telescopic crown design for removable partial dentures. J. Prosthet. Dent. 1999, 81, 684–688. [Google Scholar] [CrossRef]
  5. Wenz, H.J.; Hertrampf, K.; Lehmann, K.M. Clinical longecity of removable partial dentures retained by telescopic crowns: Outcome of the double crown with clearance fit. Int. J. Prosthodont. 2001, 14, 207–213. [Google Scholar] [PubMed]
  6. Hoffmann, O.; Beaumont, C.; Tatakis, T.N.; Zafiropoulos, G.G. Telescopic crowns as attachments for implant supported restaurations. J. Oral Implantol. 2006, 32, 291–299. [Google Scholar] [CrossRef] [PubMed]
  7. Wöstmann, B.; Balkenhol, M.; Weber, A.; Ferger, P.; Rehmann, P. Long-term analysis of telescopic crown retained removable partial dentures: Survival and need for maintenance. J. Dent. 2007, 35, 939–945. [Google Scholar] [CrossRef] [PubMed]
  8. Grossmann, A.C.; Hassel, A.J.; Schilling, O.; Lehmann, F.; Koob, A.; Rammelsberg, P. Treatment with double crown-retained removable partial dentures and oral health—Related quality of life in middle-and high-aged patients. Int. J. Prosthodont. 2007, 20, 576–578. [Google Scholar] [PubMed]
  9. Wöstmann, B.; Balkenhol, M.; Kothe, A.; Ferger, P. Dental impact on daily living of telescop crown-retained partial dentures. Int. J. Prosthodont. 2008, 21, 419–421. [Google Scholar] [PubMed]
  10. Krennmair, G.; Seemann, R.; Weinländer, M.; Piehslinger, E. Comparison of ball and telescopic crown attachments in implant-retained mandibular overdentures: A 5-year prospective study. Int. J. Oral Maxillofac. Implants 2011, 26, 598–606. [Google Scholar] [PubMed]
  11. Akagawa, Y.; Seo, T.; Ohkawa, S.; Tsuru, H. A new telescopic crown system using a soldered horizontal pin for removable partial dentures. J. Prosthet. Dent. 1993, 69, 228–231. [Google Scholar] [CrossRef]
  12. Bayer, S.; Stark, H.; Gölz, L.; Keilig, L.; Kraus, D.; Hansen, A.; Enkling, N. Clinical retention force development of double crowns. Clin. Oral Investig. 2012, 16, 407–411. [Google Scholar] [CrossRef] [PubMed]
  13. Höland, W.; Schweiger, M.; Frank, M.; Rheinberger, V. A comparison of the microstructure and properties of the IPS Empress 2 and IPS Empress Glass-Ceramics. J. Biomed. Mater. Res. 2000, 53, 297–303. [Google Scholar] [CrossRef]
  14. Pietruski, J.K.; Sajewicz, E.; Sudnik, J.; Pietruska, M.D. Retention force assessment in conical crowns in different material combinations. Acta Bioeng. Biomech. 2013, 15, 35–42. [Google Scholar] [PubMed]
  15. Besimo, C.; Graber, G.; Flühler, M. Retention forces changes in implant-supported titanium telescope crowns over long-term use in vitro. J. Oral. Rehabil. 1996, 23, 372–378. [Google Scholar] [CrossRef] [PubMed]
  16. Ohkawa, S.; Okane, H.; Nagasawa, T.; Tsuru, H. Changes in retention of various telescope crown assemblies over long-term use. J. Prosthet. Dent. 1990, 64, 153–158. [Google Scholar] [CrossRef]
  17. Frechette, A.R. The influence of partial denture design on distribution of force to abutment teeth. J. Prosthet. Dent. 2001, 85, 527–539. [Google Scholar] [CrossRef] [PubMed]
  18. Bayer, S.; Stark, H.; Mues, S.; Keilig, L.; Schrader, A.; Enkling, N. Retention force measurement of telescopic crowns. Clin. Oral Investig. 2010, 14, 607–611. [Google Scholar] [CrossRef] [PubMed]
  19. Bayer, S.; Stark, H.; Gölz, L.; Keilig, L.; Kraus, D.; Hansen, A.; Enkling, N. Telescopic crowns: Extra-oral and intra-oral retention force measurement—In vitro/in vivo correlation. Gerodontology 2012, 29, 340–347. [Google Scholar] [CrossRef] [PubMed]
  20. Behr, M.; Hofmann, E.; Rosentritt, M.; Lang, R.; Handel, G. Technical failure rates of double crown-retained removable partial dentures. Clin. Oral Investig. 2000, 4, 87–90. [Google Scholar] [CrossRef]
  21. Stober, T.; Bermejo, J.L.; Seche, A.C.; Lehmann, F.; Rammelsberg, P.; Bömicke, W. Electroplated and cast double crown-retained removable dental prostheses: 6-year results from a randomized clinical trial. Clin. Oral Investig. 2015, 19, 1129–1136. [Google Scholar] [CrossRef] [PubMed]
  22. Stancic, I.; Jelenkovic, A. Retention of telescopic denture in elderly patients with maximum partially edentulous arch. Gerodontology 2008, 25, 162–167. [Google Scholar] [CrossRef] [PubMed]
  23. Turp, I.; Bozdag, E.; Sünbüloglu, E.; Kahruman, C.; Yusufoglu, I.; Bayraktar, G. Retention and surface changes of zirconia primary crowns with secondary crowns of different materials. Clin. Oral Investig. 2014, 18, 2023–2035. [Google Scholar] [CrossRef] [PubMed]
  24. Faber, J.F.; Huber, C. Electroformed telescope crowns—A hydraulic system. J. Dent. Res. 2001, 80, 551. [Google Scholar]
  25. Weigl, P.; Lauer, H.C. Advanced biomaterials used for a new telescopic retainer for removable dentures: Ceramic vs. electroplated gold copings: Part II. Clinical effects. J. Biomed. Mater. Res. 2000, 53, 337–347. [Google Scholar] [CrossRef]
  26. Gebelein, M.; Richter, G.; Range, U.; Reitemeier, B. Dimensional changes of one-piece frameworks cast from titanium, base metal, or noble metal alloys and supported on telescopic crowns. J. Prosthet. Dent. 2003, 89, 2–7. [Google Scholar] [CrossRef] [PubMed]
  27. Greven, B.; Luepke, M.; Dorsche, S.H. Telescoping implant prostheses with intraoral luted galvano mesostructures to improve passive fit. J. Prosthet. Dent. 2007, 98, 239–244. [Google Scholar] [CrossRef]
  28. Höhnel, U.; Reitemeier, B.; Richter, G. Zur Vergießbarkeit von Titan unterschiedlichen Reinheitsgrades. Dent. Labor 1996, 44, 421–423. [Google Scholar]
  29. Groche, P.; Nitzsche, G. Temperatureinfluss auf den Adhäsionsverschleiß beim Umformen von Aluminiumblechen. Mater. Werkst. 2004, 35, 461–466. [Google Scholar] [CrossRef]
  30. Kragelski, I.W. Reibung und Verschleiß; Carl Hanser Verlag: München, Germany, 1971. [Google Scholar]
  31. Rößler, J.; Göbel, R.; Welker, D. Der Haftmechanismus von Galvano—Doppelkronen. ZWR 2005, 114, 437–442. [Google Scholar] [CrossRef]
  32. Sakai, Y.; Takahashi, H.; Iwasaki, N.; Igarashi, Y. Effects of surface roughness and tapered angle of cone crown telescopic system on retentive force. Dent. Mater. J. 2011, 30, 635–641. [Google Scholar] [CrossRef] [PubMed]
  33. Enghardt, S.; Richter, G.; Richter, E.; Reitemeier, B.; Walter, M. Experimental investigations on the influence of adhesive oxides on the metal-ceramic bond. Metals 2015, 5, 119–130. [Google Scholar] [CrossRef]
Figure 1. Schematic portrayal of the metal base part used in all cases (dimensions in mm); (A) part supporting the primary crown; (B) connection area to the material testing device.
Metals 06 00149 g001
Figure 2. Sample bodies of the combinations of materials used. Top row from left to right (primary crown/secondary crown): Degunorm/Degunorm; Degunorm/Remanium 2000; Degunorm/AGC-Gold. Bottom row from left to right: Rematitan/Rematitan; Rematitan/AGC-Gold; IPS Empress 2/AGC-Gold.
Metals 06 00149 g002
Figure 3. The Hado 2 material testing device has been portrayed with the temper-capable liquid container in the middle of the picture. To the left, the regulation-capable thermostat has been arranged. The Personal Computer is located in the right part of the picture.
Metals 06 00149 g003
Figure 4. Detail of the Hado 2 material testing device with an integrated sample body complex. Above it, the power sensor with the predetermined breaking point can be seen.
Metals 06 00149 g004
Figure 5. Section of the surface of a primary crown following a number of load-change cycles. In the lower part of the picture, residues of the horizontal processing of the initial condition can be seen. The vertical signs of wear have been portrayed more clearly in the upper half of the picture (enlargement 63:1).
Metals 06 00149 g005
Figure 6. (a) Example of five sequences of pull-off forces chosen at random as a portrayal of raw data; (b) First phase of the generalised portrayal, taking all 10 sequences of pull-off forces of series D into due account. Red—averaged total curve; black—95% confidence interval.
Metals 06 00149 g006
Figure 7. Comparative portrayal of the averaged sequences of pull-off forces for the series: A—blue; B—black; D—yellow; E—green; F—red.
Metals 06 00149 g007
Figure 8. Surface portrayal of one primary crown per series after the end of the test: (a) series A; (b) series B; (c) series C; (d) series D; (e) series E, and (f) series F. These selected examples correspond best with the matching median of the series in question. The edge with the designation 1.9 is pointing to the occlusal surface. In this area, one can recognise an orientating portrayal of the profile.
Metals 06 00149 g008aMetals 06 00149 g008b
Figure 9. (a) Electron microscope portrayal of appositions of gold by the secondary crowns on the primary crown. This is an example from series C x-marking the area examined by means of X-ray spectroscopy (Energy Dispersive X-Ray (EDX)) analysis; (b) Result of the EDX analysis of the area marked in Figure 9a. Gold was exclusively detected.
Metals 06 00149 g009
Table 1. Distribution of the materials to the primary and secondary crowns of the series of examinations. All metallic primary crowns were manufactured by casting.
Test SeriesMaterial forMaterial Combination of
Primary Crown Material/Material GroupSecondary Crown Material/Material GroupSimilar/Identical Groups of MaterialsDifferent Groups of Materials
ADegunorm®/high gold alloyDegunorm®/high gold alloy (casted)+
BDegunorm®/high gold alloyRemanium 2000®/non-precious metal alloy +
CDegunorm®/high gold alloyAGC-Gold®/electroformed gold+
DRematitan®/titanium grade 1Rematitan®/titanium grade 1 (casted)+
ERematitan®/titanium grade 1AGC-Gold®/electroformed gold +
FIPS Empress 2®/silicate ceramicsAGC-Gold®/electroformed gold +
Table 2. Summary of the devices and materials used, including the components of the alloys (in percent by mass).
Manufacturing TechnologiesHigh Gold AlloyNon-Precious Metal AlloyTitaniumCeramicsElectroformed Gold
alloy or ceramics/manufacturerDegunorm/Degudent , Hanau, D (Au-73.8; Ag-9.2; Pt-9.0; Cu-4.4; Zn-2.0; In-1.5; Ir-0.1)Remanium 2000/Dentaurum, Ispringen/Pforzheim, D (Co-61.0; Cr-25.0; Mo-7.0; W-5.0; Si-1.5; Mn- < 1.0; N- < 1.0)Rematitan Typ 1/Dentaurum, Ispringen/Pforzheim, D (Ti- > 99.5; Fe-0.20; O-0.12; C-0.08; N-0.05; H-0.01)IPS Empress 2/Ivoclar-Vivadent, Schaan, FLAGC/Wieland, Pforzheim, D (Au ≥ 99.9; Cu ≤ 0.1)
investment material/manufacturerDeguvest CF/Degudent, Hanau, DCastorit Super C/Dentaurum, Ispringen/Pforzheim, DRematitan ultra/Dentaurum, Ispringen/Pforzheim, DStar—Vest Soft II/Weber Dental, Lengwil, CH-
casting machine or oven/manufacturerMulticast compact/Degudent, Hanau, DCastomat/Dentaurum, Ispringen/Pforzheim, DRematitan—Gießanlage/Dentaurum, Ispringen/Pforzheim, DEP 500/Ivoclar-Vivadent, Schaan, FLAGC-Mikro/Wieland, Pforzheim, D
manufacturing procedurecentrifugal castinghigh frequency-centrifugal castingvacuum pressure castingpressed ceramicelectroforming
Table 3. Surface roughness of the primary crowns in original condition (measurement parameter: Rz (µm); measurement direction: vertical).
SeriesMedianMean ValueStandard Deviation
A1.221.23±0.17
B0.770.81±0.20
C0.960.98±0.24
D1.000.99±0.20
E0.650.66±0.27
F2.702.76±0.87
Table 4. Medians, mean values, and standard deviations of the pull-off forces (N) at the start and at the end of the tests; for the tendency, the averaged percentage by which the median of the initial value was reduced has been stated.
SeriesPull-off Forces at the Start of the TestPull-off Forces at the End of the TestTendency
Median/Mean Value ± Standard Deviation
A11.1/14.9 ± 12.83.3/4.0 ± 2.6−70%
B10.7/11.0 ± 1.95.9/6.5 ± 2.5−45%
C5.6/5.3 ± 1.8--
D18.2/18.6 ± 6.62.1/2.4 ± 1.5−88%
E5.9/6.1 ± 1.04.4/4.7 ± 1.5−25%
F3.1/3.4 ± 1.12.8/2.9 ± 0.8−10%
Table 5. Statistical test results: p-Values of the U-test with Bonferroni correction of the averaged pull-off forces for series comparison, taking the number of load-change cycles into account; s.—significant, ns.—not significant.
Series ComparisonNumber of Test Cycles
10002000300040005000600070008000900010,000
A/B0.880 ns.0.069 ns.0.290 ns.0.762 ns.0.650 ns.0.173 ns.0.112 ns.0.041 ns.0.082 ns.0.026 ns.
A/D0.151 ns.0.069 ns.0.028 ns.0.019 ns.0.019 ns.0.041 ns.0.028 ns.0.096 ns.0.041 ns.0.009 ns.
A/E0.545 ns.0.496 ns.0.880 ns.0.545 ns.0.762 ns.0.325 ns.0.405 ns.0.130 ns.0.290 ns.0.226 ns.
A/F0.028 ns.0.059 ns.0.041 ns.0.049 ns.0.112 ns.0.173 ns.0.151 ns.0.545 ns.0.650 ns.0.325 ns.
B/D0.069 ns.0.001 s.0.001 s.0.002 s.0.001 s.0.002 s.0.002 s.0.002 s.0.001 s.0.001 s.
B/E0.151 ns.0.198 ns.0.096 ns.0.290 ns.0.307 ns.0.405 ns.0.364 ns.0.290 ns.0.198 ns.0.041 ns.
B/F0.001 s.0.001 s.0.002 s.0.002 s.0.004 s.0.010 ns.0.004 s.0.004 s.0.010 ns.0.001 s.
D/E0.496 ns.0.001 s.0.008 ns.0.002 s.0.001 s.0.001 s.0.001 s.0.001 s.0.002 s.0.001 s.
D/F0.290 ns.0.325 ns.0.405 ns.0.449 ns.0.130 ns.0.173 ns.0.130 ns.0.151 ns.0.059 ns.0.034 ns.
E/F0.004 s.0.006 ns.0.006 ns.0.002 s.0.002 s.0.001 s.0.002 s.0.001 s.0.013 ns.0.001 s.
Table 6. Medians, mean values, and standard deviations of the surface roughness Sz (µm) taking all the primary crowns after the end of the test into account.
SeriesMedianMean ValueStandard Deviation
A11.5011.79±2.53
B4.174.26±1.50
C19.8022.93±13.98
D11.6511.24±2.49
E3.196.61±6.27
F6.756.51±2.02
Table 7. Statistical test results: p-values of the U-test with Bonferroni correction (α = 0.003) of the surface roughness Sz between the series after the end of the test; s. = significant; ns. = not significant.
SeriesABCDEF
A <0.001 s.0.023 ns.0.571 ns.0.013 ns.0.001 s.
B 0.001 s.<0.001 s.0.597 ns.0.019 ns.
C 0.019 ns.0.002 s.0.004 ns.
D 0.016 ns.0.002 s.
E 0.197 ns.
F

