
Experimental and Numerical Simulations of the Solidification Process in Continuous Casting of Slab


Abstract
:
1. Introduction
2. Experimental
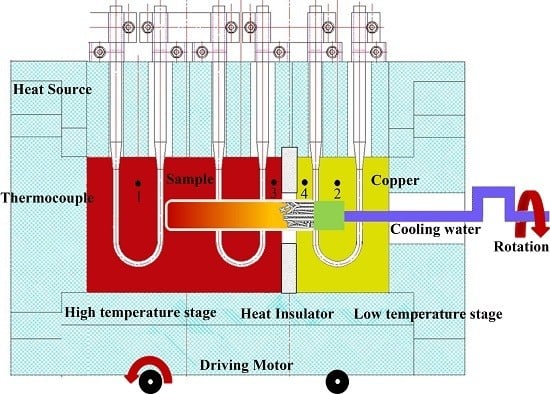
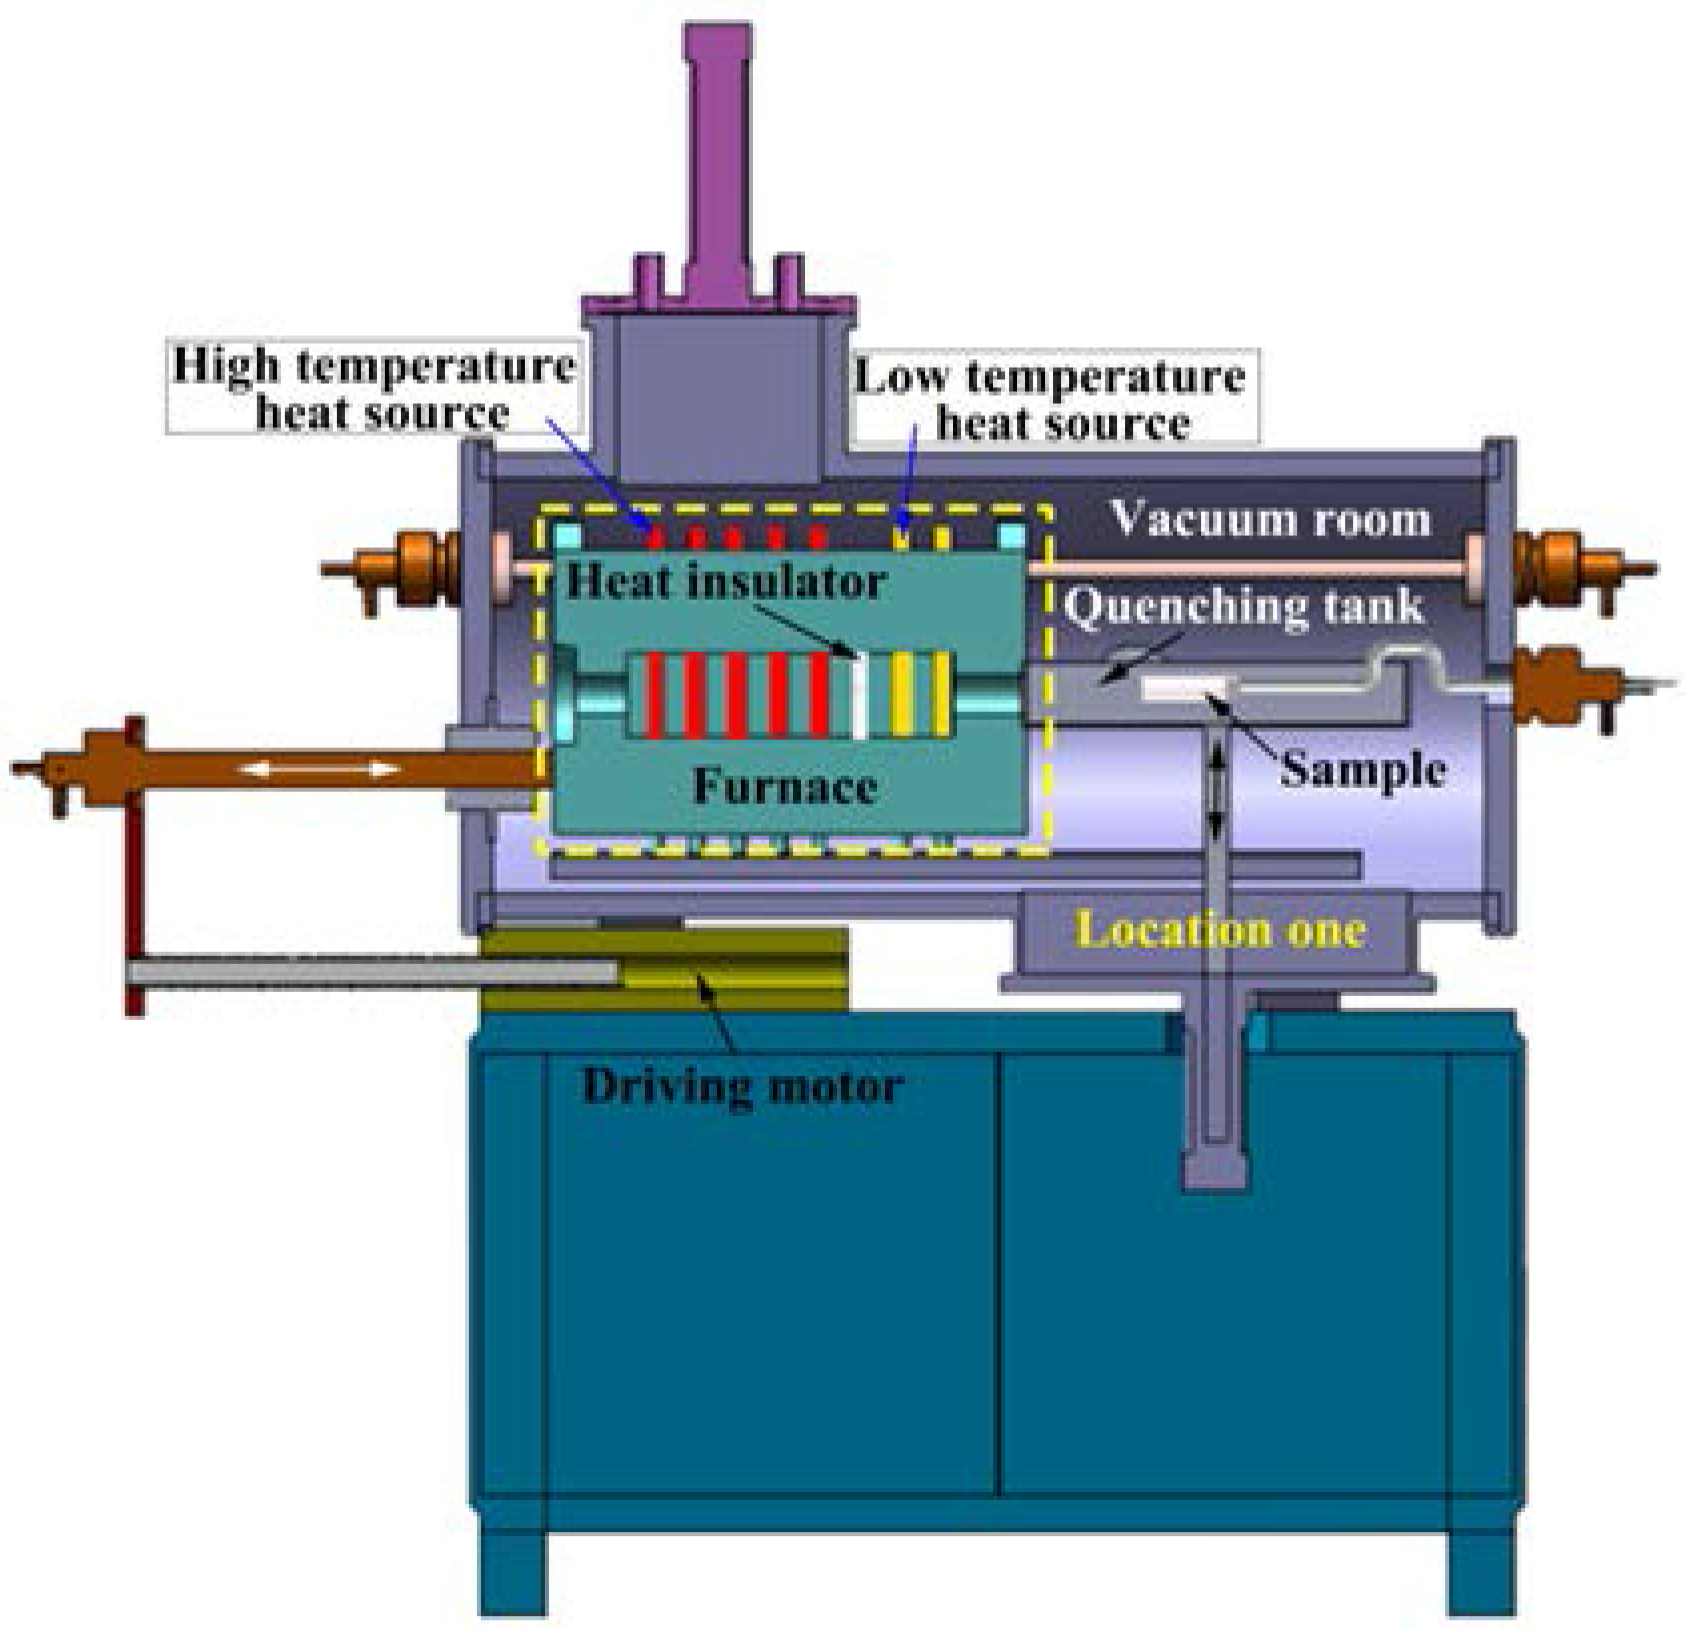
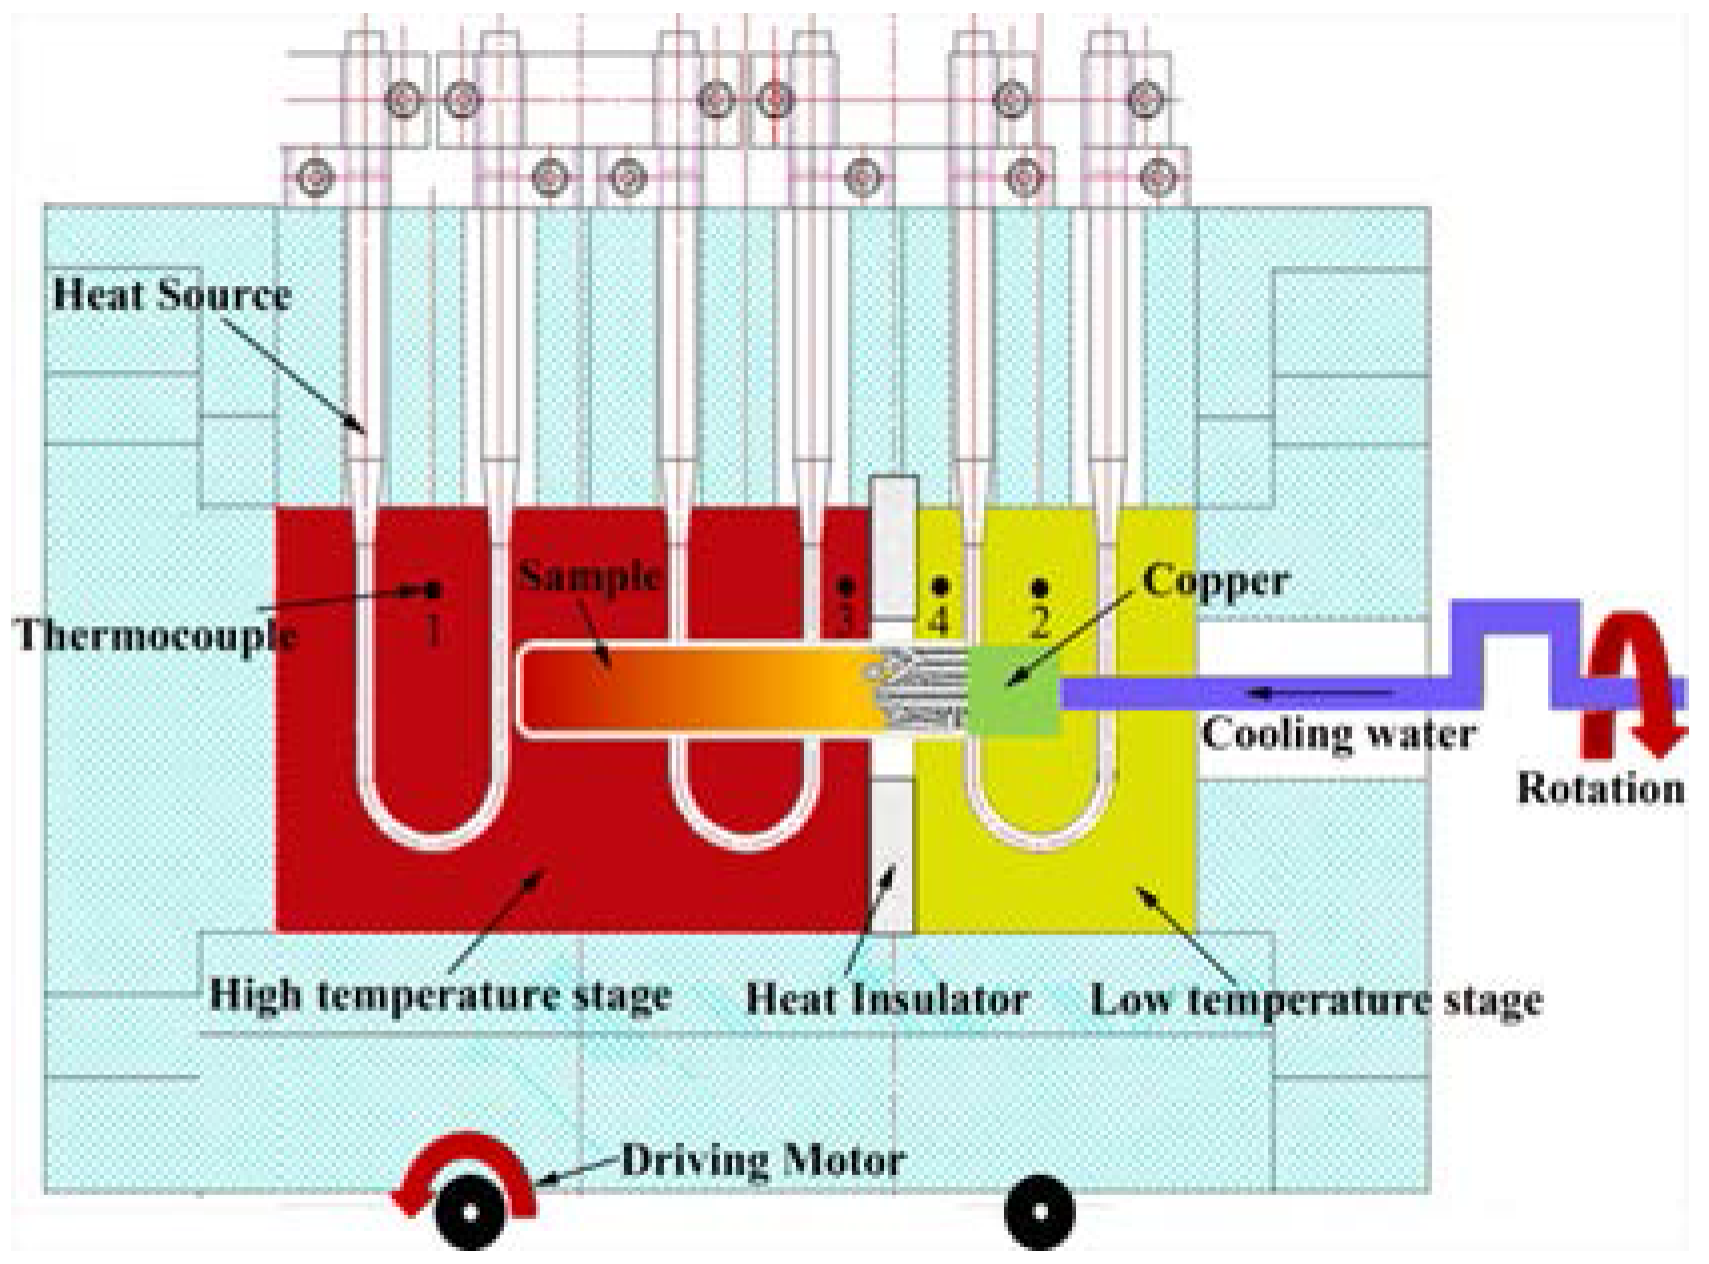
2.1. TSE
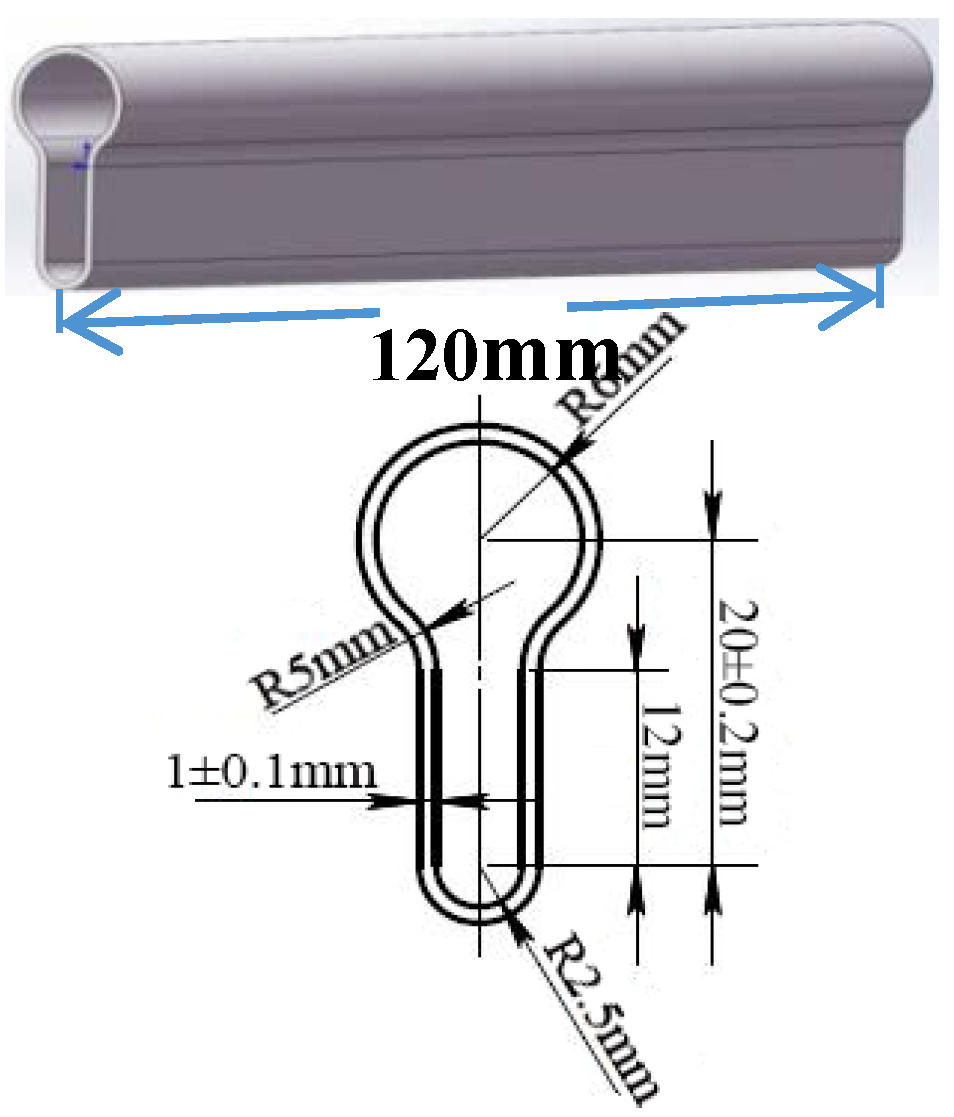
2.2. Material
3. Model Theory
4. Results and Discussion
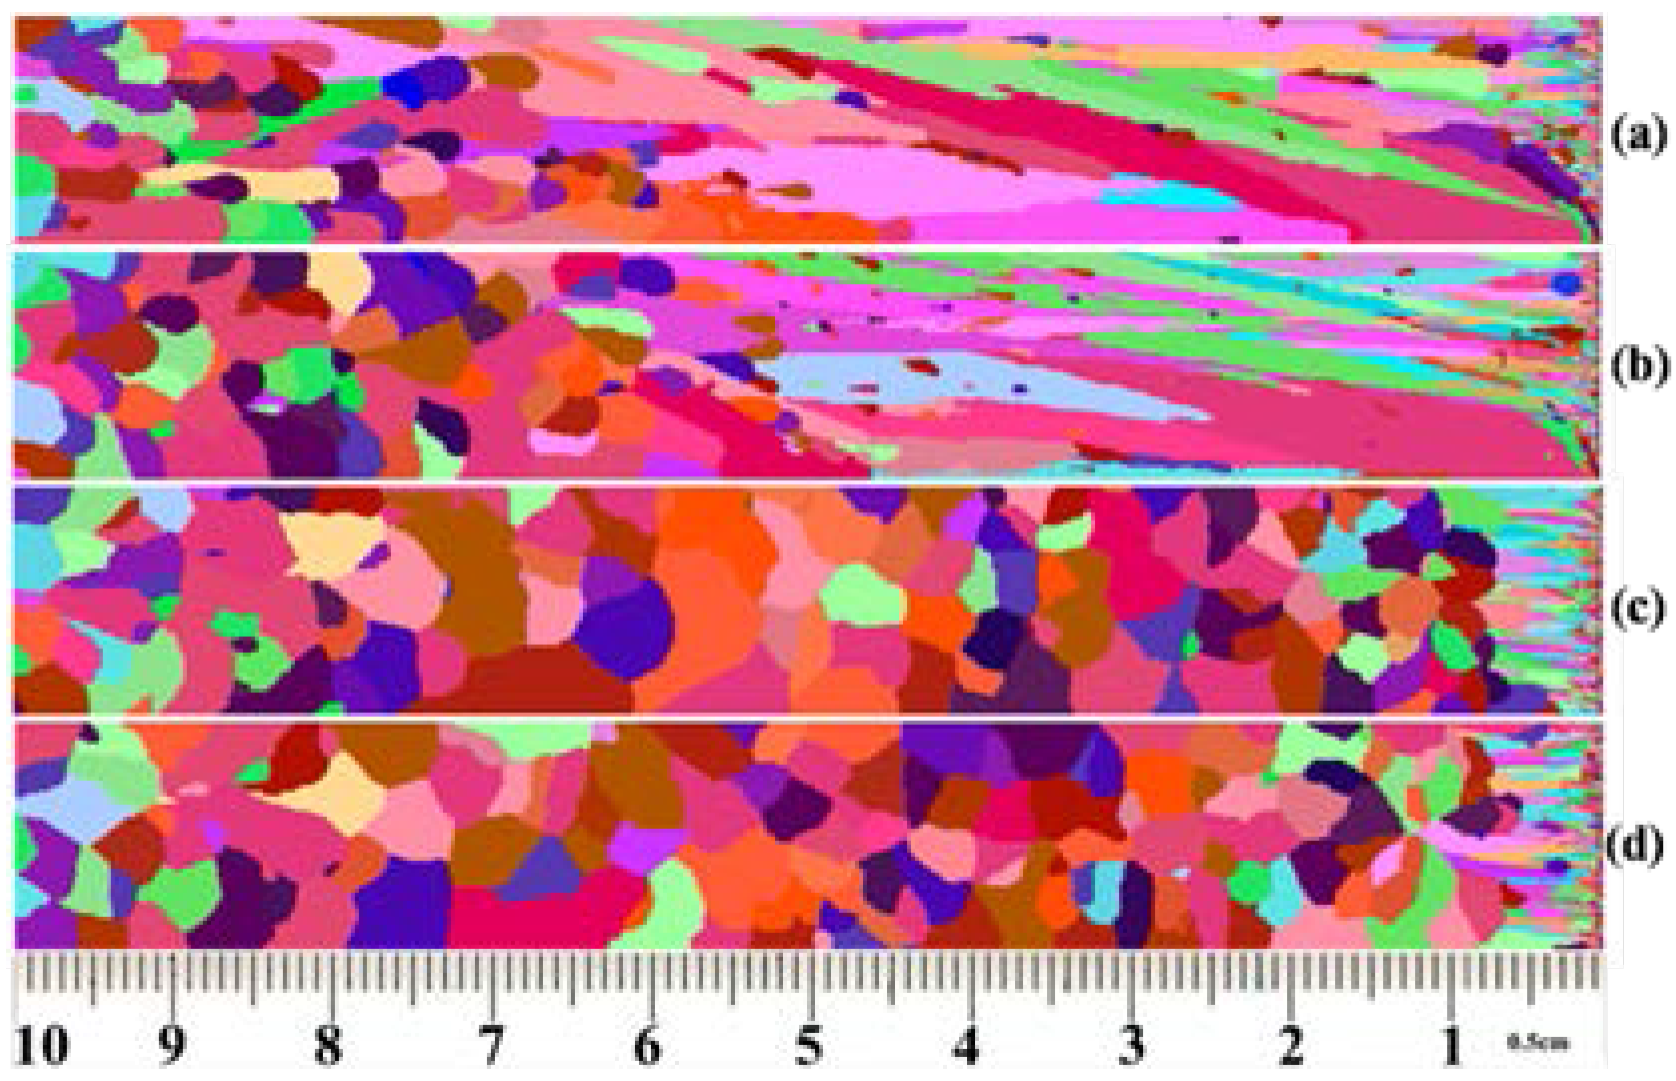
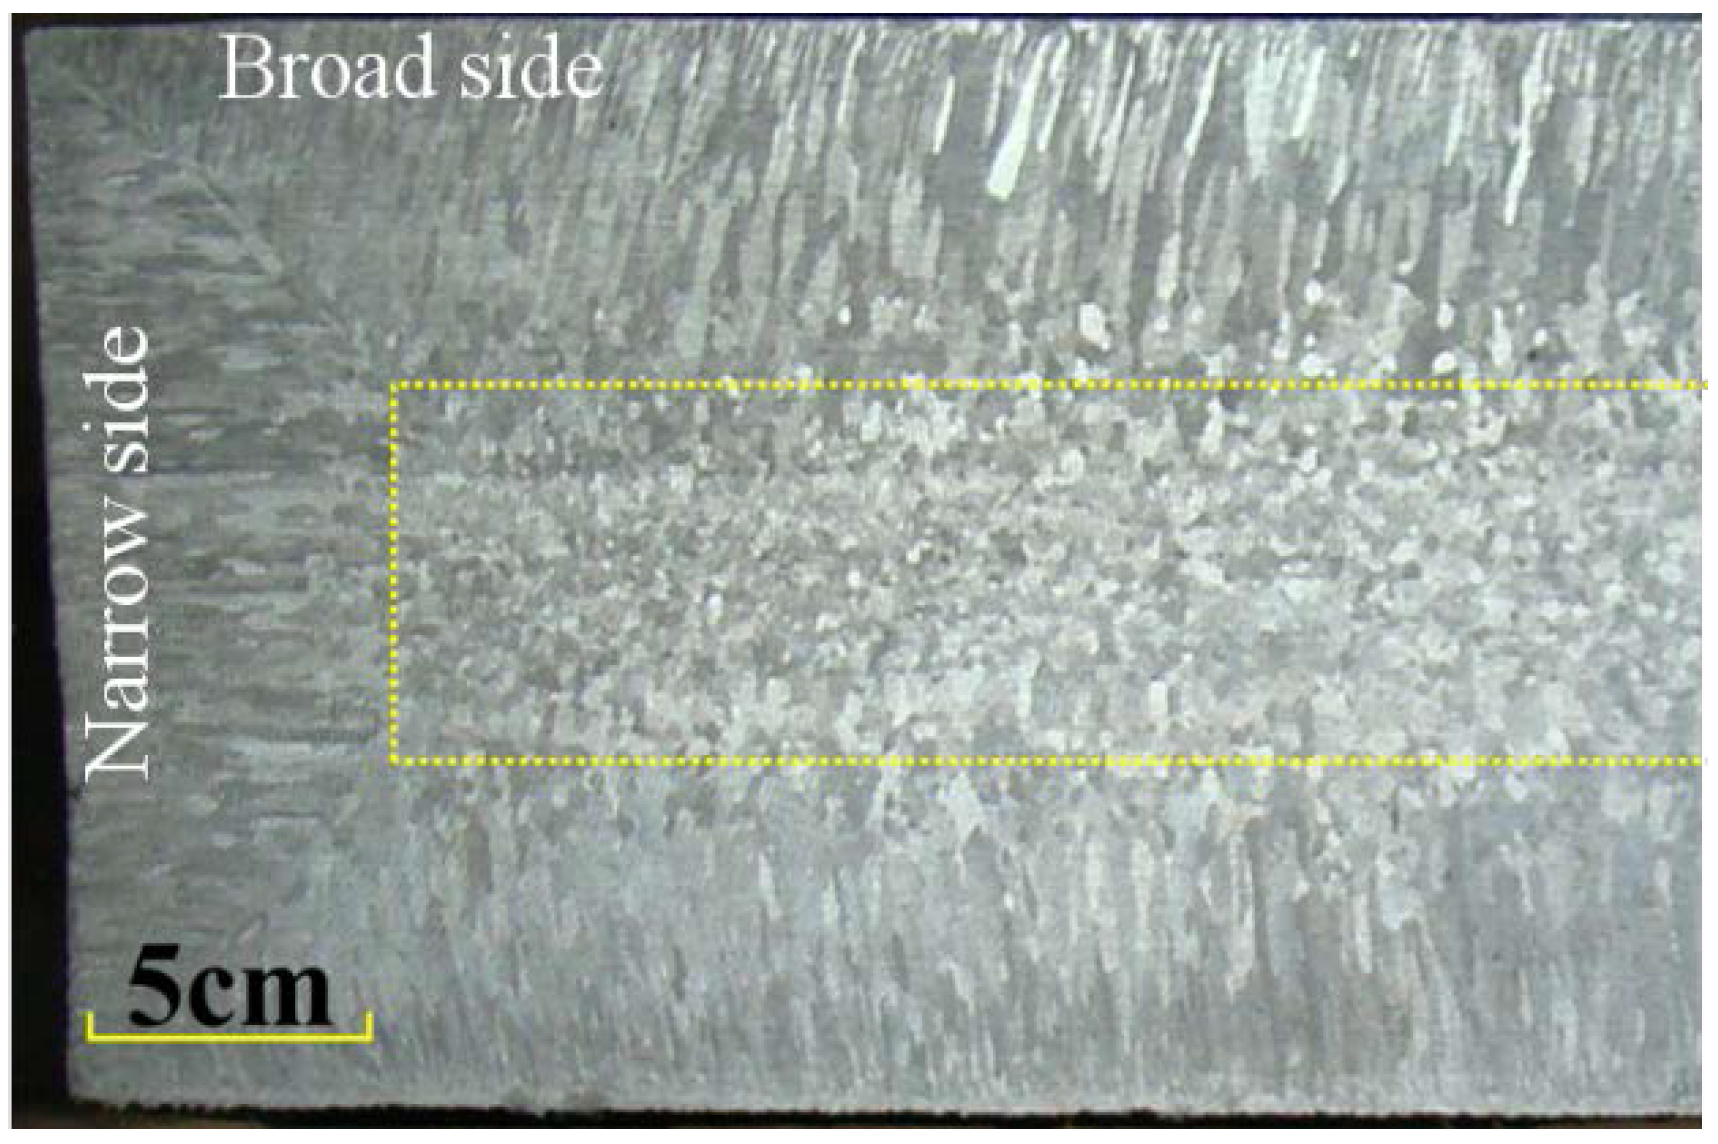
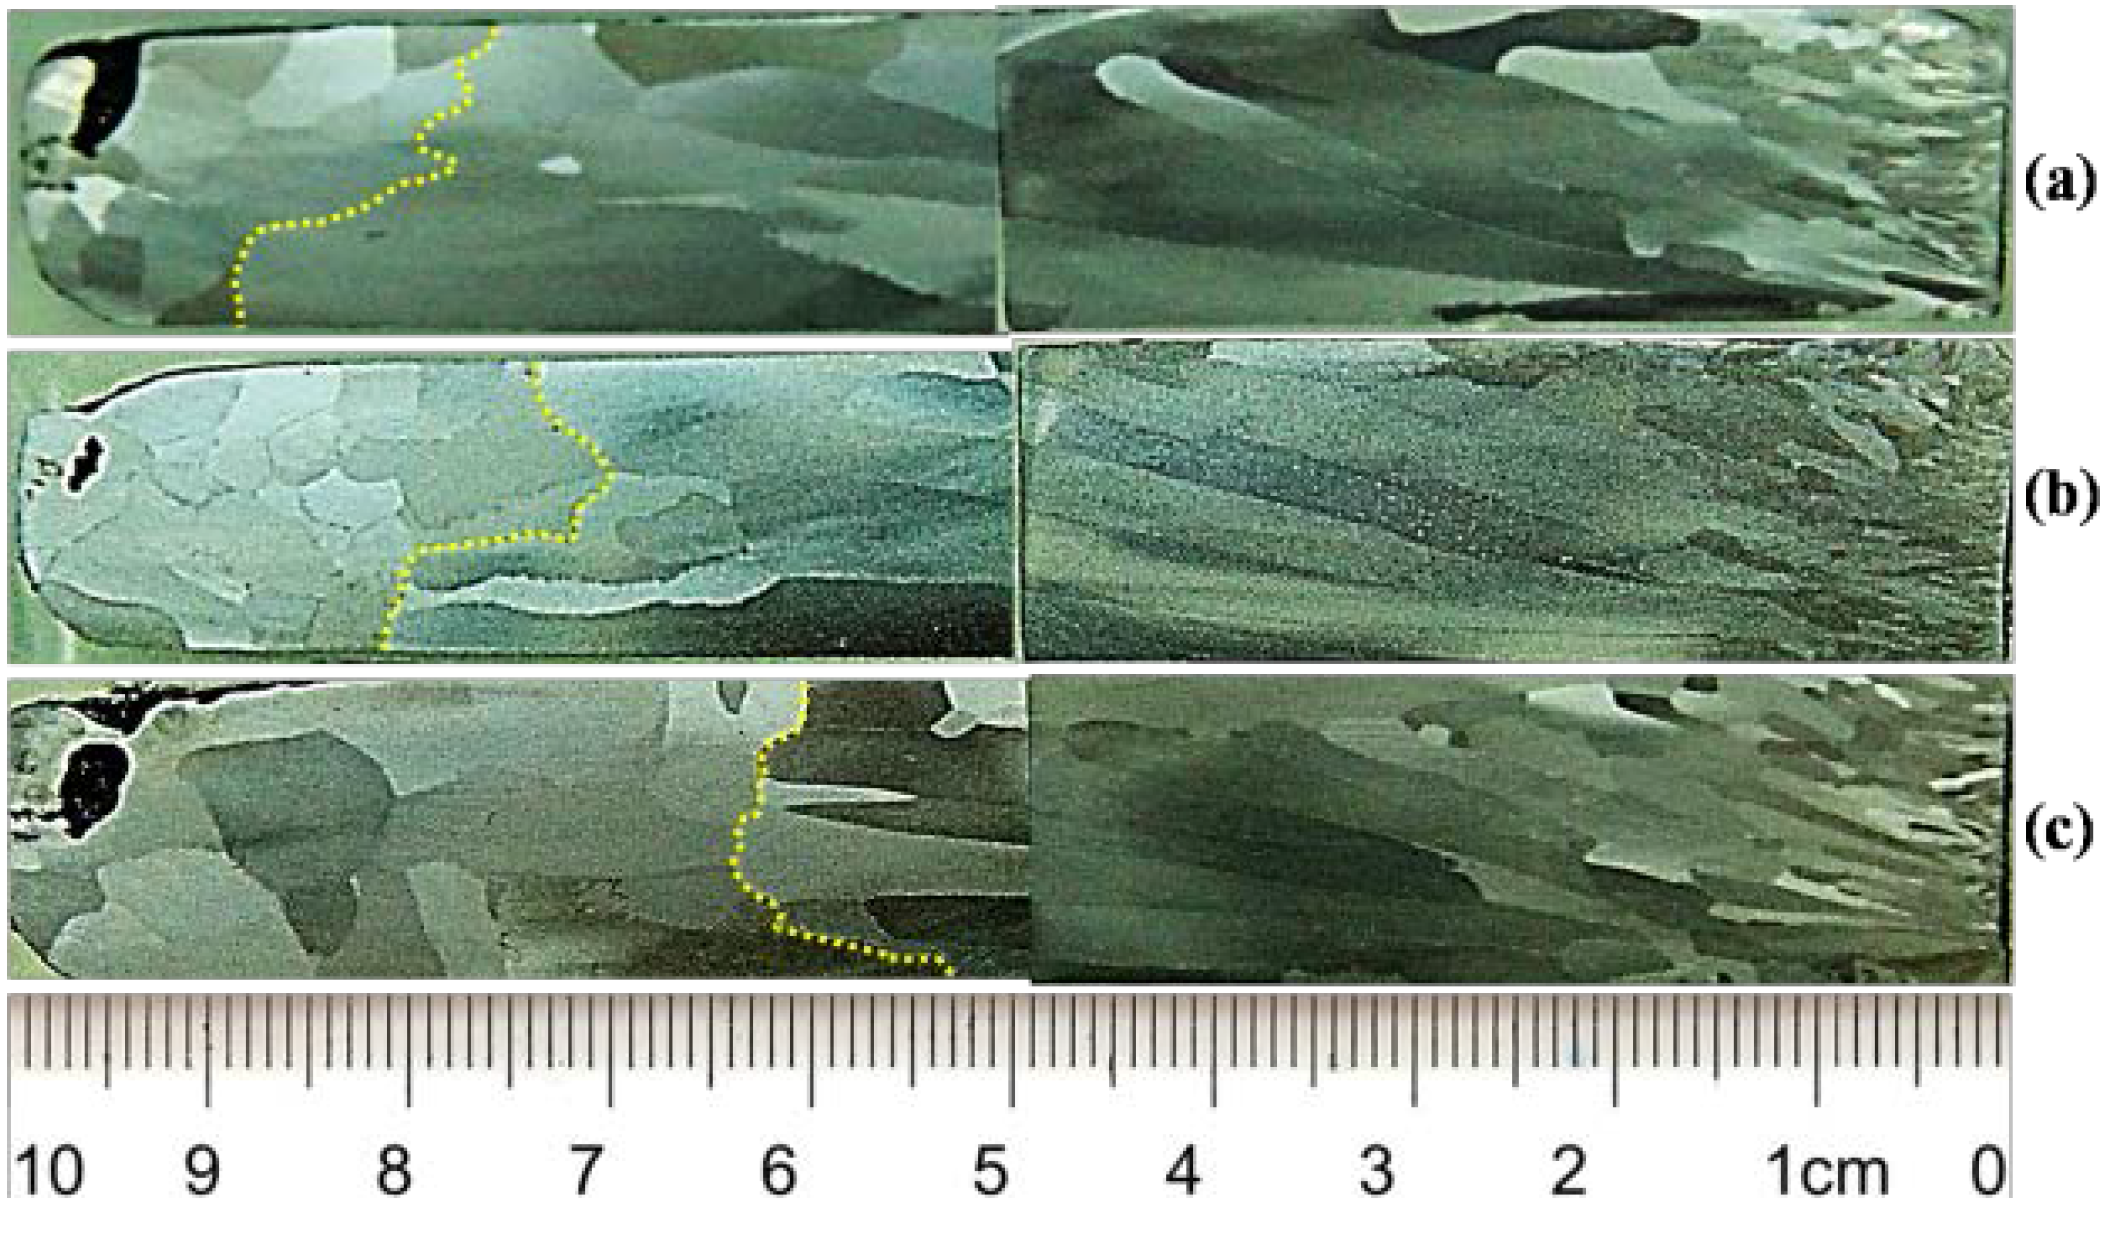
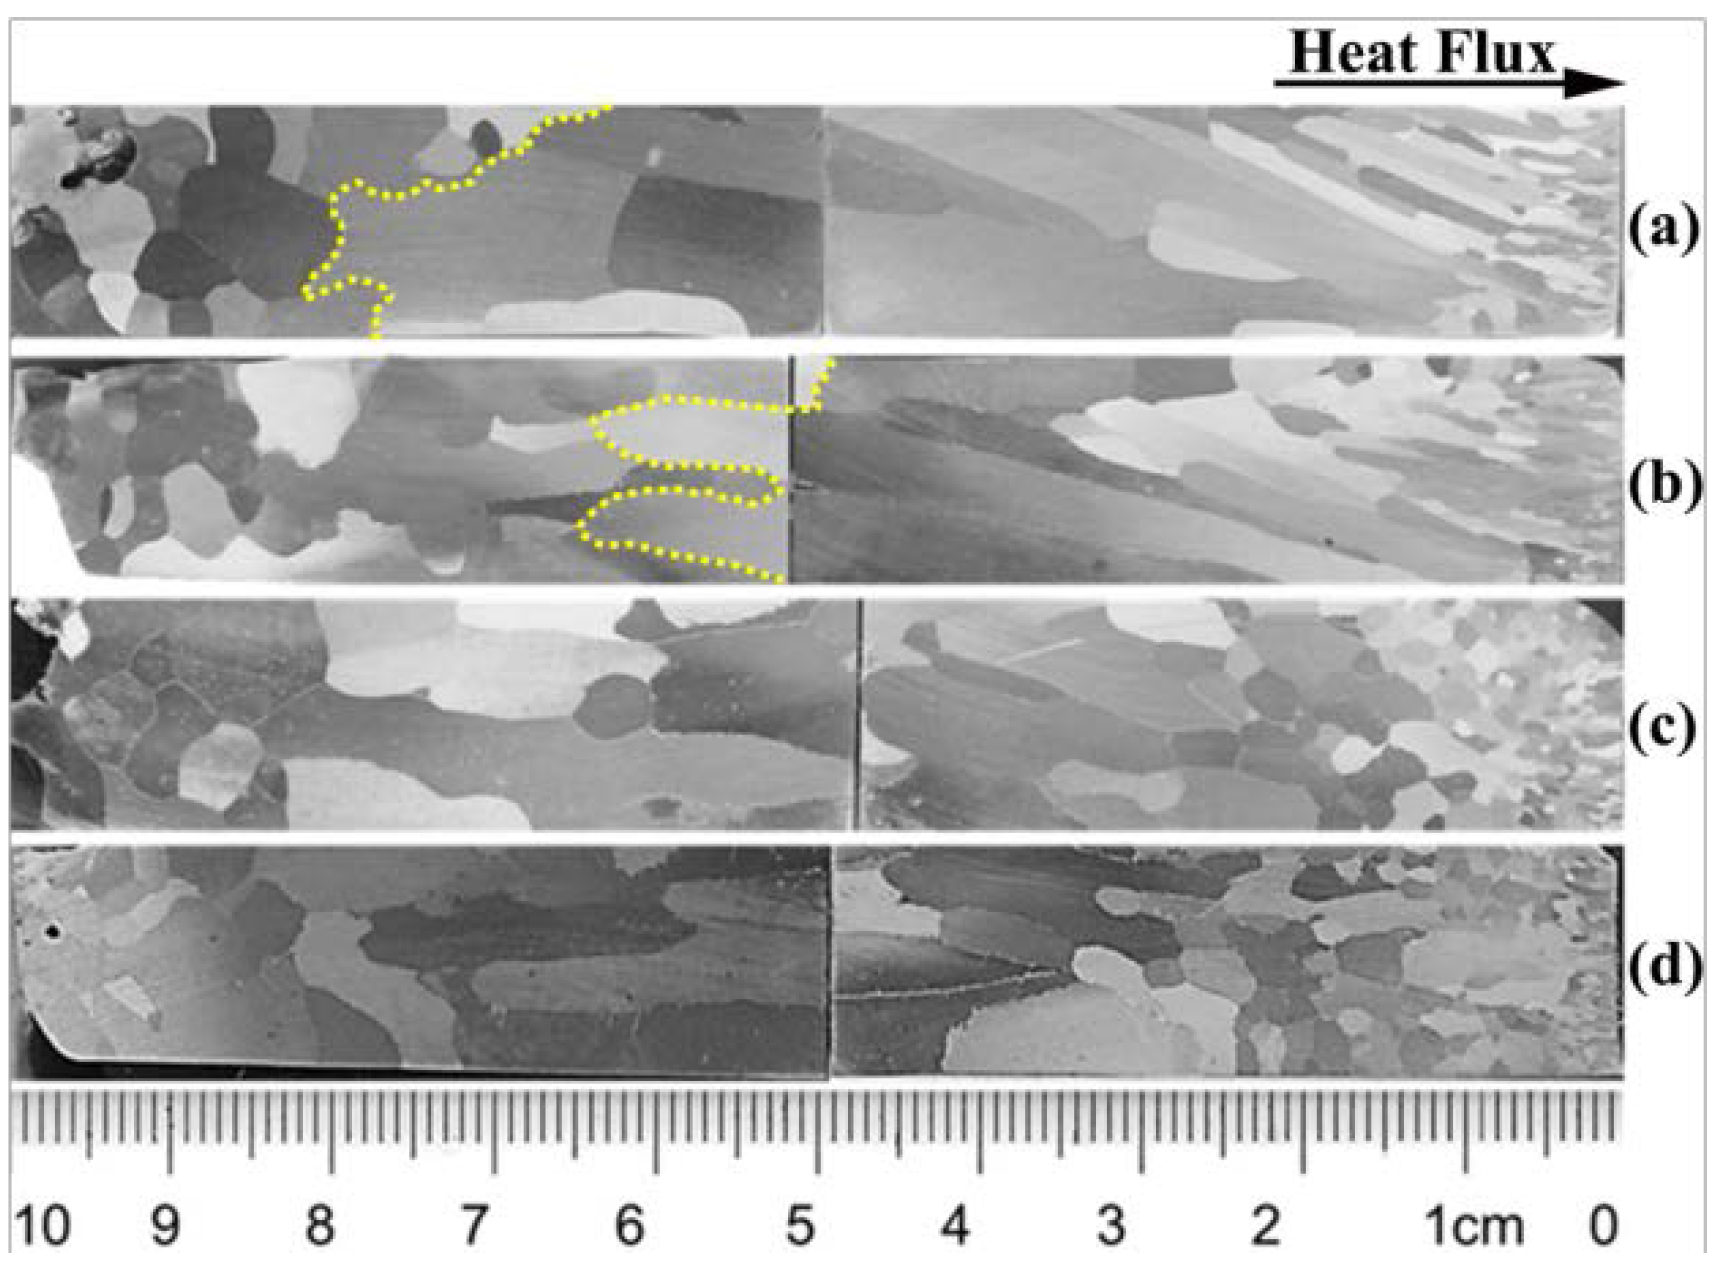
4.1. Grain Morphology of the Slab
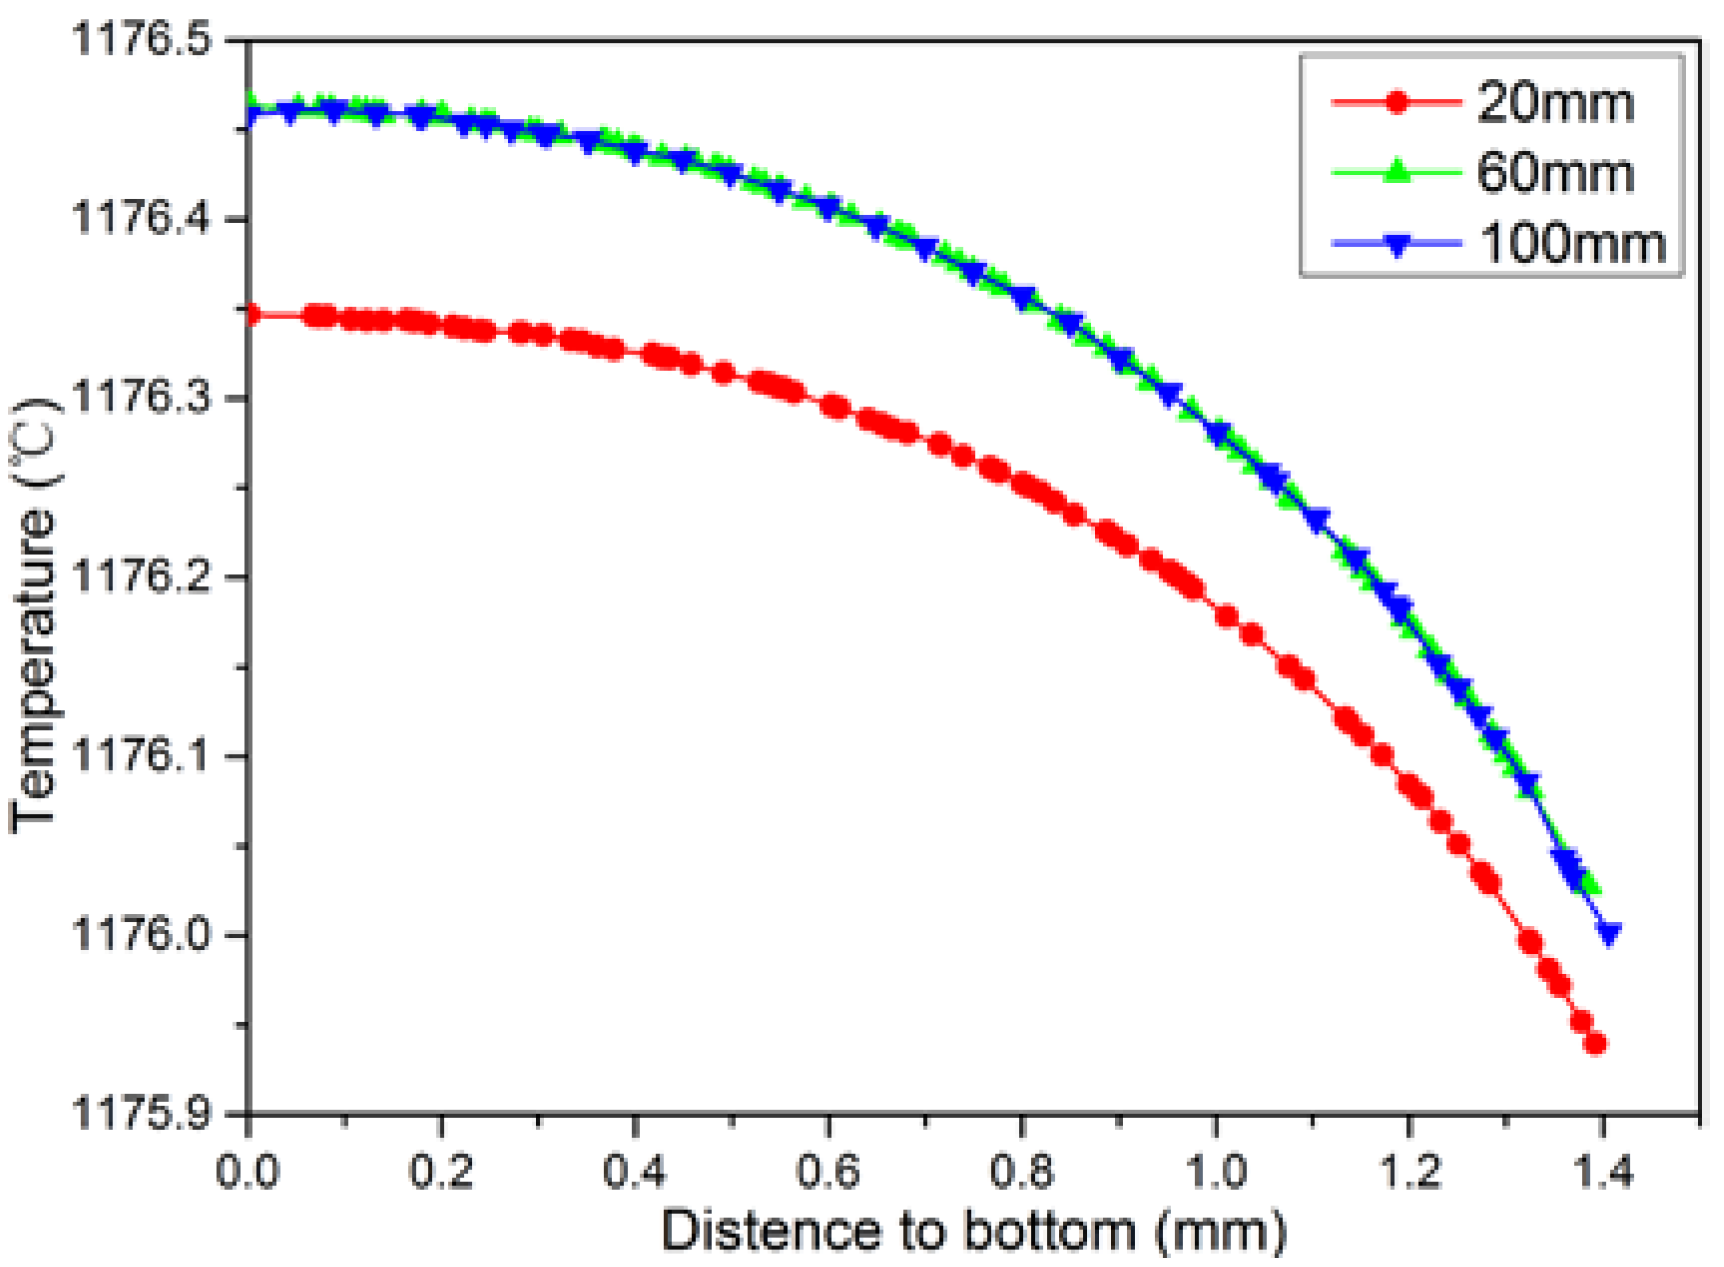
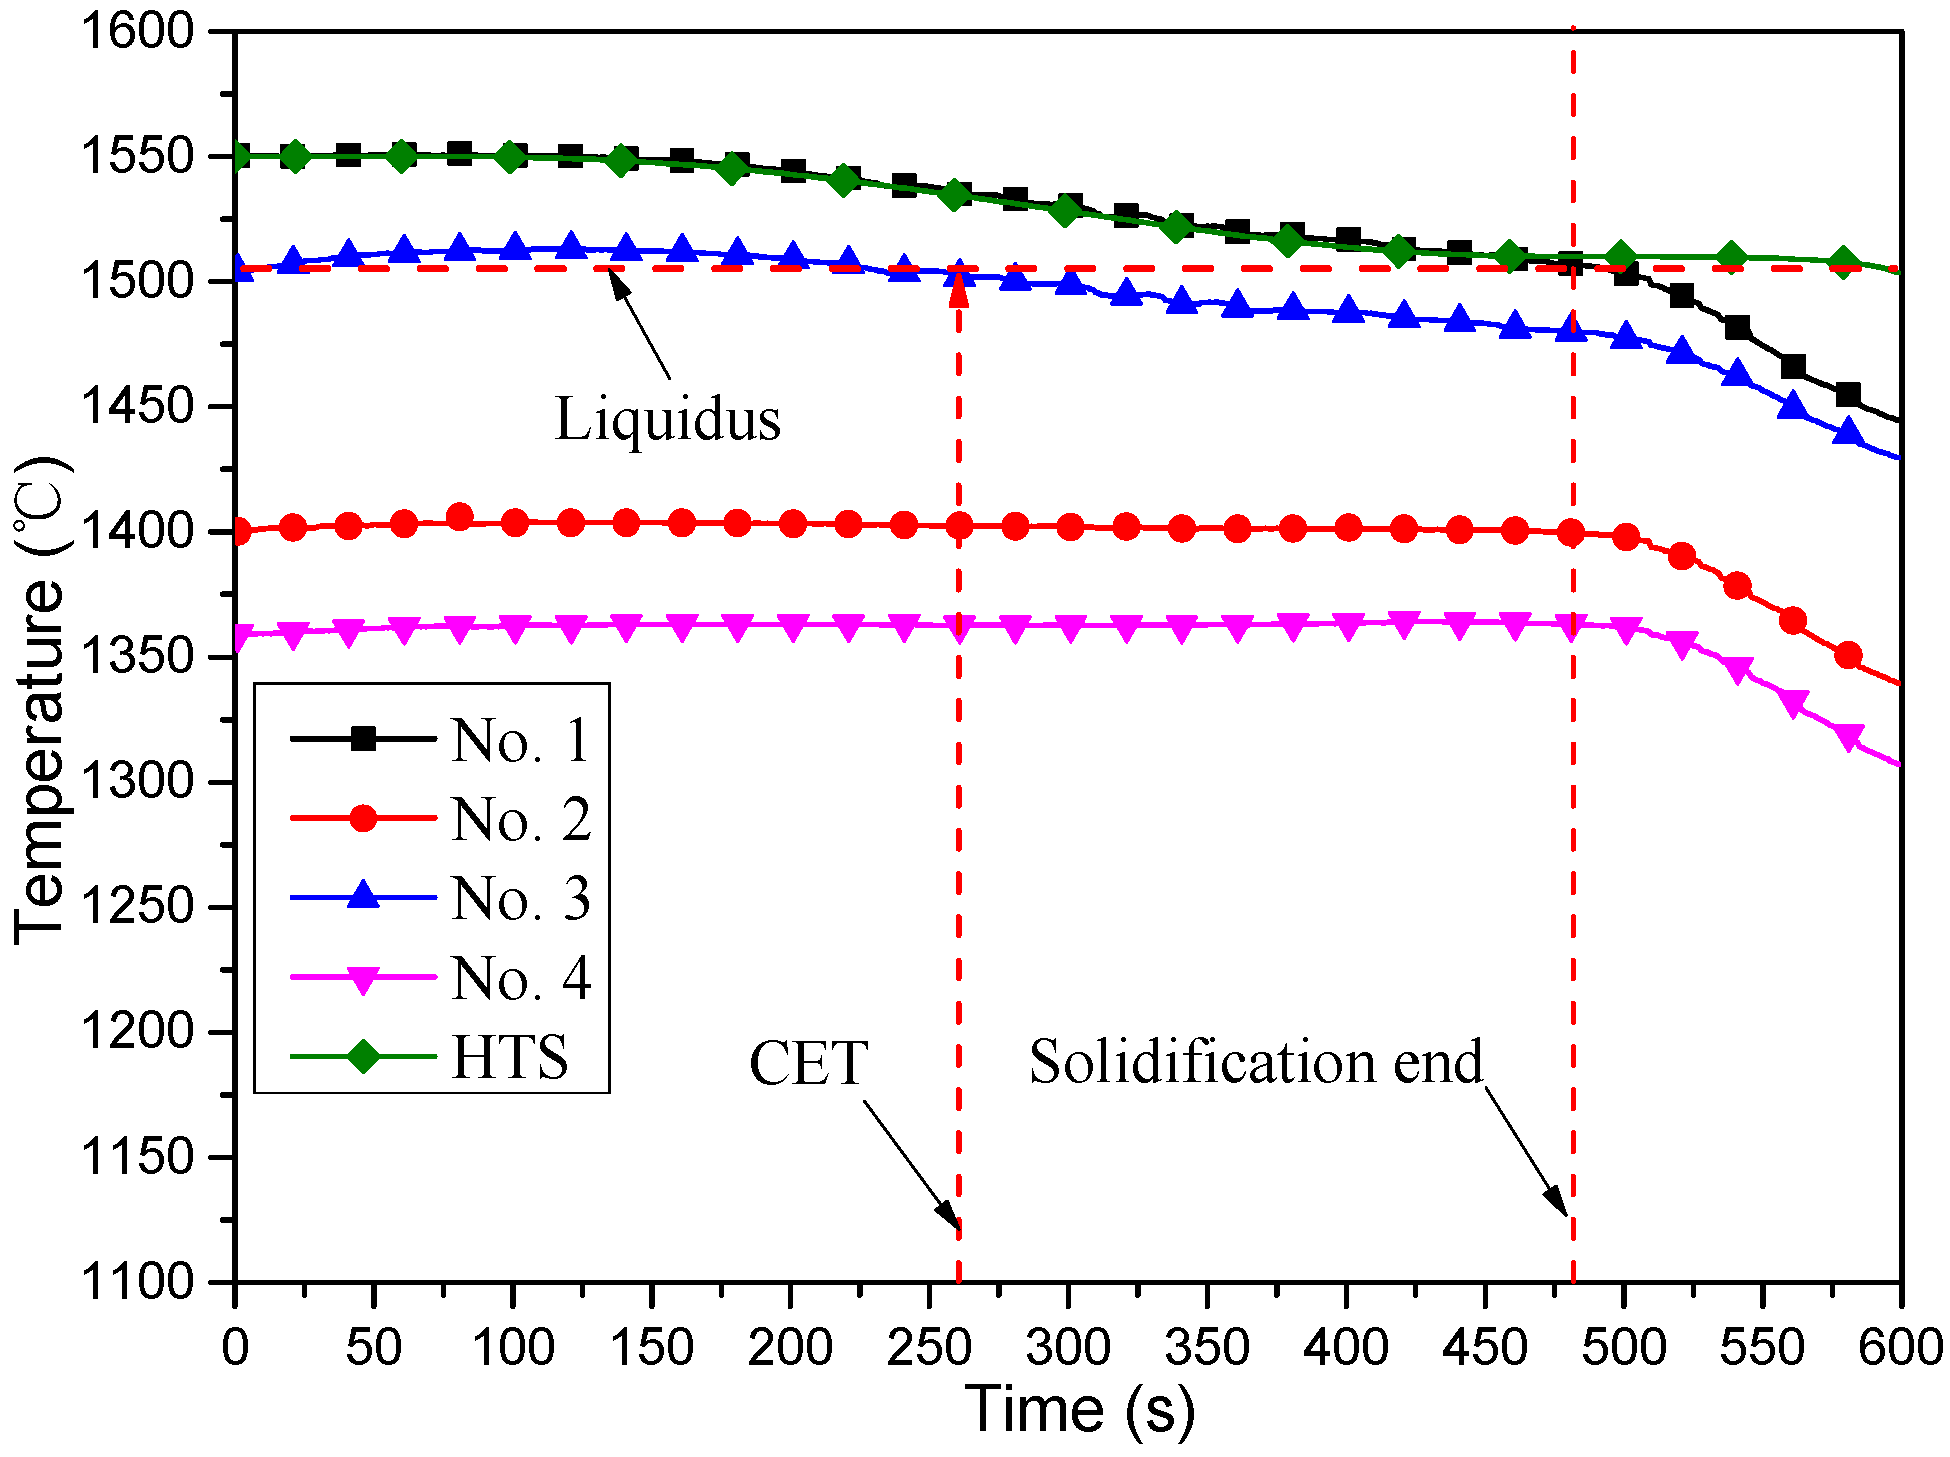
4.2. Temperature Distribution in the Furnace
4.3. Grain Growth
4.4. Numerical Simulation Results
5. Conclusions
Acknowledgments
Author Contributions
Conflicts of Interest
References
- Fredriksson, H.; Hillert, M. On the formation of the central equiaxed zone in ingots. Metall. Mater. Trans. B 1972, 3, 569–574. [Google Scholar] [CrossRef]
- Burden, M.H.; Hunt, J.D. Cellular and dendritic growth II. J. Cryst. Growth 1974, 22, 109–116. [Google Scholar] [CrossRef]
- Burden, M.H.; Hunt, J.D. Cellular and dendritic growth I. J. Cryst. Growth 1974, 22, 99–108. [Google Scholar] [CrossRef]
- Wang, T.M.; Xu, J.J.; Li, J.; Huang, W.X.; Liu, S.C.; Li, T.J. In situ study on dendrite growth of metallic alloy by a synchrotron radiation imaging technology. Sci. China Technol. Sci. 2010, 53, 1278–1284. [Google Scholar] [CrossRef]
- Ruvalcaba, D.; Mathiesen, R.H.; Eskin, D.G.; Arnberg, L.; Katgerman, L. In situ observations of dendritic fragmentation due to local solute-enrichment during directional solidification of an aluminum alloy. Acta Mater. 2007, 55, 4287–4292. [Google Scholar] [CrossRef]
- Arnberg, L.; Mathiesen, R.H. The real-time, high-resolution X-ray, video microscopy of solidification in aluminum alloys. JOM 2007, 59, 20–26. [Google Scholar] [CrossRef]
- Mathiesen, R.H.; Arnberg, L.; Bleuet, P.; Somogyi, A. Crystal fragmentation and columnar-to-equiaxed transitions in Al-Cu studied by synchrotron X-ray video microscopy. Metall. Mater. Trans. A Phys. Metall. Mater. Sci. 2006, 37A, 2515–2524. [Google Scholar] [CrossRef]
- Junichi, C.; Fujimoto, I.; Asaeda, Y. X-ray topography with chromatic-aberration correction. J. Appl. Phys. 1971, 42, 4731–4735. [Google Scholar]
- Lei, Z.S.; Zhang, B.W.; Deng, K.; Ren, Z.M. Study on Meniscus Temperature Fluctuation during Mold oscillation in Continuous Casting by Modeling Experiments. J. Shanghai Univ. 2002, 6, 236–239. [Google Scholar] [CrossRef]
- Mahapatra, R.B.; Brimacombe, J.K.; Samarasekera, I.V. Mold behavior and influence on quality in the continuous casting of steel slabs. Part II. Mold heat transfer, mold flux behavior formation of oscillation marks, longitudinal off-corner depressions, and subsurface cracks. Metall. Trans. B 1991, 22, 861–888. [Google Scholar] [CrossRef]
- Zhang, C.; Ye, J.Z.; Wu, C.S.; Hu, J.C.; Zhong, H.G.; Zhai, Q.J. The effect of cooling intensity on the solidification structure and ferrite phase fraction of a duplex stainless steel. In Proceedings of EPD Congress 2014, San Diego, CA, USA, 16–20 February 2014; pp. 463–470.
- Samarasekera, I.V.; Brimacombe, J.K. Thermal and Mechanical Behavior of Continous-casting Billet Molds. Ironmak. Steelmak. 1982, 9, 1–15. [Google Scholar]
- Thomas, B.G.; Samarasekera, I.V.; Brimacombe, J.K. Comparison of numerical modeling techniques for complex, two-dimensional, transient heat-conduction problems. Metall. Trans. B 1984, 15B, 307–318. [Google Scholar] [CrossRef]
- Thomas, B.G. Mathematical Models of Continuous Casting of Steel Slabs, Annual Report to Continuous Casting Consortium; UIUC: Champaign, IL, USA, 1995. [Google Scholar]
- Thomas, B.G.; Ho, B.; Li, G. CON1D V. 3.1 User Manual; Report to Continuous Casting Consortium: Urbana, IL, USA, 14 January 1995. [Google Scholar]
- Meng, Y.; Thomas, B.G. Heat-transfer and solidification model of continuous slab casting: CON1D. Metall. Mater. Trans. B 2003, 34B, 658–705. [Google Scholar] [CrossRef]
- Rappaz, M.; Gandin, C.A. Probabilistic modelling of microstructure formation in solidification processes. Acta Metall. Mater. 1993, 41, 345–360. [Google Scholar] [CrossRef]
- Gandin, C.A.; Rappaz, M. A coupled finite element-cellular automaton model for the prediction of dendritic grain structures in solidification processes. Acta Metall. Mater. 1994, 42, 2233–2246. [Google Scholar] [CrossRef]
- Kurz, W.; Giovanola, W.; Trivedi, R. Theory of microstructural development during rapid solidification. Acta Metall. 1986, 34, 823–830. [Google Scholar] [CrossRef]
- Yu, J.Q.; Yi, W.Z.; Chen, B.D. Binary Alloy. Phase Diagram (in Chinese); Shanghai Scientific and Technical Publishers: Shanghai, China, 1987. [Google Scholar]
- Chen, J.X. Ferrous Metallurgy (in Chinese); Metallurgical Industry Press: Beijing, China, 2004. [Google Scholar]
- Li, W.C. Physical Chemistry of Metallurgy and Material (in Chinese); Metallurgical Industry Press: Beijing, China, 2001. [Google Scholar]
- McLean, M. Directly Solidified Materials for High Temperature Service; The Metals Society: London, UK, 1983. [Google Scholar]


| Parameter | Value | Parameter | Value |
|---|---|---|---|
| Casting Speed | 0.8 m/min | Working mold length | 0.8 m |
| Slab geometry, W × N | 200 × 600 m | Secondary cooling length | 13.6 m |
| Superheat | 20 °C | - | - |
| Elements | Cr | C | N | Mn | Si | P | S |
|---|---|---|---|---|---|---|---|
| Content | 14.5 | 0.025 | 0.015 | 0.3 | 0.3 | 0.02 | 0.001 |
| Temperature (K) | Fraction Solid (wt. %) | Thermal Conductivity (W·m−1·K−1) | Specific Heat (J·g−1·K−1) |
|---|---|---|---|
| 1783 | 0.043 | 32.7 | 9.02 |
| 1781 | 0.37 | 33.3 | 26.8 |
| 1778 | 0.62 | 33.8 | 12.9 |
| 1776 | 0.72 | 33.9 | 8.87 |
| 1773 | 0.82 | 34.1 | 5.64 |
| 1771 | 0.86 | 34.2 | 4.40 |
| 1768 | 0.91 | 34.2 | 3.22 |
| 1766 | 0.94 | 34.3 | 2.70 |
| 1763 | 0.97 | 34.3 | 2.16 |
| 1761 | 1.0 | 34.3 | 1.89 |
| Element | c0/wt. % | m/K | k | Dl/(m2·s−1) |
|---|---|---|---|---|
| Cr | 14.5 | −7.4 | 0.99 | 1.8 × 10⁻⁹ |
| C | 0.025 | −58 | 0.17 | 2.3 × 10⁻⁹ |
| N | 0.015 | −4.6 | 0.78 | 3.0 × 10⁻⁹ |
| Mn | 0.3 | −5.0 | 0.68 | 7.6 × 10⁻⁹ |
| Si | 0.3 | −18.7 | 0.65 | 8.5 × 10⁻⁹ |
| P | 0.02 | −48.3 | 0.13 | 4.6 × 10⁻⁹ |
| S | 0.001 | −18.7 | 0.65 | 3.5 × 10⁻⁹ |
| Nucleation Parameter | ΔTmax | ∆Tσ | nmax |
|---|---|---|---|
| Surface nucleation | 1.0 °C | 2.0 °C | 4.68 × 10⁹ m−2 |
| Volume nucleation | 1.85 °C | 1.9 °C | 2.82 × 10⁸ m−3 |
| Growth parameter a2 | 9.403 × 10⁻⁶ ms−1·°C−2 | ||
| Growth parameter a3 | 9.480 × 10⁻⁶ ms−1·°C−3 | ||
© 2016 by the authors; licensee MDPI, Basel, Switzerland. This article is an open access article distributed under the terms and conditions of the Creative Commons by Attribution (CC-BY) license (http://creativecommons.org/licenses/by/4.0/).
Share and Cite
Bai, L.; Wang, B.; Zhong, H.; Ni, J.; Zhai, Q.; Zhang, J. Experimental and Numerical Simulations of the Solidification Process in Continuous Casting of Slab. Metals 2016, 6, 53. https://doi.org/10.3390/met6030053
Bai L, Wang B, Zhong H, Ni J, Zhai Q, Zhang J. Experimental and Numerical Simulations of the Solidification Process in Continuous Casting of Slab. Metals. 2016; 6(3):53. https://doi.org/10.3390/met6030053
Chicago/Turabian StyleBai, Liang, Bo Wang, Honggang Zhong, Jie Ni, Qijie Zhai, and Jieyu Zhang. 2016. "Experimental and Numerical Simulations of the Solidification Process in Continuous Casting of Slab" Metals 6, no. 3: 53. https://doi.org/10.3390/met6030053