3.2.1. Diffusion Couple 1: Zn/5.5 Ce-94.5 Mg at.%
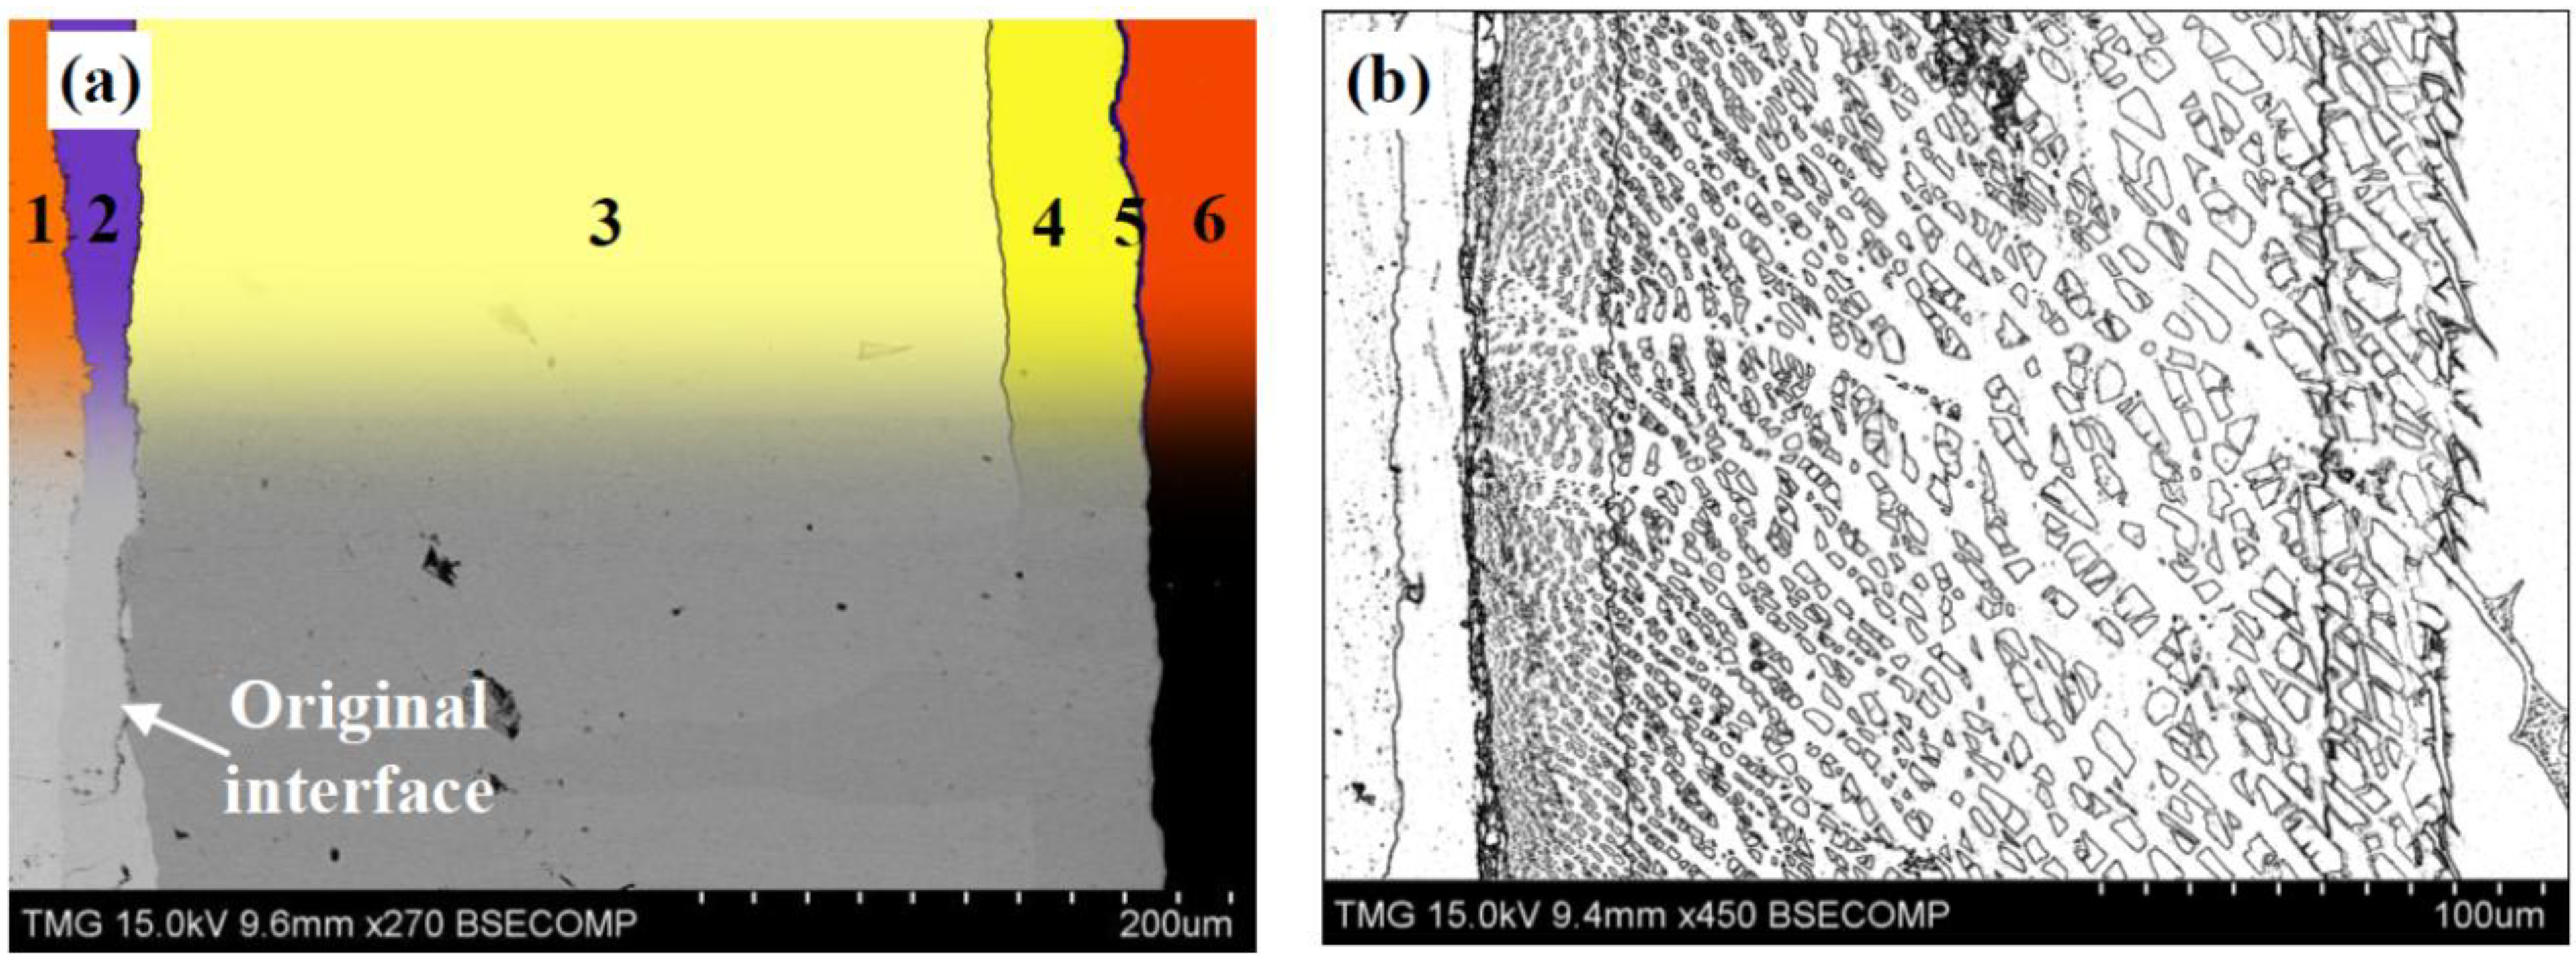
The SEM micrograph of the solid-solid diffusion Couple 1 is presented in
Figure 5a–c. The first end-member was made from pure Zn. The second end-member was made from an Mg and CeMg
12 two-phase binary alloy shown in
Figure 5d. Diffusion Couple 1 showed very peculiar phase morphologies between the two end-members, indicating the difficulty of extracting the phase relationships from this couple. These morphologies, however, are rich with information about the phase relationships, which normally requires a large number of key alloys to be revealed. WDS spot analysis was carried out for every component of these diffusion zones. The WDS spot analysis results are listed in
Table 3.
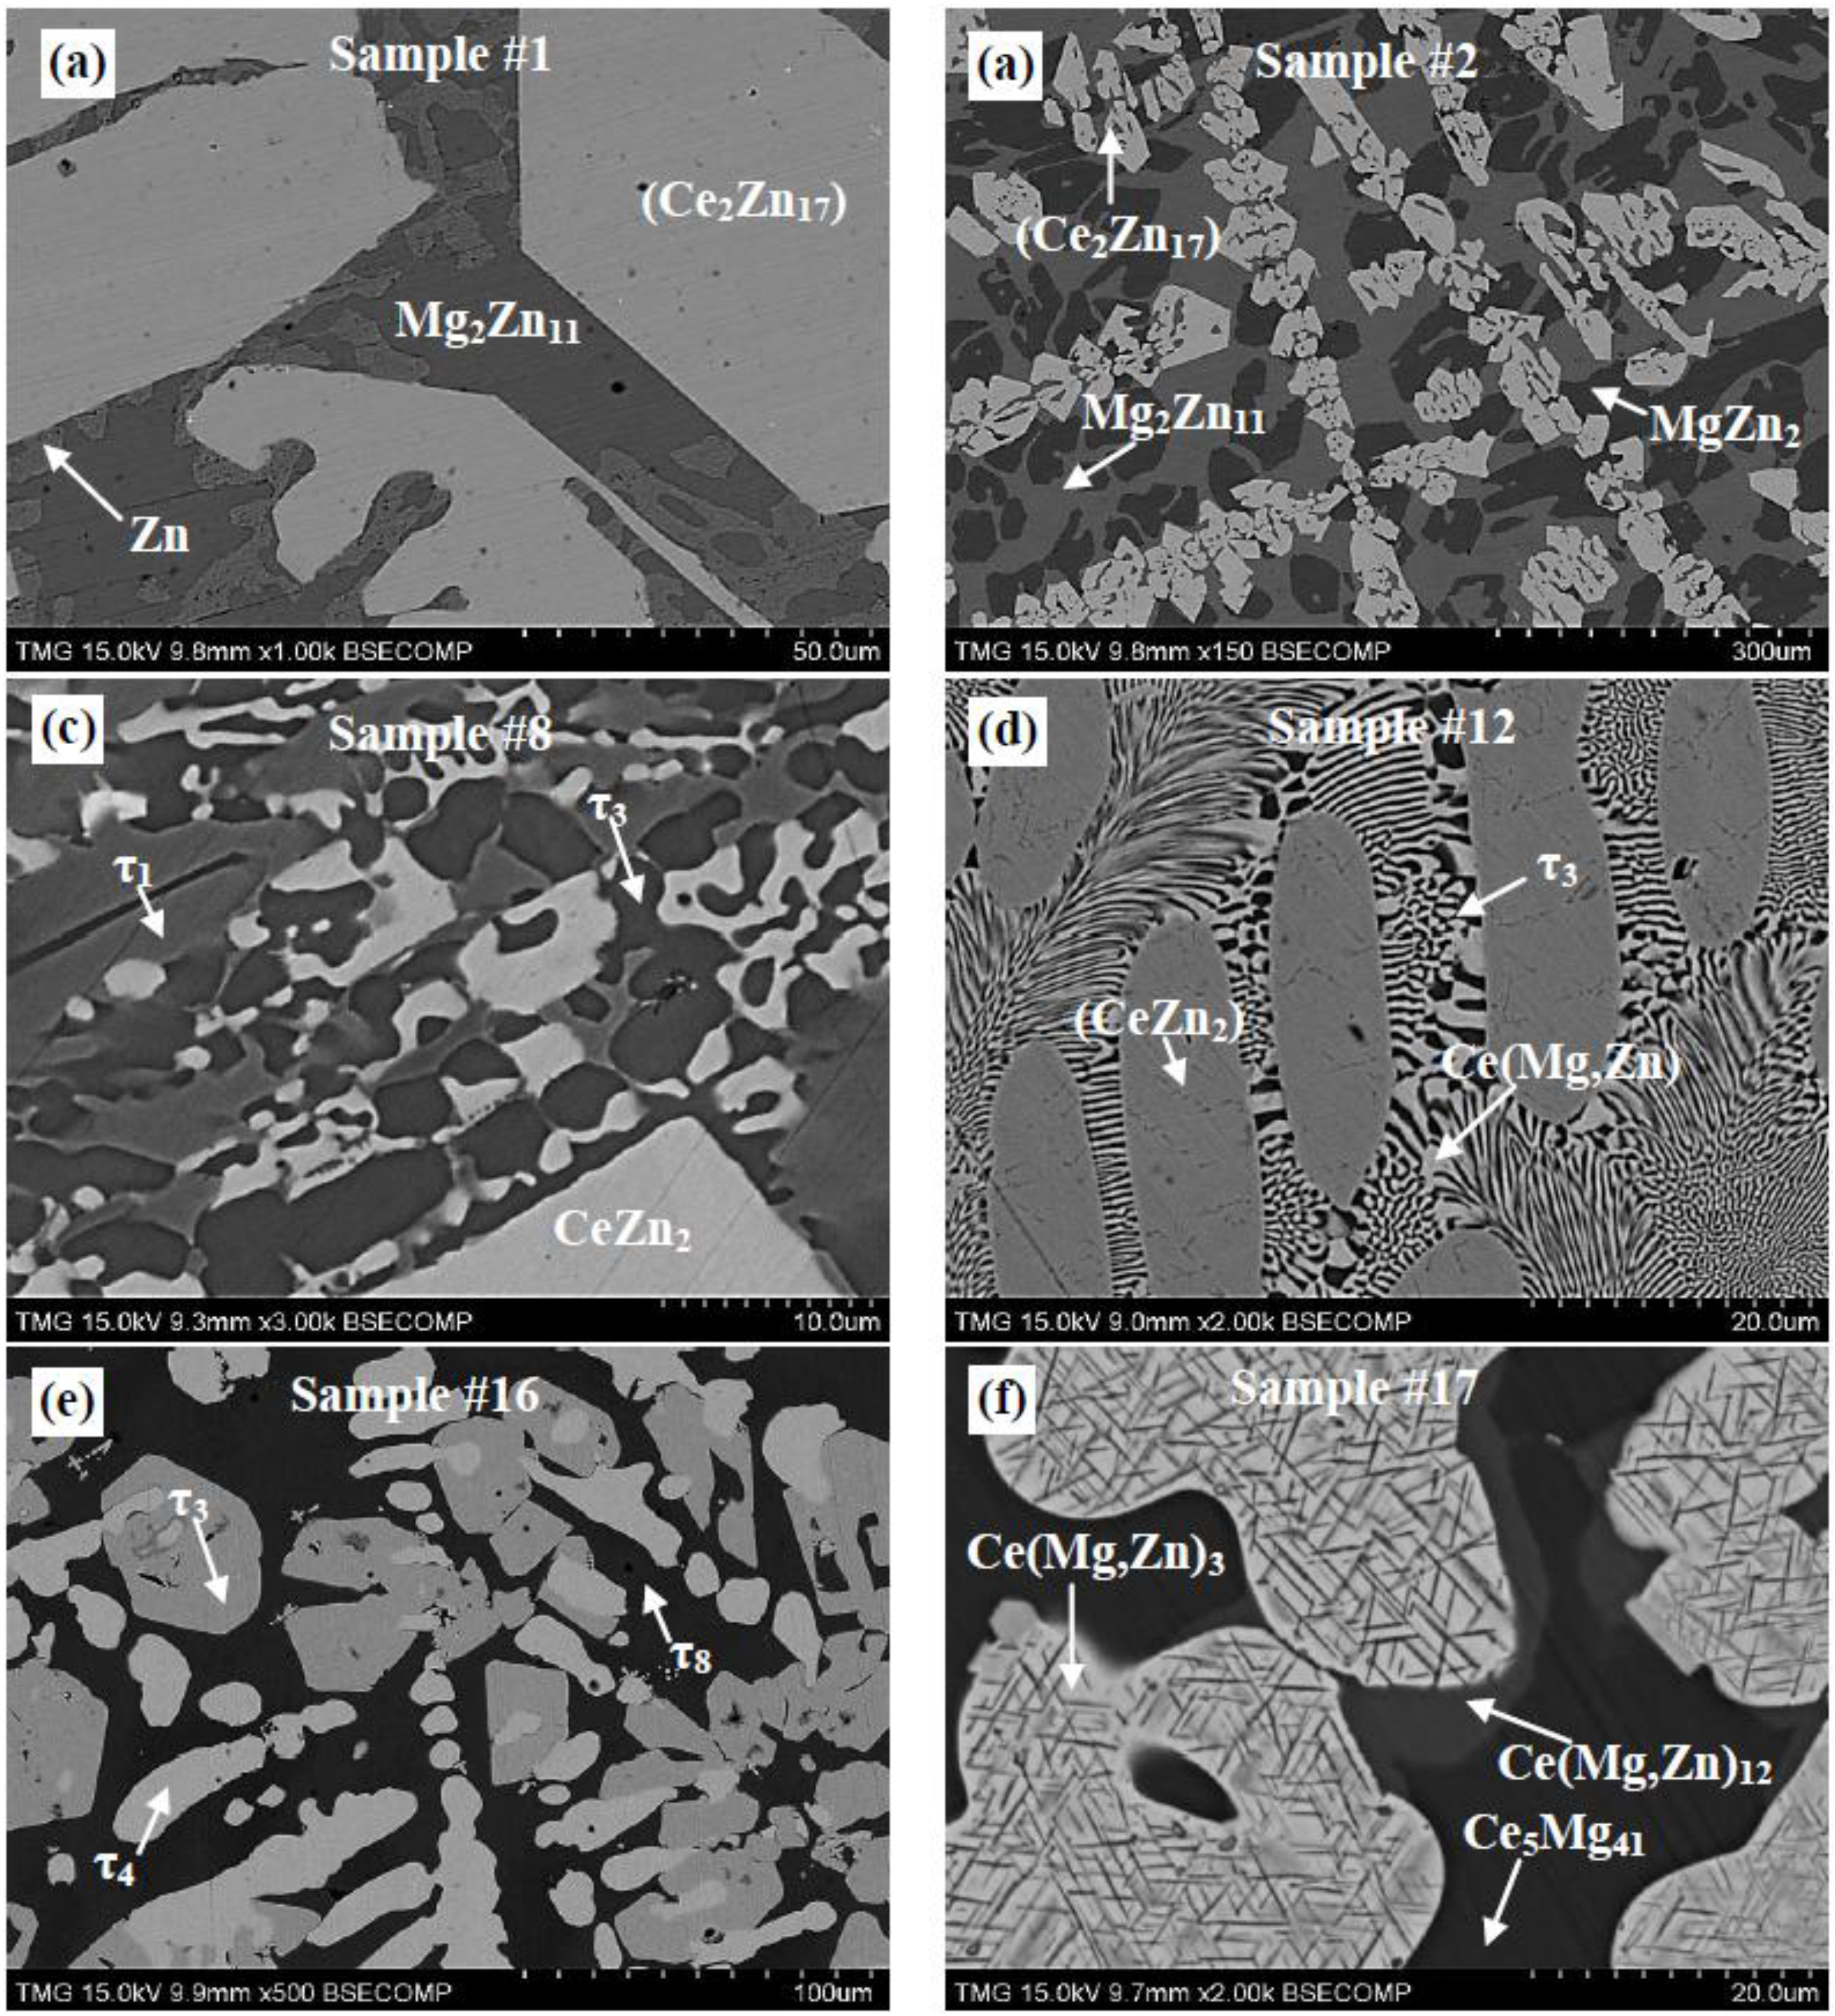
Figure 5.
(a–c) SEM micrographs of diffusion Couple 1 annealed at 300 °C for 21 days; (d) SEM micrograph of the Mg + CeMg12 two-phase alloy (end-member).
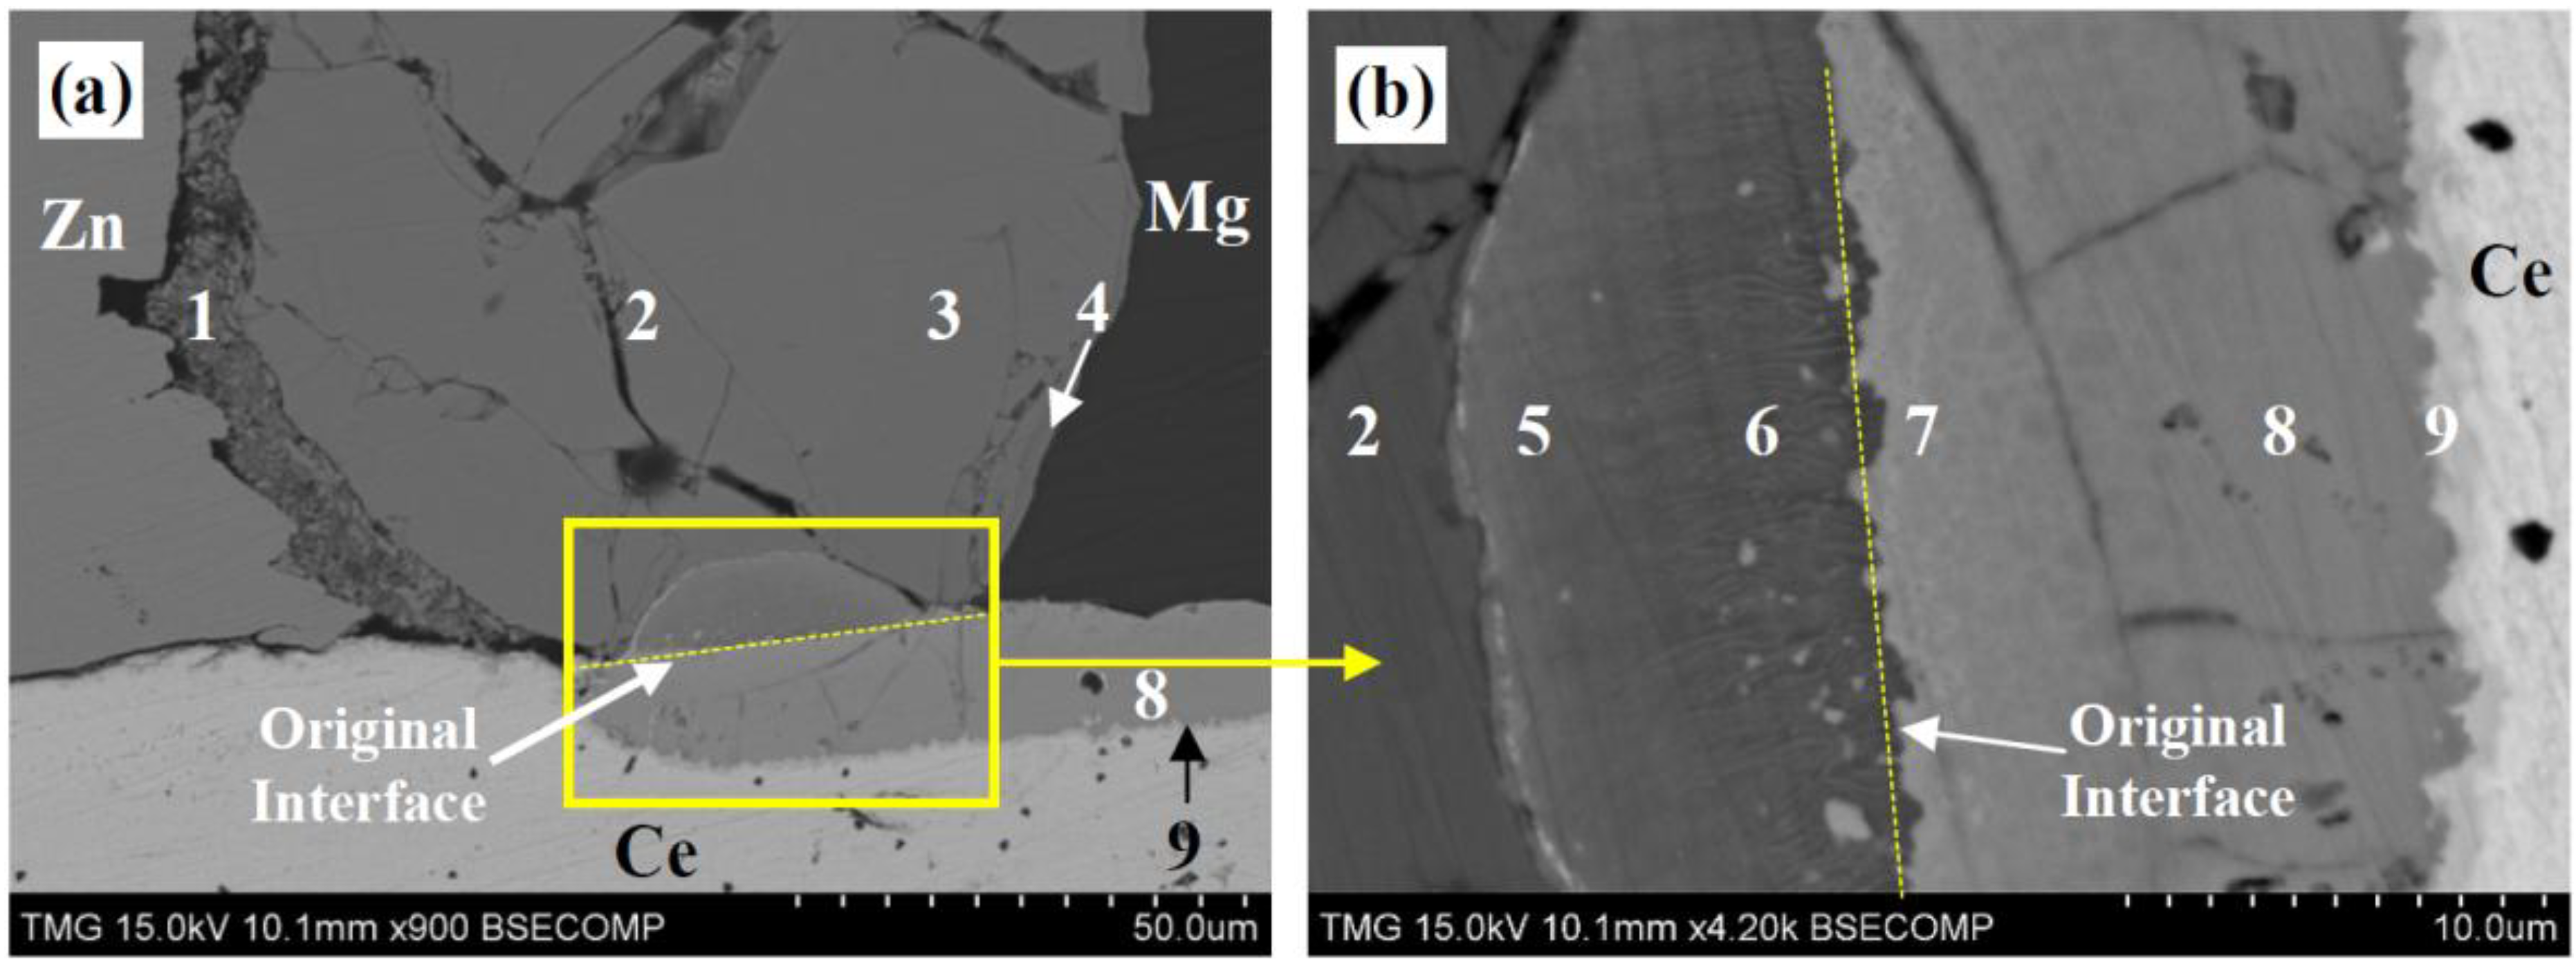
Upon annealing, nine diffusion zones formed. Diffusion Zone 2 represents the single phase of around 20 μm in width. Diffusion Zones 3–5 show layers with two phases. Diffusion Zones 6–8 show peritectic-like phase morphologies. Thus, Zones 6–8 contain two two-phase equilibria,
i.e., Solid A with Solid B and Solid B with Solid C, as illustrated in Zone 7 of
Figure 5b and
Table 3.
The SEM micrograph of diffusion Couple 1 in
Figure 5a showed a white phase and islanding within diffusion Zones 3–8, and the grey phase is the matrix. WDS spots were performed across diffusion Zones 3–8 to measure the composition of the white phase islands and the grey phase in the matrix.
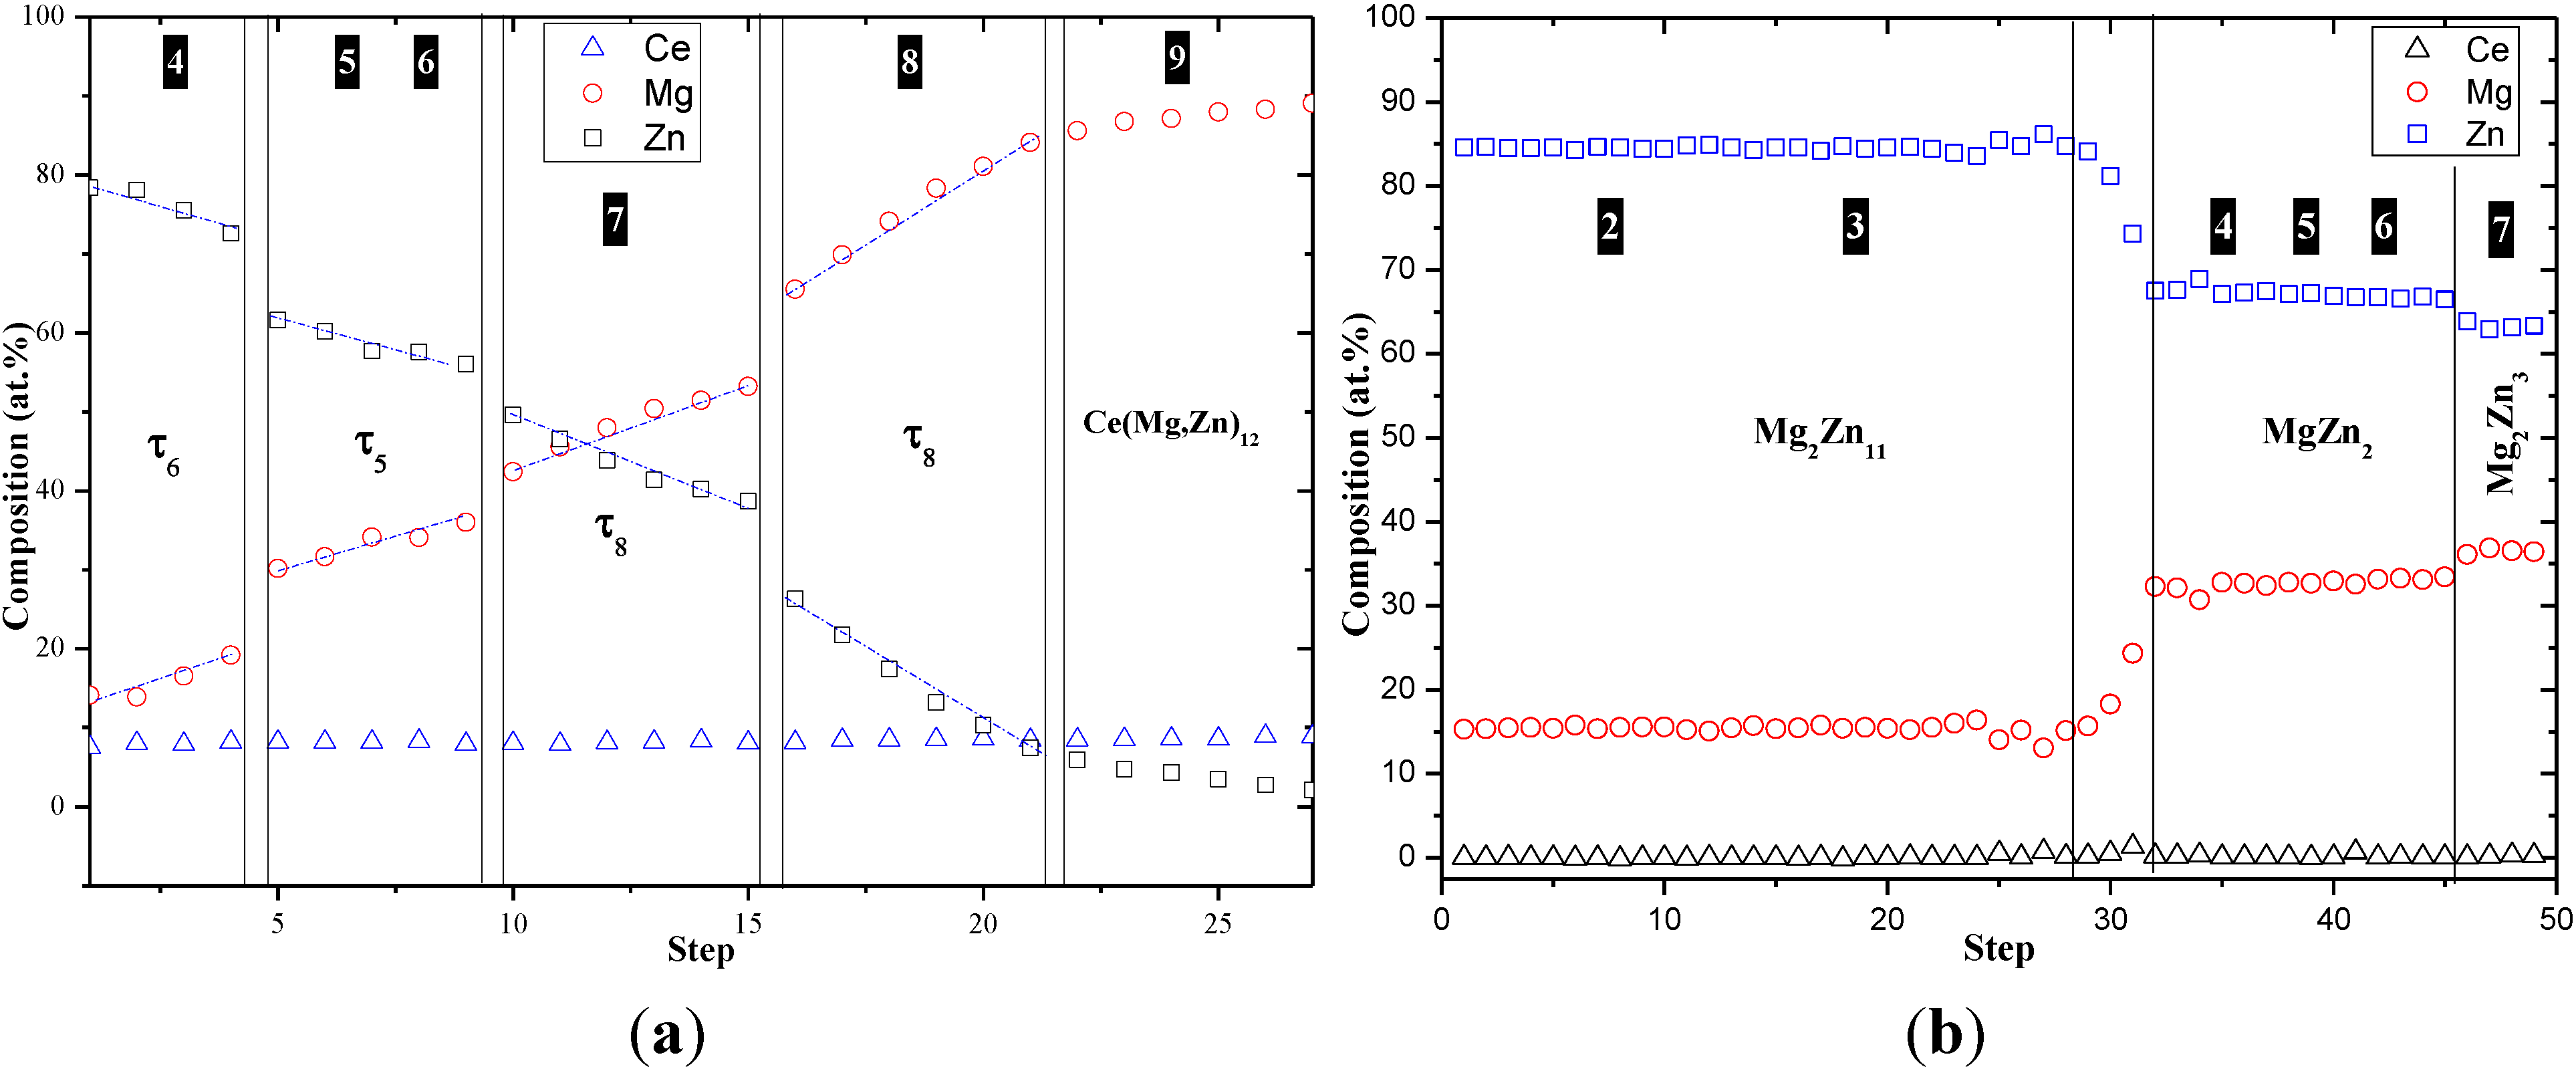
Figure 6a,b shows the composition profile of the white and grey phases across the diffusion couple. The
x-axis does not represent a metric distance; hence, it was labeled as a step, because these readings were taken across the diffusion zone with no exact spatial measurements.
Table 3.
WDS spot analysis of different diffusion zones of diffusion Couple 1.
| Zone | Composition (at.%) | Corresponding phase |
|---|
| Ce | Mg | Zn |
|---|
| 1 (end-member) | - | - | 100 | Zn |
| 2 | - | 15.6 | 84.4 | Mg2Zn11 |
| 3 | - | 15.0 | 84.9 | Mg2Zn11 (grey) |
| | 10.9 | 1.3 | 87.8 | (Ce2Zn17) |
| 4 | <1.0 | 32.8 | 67.1 | MgZn2 (grey) |
| | 8.0 | 8.2 | 83.8 | τ6 |
| 5 | - | 33.4 | 66.6 | MgZn2 (grey) |
| | 8.2 | 30.2 | 61.6 | τ5 (white) |
| 6 | 7.9 | 36.0 | 56.1 | τ5 (white) |
| | 0.1 | 32.8 | 67.1 | MgZn2 (grey) |
| | 0.1 | 32.8 | 67.1 | MgZn2 (grey) |
| | 2.3 | 49.0 | 48.7 | τ2 |
| 7 | 2.3 | 49.0 | 48.7 | τ2 |
| | 0.2 | 38.9 | 60.9 | Mg2Zn3 (grey) |
| | 8.6 | 42.4 | 49.0 | τ8 (white) |
| | 2.3 | 49.0 | 48.7 | τ2 |
| 8 | - | 100 | - | Mg |
| | 2.3 | 49.0 | 48.7 | τ2 |
| | 8.1 | 53.2 | 38.7 | τ8 (white) |
| | - | 100 | - | Mg |
| 9 (end-member) | 8.66 | 91.34 | - | Ce(Mg,Zn)12 |
| | - | 100 | - | Mg |
Figure 6.
The WDS composition profile of the (a) white phase islanding in the two-phase diffusion Zones 4–9; (b) the grey phase in the matrix of the same diffusion zones, including Zone 2.
One binary compound, CeMg
12, and three linear ternary compounds, τ
6 (CeMg
2.3−xZn
12.8+x; 0 ≤
x ≤ 1.1), τ
5 (CeMg
7Zn
12) and τ
8 (Ce(Mg
1−yZn
y)
11; 0.096 ≤
y ≤ 0.43), were detected from the white phase profile in
Figure 6a, whereas, three binary compounds (Mg
2Zn
11, MgZn
2 and Mg
2Zn
3) were detected in the grey phase profile (
Figure 6b). The concentration of Ce was almost constant within the ternary phases’ profile in
Figure 6a.
The sequence of the phases in the grey phase matrix was similar to that of the Mg-Zn binary diffusion couple, annealed at 300 °C and 21 days, shown in
Figure 7a. WDS spot results of the Mg-Zn diffusion couple are listed in
Table 4. The ternary diffusion Couple 1 was compared with the Mg-Zn binary diffusion couple to give a better understanding of the phase relations between the Mg-Zn binary compounds and the τ
5, τ
6 and τ
8 ternary compounds. In other words, the ternary compounds were distributed in a matrix of Mg-Zn compound layers, as illustrated in
Figure 7b.
Figure 7.
(a) SEM micrograph of the Mg-Zn binary diffusion couple annealed at 300 °C for 21 days; (b) sketch of the ternary diffusion Couple 1 showing three ternary compounds islanding in the Mg-Zn compound layers.
Table 4.
WDS spot analysis of the Mg-Zn binary diffusion couple.
| Zone | Composition (at.%) | Corresponding phase |
|---|
| Mg | Zn |
|---|
| 1 (end-member) | - | 100 | Zn |
| 2 | 15.3 | 84.7 | Mg2Zn11 |
| 3 | 67.1 | 32.9 | MgZn2 |
| 4 | 61.8 | 39.2 | Mg2Zn3 |
| 5 | 52.3 | 47.7 | Mg12Zn13 |
| 6 (end-member) | 100 | - | Mg |
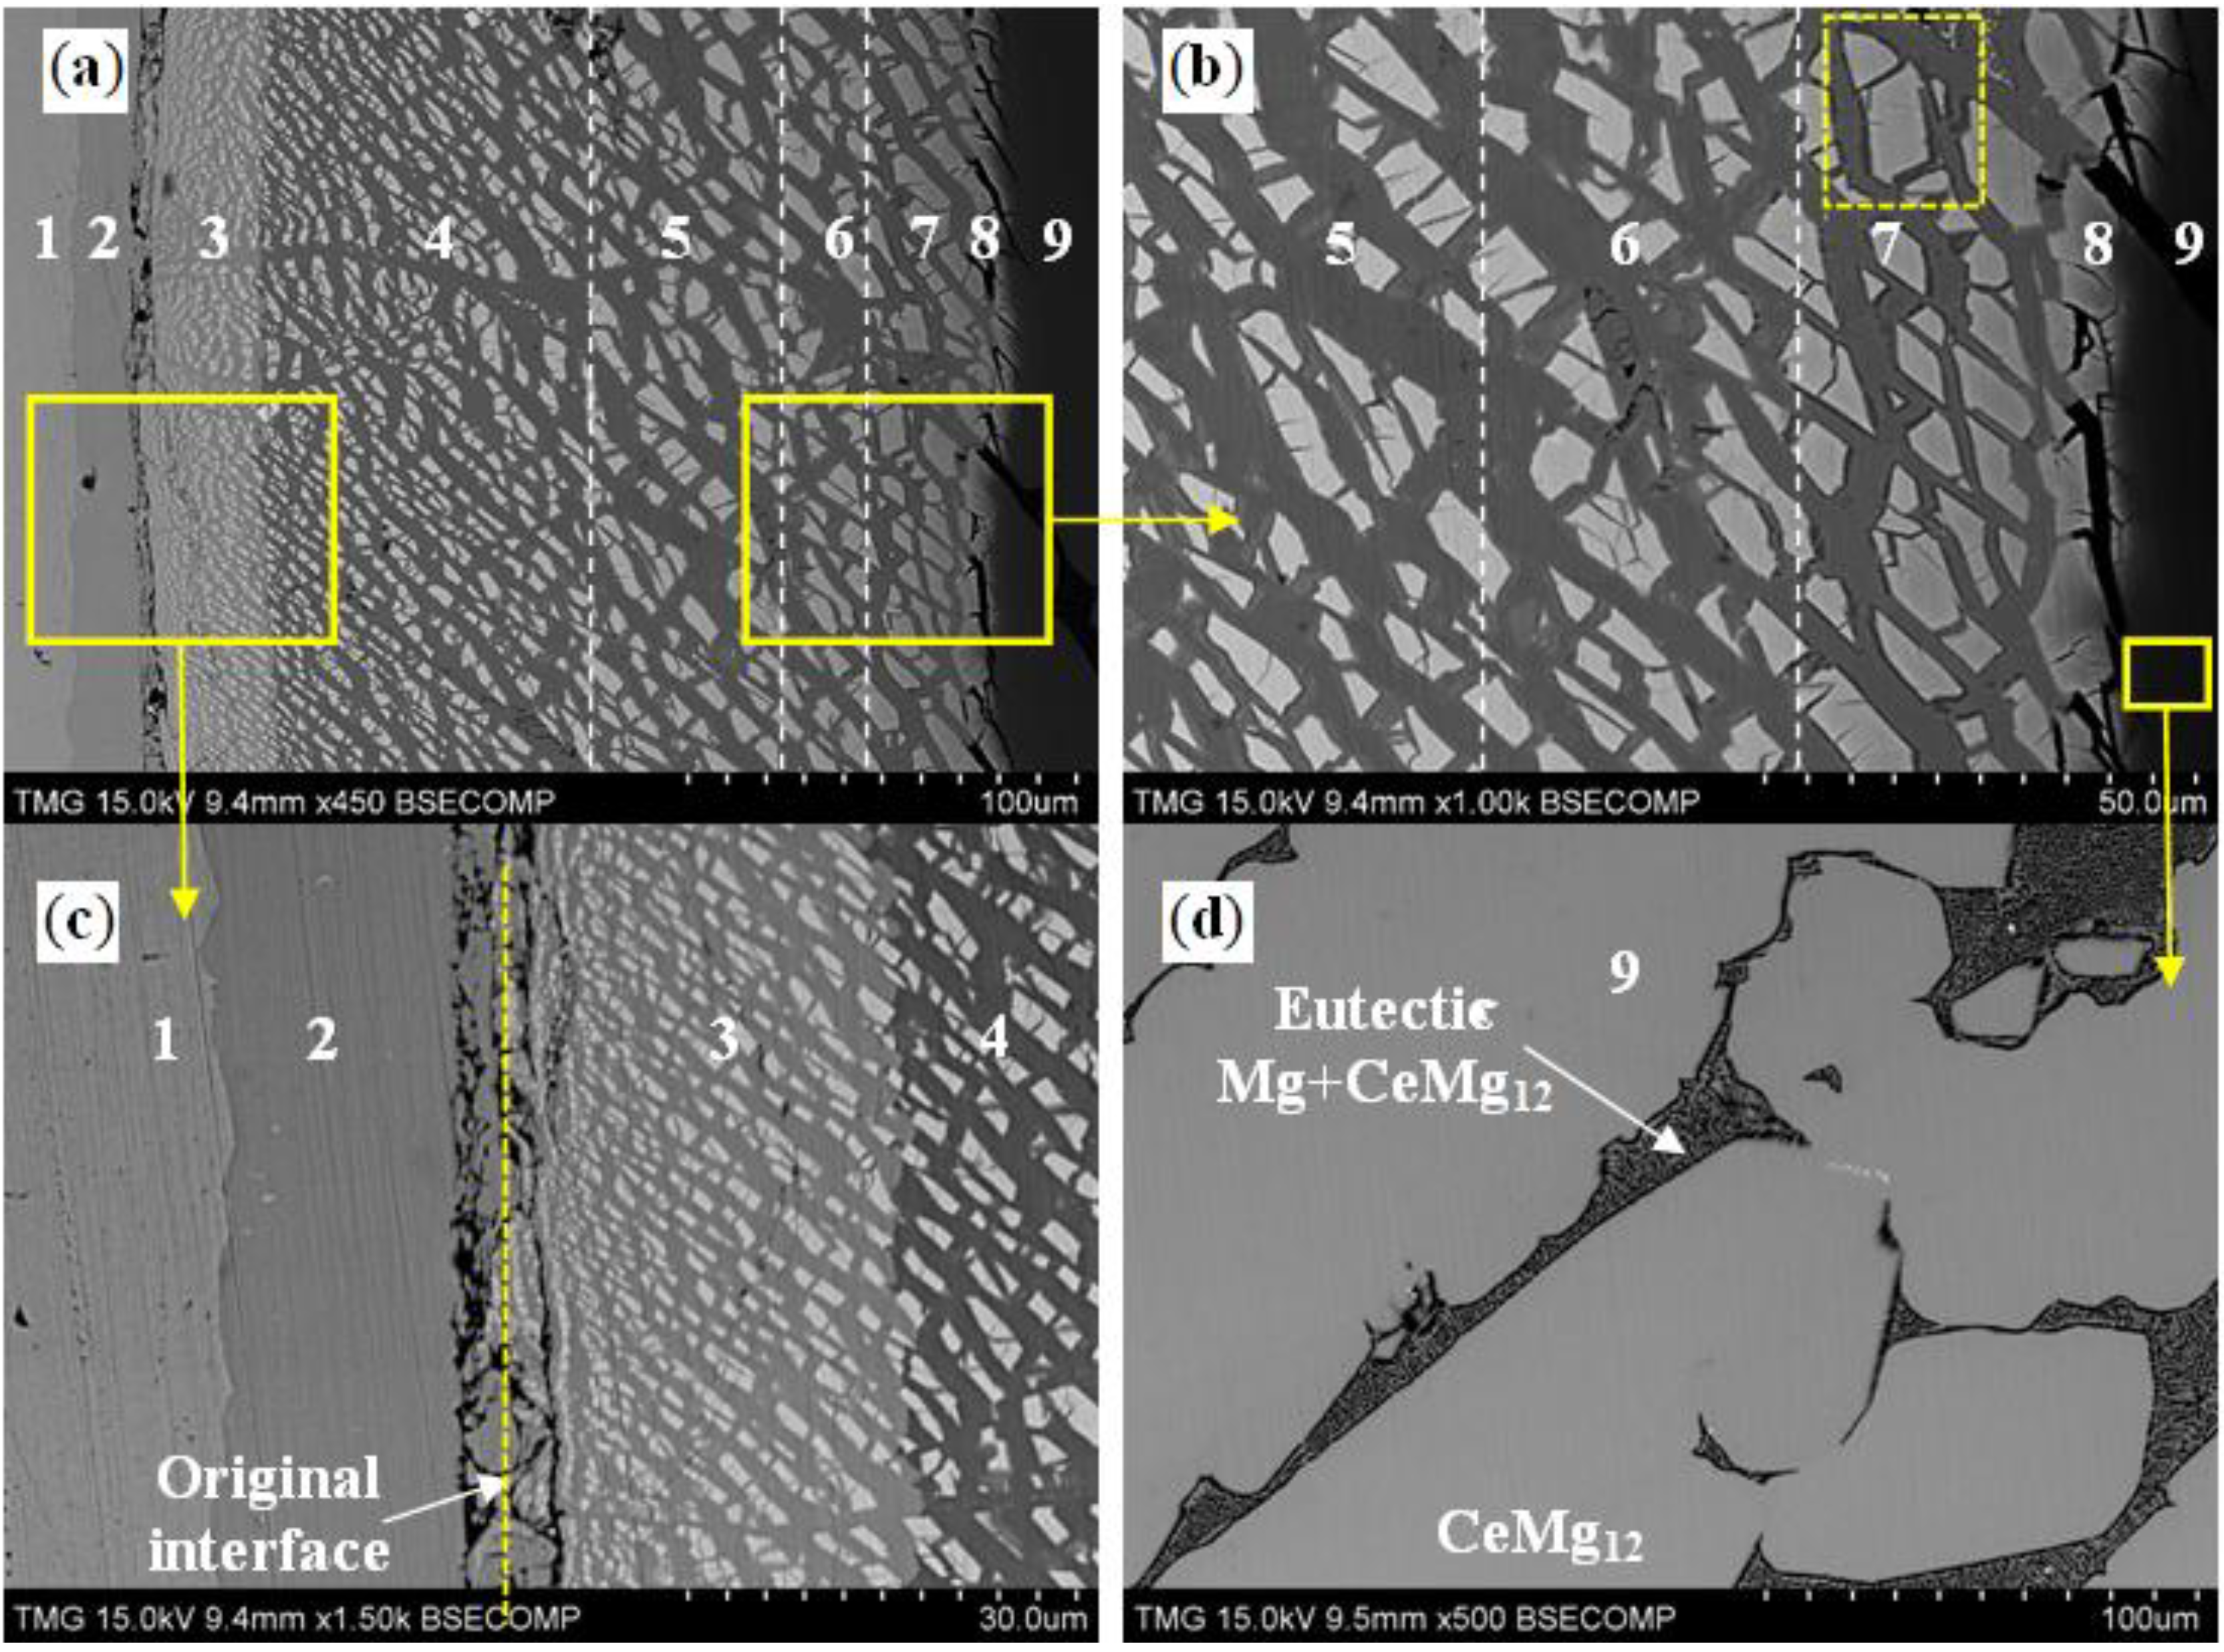
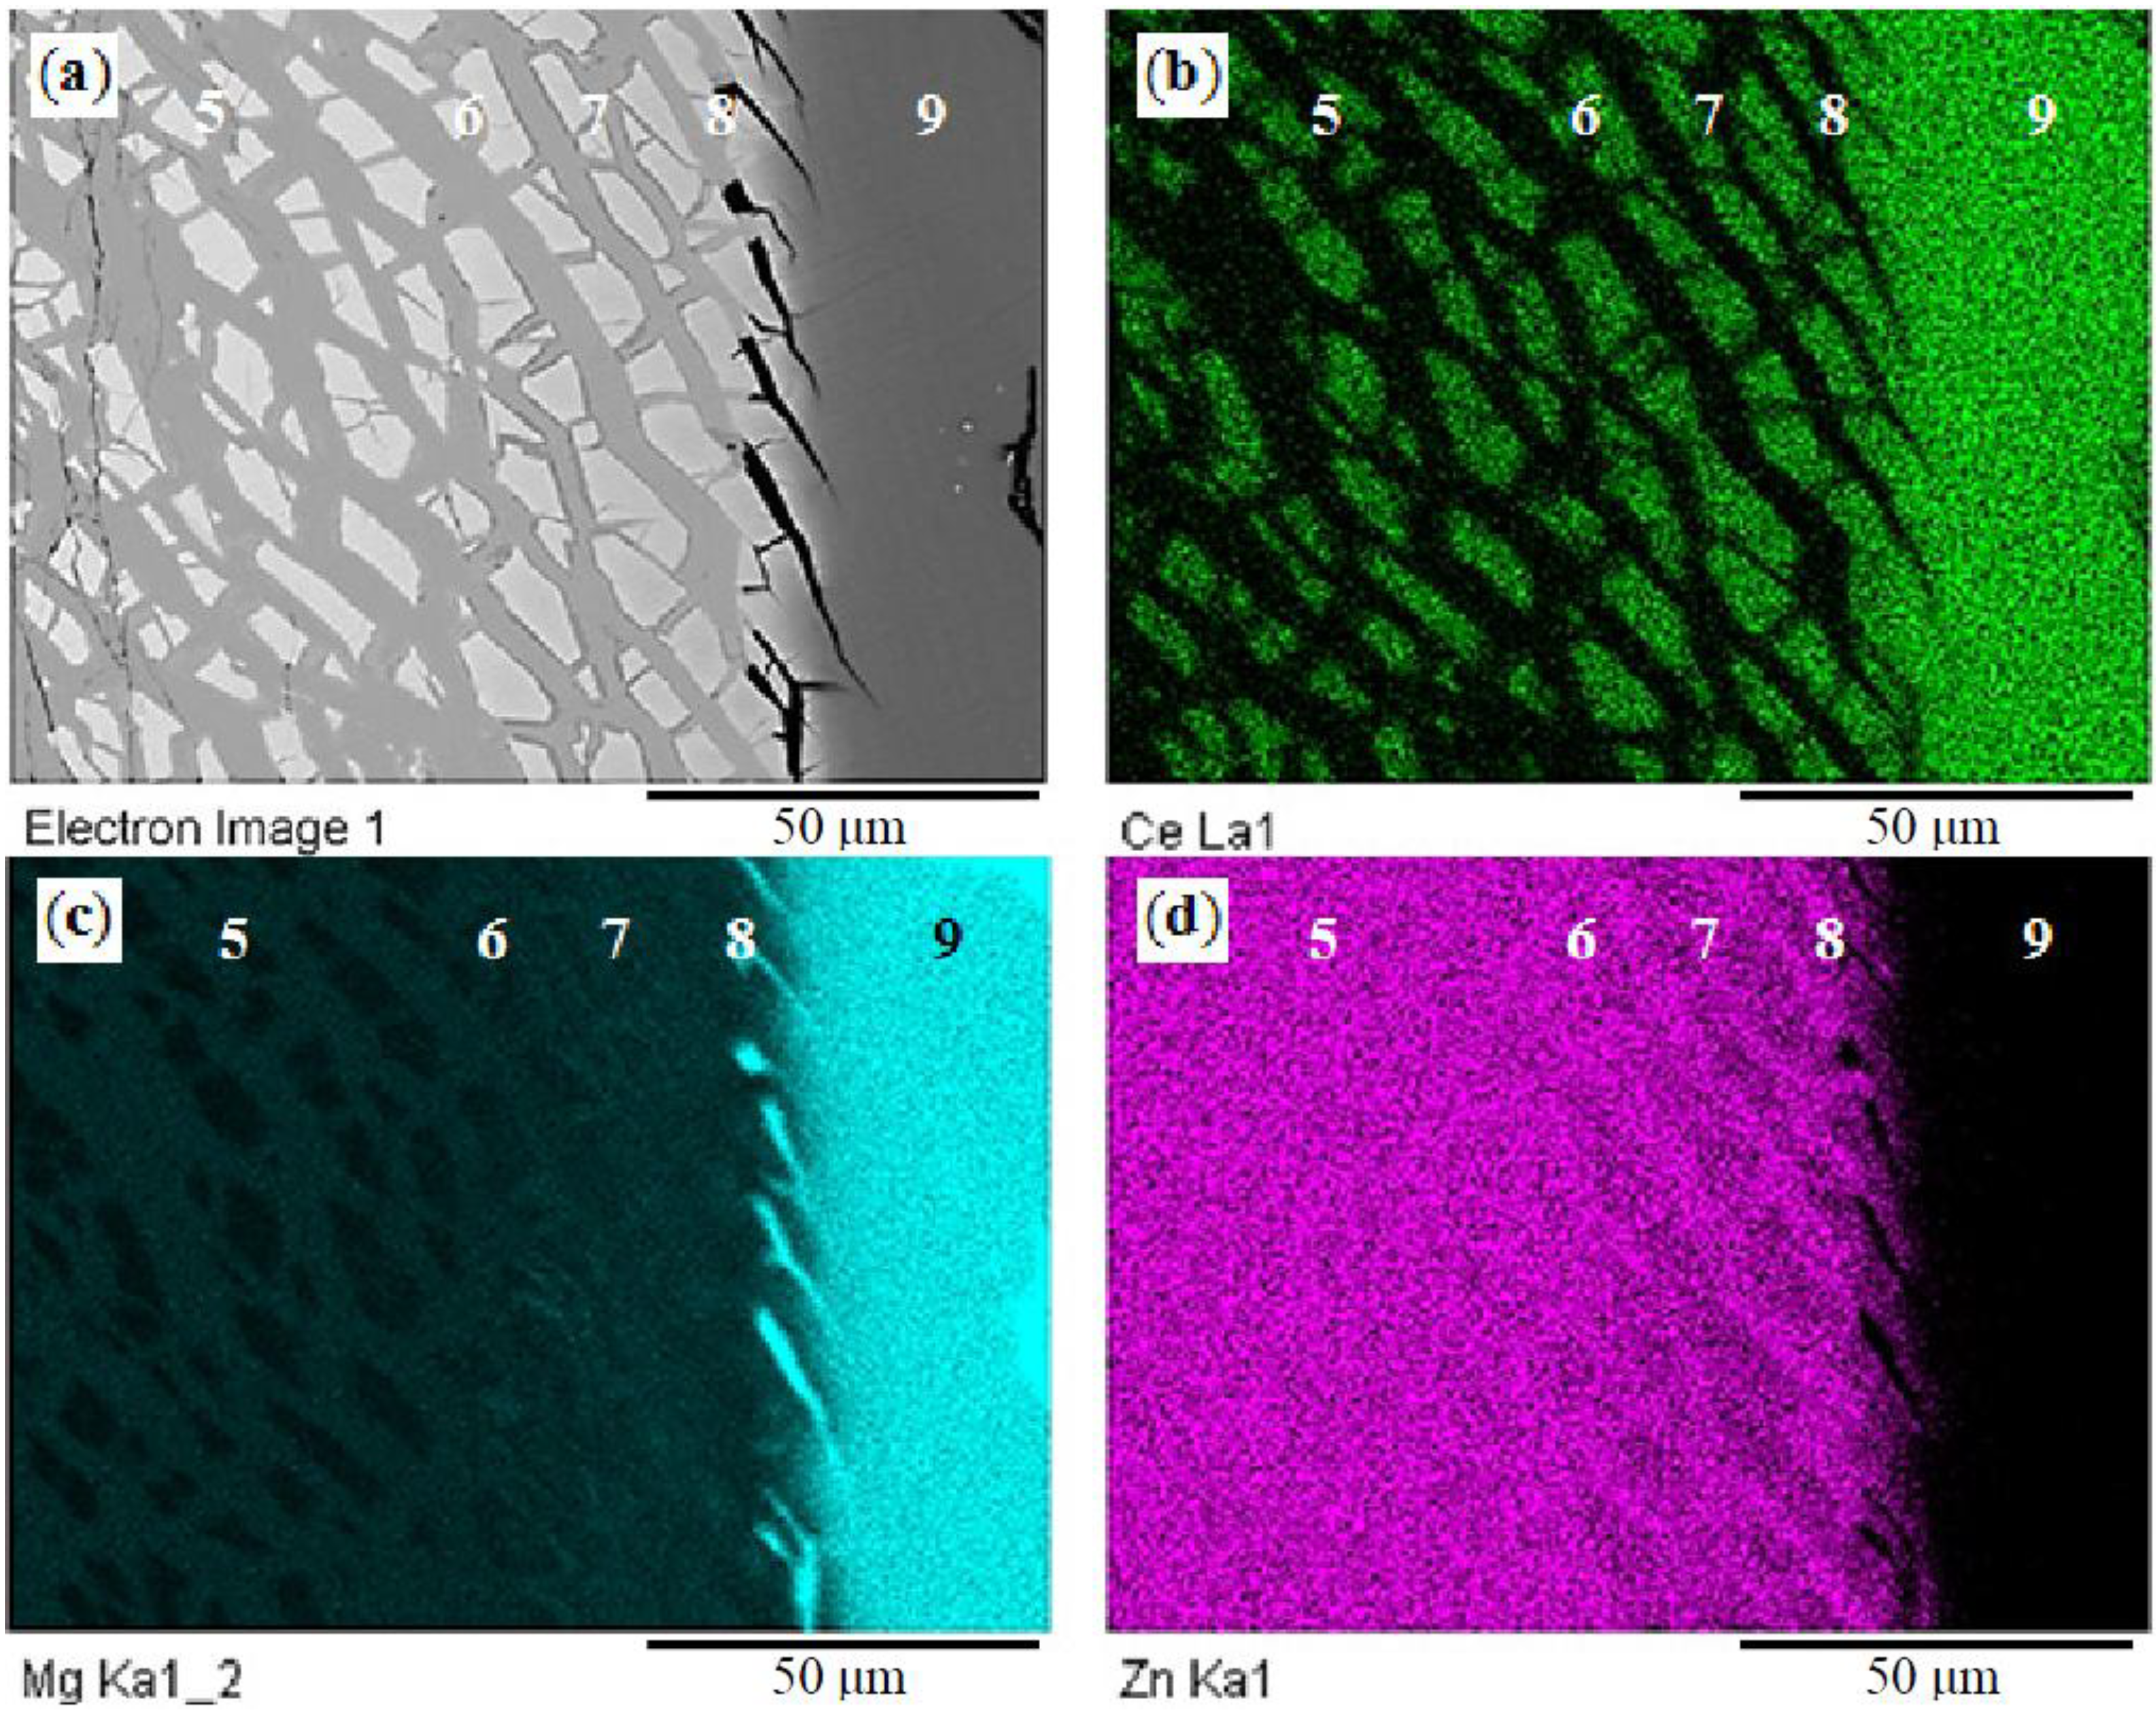
EDS elemental mapping was used to define the composition of diffusion Zones 5 to 9, shown in
Figure 8a. The Ce, Mg and Zn elemental maps are shown in
Figure 8b–d, respectively. The color contrast of the Mg element,
Figure 8c, revealed that the dark phase at the interface between Zones 8 and 9 is pure Mg and not a crack, as was suspected. The corresponding phase relationships determined from this part of the diffusion couple will be discussed in combination with
Figure 9.
Figure 8.
(a) SEM micrograph of Zones 5–8 of diffusion Couple 1; (b–d) EDS elemental maps of Ce, Mg and Zn, respectively.
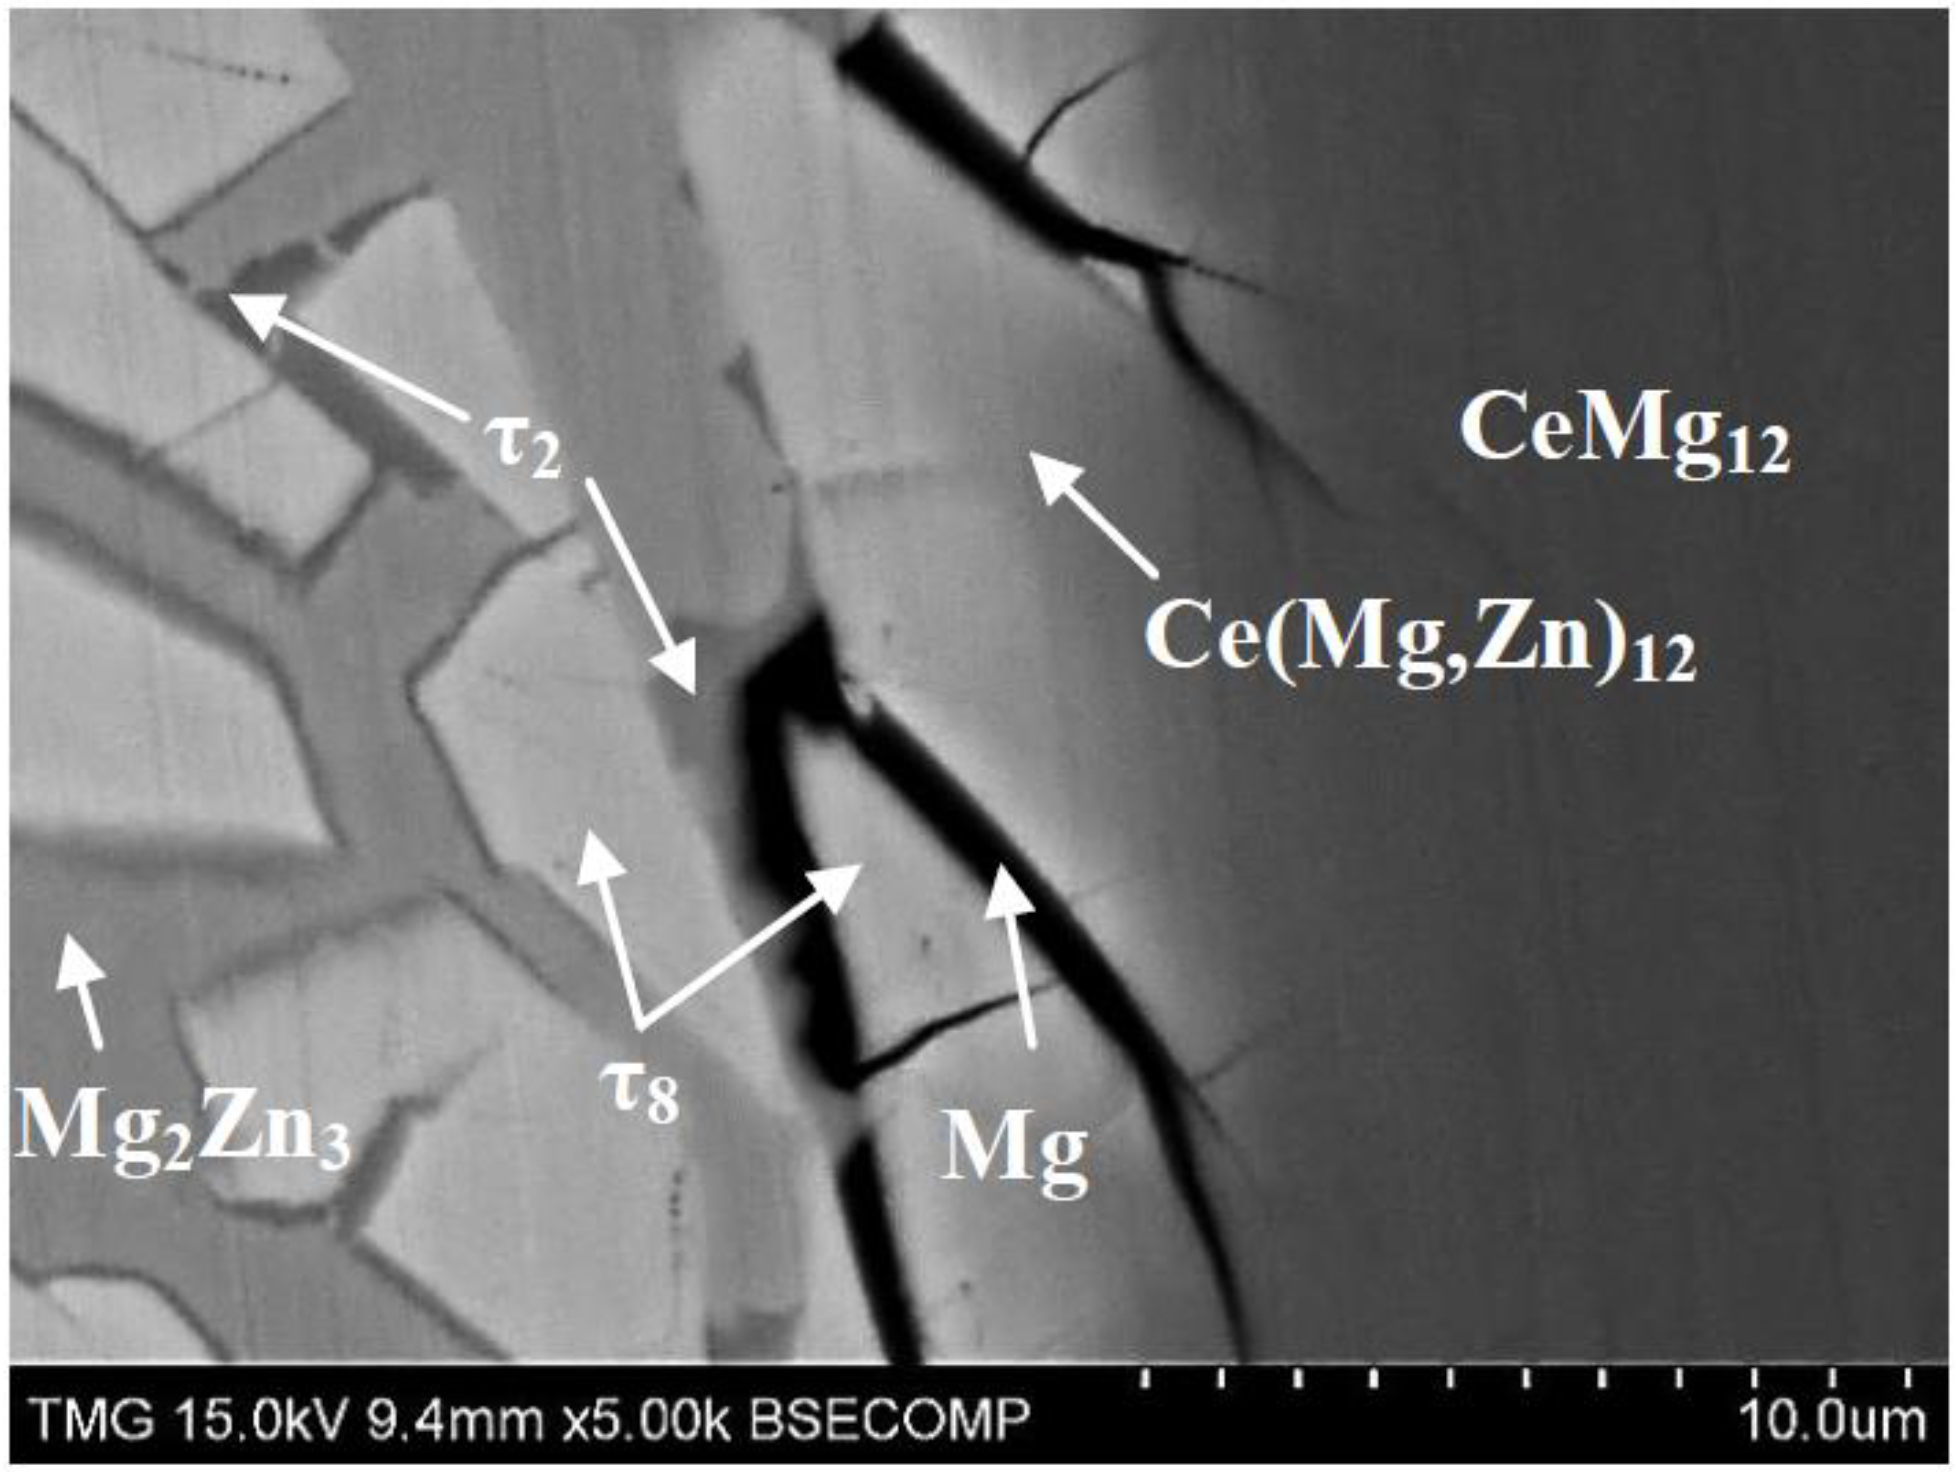
Figure 9.
SEM micrograph of diffusion Zones 7 and 8 of diffusion Couple 1.
The SEM micrograph shown in
Figure 9 shows the formation of a dark phase falling between τ
8 and pure Mg phases. This phase is in equilibrium with τ
8, Mg
2Zn
3, MgZn
2, τ
5 and pure Mg. WDS spot analysis revealed that this phase is τ
2 (CeMg
29.2Zn
24.8) according to
Table 1. Based on its chemical composition, τ
2 is located near the binary Mg
12Zn
13. However, the binary Mg
12Zn
13 appears as a thin layer in
Figure 7 (zone #5). It is expected that the Mg
12Zn
13 layer was breaking into smaller parts upon the subsequent formation of the two ternary compounds, τ
5 and τ
8, providing the 2.0 at.% Ce necessary to form τ
2.
One can raise an issue regarding the morphology of the scattered ternary compounds over a matrix of Mg-Zn compounds. It is presumed that the scattered formation of the ternary compounds was due to the preferential reaction of the diffusing species. Referring to the diffusion multiple in
Figure 2a, the Mg-Zn binary diffusion couple has thicker diffusion layers than those of the Ce-Mg binary couple, as well as no diffusion occurred in the Ce-Zn binary diffusion couple at 300 °C and 21 days. In conclusion, the mobility of the atoms in the Mg-Zn system is higher than the atoms in both Ce-Mg and Ce-Zn systems. This conclusion will be discussed further below.
The composition of Ce was constant at 8.2 at.% in the profile of the Ce(Mg,Zn)
12 solid solution and the ternary compounds, τ
8, τ
5 and τ
6, shown in
Figure 6a. However, the Ce concentration must be 7.6 at.% Ce for Ce(Mg,Zn)
12. This difference could be due to the error of the WDS measurements, which was estimated as ±1 at.% for Ce. Thus, it is most likely that the ternary compounds were formed from the Ce(Mg,Zn)
12 due to the Mg/Zn atomic exchange. This can also be supported by monitoring the end of the white phase traces, which can indicate the original location of the interface between the two end-members.
Figure 5c shows clearly the location of the original interface where the crack exists, and the Mg
2Zn
11 forms on both sides. The Ce(Mg,Zn)
12 solid solution is characterized by the substitution of Mg with Zn atoms. However, Zn has a smaller atomic radius (133 pm) than Mg (160 pm) [
17]. Because of this difference in the atomic radii, distortion in the lattice structure might take place, and various ternary compounds with constant Ce concentration can be formed when Zn content reaches a threshold value. Evidence of this distortion,
Figure 5a shows that the size of the white grains near the Zn-rich side is smaller than those adjacent to the Ce(Mg,Zn)
12 solid solution; this was also illustrated in
Figure 7b. The grains with more Zn, due to substitution, show a smaller grain size. In addition, the substituted Mg atoms can be consumed by excess Zn atoms through the diffusion reaction to form Mg-Zn compounds. This can provide an explanation for the presence of pure-Mg (the black phase in Zones 8 and 9), which might be filtered from the solid solution due to the substitution mechanism.
In this system, the same phase morphology was observed in all diffusion couples containing Zn-rich end-members, specifically whenever a substitutional solid solution was encountered within the diffusion path. Diffusion Couple 2, for example, showed the same morphology, due to the Mg/Zn substitution in the Ce(Mg,Zn)3 solid solution. The results of diffusion Couple 2 will be presented next.
According to the phase diagram rules, in a ternary system, the maximum number of phases in each diffusion layer is two. However, in diffusion Zones 6, 7 and 8, three phases were detected. These phases are τ
2 + τ
5 + MgZn
2, τ
5 + Mg
2Zn
3 + τ
2 and τ
8 + Mg
2Zn
3+τ
2, respectively. This could be due to the anisotropic diffusion, which results sometimes during the sequential growth of the diffusion layers [
18]. Such anisotropic growth might result in a volumetric mismatch, at the interface between two dissimilar phases, which occurs due to the lattice distortion. This can give more chance to the phases in the diffusion layers to break apart into scattered islands, equilibrating with the surrounding phases.
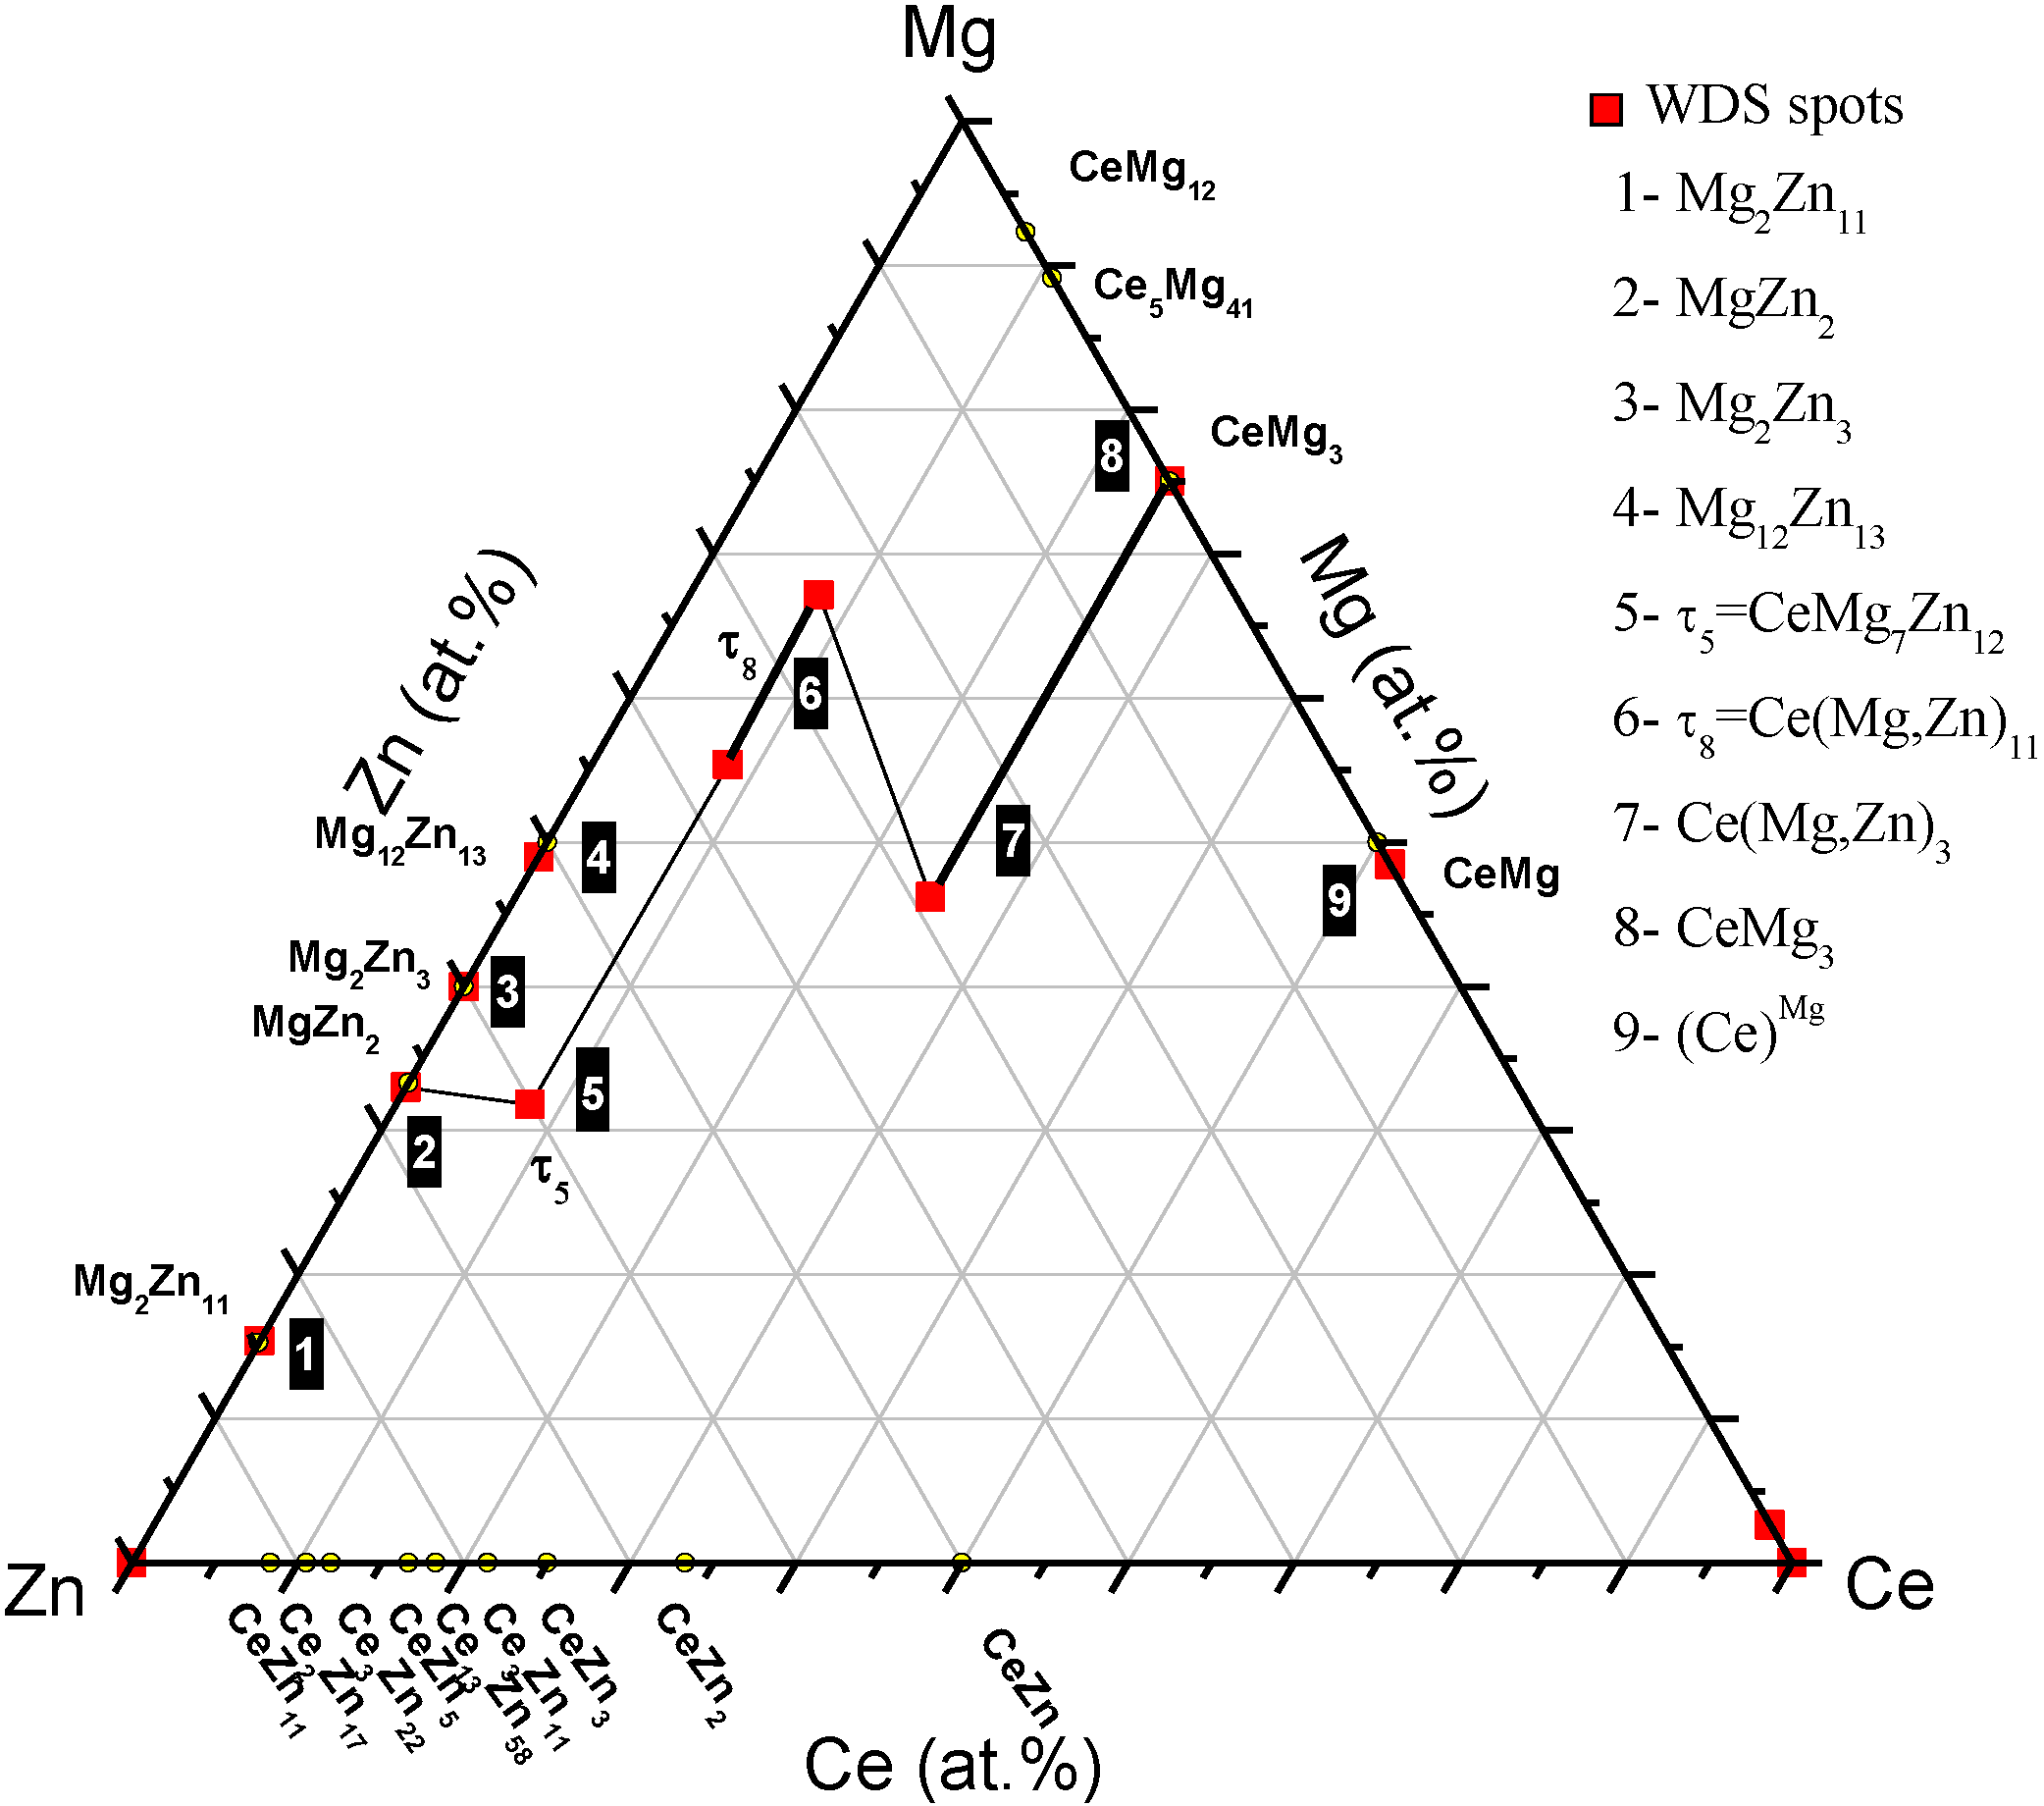
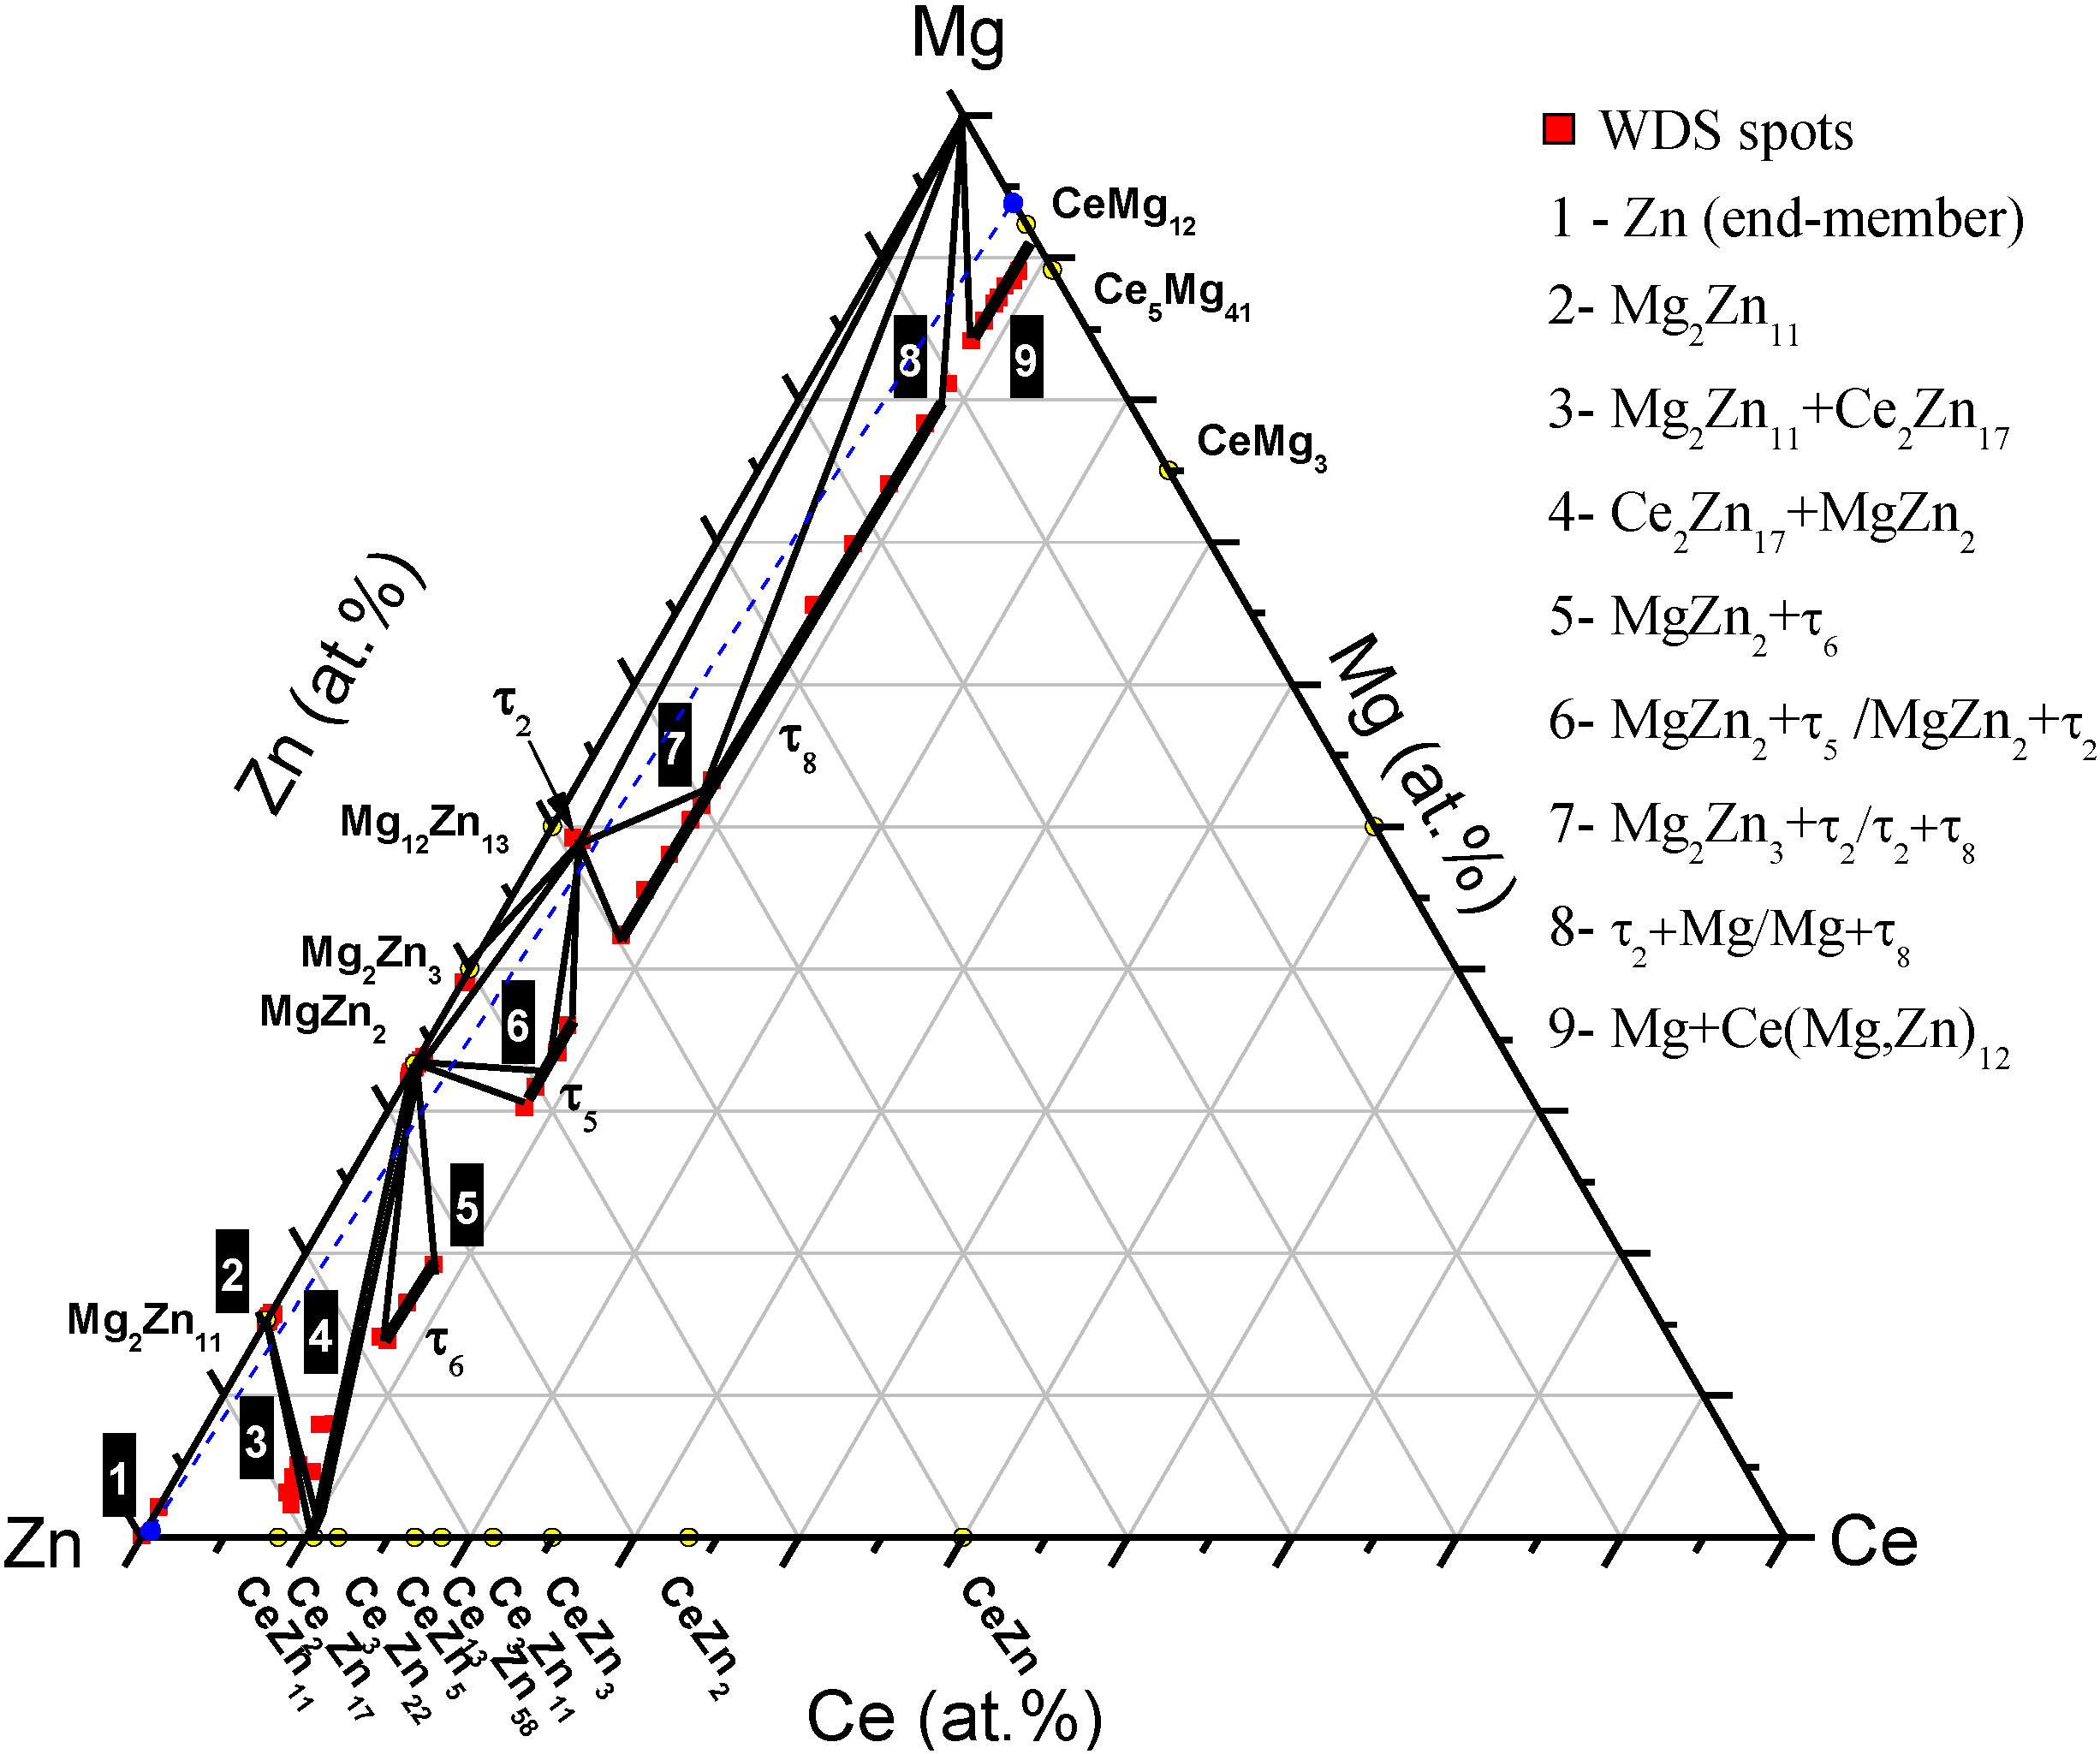
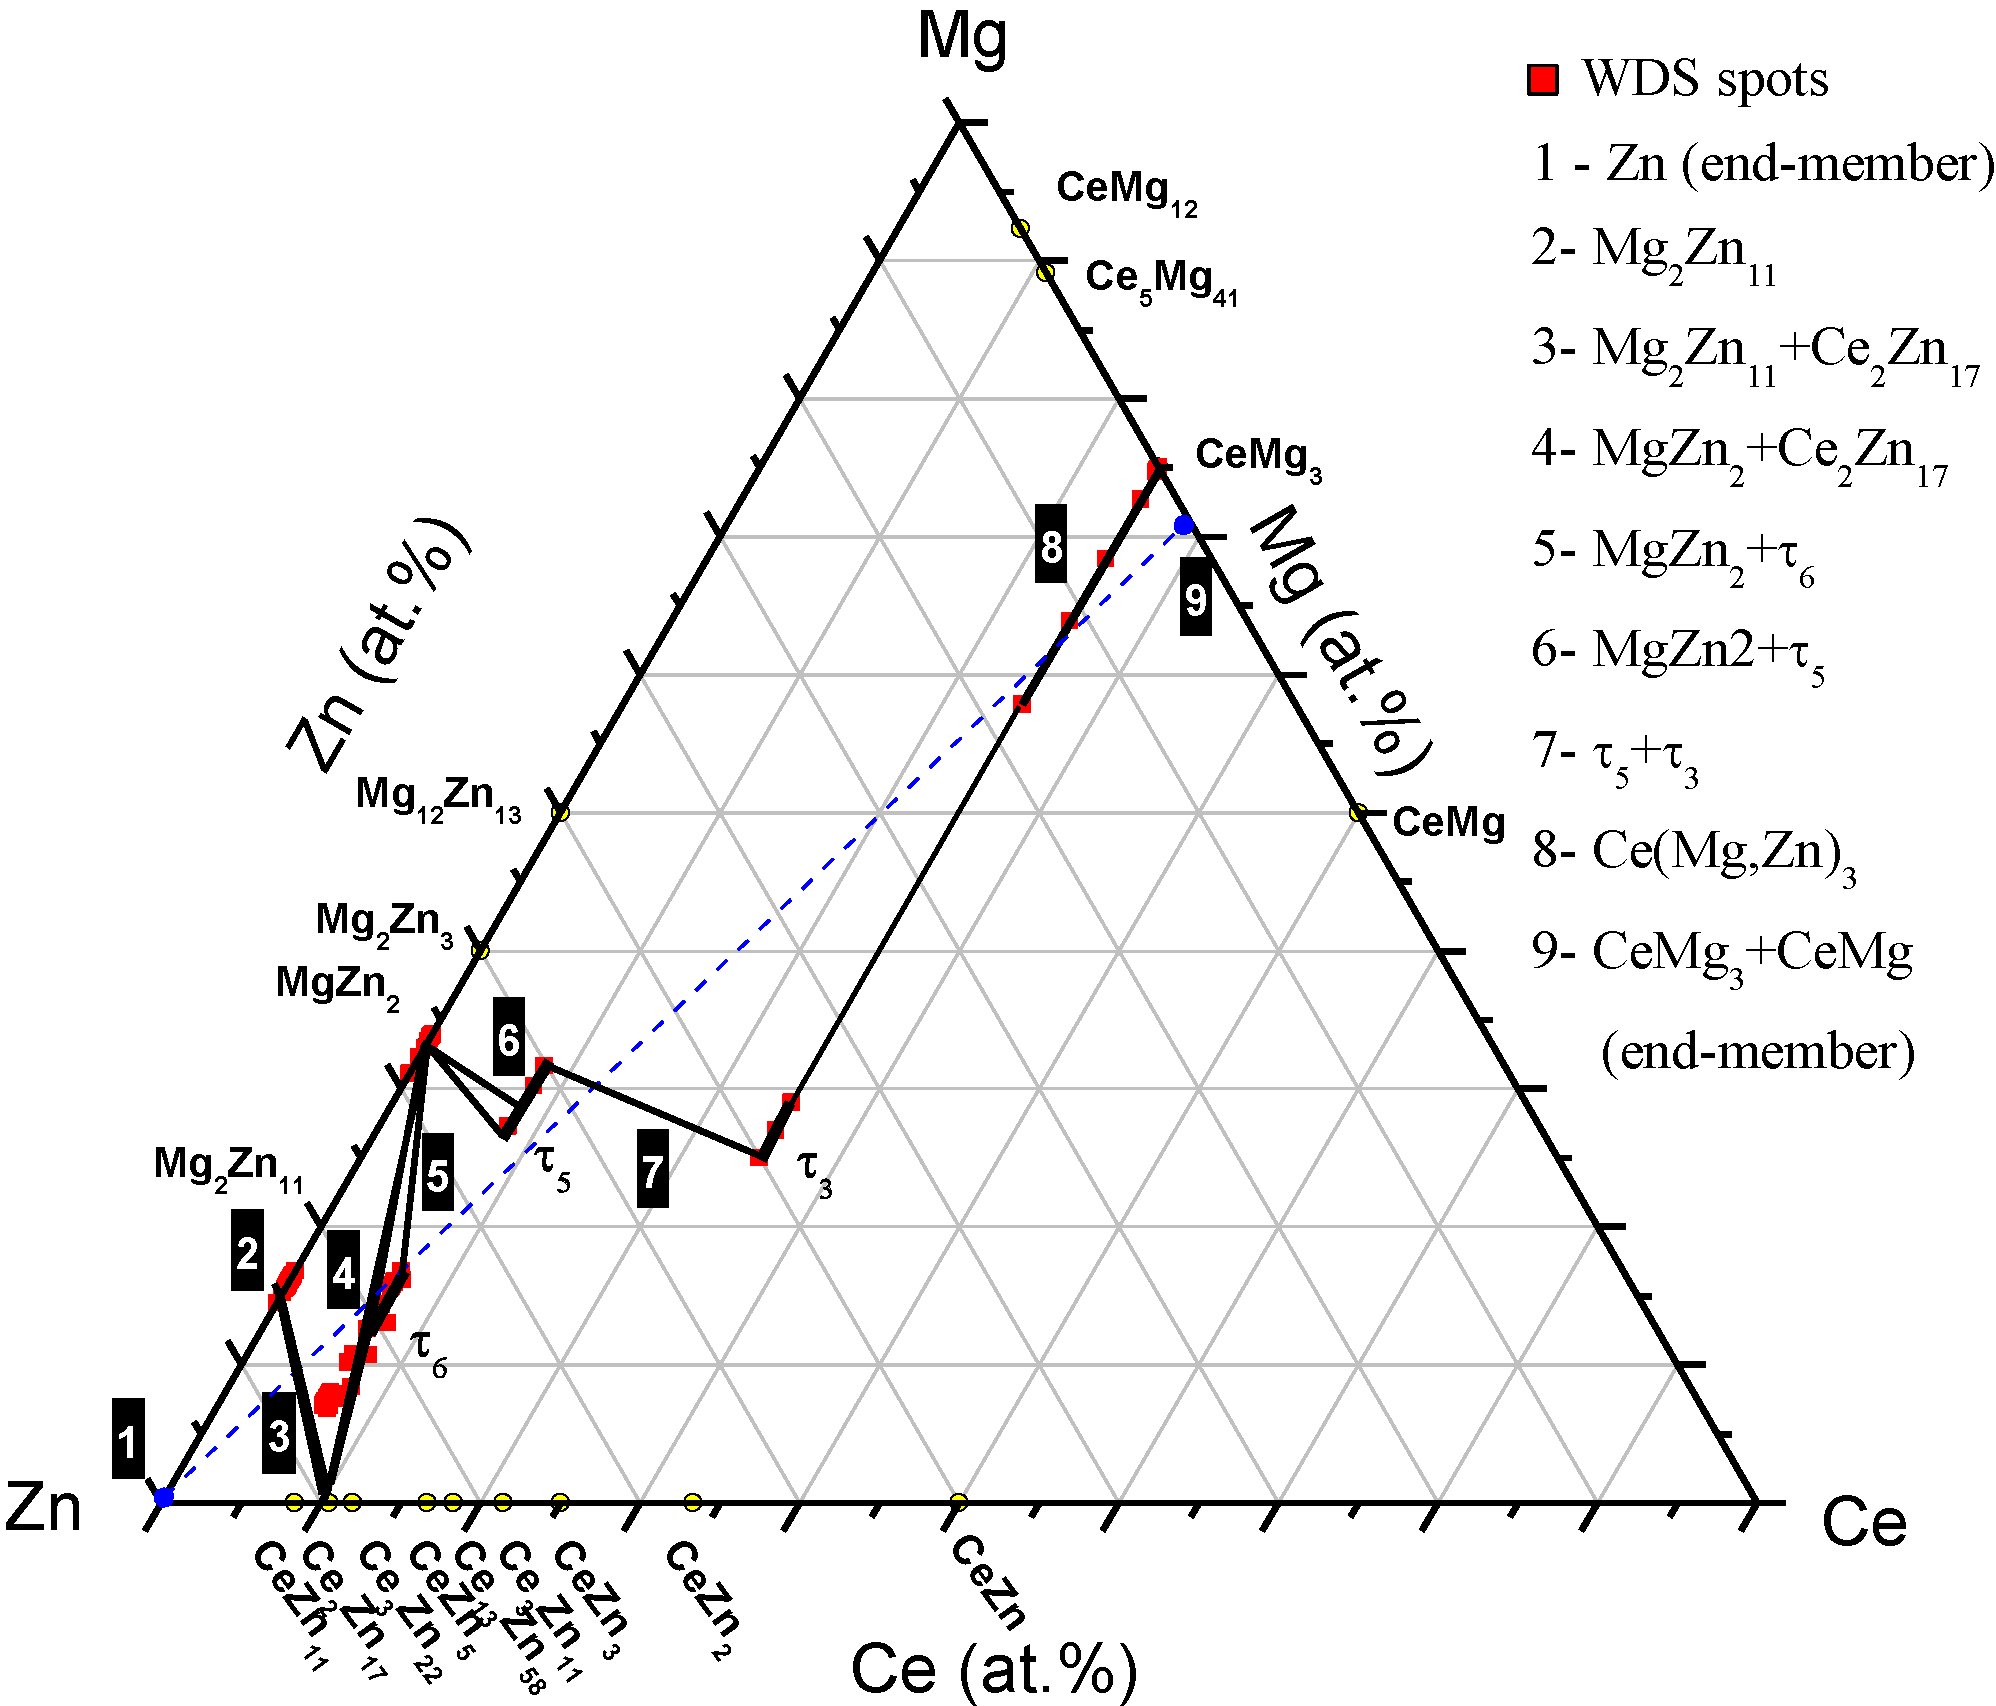
From the WDS spots and line-scans and the EDS elemental maps, the path of diffusion Couple 1 is represented graphically in
Figure 10. The two end-members of diffusion Couple 1 are connected by a dashed line.
Figure 10.
Phase equilibria depicted from the WDS spot analysis and line-scans across diffusion Couple 1. Numbers in black boxes represent the diffusion zones indicated on the diffusion couple micrographs. Numbers on the right-hand side represent the phases in every zone.
3.2.2. Diffusion Couple 2: Zn/27.0 Ce-73.0 Mg at.%
The SEM micrographs of the solid-solid diffusion Couple 2 are represented in
Figure 11. The first end-member was made from pure Zn. The second end-member was made from the CeMg and CeMg
3 two-phase binary alloy. Diffusion Couple 2, similar to diffusion Couple 1, showed dispersed ternary compounds within a matrix of Mg-Zn binary compounds. Furthermore, the size of the white grains is decreasing with the increase in the Zn concentration. The occurrence of this morphology was thoroughly discussed within the results of diffusion Couple 1. In contrast to diffusion Couple 1, the results of diffusion Couple 2 showed that τ
3 is forming from the Ce(Mg,Zn)
3 solid solution due to the further substitution of Mg by Zn; then, τ
5 and τ
6 formed later, due to the increase in the Zn concentration.
Nine diffusion zones were determined and analyzed using WDS spot analysis and line-scans. Diffusion Zone 2 represents a single phase of 10 μm in thickness.
Figure 11c is a magnified part from diffusion Couple 2 showing diffusion Zone 3, which represents a two-phase equilibrium between Mg
2Zn
11 and Ce
2Zn
17. Diffusion Zones 4, 5, 6 and 7 have two compounds. The results of WDS spot analysis of diffusion Couple 2 are listed in
Table 5.
Figure 11b shows a very thin bright phase surrounding τ
3 (Ce
2Mg
3Zn
3), the white dendrites of Zone 7. Thus, the diffusion zone was magnified up to 10 kX (
Figure 11d) to find out the composition of that phase using WDS spot analysis. The WDS spot analysis gave the following stoichiometry: 9.9 at.% Ce, 27.6 at.% Mg and 62.5 at.% Zn, which corresponding to τ
5 (CeMg
7Zn
12). This means that τ
5 is in equilibrium with MgZn
2 and τ
3. Furthermore, the composition profile is represented in the same figure to show the concentration gradient within τ
3, Ce(Mg,Zn)
3 and CeMg
3.
Figure 11.
(a–d) SEM micrographs of diffusion Couple 2 annealed at 300 °C and 21 days.
Table 5.
WDS spot analysis of different diffusion zones of diffusion Couple 2.
| Zone | Composition (at.%) | Corresponding phase |
|---|
| Ce | Mg | Zn |
|---|
| 1 (end-member) | 0 | 100 | 0 | Zn |
| 2 | 0 | 15.9 | 84.1 | Mg2Zn11 |
| 3 | 7.2 | 2.9 | 89.9 | (Ce2Zn17) |
| 0 | 15.9 | 84.1 | Mg2Zn11 |
| 4 | 7.5 | 5.2 | 87.3 | (Ce2Zn17) |
| 0.7 | 31.6 | 67.7 | MgZn2 (dark) |
| 5 | 5.9 | 10.8 | 83.3 | τ6 |
| 0.7 | 31.6 | 67.7 | MgZn2 (dark) |
| 6 | 9.9 | 27.6 | 62.5 | τ5 (white) |
| 0.2 | 33.5 | 66.3 | MgZn2 (dark) |
| 7 | 24.0 | 29.2 | 46.8 | τ3 |
| 14.1 | 31.6 | 54.3 | τ5 |
| 8 | 24.3 | 57.8 | 17.9 | Ce(Mg,Zn)3 |
| 9 (end-member) | 25.0 | 75.0 | 0 | CeMg3 |
| 50.0 | 50.0 | 0 | CeMg |
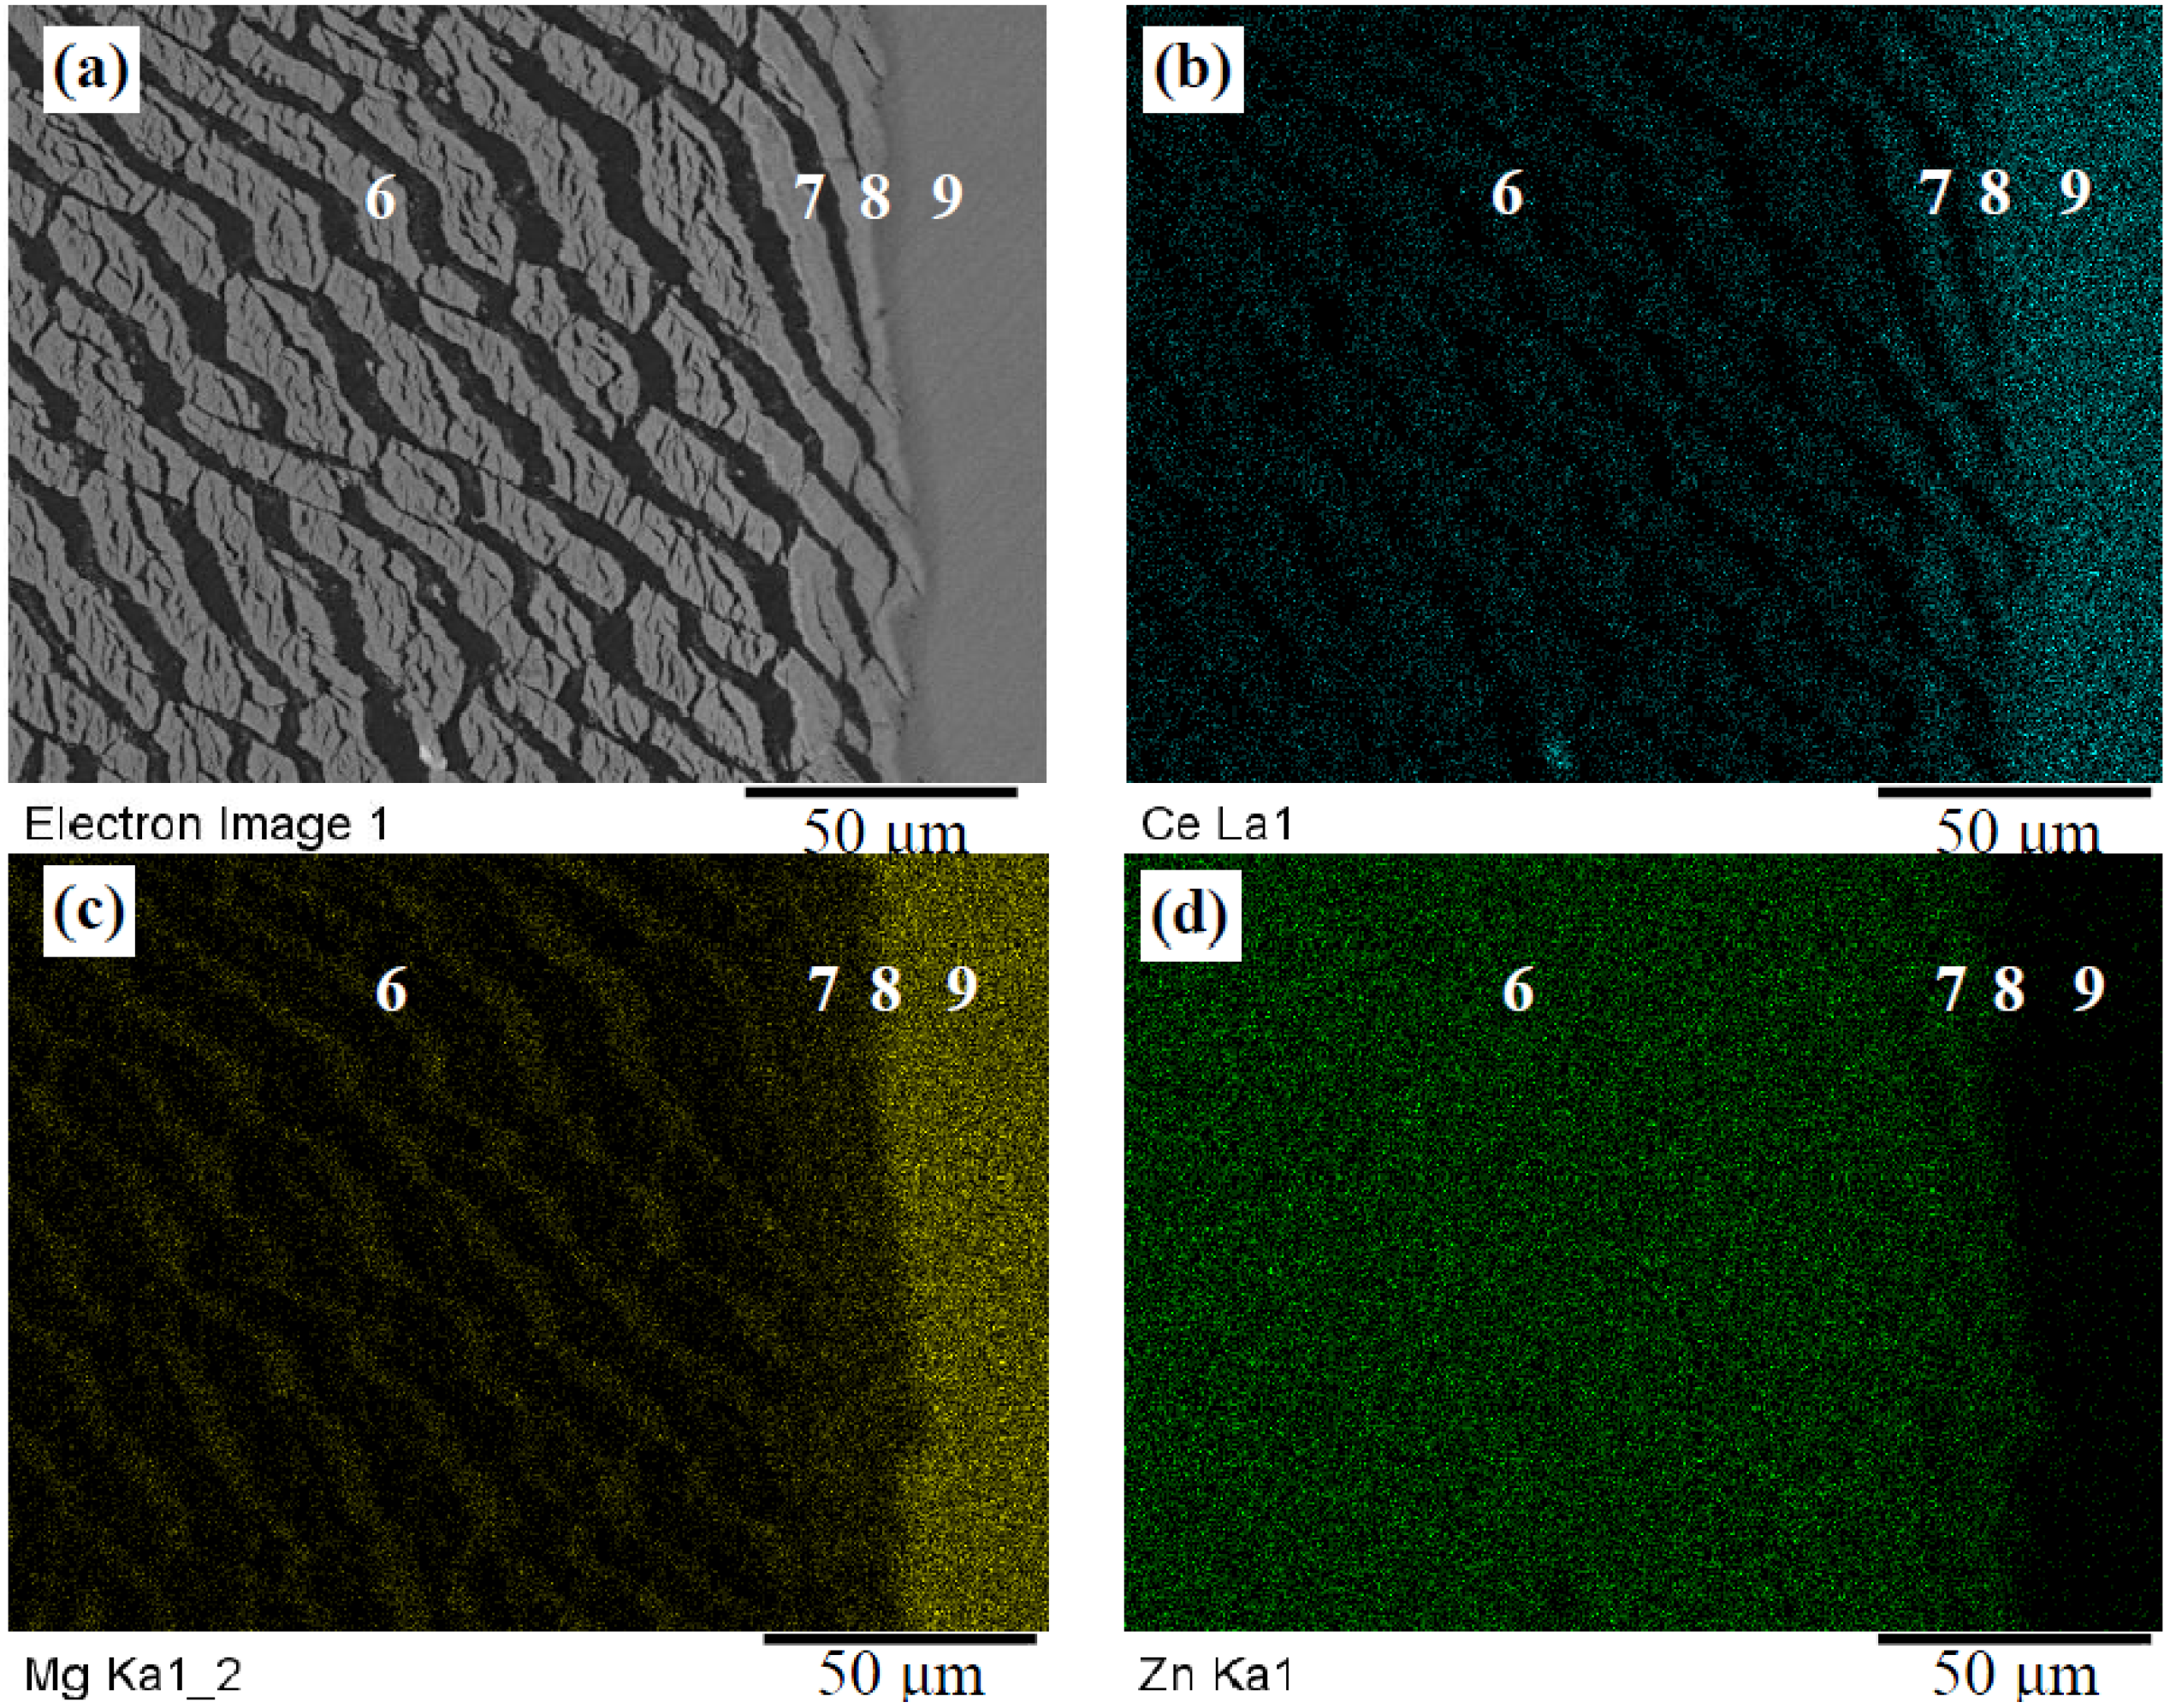
Three ternary compounds, formed within the two-phase diffusion Zones 5 to 7, were observed. These compounds are τ6, τ5 and τ3. The three compounds were characterized by the Mg/Zn substitution at a constant Ce concentration. The homogeneity ranges of these compounds were estimated, using WDS spot analysis, to be 6.0–12.4 at.% Mg, 24.0–31.6 at.% Mg and 25.0–29.0 at.% Mg, respectively.
Figure 12.
(a) SEM micrograph of Zones 6, 7, 8 and 9 of diffusion Couple 2; (b–d) EDS elemental maps of Ce, Mg and Zn, respectively.
Figure 13.
Phase equilibria depicted from the WDS spot analysis across diffusion Couple 2.
EDS elemental mapping was performed for diffusion Zones 6 to 9, as shown in
Figure 12. The elemental maps were used to recognize the composition of every phase in the targeted area, as well as to determine the boundaries of every diffusion zone. Accordingly, the dark phase in the matrix of diffusion zones #6 and 7 (
Figure 12a) was recognized to be a binary compound containing Mg and Zn, since the trace of this phase in the Ce map is dark. In contrast, the traces of the bright dendrites, for the same diffusion zones, represent ternary compounds.
Figure 12b, shows that the ternary dendrites of Zone 7 contain higher Ce concentration in Zone 6, whereas, the proportion between Mg and Zn concentrations remains the same. However, these dendrites seem connected. The phase equilibria depicted from diffusion Couple 2 are represented graphically in
Figure 13. The two end-members of diffusion Couple 2 are connected by a dashed line.
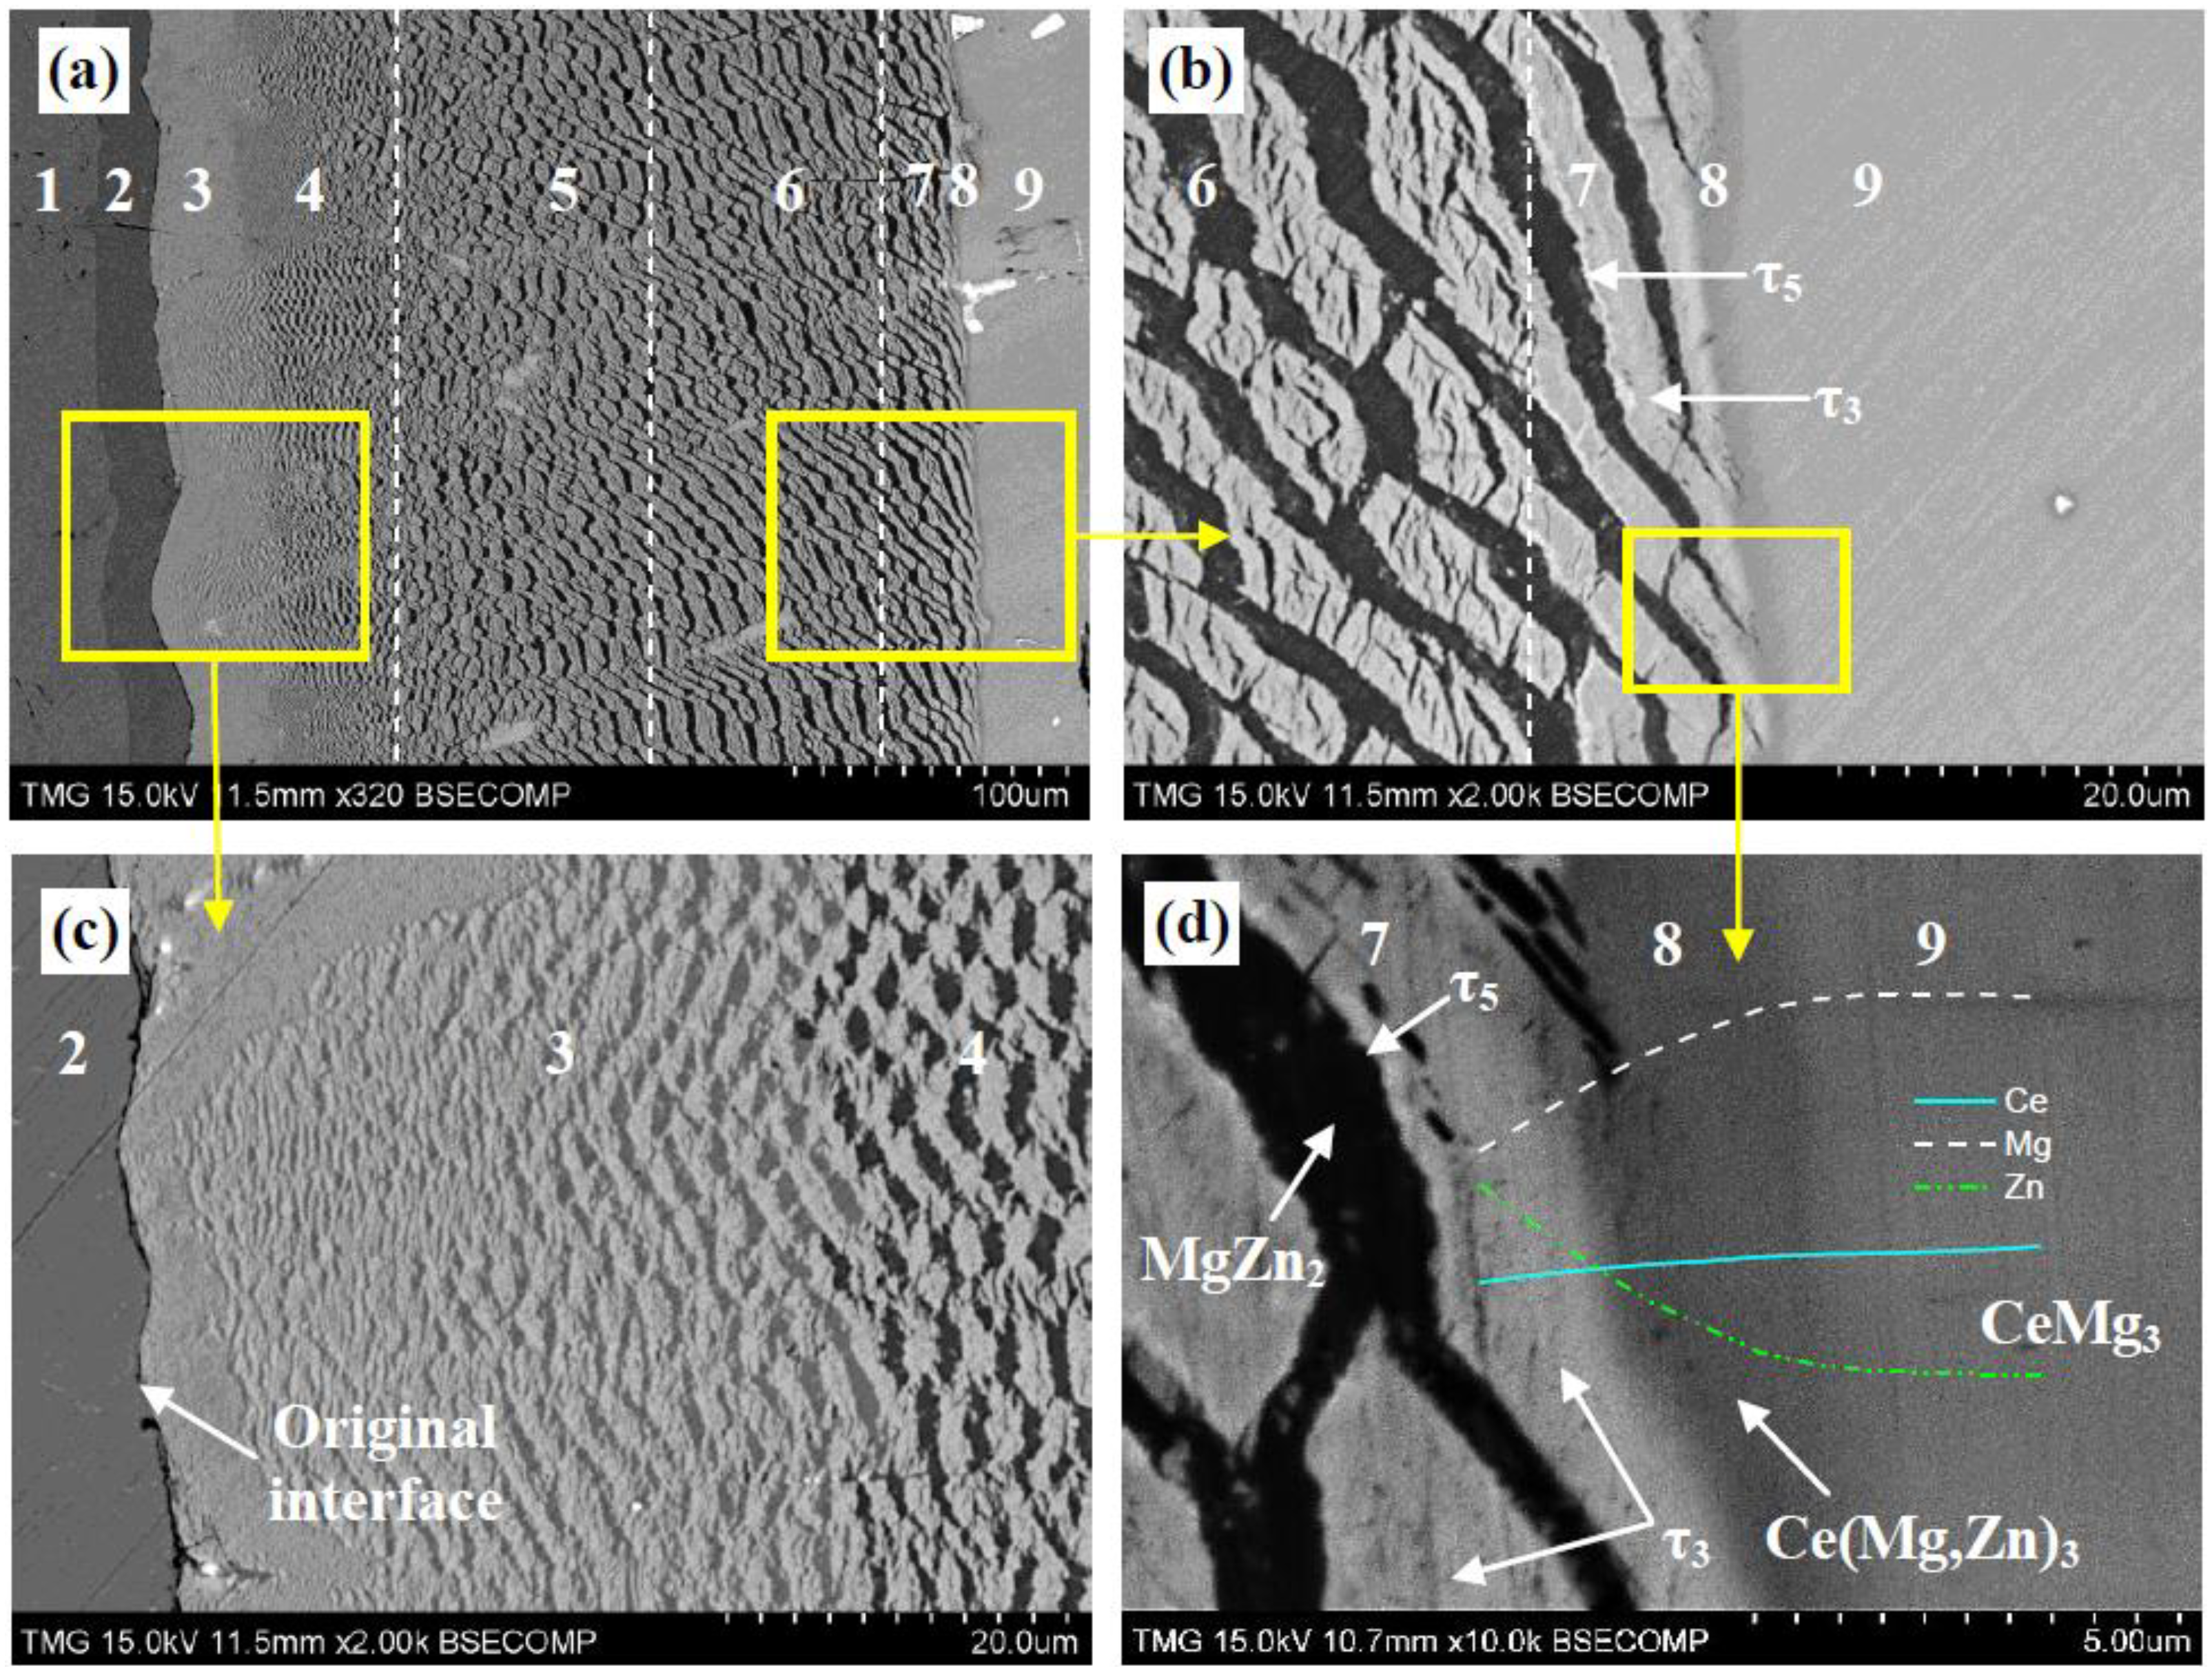
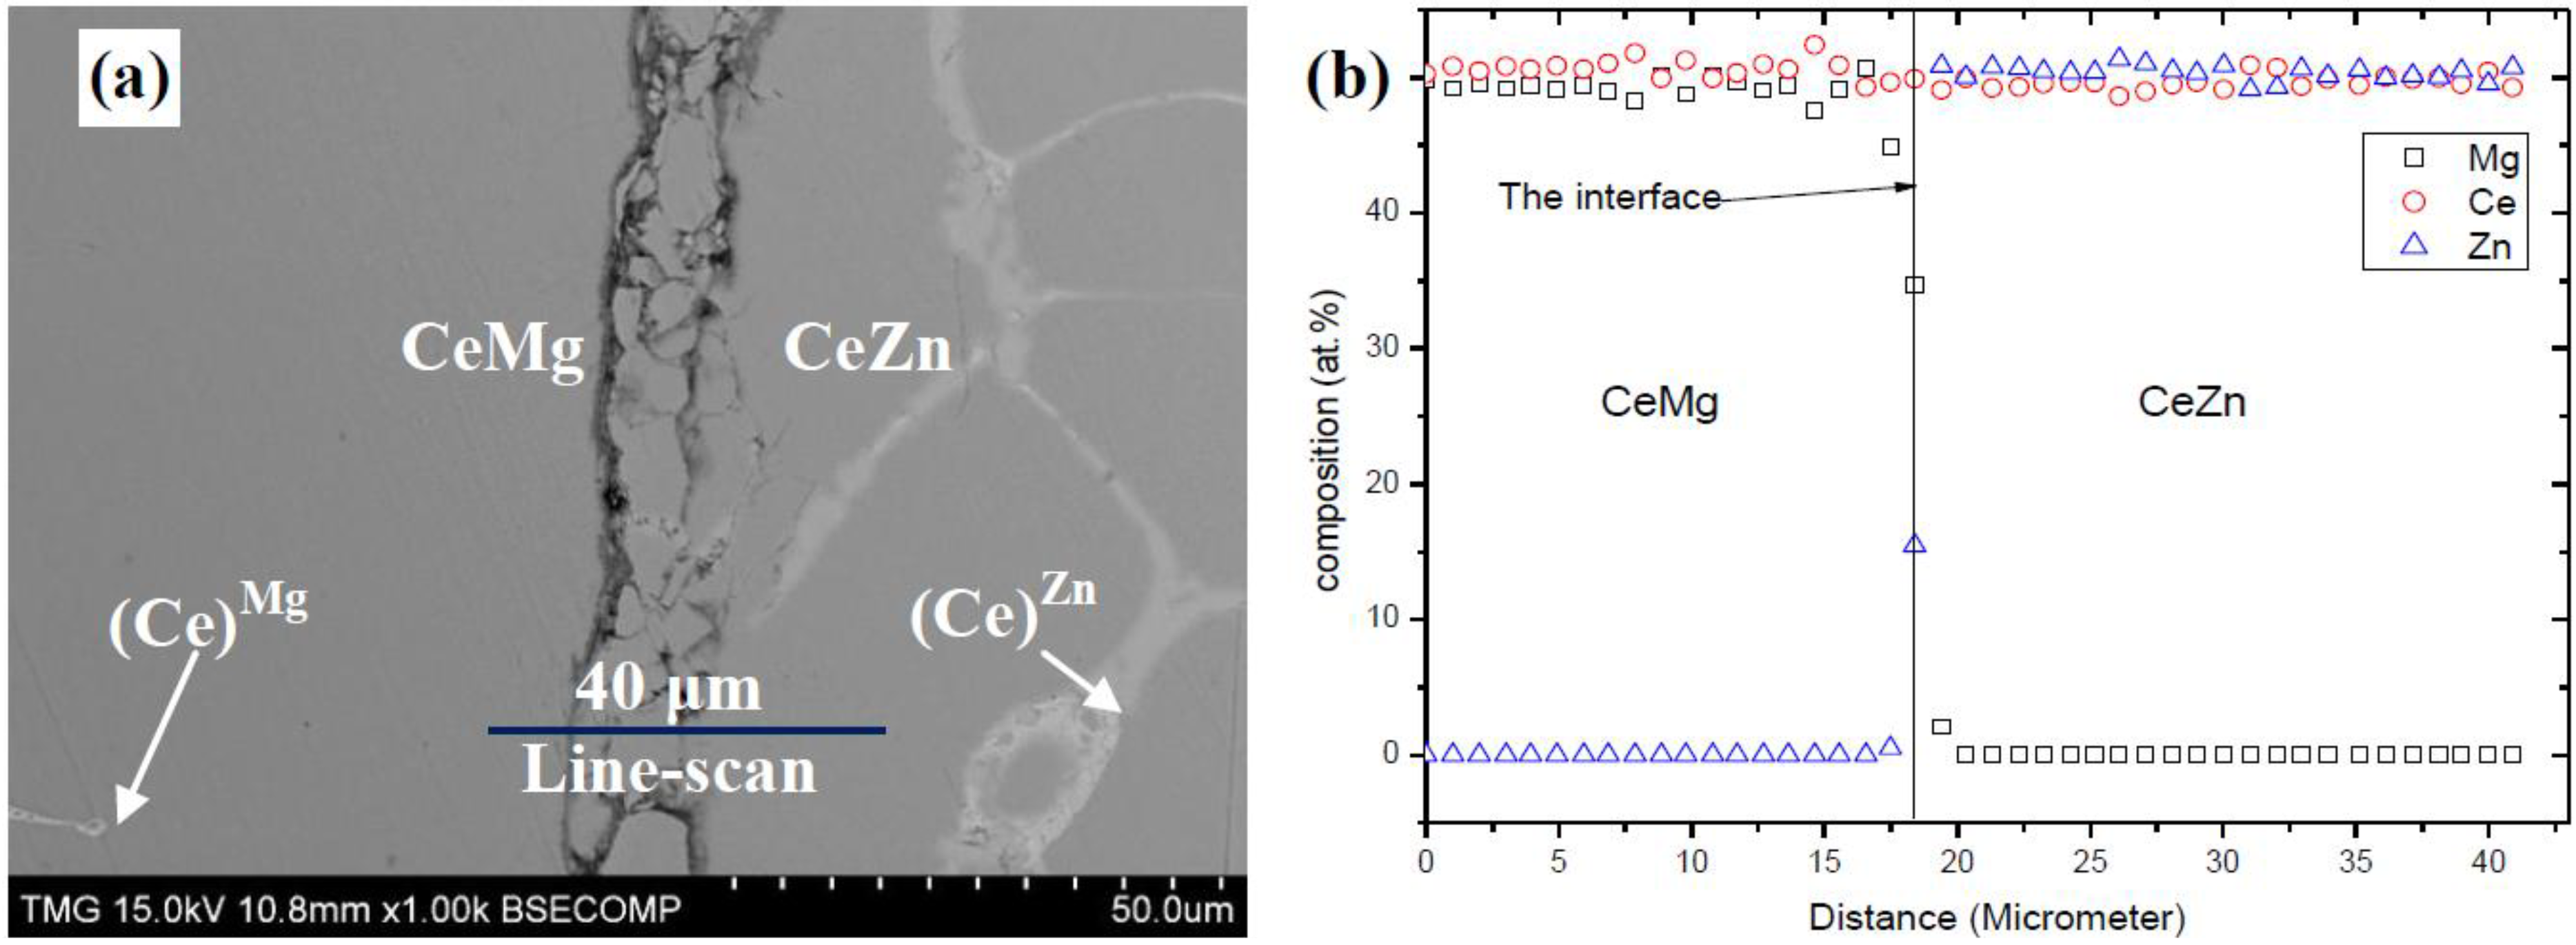
3.2.3. Diffusion Couple 3: Ce/97.0 Mg-3.0 Zn at.%
Solid-solid diffusion Couple 3, shown in
Figure 14, was made from pure Ce and a binary alloy containing 83.0 at.% Mg and 17.0 at.% Zn (
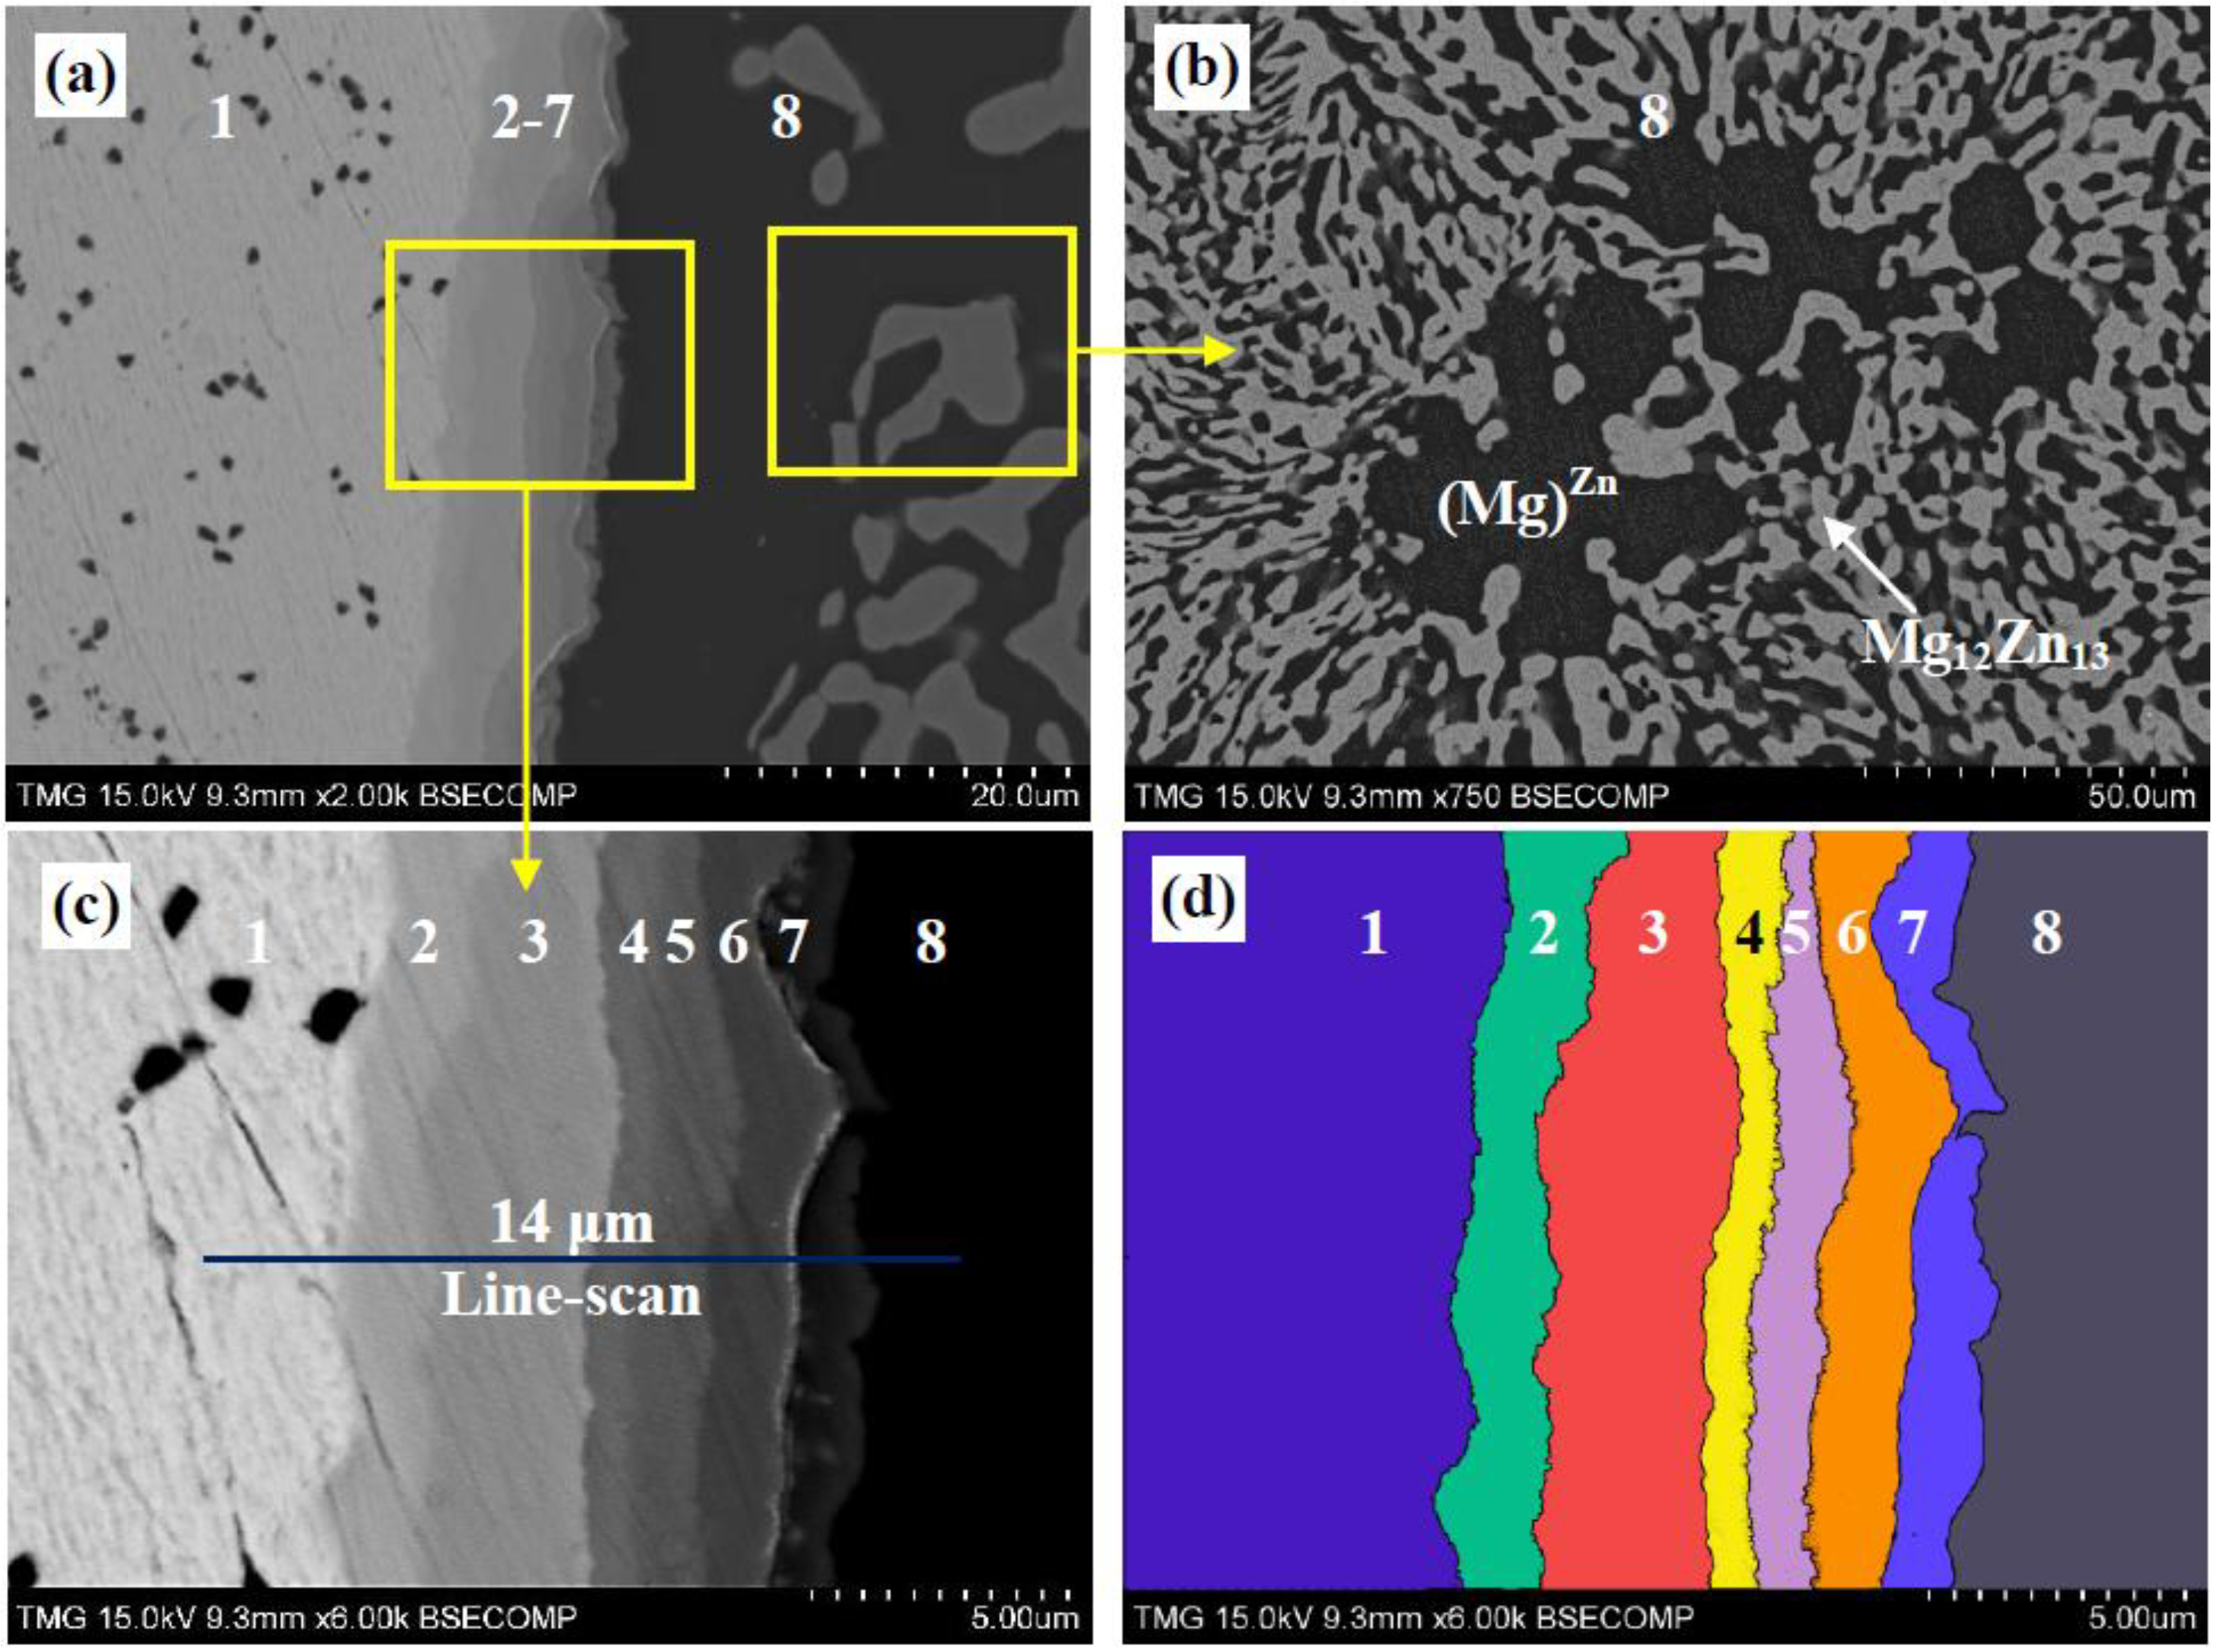
Figure 14b). Unlike other diffusion couples and the diffusion multiple, diffusion Couple 3 was annealed for 40 days instead of 21 days, since no diffusion layers were observed after 21 days of annealing. Thirty days was also tried, and no diffusion layers could be observed either. However, six diffusion layers with a total thickness of ~12 μm formed after 40 days of annealing. The WDS spot results of the diffusion zones are listed in
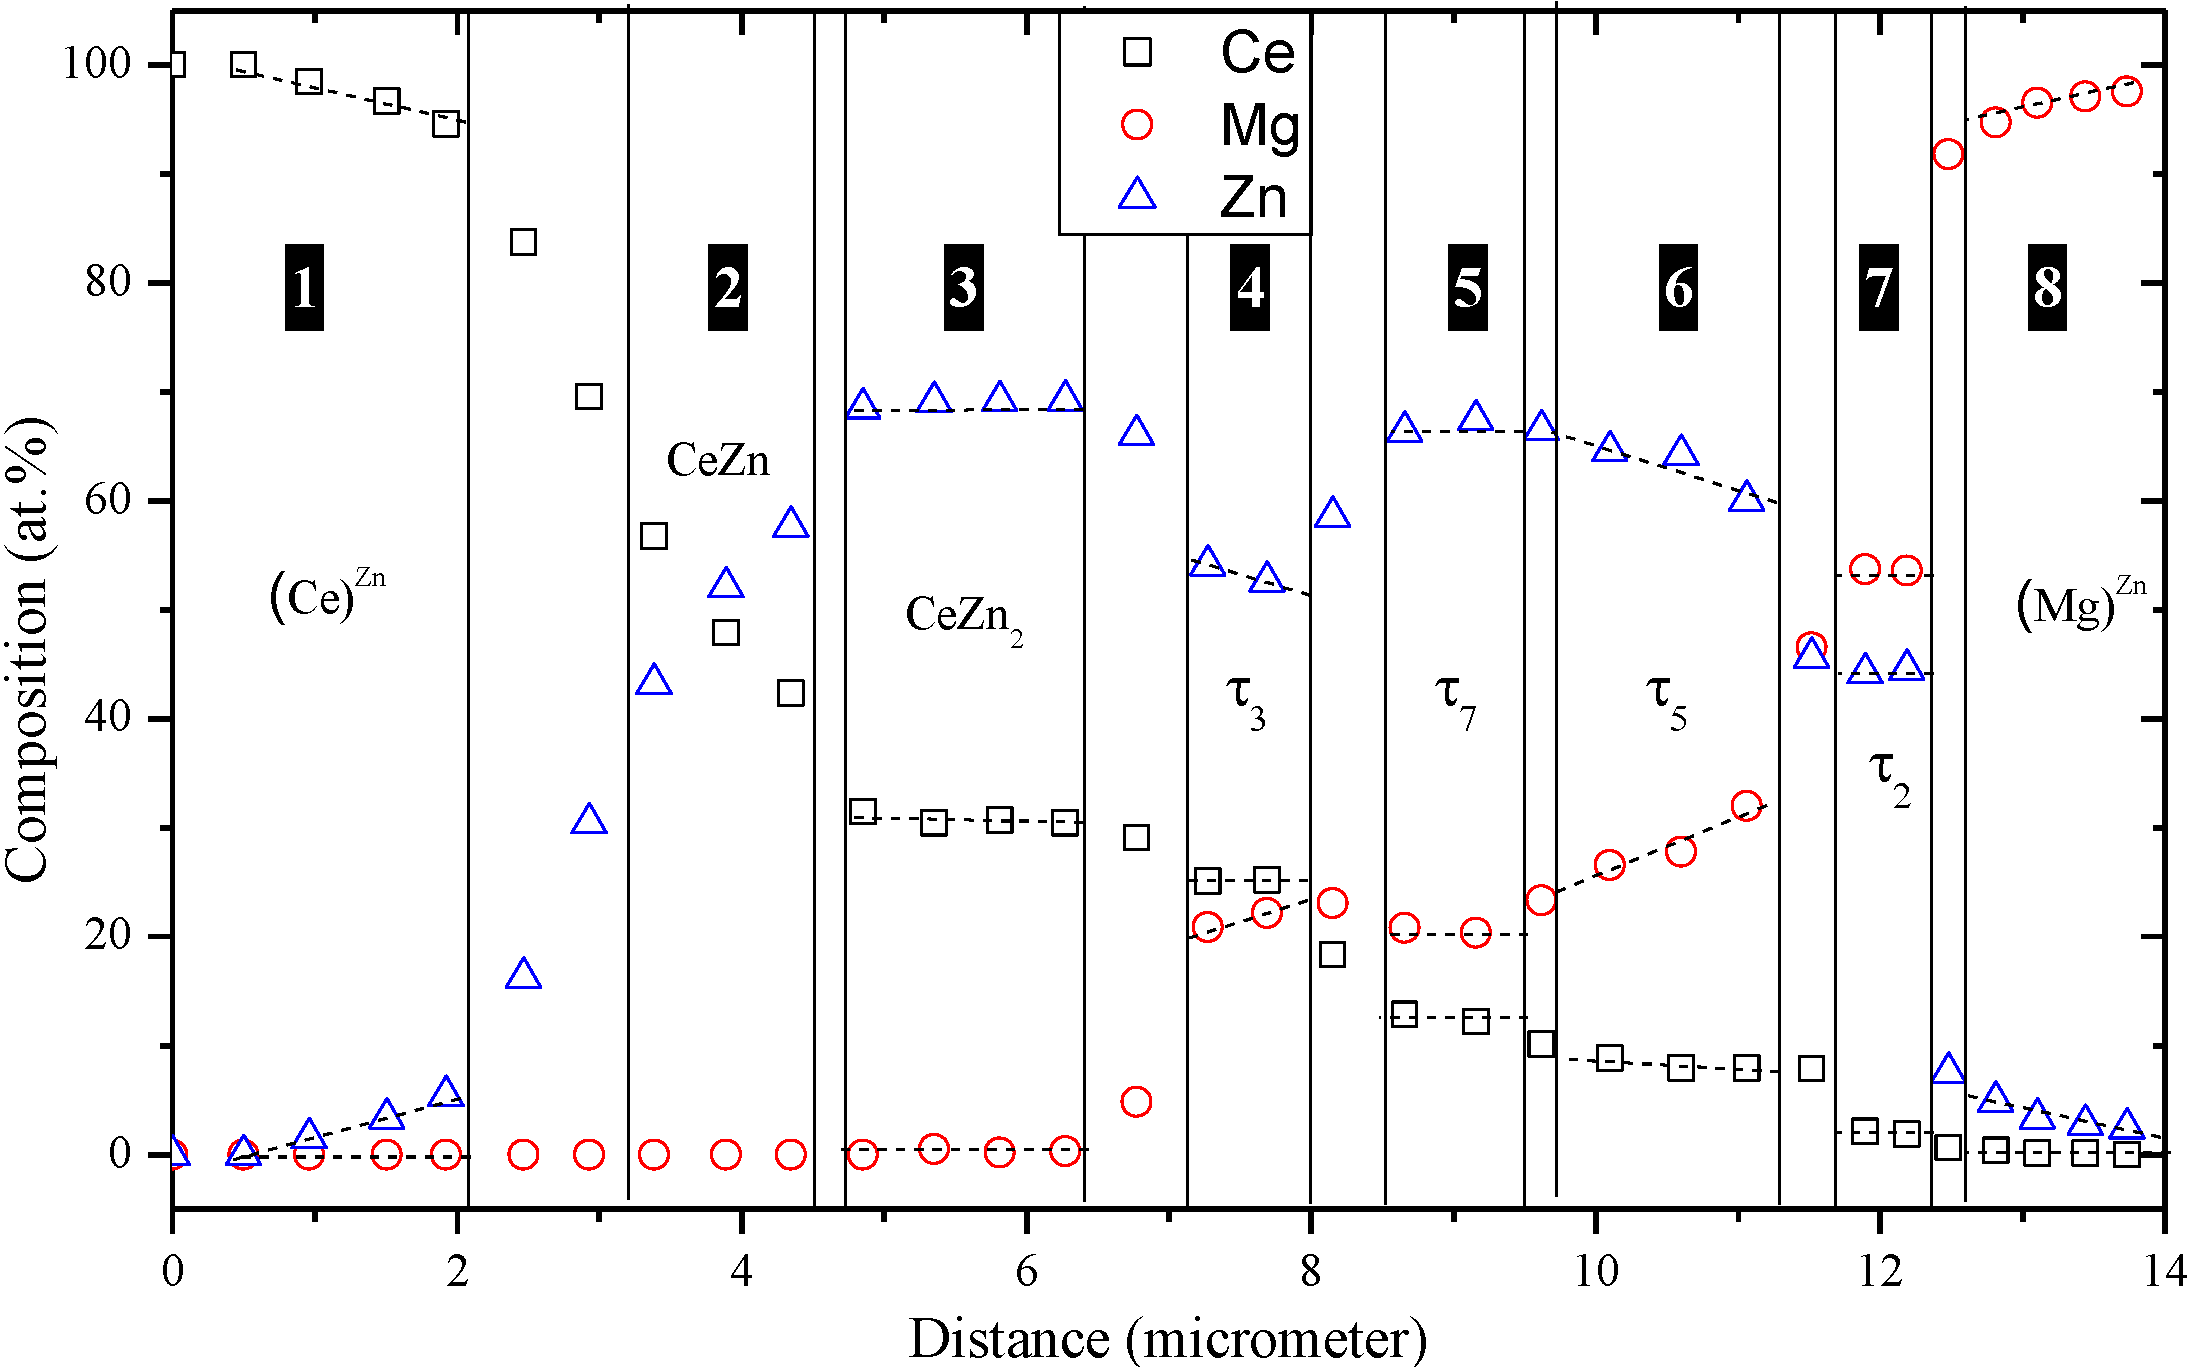
Table 6. The WDS line-scan was performed across the diffusion zones of diffusion Couple 3. The composition of each layer was determined by, at least, two spots along the WDS line-scan, as shown in
Figure 15.
Figure 14.
(a), (c) and (d) SEM micrographs of diffusion Couple 3; (b) SEM micrograph of the 83 Mg-17 Zn (at.%) end-member.
Table 6.
WDS spot analysis of different diffusion zones of diffusion Couple 3.
| Zone | Composition (at.%) | Corresponding phase |
|---|
| Ce | Mg | Zn |
|---|
| 1 (end-member) | 100 | 0 | 0 | Ce |
| 2 | 47.8 | 0 | 52.2 | CeZn |
| 3 | 32.1 | 0 | 67.9 | CeZn2 |
| 4 | 24.5 | 24.0 | 51.5 | τ3 |
| 5 | 16.7 | 20.4 | 62.9 | τ7 |
| 6 | 7.9 | 27.8 | 64.3 | τ5 |
| 7 | 2.0 | 53.7 | 44.3 | τ2 |
| 8 (end-member) | 0 | 48.0 | 52.0 | Mg12Zn13 |
| | 0 | 97.6 | 2.4 | (Mg)Zn |
Figure 15.
The WDS line-scan across diffusion Couple 3.
Based on the WDS spot analysis and line-scan, the solubility of Zn in Ce, Zone 1, was determined as 4.0 at.% Zn, as well as the solid solubility of Zn in Mg, Zone 8, was determined as 3.6 at.% Zn. Diffusion Zones 2 and 3 represent the CeZn and CeZn2 binary compounds, respectively. Diffusion Zones 4 and 6 represent the ternary compounds, τ3 and τ5, which are characterised by the Mg/Zn substitution at a constant Ce composition. Diffusion Zones 5 and 7 represent the stoichiometric ternary compounds, τ7 and τ2, respectively.
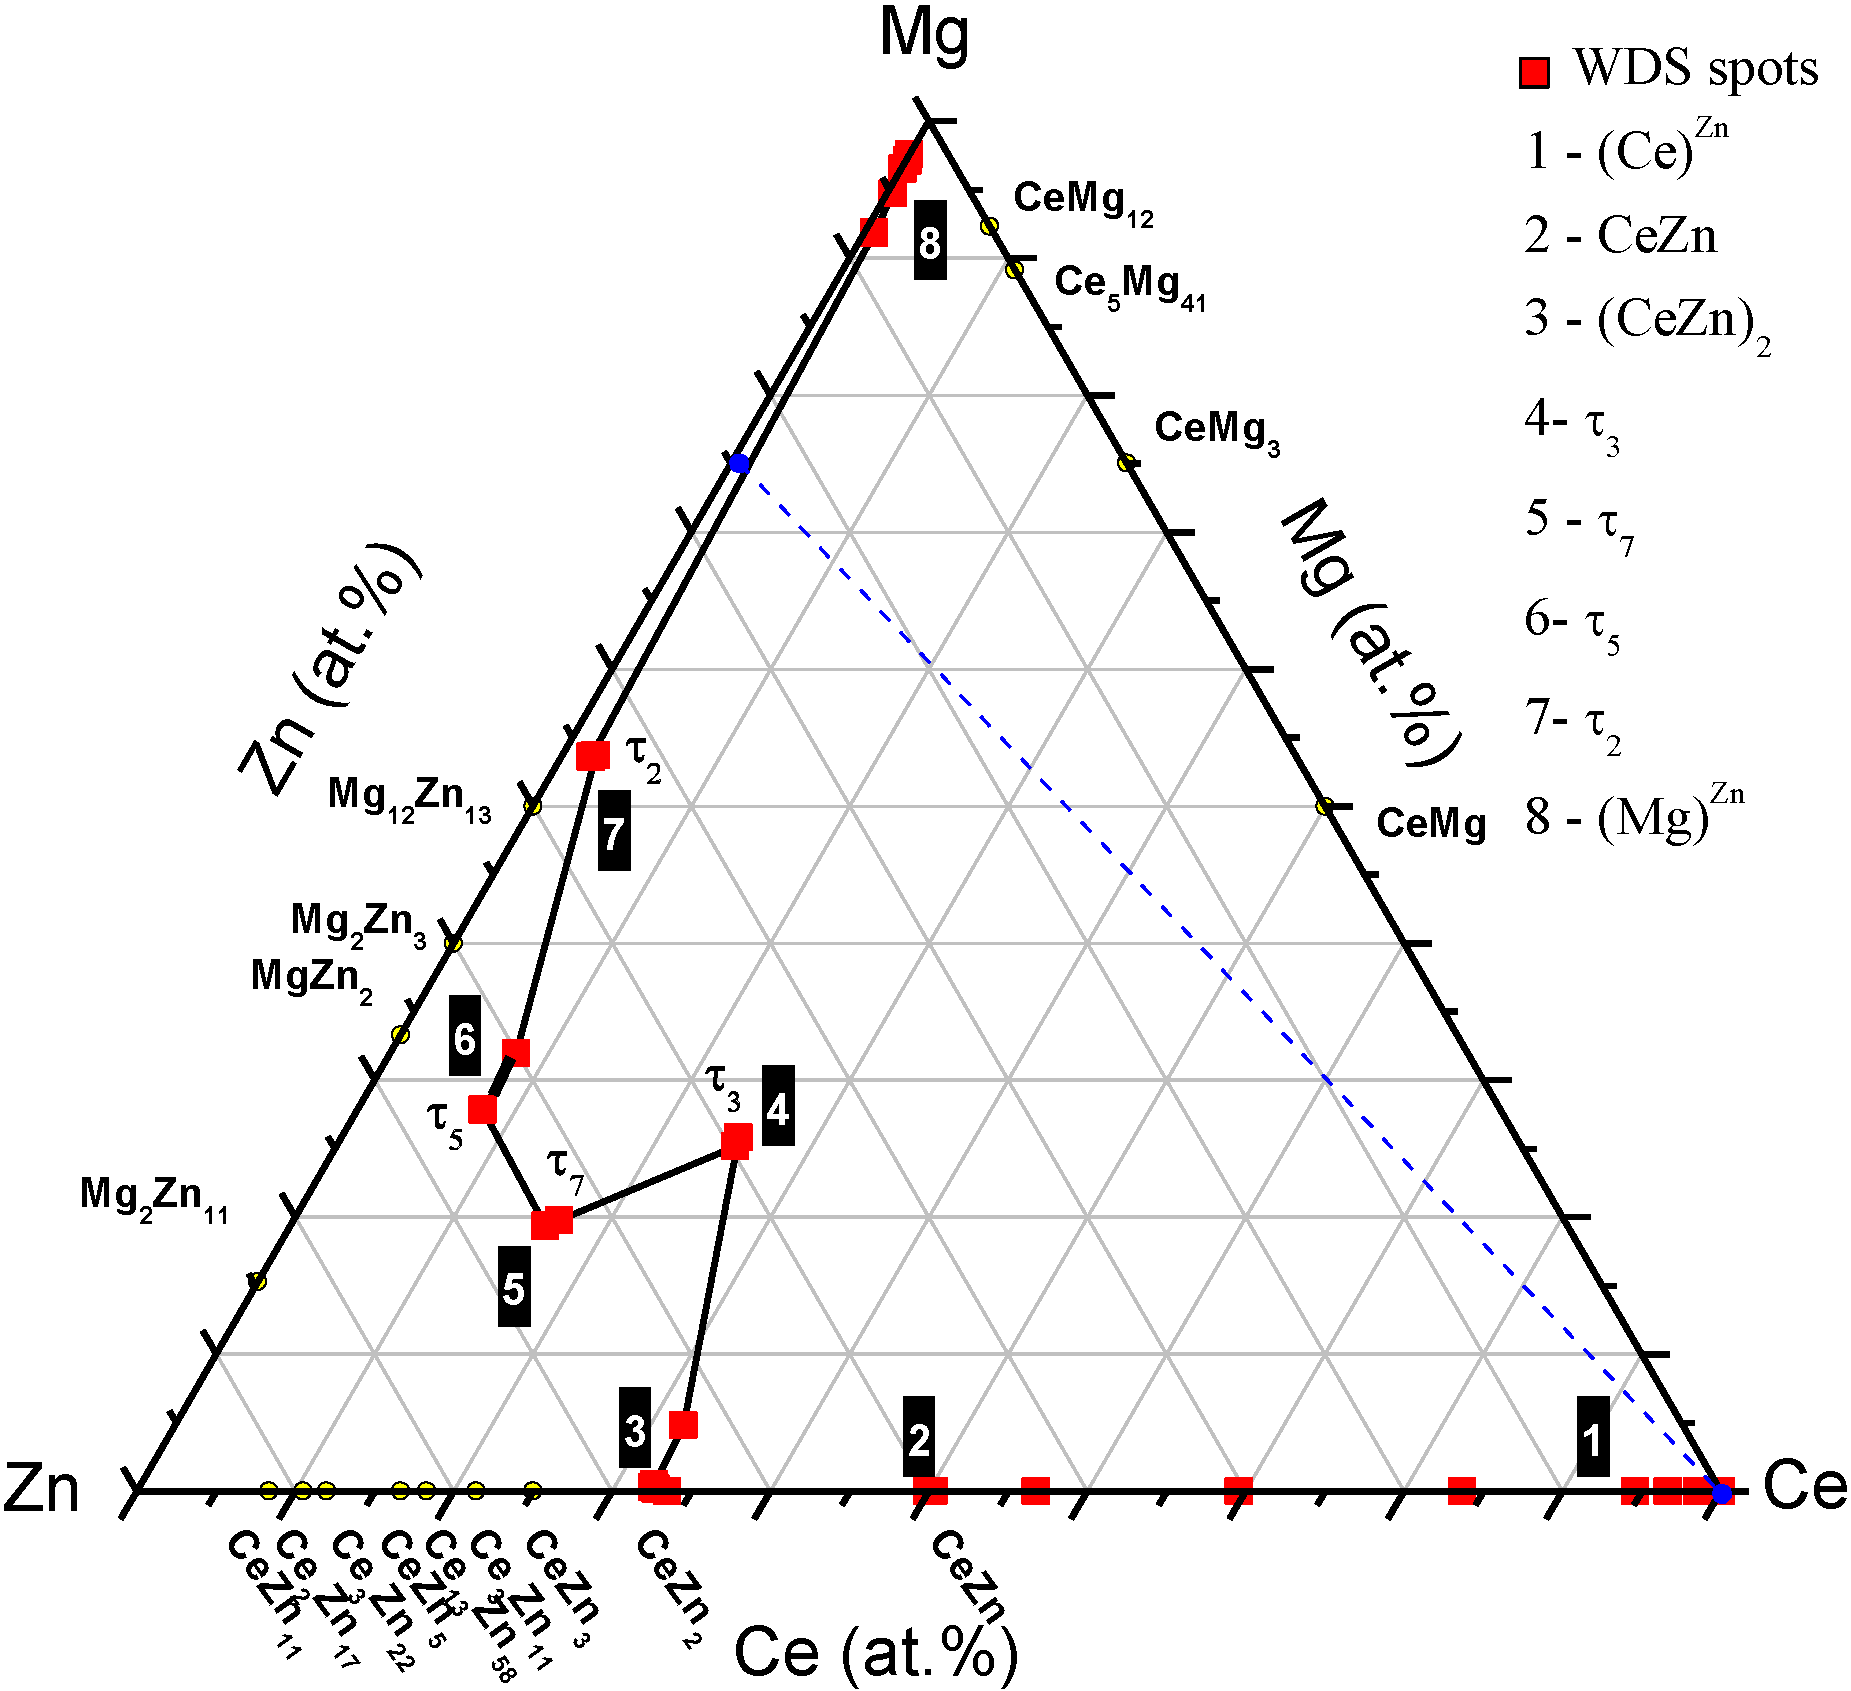
According to WDS spot analysis and line-scans, the diffusion path of diffusion Couple 3 can be represented as follows: Pure Ce (end-member) → (Ce)
Zn → CeZn → CeZn
2 → τ
3 → τ
7 → τ
5 → τ
2 → (Mg)
Zn → (Mg)
Zn + Mg
12Zn
13 (end-member). The diffusion path is represented graphically in
Figure 16. The two end-members are connected by a dashed line.
Figure 16.
Diffusion path depicted from diffusion Couple 3.
The diffusion path of diffusion Couple 3 (
Figure 16) shows some of the phases, corresponding to the diffusion Zones 2–6 (
Figure 14), that form near the Zn-rich side. In order to understand the diffusion reaction, the mass balance principle must be taken into account. In this case, the diffusion reaction can be described as follows: the pure Ce existing in the end-member of diffusion Couple 3 was diffusing against Mg and Zn atoms, which were provided by the two-phase alloy of the other end-member. The atomic exchange took place, and the Ce concentration dropped gradually across the formed diffusion zones, as shown in the WDS composition profile in
Figure 15. Accordingly, several Zn-rich ternary compounds were formed to the left side of the line connecting the two end-members. In this case, the mass of the reacted Ce and Zn must to be compensated with more Mg. Thus, the diffusion reaction switched its path sharply towards the Mg-rich corner after Zone 5, and the two-phase end-member contributed to this compensation by forming a considerably thick layer of Mg-rich solid solution, (Mg)
Zn in Zone 8, to balance the mass. Therefore, the diffusion path fulfilled the mass balance condition by intersecting the line connecting the two end-members at least once.
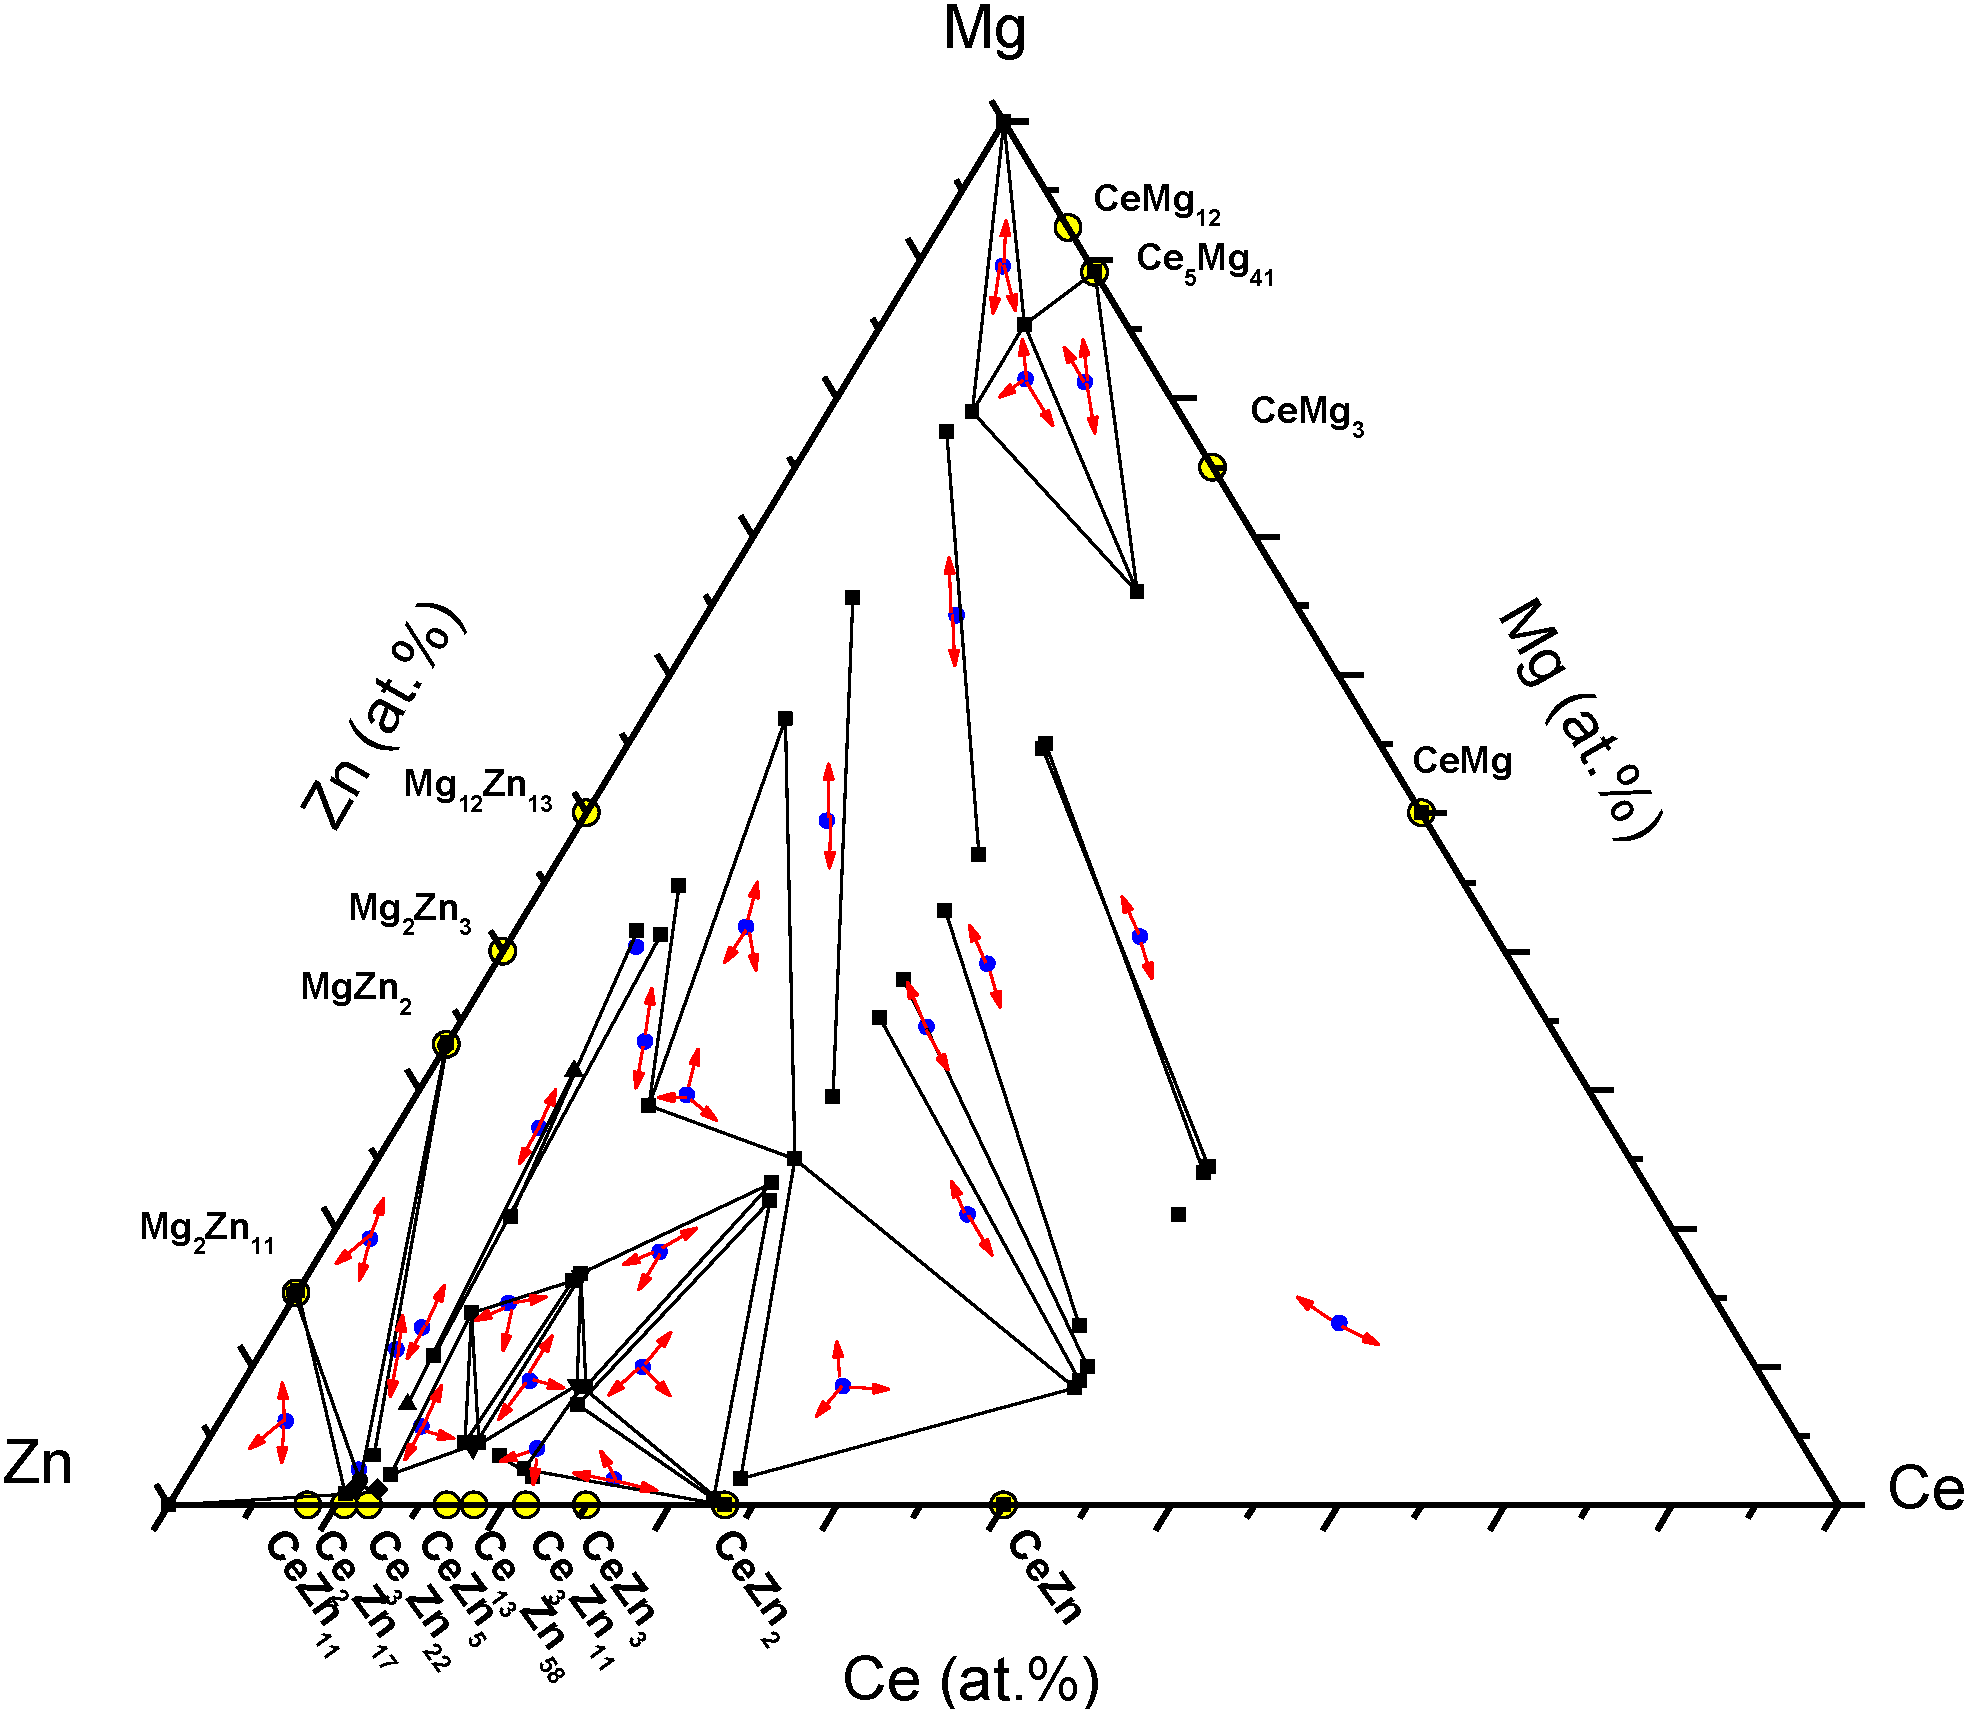
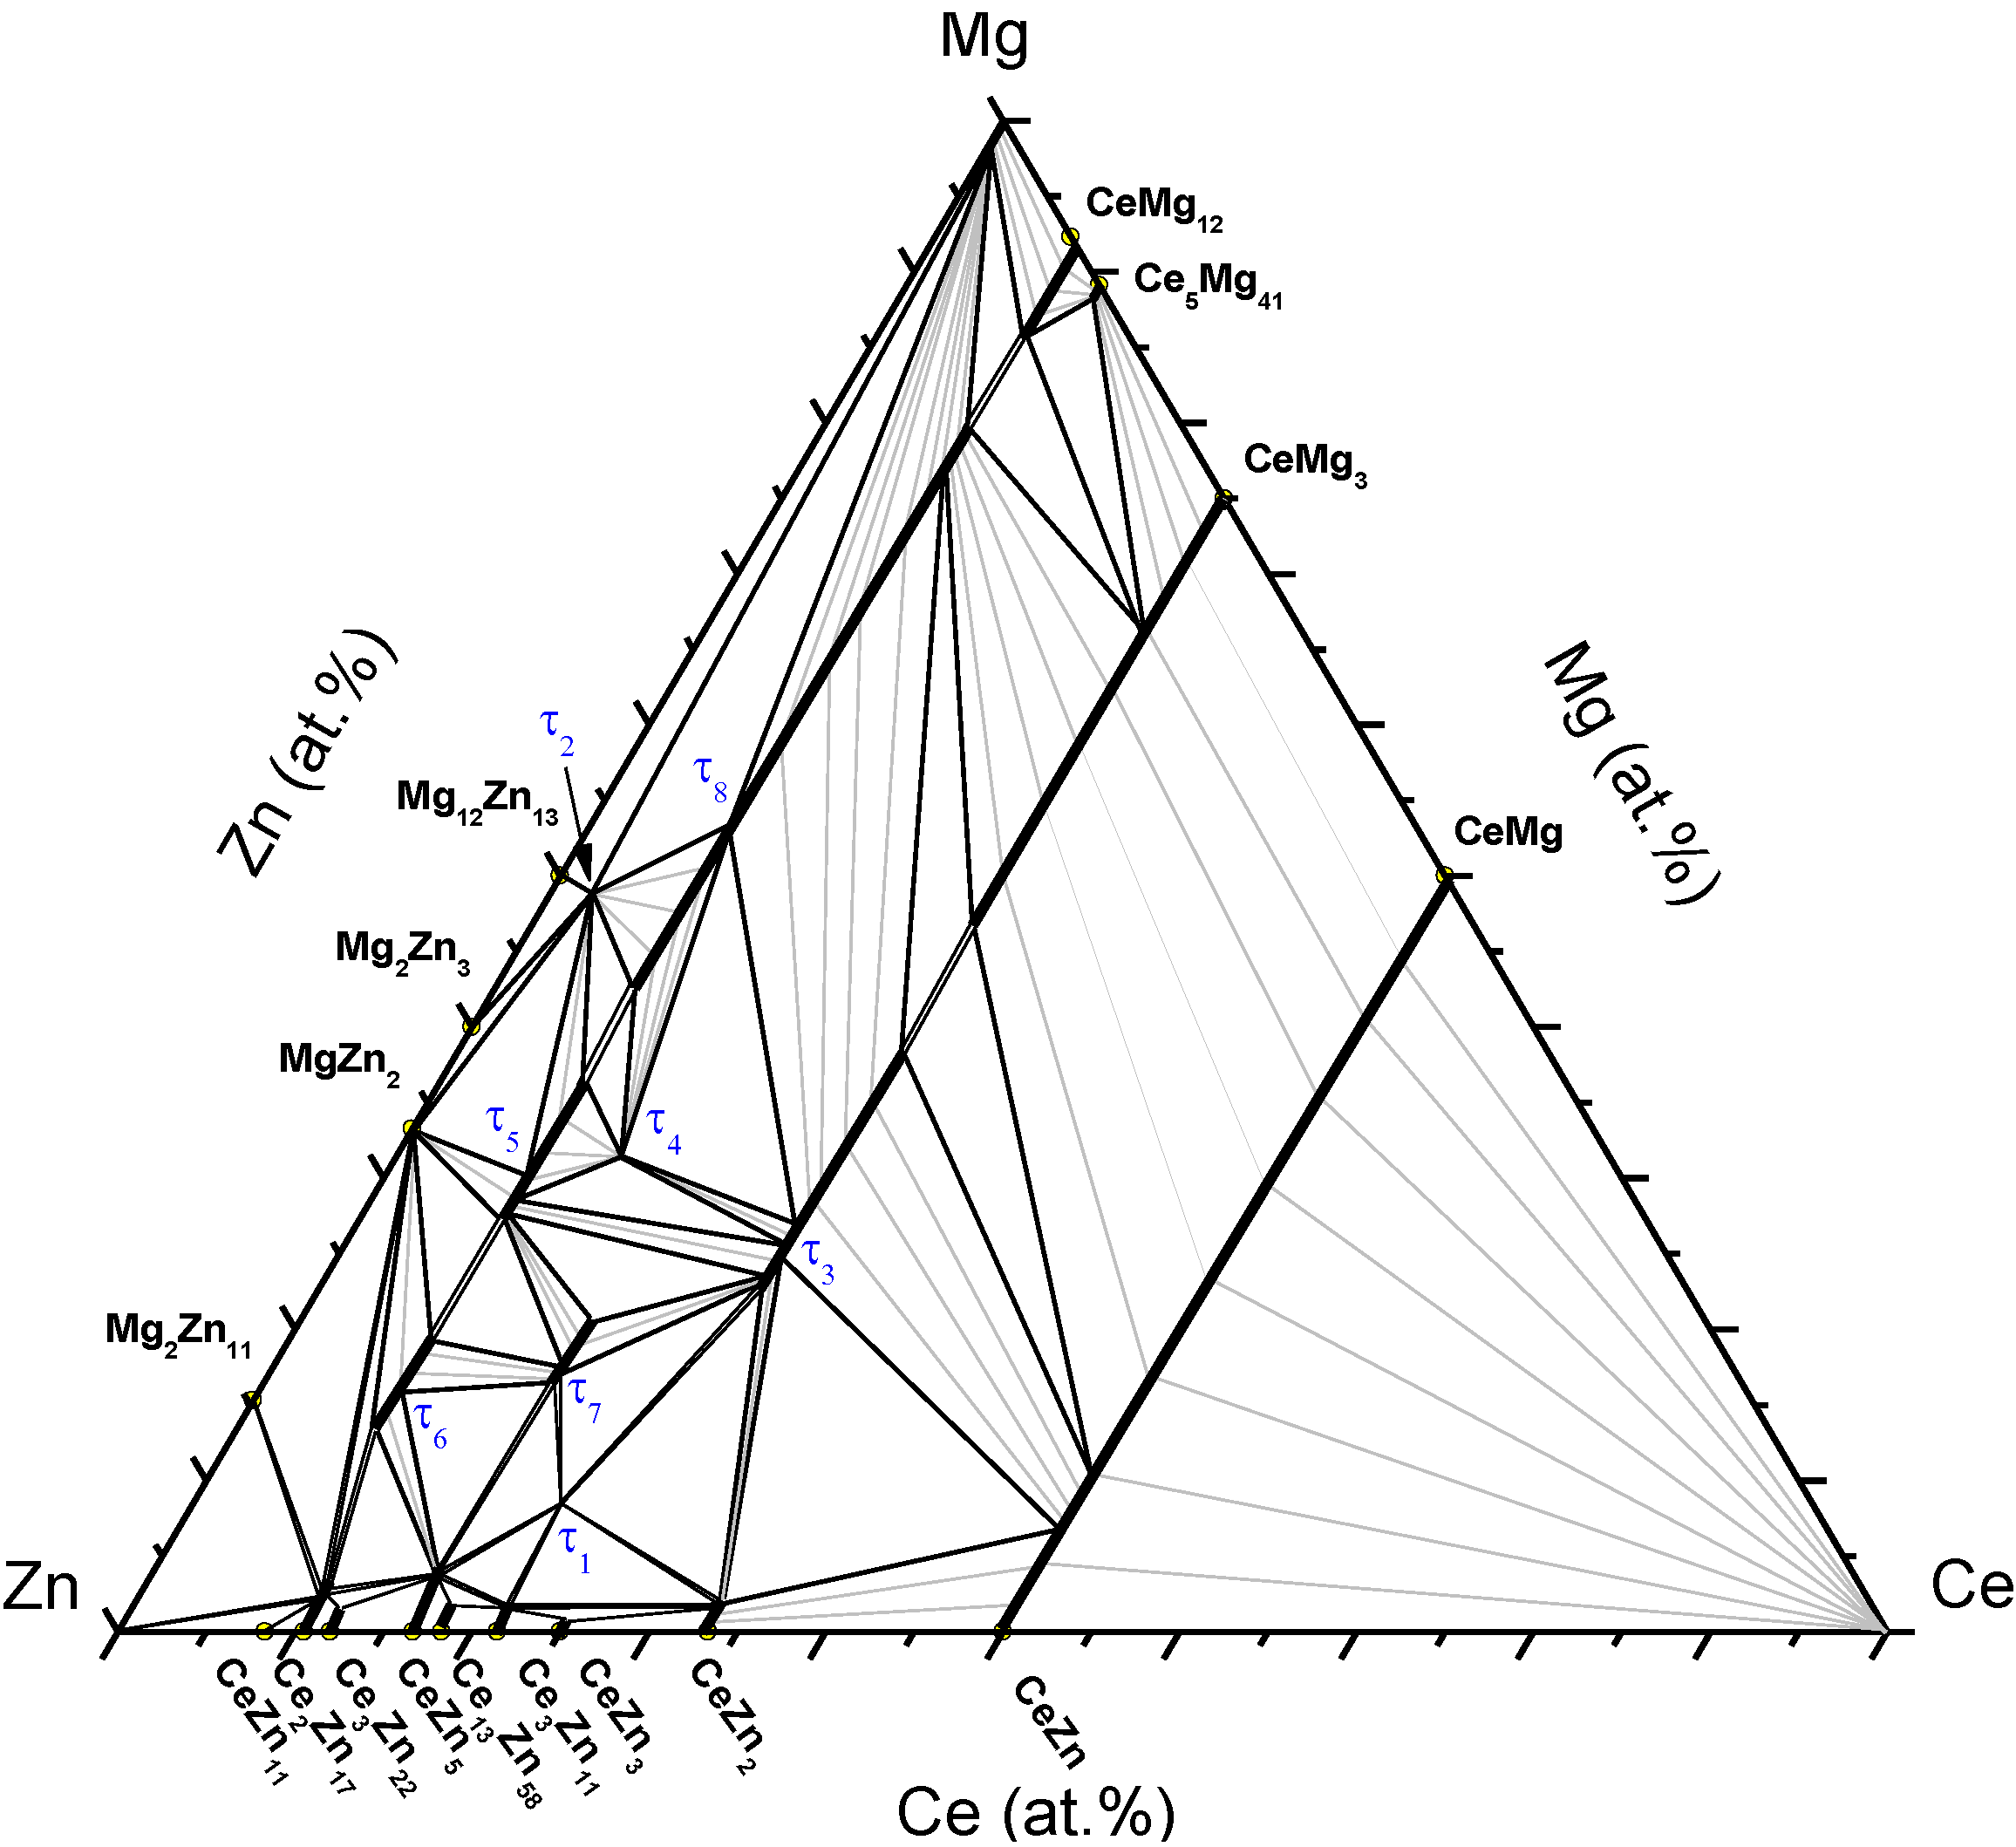
Seven ternary compounds were detected in diffusion multiple and diffusion Couples 1, 2 and 3; these phases are τ2, τ3, τ4, τ5, τ6, τ7 and τ8. Obviously, several of these compounds were observed in more than one couple, providing the confirmation of their presence in the system at 300 °C.
The three diffusion couples gave a clear idea about the phase equilibria in the Zn-rich corner, up to 33 at.% Mg and 10 at.% Ce; since their results in that part were consistent. Other regions of the Ce-Mg-Zn isothermal section at 300 °C were determined by the key alloy experiments, and their results are discussed in the following section.


