
Experimental Determination of the Standard Gibbs Energy of Formation of Fe3–xVxO4 at 1473 K

1
State Key Laboratory for Comprehensive Utilization of Vanadium and Titanium Resources, Pangang Group Institute Co., Ltd., Panzhihua 617000, China
2
State Key Laboratory of Advanced Metallurgy, Beijing 100083, China
3
School of Metallurgical and Ecological Engineering, University of Science and Technology Beijing, Beijing 100083, China
*
Author to whom correspondence should be addressed.
Metals 2023, 13(8), 1498; https://doi.org/10.3390/met13081498
Submission received: 3 July 2023
/
Revised: 1 August 2023
/
Accepted: 16 August 2023
/
Published: 21 August 2023
(This article belongs to the Special Issue Thermodynamic Properties of Metallurgical Melts)
Abstract
:In the present study, an approach of determining the standard Gibbs energy of formation of Fe3–xVxO4 was proposed firstly, then the standard Gibbs energies of formation of a variety of Fe3–xVxO4 were determined experimentally, and finally, a calculating model of the standard Gibbs energy of formation of Fe3–xVxO4 was established. The detailed results are as follows: (1) the standard Gibbs energy of formation of Fe3–xVxO4 can be determined successfully by two steps; the first is to measure the chemical potential of Fe in Fe3–xVxO4 under fixed oxygen partial pressure, the second is to derive the chemical potential of V in Fe3–xVxO4 by Gibbs–Duhem relation; (2) the standard Gibbs energies of formation of Fe3–xVxO4 are mainly decided by the Fe/V molar ratio, and almost not influenced by the oxygen partial pressure in the range from 2.39 × 10⁻¹² to 3.83 × 10⁻¹¹ atm; (3) in this oxygen partial pressure range, the standard Gibbs energies of formation of Fe3–xVxO4 can be calculated satisfactorily by the following model: .
1. Introduction
The Fe–V–O system has attracted huge interest for decades due to the variety of the iron vanadate oxides formed in this system and the diverse applications of the oxides [1,2]. For instance, more than twenty oxides of iron vanadate such as Fe0.1V2O5.15, Fe0.33V2O5, Fe0.83V1.17O4, Fe2V2O5, Fe2V4O12.29, Fe2V4O13, FeV2O6, FeV3O8, FeVO3, Fe2VO4, FeV2O4, FeVO4, and Fe4V6O21. have been reported [3,4,5,6], and their potential application in rechargeable batteries, electrical and optical switching devices, and heterogeneous catalysis fields have also been investigated [7,8].
Among the reported iron vanadate oxides, the oxides Fe2VO4 and FeV2O4 have been the focus of special attention [9,10] because they possess a spinel structure and key structural-related magnetic or electrical properties [11,12]. Fe2VO4 has the inverse spinel structure of Fe3+[Fe2+V3+]O4, like magnetite Fe3+[Fe2+Fe3+]O4. However, FeV2O4 changes to the normal spinel structure of Fe2+[V3+]2O4 with divalent iron (Fe2+) occupying tetrahedral sites and trivalent vanadium (V3+) occupying octahedral sites due to the strong affinity of V3+ ions for octahedral sites.
In addition to the stoichiometric compounds Fe2VO4 and FeV2O4, a complete solid solution Fe3–xVxO4 can be formed by Fe3+[Fe2+Fe3+]O4 and Fe2+[V3+]2O4. The cation distribution in the spinel solid solution Fe3–xVxO4 has been determined by Mössbauer spectroscopy [13]. For 0 < x < 1.0, the solid solution remains an inverse spinel structure as Fe3+[Fe2+Fe3+1-xV3+x]O4. For 1.64 < x < 2.0, the solid solution remains a normal spinel structure as Fe2+[Fe3+1–x/2V3+x/2]2O4. The transition from normal to inverse is observed for 1.0 < x < 1.64.
Due to the similar structure to magnetite Fe3O4, great consideration has been given to the magnetic properties of Fe3–xVxO4. Wakihara et al. [14] synthesized the spinel solid solution with stoichiometric composition at 1500 K under controlled CO2–H2 atmospheres, measured the Curie temperature and the magnetization behaviors of a series of solid-solution compounds, and proposed a magnetic structure model. Jin et al. [15] fabricated epitaxial Fe3–xVxO4 (0 ≤ x ≤ 0.6) films by using reactive co-sputtering from pure Fe and V in a gas mixture of Ar and O2, and the magnetic and magnetotransport properties of the film spinels were studied at room temperature. Pool et al. [16] synthesized nanoparticles of Fe3–xVxO4 with up to 33% vanadium substitution (x = 0 to 1) by mixing appropriate ratios of solutions of 0.5 mmol V(acac)3 and Fe(acac)3, 1,2-hexadecanediol with benzyl ether, oleic acid(1.5 mmol), and oleylamine (1.5 mmol) under evacuated conditions. The site preference of the vanadium and the magnetic behavior of the nanoparticles were investigated through L23edge X-ray absorption spectroscopy (XAS) and X-ray magnetic circular dichroism (MCD) spectra.
Research on the optical absorption properties as well as the catalytic and stable properties of Fe3–xVxO4 have also been reported. Kim et al. [17] prepared the Fe3–xVxO4 thin film on Si (100) substrates by using a sol–gel method. The valence and occupying sites of V ions in the Fe3–xVxO4 (x < 1.0) compounds were revealed by using X-ray diffraction, X-ray photoelectron spectroscopy, and Mössbauer spectroscopy, while the optical absorption properties of the films were measured by spectroscopic ellipsometry (SE). Häggblad et al. [18] investigated the catalytic effect of Fe3–xVxO4 (x < 1.37) on the oxidation of methanol to produce formaldehyde, and the valence change of V ion was revealed by in and ex situ analyses of the samples with X-ray absorption near edge structure (XANES) spectroscopy.
Apart from the research on the physical properties of Fe3–xVxO4, a number of works relating to the phase equilibria of Fe3–xVxO4 have been carried out. Coetsee et al. [19] determined the existing phases with the change of Fe/V molar ratio in the V2O3–FeO system from 1673 K to 1873 K by using CO/CO2 = 3 gas mixture to control the oxygen partial pressure. Wakihara et al. [20] determined the phase equilibria in FeO–Fe2O3–V2O3 system at 1500 K by varying the oxygen partial pressure and proposed the phase boundaries of Fe3–xVxO4. In our previous publication [21], the phase equilibria of the FeO–V2O3 system at 1473 K under various oxygen partial pressures were determined, and a phase diagram of vs. the molar ratio of V/(Fe + V) was presented. Based on the available phase equilibria and thermodynamic data, the Fe–V–O system was assessed and optimized through the CALPHAD method. Xie et al. [2] performed the assessment by adopting the modified quasichemical model to describe the liquid phase in the system and the sublattice model based on the compound energy formalism to describe the spinel solid solution Fe3–xVxO4. Du et al. [22] also performed an evaluation and modeling of the system by using the modified quasichemical model to describe the liquid oxide solution and the two sublattice spinel solution model within the framework of the compound energy formalism to the spinel solid solution Fe3–xVxO4. In addition, the modeling works of some more complex systems, such as the Fe–Ti–V–O system [23] and CaO–FeO–Fe2O3–MgO–SiO2-containing V2O3 and V2O5 system [24], were reported.
However, regarding the elementary thermodynamic data, i.e., the standard Gibbs energy of Fe3–xVxO4, only the data of FeV2O4 was reported. The first Gibbs energy measurement was performed by Chipman and Dastur [25] by the equilibration of FeV2O4 with liquid Fe–V solution under a controlled H2–H2O gas atmosphere at 1873 K. Wakihara et al. [20] determined the standard Gibbs energy of the reaction of Fe + V2O3 + 0.5O2 = FeV2O4 and 0.05Fe + V2O3 + Fe0.95O = FeV2O4 at 1500 K, according to the equilibrated oxygen partial pressure. And even in the database of commercial thermodynamic software FactSage [26], only the data of FeV2O4 can be retrieved. Therefore, the present study aimed at providing the fundamental thermodynamic data of Fe3–xVxO4 and understanding the effect of V substituting on the thermodynamic property of the spinel phase; the standard Gibbs energy of formation of Fe3–xVxO4 was determined by combining theoretical derivation with experimental measurements.
2. Principle and Experimental
2.1. Principle of Determining the Gibbs Energy of Fe3–xVxO4
The molar Gibbs energy of Fe3–xVxO4 can be calculated according to Equation (1).
where , , and are the chemical potentials of Fe, V, and O2, respectively. Furthermore, according to the Gibbs–Duhem relation [27], the chemical potentials of Fe, V, and O2 can be connected by Equation (2).
If the oxygen partial pressure is fixed unchangeably, the will be zero, and then Equation (2) can be simplified as Equation (3).
Then, Equation (4) can be obtained by dividing both sides of Equation (3) by x.
where represent the molar ratio of Fe to V in Fe3–xVxO4. If it is replaced by y, Equation (4) becomes Equation (5).
By integrating Equation (5) from to , the following relations can be obtained.
where refers to the molar ratio of Fe to V in Fe3–xVxO4 when it is saturated or equilibrated with V2O3, i.e., the minimum molar ratio of Fe to V in Fe3–xVxO4 at the fixed oxygen partial pressure. Correspondingly, refers to the chemical potential of V in the Fe3–xVxO4 that is saturated or equilibrated with V2O3 at the fixed oxygen partial pressure.
Next, using the method of integration by parts, Equation (6) can be changed to Equation (7).
Rearranging Equation (7), a relation of Equation (8) can be obtained.
Equation (8) tells us if we can know the functional relationship between and , as well as the value of and , then the chemical potential of V in Fe3–xVxO4 can be calculated through Equation (8).
Regarding the parameters and , they can be determined by using the following approaches. For , it can be read directly from the phase diagram of the FetO–V2O3 system at 1473 K under various oxygen partial pressures, which we have reported in a previous publication [21]. For , it can be determined by the formation reaction of V2O3 shown as Equation (9), because the chemical potentials of V in all the equilibrated phases are equal.
According to Equation (9), the can be determined by Equation (10).
where is the chemical potential of pure V2O3 compound, is the chemical potential of O2 at 1atm, and is the oxygen partial pressure adopted in experiments.
From the above analysis, it can be concluded that when the dependence of on can be obtained, the will be calculated through Equation (8), and the (molar Gibbs energy of Fe3–xVxO4) can be calculated by inserting and into Equation (1). Therefore, to measure the in Fe3–xVxO4 is a prerequisite for the determination of the molar Gibbs energy of Fe3–xVxO4.
2.2. Experimental Procedure for Measuring in the Solid-Solution Phase Fe3–xVxO4
The experiments to measure the values of the chemical potential of Fe in the solid solution phase Fe3–xVxO4 consisted of three steps. The first was to prepare the pure Fe3–xVxO4 compounds with different Fe/V molar ratios at fixed oxygen partial pressure; the second was to equilibrate the prepared Fe3–xVxO4 with liquid copper; the third was to measure the content of Fe in the copper by Inductive Coupled Plasma–Optical Emission Spectrometer (ICP–OES, OPTIMA 7000DV, Waltham, MA, USA).
Pure Fe3–xVxO4 compounds with different Fe/V molar ratios were prepared through the conventional solid-state reaction method under CO–CO2 gas mixture atmosphere at 1473 K, where CO–CO2 gas mixture was adopted to control the oxygen partial pressure in the reaction chamber. The experimental apparatus and the operating details can be found in our previous publications [21,28,29]. The reactants, composed of analytical reagents of Fe, Fe2O3, and V2O3 with purity of 99.99%, were ground homogeneously in an agate mortar and pressed into pellets. Then, the pellets were placed into an alumina crucible and reacted in a pre-designed atmosphere for 72 h. Detailed information about the composition of prepared samples and the preparing atmospheres is shown in Table 1.
After the pure Fe3–xVxO4 was prepared, it was equilibrated with liquid copper at 1473 K for 72 h under the same atmosphere as the preparing condition. Here, the liquid copper was selected as the metal to equilibrate with the Fe3–xVxO4 sample. This is because the liquid copper is stable and cannot be oxidized during the present investigated oxygen partial pressure range (2.39 × 10⁻¹²~3.83 × 10⁻¹¹ atm), and also, the activity coefficient of Fe in liquid copper is far greater than unity [30], which can ensure that the concentration of Fe in liquid copper is very small. For a typical run of the equilibrating experiment, about 5 g copper powder with a purity of 99.99% was placed into an alumina crucible, a tablet of about 2.5 g of Fe3–xVxO4 was placed above the copper powder, and then the crucible containing the samples was put into a furnace and heated to 1473 K. When the temperature reached 1473 K, the samples were held for 72 h to ensure the equilibrium between Fe3–xVxO4 and liquid copper. Then, the equilibrated samples were quenched by lifting the sample from the high-temperature zone to the water-cooled quenching chamber. The quenched sample was taken out from the quenching chamber, and the solidified copper was separated from the Fe3–xVxO4 by a mechanical method. Then, the surface of the separated copper was cleaned mechanically for ICP–OES analysis to measure the content of Fe. For the ICP–OES analysis of Fe content, each sample was measured three times to ensure the error was less than 10 ppm; then, the measured three values were averaged as the final results.
When the content of Fe in the copper sample was measured, the chemical potential of Fe in the Fe3–xVxO4 sample can be deduced by using the following method. As the Fe3–xVxO4 sample was equilibrated with the liquid copper chemically, the chemical potential of Fe in the Fe3–xVxO4 sample was equal to that in the copper sample. So, by using the measured content of Fe in copper, the chemical potential of Fe can be determined by Equation (11).
where is the chemical potential of pure iron, is the activity coefficient of Fe in liquid copper, and is the molar fraction of Fe in the liquid copper. Furthermore, if the content of Fe in the liquid copper is low and can be treated as a dilute solution, the activity coefficient can be replaced by the Henry constant of Fe in liquid copper , which was reported to be 24.1 relative to the pure solid Fe [30]. Therefore, in the present study, the chemical potential of Fe would be determined by Equation (12).
After in the Fe3–xVxO4 sample with different Fe/V molar ratio was determined, the dependence of on can be deduced. When the relationship between and was obtained, the molar Gibbs energy of Fe3–xVxO4 can then be obtained by the approach presented in the previous section.
3. Results and Discussion
3.1. Chemical Potential of Fe in the Fe3–xVxO4 under Different Oxygen Partial Pressures
In our previous publication [21], the phase diagram of the “FeO”–V2O3 system at 1473 K in the oxygen partial pressure range of 5.98 × 10⁻¹⁵ atm to 2.39 × 10⁻⁸ atm was reported. Under the present investigated oxygen partial pressures, the Fe/V molar ratio for the single-phase area of Fe3–xVxO4 is summarized in Table 2. Where and correspond to the maximal and minimum Fe/V molar ratio of Fe3–xVxO4 single-phase area. When the Fe/V molar ratio in the system is larger than , Fe3–xVxO4 will coexist with the FeO phase. And when the Fe/V in the system is less than , Fe3–xVxO4 will coexist with the V2O3 phase.
From Table 2, it can be clearly seen that the Fe/V ratio of the presently investigated samples is located in the single-phase area of Fe3–xVxO4. So this can ensure the prepared compounds are pure phase with the pre-designed Fe/V molar ratio.
In Table 3, the ICP-OES measurement results for the contents of Fe in the quenched copper phase that had been equilibrated with Fe3–xVxO4 are present. For the sake of clarity, the Fe/V molar ratio of the equilibrating Fe3–xVxO4 compound and the equilibrating oxygen partial pressure are also listed together in Table 3. By using the measured contents of Fe in the quenched copper phase, the chemical potential of Fe in Fe3–xVxO4 was calculated according to Equation (12), and the calculated values are shown in the form of in the last column of Table 3.
From the calculated results of shown in the last column of Table 3, it can be found that both the Fe/V molar ratio of Fe3–xVxO4 and the equilibrating oxygen partial pressure have a significant effect on the chemical potential of Fe in the Fe3–xVxO4 compound. At each fixed oxygen partial pressure, the chemical potential of Fe increased gradually with the increase of the Fe/V molar ratio. By comparing the results with the same Fe/V ratio, it can be found that the chemical potential of Fe decreased gradually with the increase of the equilibrating oxygen partial pressures. For instance, the for Fe3–xVxO4(Fe/V = 1.6) decreased from −23,861.3 J/mol to −28,362.0 J/mol and then to −37,547.4 J/mol, while the oxygen partial pressure increased from 2.39 × 10⁻¹² atm to 9.57 × 10⁻¹² atm and then to 3.83 × 10⁻¹¹ atm.
In view of the above-indicated situation, it is an expedient approach to deduce the functional relations between and y separately at each experimental oxygen partial pressure. It was assumed that the relations between and y could be expressed by the relation shown in Equation (13).
To determine the model parameters and , was plotted against y, and the results are shown in Figure 1.
From Figure 1, it can be seen that satisfactory linear relationships exist between and y. This implies that the assumed functional relation by Equation (13) is acceptable in the current investigated conditions, and the obtained functional relations between and y at different oxygen partial pressures are summarized and presented in Table 4.
3.2. Chemical Potential of V in the Fe3–xVxO4 under Different Oxygen Partial Pressure
After obtaining the functional relationships between the and y, the chemical potential of V in Fe3–xVxO4 under different oxygen partial pressures were derived. The detailed procedure is as follows. Firstly, the functional relationship between and y, as shown in Equation (13), was inserted into Equation (8), yielding Equation (14).
Rearranging Equation (14), Equation (15) was obtained.
By integrating Equation (15) by parts, Equation (16) was obtained.
Equation (16) was rearranged and integrated again, and Equation (17) was obtained.
Then, inserting Equation (10) into Equation (17) yielded Equation (18)
where is the standard Gibbs energy of formation of V2O3, and its reported value at 1473 K is −864,690.7 J/mol. The values of at 2.39 × 10⁻¹² atm, 9.57 × 10⁻¹² atm, and 3.83 × 10⁻¹¹ are 0.524, 0.565, and 0.567, respectively.
Now, through Equation (18), the values of for Fe3–xVxO4 with various Fe/V ratios under different oxygen partial pressures can be calculated. The calculated results are summarized and presented in Table 5.
3.3. Standard Gibbs Energy of Formation of Fe3–xVxO4 at 1473 K
According to the definition of standard Gibbs energy of formation, the standard Gibbs energy of Fe3–xVxO4 can be determined by the following relation.
where , the chemical potential of pure Fe3–xVxO4, is equal to the molar Gibbs energy of pure Fe3–xVxO4, so Equation (1) can be inserted into Equation (19) to replace the . Then, a relation shown as Equation (20) can be obtained.
Furthermore, according to the relationship between and oxygen partial pressure, Equation (20) can be changed to Equation (21).
Now, by inserting the values of and presented in Table 4 into Equation (21), the standard Gibbs energy of formation of Fe3–xVxO4 with different Fe/V ratios under experimental oxygen partial pressures was calculated, and the calculated results are listed in Table 6.
To further understand the influence of Fe/V ratio and oxygen partial pressure on the standard Gibbs energy of formation of Fe3–xVxO4, the calculated values presented in Table 5 were demonstrated in Figure 2 by plotting the against the Fe/V molar ratio. From Figure 2, it can be seen apparently that the data of determined under different oxygen partial pressures shown not only very similar changing trends but also very small differences. This implies that in the present investigated composition and atmosphere ranges, the standard Gibbs energy of formation of Fe3–xVxO4 is mainly influenced by the Fe/V molar ratio, and the effect of oxygen partial pressure is almost negligible.
In Figure 2, apart from the data determined in the present study, the standard Gibbs energy of formation of FeV2O4 reported as −1,061,678.1 J/mol at 1473 K [26] was also denoted by using a star marker. It can be found that the shows excellent agreement and compatibility with the present determined data.
From Figure 2, although the trend of the change of the standard Gibbs energy of formation of Fe3–xVxO4 with the increasing of Fe/V molar ratio can be seen explicitly, the functional relationship between them is implicit. To derive it, the standard Gibbs energies of the formation of FeV2O4 and Fe3O4 were considered because Fe3–xVxO4 can be considered as a complete solid solution formed with FeV2O4 and Fe3O4 FeV2O4 and Fe3O4 as the end members.
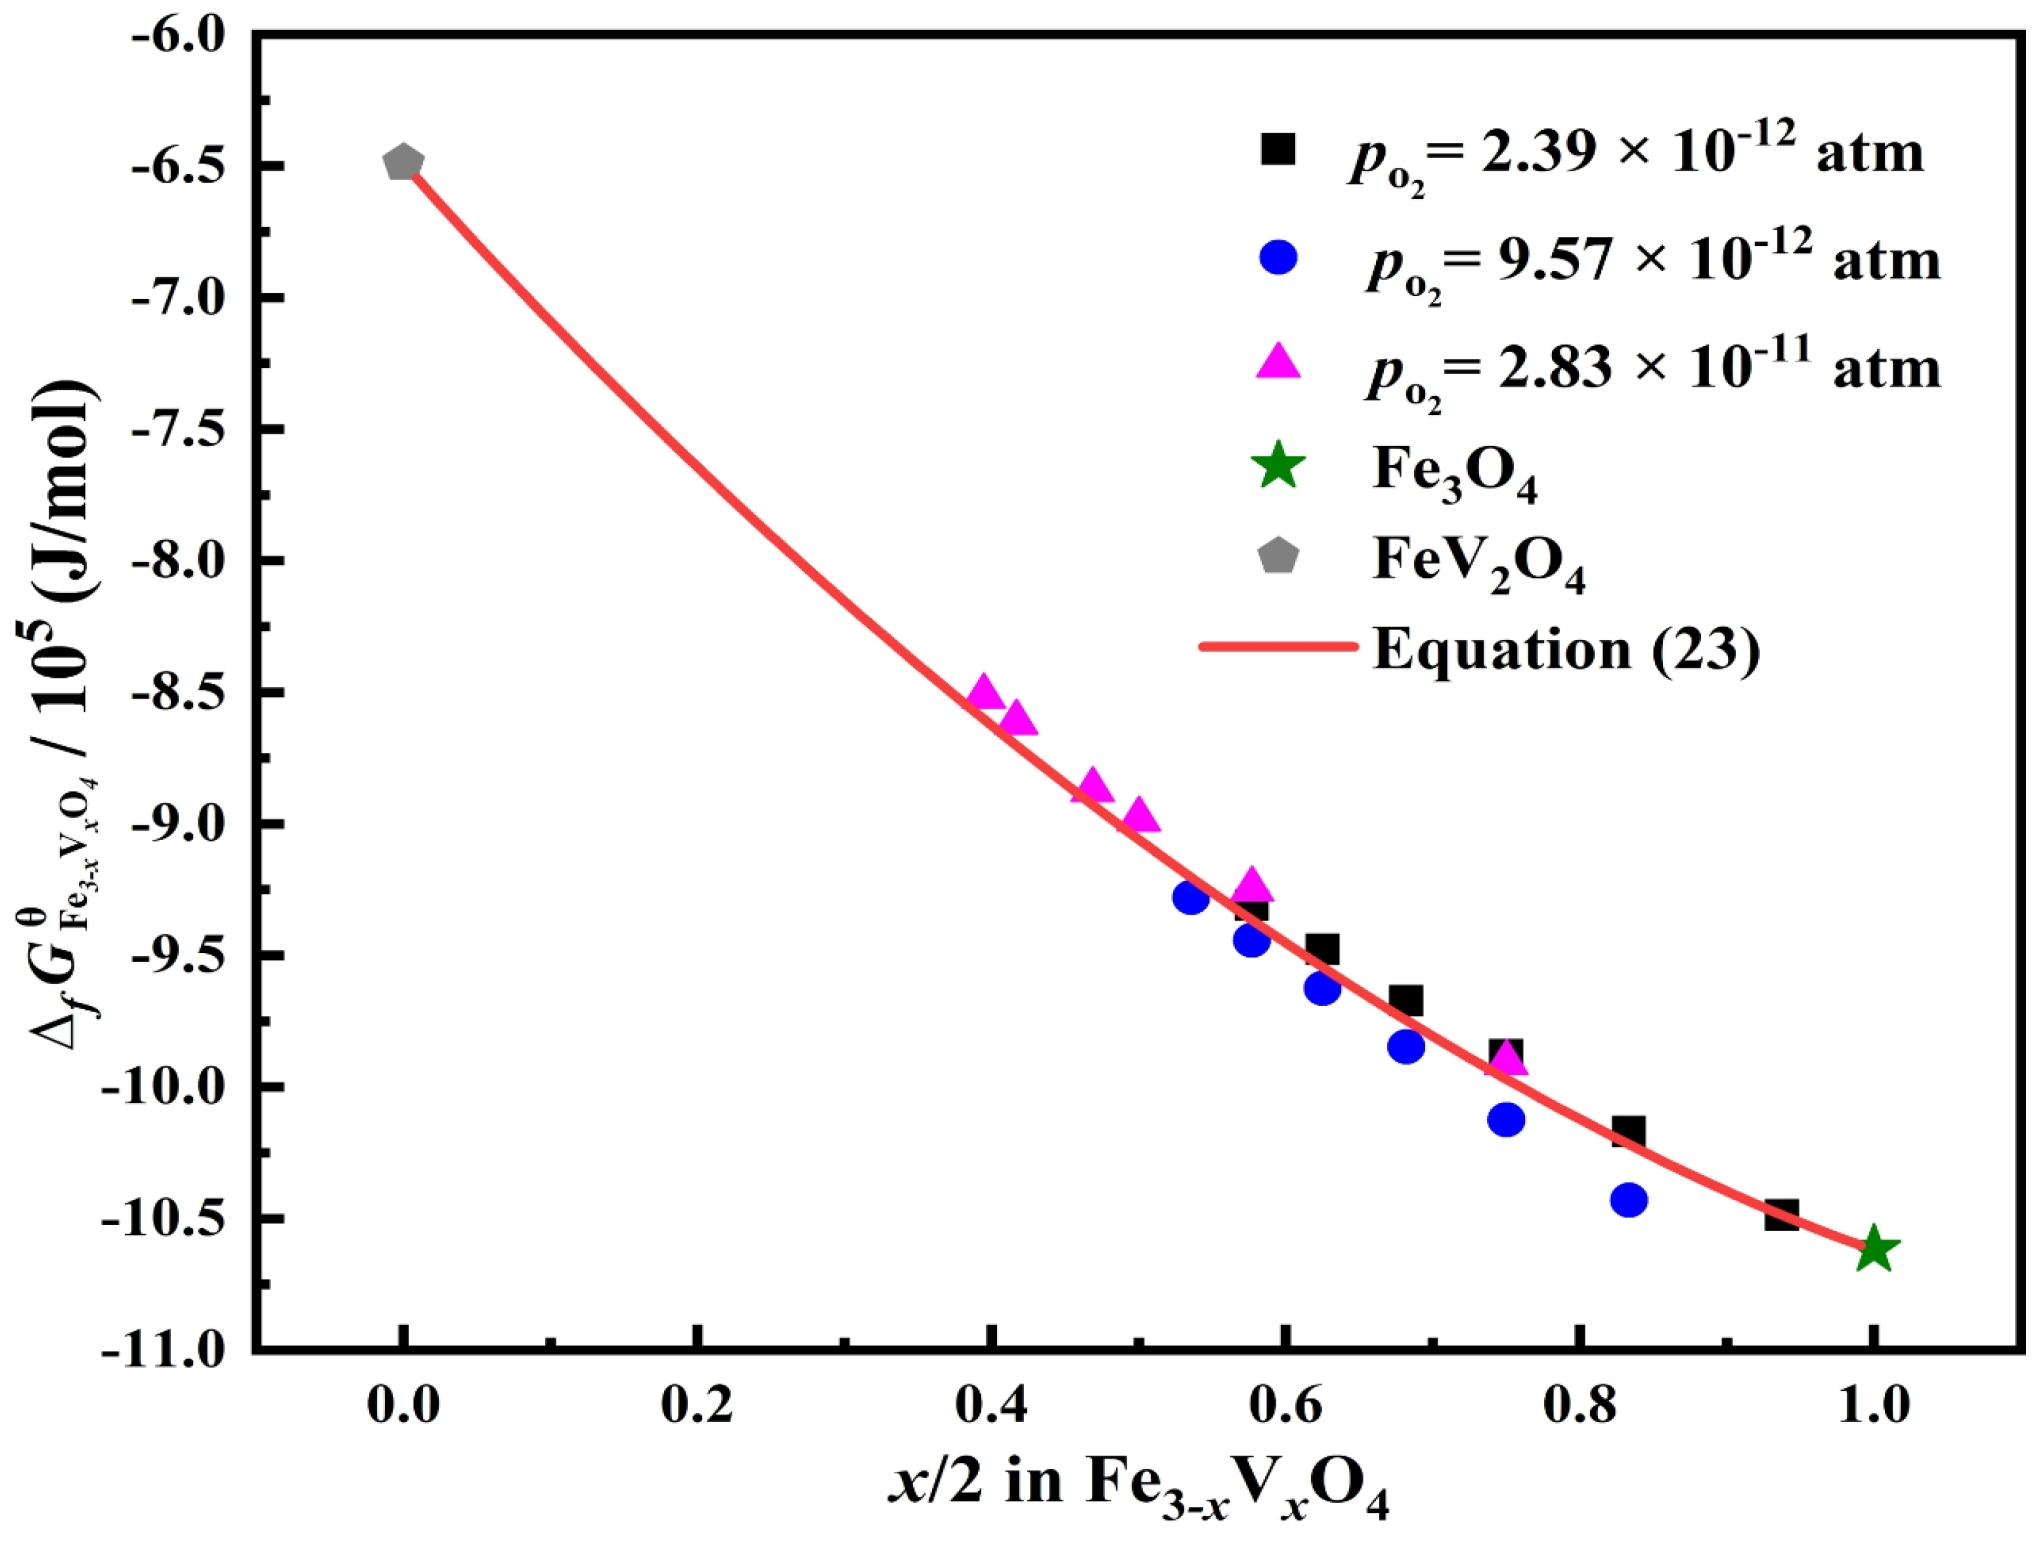
In Figure 3, the standard Gibbs energies of the formation of FeV2O4 and Fe3O4 were plotted together with that of Fe3–xVxO4 against . Where can be regarded as the molar fraction of the end member FeV2O4. The adopted data of the standard Gibbs energies of the formation of Fe3O4 were –648765.3 J/mol [26].
From Figure 3, it can be seen that the present determined standard Gibbs energy of formation of Fe3–xVxO4 has high relevance with that of their end members. Therefore, the regular solution model was adopted tentatively to establish a calculating model of the standard Gibbs energy of formation of Fe3–xVxO4.
According to the regular solution model, the Gibbs energy of a solution composed of A and B can be expressed by Equation (22).
where and are Gibbs energy of pure components A and B, and are molar fractions of A and B, and is the model parameter obtained from experimental data. In the present study, by using Fe3O4 to replace A, FeV2O4 to replace B, and fitting the model to the determined values of , the following expression of calculating the standard Gibbs energy of formation of Fe3–xVxO4 was obtained.
To evaluate the estimating effect of the derived model, Equation (23) was used to calculate the with the ranging from 0 to 2, and the calculated results are presented in Figure 3 using a solid line. By comparing the calculated values with that determined experimentally, it can be seen apparently that the derived model can estimate the standard Gibbs energy of formation of Fe3–xVxO4 satisfactorily.
4. Conclusions
In view of the lack of primary thermodynamic data for the solid-solution compound Fe3–xVxO4, an approach of determining the standard Gibbs energy of formation of Fe3–xVxO4 was proposed, and its applicability was confirmed. The detailed procedure of the approach and the obtained results are as follows:
- The approach of determining consists of two steps. The first is to measure the chemical potential of Fe () in Fe3–xVxO4 under fixed oxygen partial pressure by using liquid copper as the equilibrating phase, thereby obtaining the composition-dependent relation of . The second is to calculate the by utilizing the Gibbs–Duhem relation.
- The standard Gibbs energies of the formation of a variety of Fe3–xVxO4 compounds were determined through this approach, and its reliability was verified by comparing the determined with the reported value of FeV2O4.
- In the oxygen partial pressure range from 2.39 × 10⁻¹² to 3.83 × 10⁻¹¹ atm, the standard Gibbs energies of formation of Fe3–xVxO4 is mainly decided by the Fe/V molar ratio and almost not related to the oxygen partial pressure.
- The standard Gibbs energies of the formation of Fe3–xVxO4 can be modeled satisfactorily using the regular solution model with Fe3O4 and FeV2O4 as the solution end members.
Author Contributions
Conceptualization, B.Y.; investigation, Q.M. and M.L.; writing—original draft preparation, Q.M. and M.L.; writing—review and editing, B.Y.; project administration, B.Y. All authors have read and agreed to the published version of the manuscript.
Funding
This research was funded by the State Key Laboratory of Vanadium and Titanium Resources Comprehensive Utilization grant number 2021P4FZG01A, and the National Natural Science Foundation of China, grant number 52174274.
Data Availability Statement
Not applicable.
Conflicts of Interest
The authors declare that they have no conflict of interest.
References
- Lu, R.W.; Ren, X.L.; Zhan, C.Z.; Wang, C.; Lv, R.; Shen, W.; Kang, F.; Huang, Z.-H. Facile synthesis of FeVO@C materials as high-performance composite cathode for lithium-ion hybrid capacitor. J. Alloys Compd. 2020, 835, 155398. [Google Scholar] [CrossRef]
- Xie, W.; Xin, X.R.; Cao, Z.M. Thermodynamic assessment of the Fe–V–O system. CALPHAD Comput. Coupling Phase Diagr. Thermochem. 2020, 71, 102213. [Google Scholar] [CrossRef]
- Li, S.-R.; Ge, S.-Y.; Qiao, Y.; Chen, Y.-M.; Feng, X.-Y.; Zhu, J.-F.; Chen, C.-H. Three-dimensional porous Fe0.1V2O5.15 thin film as a cathode material for lithium ion batteries. Eectrochimica Acta 2012, 64, 81–86. [Google Scholar] [CrossRef]
- Xie, W.; Xin, X.R.; Cao, Z.M. Thermodynamic, lattice dynamical, and elastic properties of iron-vanadium oxides from experiments and first principles. J. Am. Ceram. Soc. 2020, 103, 3797–3811. [Google Scholar] [CrossRef]
- Muller, J.; Joubert, J.C.; Marezio, M. The synthesis of the crystalline structure of the new oxide FeV3O8 (FexV1-xO2, x = 0.25). J. Solid State Chem. 1979, 27, 191–199. [Google Scholar] [CrossRef]
- Mawuse, A.A.; Song, N.; Jeong, I.H. All layered iron vanadate (FeV3O9.2.1H2O) as electrode for symmetric supercapacitor application in aqueous electrolyte. J. Alloys Compd. 2023, 938, 168641. [Google Scholar]
- Sharma, A.; Ashoka, S.; Nishchith, B.S.; Kalegowda, Y. Electrochemical quantification of glycine using amorphous iron vanadate nanoparticles modified pencil electrode. Inorg. Chem. Commun. 2023, 153, 110766. [Google Scholar] [CrossRef]
- Zhang, C.L.; Sang, H.R.; Yang, H.P.; Hu, L.; Wu, B.; Yin, Y. Establishment of a novel Fenton-like enhanced low-temperature selective catalytic reduction over FeVO4 catalysts. J. Environ. Chem. Eng. 2023, 11, 109634. [Google Scholar] [CrossRef]
- Wang, D.Y.; Li, F.; Yan, B.J. Synthetic mechanism and kinetics of Fe2VO4 at 1273–1473 K from Fe2O3 and V2O3 under reducing atmosphere. J. Alloys Compd. 2019, 797, 1050–1058. [Google Scholar] [CrossRef]
- Kawaguchi, S.; Ishibashi, H.; Nishihara, S.; Miyagawa, M.; Inoue, K.; Mori, S.; Kubota, Y. Anomalous magnetization behaviour in a single crystal of vanadium spinel FeV2O4. J. Phys. Condens. Matter 2013, 25, 416005. [Google Scholar] [CrossRef]
- Cevik, E.; Bozkurt, A.; Gunday, S.T.; Qahtan, T.F.; Drmosh, Q.A.; Elsayed, K.A.; Akhtar, S.; Mustafa, A. Synthesis of NiO/Fe2VO4 nano-hybrid structures via sonication induced approach for electrochemical energy storage in non-aqueous medium. J. Energy Storage 2023, 68, 107873. [Google Scholar] [CrossRef]
- Kang, J.S.; Hwang, J.; Kim, D.H.; Lee, E.; Kim, W.-J.; Kim, C.-S.; Kwon, S.; Lee, S.; Kim, J.; Ueno, T.; et al. Valence states and spin structure of spinel FeV2O4 with different orbital degrees of freedom. Phys. Rev. B 2012, 85, 165136. [Google Scholar] [CrossRef]
- Abe, M.; Karachi, M.; Nomura, S. Mossbauer study of the FeV2O4–Fe3O4 system. J. Solid State Chem. 1974, 10, 351–356. [Google Scholar] [CrossRef]
- Wakihara, M.; Shimizu, Y.; Katsura, T. Preparation and Magnetic properties FeV2O4–Fe3O4 system. J. Solid State Chem. 1971, 3, 478–483. [Google Scholar] [CrossRef]
- Jin, C.; Liz, J.; Zheng, D.X.; Tang, M.; Li, P.; Bai, H. Effect of cation substitution on the magnetic and magnetotransport properties of epitaxial Fe3−xVxO4 films. Appl. Surf. Sci. 2015, 332, 70–75. [Google Scholar] [CrossRef]
- Pool, V.L.; Kleb, M.T.; Chorney, C.L.; Lee, J.H.; Park, J.Y.; Kim, S.J. Enhanced magnetization in VxFe3−xO4 nanoparticles. J. Magn. Magn. Mater. 2015, 396, 304–307. [Google Scholar] [CrossRef]
- Kim, K.J.; Choi, S.L.; Lee, H.J.; Lee, J.H.; Park, J.Y. Evolution of structural and optical-absorption properties in VxFe3−xO4. Solid State Commun. 2007, 143, 285–288. [Google Scholar] [CrossRef]
- Häggblad, R.; Massa, M.; Andersson, A. Stability and performance of supported Fe–V-oxide catalysts in methanol oxidation. J. Catal. 2009, 266, 218–227. [Google Scholar] [CrossRef]
- Coetsee, T.; Pistorius, C. Preliminary Observations on Phase Relations in the “V2O3–FeO” and V2O3–TiO2 Systems from 1400 °C to 1600 °C in Reducing Atmospheres. J. Am. Ceram. Soc. 2000, 83, 1485–1488. [Google Scholar] [CrossRef]
- Wakihara, M.; Katsura, T. The Phase Equilibria in the FeO-Fe2O3-V2O3 System at 1500°K. Bull. Chem. Soc. Jpn. 1971, 44, 3043–3046. [Google Scholar] [CrossRef]
- Yan, B.; Wang, D.; Qiu, Q.; Deng, T. Phase relations in the “FeO-V2O3” system at 1473 K and the magnetic properties of spinel phase Fe3-xVxO4. Ceram. Int. 2020, 46, 6160–6167. [Google Scholar] [CrossRef]
- Du, W.T.; Jung, I.H. Critical evaluation and thermodynamic modeling of the Fe-V-O (FeO-Fe2O3-VO-V2O3-VO-V2O5) system. CALPHAD Comput. Coupling Phase Diagr. Thermochem. 2019, 67, 101682. [Google Scholar] [CrossRef]
- Malan, W.D.; Akdogan, G.; Taskinen, P.; Zietsman, J. Phase equilibria and thermodynamic evaluation of the Fe-Ti-V-O system in air. CALPHAD Comput. Coupling Phase Diagr. Thermochem. 2019, 65, 141–154. [Google Scholar] [CrossRef]
- Jantzen, T.; Yazhenskikh, E.; Hack, K.; Baben, M.; Wu, G.; Müller, M. Addition of V2O5 and V2O3 to the CaO–FeO–Fe2O3–MgO–SiO2 database for vanadium distribution and viscosity calculations. CALPHAD Comput. Coupling Phase Diagr. Thermochem. 2021, 74, 102284. [Google Scholar] [CrossRef]
- Chipman, J.; Dastur, M.N. Vanadium-oxygen equilibrium in liquid iron. JOM 1951, 191, 111–115. [Google Scholar] [CrossRef]
- The FactSage System. Available online: http://www.factsage.com/ (accessed on 1 July 2023).
- Hillert, M. Phase Equilibria, Phase Diagrams and Phase Transformations, 2nd ed.; Cambridge University Press: Cambridge, UK, 2007; p. 49. [Google Scholar]
- Wang, D.; Shu, Q.; Yan, B.; Wu, L.; Wang, J.; Dong, Y. Thermodynamics of the CaO–SiO2–VOx system at 1873 K under the oxygen partial pressure of 6.93 × 10⁻¹¹ atm. J. Am. Ceram. Soc. 2017, 100, 4912–4927. [Google Scholar] [CrossRef]
- Yan, B.; Wang, D.; Deng, T.; Wu, L.; Dong, Y. Effects of oxygen partial pressure on the thermodynamics of CaO–SiO2–VOx system at 1873 K. J. Am. Ceram. Soc. 2020, 103, 2114–2127. [Google Scholar] [CrossRef]
- Sigworth, G.K.; Elliott, J.F. The thermodynamics of dilute liquid copper alloys. Can. Metall. Q. 1974, 13, 455–461. [Google Scholar] [CrossRef]
Figure 1.
Plots of against Fe/V ratio of Fe3–xVxO4 and the linear fitting results.
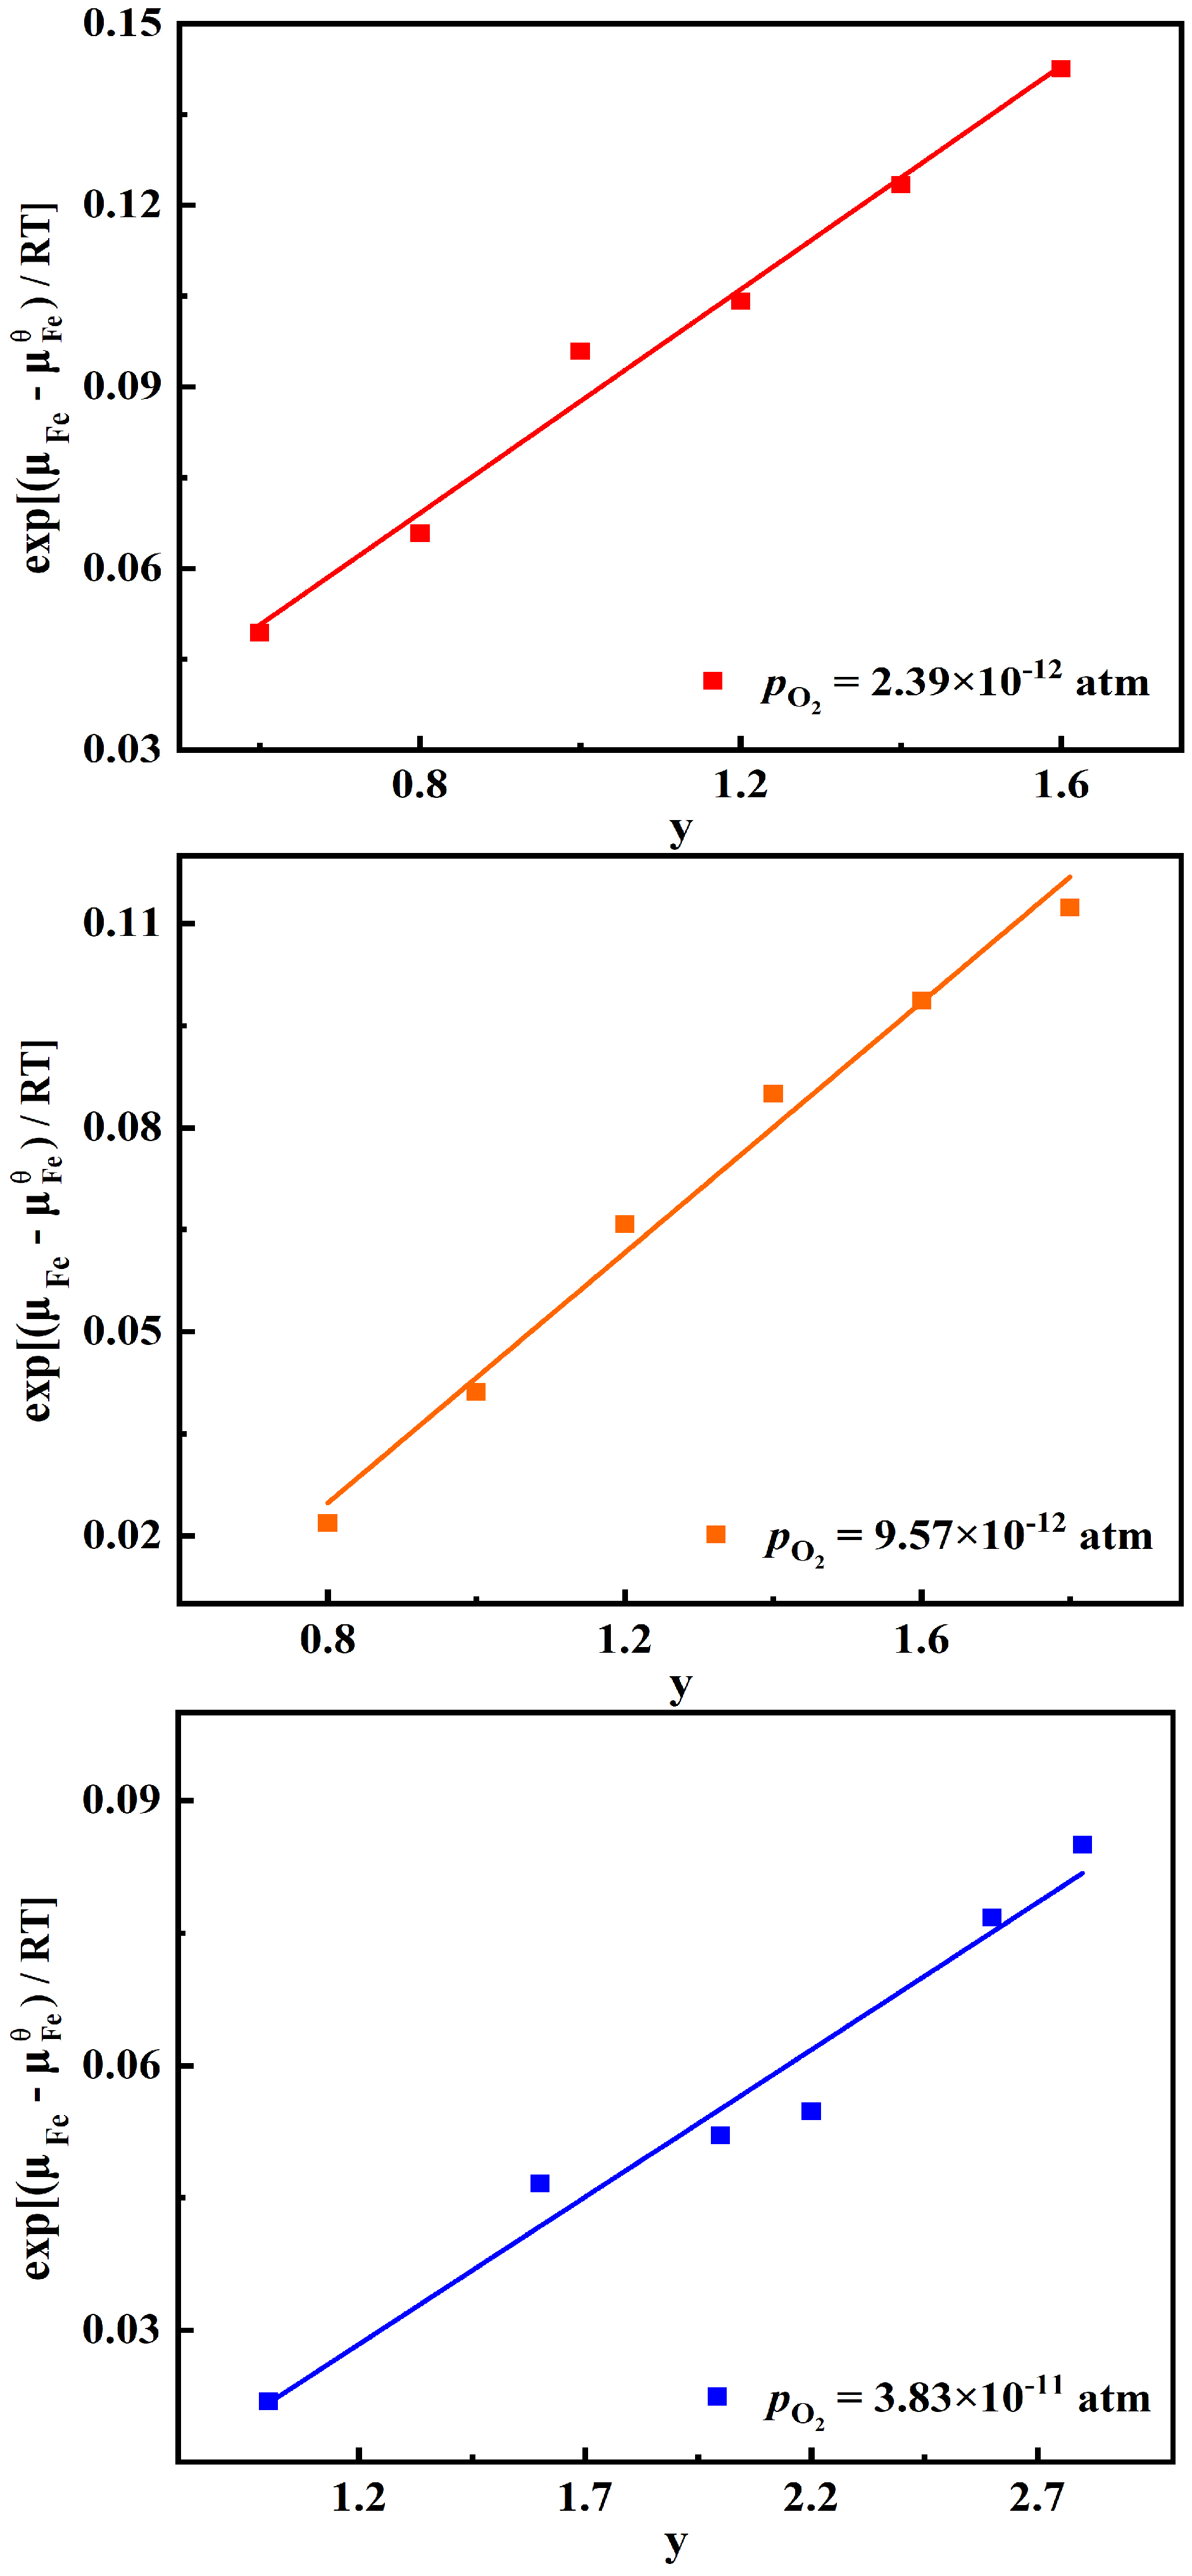
Figure 2.
The changing trend of with Fe/V ratio under different oxygen partial pressures.
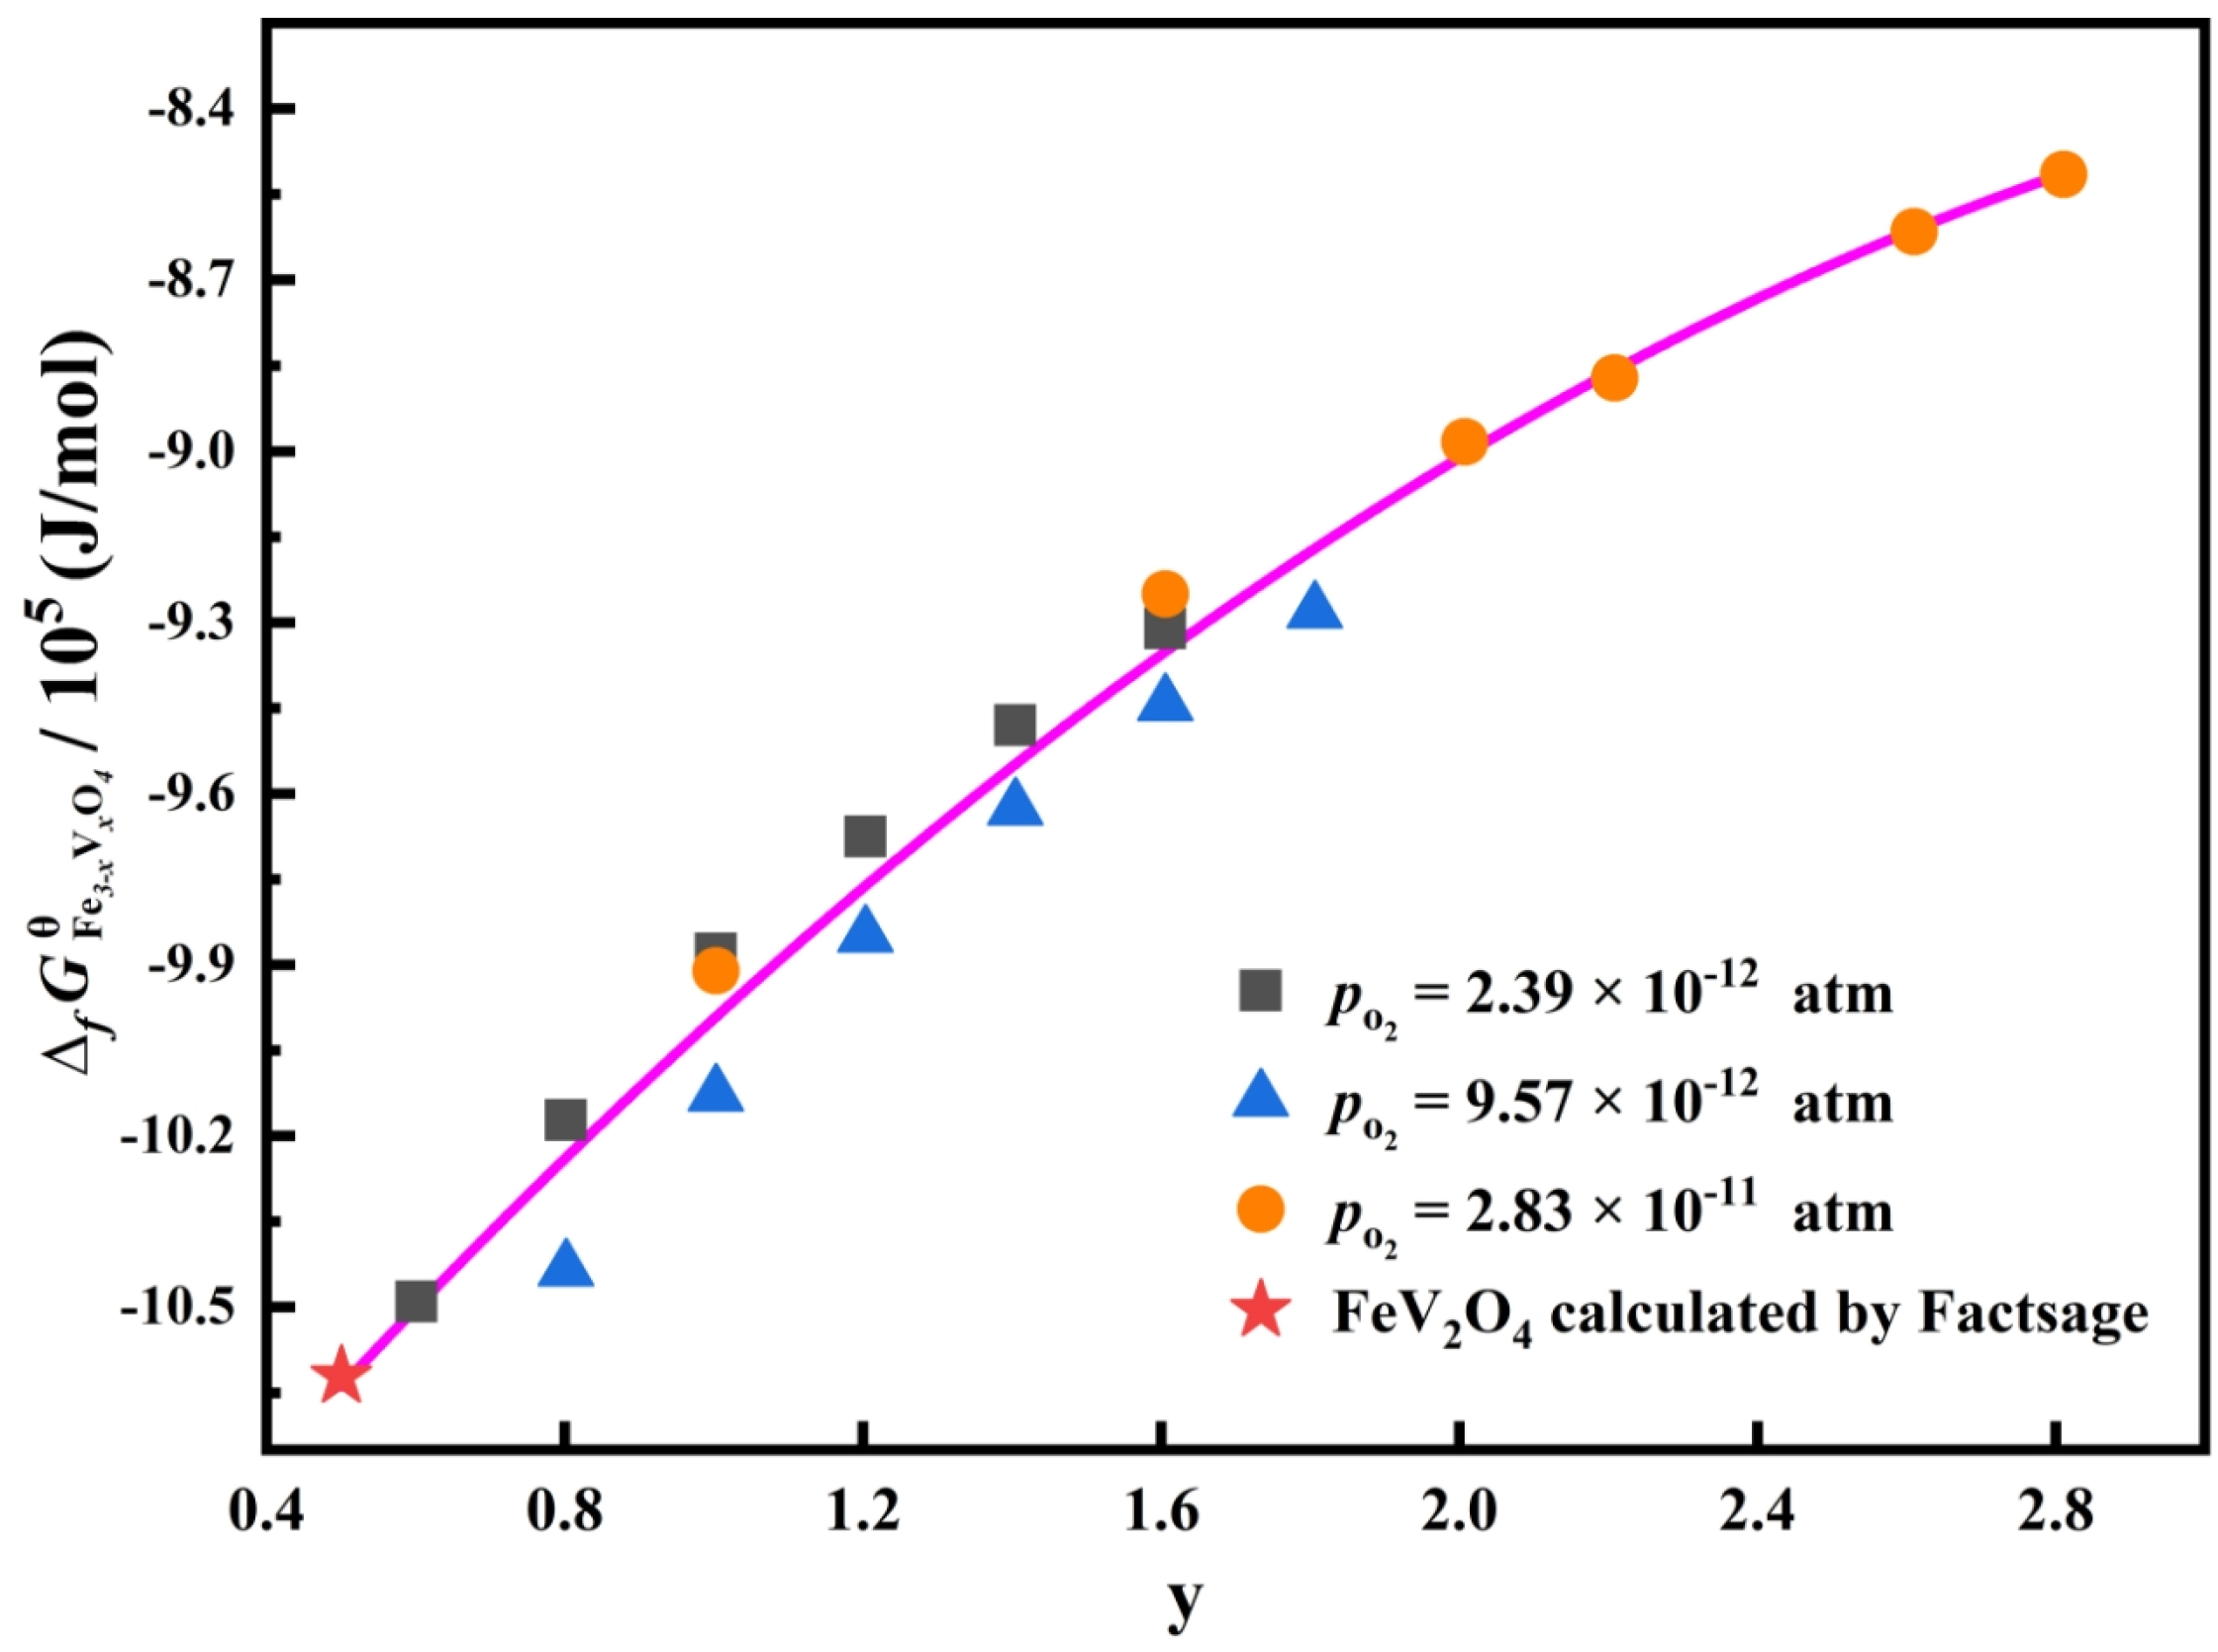
Figure 3.
Comparing the present determined with the model calculating results.

Table 1.
Composition and preparing conditions of Fe3–xVxO4 compounds.
| No. of Samples | Fe/V Molar Ratio | Volume Ratio of CO to CO2 | Oxygen Partial Pressure (atm) |
|---|---|---|---|
| 1-1 | 1.6 | 2 | 2.39 × 10⁻¹² |
| 1-2 | 1.4 | ||
| 1-3 | 1.2 | ||
| 1-4 | 1.0 | ||
| 1-5 | 0.8 | ||
| 1-6 | 0.6 | ||
| 2-1 | 1.8 | 1 | 9.57 × 10⁻¹² |
| 2-2 | 1.6 | ||
| 2-3 | 1.4 | ||
| 2-4 | 1.2 | ||
| 2-5 | 1.0 | ||
| 2-6 | 0.8 | ||
| 3-1 | 2.8 | 0.5 | 3.83 × 10⁻¹¹ |
| 3-2 | 2.6 | ||
| 3-3 | 2.2 | ||
| 3-4 | 2.0 | ||
| 3-5 | 1.6 | ||
| 3-6 | 1.0 |
Table 2.
Compositional limitations of Fe3–xVxO4 single-phase area.
| Oxygen Partial Pressure | Compositional Limitations | |
|---|---|---|
| 2.39 × 10⁻¹² | 0.524 | 1.604 |
| 9.57 × 10⁻¹² | 0.565 | 2.300 |
| 3.83 × 10⁻¹¹ | 0.567 | 3.098 |
Table 3.
The equilibrating experimental conditions and the related results.
| Equilibrating Experimental Conditions | Results | ||||
|---|---|---|---|---|---|
| No. | Mass % of Fe in Cu | (J/mol) | |||
| 1-1 | 1.6 | 2.39 × 10⁻¹² | 0.52 | 0.0059 | −23,861.3 |
| 1-2 | 1.4 | 0.45 | 0.0051 | −25,630.8 | |
| 1-3 | 1.2 | 0.38 | 0.0043 | −27,700.2 | |
| 1-4 | 1.0 | 0.35 | 0.0040 | −28,706.8 | |
| 1-5 | 0.8 | 0.24 | 0.0027 | −33,325.5 | |
| 1-6 | 0.6 | 0.18 | 0.0020 | −36,847.6 | |
| 2-1 | 1.8 | 9.57 × 10⁻¹² | 0.41 | 0.0047 | −26,770.1 |
| 2-2 | 1.6 | 0.36 | 0.0041 | −28,362.0 | |
| 2-3 | 1.4 | 0.31 | 0.0035 | −30,192.4 | |
| 2-4 | 1.2 | 0.24 | 0.0027 | −33,325.5 | |
| 2-5 | 1.0 | 0.15 | 0.0017 | −39,079.9 | |
| 2-6 | 0.8 | 0.08 | 0.0009 | −46,777.0 | |
| 3-1 | 2.8 | 3.83 × 10⁻¹¹ | 0.31 | 0.0035 | −30,192.4 |
| 3-2 | 2.6 | 0.28 | 0.0032 | −31,438.4 | |
| 3-3 | 2.2 | 0.20 | 0.0023 | −35,557.6 | |
| 3-4 | 2.0 | 0.19 | 0.0022 | −36,185.6 | |
| 3-5 | 1.6 | 0.17 | 0.0019 | −37,547.4 | |
| 3-6 | 1.0 | 0.08 | 0.0009 | −46,777.0 | |
is the molar ratio of Fe to V in Fe3–xVxO4.
Table 4.
The functional relations between and y at different oxygen partial pressure.
| 2.39 × 10⁻¹² | |
| 9.57 × 10⁻¹² | 𝜇𝐹𝑒 = 𝜇𝐹𝑒𝜃 + 𝑅𝑇𝑙𝑛 − 0.0488 + 0.092𝑦 |
| 3.83 × 10⁻¹¹ |
Table 5.
The derived as well as the measured in Fe3–xVxO4 compounds.
| Equilibrating Experimental Conditions | Results | |||
|---|---|---|---|---|
| No. | (J/mol) | (J/mol) | ||
| 1-1 | 1.6 | 2.39 × 10⁻¹² | −23,861.3 | −200,496.5 |
| 1-2 | 1.4 | −25,630.8 | −197,958.8 | |
| 1-3 | 1.2 | −27,700.2 | −195,406.8 | |
| 1-4 | 1.0 | −28,706.8 | −192,835.2 | |
| 1-5 | 0.8 | −33,325.5 | −190,234.6 | |
| 1-6 | 0.6 | −36,847.6 | −187,586.3 | |
| 2-1 | 1.8 | 9.57 × 10⁻¹² | −26,770.1 | −237,836.0 |
| 2-2 | 1.6 | −28,362.0 | −234,273.1 | |
| 2-3 | 1.4 | −30,192.4 | −230,479.1 | |
| 2-4 | 1.2 | −33,325.5 | −226,331.9 | |
| 2-5 | 1.0 | −39,079.9 | −221,577.7 | |
| 2-6 | 0.8 | −46,777.0 | −215,523.2 | |
| 3-1 | 2.8 | 3.83 × 10⁻¹¹ | −30,192.4 | −249,849.2 |
| 3-2 | 2.6 | −31,438.4 | −247,033.0 | |
| 3-3 | 2.2 | −35,557.6 | −241,291.1 | |
| 3-4 | 2.0 | −36,185.6 | −238,348.9 | |
| 3-5 | 1.6 | −37,547.4 | −232,253.9 | |
| 3-6 | 1.0 | −46,777.0 | −222,086.1 | |
is the molar ratio of Fe to V in Fe3-xVxO4.
Table 6.
The standard Gibbs energy of formation of Fe3–xVxO4.
| No. | |||
|---|---|---|---|
| 1-1 | 1.6 | 2.39 × 10⁻¹² | −930,820.9 |
| 1-2 | 1.4 | −947,729.6 | |
| 1-3 | 1.2 | −967,218.6 | |
| 1-4 | 1.0 | −987,740.2 | |
| 1-5 | 0.8 | −1,016,918.9 | |
| 1-6 | 0.6 | −1,048,605.1 | |
| 2-1 | 1.8 | 9.57 × 10⁻¹² | −927,899.3 |
| 2-2 | 1.6 | −944,122.7 | |
| 2-3 | 1.4 | −962,382.6 | |
| 2-4 | 1.2 | −984,614.1 | |
| 2-5 | 1.0 | −1,012,433.4 | |
| 2-6 | 0.8 | −1,043,021.7 | |
| 3-1 | 2.8 | 3.83 × 10⁻¹¹ | −851,470.1 |
| 3-2 | 2.6 | −861,457.0 | |
| 3-3 | 2.2 | −887,027.6 | |
| 3-4 | 2.0 | −898,199.8 | |
| 3-5 | 1.6 | −924,783.2 | |
| 3-6 | 1.0 | −990,774.3 |
is the molar ratio of Fe to V in Fe3-xVxO4.
Disclaimer/Publisher’s Note: The statements, opinions and data contained in all publications are solely those of the individual author(s) and contributor(s) and not of MDPI and/or the editor(s). MDPI and/or the editor(s) disclaim responsibility for any injury to people or property resulting from any ideas, methods, instructions or products referred to in the content. |
© 2023 by the authors. Licensee MDPI, Basel, Switzerland. This article is an open access article distributed under the terms and conditions of the Creative Commons Attribution (CC BY) license (https://creativecommons.org/licenses/by/4.0/).
Share and Cite
MDPI and ACS Style
Miao, Q.; Li, M.; Yan, B. Experimental Determination of the Standard Gibbs Energy of Formation of Fe3–xVxO4 at 1473 K. Metals 2023, 13, 1498. https://doi.org/10.3390/met13081498
AMA Style
Miao Q, Li M, Yan B. Experimental Determination of the Standard Gibbs Energy of Formation of Fe3–xVxO4 at 1473 K. Metals. 2023; 13(8):1498. https://doi.org/10.3390/met13081498
Chicago/Turabian StyleMiao, Qingdong, Ming Li, and Baijun Yan. 2023. "Experimental Determination of the Standard Gibbs Energy of Formation of Fe3–xVxO4 at 1473 K" Metals 13, no. 8: 1498. https://doi.org/10.3390/met13081498
Note that from the first issue of 2016, this journal uses article numbers instead of page numbers. See further details here.