Article

Insight into the Influence of Alloying Elements on the Elastic Properties and Strengthening of Copper: A High-Throughput First-Principles Calculations

1
School of Materials Science and Engineering, Henan University of Science and Technology, Luoyang 471023, China
2
Provincial and Ministerial Co-Construction of Collaborative Innovation Center for Non-Ferrous Metal New Materials and Advanced Processing Technology, Henan University of Science and Technology, Luoyang 471023, China
3
School of Physics and Engineering, Henan University of Science and Technology, Luoyang 471023, China
*
Author to whom correspondence should be addressed.
These authors contributed equally to this work.
Metals 2023, 13(5), 875; https://doi.org/10.3390/met13050875
Submission received: 29 March 2023 / Revised: 25 April 2023 / Accepted: 30 April 2023 / Published: 1 May 2023
(This article belongs to the Section Computation and Simulation on Metals)

Abstract

:
In this work, using the high-throughput density functional theory calculation method, the influence of 36 alloying elements on the elastic properties of FCC-Cu was systematically studied, and based on the Labusch model, a linear relationship was fitted between the composition and lattice parameters, and the shear modulus. The solid solution strengthening behavior brought about by alloying was studied quantitatively. The results showed that most alloying elements have solid solution potentiality in copper. The change in the elastic modulus and the strengthening effect of alloying on solid solutions were determined by the elements’ positions in the periodic table. In the same period, the alloying elements located in the middle of the period tended to enhance the elastic modulus of copper, while the elements located at both ends have greater solid solution strengthening ability. The predicted results are in good agreement with the experimental values, which provide theoretical guidance for the design of high-performance copper alloys.

1. Introduction

Copper and Copper alloys, favored for their excellent mechanical properties and high electrical conductivity, are critical materials in the automotive industry, aerospace, and integrated circuits [1,2,3,4,5,6,7,8,9]. To enhance the comprehensive performance of copper alloys, some alloying elements are usually added, such as Al [10], Ti [11], Fe [12], Zr [13], Cr [14], and Mg [15]. The effectiveness of alloying is influenced by several factors, such as the second phase, grain refinement, and solid-solution strengthening (SSS); the former two can be explained using the Hall–Petch and Orowan mechanisms. However, the SSS effect of different alloying elements in Cu-based alloys still needs to be clarified and systematically studied.
At present, people have undertaken extensive work on the quantitative evaluation of the SSS effect, and the research shows that the SSS of materials is the result of solute and dislocation interactions. As dislocations move through the crystal, additional shear stress is required to break through this barrier to continue plastic deformation [16,17]. The theory of solid solution strengthening can be roughly divided into strong and weak pinning models. Friedel and Fleischer [18] proposed the strong pinning model, which regards the solute as a single-point barrier for dislocation bending, and the barrier can only be broken through when there is a sufficient external force. Furthermore, Labusch’s weak pinning model also considers the random distribution of solutes [19]. The quantification of the SSS effect requires reliable composition-related material property parameters, and experimental measurements are usually expensive and cumbersome. Fortunately, with the advancement of computation power, the first principles based on density functional theory have been widely used. For example, Tokuteru et al. [20] systematically evaluated the strengthening ability of 55 alloying elements to FCC-Al, Yasi et al. [21] assessed the capacity of 29 different solutes to strengthen Mg-based alloys, and Hu et al. [22] studied the finite temperature elastic properties of 19 W-based alloys. However, studies on the impact of alloying elements on copper’s performance parameters typically concentrate on different performance parameters, and the SSS effect of copper alloys has not yet been systematically evaluated. To guide the design of copper-based alloys, the effects of alloying elements on the mechanical properties of copper need to be thoroughly investigated.
This work carried out automatic high-throughput calculations for 36 solid solutions composed of different alloy elements and copper in periods 2 to 6 of the element periodic table. By fitting the equation of state, the lattice constants of the solid solutions with various components were determined, and then the elastic properties were calculated. Finally, based on the Labusch model, the strengthening ability of these alloy elements was quantitatively assessed, and the predicted results were close to the experiments. The research provides the basis and guidance for the design strategy of high-performance copper alloys.

2. Computational Details and Theory

The high-throughput calculation process was executed using the MyElas toolkit [23], a framework for automatically executing assigned tasks and processing data. The specific computing flow is shown in Figure 1. The VASP software program was used for all calculations [24,25] using the generalized gradient approximation of GGA-PBE to describe the exchange–correlation energy [26]. Using 480 eV plane wave cut-off energy, the self-consistent energy convergence of electrons is 10−7 ev/atom, and the ion relaxation standard is 0.01 ev/Å. The Monkhorst–Pack [27] k-point grids were 8 × 8 × 8, allowing the volume to change during relaxation. In addition, spin polarization leads to magnetic moments for some atoms (Cr, Mn, Fe, Co, Ni, etc.), for which treatment information can be found in Table S1.
The simulation cell is simulated by a 2 × 2 × 2 supercell with 32 atoms. The random substitution of atoms is realized by the Monte Carlo special quasi-random structure (MCSQS) [28] of the ATAT software package [29], considering 3.125 at.%, 6.25 at.%, 9.375 at.%, and 12.5 at.% four different concentrations. Their crystal structures are shown in Figure S1. The thermodynamic stability of Cu-X simulation cells are evaluated by the enthalpy of mixing, which can be expressed by the following formula [30]:
Δ H m i x i n g ( C u x M y ) = E t o t a l x E a t o m ( C u ) y E a t o m ( M ) x + y
where E t o t a l , E a t o m ( C u ) , and E a t o m ( M ) are the total energies of the simulation cells for the SQS cell, FCC Cu, and solid ground state reference phase of the M solute, respectively.
The exact BM equation of state (EOS) [31] fit was used to obtain the equilibrium lattice constants of the simulation cell, here using 11 energy–volume data points in the range of 0.85–1.15 V0. V0 is the initial volume of the simulation cell, and the EOS form is as follows [32]:
E ( V ) = a + b V 2 / 3 + c V 4 / 3 + d V 2
where a, b, c and d are fitting parameters related to the material’s ground state properties, and V is volume of the simulation cell.
The elastic properties of the FCC-Cu-based alloys were then calculated using the stress-–strain method [33], and the Voigt–Reuss–Hill (VRH) [34] scheme was used to estimate the relevant modulus parameters. FCC-Cu is a cubic crystal system, but for the simulation cell obtained by the SQS method, the solute incorporation affected the symmetry of the system [35], increasing the number of independent elastic constants. To solve the above problem, the correlation components close to zero are ignored, and the correlation elastic parameters are averaged, for example:
C 11 ¯ = ( C 11 + C 22 + C 33 ) 3

3. Results and Discussion

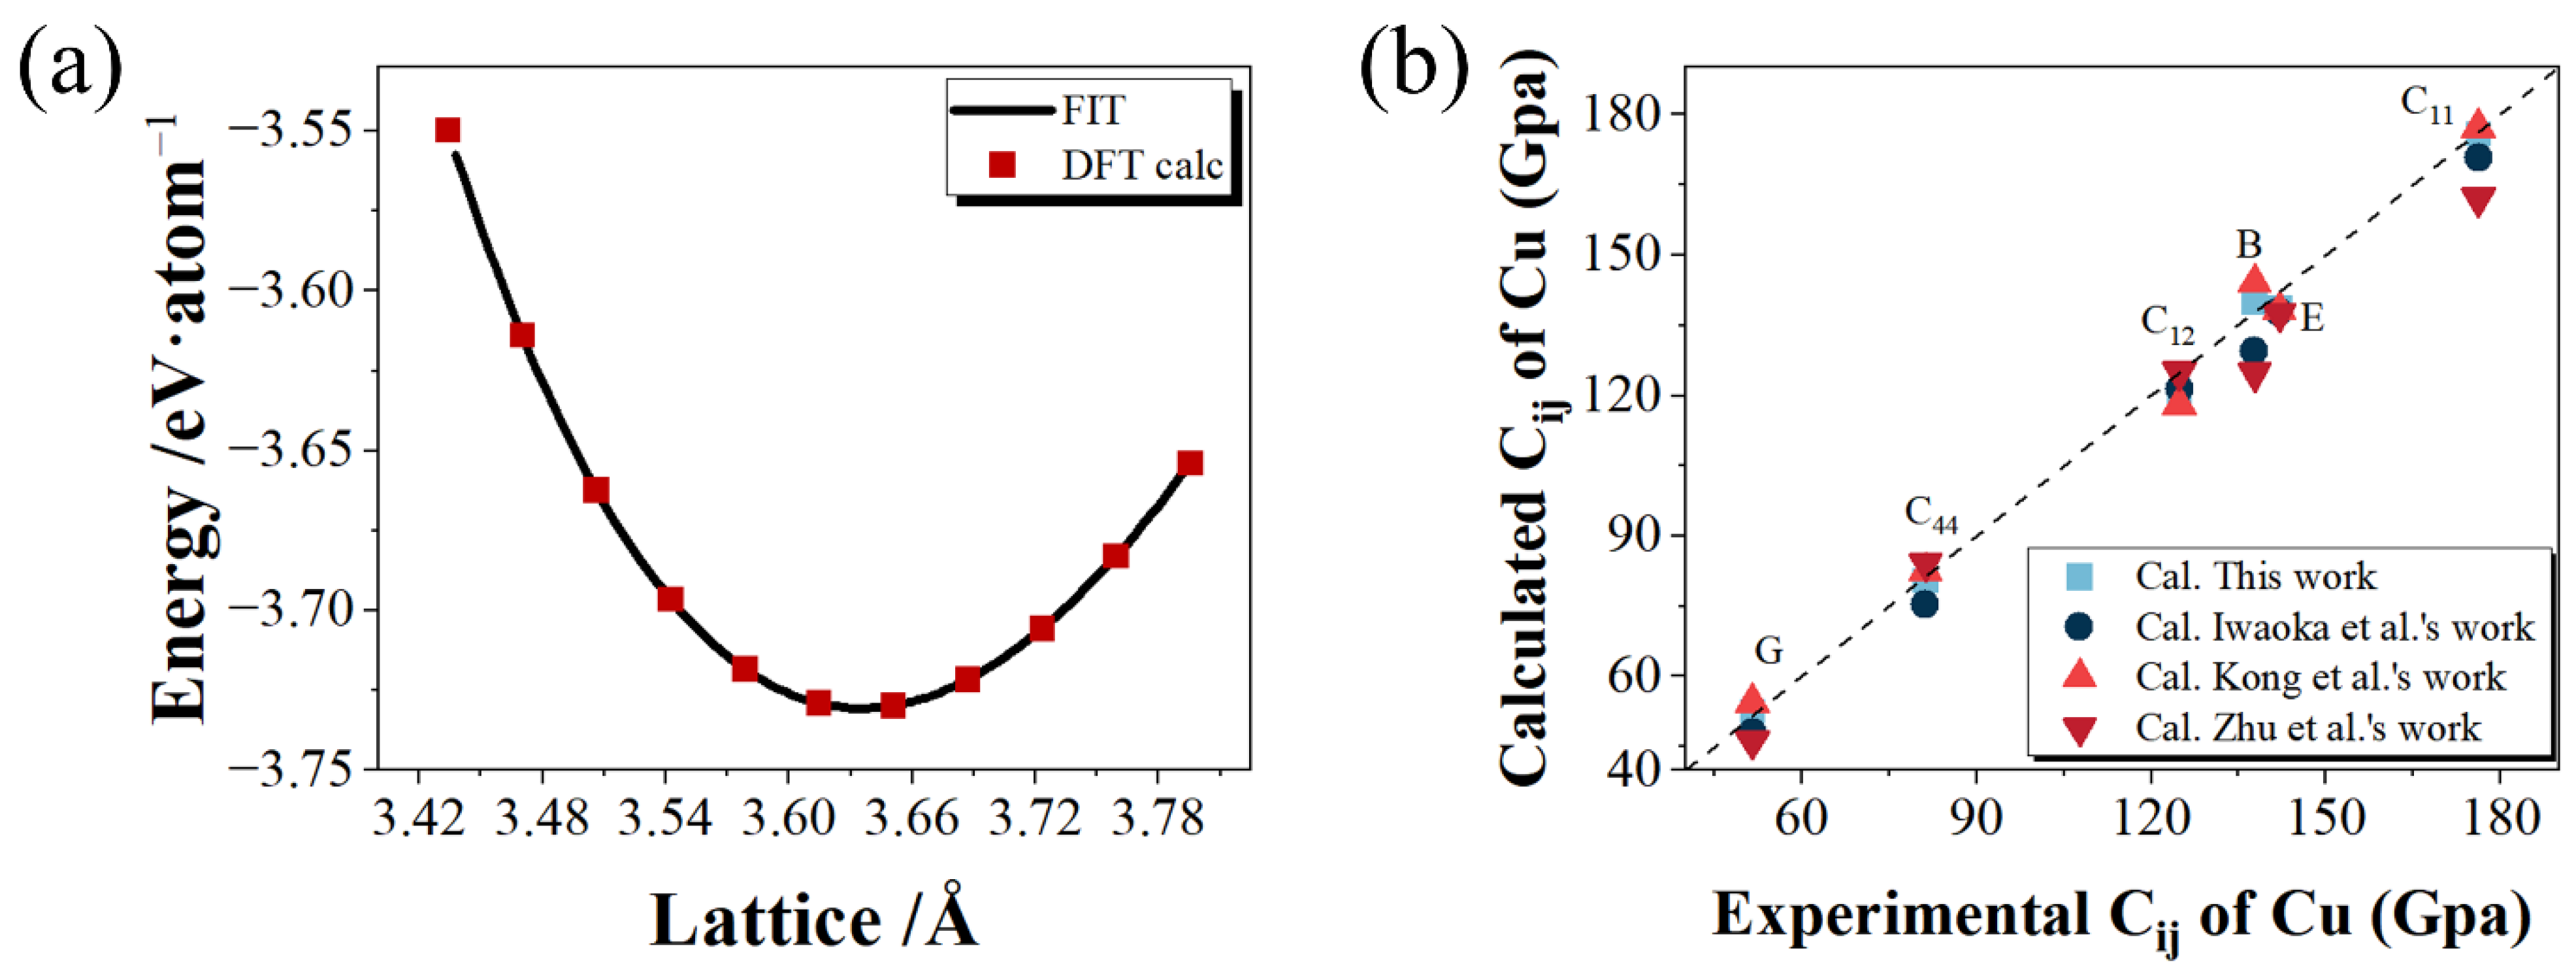
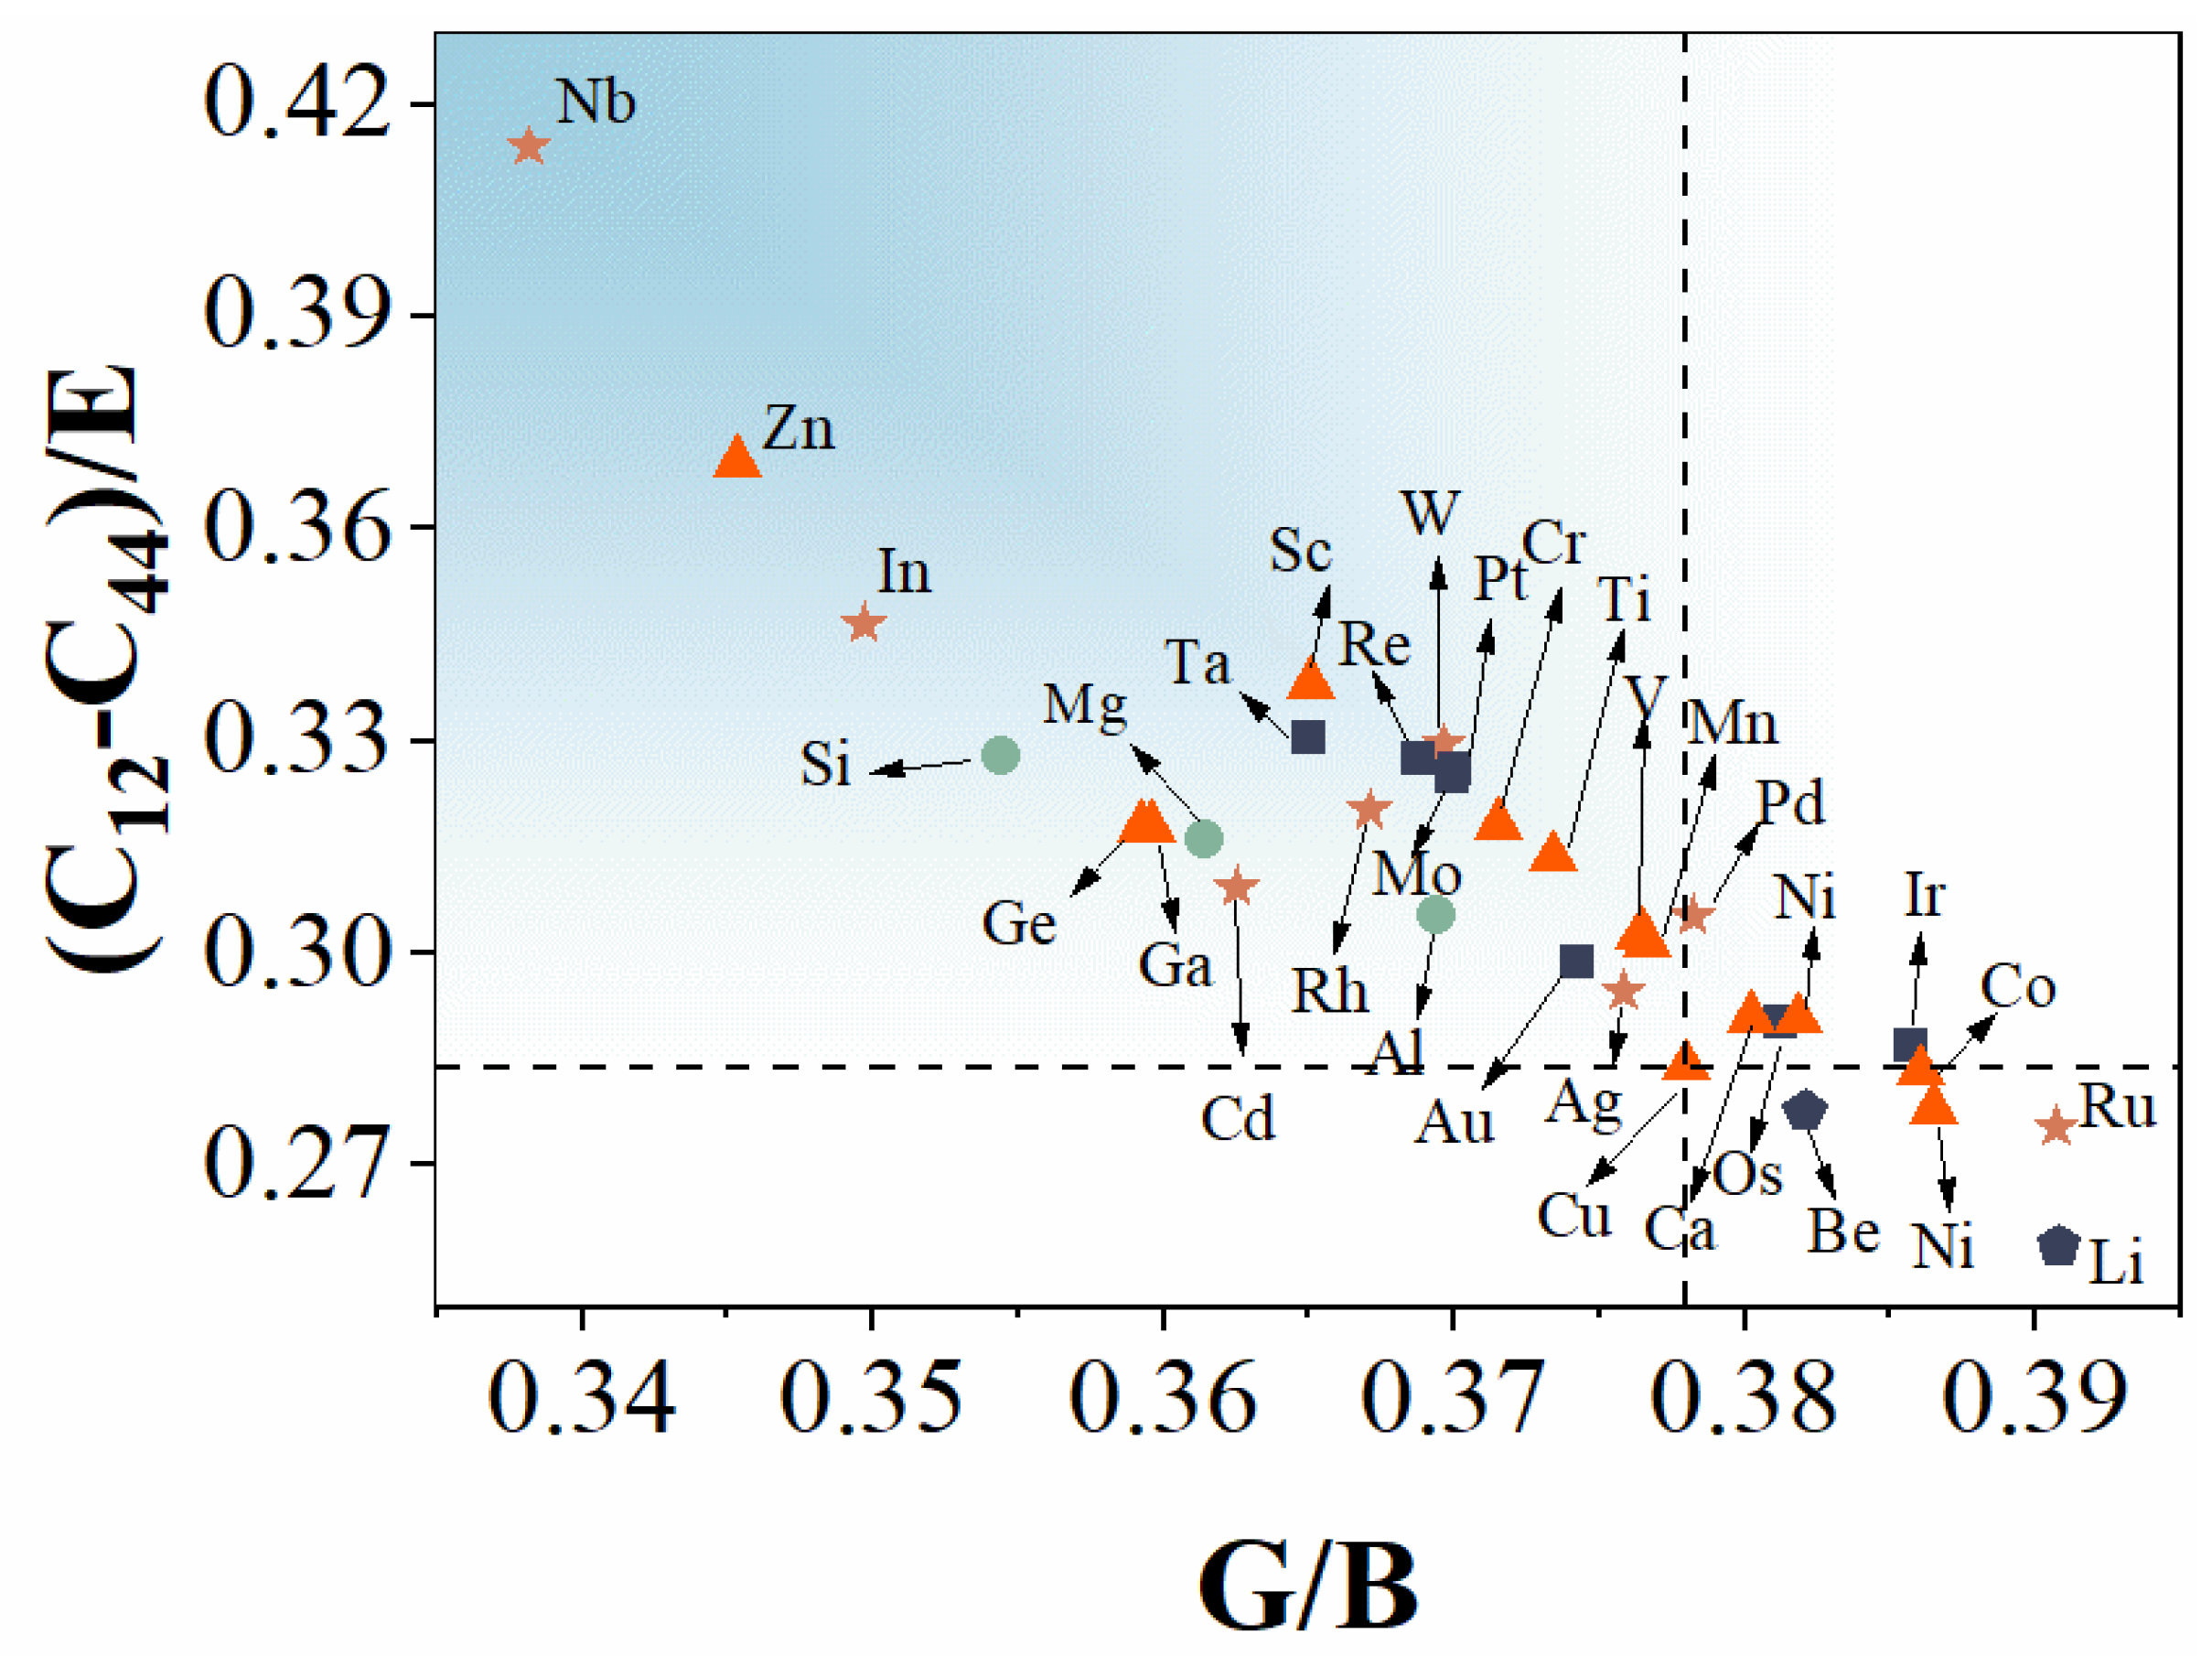
3.1. Elastic Properties

The lattice constant of pure copper calculated in this work was 3.635 Å, and the EOS fitting is shown in Figure 2a. This was 0.56% larger than the experimental value (3.615 Å) [36], which results from the GGA exchange functional overestimating the lattice constant. Figure 2b shows pure copper’s calculated elastic constant and elastic modulus. The abscissa represents the experimental value measured by Overton et al. [37], and the ordinate represents the calculated value of this study and previous reports. Points close to the dotted line indicate that the calculation is close to the theoretical value. As can be seen, the C11, B, reported by Zhu et al. [38] and Iwaoka et al. [39] were slightly smaller than our value, and the C11, B, G of Kong et al. [40] were slightly larger than our value. That is, the value calculated in this work was closer to the experimental value, indicating the calculation method’s reliability.
In order to make the strengthening of the alloy effective, the solid solution needs to meet the stability conditions of thermodynamics and mechanics. Using Born’s criterion [41] which judges the stability of crystal mechanics, the results showed that all the Cu-based solid solutions in this study were mechanically stable. Then, the elastic properties of the 3.125 at.% Cu-based alloys were analyzed. Figure 3 shows the percentage change of B, G, E, B/G, and Poisson’s ratio ( υ ) after alloying. The modulus of elasticity, including bulk modulus for resistance to deformation, shear modulus for resistance to shear deformation, and Young’s modulus related to material stiffness were also examined. It is evident from Figure 3a that the alloying elements of the second and third periods generally tended to reduce the elastic modulus of the Cu matrix. For elements from periods four to six, the elastic modulus was influenced by the position of the solute element on the chemical elements periodic table (PT). The modulus first increases with the atomic number of each period, peaks in groups VIIB and VIII, and then falls. The elements near the two ends of each period tend to lower the Cu matrix’s elastic modulus (the decrease can reach more than 10%), while the elements in the middle of the period generally increase the elastic modulus of the Cu matrix (it can increase by more than 6%). G and E have the same change law, and the change of B is slightly different from that of G and E. Among them, the increase of the bulk modulus after the solid solution of Nb and In deviates from the law of third elements. This value is more prominent than neighboring elements, suggesting that the solute’s intrinsic bulk modulus and electron density also affect the bulk modulus.
The toughness and brittleness of materials in mechanical engineering are critical, so they must be considered. The copper-based alloys with a concentration of 3.125 at.% calculated in this work all showed strong toughness characteristics. Cu-3.125 at.%Ru had the smallest B/G, and its value of 2.56 was greater than the toughness judgment value of 1.75. The smallest Poisson’s ratio was Cu-3.125 at.% Li, which had a value of 0.38, greater than the empirical index of 0.26. Figure 3b shows the v, B/G of the Cu-based solid solution as a percentage change relative to pure copper. Both of these are related to resilience, so there is a strong correlation between the changing trends of the two. For the alloy elements of the fourth to sixth period, the influence on the toughness of the copper matrix shows an apparent periodicity. The elements at both ends of the periodic table generally improve the toughness of the Cu-based alloys. In contrast, the group VIII elements in the middle of the period, such as Fe, Co, Tc, and Ir, reduce the toughness of Cu-based alloys.
The relationship between (C12-C44)/E (the ratio of Cauchy pressure (C12-C44) to E, an indicator used to describe the ductility of the material) and G/B is shown in Figure 4 to more intuitively show the influence of different elements on copper toughness–brittleness. Data points closer to the upper left corner of the graph indicate relatively better ductility, and closer to the lower right corner indicate relatively poor toughness. It was found that after most of the alloying elements were added, the ductility of copper was improved, among which Nb, Zn, In, Si, and Ge had more significant improvement effects, while Li, Ru, and Be induced adverse effects.

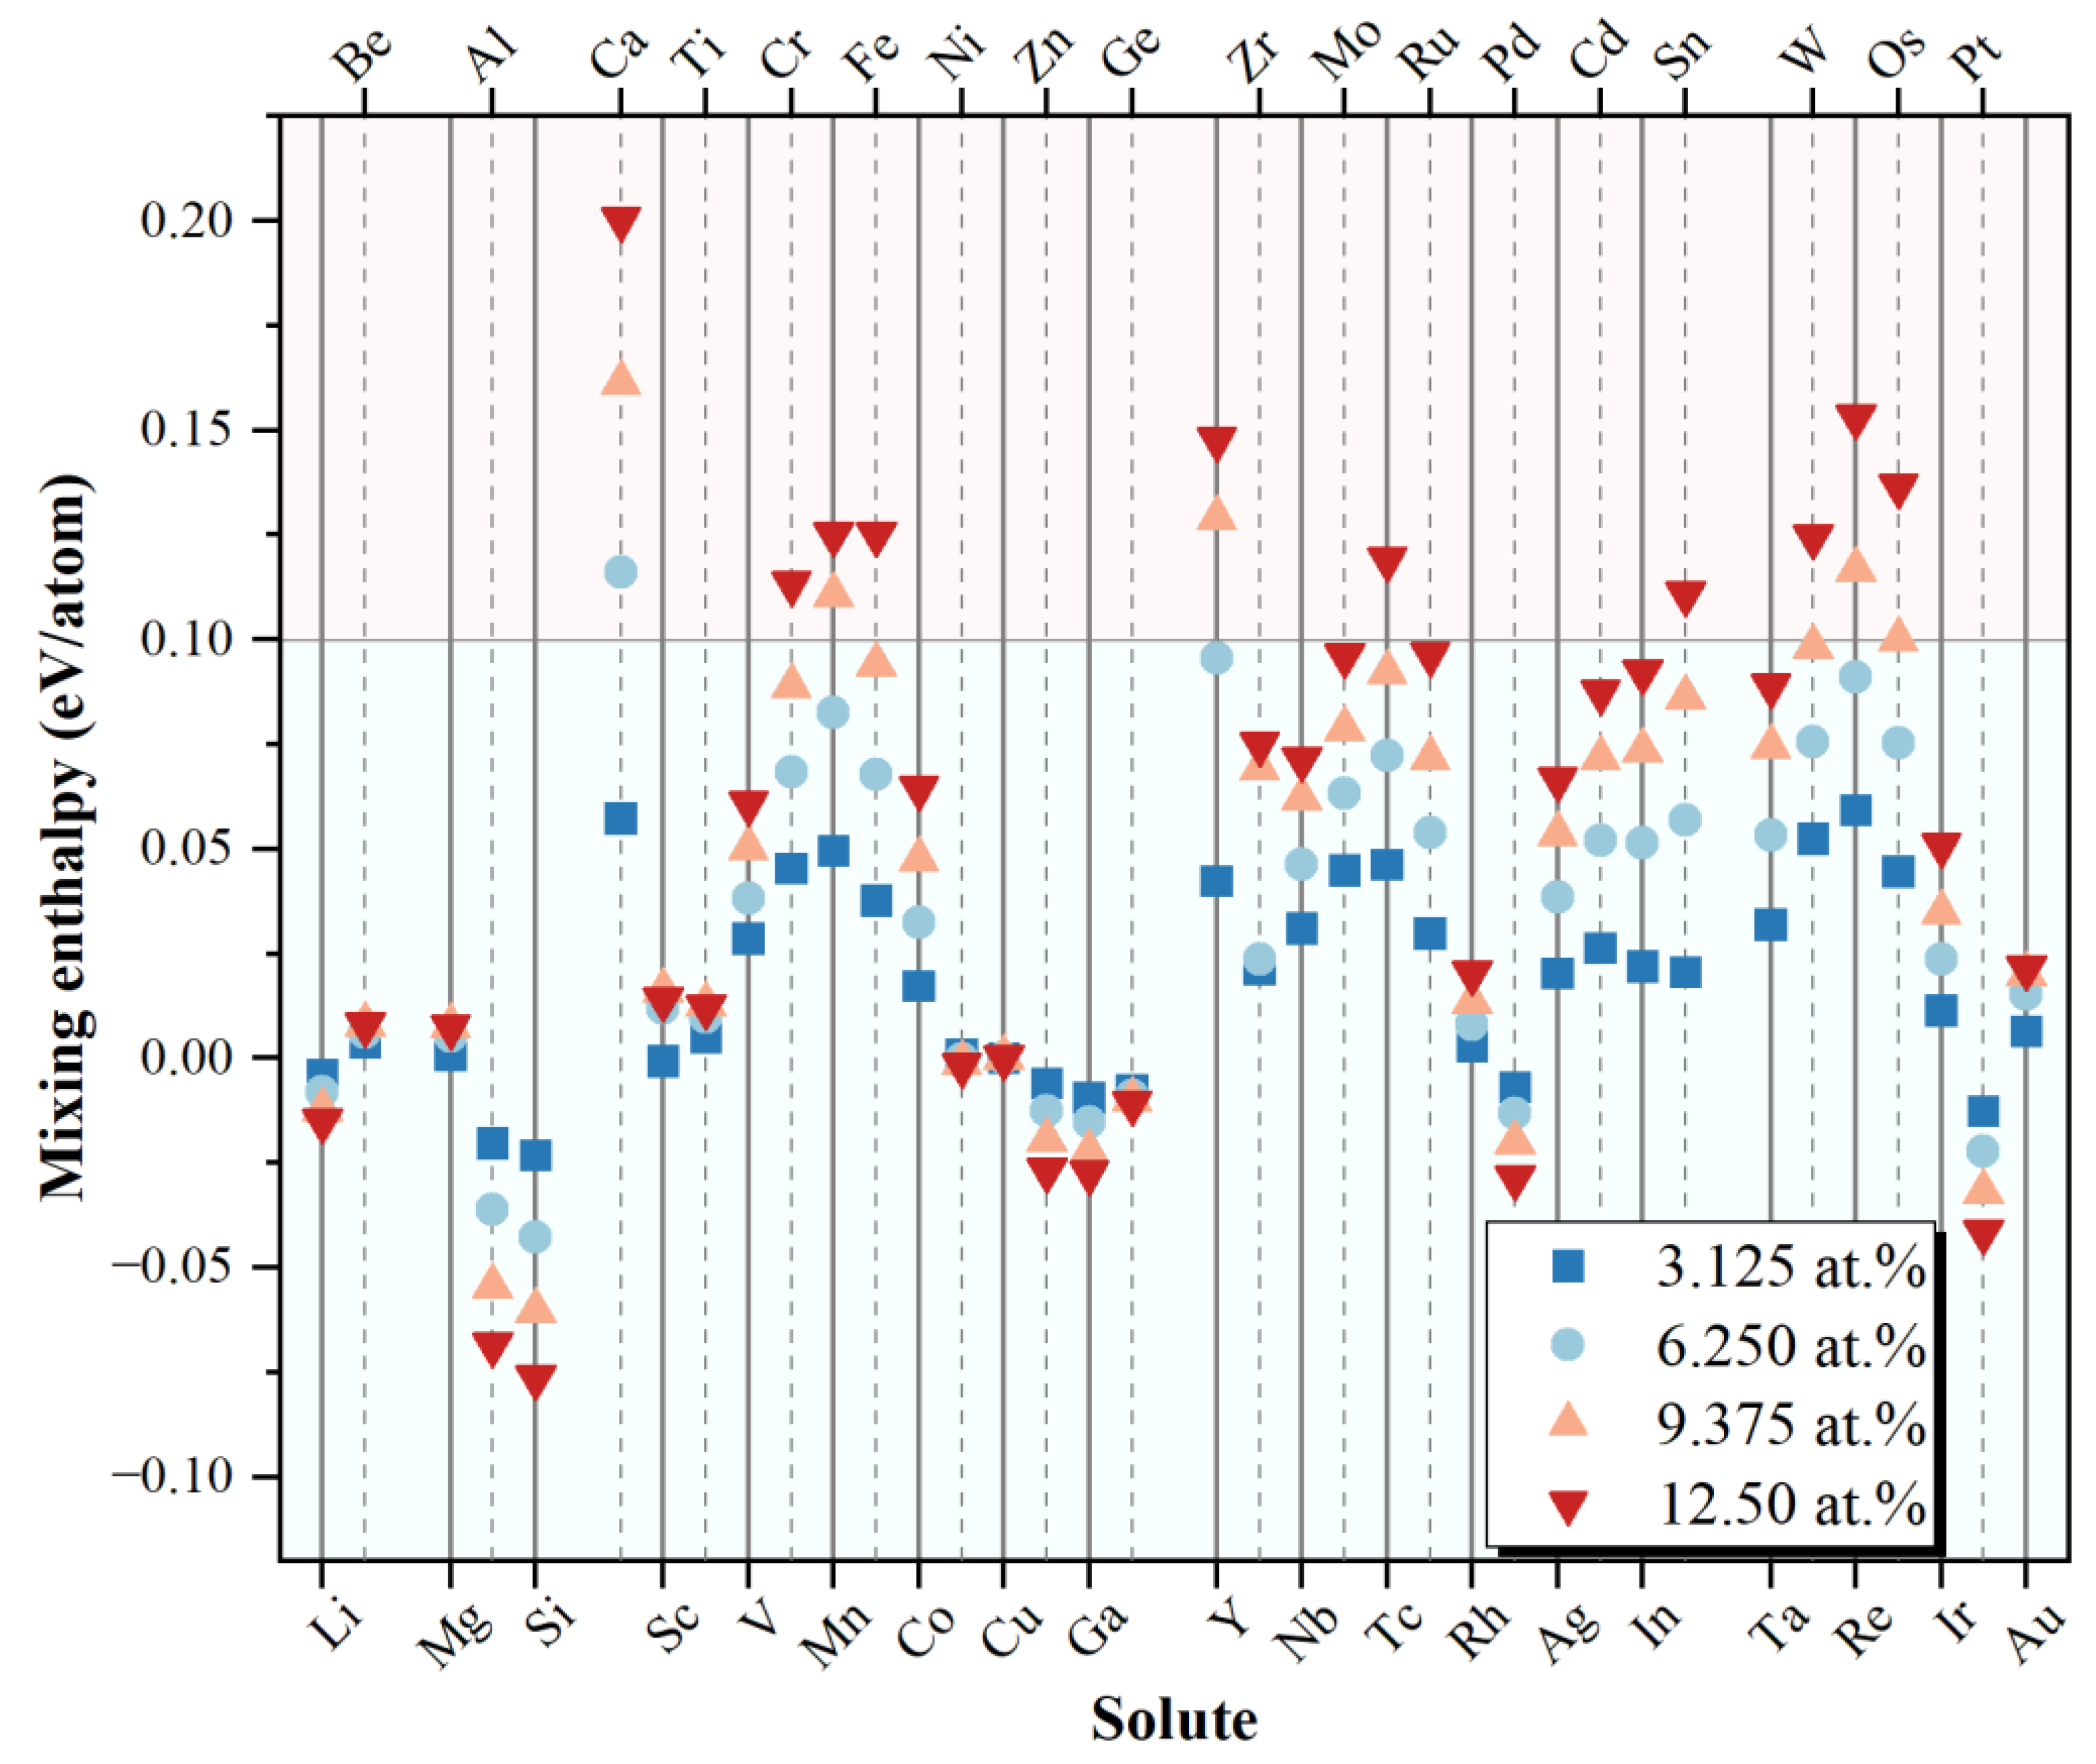
3.2. Stability and Energetics

The mixing enthalpy of four different concentrations of FCC-Cu-based alloys are shown in Figure 5, and the specific values are shown in Table S4. It was found that the mixing enthalpy changes periodically with the position of the atoms in the periodic table. Specifically, in the same period, the difference in electronegativity between the solute and Cu atoms causes the mixing enthalpy to increase initially and then decrease with the increase in atomic number. Among them, Li, Be, Al, Si, Ni, Zn, Ga, Ge, Rh, Pd, Pt, and Au are thermodynamically easier to form solid solutions with Cu. At the same time, the atomic radius difference between the solute and Cu also has a particular influence. For example, Ca has a higher mixing enthalpy in the Cu matrix, possibly due to the more significant difference in atomic radius between them and Cu [42]. Although the enthalpy of mixing represents the tendency to form a solid solution, it cannot fully represent the solubility of elements, which is also affected by temperature and the thermodynamics of competing/coexisting phases that may exist in the binary system [43,44]. For example, the mixing enthalpy of Mn and Cu is relatively high, but from the Cu-Mn phase diagram, Mn can still dissolve in Cu. Furthermore, due to the different reference states of alloying elements, the solid solubility between different elements cannot be compared by the enthalpy of mixing alone. In conclusion, we can regard elements with mixing enthalpy below 0.1 eV/atom as having solid solution potentiality [44]. Therefore, at low concentrations, the majority of the alloying elements in this study have the potential to form solid solutions in the Cu matrix.

3.3. Solid Solution Strengthening

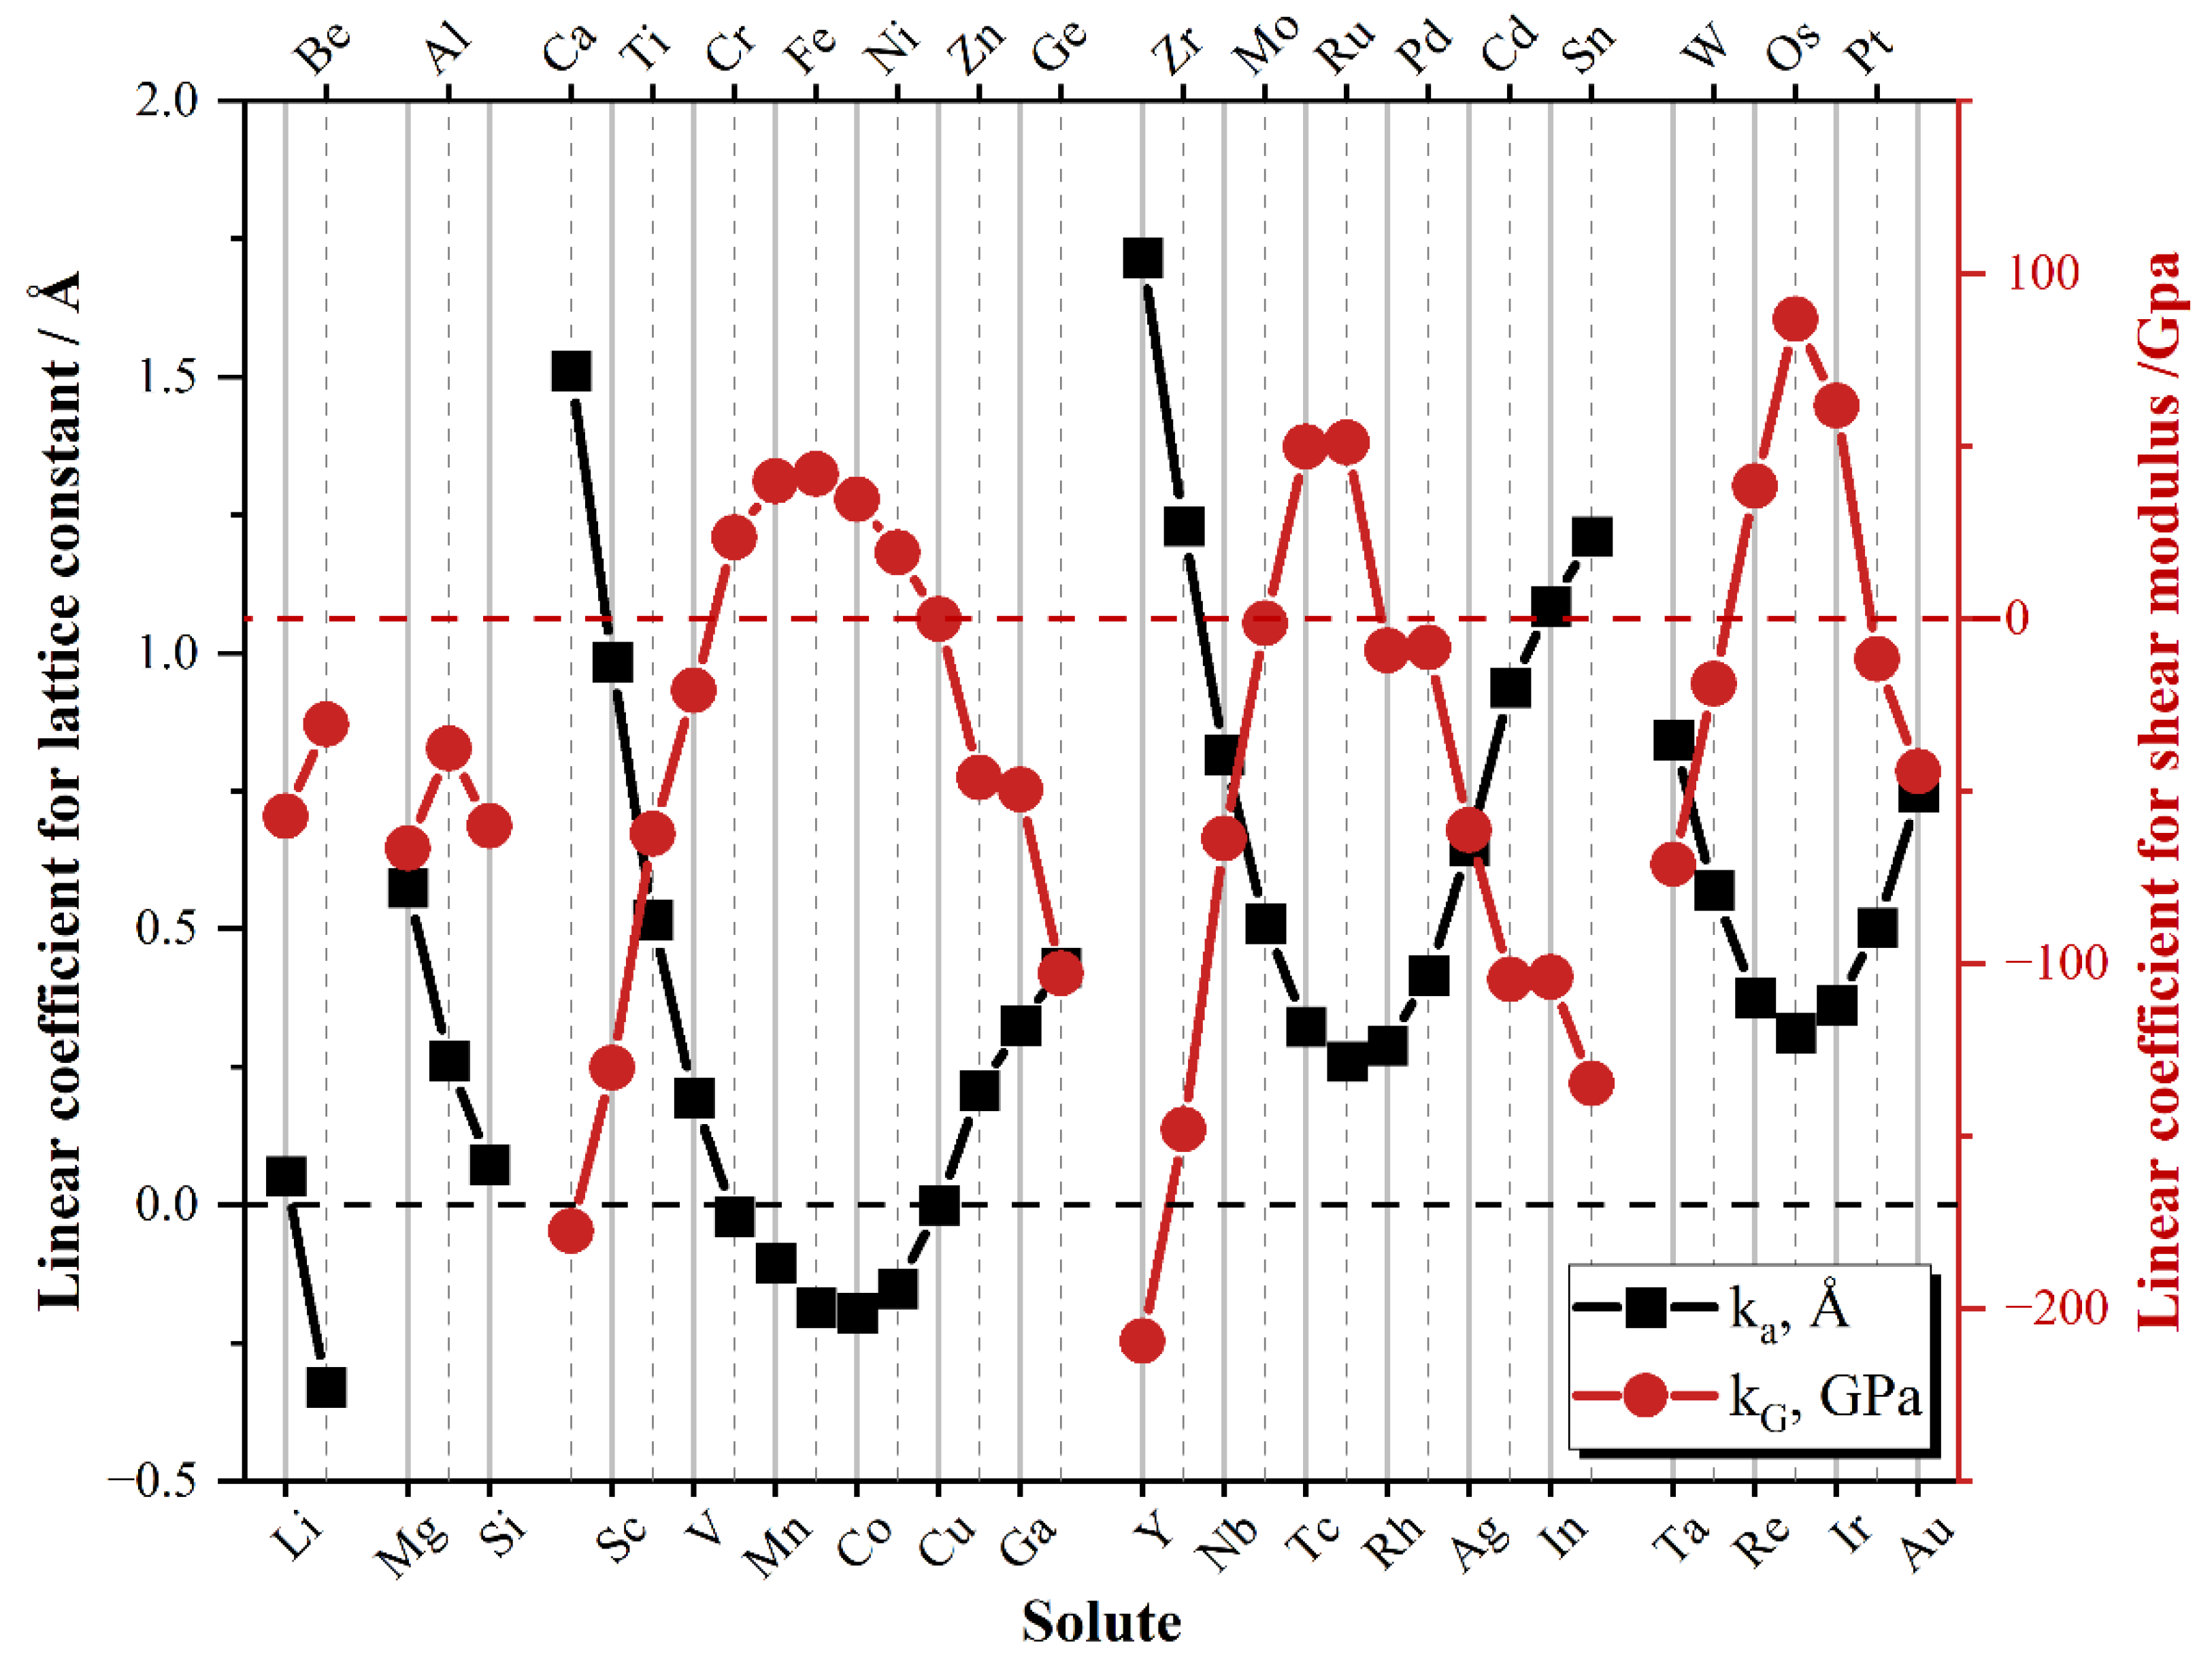
3.3.1. Linear Regression Coefficients of Lattice Parameter Change

Most properties of solid solutions are proportional to the solute concentration at low concentrations. Consequently, the lattice parameters of Cu-based solid solutions also show a linear dependence on their concentration. Here, the relationship between the concentration and lattice parameters is fitted using the following form:
a ( c ) = k a c + a 0
where c is the solute concentration, and a ( c ) and a 0 represent the lattice constants of Cu-X solid solution and pure FCC-Cu, respectively. k a is a parameter that needs to be fitted, and its value represents the mismatching ability of alloying elements to the Cu matrix lattice size. Figure 6b plots the calculation and experimental data of Cu-Al solid solution lattice parameters, where k a = 0.26, correlation coefficient R2 = 0.99, and the linear regression fit is good. The linear trend between the calculated and experimental data [45] is nearly identical.
At the same time, we also provide the Vegard’s law-predicted relationship between the solid solution’s composition and the lattice constant, which is shown in the following formula:
a ( c ) = k a v c + a 0
where k a v = a x a 0 , a x is the lattice constant of the solute x of the FCC structure; their values are listed in Table S5. From Figure 6b, it can be found that the lattice constant of the Cu-Al alloy under Vegard’s law [47] is slightly different from the experiment and calculation, k a v = 0.39, which is about 1.5 times that of k a . This stems from the fact that Vegard’s law is determined by the lattice parameters of pure elements, without a more precise determination through experiments.
Figure 6a shows a linear fit of the lattice constants for Cu-based solid solutions of 36 alloying elements, with the specific values and accuracy of the fit listed in Table S6. It is clear that the value of the linear fit parameter k a depends strongly on the position of the element in PT; for elements with periods four to six, the value of k a decreases and then increases in each period, and the dot line chart presents an upward-opening parabolic feature. This variation is attributed to the size of the atomic radii of the elements in each period, and the trends of the atomic radii of the elements in each period show similar characteristics, which leads to a change in the lattice volume and, thus, in the shift in k a , which is consistent with the well-known transition metal elements’ d-band filling effect [48,49,50]. In addition to this, the vast majority of the 36 alloying elements calculated in this study have positive linear coefficients and only six of them tended to shrink the lattice; the curve of the period tends to move upward as the number of periods increases. The trends of the lattice constants under Vegard’s are almost the same as our calculated k a , but their values are not exactly equal. Figure 6a also gives the variation of k a k a v , and it can be seen that most of the 3d elements match better with both. In contrast, the corresponding k a of 4d and 5d elements is significantly larger, indicating that their interaction with Cu is weaker than that of second to fourth period elements, making their solid solution volume larger.
Figure 6c displays the corresponding k a of some alloying elements calculated in the present work, along with the available experimental data. The majority of the data points in this study are situated close to the diagonal line, indicating that the calculated values and experimental values are well matched.

3.3.2. Linear Regression Coefficients of Shear Modulus Change

We also employed a linear regression model to fit the composition dependence of the shear modulus, similar to what we performed for the fit to the lattice constant. Its form is as follows:
G ¯ ( c ) = k G c + G 0 ¯
where G ¯ ( c ) and G 0 ¯ are the shear moduli of the alloy with a solute concentration of c at.% and FCC-Cu, respectively. k G is the fitted coefficient, which can measure the modulus mismatching ability of the alloying elements to FCC-Cu. Figure 7 shows the fitted shear modulus, the exact values of which can be seen in Table S7. For most Cu-based solid solutions, the fit is good with only a small number of systems deviating slightly from the linear relationship. Similar to before, the value of k G is still related to the position of the element in the PT, and the value of k G generally increases and then decreases in the same period, in contrast to the k a trend. This variation is connected to the solid solution’s volume. The larger the volume, the lower the shear modulus, which is ultimately attributed to the atomic radius of the alloying element. Notably, most alloying elements have a propensity to decrease copper’s shear modulus. When k G is negative, k a is generally positive and vice versa. The exceptions are some elements in the middle of the fifth and sixth periods, such as Tc, Ru, Re, and Os. This should be related to their electronic structure where the formation of the outer nuclear electron cloud is usually influenced by the solute atoms, thus affecting the behavior of the solid solution.

3.3.3. Solid Solution Strengthening Effects

For evaluating the SSS effect of alloying elements, many models have been created [51,52,53]. Considering the degree of agreement with experiments and the simplicity of the process, the widely used Labusch model was used in this work to estimate this effect [54,55,56]. The excess strength ( Δ σ S S S ) obtained from SSS can be expressed as follows:
Δ σ S S S = 3 Z G ε 4 / 3 c 2 / 3
ε = [ ( ε s 1 + 0.5 | ε s | ) 2 + ( β ε b ) 2 ] 1 / 2
ε b = 1 a 0 ( d a   d c ) c = 0 k a a 0
ε s = 1 G 0 ( d G   d c ) c = 0 k G G 0
where Z is the solvent-related constant, G is the shear modulus of Cu, ε is the mismatch coefficient, and β is 16 for edge dislocations and 3 for screw dislocations. ε s and ε b are the lattice and modulus mismatch parameters, respectively.
The mismatch factors of the 36 alloying elements for Cu-based solid solutions are shown in Figure 8, and the obtained excess strength ( Δ σ S S S ) is shown in Figure S2. Edge dislocations typically have a stronger strengthening effect than screw dislocations, and both are periodic. For alloying elements in the fourth to sixth periods, the mismatch factor first decreases and then increases. Alloying elements near both ends of the same period have a stronger strengthening ability. Elements with similar positions to Cu in PT, such as Co, Ni, and Ga, do not have a particularly strong strengthening ability due to their electronegativity and atomic radius being close to that of copper.
To further understand the strengthening effect of alloying elements, this effect was assessed using the critical resolved shear stress ( Δ C R S S ) [57], which the following equation can express [58,59]:
τ = Δ σ S S S e m k B T / W 0
This equation is generally applied beneath 1/3 of the absolute melting point [60], where m is related to the crystal deformation rate, usually close to 25. k B is the Boltzmann constant, T is the absolute temperature, and W 0 represents the binding energy of the solute atoms with the dislocation segment of the edge.
Here, we evaluated the strengthening potential of 1.at % solute content at 300 K, W 0 in Equation (11) is estimated to be 1.2 × 10⁻¹⁹ J, the parameter Z in the Equation (7) is obtained according to the fitting of the calculation result and the experimental data [61], and the value is 1/2380. As shown in Figure 9, similar to the mismatching ability of elements, the strengthening ability of elements at both ends of the same period is stronger. It is worth mentioning that the high-performance copper alloy Zr, Cd, Sn, and Ag elements commonly used in copper alloys have great strengthening potential, and their strengthening effect on copper alloys has been verified. In addition, although the solid solution potential of Mn, Ni, and Zn is not outstanding, they are widely used because of their high solubility in copper and the ability to strengthen copper in other mechanisms.
Furthermore, we selected the Δ C R S S corresponding to three highly soluble solutes and compared them with the experimental values [61,62,63]. As shown in Figure 10, the horizontal coordinates are the calculated values, and the vertical coordinates are the experimental values. The data points are close to the diagonal line at different contents and temperatures and are in good agreement. This verifies the accuracy of the current calculation.

4. Conclusions

In this study, a high-throughput first-principle calculation process was used to systematically study the mixing enthalpy and elastic properties of 36 binary Cu-based alloys. The SSS effect of alloying elements was quantitatively evaluated based on Labusch theory. The following main conclusions can be drawn:
(1)
The mixing enthalpy shows that most alloying elements can dissolve in copper at low concentrations, among which Li, Be, Al, Si, Ni, Zn, Ga, Ge, Rh, Pd, Pt, and Au are more thermodynamically favorable. The Born criterion states that all solid solution structures are mechanically stable.
(2)
The position of the alloying element in the periodic table of chemical elements determines the variation of the modulus of elasticity. For alloying elements of fourth to sixth periods, the modulus changes in a parabolic pattern within each period.
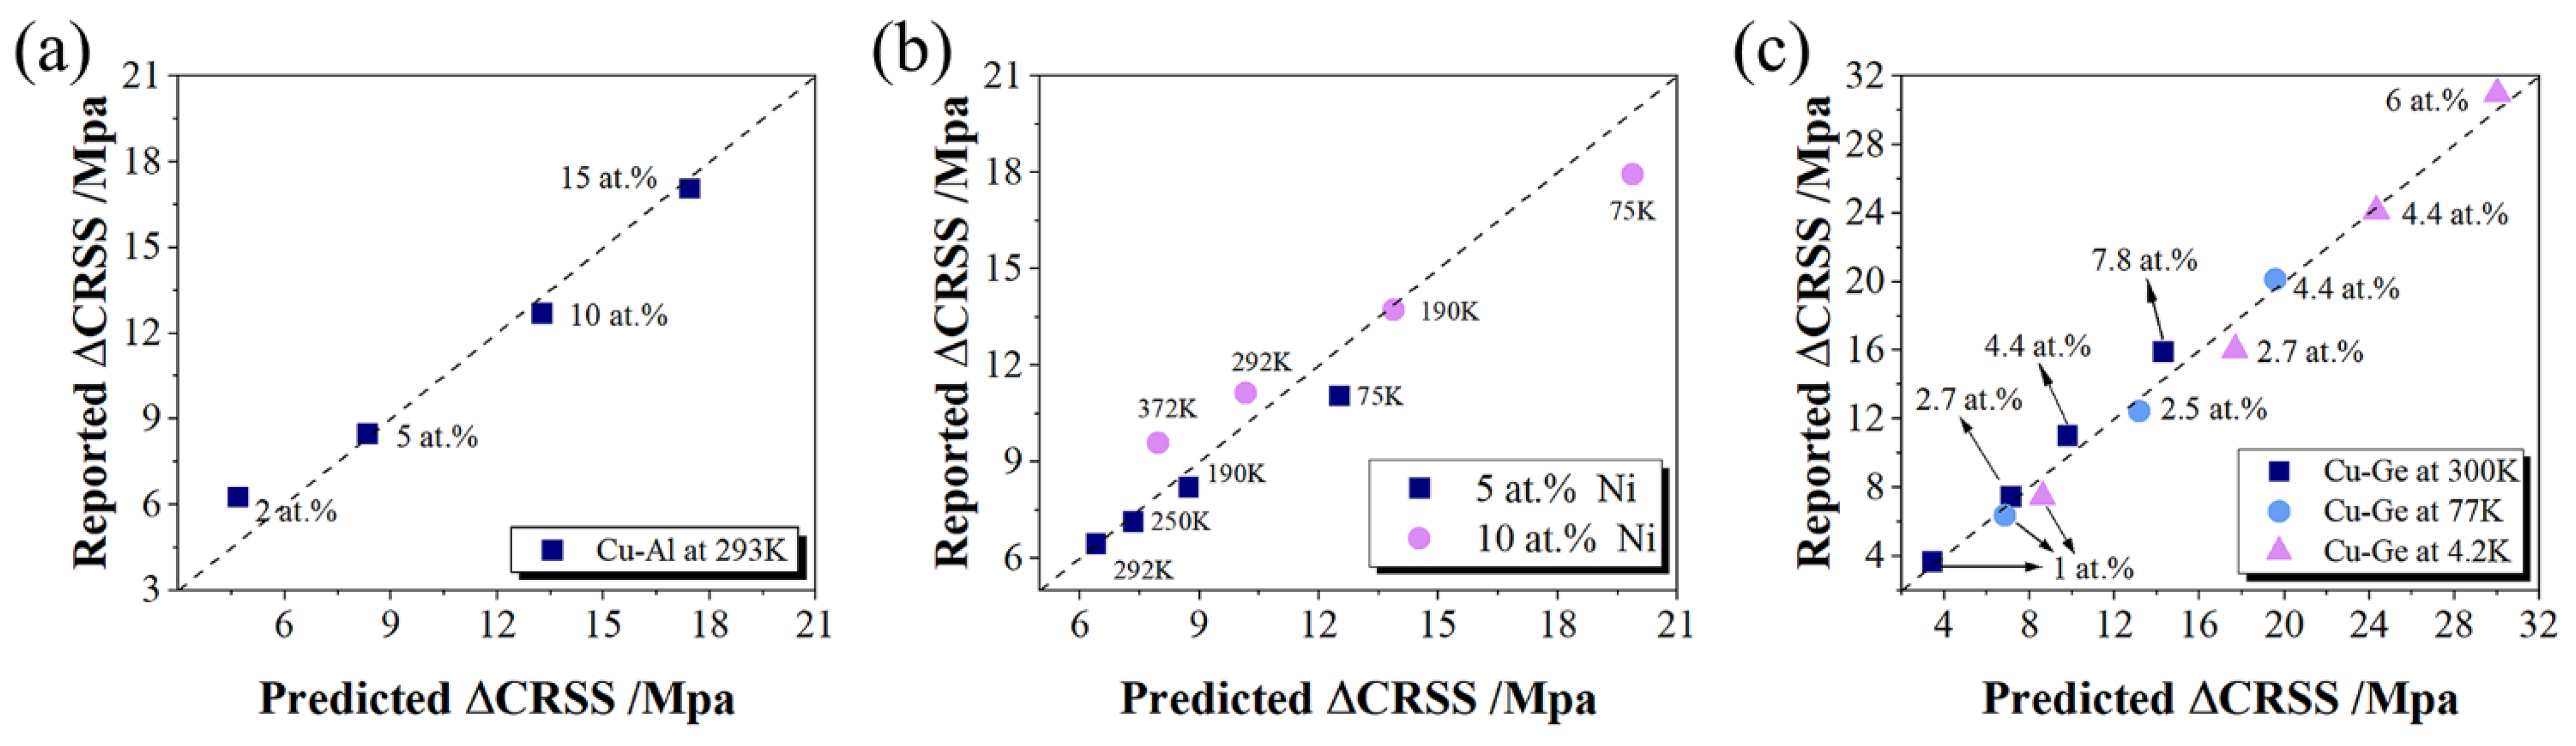
(3)
The lattice parameters and shear modulus of the solid solution showed a good linear relationship with the concentration, which matched the experimental values fairly well.
(4)
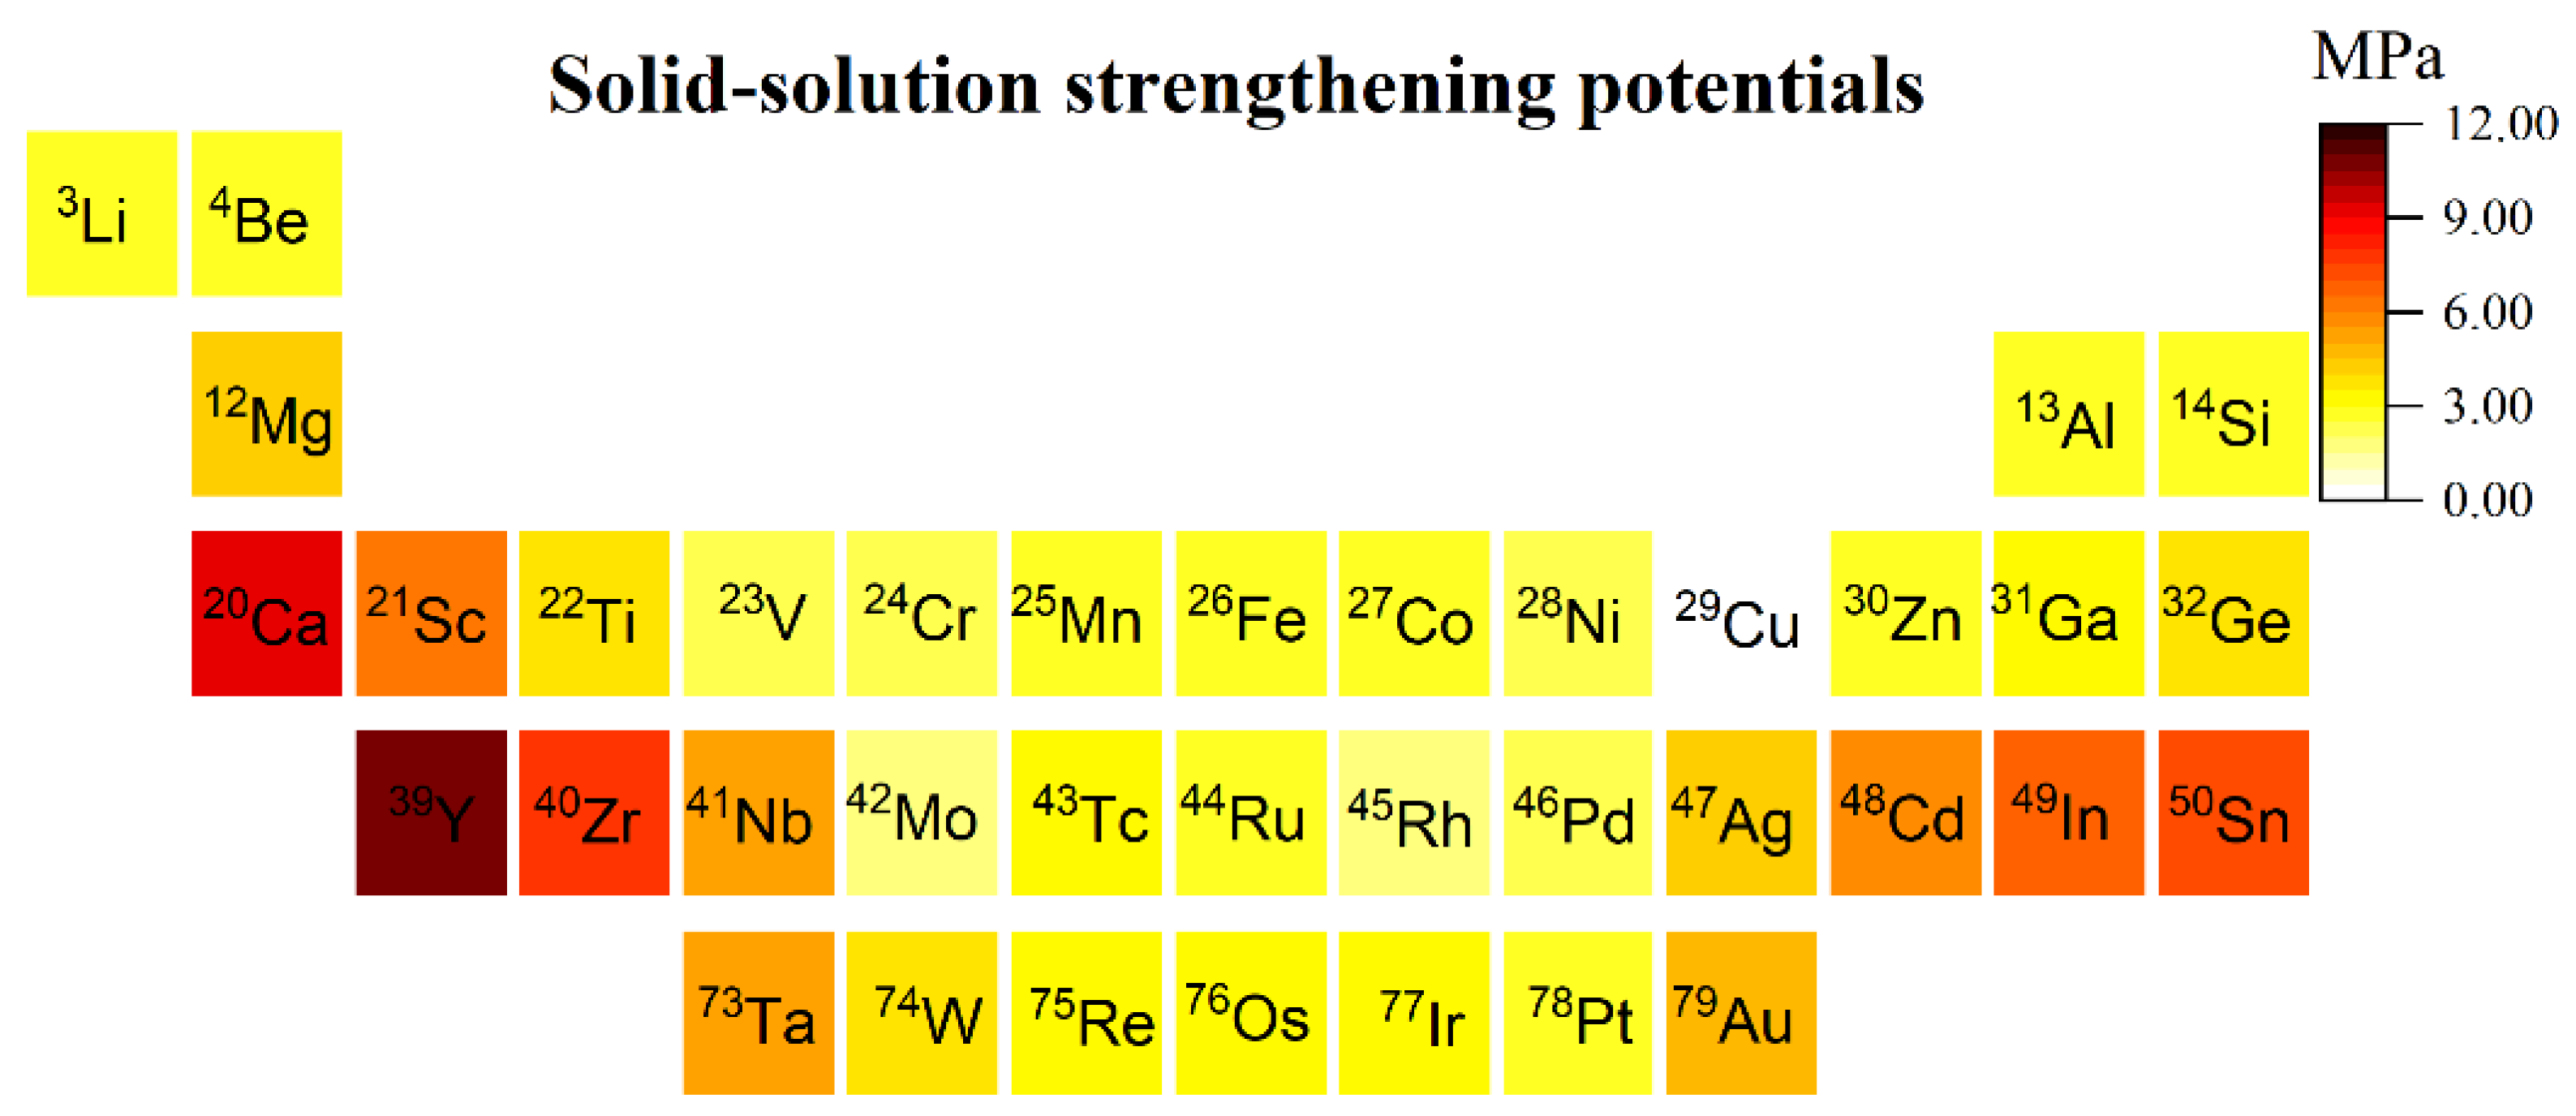
In the same period, the alloying elements at both ends have a higher strengthening ability than the elements in the middle.
(5)
The predicted critical decomposition shear stresses are in good agreement with the experimental values. Considering the cost and strengthening ability of solute elements, Mg, Ca, Y, Zr, Cd, In, and Sn are potential candidates for solid solution strengthening, while Ru, Rh, and Pt have less potential as strengthening elements. This study provides theoretical insights into the design of high-performance copper alloys.

Supplementary Materials

The following supporting information can be downloaded at: https://www.mdpi.com/article/10.3390/met13050875/s1, Figure S1: Special quasi-random structures (SQS) with different solute contents: (a) 3.125 at.%; (b) 6.25 at.%; (c) 9.375 at.%; ( d) 12.5 at.%; Figure S2: The excess strength (ΔσSSS) obtained by solid-solution strengthening (1 at.% solute content, 300K); Table S1: Spin magnetic moments ((μB/atom) used for some atoms during first-principle calculations; Table S2: The Warren-Cowley short-range order parameter of the SQS structures; Table S3: Calculated elastic properties of 3.125 at.% Cu-X solid solution. Including elastic constant Cij’s, Bulk modulus (B), Young’s modulus (E), Shear modulus (G), Poisson’s ratio ( ν ), ratio of bulk modulus to shear modulus (B/G); Table S4: Mixing enthalpy ( Δ H m i x i n g ) of Cu-X alloys calculated from solute ground state energy; Table S5: The result of EOS fitting in ground state (V0: equilibrium volume (Å3), E0: static energy (eV/atom), B0: bulk modulus (GPa), B’: first derivative of bulk modulus to pressure) and the Lattice constant (Å) of pure elements in FCC structure by first principles calculations; Table S6: The lattice constant and the corresponding linear regression coefficient ( k a ) of Cu-X solid solutions, and the value of k a v under Vegard’s law; Table S7: The calculated VRH shear moduli and the corresponding linear regression coefficients (kG) for the Cu-X solid solutions. Some outlier data marked in italics are excluded; Table S8: The misfit factors for the 36 alloying elements in Cu.

Author Contributions

Conceptualization, J.X. and A.W.; methodology, J.Z., Y.Z. and T.L.; validation, B.S., Y.Z. and A.W.; formal analysis, J.Z., Y.Z. and A.W.; investigation, B.S., J.Z. and Y.Z.; resources, A.W.; data curation, Z.M., T.L. and H.L.; writing—original draft, J.Z. and Y.Z.; writing—review and editing, A.W.; visualization, Z.M. and Y.Z.; supervision, H.L. and J.X.; project administration, A.W.; funding acquisition, J.X. and A.W. All authors have read and agreed to the published version of the manuscript.

Funding

This work was supported by the National Key R&D Program of China (2021YFB3701304) and the Key R&D and Extension Project of Henan Province (No.232102231006).

Data Availability Statement

All high-throughput computational codes, input files, and crystal structures in this work are available from the corresponding author. Processed data are listed in Supplementary Material.

Acknowledgments

The authors are very grateful to Jia Tan, Jing Wang, and Yifeng Wang for their help in code and supercomputing. Thanks to the anonymous reviewers for improvements to this article.

Conflicts of Interest

The authors declare no conflict of interest.

References

  1. Wang, C.; Fu, H.; Jiang, L.; Xue, D.; Xie, J. A Property-Oriented Design Strategy for High Performance Copper Alloys via Machine Learning. Npj Comput. Mater. 2019, 5, 87. [Google Scholar] [CrossRef]
  2. Geng, Y.; Ban, Y.; Wang, B.; Li, X.; Song, K.; Zhang, Y.; Jia, Y.; Tian, B.; Liu, Y.; Volinsky, A.A. A Review of Microstructure and Texture Evolution with Nanoscale Precipitates for Copper Alloys. J. Mater. Res. Technol. 2020, 9, 11918–11934. [Google Scholar] [CrossRef]
  3. Zhang, H.; Fu, H.; He, X.; Wang, C.; Jiang, L.; Chen, L.-Q.; Xie, J. Dramatically Enhanced Combination of Ultimate Tensile Strength and Electric Conductivity of Alloys via Machine Learning Screening. Acta Mater. 2020, 200, 803–810. [Google Scholar] [CrossRef]
  4. Yang, H.; Ma, Z.; Lei, C.; Meng, L.; Fang, Y.; Liu, J.; Wang, H. High Strength and High Conductivity Cu Alloys: A Review. Sci. China Technol. Sci. 2020, 63, 2505–2517. [Google Scholar] [CrossRef]
  5. Zhang, H.; Fu, H.; Zhu, S.; Yong, W.; Xie, J. Machine Learning Assisted Composition Effective Design for Precipitation Strengthened Copper Alloys. Acta Mater. 2021, 215, 117118. [Google Scholar] [CrossRef]
  6. Xie, M.; Huang, W.; Chen, H.; Gong, L.; Xie, W.; Wang, H.; Yang, B. Microstructural Evolution and Strengthening Mechanisms in Cold-Rolled Cu–Ag Alloys. J. Alloys Compd. 2021, 851, 156893. [Google Scholar] [CrossRef]
  7. Xiong, H.; Ma, Y.; Zhang, H.; Chen, L. Design of Cu–Cr Alloys with High Strength and High Ductility Based on First-Principles Calculations. Metals 2022, 12, 1406. [Google Scholar] [CrossRef]
  8. Li, Z.; Chen, K.; Chen, X.; Zhu, Y.; Chen, M.; Wang, Y.; Shen, J.; Shi, J.; Wang, Z. In-Situ Fabrication, Microstructure and Mechanical Performance of Nano Iron-Rich Precipitate Reinforced Cu and Cu Alloys. Metals 2022, 12, 1453. [Google Scholar] [CrossRef]
  9. Thomas, S.; Yazdanparast, S.; Hildreth, O.; Asle Zaeem, M. Formation Energies, Electronic Properties and Elemental Diffusion of Cu–Cr–Nb (GRCop) Alloys. Phys. B Condens. Matter 2022, 637, 413909. [Google Scholar] [CrossRef]
  10. Wang, Y.; Su, C.; Konovalov, S. Microstructure and Mechanical Properties of Cu-6.5%Al Alloy Deposited by Wire Arc Additive Manufacturing. Metallogr. Microstruct. Anal. 2021, 10, 634–641. [Google Scholar] [CrossRef]
  11. Wei, H.; Hou, L.; Cui, Y.; Wei, Y. Effect of Ti Content on Corrosion Behavior of Cu-Ti Alloys in 3.5% NaCl Solution. Trans. Nonferrous Met. Soc. China 2018, 28, 669–675. [Google Scholar] [CrossRef]
  12. Wang, M.; Yang, Q.; Jiang, Y.; Li, Z.; Xiao, Z.; Gong, S.; Wang, Y.; Guo, C.; Wei, H. Effects of Fe Content on Microstructure and Properties of Cu–Fe Alloy. Trans. Nonferrous Met. Soc. China 2021, 31, 3039–3049. [Google Scholar] [CrossRef]
  13. Zhang, Y.; Sun, H.; Volinsky, A.A.; Tian, B.; Song, K.; Wang, B.; Liu, Y. Hot Workability and Constitutive Model of the Cu-Zr-Nd Alloy. Vacuum 2017, 146, 35–43. [Google Scholar] [CrossRef]
  14. Wang, W.; Zhu, J.; Qin, N.; Zhang, Y.; Li, S.; Xiao, Z.; Lei, Q.; Li, Z. Effects of Minor Rare Earths on the Microstructure and Properties of Cu-Cr-Zr Alloy. J. Alloys Compd. 2020, 847, 155762. [Google Scholar] [CrossRef]
  15. Wang, B.; Zhang, Y.; Tian, B.; Yakubov, V.; An, J.; Volinsky, A.A.; Liu, Y.; Song, K.; Li, L.; Fu, M. Effects of Ce and Y Addition on Microstructure Evolution and Precipitation of Cu-Mg Alloy Hot Deformation. J. Alloys Compd. 2019, 781, 118–130. [Google Scholar] [CrossRef]
  16. Toda-Caraballo, I.; Rivera-Díaz-del-Castillo, P.E.J. Modelling Solid Solution Hardening in High Entropy Alloys. Acta Mater. 2015, 85, 14–23. [Google Scholar] [CrossRef]
  17. Zhang, H.L.; Cai, D.D.; Sun, X.; Huang, H.; Lu, S.; Wang, Y.Z.; Hu, Q.M.; Vitos, L.; Ding, X.D. Solid Solution Strengthening of High-Entropy Alloys from First-Principles Study. J. Mater. Sci. Technol. 2022, 121, 105–116. [Google Scholar] [CrossRef]
  18. Fleisgher, R.L. Solution Hardening. Acta Metall. 1961, 9, 996–1000. [Google Scholar] [CrossRef]
  19. Labusch, R. A Statistical Theory of Solid Solution Hardening. Phys. Status Solidi B 1970, 41, 659–669. [Google Scholar] [CrossRef]
  20. Uesugi, T.; Higashi, K. First-Principles Studies on Lattice Constants and Local Lattice Distortions in Solid Solution Aluminum Alloys. Comput. Mater. Sci. 2013, 67, 1–10. [Google Scholar] [CrossRef]
  21. Yasi, J.A.; Hector, L.G.; Trinkle, D.R. First-Principles Data for Solid-Solution Strengthening of Magnesium: From Geometry and Chemistry to Properties. Acta Mater. 2010, 58, 5704–5713. [Google Scholar] [CrossRef]
  22. Hu, Y.-J.; Shang, S.-L.; Wang, Y.; Darling, K.A.; Butler, B.G.; Kecskes, L.J.; Liu, Z.-K. Effects of Alloying Elements and Temperature on the Elastic Properties of W-Based Alloys by First-Principles Calculations. J. Alloys Compd. 2016, 671, 267–275. [Google Scholar] [CrossRef]
  23. Wang, H.; Gan, Y.C.; Geng, H.Y.; Chen, X.-R. MyElas: An Automatized Tool-Kit for High-Throughput Calculation, Post-Processing and Visualization of Elasticity and Related Properties of Solids. Comput. Phys. Commun. 2022, 281, 108495. [Google Scholar] [CrossRef]
  24. Kresse, G.; Furthmüller, J. Efficient Iterative Schemes for Ab Initio Total-Energy Calculations Using a Plane-Wave Basis Set. Phys. Rev. B 1996, 54, 11169–11186. [Google Scholar] [CrossRef]
  25. Kresse, G.; Furthmüller, J. Efficiency of Ab-Initio Total Energy Calculations for Metals and Semiconductors Using a Plane-Wave Basis Set. Comput. Mater. Sci. 1996, 6, 15–50. [Google Scholar] [CrossRef]
  26. Perdew, J.P.; Burke, K.; Ernzerhof, M. Generalized Gradient Approximation Made Simple. Phys. Rev. Lett. 1996, 77, 3865–3868. [Google Scholar] [CrossRef]
  27. Monkhorst, H.J.; Pack, J.D. Special Points for Brillouin-Zone Integrations. Phys. Rev. B 1976, 13, 5188–5192. [Google Scholar] [CrossRef]
  28. van de Walle, A.; Tiwary, P.; de Jong, M.; Olmsted, D.L.; Asta, M.; Dick, A.; Shin, D.; Wang, Y.; Chen, L.-Q.; Liu, Z.-K. Efficient Stochastic Generation of Special Quasirandom Structures. Calphad 2013, 42, 13–18. [Google Scholar] [CrossRef]
  29. van de Walle, A.; Asta, M.; Ceder, G. The Alloy Theoretic Automated Toolkit: A User Guide. Calphad 2002, 26, 539–553. [Google Scholar] [CrossRef]
  30. Yu, W.; Chong, X.; Gan, M.; Wei, Y.; Zhang, A.; Wang, Y.; Feng, J. Exploring the Solution Strengthening Effect of 33 Alloying Elements in Pt-Based Alloys by High-Throughput First-Principles Calculations. J. Appl. Phys. 2022, 131, 185103. [Google Scholar] [CrossRef]
  31. Birch, F. Finite Elastic Strain of Cubic Crystals. Phys. Rev. 1947, 71, 809–824. [Google Scholar] [CrossRef]
  32. Shang, S.-L.; Wang, Y.; Kim, D.; Liu, Z.-K. First-Principles Thermodynamics from Phonon and Debye Model: Application to Ni and Ni3Al. Comput. Mater. Sci. 2010, 47, 1040–1048. [Google Scholar] [CrossRef]
  33. Shang, S.; Wang, Y.; Liu, Z.-K. First-Principles Elastic Constants of α- and θ-Al2O3. Appl. Phys. Lett. 2007, 90, 101909. [Google Scholar] [CrossRef]
  34. Hill, R. The Elastic Behaviour of a Crystalline Aggregate. Proc. Phys. Soc. Sect. A 1952, 65, 349. [Google Scholar] [CrossRef]
  35. Yang, J.; Ouyang, P.; Liu, T.; Yun, H.; Sun, W.; Wang, Y.; Liu, J.; Zhang, S. First-Principles Study of the Effect of Aluminum Content on the Elastic Properties of Cu-Al Alloys. Mater. Today Commun. 2022, 31, 103399. [Google Scholar] [CrossRef]
  36. Straumanis, M.E.; Yu, L.S. Lattice Parameters, Densities, Expansion Coefficients and Perfection of Structure of Cu and of Cu–In α Phase. Acta Crystallogr. Sect. A 1969, 25, 676–682. [Google Scholar] [CrossRef]
  37. Overton, W.C.; Gaffney, J. Temperature Variation of the Elastic Constants of Cubic Elements. I. Copper. Phys. Rev. 1955, 98, 969–977. [Google Scholar] [CrossRef]
  38. Zhu, Y.D.; Yan, M.F.; Zhang, Y.X.; Zhang, C.S. First-Principles Investigation of Structural, Mechanical and Electronic Properties for Cu–Ti Intermetallics. Comput. Mater. Sci. 2016, 123, 70–78. [Google Scholar] [CrossRef]
  39. Iwaoka, H.; Hirosawa, S. First-Principles Calculation of Elastic Properties of Cu-Zn Intermetallic Compounds for Improving the Stiffness of Aluminum Alloys. Comput. Mater. Sci. 2020, 174, 109479. [Google Scholar] [CrossRef]
  40. Kong, G.-X.; Ma, X.-J.; Liu, Q.-J.; Li, Y.; Liu, Z.-T. Structural Stability, Elastic and Thermodynamic Properties of Au–Cu Alloys from First-Principles Calculations. Phys. B Condens. Matter 2018, 533, 58–62. [Google Scholar] [CrossRef]
  41. Fürth, R. On the Stability of Crystal Lattices: VI. The Properties of Matter under High Pressure and the Lattice Theory of Crystals. Math. Proc. Camb. Philos. Soc. 1941, 37, 177–185. [Google Scholar] [CrossRef]
  42. Ghosh, D.; Biswas, R. Theoretical Calculation of Absolute Radii of Atoms and Ions. Part 1. The Atomic Radii. Int. J. Mol. Sci. 2002, 3, 87–113. [Google Scholar] [CrossRef]
  43. Wang, M.-X.; Zhu, H.; Yang, G.-J.; Liu, K.; Li, J.-F.; Kong, L.-T. Solid-Solution Strengthening Effects in Binary Ni-Based Alloys Evaluated by High-Throughput Calculations. Mater. Des. 2021, 198, 109359. [Google Scholar] [CrossRef]
  44. Liu, T.; Chong, X.-Y.; Yu, W.; Zhou, Y.-X.; Huang, H.-G.; Zhou, R.-F.; Feng, J. Changes of Alloying Elements on Elasticity and Solid Solution Strengthening of α-Ti Alloys: A Comprehensive High-Throughput First-Principles Calculations. Rare Met. 2022, 41, 2719–2731. [Google Scholar] [CrossRef]
  45. Huang, C.X.; Hu, W.; Yang, G.; Zhang, Z.F.; Wu, S.D.; Wang, Q.Y.; Gottstein, G. The Effect of Stacking Fault Energy on Equilibrium Grain Size and Tensile Properties of Nanostructured Copper and Copper–Aluminum Alloys Processed by Equal Channel Angular Pressing. Mater. Sci. Eng. A 2012, 556, 638–647. [Google Scholar] [CrossRef]
  46. Pearson, W.B. A Handbook of Lattice Spacings and Structures of Metals and Alloys: International Series of Monographs on Metal Physics and Physical Metallurgy; Elsevier: Amsterdam, The Netherlands, 2013; Volume 4, ISBN 1-4832-2661-1. [Google Scholar]
  47. Vegard, L. The Constitution of Mixed Crystal and the Space Occupied by Atom. Z. Phys. 1921, 5, 17. [Google Scholar] [CrossRef]
  48. Cyrot, M.; Cyrot-Lackmann, F. Energy of Formation of Binary Transitional Alloys. J. Phys. F Met. Phys. 1976, 6, 2257–2265. [Google Scholar] [CrossRef]
  49. Cyrot-Lackmann, F. Sur le calcul de la cohésion et de la tension superficielle des métaux de transition par une méthode de liaisons fortes. J. Phys. Chem. Solids 1968, 29, 1235–1243. [Google Scholar] [CrossRef]
  50. Sutton, A.P. Electronic Structure of Materials; Clarendon Press: Oxford, UK, 1993; ISBN 0-19-158853-9. [Google Scholar]
  51. Wen, C.; Wang, C.; Zhang, Y.; Antonov, S.; Xue, D.; Lookman, T.; Su, Y. Modeling Solid Solution Strengthening in High Entropy Alloys Using Machine Learning. Acta Mater. 2021, 212, 116917. [Google Scholar] [CrossRef]
  52. Leyson, G.P.M.; Hector, L.G.; Curtin, W.A. Solute Strengthening from First Principles and Application to Aluminum Alloys. Acta Mater. 2012, 60, 3873–3884. [Google Scholar] [CrossRef]
  53. Ma, D.; Friák, M.; von Pezold, J.; Raabe, D.; Neugebauer, J. Computationally Efficient and Quantitatively Accurate Multiscale Simulation of Solid-Solution Strengthening by Ab Initio Calculation. Acta Mater. 2015, 85, 53–66. [Google Scholar] [CrossRef]
  54. Wu, Z.; Gao, Y.; Bei, H. Thermal Activation Mechanisms and Labusch-Type Strengthening Analysis for a Family of High-Entropy and Equiatomic Solid-Solution Alloys. Acta Mater. 2016, 120, 108–119. [Google Scholar] [CrossRef]
  55. Pöhl, C.; Schatte, J.; Leitner, H. Solid Solution Hardening of Molybdenum–Hafnium Alloys: Experiments and Modeling. Mater. Sci. Eng. A 2013, 559, 643–650. [Google Scholar] [CrossRef]
  56. Agustianingrum, M.P.; Yoshida, S.; Tsuji, N.; Park, N. Effect of Aluminum Addition on Solid Solution Strengthening in CoCrNi Medium-Entropy Alloy. J. Alloys Compd. 2019, 781, 866–872. [Google Scholar] [CrossRef]
  57. Akhtar, A.; Teghtsoonian, E. Plastic Deformation of Ni-Cr Single Crystals. Metall. Trans. 1971, 2, 2757–2763. [Google Scholar] [CrossRef]
  58. Čižek, L.; Kratochvíl, P.; Smola, B. Solid Solution Hardening of Copper Crystals. J. Mater. Sci. 1974, 9, 1517–1520. [Google Scholar] [CrossRef]
  59. Butt, M.Z. Investigation of the Activation-Parameters of Low-Temperature Slip in Cubic Metals. Czechoslov. J. Phys. 1999, 49, 1177–1184. [Google Scholar] [CrossRef]
  60. Butt, M.Z.; Ghauri, I.M. Effect of short-range order on the temperature dependence of plastic flow in α-brasses. Phys. Status Solidi A 1988, 107, 187–195. [Google Scholar] [CrossRef]
  61. Kamada, K.; Yoshizawa, I. The Anomalies in Temperature Dependence of the Yield Stress of Cu Base Solid Solutions. J. Phys. Soc. Jpn. 1971, 31, 1056–1068. [Google Scholar] [CrossRef]
  62. Miura, S.; Ono, N.; Nishimura, Y. Hall-Petch Relation and Twin Boundaries in Pure Copper and Cu-Al Alloys. J. Soc. Mater. Sci. Jpn. 2009, 58, 865–872. [Google Scholar] [CrossRef]
  63. Butt, M.Z.; Aziz, F.; Ali, D. Correlation between the Temperature Dependence of Yield Stress and the Nature of Solute Distribution in Cu–Ni Solid Solutions. J. Alloys Compd. 2010, 498, 102–106. [Google Scholar] [CrossRef]
Figure 1. High-throughput computing process.
Metals 13 00875 g001
Figure 2. (a) Cu lattice constants fitted by EOS. (b) Experimental data from Overton et al. [37] vs Calculated elastic constants of Cu in this work and data from others work [38,39,40].
Metals 13 00875 g002
Figure 3. Percentage change of elastic properties by alloying (3.125 at.%). (a) B: Bulk modulus; G: Shear modulus; E: Young’s modulus. (b) B/G: Pugh ratio; υ : Poisson’s ratio.
Metals 13 00875 g003
Figure 4. The relationship of (C12-C44)/E and G/B for Cu-based solid solutions.
Metals 13 00875 g004
Figure 5. Mixing enthalpy of Cu-based solid solutions.
Metals 13 00875 g005
Figure 6. (a) Linear regression parameters of the lattice constant and composition of Cu-based solid solutions of different solutes. The solid circle is the calculation result and triangle is the linear coefficient under Vegard’s law, and their difference is the pink square. (b) The Cu-Al solid solution lattice constants at different solute concentrations, with Vegard’s law predictions and experimental data from [45]. (c) Linear regression coefficients of the predicted lattice constants and compositions compared with the experimental data from [46].
Metals 13 00875 g006
Figure 7. Linear regression coefficients of the shear modulus (red line) and lattice constants (black line) for Cu-based solid solutions.
Metals 13 00875 g007
Figure 8. The misfit factor of Cu-based solid solutions.
Metals 13 00875 g008
Figure 9. Average solid solution strengthening potential of Cu-based solid solutions at 300 K.
Metals 13 00875 g009
Figure 10. Comparison of predicted ΔCRSS and experimental data from [61,62,63] for three solid solutions. (a) Cu-Al solid solutions; (b) Cu-Ni solid solutions; (c) Cu-Ge solid solutions.
Metals 13 00875 g010
Disclaimer/Publisher’s Note: The statements, opinions and data contained in all publications are solely those of the individual author(s) and contributor(s) and not of MDPI and/or the editor(s). MDPI and/or the editor(s) disclaim responsibility for any injury to people or property resulting from any ideas, methods, instructions or products referred to in the content.

