
Effect of Al2O3 Inclusions or Mold Flux Particles on Their Surrounding Microstructures of Sliver Defects on the Surface of Automobile Exposed Panel
State Key Laboratory of Advanced Special Steel, School of Materials Science and Engineering, Shanghai University, Shanghai 200444, China
*
Author to whom correspondence should be addressed.
Metals 2023, 13(4), 661; https://doi.org/10.3390/met13040661
Submission received: 19 February 2023
/
Revised: 22 March 2023
/
Accepted: 24 March 2023
/
Published: 27 March 2023
(This article belongs to the Special Issue Non-metallic Inclusions in Steelmaking)
Abstract
:The Al2O3 inclusions and mold flux particles are the initial causes of the sliver defects on the surface of automobile exposed panels. During the rolling process, the smashed Al2O3 inclusions or mold flux particles will hinder the growth of recrystallized grains. Compared with mold flux particles, the smashed Al2O3 inclusions have a smaller size, a denser distribution, and a larger number density, so the smashed Al2O3 inclusions have a stronger ability to hinder grain boundary migration. Therefore, the average grain size is small in the following sequence: Al2O3 defect zone with Al2O3 inclusions (Al2O3 DZ with Al2O3), mold flux defect zone with mold flux particles (MFDZ with MFP), mold flux defect zone without mold flux particles (MFDZ without MFP), Al2O3 defect zone without Al2O3 inclusions (Al2O3 DZ without Al2O3), and non-defect zone (NDZ). The influence of particles on the grain orientation of the defect zones results in the microtexture of Al2O3 DZ without Al2O3 is {111}<313>, which is close to the {111}<101> microtextures of NDZ and MFDZ without MFP, while the {001}<114> microtexture on Al2O3 DZ with Al2O3 and the {313}<111> microtexture on MFDZ with MFP are quite different from that of NDZ. Due to differences in the inclusions, orientation, and microtexture of the defect zones and NDZ, dark-gray or bright white sliver defects on the surface of the automobile exposed panel are eventually formed.
1. Introduction
The sliver surface defects on the automobile exposed panel are important surface quality problems that affect product delivery and customer satisfaction. The manufacturing process of an automobile exposed panel is a long process, including the steelmaking process, which involves hot metal pretreatment, converter blowing, secondary refining, and continuous casting, as well as the post process, which involves hot rolling, pickling, cold rolling, continuous annealing, and hot galvanizing. Previous research has shown that steelmaking defects can be classified as Al2O3 inclusions, mold flux particles, and bubbles. The primary sources for Al2O3 inclusions are usually from deoxidation/reoxidation reactions and nozzle clogging [1]. Mold flux particles are generally trapped in the molten steel due to the fluctuations of the liquid’s surface in the mold, and then they are captured by the hook of the primary solidified shell [2]. The inclusions or mold flux particles generated in the steelmaking process are firstly crushed in the rolling process, and then dispersed along the rolling direction along with the extension of the steel sheet, which may eventually lead to sliver defects on the surface of the automobile exposed panel [3,4]. Since the defects formed in each process are intertwined, it is difficult to distinguish and identify the steelmaking defects and trace the causes of their formation [5]. Furthermore, it takes a long time to obtain the feedback results of the defects after improving the steelmaking process [6]. Thus, the accurate identification of the surface defects of the automobile exposed panel caused by the steelmaking process is beneficial to assist in judging the origin of the defects.
Some qualitative and quantitative analyses of sliver defects on the surface of the automobile exposed panel caused by steelmaking have been performed in the recent years [7,8]. The research on sliver defects can be roughly divided into two categories: the formation reason and control technology of sliver defects, and the characteristics, distribution, and evolution of inclusions on sliver defects. For example, Yu et al. [9] studied the evolution of surface sliver, the hole and skin warping defects caused by inclusions, and then distinguished the types of surface defects of an IF steel sheet according to the location, size, and compositions of the inclusions. In our previous work, we used the quantitative electrolysis method to erode the automobile exposed panel [10]. The Al2O3 inclusions in the surface defects of the automobile exposed panel were exposed by the quantitative electrolysis, and the three-dimensional morphology, size, compositions, quantity, and distribution of Al2O3 inclusions in the defect zone and non-defect zone were clarified [10].
As for the research methods of sliver defects, scholars mostly use the scanning electron microscopy coupled energy dispersive X-ray spectroscopy to analyze the morphology and the chemical compositions of defects and inclusions, and they use the confocal laser scanning microscopy to measure the depth and the morphology of the defect. EBSD is occasionally applied in the analysis of the surface defects of cold-rolled steel sheets [11,12]. For example, in our previous research, the characteristics of mold flux particles causing sliver defects on the surface of a hot-dip galvanized the automobile exposed panel, and so the grain orientation of the defect zone was discussed [13]. Most previous works have tried to describe the characteristics of the sliver defects of automobile exposed panel from the perspective of the composition, size, quantity, and morphology of Al2O3 inclusions or mold flux particles [14,15]. Although the application of EBSD is involved in some studies, research on the microtextures of the defect zone and non-defect zone on the surface of the automobile exposed panel is quite limited.
Many researchers have studied the effect of particles on the microstructure and properties of alloy materials [16,17]. For example, Ravinath et al. [16] analyzed the impact of aging temperature on the metallurgical and dry sliding wear behavior of the LM25/Al2O3 metal matrix composite for an automotive application. However, the report is quite limited for investigating the particles’ influence on the surrounding matrix microstructure of the hot-dip galvanized automobile exposed panel.
According to the above analysis, the innovations of this article are the electrolytic method that exposes the three-dimensional morphology of inclusions, the comparison of results from the microtexture analysis of the defect zones and the non-defect zones, and the particles’ influence on the surrounding matrix microstructure of the hot-dip galvanized automobile exposed panel. In the present paper, the characteristics of Al2O3 inclusions and mold flux particles along the sliver surface defects are clarified. Then, the microtexture of the defect zones and the non-defect zones is revealed by EBSD. The particles’ influence on their surrounding microstructure of an automobile exposed panel is further analyzed. Finally, from the perspective of the microstructure of an automobile exposed panel, the formation mechanism of sliver defects on the surface of an automobile exposed panel is clarified, based on the size and distribution characteristics of the inclusions and mold flux particles, together with the microstructures of the matrices around these particles.
2. Experimental Procedures
2.1. Production Process of Automobile Exposed Panel
The chemical composition of the hot-dip galvanized automobile exposed panels of the ultra-low carbon steel is shown in Table 1. The element contents were measured by direct reading spectrometer (SPECTROMAXx, Spectro, Germany). The compositions of mold powders are shown in Table 2. The steelmaking process includes converter blowing, RH degassing, and continuous casting. The post process includes hot rolling, pickling, cold rolling, continuous annealing, and hot galvanizing.
2.2. Sampling Methodology
The thickness of the hot-dip galvanized automobile exposed sheet was about 0.8 mm. The main experimental procedures are as follows:
- (1)
- Statistics of the morphology and size of inclusions on sliver defects
Firstly, the hot-dip galvanized steel sheet was cut into 10 mm in length, and 10 mm in width using wire cutting machine (DK250, Big Iron numerical control machinery Co., Ltd., Foshan, China). The zinc layer and part of the matrix structure on the surface of the hot-dip galvanized sheet were removed by electrolysis to expose the three-dimensional morphology of the inclusions and mold flux particles. Secondly, the electrolysis sample after ultrasonic cleaning was observed and analyzed with scanning electron microscopy equipped with energy dispersive spectrometer (SEM-EDS, EVO 18, Carl Zeiss, Oberkochen, Germany); the morphology, size, chemical compositions, distribution, and locations of inclusions were counted and recorded.
- (2)
- Statistics of grain information on defect zones and non-defect zones
Firstly, the electron microscope samples were inlaid and polished again, and then they were put into the SEM-EDS after ultrasonic cleaning. According to the inclusion positions recorded, the defect zones with inclusions or mold flux particles, the defect zones with Al2O3 inclusions or mold flux particles, and the non-defect zones were analyzed by EBSD (SYMMETRY, Oxford Instruments, Abingdon, UK), and the microstructures were characterized. Then, from the perspective of microstructure, combined with the quantity, type, and size of Al2O3 inclusions or mold flux particles, the formation mechanism of the sliver defects on the surface of automobile exposed panel was investigated.
3. Results and Discussion
3.1. Morphology of Sliver Defects on Automobile Exposed Panel
Figure 1 presents the macro morphology of the typical Al2O3 sliver defect and mold flux sliver defect on the surface of the automobile exposed panel, and Table 3 shows the compositions of the particles on the Al2O3 sliver defect and mold flux sliver defect. Figure 1a presents the macro morphology of a typical Al2O3 sliver defect on the surface of an automobile exposed panel; Figure 1b presents the enlarged diagram of the defect zone in Figure 1a; and Figure 1c presents the enlarged diagram of the non-defect zone in Figure 1a. Combined with the full-size sample, Figure 1a–c shows a dark-gray sliver with a width of 530 μm on the surface of the automobile exposed panel. The dark-gray sliver defect is distributed along the rolling direction with a smooth surface. Under SEM, there are clear boundaries between the dark-gray sliver defect zone and the non-defect zone. The zinc layer on the sliver defect zone is unevenly distributed, but that of the non-defect zone presents the lamellar distribution evenly. Al, O, C, Fe, and Zn are the main detected elements of the particles on the Al2O3 sliver defect in Table 3, so we suppose that these particles are Al2O3 inclusions with a size smaller than 10 μm. Fe and Zn elements come from the steel matrix and zinc layer, respectively, and C element may come from the matrix, sample preparation, and analysis process.
Figure 1d presents the macro morphology of typical mold flux sliver defects on the surface of an automobile exposed panel; Figure 1e presents the enlarged diagram of the defect zone in Figure 1d; and Figure 1f presents the enlarged diagram of the non-defect zone in Figure 1d. Combined with the full-size sample, Figure 1d–f shows a bright white sliver with a width of about 350 μm distributed on the surface of the automobile exposed panel. The bright white sliver defects are distributed along the rolling direction with a smooth surface. Black strip protrusions are observed on the defect zone under SEM. The distribution of the zinc layer on the defect zone and the non-defect zone is obviously different. The zinc layer of the non-defect zone is lamellar and even, but that of the defect zone is not. The main detected elements of the particles on mold flux sliver defect are Al, O, Mg, Ca, Si, C, Fe, Zn, Na, K, and F, and Na, K, and F are the characteristic elements of mold flux. So, we suppose that these particles are mold flux particles with sizes of 5–17 μm. Among them, Fe and Zn come from the steel matrix and zinc layer, respectively, and C may come from the matrix, sample preparation, or analysis process.
3.2. Three-Dimensional Morphology of Al2O3 Inclusions and Mold Flux Particles
Lots of inclusions are covered by the zinc layer; this means that we cannot observe the relatively full-size morphology and its distribution characteristics on the sliver defects. The zinc layer of the sample can be accurately and effectively removed with quantitative electrolysis, making the Al2O3 inclusions or mold flux particles exposed and showing a relatively full-size morphology and its distribution characteristics on the sliver defects. With the following formula, the appropriate electrolysis depth can be controlled by adjusting the current intensity and electrolysis time.
where I is the current intensity (A); t is the time of erosion (s); MZn and MFe are the molecular mass of Zn and Fe, respectively (kg/mol); S is the area dipped in electrolyte (m2); ρZn and ρFe are the densities of zinc and steel substrate, respectively (kg/m3); NA is the Avogadro constant (6.02 × 10²³ mol−1); e is the electric charge (1.6 × 10⁻¹⁹ C); and hZn and hFe are the erosion depth of zinc layer and steel substrates, respectively (m).
The schematic diagram of the electrolytic device is presented in Figure 2. The samples with typical Al2O3 sliver defects or mold flux sliver defects are used as anodes, and the stainless steel sheets are used as cathodes. For different defects, different electrolyte formulations are chosen. For Al2O3 defects, the aqueous electrolyte containing 10 vol% HCl is used for quantitative electrolysis in a constant current intensity mode. For mold flux defects, the nonaqueous electrolyte containing methanol, 4-methylammonium chloride, and acetylacetone is used for quantitative electrolysis in a constant current intensity mode.
The surface of the automobile exposed panel is hot-dip galvanized with the zinc layer. The 10 mm × 10 mm Al2O3 defect samples were eroded for 5 min, 10 min, and 15 min under a constant current intensity of 0.1 A. The 10 mm × 10 mm mold flux defect samples were eroded successively for 2 min, 3 min, and 4 min under a constant current intensity of 0.1 A. The surface zinc layer can be gradually removed to expose the inclusions or mold flux particles on the defect surface, showing a relatively full-size morphology and its distribution characteristics on the defect. Figure 3a–c presents the morphology of the zinc layer on the surface of Al2O3 defect samples, which are gradually eroded. In Figure 3a, the zinc layer begins to be eroded from the grain boundary after 5 min of electrolysis. The zinc layer is completely eroded after 10 min of electrolysis, and the steel sheet is further corroded along the grain boundary, as shown in Figure 3b. Figure 3c shows that the grain boundary of the steel plate disappeared after 15 min of electrolysis, and part of the steel substrate structure is eroded. Therefore, all of the zinc layer and a part of the steel substrate structure can be removed with electrolysis for 5–15 min, which is an ideal condition for removing the surface zinc layer of Al2O3 defect samples. Figure 3d–f indicates the morphology of the zinc layer on the surface of the mold flux defect sample, which is eroded gradually. In Figure 3d, the zinc is partially eroded from the grain boundary after 2 min of electrolysis. In Figure 3e, most of the zinc layer has been removed after 3 min of electrolysis. All the zinc layers have been eroded after 4 min of electrolysis, as shown in Figure 3f. Therefore, electrolysis for 2–4 min can remove all of the zinc layer, which is an ideal time for removing the surface zinc layer from the mold flux defect samples.
Because the Al2O3 inclusions are buried deep in the matrix and the zinc layer is thick, the corrosion time for exposing Al2O3 inclusions is longer. Because the mold flux particles exist on the surface of a matrix, the zinc layer covering the mold flux particles is relatively thin. So, mold flux particles can be exposed in a shorter electrolysis time.
Figure 4 exhibits the typical three-dimensional morphology of Al2O3 inclusions and mold flux particles in sliver defects. According to the observation of inclusions and mold flux particles exposed in the electrolysis process, the Al2O3 inclusions can be roughly divided into four types based on their morphology, namely, irregular shape, plate-like shape, ring-like shape, and polyhedral shape, and their sizes usually range from 5 to 12 μm. Four types of mold flux particles are also observed on the surface of mold flux defects on the basis of their morphology, namely, irregular shape, spherical shape, polyhedral shape, and plate-like shape. Mold flux particles with sizes ranging from 5 to 17 μm are found in mold flux defects.
Figure 5 reveals the element map scanning (EDS) of Al2O3 inclusions and mold flux particles in the Al2O3 defects and mold flux defects. According to the EDS, there are only Al and O elements in Figure 4a–d. So, we suppose that these inclusions are Al2O3 inclusions. The irregular Al2O3 inclusion, as shown in Figure 4a, has a rough surface and is about 5 μm in size. The EDS analysis results exhibit that the size of the element aggregation area is smaller than that of the inclusion in Figure 5a, indicating that the inclusion surface is wrapped with other substances. The plate-like Al2O3 inclusion is close to 12 μm in size, as shown in Figure 4b. In Figure 5b, the EDS analysis result shows that the elements on its surface are unevenly distributed, and there are the aggregations of Al and O elements at individual positions. The shape of the ring-like Al2O3 inclusion may be formed by deformation of Al2O3 inclusions with other shapes after rolling and smashing; it is 10 μm in size, which is exhibited in Figure 4c. The element distribution is consistent with the shape, as exhibited in Figure 5c. The polyhedral Al2O3 inclusion, as shown in Figure 4d, is 5 μm in size and it has a smooth surface; its element distribution is exhibited in Figure 5d, which is consistent with the morphology of the block shape.
For the irregular mold flux, it can be seen that the mold flux particle has an irregular shape and is 5 μm in size, as shown in Figure 4e. In Figure 5e, the boundary between the inclusion and the matrix is not clear, and Al, O, Si, and K elements are detected by EDS. Therefore, the main compositions of the irregular mold flux may be Al2O3·SiO2·K2O, which are the typical compositions of mold flux. For the spherical mold flux, as shown in Figure 4f, its surface is smooth and partially exposed. Its size is larger than 8 μm. Al, O, Ca, and K elements are detected by EDS in Figure 5f, so the main compositions of spherical mold flux may be Al2O3·SiO2·K2O. For the polyhedral mold flux, it floats on the substrate surface, as shown in Figure 4g. It has a smooth surface and is about 10 μm in size. According to the EDS analysis results in Figure 5g, there are Al, O, Ca, and K elements in the polyhedral mold flux. Thus, its main compositions may be Al2O3·CaO·K2O. For the plate-like mold flux, it has a quadrangular morphology, smooth surface, and it is 17 μm in size, as shown in Figure 4h. In Figure 5h, its three-dimensional shape does not appear even after electrolysis. Al, O, Ca, and K elements are observed by EDS. Therefore, its main compositions may be Al2O3·CaO·K2O. The compositions of the mold flux particles are consistent with the mold powders in Table 2.
In comparison, the plate-like Al2O3 inclusion, ring-like Al2O3 inclusion, polyhedral mold flux particle, and plate-like mold flux particle are relatively large in size. The difference between the maximum and minimum sizes of the mold flux particles is greater than that of the Al2O3 inclusions.
Pan et al. [10] made a statistical analysis on the size and distribution of Al2O3 inclusions in Al2O3 sliver defects and found that the sizes of the Al2O3 inclusions were 3–10 μm. The average inclusion size for the inclusions larger than 1 µm in the defect zone was 4.45 µm, which is larger than 3.20 µm for the non-defect zone (NDZ). The spacings of the Al2O3 inclusions in the defect zone and NDZ are 25.13 µm and 402.66 µm, respectively. So, the Al2O3 inclusions in the defect zone are large in size and densely distributed compared with those in NDZ. Li et al. [13] studied the size and distribution of mold flux particles in mold flux sliver defects. The mold flux particles in the mold flux defect zone are about 5–15 μm in size, their quantity density is more than 100 mm−2, and their average spacing is less than 60 μm. However, in NDZ, the quantity density is less than 75 mm−2 and the average spacing between the particles is greater than 100 μm. Thus, the distribution of mold flux particles in the defect zone is denser than that in NDZ. One can find that the above results of the size and distribution of Al2O3 inclusions and mold flux particles are basically consistent with the results observed in this paper.
3.3. EBSD Analysis of the Surface of Sliver Defect Zones and Surrounding Matrix
The following detection zones are randomly selected. In order to verify the correctness of the data and conclusions obtained, we select different zones on twelve samples for testing. Samples 1, 2, 3, and 4 are the samples of the Al2O3 sliver defect, samples 5, 6, 7, and 8 are the samples of the mold flux sliver defect, and there is no defect in samples 9, 10, 11, and 12. The detected data of sample 1, 4, and 9 are showed in the main text, and the data from the other samples are presented in the Supplementary Material.
3.3.1. Analysis of Grain Orientation near Al2O3 Inclusions or Mold Flux Particles
Figure 6 presents the grain boundary distribution (GBD), phase distribution (PD), and crystal orientation maps (COM) obtained from the EBSD data on the Al2O3 sliver defect of sample 1, as well as the morphology and map scanning analysis results of the Al2O3 inclusions. There are six inclusions with Al and O elements in zone 1 in Figure 6, which is called the Al2O3 defect zone with Al2O3 inclusions (Al2O3 DZ with Al2O3). There are no Al2O3 inclusions in zone 2 around the Al2O3 DZ with Al2O3 in Figure 6, which is called the Al2O3 defect zone without Al2O3 inclusions (Al2O3 DZ without Al2O3). The morphology and map scanning analysis results of Al2O3 inclusions are shown in Figure 6d.
As can be seen from Figure 6a, the GBD of zone 1 is dense, and the GBD of zone 2 is relatively sparse, indicating that the grain sizes of Al2O3 DZ with Al2O3 are small, and the grain sizes of Al2O3 DZ without Al2O3 are large. In Figure 6b, the iron BCC phase and the Al2O3 phase can be observed, accounting for 80.9% and 18.9% of zone 1, respectively. In zone 2 of Figure 6b, the iron BCC phase and a small amount of the Al2O3 phase can be observed at the grain boundary, accounting for 96.8% and 3.1%, respectively. Figure 6c is the COM of the Al2O3 DZ with Al2O3 and the Al2O3 DZ without Al2O3, and the color key indicates the crystal orientation. Zone 1 has different colors, indicating that the grains of zone 1 have no orientation. In addition, the COM of zone 2 has a color that is close to blue, meaning that the grains are mainly in the <111> orientation, so the ND//<111> microtexture exists on the rolling surface of zone 2. Figures S1–S3 are the GBD, PD, and COM obtained from the EBSD data on the Al2O3 sliver defect of other samples. Combined with Figures S1–S3, it can be concluded that the grains of Al2O3 DZ with Al2O3 have no orientation, but there is ND//<111> microtexture existing on Al2O3 DZ without Al2O3.
However, the COM can only show if the grains on the rolling surface have a roughly fixed orientation tendency. Whether the grains have a preferred microtexture, this can be illustrated in the inverse pole figures (IPF) in the rolling direction (RD), transverse direction (TD), and normal direction (ND) [18]. Figure 7 presents the inverse pole figures (IPF) in rolling direction (RD), transverse direction (TD), and normal direction (ND) of Al2O3 sliver defect in sample 1. The strength of the microtexture can be directly reflected through the polar density distribution contour in IPF. Figure 7a is the IPF of zone 1. In the RD, there is a slight <114> preferred orientation that has a polar density of 2.05. In the TD, there is a slight <001> preferred orientation that has a polar density of 2.03. However, <001> has an obvious preferred orientation in the ND, and the polar density is 2.65, referring to the polar density scale. Figure 7b presents the IPF of zone 2. In the RD, there is a slight <313> preferred orientation that has a polar density of 1.75. In the TD, there is a slight <101> preferred orientation that has a polar density of 2.05. However, <111> has an obvious preferred orientation in the ND, and the polar density is 4.11, referring to polar density scale. Compared with zone 1, zone 2 has a higher polar density in TD and ND, indicating that the preferred orientation of the grains in zone 2 is stronger. From Figures S4–S6, the same analysis results can be achieved. Therefore, the preferred orientation of the grains in Al2O3 DZ without Al2O3 is stronger than that in Al2O3 DZ with Al2O3.
Figure 8 presents the GBD, PD, and COM obtained from the EBSD data on the mold flux sliver defect of sample 5, as well as the morphology and map scanning analysis results of the mold flux particles. There is one mold flux particle that is 6 μm in size in zone 3 in Figure 8, which is called the mold flux defect zone with mold flux particles (MFDZ with MFP). There are no mold flux particles in zone 4 around MFDZ with MFP in Figure 8, which is called the mold flux defect zone without mold flux particles (MFDZ without MFP). The morphology and map scanning analysis results of the mold flux particle containing Al, O, Mg, and Na are shown in Figure 8d, and the main compositions of the mold flux particle may be Al2O3·MgO·CaO·Na2O.
As can be seen from Figure 8a, the grain sizes of zone 3 are smaller than those of zone 4. In Figure 8b, the iron BCC phase and the mold flux phase can be observed, accounting for 70.9% and 28.6% of zone 3, respectively. In zone 4, the iron BCC phase and a small amount of the mold flux phase can be observed, accounting for 96.7% and 2.8%, respectively. Figure 8c presents the COM of MFDZ with MFP and MFDZ without MFP, showing that the colors of zone 3 with no orientation are diverse, and the colors of zone 4 with <111> orientation are mainly blue. Therefore, the ND//<111> microtexture exists on the rolling surface of zone 4. Figures S7–S9 present the GBD, PD, and COM obtained from the EBSD data on the mold flux sliver defect of other samples. Combined with Figures S7–S9, it can be concluded that the grains of MFDZ with MFP have no orientation, but that there is an ND//<111> microtexture existing on MFP and MFDZ without MFP.
Figure 9 presents the IPF in RD, TD, and ND of the mold flux defect in sample 5. Figure 9a presents the IPF of zone 3. In the RD, there is a slight <203> preferred orientation that has a polar density of 1.67. In the TD, there is a slight <101> preferred orientation that has a polar density of 2.86. However, <334> has an obvious preferred orientation in the ND, and the polar density is 3.89, referring to the polar density scale. Figure 9b presents the IPF of zone 4. In the RD, there is a slight <101> preferred orientation that has a polar density of 2.17. In the TD, there is a slight <223> preferred orientation that has a polar density of 3.48. However, <111> has an obvious preferred orientation in the ND, and the polar density is 4.41, referring to polar density scale. Compared with zone 3, zone 4 has a higher polar density in RD, TD, and ND, indicating that the preferred orientation of grains in zone 4 is stronger. From Figures S10–S12, the same analysis results can be achieved. Thus, the preferred orientation of the grains in MFDZ without MFP is stronger than that in MFDZ with MFP.
Figure 10b presents the PD on the NDZ in sample 9, which shows that there is only the iron BCC phase in the NDZ, accounting for 99.2%. The number of blue <111> oriented grains in NDZ accounts for a large proportion, as the ND//<111> microtexture is mainly on the rolling surface of the NDZ, which is the same as the previous research results [19]. The IPF of the NDZ along RD, TD, and ND is exhibited in Figure 10d. There is a <101> preferred orientation in the RD that has a polar density of 4.89; <434> has a preferred orientation in the TD with a polar density of 2.56; and <111> has a preferred orientation in the ND with a polar density of 5.69. Through testing other non-defect samples (Figures S13–S15), we found that the ND//<111> microtexture is the main microtexture of the NDZ, and the polar density of the NDZ is strong.
Combined with the previous analysis of zone 1, zone 2, zone 3, and zone 4, the number of the <111> oriented grains on different zones is large in the sequences of zone 5 (NDZ), zone 4 (MFDZ without MFP), zone 2 (Al2O3 DZ without Al2O3), zone 1 (Al2O3 DZ with Al2O3), and zone 3 (MFDZ with MFP). The values of the maximum polar density are in the sequence of zone 5 (NDZ) > zone 4 (MFDZ without MFP) > zone 2 (Al2O3 DZ without Al2O3) > zone 3 (MFDZ with MFP) > zone 1 (Al2O3 DZ with Al2O3). It is obvious that the orientation difference between the defect zones and the NDZ is closely related to the existence of particles, and the diversity between the Al2O3 inclusions and the mold flux particles also has an impact on the orientation strength.
In order to intuitively observe the changes and differences of the crystal orientations and the orientation strength on different zones, the crystal orientations and microtexture on different zones of samples 1, 5, and 9 are counted and listed in Table 4. In general, the microtexture of the sheet surface is composed of crystal orientations of the rolling surface and rolling direction. Therefore, there is a {111}<101> microtexture on the rolling surfaces of zone 4 and zone 5. The microtexture in zone 2 is {111}<313>, which is close to the {111}<101> microtexture of zone 5, while the {001}<114> microtexture on the rolling surfaces of zone 1 and the {313}<111> microtexture on the rolling surfaces of zone 2 are quite different from that of zone 5. The IPF information and microtexture components of different zones on other samples are listed in Table S1. Based on all the test results, the microtexture of the NDZ is {111}<101>, and the surface of the Al2O3 DZ without Al2O3 or the MFDZ without MFP is close to the {111}<101> microtexture, but the surface of the Al2O3 DZ with Al2O3 on the MFDZ with MFP is different from the {111}<101> microtexture.
3.3.2. Grain Size Analysis of Defect Zones and Non-Defect Zone
Figure 11 presents the comparison of the grain size distribution of different zones in samples 1, 5, and 9. The grain sizes of zone 5 are among 0–18 μm, and the grains with big sizes (>8 μm) account for 16.7% of the total grains, and the proportion is larger than for those in the other zones. This is because the particles hinder the migration of grain boundaries during the rolling on the defect zones, then the grain boundaries cannot move, resulting in the retention of small angle grain boundaries and the formation of small grains. However, there are no particles that can hinder the grain boundaries from migration into the NDZ.
Table 5 and Figure 12 show the statistical results and comparison diagram of the grain sizes of different zones in samples 1, 5, and 9. According to Table 5 and Figure 12, the average grain size is large in the following sequence: zone 5 (NDZ) > zone 4 (MFDZ without MFP) > zone 2 (Al2O3 DZ without Al2O3) > zone 3 (MFDZ with MFP) > zone 1 (Al2O3 DZ with Al2O3). The difference between the maximum and minimum of grain sizes is as follows: zone 5 (NDZ) > zone 4 (MFDZ without MFP) > zone 2 (Al2O3 DZ without Al2O3) > zone 3 (MFDZ with MFP) > zone 1 (Al2O3 DZ with Al2O3). The analysis results can also be obtained from Table S2.
The average grain sizes and the differences between the maximum and minimum grain sizes on the Al2O3 DZ with Al2O3 and the MFDZ with MFP are smaller than that on the NDZ, because the inclusions (mold flux particles) impede the migration of the recrystallized grain boundaries. However, in terms of the degree of inhibition on the growth of recrystallized grains, the Al2O3 inclusions and the mold flux particles are slightly distinct. The average grain size and the difference between the maximum and minimum grain size on the Al2O3 DZ with Al2O3 are smaller than those on the MFDZ with MFP, on account of promoting grain refinement and homogenization by the small and numerous Al2O3 inclusions. Thus, the diversity of the grain size on defect zones with inclusions(mold flux particles) and NDZ is related to the existence of inclusions (mold flux particles). At the same time, the average size and difference between the maximum and minimum grain sizes are also affected by the types and sizes of the particles.
3.4. Formation Mechanism of Sliver Defect on Automobile Exposed Panel
In the process of steelmaking and continuous casting, due to the decarbonization operation in the converter, the oxygen content of molten steel at the end point of decarbonization will inevitably rise. A large number of Al2O3 inclusions will be generated by Al deoxidation in the subsequent refining process [20]. During the continuous casting process, oxygen from slag and air further reacts with Al in the molten steel to form Al2O3 inclusions [21]. These are the main reasons for the existence of Al2O3 inclusions on automobile exposed panels. In the continuous casting process, if the flow field deviates from the ideal flow field in the mold, and the large mold liquid level fluctuation occurs due to the blockage of the submerged entry nozzle, the entrainment of the mold flux may take place. Then, the involved mold flux particles may be caught by the hooks of the primary solidified shell, leading to the existence of mold flux particles on automobile exposed panels [22]. When the Al2O3 inclusions and mold flux particles are large enough, they can easily lead to the sliver defects of automobile exposed panel.
Figure 13 presents the schematics of the plastic deformation of the rolled steel sheet with a thickness of about 1 mm. When there are no particles in the structure of the steel sheet, the morphology of the grains on the surface of the rolled steel sheet is shown in Figure 13a, and the grains show a slender strip distribution along the rolling direction [23]. As shown in Figure 13b,c, when there are hard Al2O3 inclusions and mold flux particles in the structure of the steel sheet, more dislocations will be generated around the particles during rolling, resulting in stress concentration, cracks, and connected voids [24]. The continuity of the steel matrix will be destroyed and the amount of plastic deformation will be increased so that the distortion energy and the driving force of the recrystallization will increase. To sum up, Al2O3 inclusions and mold flux particles in the structure of the steel sheet will provide energy for recrystallization. When the grain boundary migrates to a straight line, the grain boundary stops moving without the driving force. If there are hard secondary phase particles, such as AlN particles, around the grain boundary, the migration of the grain boundaries will be hindered by these particles [25].
Figure 14 presents a schematic diagram of the grain migration process after recrystallization. Figure 14a–c presents schematic diagrams of the grain boundary migration without particles hindering, and the grain boundary gradually migrates under the action of a driving force, which tends to be flat and forms larger grains. Generally, the small particles can retard the grain growth. In the present work, after hot rolling and cold rolling, the smashed alumina particles are fine in size, even though they are smaller than 1 μm. These smashed Al2O3 particles may also retard grain growth during the continuous annealing process. As shown in Figure 14d, when there are smashed Al2O3 inclusions in the structure, the grain boundary migration after recrystallization will be hindered by the small Al2O3 inclusions. After the grain boundary encounters the small Al2O3 inclusions, the grain boundary movement stops, so the grain size is smaller than that without particle impediment. The final morphology of grains with the grain boundary pinned by the small Al2O3 inclusions is shown in Figure 14f. Figure 14g–i presents schematic diagrams of the grain boundary migration with mold flux particles hindering, and the hindering theory of mold flux particles is similar to that of Al2O3 inclusions.
The ability of inclusions to block grain boundary migration is closely related to the size of the particles. According to the previous research, the pinning force by particles against grain growth can be expressed as follows [26,27]:
where FZ is the pinning force of the particles; KZ is a dimensionless Zener coefficient; R is the radius of particles; f is the particle volume fraction; and γ is the interfacial energy. Because of the samples that nearly have the same composition, KZ, γ, and f can be regarded as the same values. However, the radius of mold flux particles is larger than the smashed Al2O3 inclusions [10,13]. Consequently, the pinning force by the mold flux particles against grain growth is smaller than the smashed Al2O3 inclusions. Therefore, during the recrystallization process after rolling, Al2O3 inclusions have the stronger ability to hinder the migration of grain boundaries. Finally, the average size and the difference between the maximum and minimum grain sizes of the Al2O3 DZ with Al2O3 are smaller than those of the MFDZ with MFP, as shown in Table 5.
The differences of the grain orientations among the Al2O3 DZ with Al2O3 (MFDZ with MFP), the Al2O3 DZ without Al2O3 (MFDZ without MFP), and the NDZ are caused by Al2O3 inclusions or mold flux particles. The orientation of each zone is related to the grain size. Song [28] mentioned that the deformation coordination’s ability for small-size grains is better, so that the orientations of small grains on defect zones are more likely to change during rolling, leading to a large microtexture diversity between the defect zones and NDZ. The average grain size of the Al2O3 DZ without Al2O3 (MFDZ without MFP) is larger than that of the Al2O3 DZ with Al2O3 (MFDZ with MFP), so the microtexture of the Al2O3 DZ without Al2O3 (MFDZ without MFP) is close to the {111}<101> microtexture of NDZ, but the microtexture of the Al2O3 DZ with Al2O3 (MFDZ with MFP) is different from the {111}<101> microtexture of NDZ.
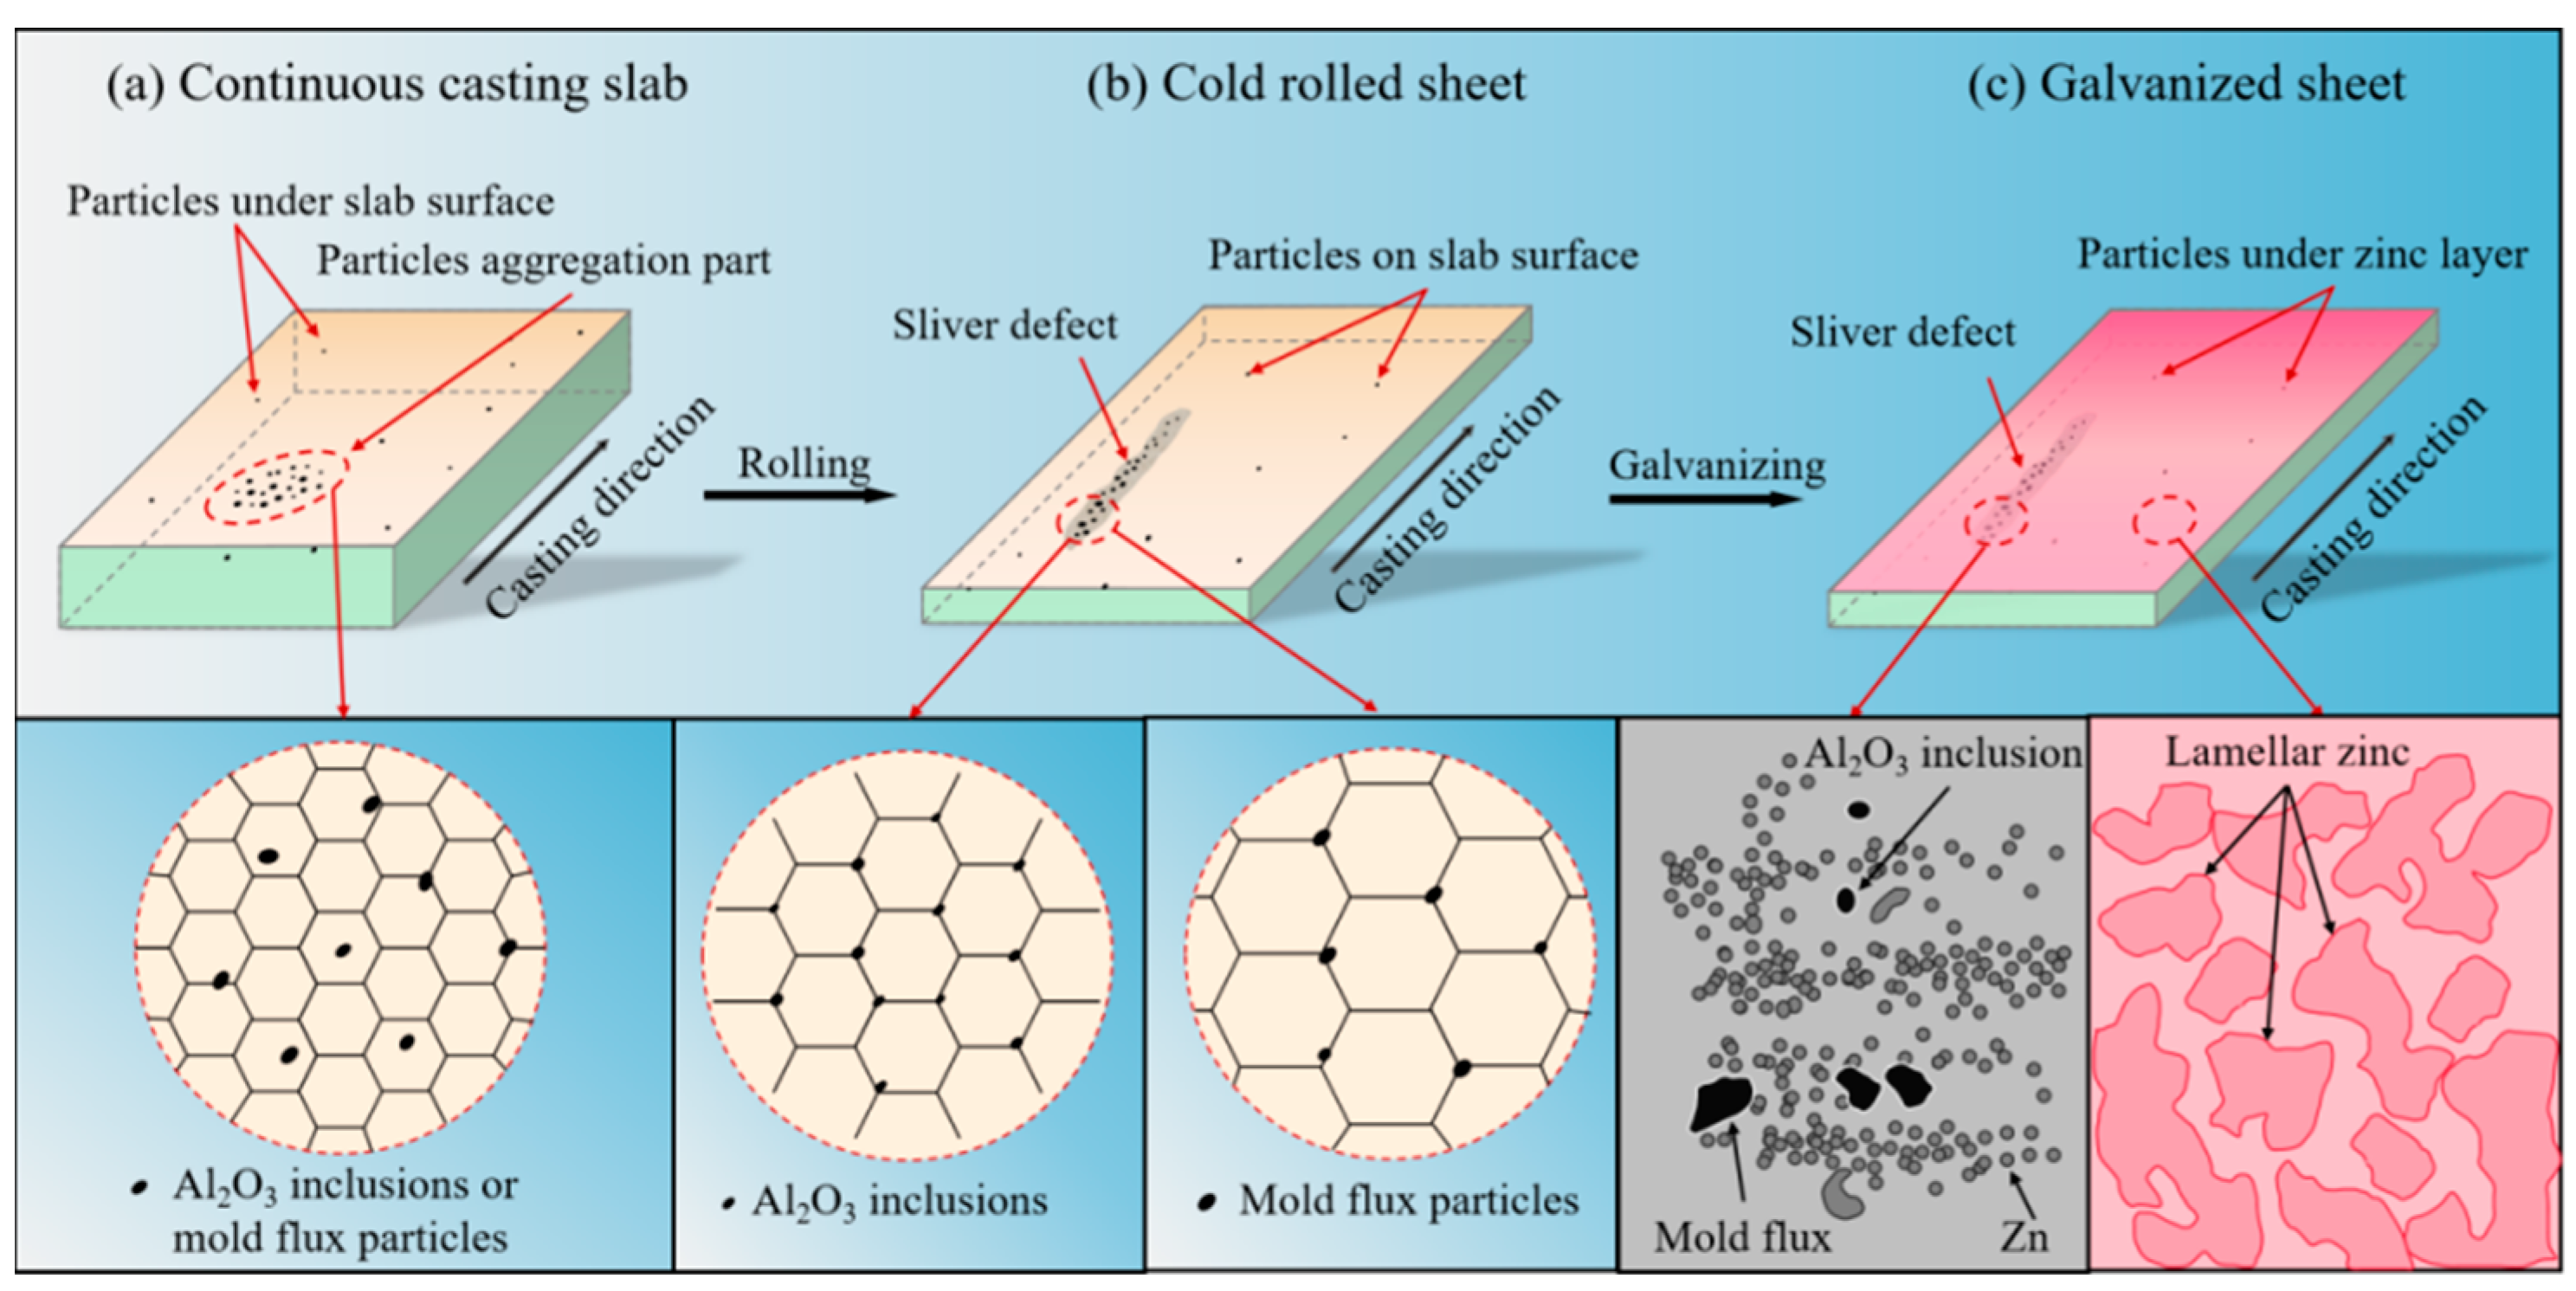
Figure 15 presents the microstructure change during sliver defect formation. In Figure 15a, there are many particles and a particle aggregation part under continuous casting slab surface, and particles randomly distribute in the microstructure of continuous casting slab. In Figure 15b, the particle aggregation part is rolled to a sliver defect, which is composed of the crushed particles. The grains around the smashed Al2O3 inclusions will be smaller than those around the mold flux particles due to the smaller size and denser distribution of the smashed Al2O3 inclusions. From Figure 15c, the secondary particles affect the nucleation and growth of zinc grains on the surface of the steel substrate in the galvanizing process [12]. The heterogeneous nucleation process of zinc grains occurs at the interface between particles and liquid zinc in the sliver defect, then the zinc grains grow along the interface. The more particles, cracks, and holes in the defect zone, the more interfaces can nucleate, and the zinc grains will eventually stack in the defect zone, so the sliver defects will become more obvious after galvanizing. While the homogeneous nucleation process of zinc grains occurs in other areas of the cold-rolled sheet, the new phase is formed directly in liquid zinc [29]. In addition, as shown in Figure 15c, the distribution of zinc on the hot-dip galvanized sheet has obvious differences between the defect zone and the non-defect zone. Regular lamellar zinc can be observed on the surface of the non-defect zone, while there is no lamellar morphology on the sliver defect zones. This is because zinc usually grows freely along the {111} and {110} planes to form a lamellar morphology [12], so the zinc on the non-defect zone composed of the {111}<101>texture presents a lamellar morphology, and the zinc on the sliver defect zones does not present an obvious lamellar morphology due to the few {111} planes of the Al2O3 defect zones composed of the {001}<114>texture and {111}<313>texture. Similarly, there is no obvious lamellar morphology on the mold particle’s sliver defect zone.
Firstly, the inclusions introduced in the steelmaking process will be crushed during the rolling process, forming strip defects along the rolling direction. Due to the cracks and connected voids caused by particles and the hindering effect of the mashed particles on grain boundary migration, differences in the average grain size, orientation, and microtexture among the Al2O3 DZ with Al2O3 (MFDZ with MFP), the Al2O3 DZ without Al2O3 (MFDZ without MFP), and the NDZ are generated. Secondly, because of the dense distribution of inclusions, cracks, and holes in the sliver defect zone, the zinc grains are stacked during the hot galvanizing process, which makes the sliver defect prominent. The texture affects the distribution of the zinc layer on the hot-dip galvanized sheet, resulting in no lamellar zinc layer in the sliver defect zone, while the zinc on the non-defect zone presents a lamellar morphology. Finally, combining the above factors, the sliver defects are formed after light irradiation.
The inclusion introduced in the steelmaking process is the original factor that forms the strip defect. Then, the smashed inclusions make the texture and orientation of the defect zone and the non-defect zone different, resulting in the stacking of zinc grains and the irregular distribution of zinc on the sliver defect zones, which will ultimately lead to the formation of the sliver defects on the hot-dip galvanized automobile exposed panel. Those are the causes and processes of the formation of dark-gray or bright white sliver defects on the surface of an automobile exposed panel.
4. Conclusions
The effects of the Al2O3 inclusions or mold flux particles on the surrounding microstructure of sliver defects on the surface of an automobile exposed panel were studied to reveal the formation mechanism of the sliver defects. The conclusions are obtained as follows. Additionally, Al2O3 DZ with Al2O3, Al2O3 DZ without Al2O3, MFDZ with MFP, MFDZ without MFP, and NDZ are the abbreviations of the Al2O3 defect zone with Al2O3 inclusions, the Al2O3 defect zone without Al2O3 inclusions, the mold flux defect zone with mold flux, the mold flux defect zone without mold flux particles, and the non-defect zone, respectively.
(1) For the typical Al2O3 sliver defect with a width of 530 μm on the surface of the automobile exposed panel, the zinc layer on the surface of the Al2O3 defect can be removed with quantitative electrolysis, and the Al2O3 inclusions with sizes ranging from 5 to 12 μm that are exposed by quantitative electrolysis can be divided into an irregular shape, a plate-like shape, a ring-like shape, and a polyhedral shape according to their morphology.
(2) For the typical mold flux sliver defect with a width of 350 μm, the zinc layer on the surface of the mold flux defect can be removed by nonaqueous electrolysis, and the mold flux inclusions with sizes in the range of 5–17 μm that are exposed by nonaqueous electrolysis can be roughly divided into irregular shape, spherical shape, polyhedral shape, and plate-like shape according to their morphology.
(3) The strength of crystal orientation can be directly reflected in the polar density values. The values of the maximum polar density on the different zones are in the sequence of zone 5 (NDZ) > zone 4 (MFDZ without MFP) > zone 2 (Al2O3 DZ without Al2O3) > zone 3 (MFDZ with MFP) > zone 1 (Al2O3 DZ with Al2O3). It is obvious that the difference in the orientation strengths between the defect zones and the NDZ is closely related to the existence of particles, and the impact of the smashed Al2O3 inclusions on the orientation strength is stronger than that of the mold flux particles.
(4) The microtexture of the steel sheet surface is composed of crystal orientations of rolling surface and rolling direction. There is a {111}<101> microtexture on the rolling surfaces of zone 5 (NDZ). However, the smashed Al2O3 inclusions (mold flux particles) can change the crystal orientations of the steel matrix. The closer the location is to the particles, the greater the influence of the particles on the orientation.
(5) The average grain size in the different zones is large in the following sequence: zone 5 (NDZ) > zone 4 (MFDZ without MFP) > zone 2 (Al2O3 DZ without Al2O3) > zone 3 (MFDZ with MFP) > zone 1 (Al2O3 DZ with Al2O3). This is because the smashed Al2O3 inclusions (mold flux particles) can hinder the migration of grain boundaries, and the hindering effect of the smashed Al2O3 inclusions is stronger than that of mold flux particles.
(6) The inclusion introduced in the steelmaking process is the original factor that forms the strip defect. Then, the smashed inclusions make the texture and orientation of the defect zone and the non-defect zone different, resulting in the stacking of zinc grains and the irregular distribution of zinc in the sliver defect zone, which will ultimately lead to the formation of the sliver defects on the hot-dip galvanized automobile exposed panel. Those are the causes of the formation of dark-gray or bright white sliver defects on the surface of an automobile exposed panel.
Supplementary Materials
The following supporting information can be downloaded at: https://www.mdpi.com/article/10.3390/met13040661/s1, Figure S1: Grain boundary distribution (GBD), phase distribution (PD), and crystal orientation maps (COM) on Al2O3 sliver defect of sample 2. (a) GBD; (b) PD; and (c) COM; Figure S2: GBD, PD, and COM on Al2O3 sliver defect of sample 3. (a) GBD; (b) PD; and (c) COM; Figure S3: GBD, PD, and COM on Al2O3 sliver defect of sample 4. (a) GBD; (b) PD; and (c) COM; Figure S4: Inverse pole figures (IPF) in rolling direction (RD), transverse direction (TD), and normal direction (ND) of Al2O3 sliver defect on sample 2. (a) Zone 1’; (b) zone 2’; Figure S5: IPF in RD, TD, and ND of Al2O3 sliver defect on sample 3. (a) Zone 1+; (b) zone 2+; Figure S6: IPF in RD, TD, and ND of Al2O3 sliver defect on sample 4. (a) Zone 1−; (b) zone 2−; Figure S7: GBD, PD, and COM on mold flux sliver defect of sample 6. (a) GBD; (b) PD; and (c) COM; Figure S8: GBD, PD, and COM on mold flux sliver defect of sample 7. (a) GBD; (b) PD; and (c) COM; Figure S9: GBD, PD, and COM on mold flux sliver defect of sample 8. (a) GBD; (b) PD; and (c) COM; Figure S10: IPF in RD, TD, and ND of Al2O3 sliver defect on sample 6. (a) Zone 1’; (b) zone 2’; Figure S11: IPF in RD, TD, and ND of Al2O3 sliver defect on sample 7. (a) Zone 1+; (b) zone 2+; Figure S12: IPF in RD, TD, and ND of Al2O3 sliver defect on sample 8. (a) Zone 1−; (b) zone 2−; Figure S13: GBD, PD, COM, and IPF on non-defect zone (NDZ) of sample 10. (a) GBD; (b) PD; (c) COM; and (d) IPF; Figure S14: GBD, PD, COM, and IPF on non-defect zone (NDZ) of sample 11. (a) GBD; (b) PD; (c) COM; and (d) IPF; Figure S15: GBD, PD, COM, and IPF on non-defect zone (NDZ) of sample 12. (a) GBD; (b) PD; (c) COM; and (d) IPF; Table S1: Statistical results of crystal orientations and microtexture in different zones of samples 2, 3, 4, 6, 7, 8, 10, 11, and 12; Table S2: Statistical results of grain size distributions of different zones on samples 1, 5, and 9.
Author Contributions
Conceptualization, T.L. and J.Y.; methodology, Q.Z.; software, T.L.; validation, Q.Z., T.L. and J.Y.; formal analysis, Q.Z.; investigation, T.L.; resources, J.Y.; data curation, Q.Z.; writing—original draft preparation, Q.Z.; writing—review and editing, Q.Z.; visualization, J.Y.; supervision, T.L.; project administration, T.L.; funding acquisition, J.Y. All authors have read and agreed to the published version of the manuscript.
Funding
This research work was supported by the National Natural Science Foundation of China (U1960202).
Data Availability Statement
Data available in a publicly accessible repository.
Acknowledgments
The authors gratefully acknowledge financial support by the National Natural Science Foundation of China (U1960202).
Conflicts of Interest
The authors declare no conflict of interest.
References
- Sasai, K. Agglomeration and Removal of Alumina Inclusions in Molten Steel with Controlled Concentrations of Interfacial Active Elements. ISIJ Int. 2020, 60, 409–418. [Google Scholar] [CrossRef] [Green Version]
- Lopez, P.E.R.; Mills, K.C.; Lee, P.D. A Unified Mechanism for the Formation of Oscillation Marks. St. Metall. Mater. Trans. B. 2012, 43, 110–122. [Google Scholar]
- Zhang, Q.Y.; Wang, L.; Wang, X.H. Influence of casting speed variation during unsteady continuous casting. ISIJ Int. 2006, 46, 1421–1426. [Google Scholar] [CrossRef] [Green Version]
- Wang, M.; Bao, Y.P. Source and negative effects of macro-inclusions in titanium stabilized ultra low carbon interstitial free (Ti-IF) steel. Met. Mater. Int. 2012, 18, 29–35. [Google Scholar] [CrossRef]
- Chen, Y.; Zeng, J.H.; Wu, G.R. Control for Surface Faint-Sliver Defects in Cold-Rolled IF Steel Sheet. Advanced Materials Research. Adv. Mater. Res. 2011, 396, 1145–1150. [Google Scholar] [CrossRef]
- Gao, W.F. Formation and Prevention of Sliver Defects on the Surface of Cold-Rolled Strip. Advanced Materials Research. Adv. Mater. Res. 2011, 402, 221–226. [Google Scholar] [CrossRef]
- Záhumenský, P.; Merwin, M.J. Evolution of artificial defects from slab to rolled products, J. Mater. Process. Mater. Process. Tech. 2008, 196, 266–278. [Google Scholar] [CrossRef]
- Utsunomiya, H.; Hara, K.; Matsumoto, R.; Azushima, A. Formation mechanism of surface scale defects in hot rolling process. CIRP Ann. 2014, 63, 261–264. [Google Scholar] [CrossRef]
- Yu, H.X.; Ji, C.X.; Chen, B.; Wang, C.; Zhang, Y.H. Characteristics and evolution of inclusion induced surface defects of cold rolled IF sheet. J. Iron Steel Res. 2015, 22, 17–23. [Google Scholar] [CrossRef]
- Pan, X.Q.; Yang, J.; Park, J.; Ono, H. Distribution characteristics of inclusions along with the surface sliver defect on the exposed panel of automobile: A quantitative electrolysis method. Int. J. Miner. Metall. Mater. 2020, 27, 1489–1498. [Google Scholar] [CrossRef]
- Cao, S.; Zhang, J.; Wu, J.; Chen, J.J. Analysis of Orange Peel Defect in St14 Steel Sheet by Electron Backscattered Diffraction (EBSD). Mater. Sci. Technol. 2005, 21, 17–20. [Google Scholar]
- Dong, B.; Yang, C.Z.; Cai, J.; Huang, D.J. Formation mechanism of white linear defects on galvanized steel sheet. Journal of Iron and Steel Research. Iron Steel Res. 2015, 27, 56–61. [Google Scholar]
- Li, T.T.; Yang, J.; Li, G.B.; Kang, W.; Lin, Y.; Meng, J.S. Characteristics of sliver defects caused by mould flux entrainment on the surface of the hot-dip galvanised automobile exposed panel. Ironmak. Steelmak. 2022, 49, 456–471. [Google Scholar] [CrossRef]
- Li, H.B.; Yuan, P.; Chen, B.; Liu, F.G. The influence of slag chemistry on the formation of sliver defects. Ironmak. Steelmak. 2019, 46, 463–468. [Google Scholar] [CrossRef]
- Moir, S.; Preston, J.J. Surface defects-evolution and behaviour from cast slab to coated strip. Mater. Process. Tech. 2002, 125, 720–724. [Google Scholar] [CrossRef]
- Ravinath, H.; Ahammed, I.; Harigovind, P.; VR, A.S.; Shankar, K.V.; Nandakishor, S. Nandakishor, impact of aging temperature on the metallurgical and dry sliding wear behaviour of LM25/Al2O3 metal matrix composite for automotive application. Int. J. Lightweight Mater. Manuf. 2023, in press. [Google Scholar]
- Jiang, B.; Wu, M.; Sun, H.; Wang, Z.L.; Zhao, Z.G.; Liu, Y.Z. Prediction Model of Austenite Growth and the Role of MnS Inclusions in Non-Quenched and Tempered Steel. Met. Mater. Int. 2018, 24, 15–22. [Google Scholar] [CrossRef]
- Gao, L.F.; Kang, Y.L.; Lv, G.; Zhu, G.M.; Liu, R.D.; Lin, L.J. Study on Microstructure Evolution and Micro-Texture inTi-IF Steel During Continuous Annealing. Iron Steel Res. 2011, 23, 33–36. [Google Scholar]
- Muraki, M.; Toge, T.; Sakata, K.; Obara, T.; Furubayashi, E. Formation mechanism of {111} recrystallization texture in ferritic steels. Tetsu Hagane 1999, 85, 751–757. [Google Scholar] [CrossRef] [Green Version]
- Deng, X.; Ji, C.; Zhu, G.; Liu, Q.; Huang, F.; Tian, Z.; Wang, X. Quantitative Evaluations of Surface Cleanliness in IF Steel Slabs at Unsteady Casting. Metall. Mater. Trans. B 2019, 50, 1974–1987. [Google Scholar] [CrossRef]
- Leao, P.B.P.; Klug, J.L.; de Abreu, H.F.G.; Carneiro, C.A.R.; Ferreira, H.C.; Bielefeldt, W.V. Sliver defects in an ultra-low carbon Al-killed steel caused by low steel level in the tundish. Ironmak. Steelmak. 2021, 48, 978–987. [Google Scholar] [CrossRef]
- Lee, G.G.; Shin, H.J.; Kim, S.H.; Kim, S.K.; Choi, W.Y.; Thomas, B.G. Prediction and control of subsurface hooks in continuous cast ultra-low-carbon steel slabs. Ironmak. Steelmak. 2009, 36, 39–49. [Google Scholar] [CrossRef] [Green Version]
- Hasan, S.M.; Haldar, A.; Chakrabarti, D. Microstructure and mechanical property of cold rolled low carbon steel after prolonged annealing treatment. Mater. Sci. Technol. 2012, 28, 823–828. [Google Scholar] [CrossRef]
- Liu, G.; Li, S.L.; Zhang, H.L.; Wang, X.T.; Wang, Y.L. Characterization of Impact Deformation Behavior of a Thermally Aged Duplex Stainless Steel by EBSD. Acta Metall. Sin. (Engl. Lett.) 2018, 31, 798–806. [Google Scholar] [CrossRef] [Green Version]
- Liu, H.T.; Yao, S.J.; Sun, Y.; Gao, F.; Song, H.Y.; Liu, G.H.; Li, L.; Geng, D.Q.; Liu, Z.Y.; Wang, G.D. Evolution of microstructure, texture and inhibitor along the processing route for grain-oriented electrical steels using strip casting. Mater. Charact. 2015, 106, 273–282. [Google Scholar] [CrossRef]
- Manohar, P.A.; Ferry, M.; Chandra, T. Five Decadesof the Zener Equation. ISIJ Int. 1998, 38, 913–924. [Google Scholar] [CrossRef] [Green Version]
- Dong, Z.Q.; Jiang, B.; Mei, Z.; Zhang, C.L.; Zhou, L.Y.; Liu, Y.Z. Effect of Carbide Distribution on the Grain Refinement in the Steel for Large-Size Bearing Ring. steel research international. Steel Res. Int. 2016, 87, 745–751. [Google Scholar] [CrossRef]
- Song, H.Y.; Wang, Y.P.; Esling, C.; Wang, G.D.; Liu, H.T. The role of grain colony on secondary recrystallization in grain-oriented electrical steel: New insights from an original tracking experiment. Acta Mater. 2021, 206, 116611. [Google Scholar] [CrossRef]
- Kozisek, Z.J. Crystallization in small droplets: Competition between homogeneous and heterogeneous nucleation. Journal Of Crystal Growth. Cryst. Growth 2019, 522, 53–60. [Google Scholar] [CrossRef]
Figure 1.
Macro morphology of sliver defects. (a) Al2O3 sliver defect; (b) defect zone of (a); (c) non-defect zone of (a); (d) mold flux sliver defect; (e) defect zone of (d); and (f) non-defect zone of (d).
Figure 1.
Macro morphology of sliver defects. (a) Al2O3 sliver defect; (b) defect zone of (a); (c) non-defect zone of (a); (d) mold flux sliver defect; (e) defect zone of (d); and (f) non-defect zone of (d).
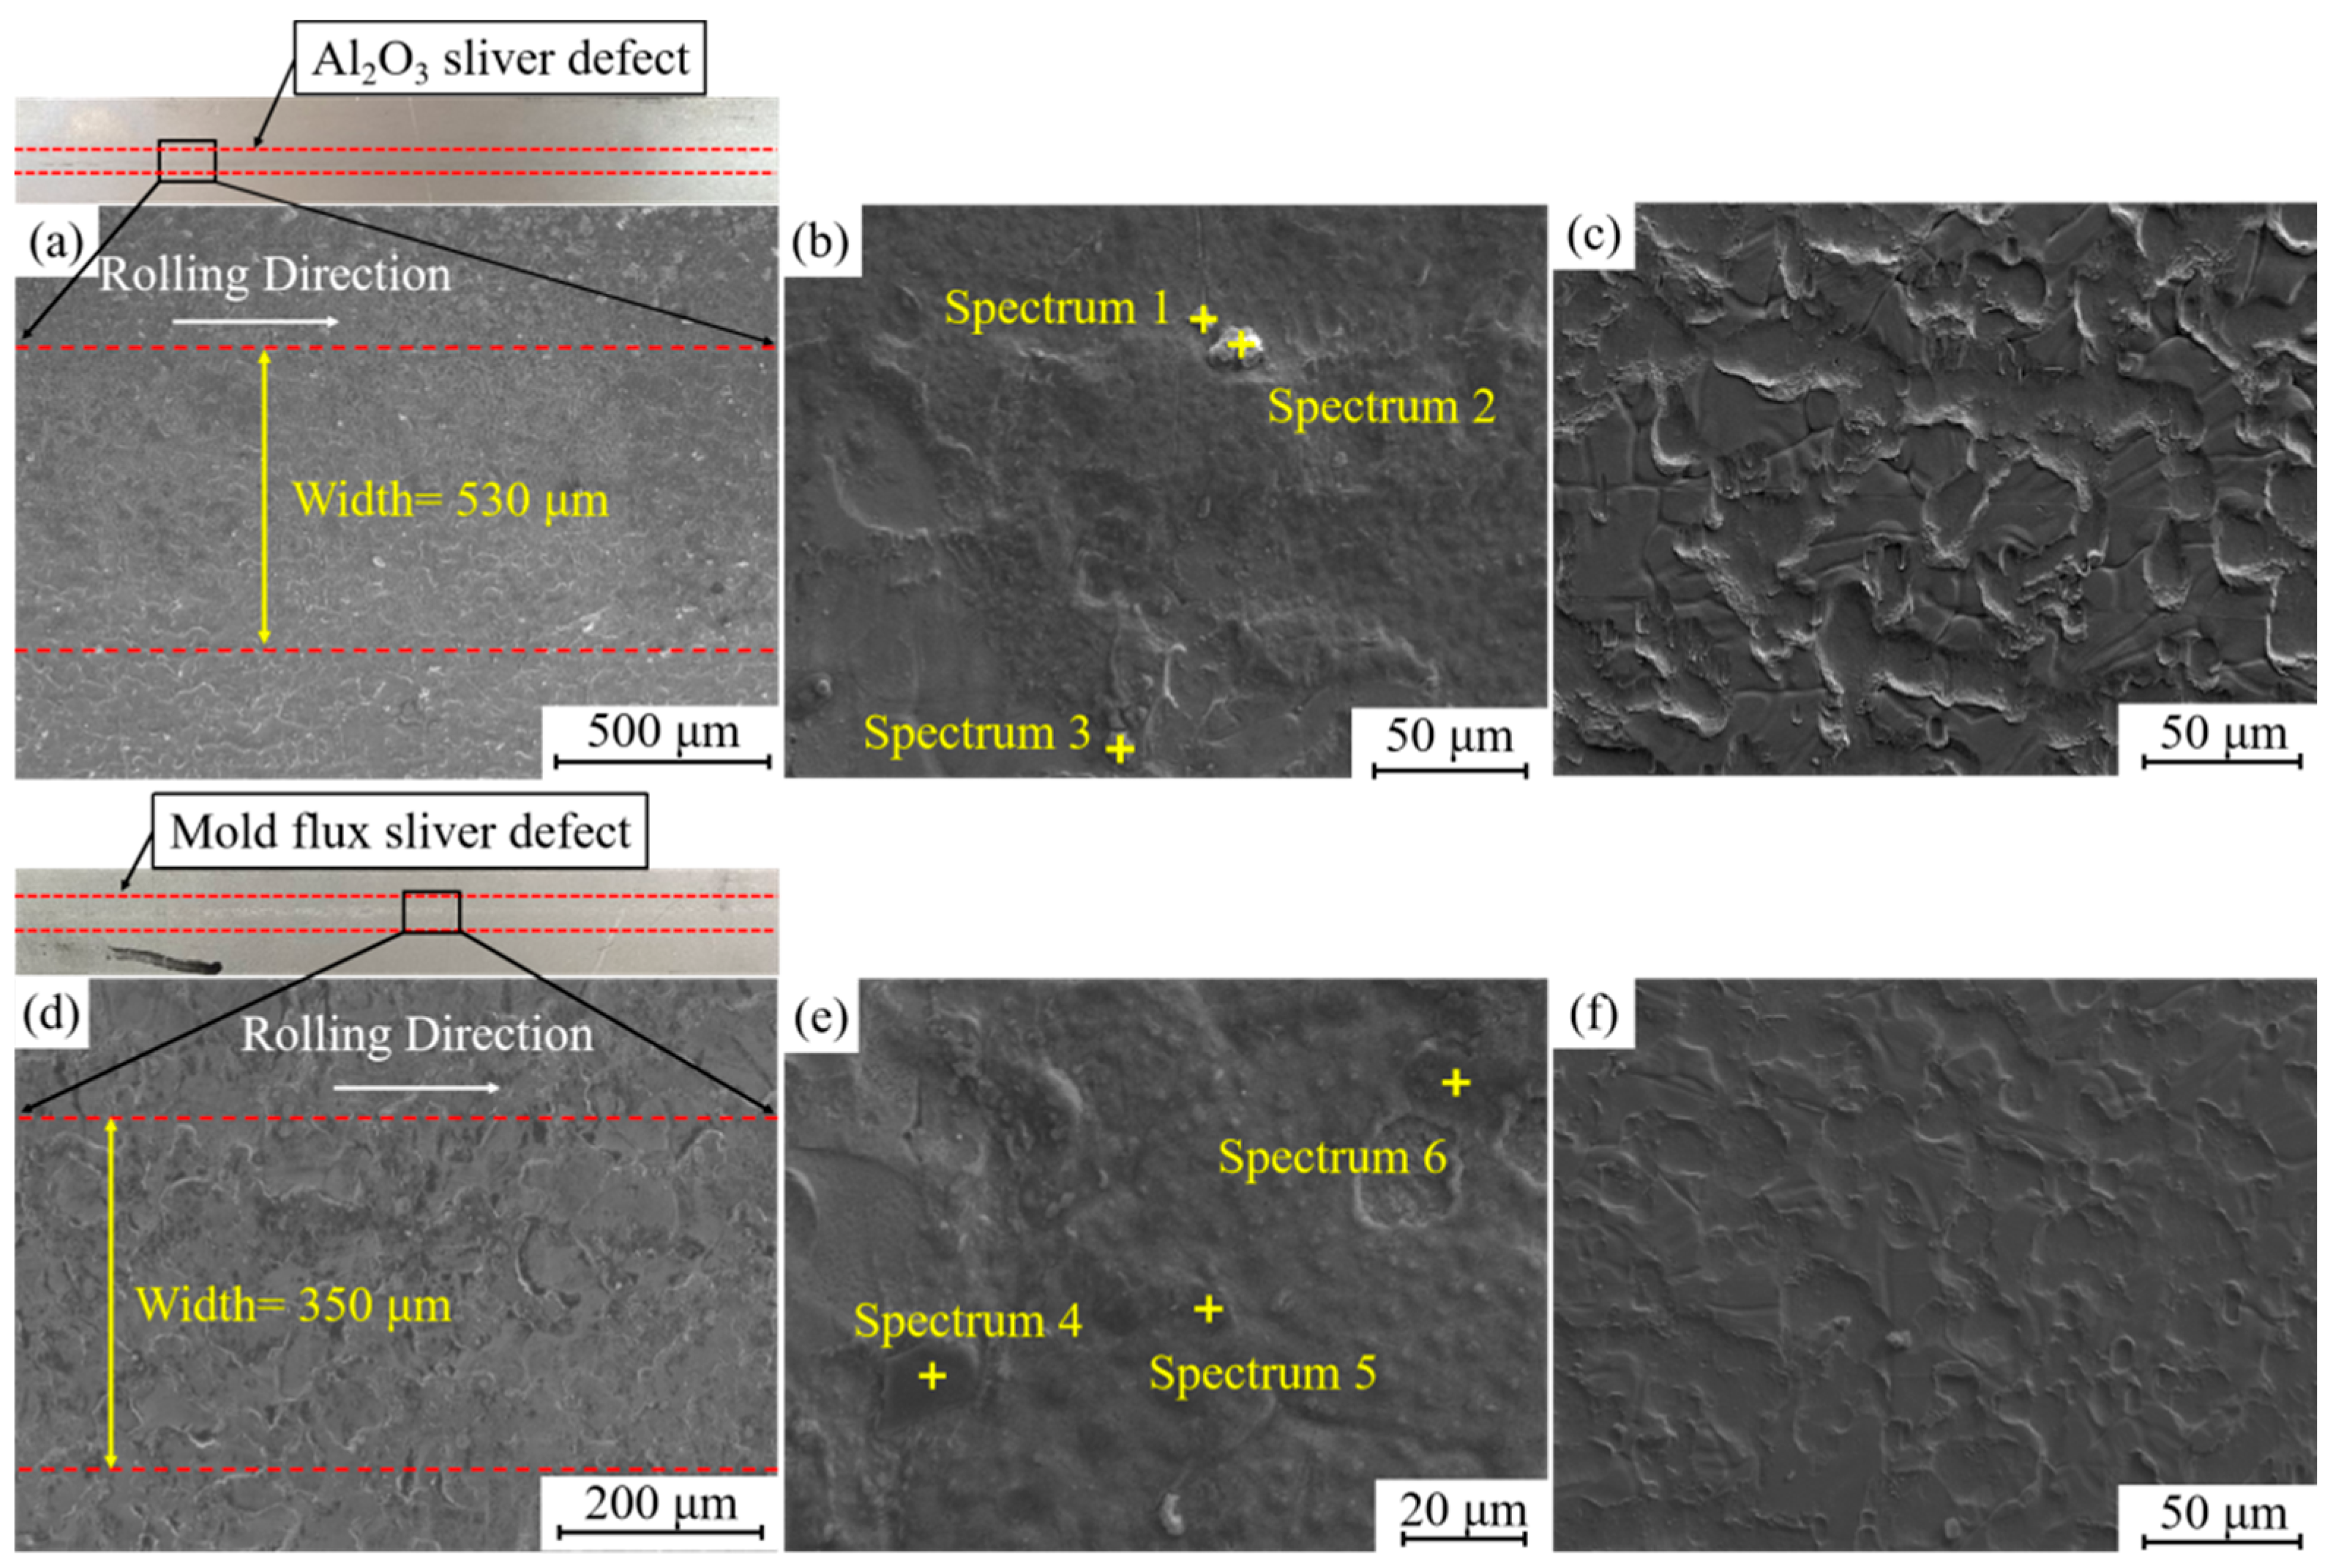
Figure 2.
Schematic diagram of electrolytic device.
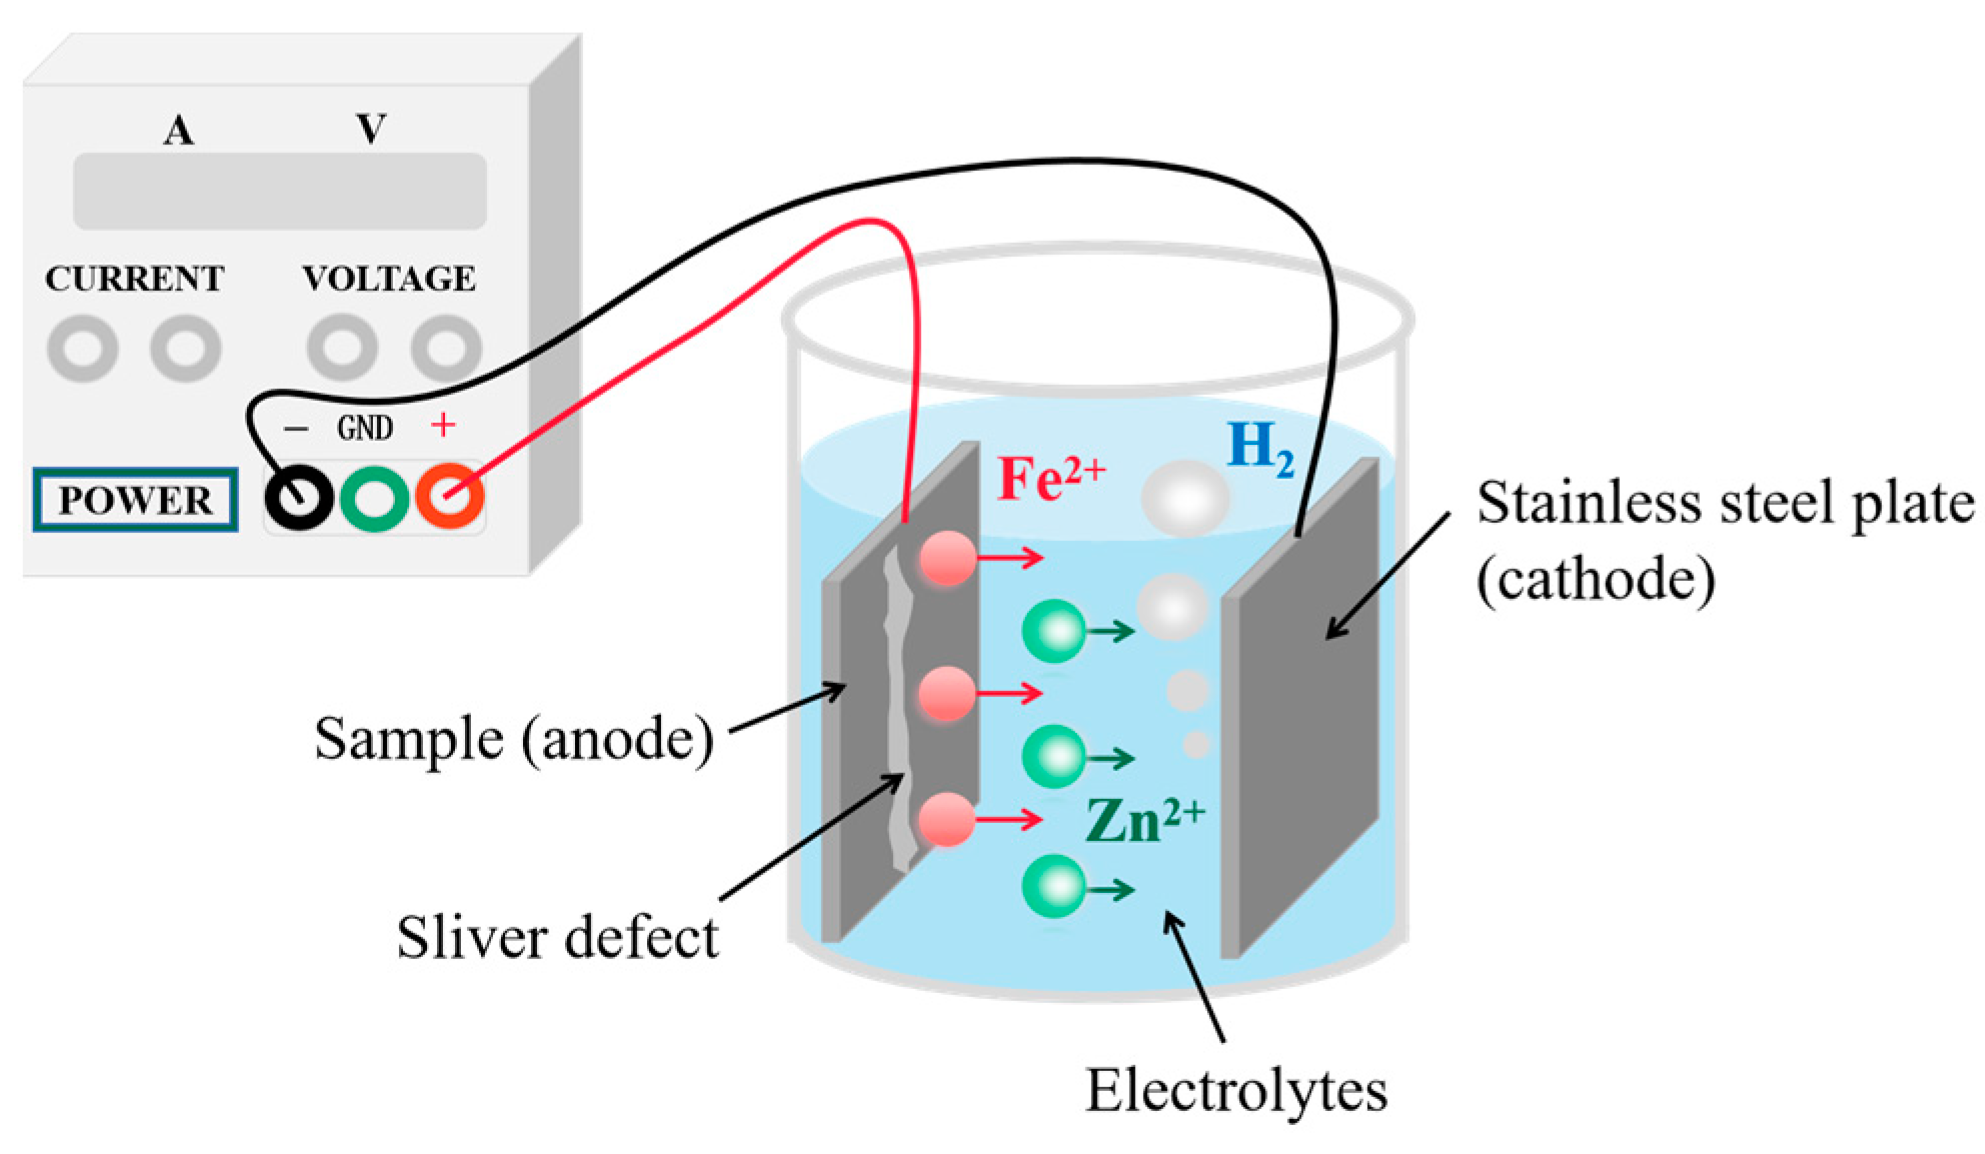
Figure 3.
Morphology of particles of Al2O3 and mold flux in sliver defect zone after different electrolytic times. Al2O3 sliver defect zone: (a) 5 min, (b) 10 min, and (c) 15 min. Mold flux sliver defect zone: (d) 2 min, (e) 3 min, and (f) 4 min.
Figure 3.
Morphology of particles of Al2O3 and mold flux in sliver defect zone after different electrolytic times. Al2O3 sliver defect zone: (a) 5 min, (b) 10 min, and (c) 15 min. Mold flux sliver defect zone: (d) 2 min, (e) 3 min, and (f) 4 min.

Figure 4.
Typical three-dimensional morphology of Al2O3 inclusions and mold flux particles in Al2O3 and mold flux sliver defects after electrolysis. Al2O3 defects: (a) irregular shape, (b) plate-like shape, (c) ring-like shape, and (d) polyhedral shape. Mold flux defects: (e) irregular shape, (f) spherical shape, (g) polyhedral shape, and (h) plate-like shape.
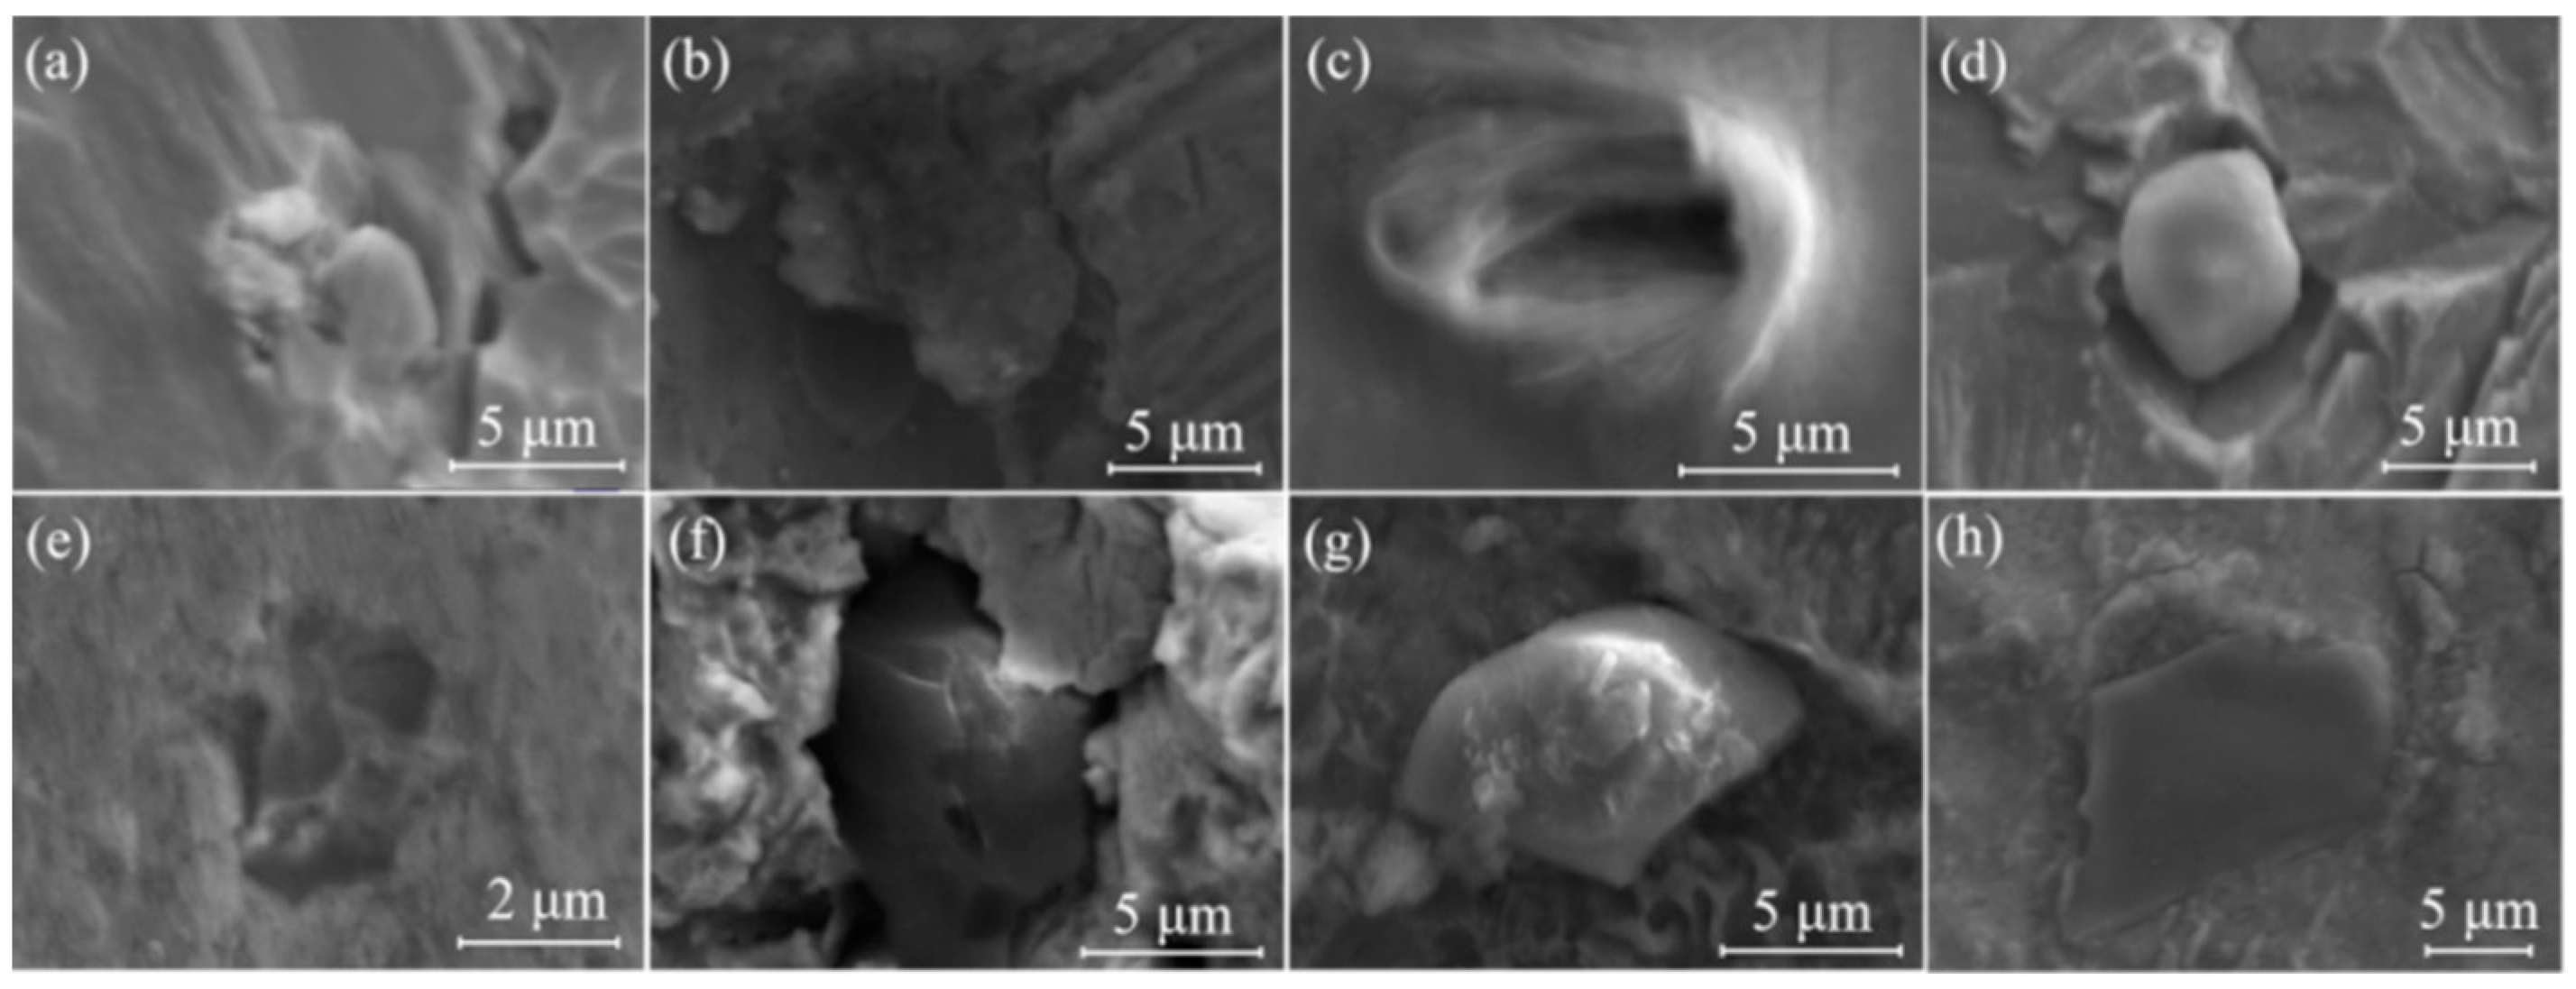
Figure 5.
Elemental map scanning (EDS) of Al2O3 inclusions and mold flux particles in Al2O3 and mold flux sliver defects after electrolysis. Al2O3 defects: (a) irregular shape, (b) plate-like shape, (c) ring-like shape, and (d) polyhedral shape. Mold flux defects: (e) irregular shape, (f) spherical shape, (g) polyhedral shape, and (h) plate-like shape.

Figure 6.
Grain boundary distribution (GBD), phase distribution (PD), and crystal orientation maps (COM) on Al2O3 sliver defect of sample 1, as well as the morphology and map scanning analysis results of Al2O3 inclusions. (a) GBD; (b) PD; (c) COM; and (d) the morphology and map scanning analysis results.

Figure 7.
Inverse pole figures (IPF) in rolling direction (RD), transverse direction (TD), and normal direction (ND) of Al2O3 sliver defect in sample 1. (a) Zone 1; (b) zone 2.
Figure 7.
Inverse pole figures (IPF) in rolling direction (RD), transverse direction (TD), and normal direction (ND) of Al2O3 sliver defect in sample 1. (a) Zone 1; (b) zone 2.

Figure 8.
GBD, PD, and COM on mold flux sliver defect of sample 5, as well as the morphology and map scanning analysis results of mold flux particles. (a) GBD; (b) PD; (c) COM; and (d) the morphology and map scanning analysis results.
Figure 8.
GBD, PD, and COM on mold flux sliver defect of sample 5, as well as the morphology and map scanning analysis results of mold flux particles. (a) GBD; (b) PD; (c) COM; and (d) the morphology and map scanning analysis results.
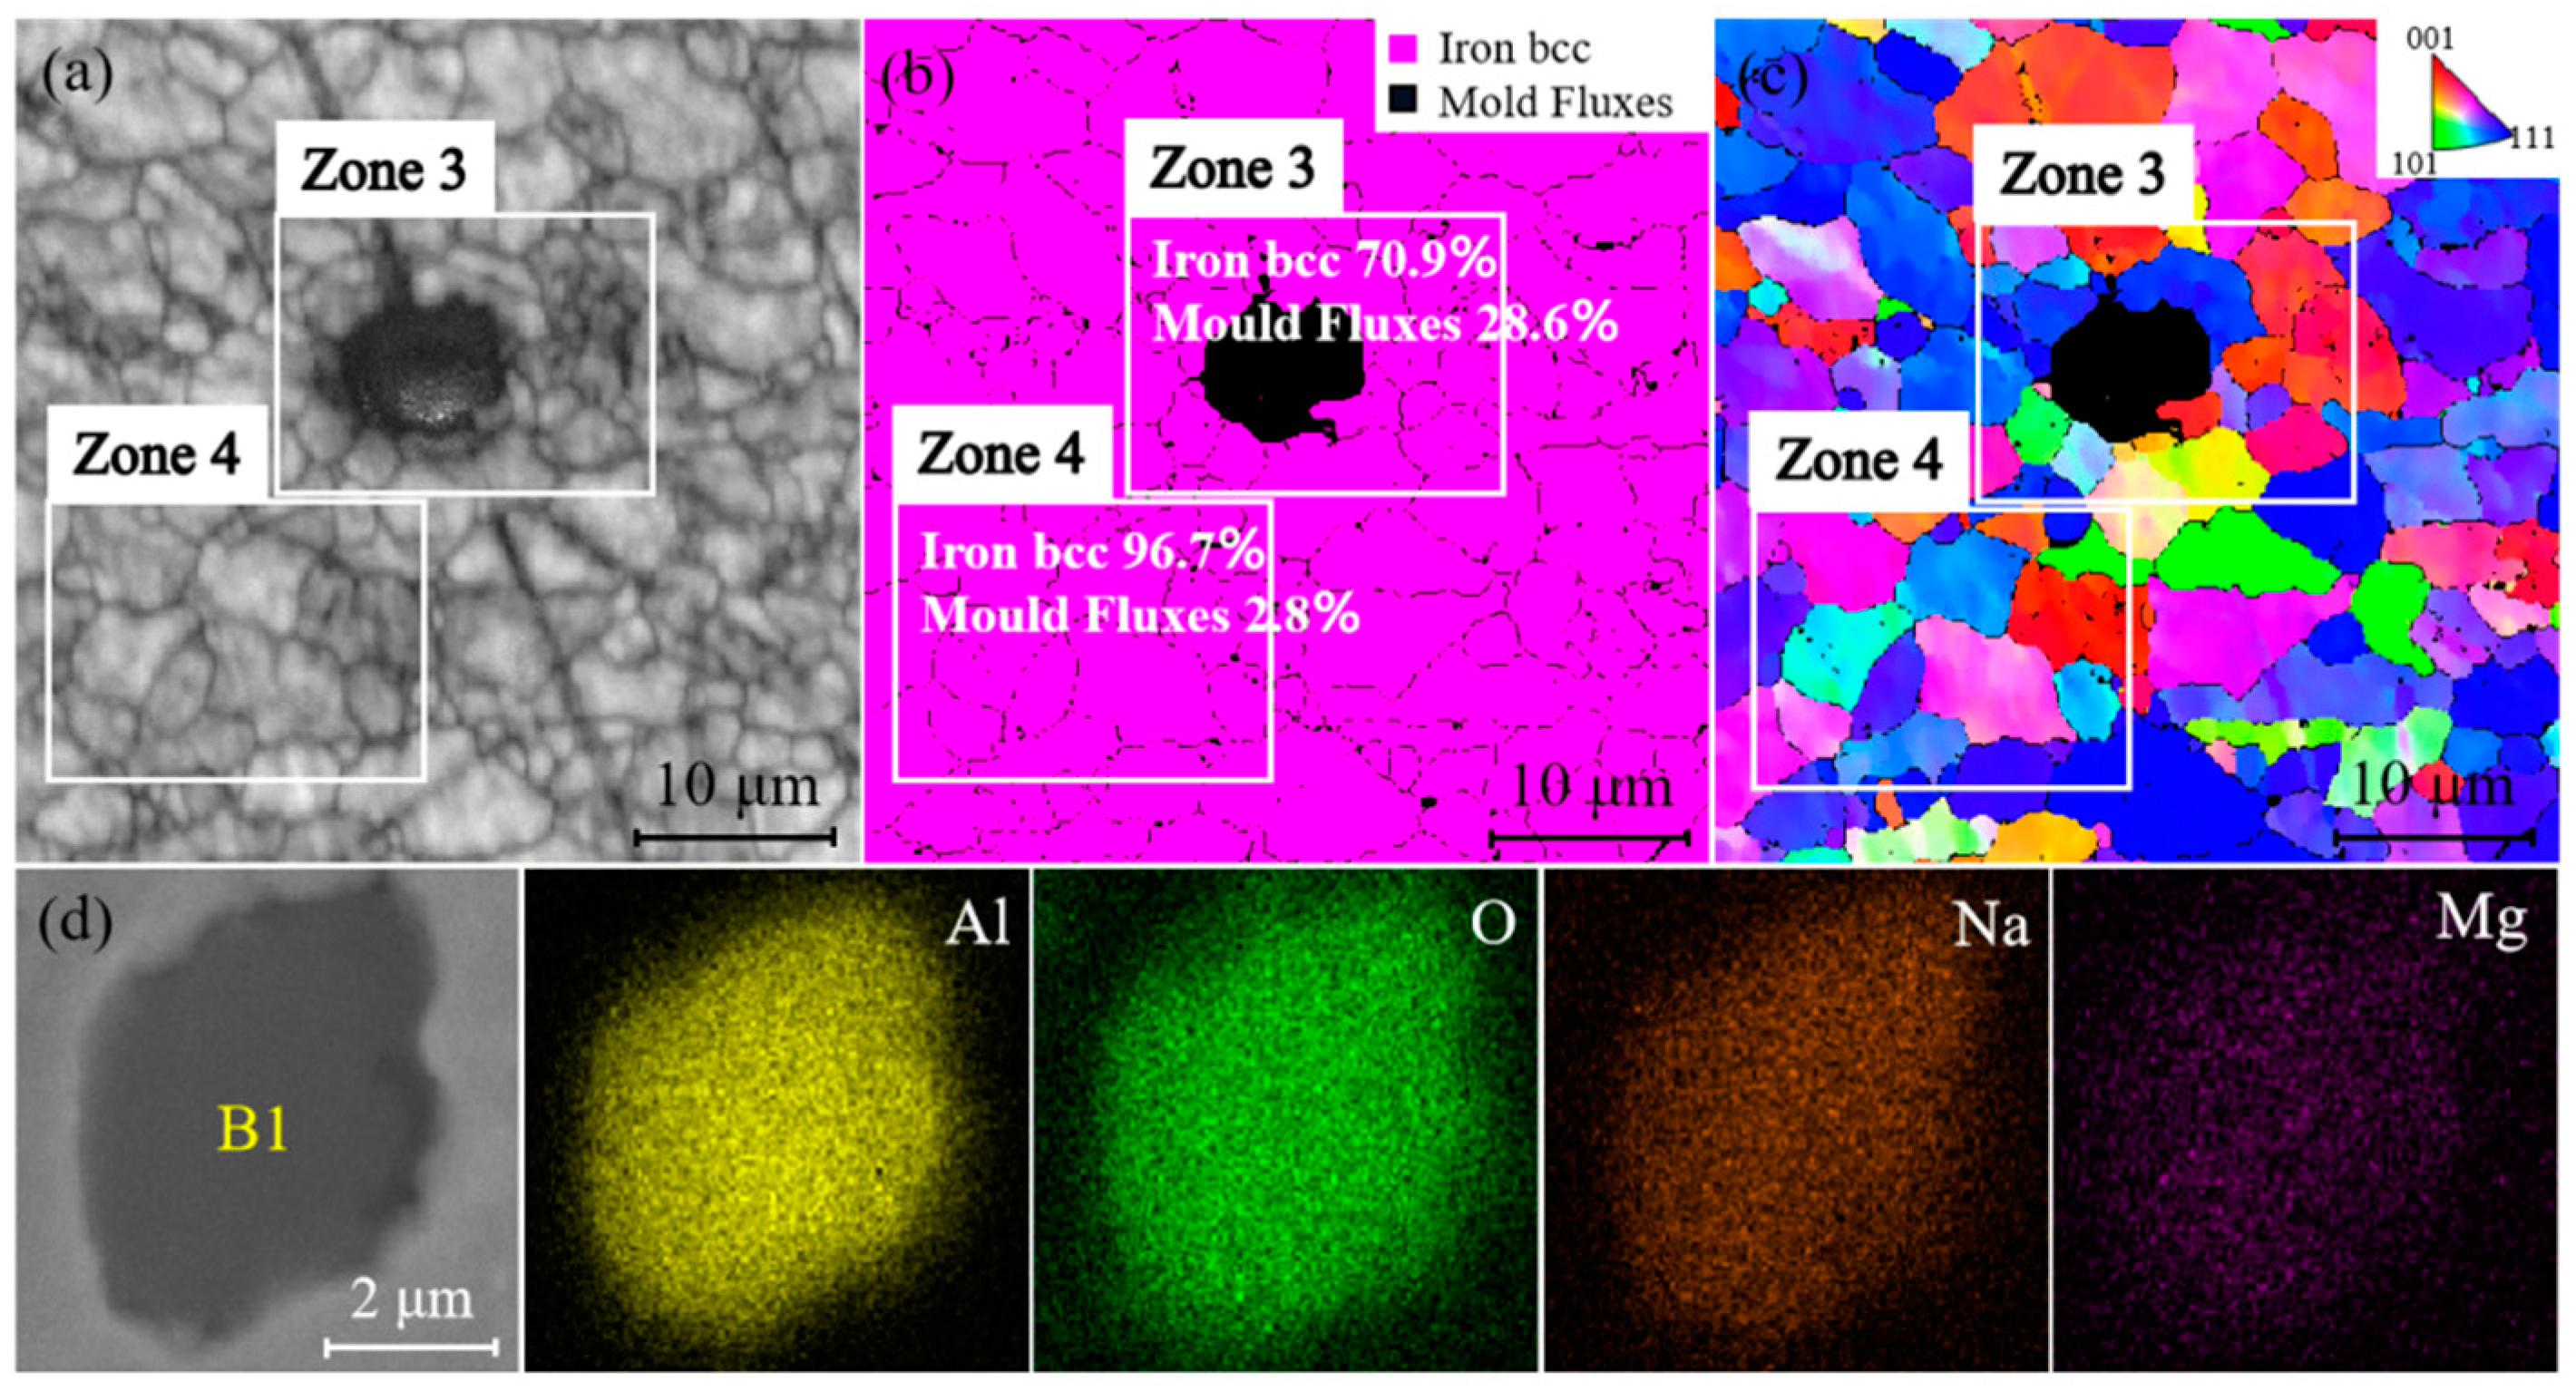
Figure 9.
IPF in RD, TD, and ND of mold flux sliver defect in sample 5. (a) Zone 3; (b) zone 4.
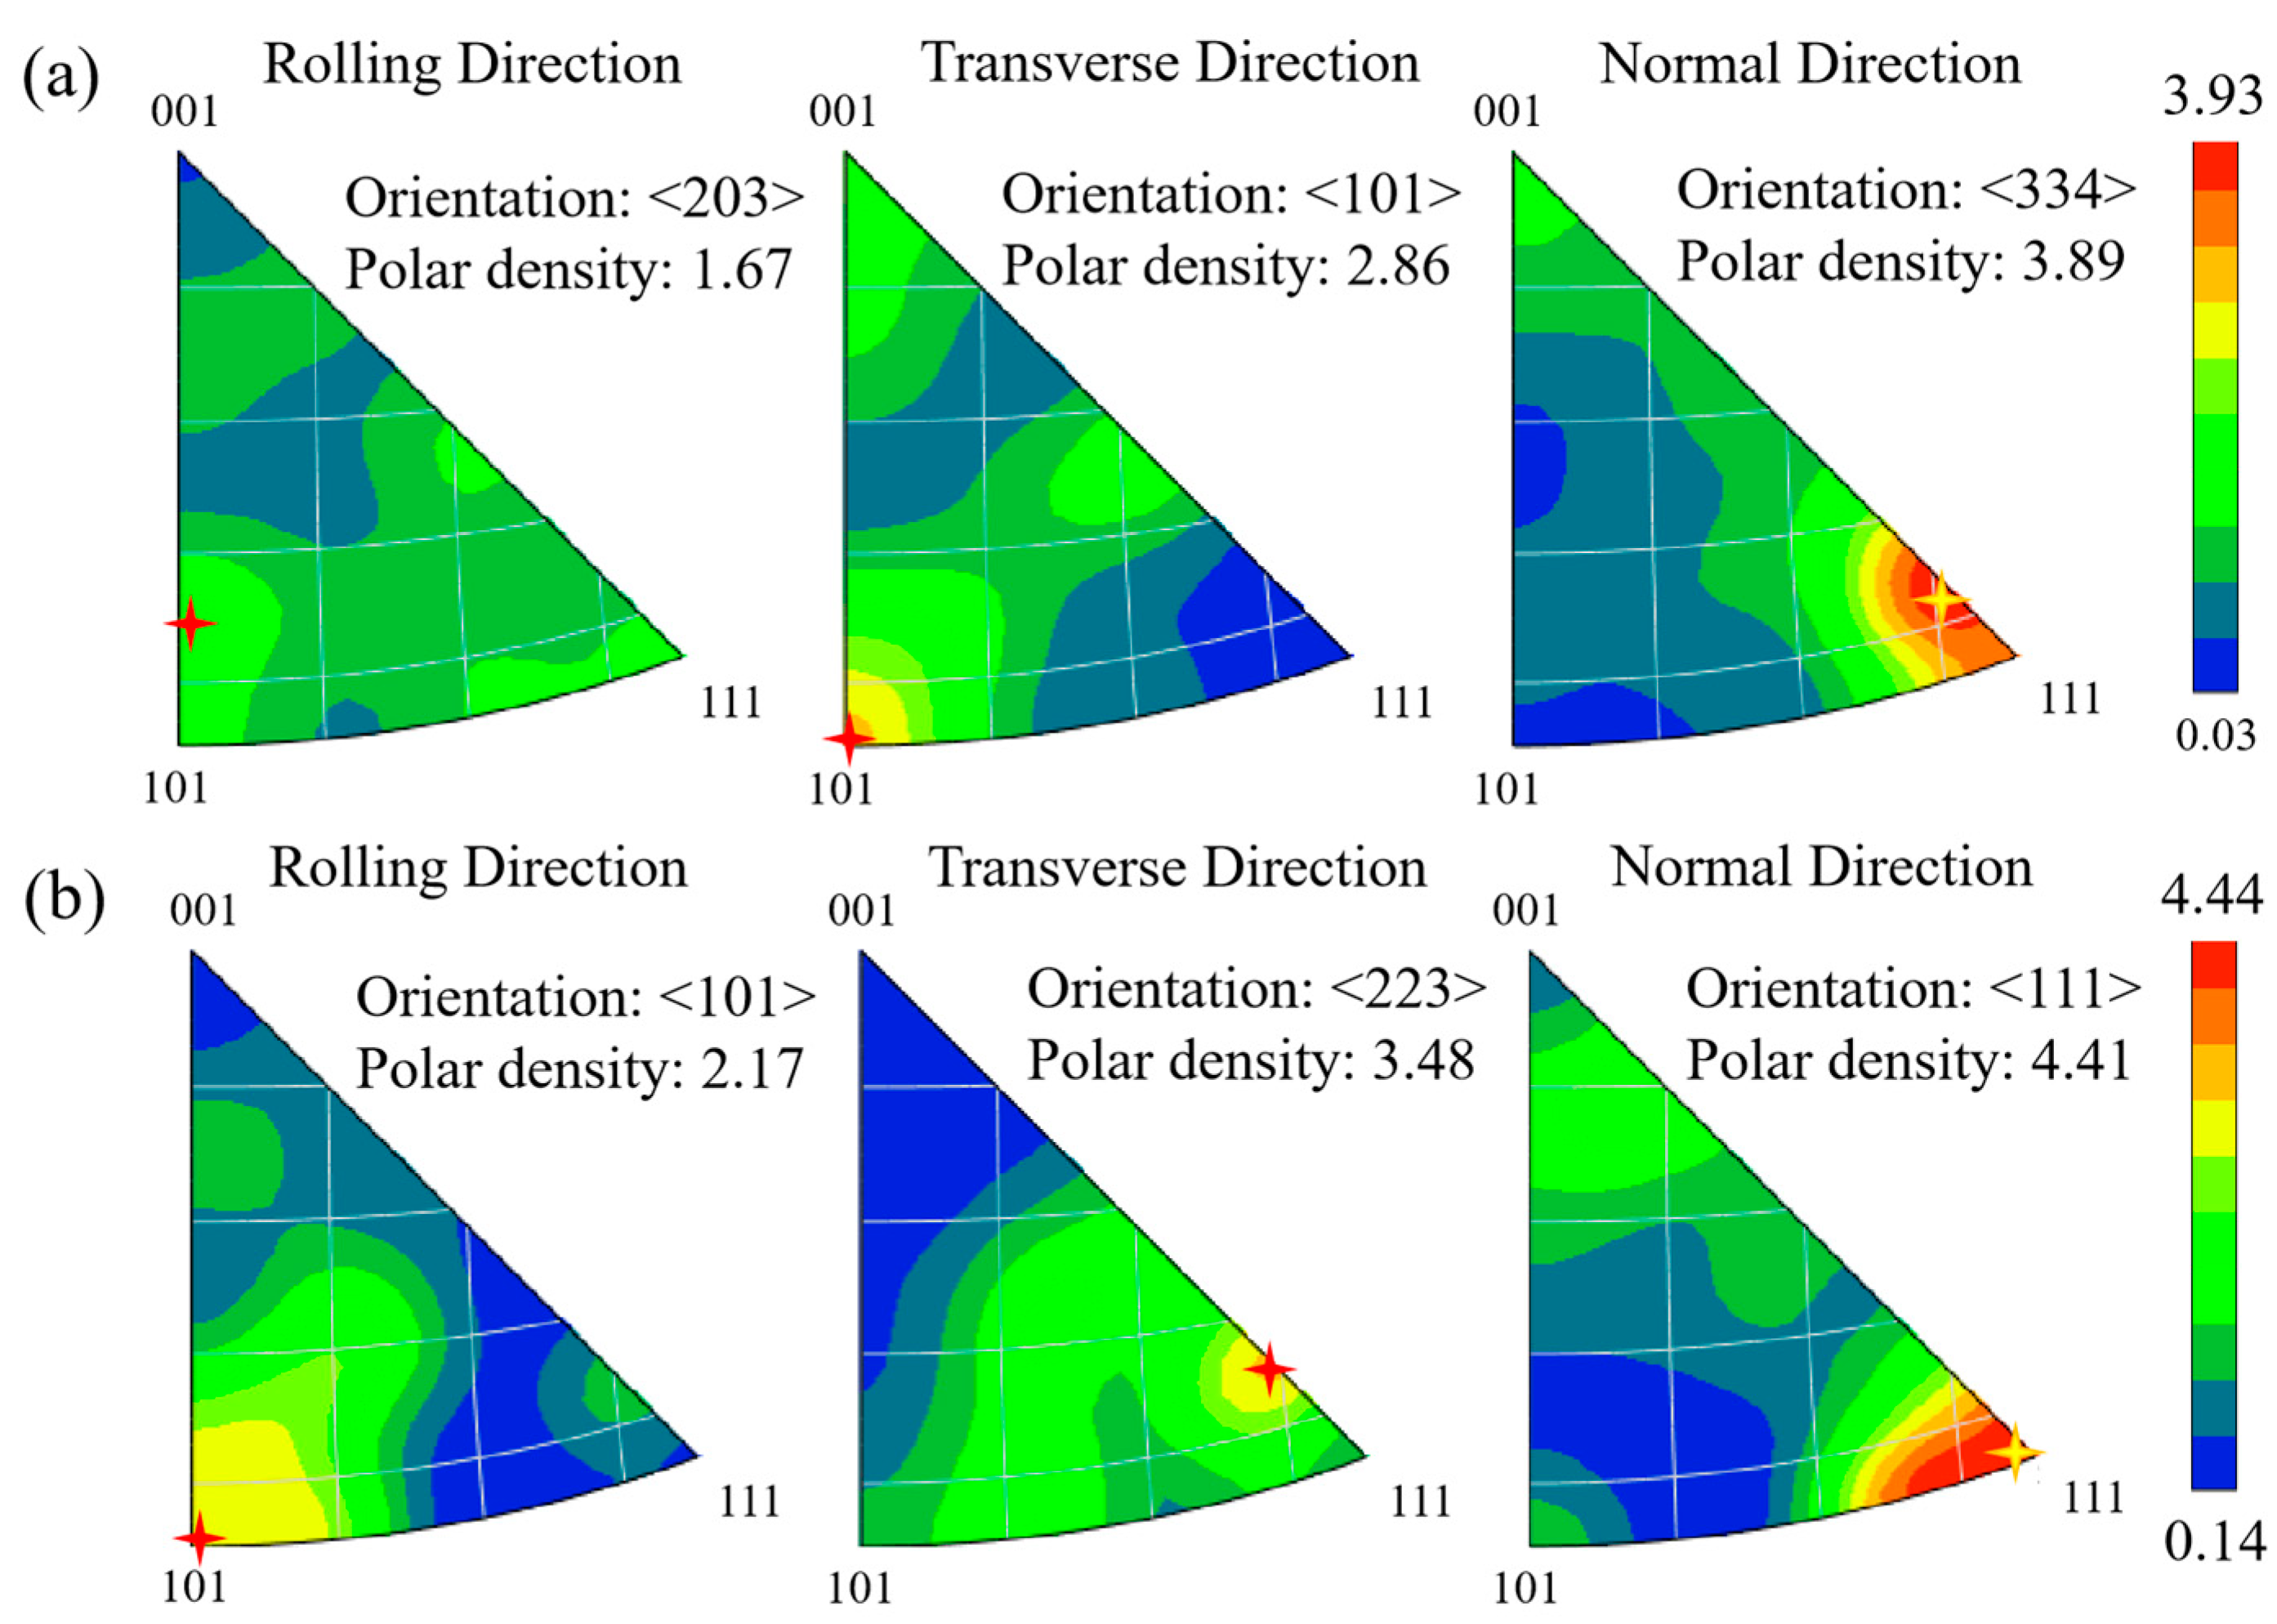
Figure 10.
GBD, PD, COM, and IPF on non-defect zone (NDZ) of sample 9. (a) GBD; (b) PD; (c) COM; and (d) IPF.
Figure 10.
GBD, PD, COM, and IPF on non-defect zone (NDZ) of sample 9. (a) GBD; (b) PD; (c) COM; and (d) IPF.
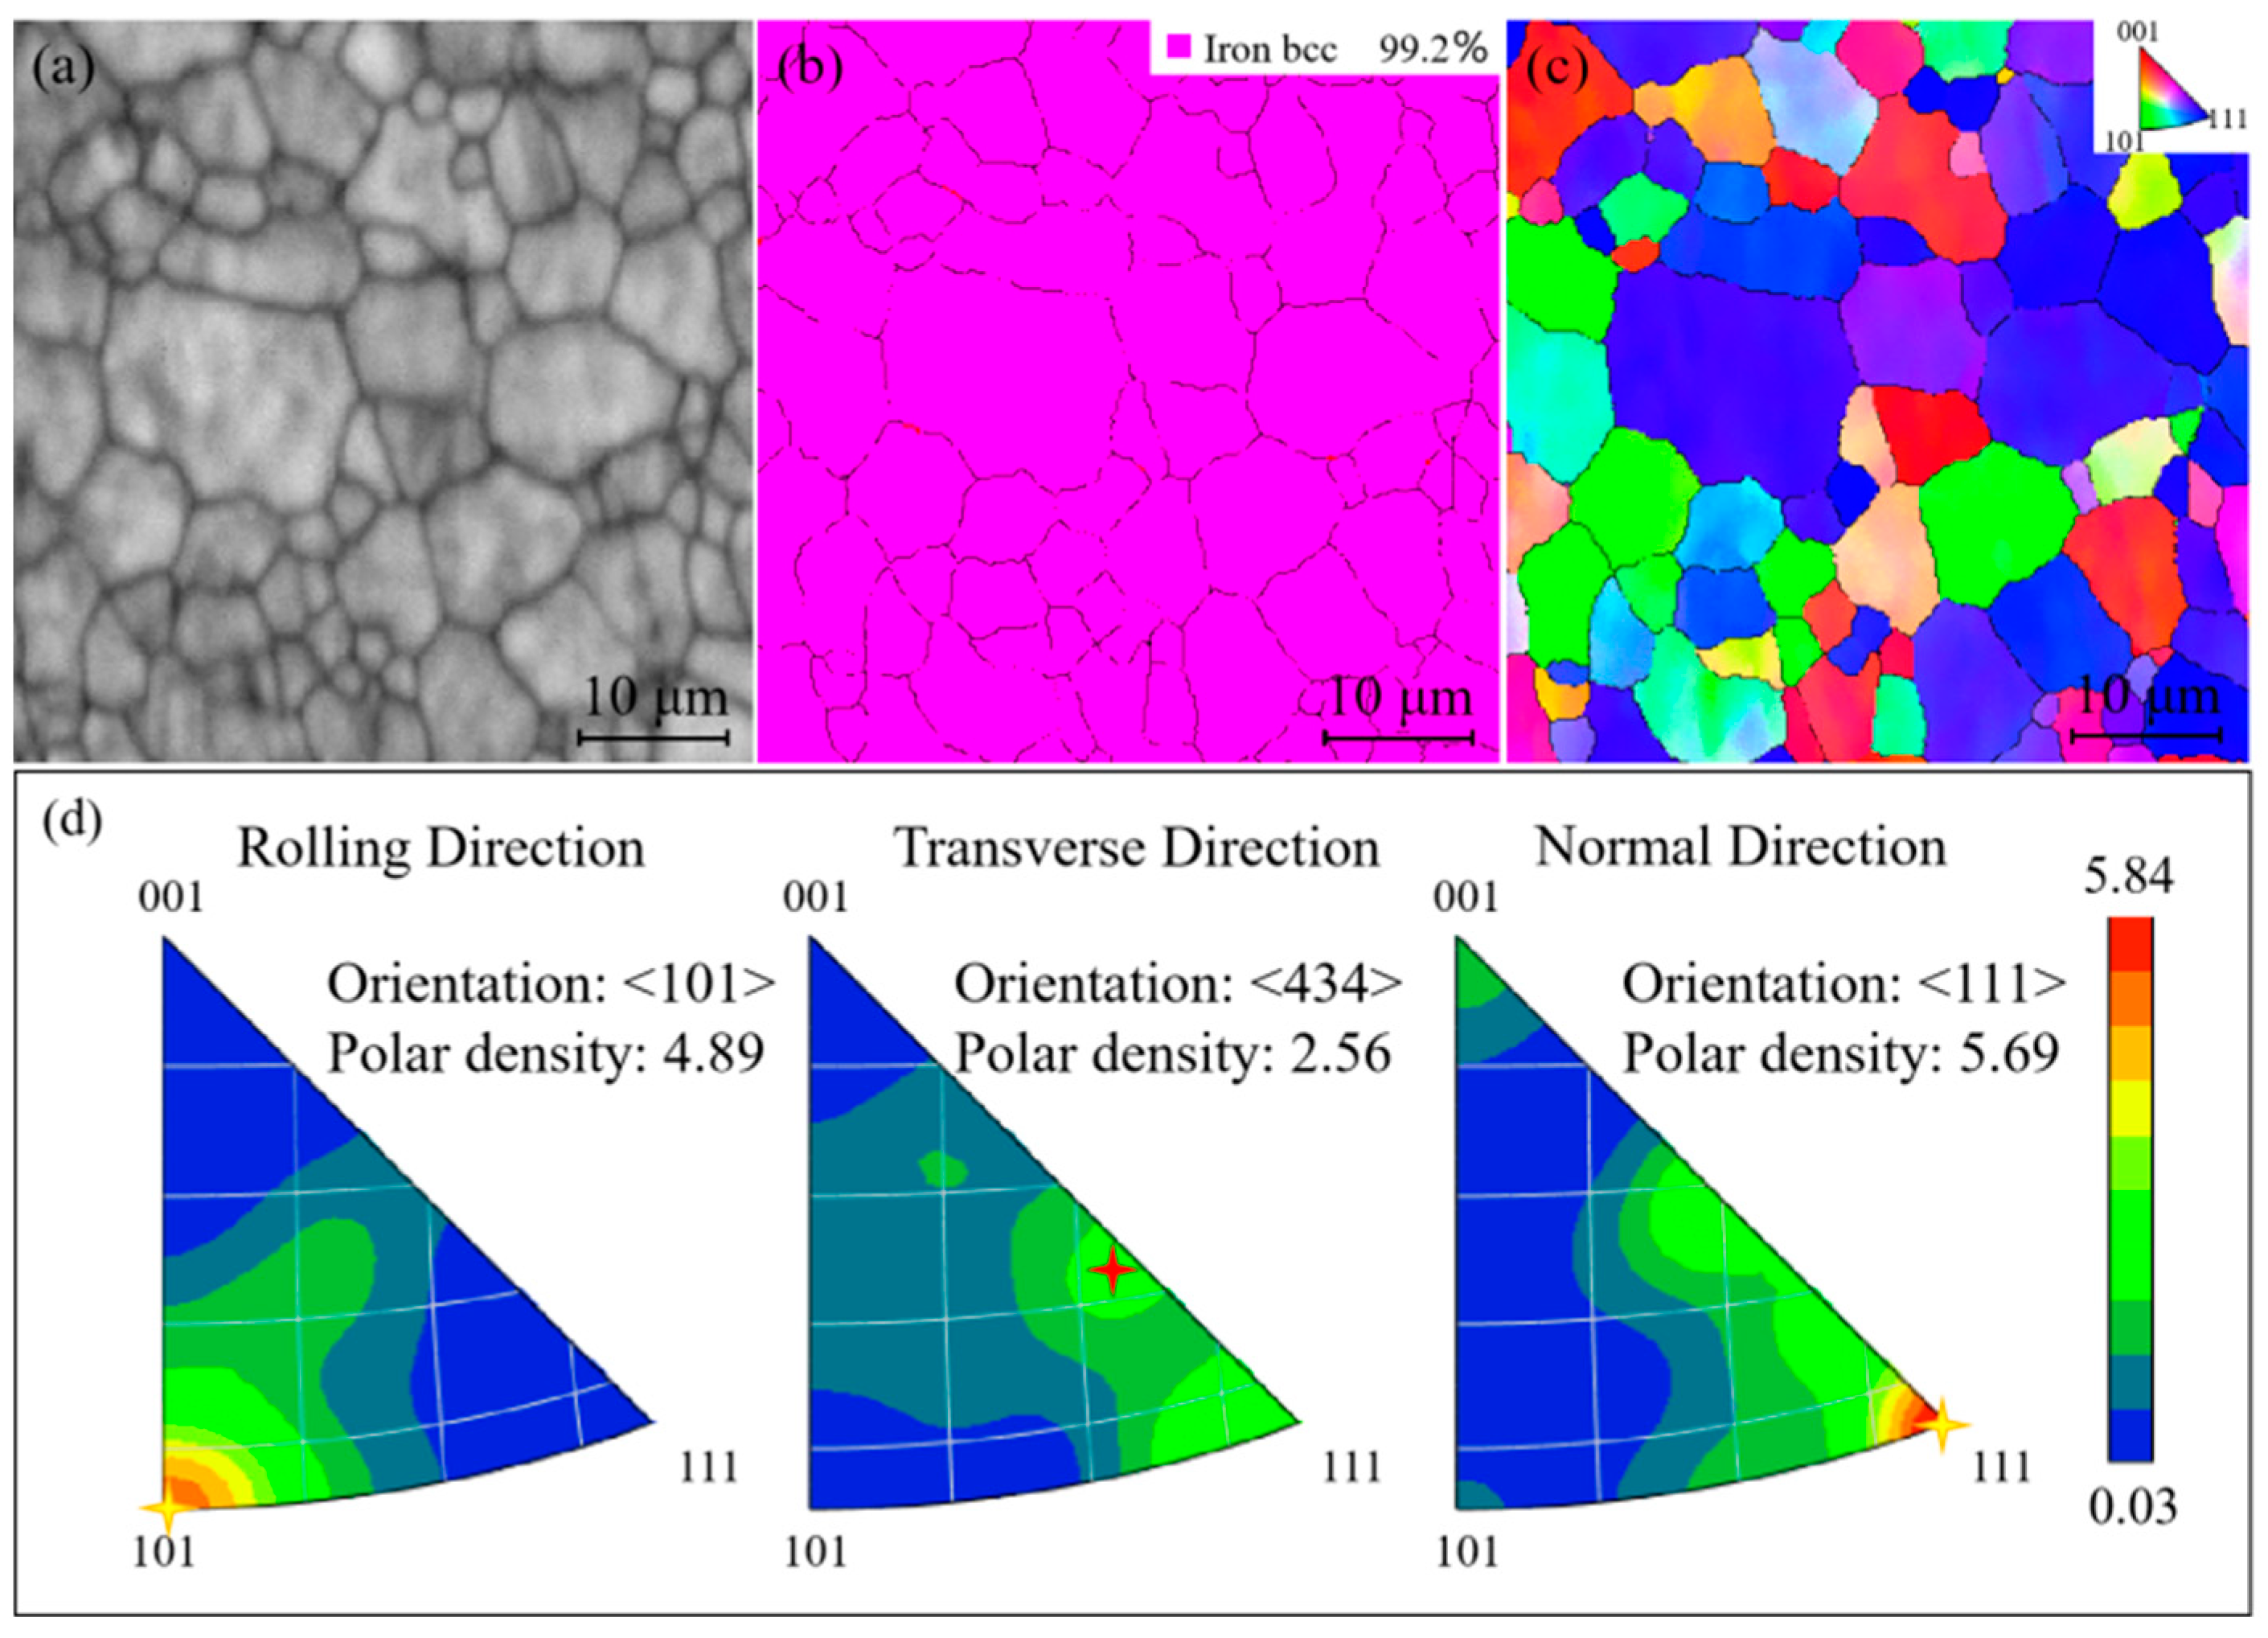
Figure 11.
Comparison of grain size distribution of different zones in samples 1, 5, and 9.
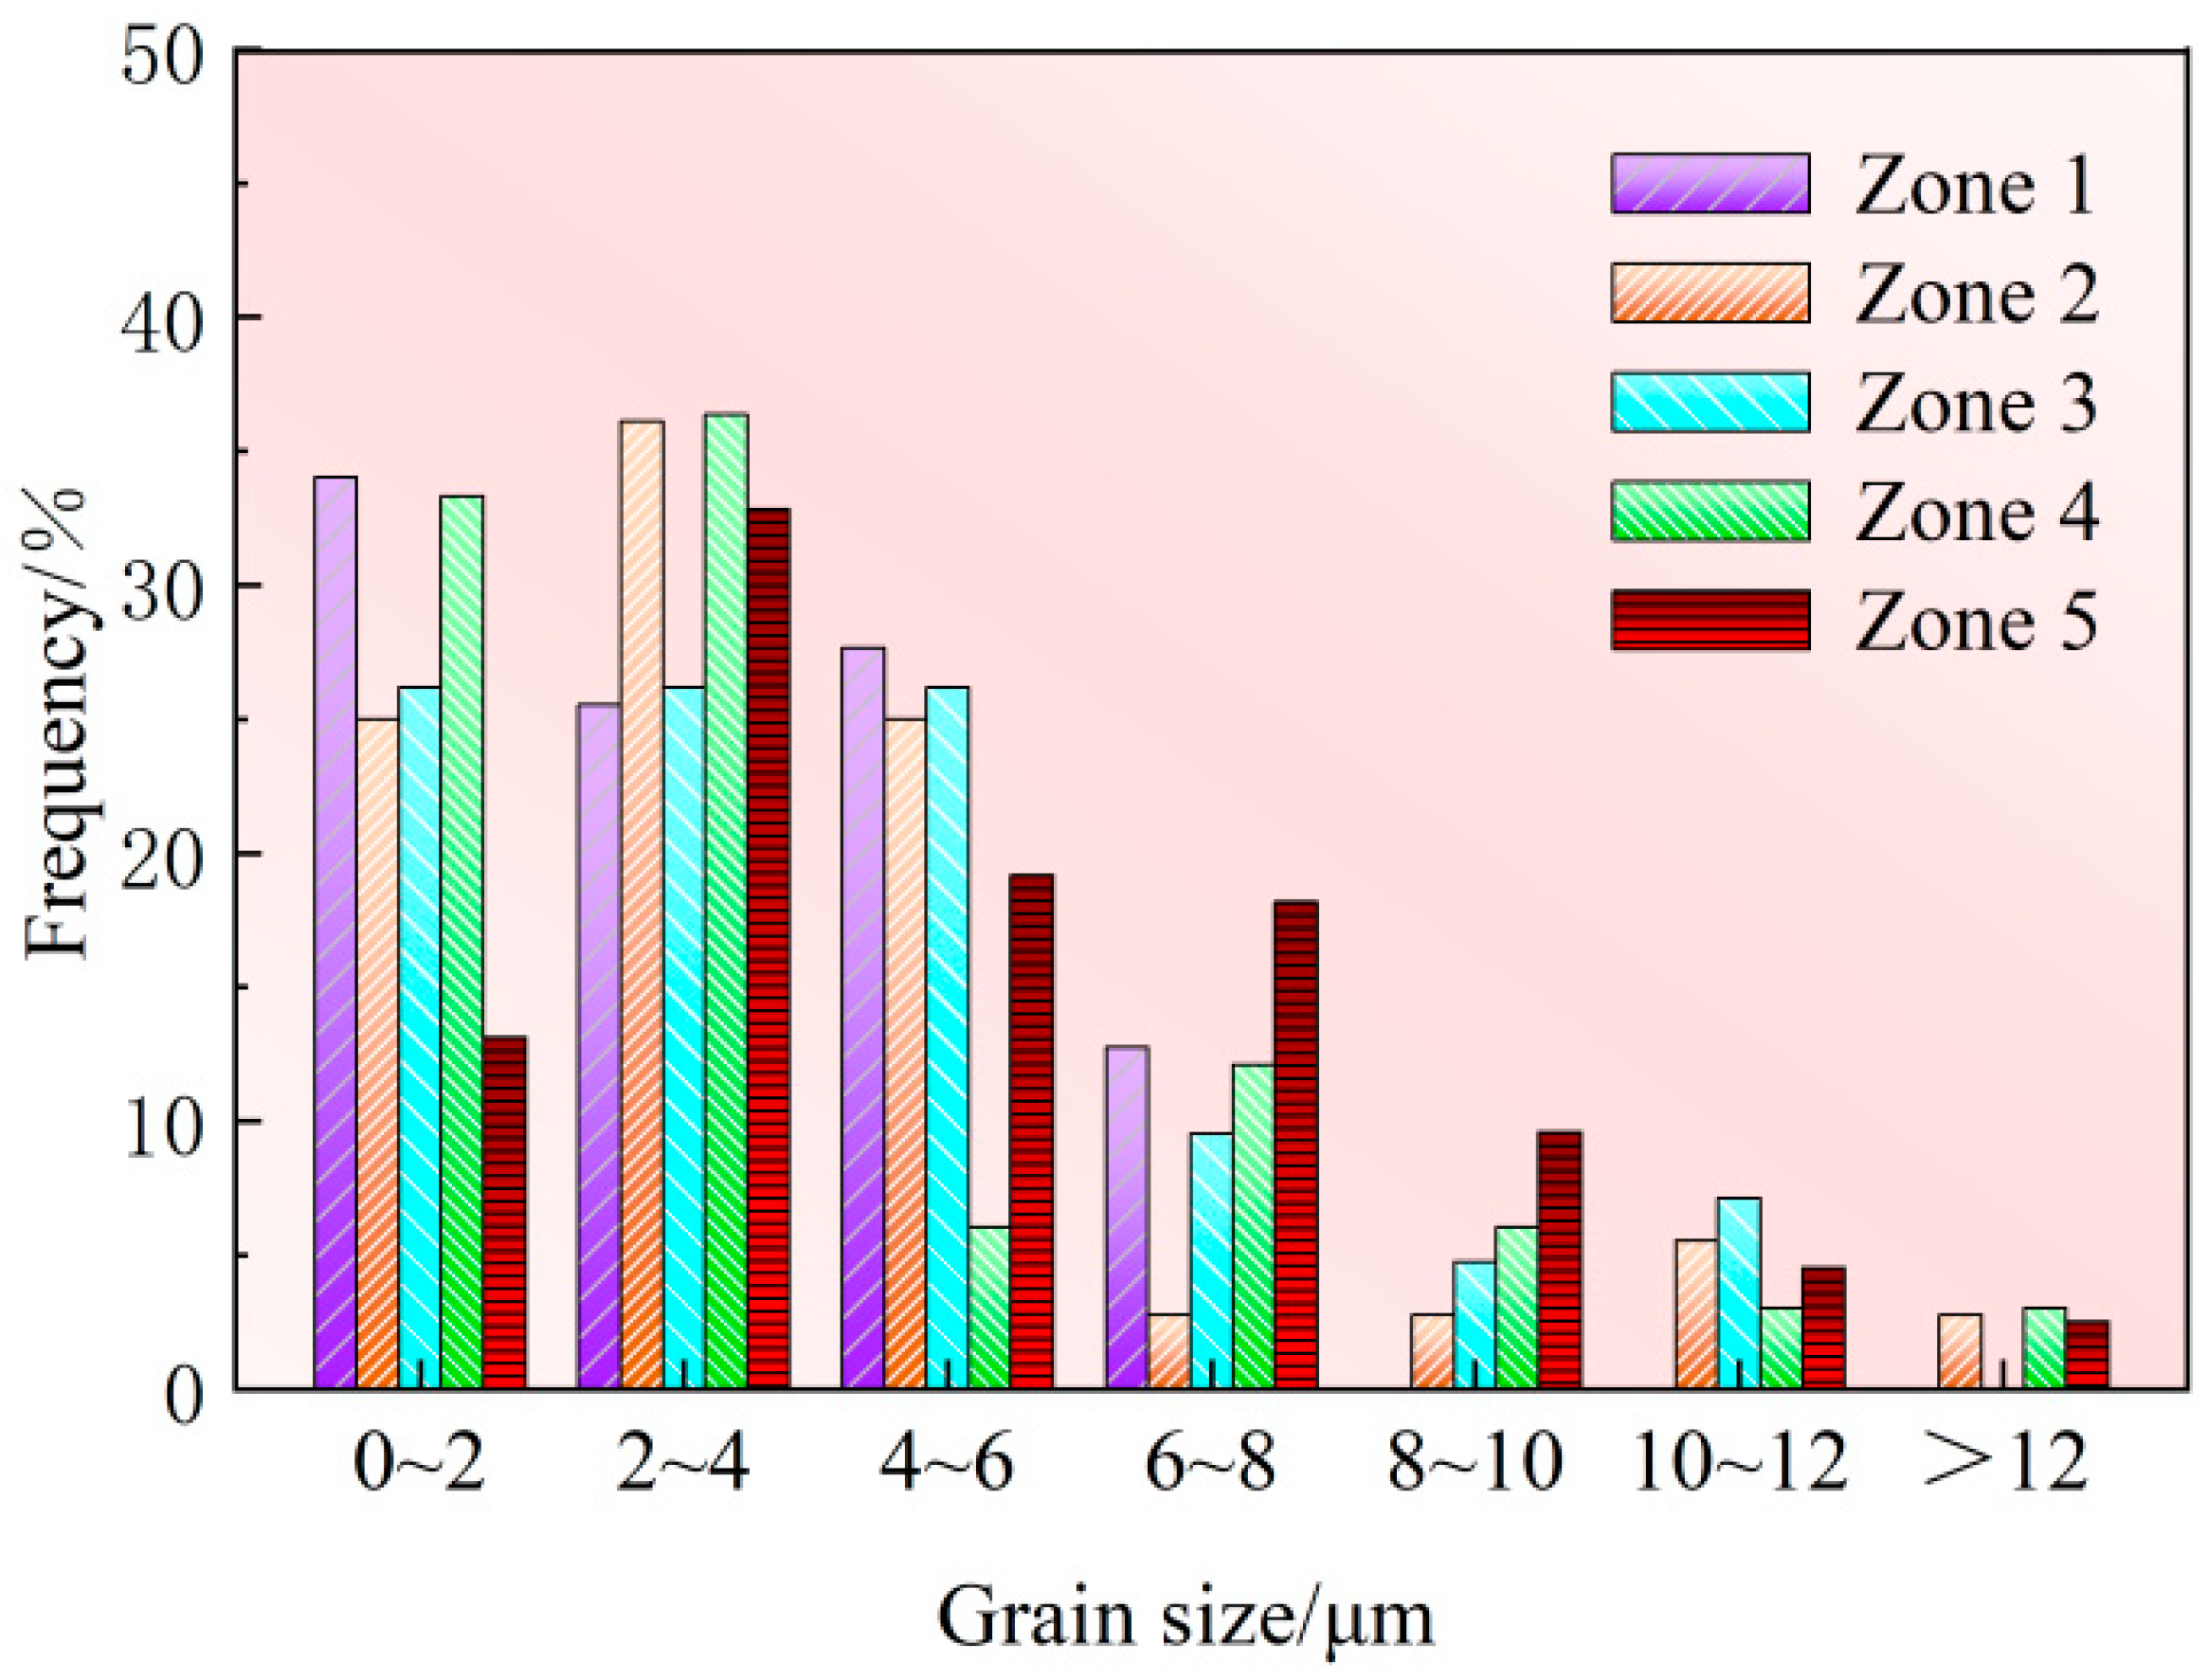
Figure 12.
Comparison of grain sizes of different zones in samples 1, 5, and 9.
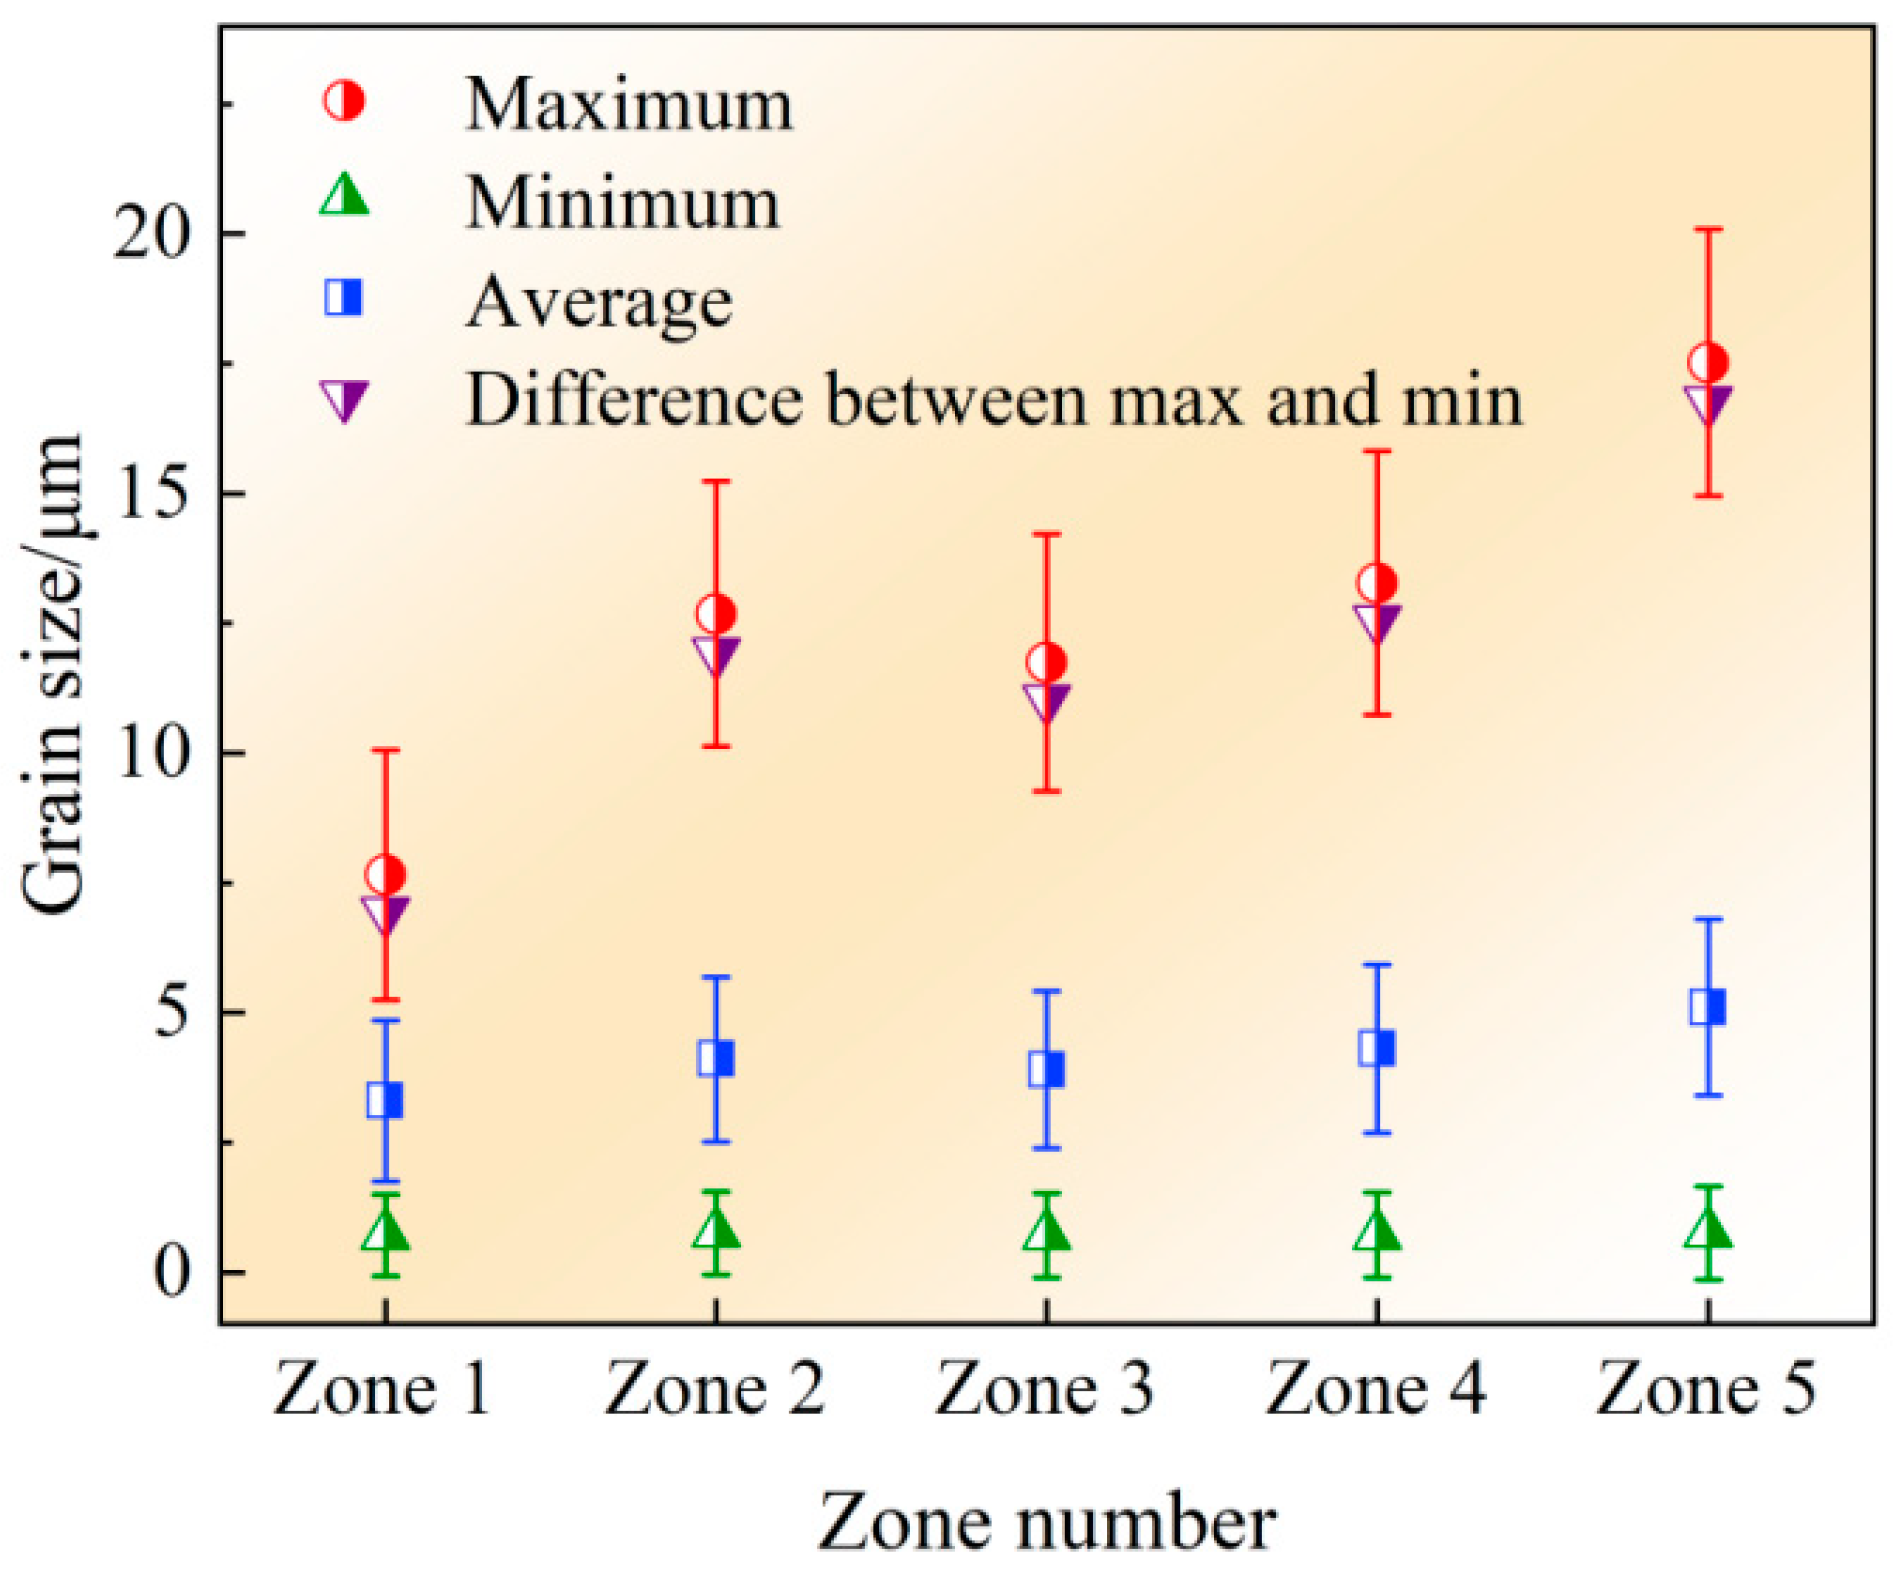
Figure 13.
Schematics of the plastic deformation of the rolled steel sheet. (a) No conclusions; (b) cracks caused by inclusions or mold flux particles; and (c) voids caused by inclusions or mold flux particles.
Figure 13.
Schematics of the plastic deformation of the rolled steel sheet. (a) No conclusions; (b) cracks caused by inclusions or mold flux particles; and (c) voids caused by inclusions or mold flux particles.
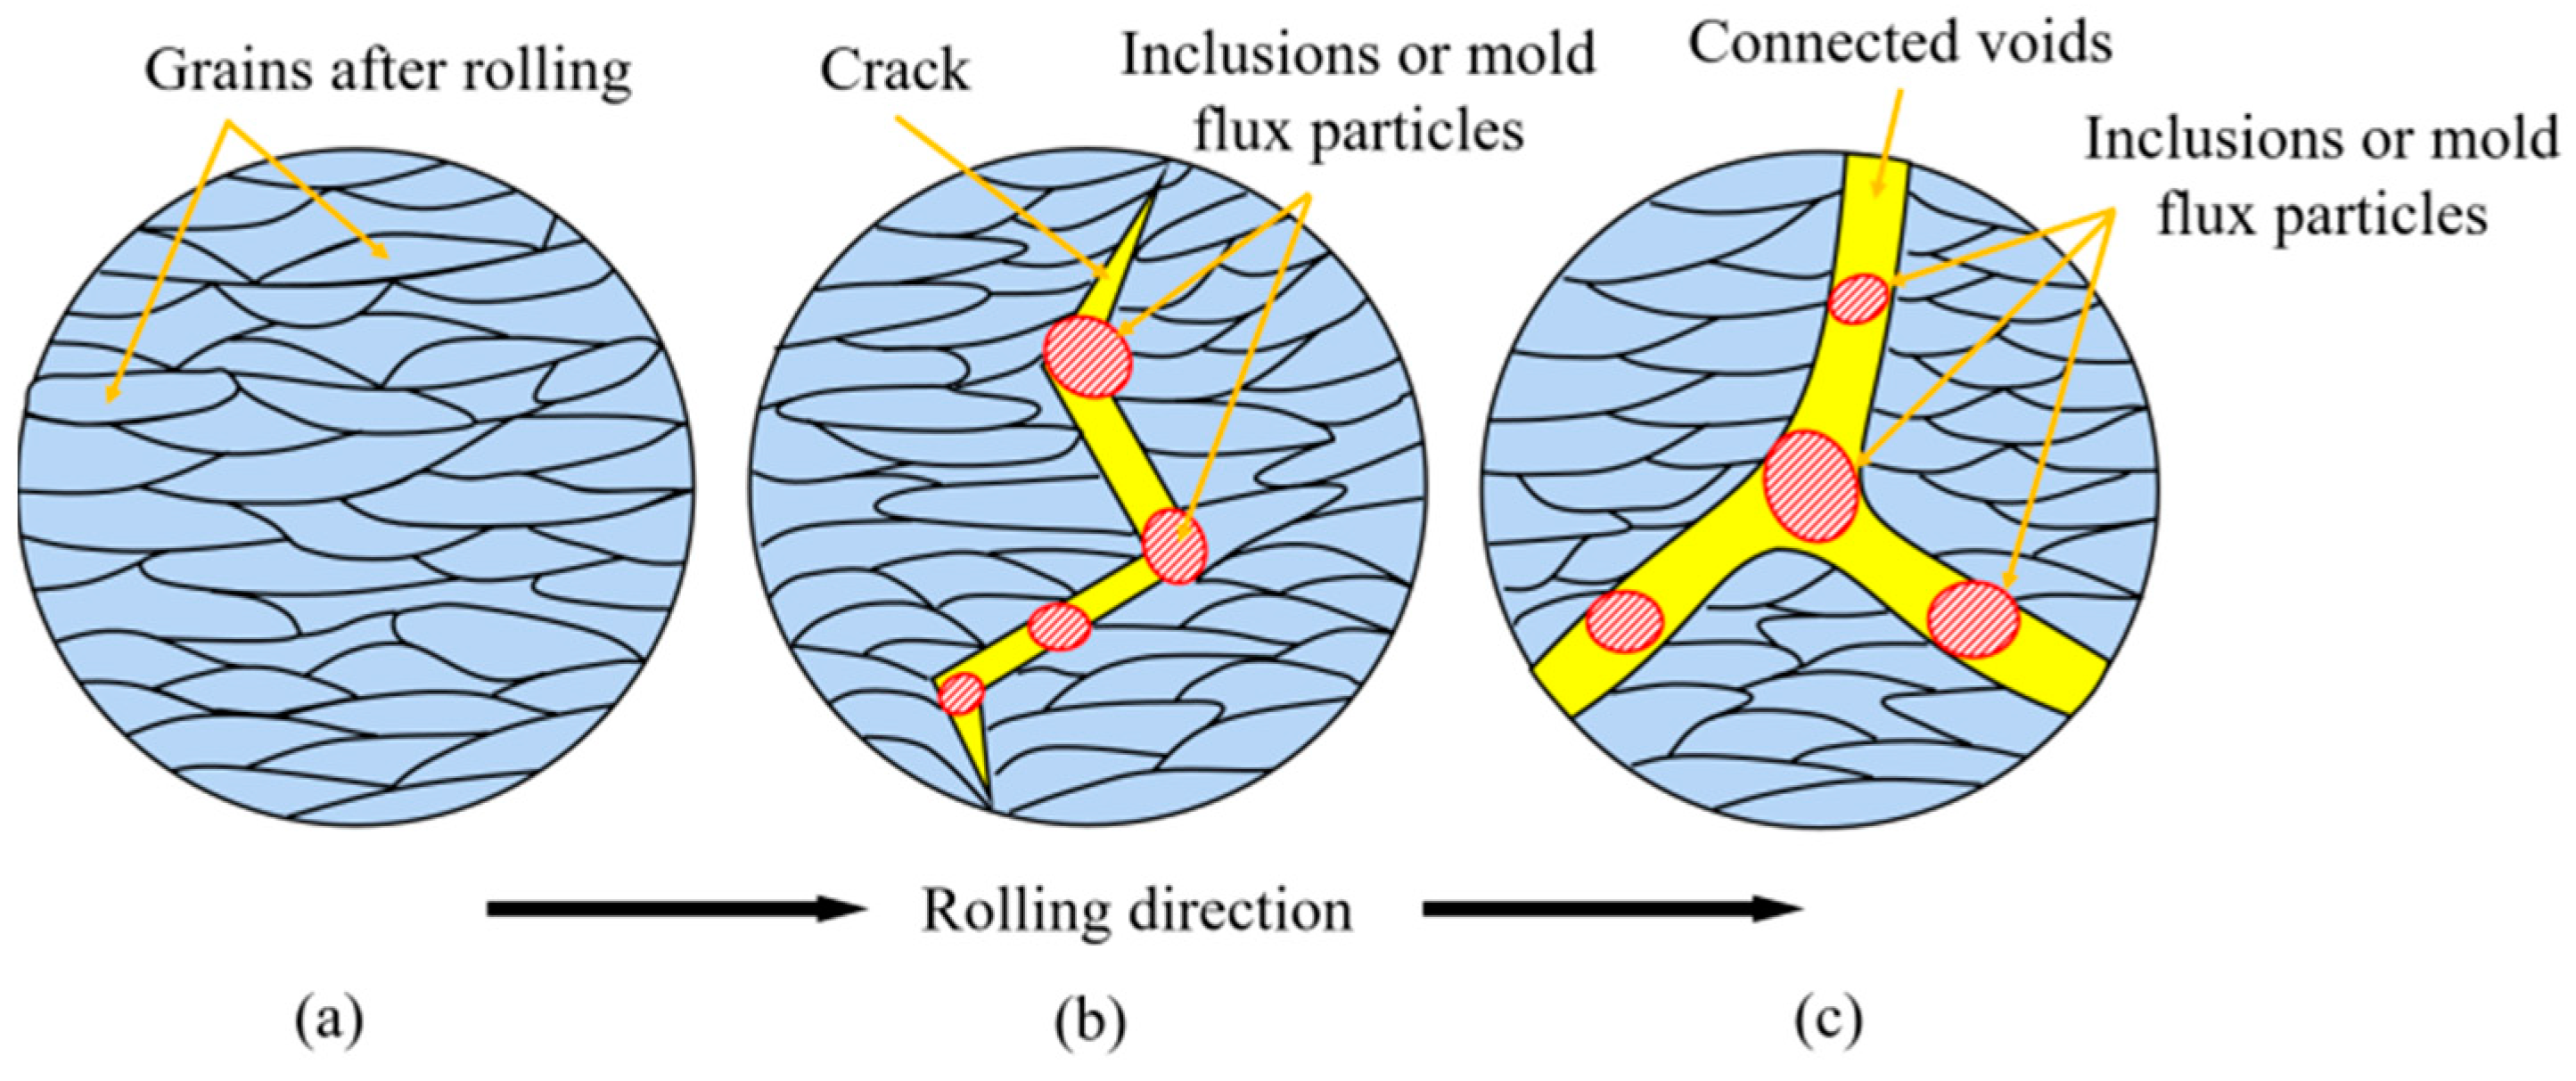
Figure 14.
Schematic diagrams of grain migration process after recrystallization. (a–c): no particles; (d–f): with Al2O3 inclusions; and (g–i): with mold flux particles.
Figure 14.
Schematic diagrams of grain migration process after recrystallization. (a–c): no particles; (d–f): with Al2O3 inclusions; and (g–i): with mold flux particles.
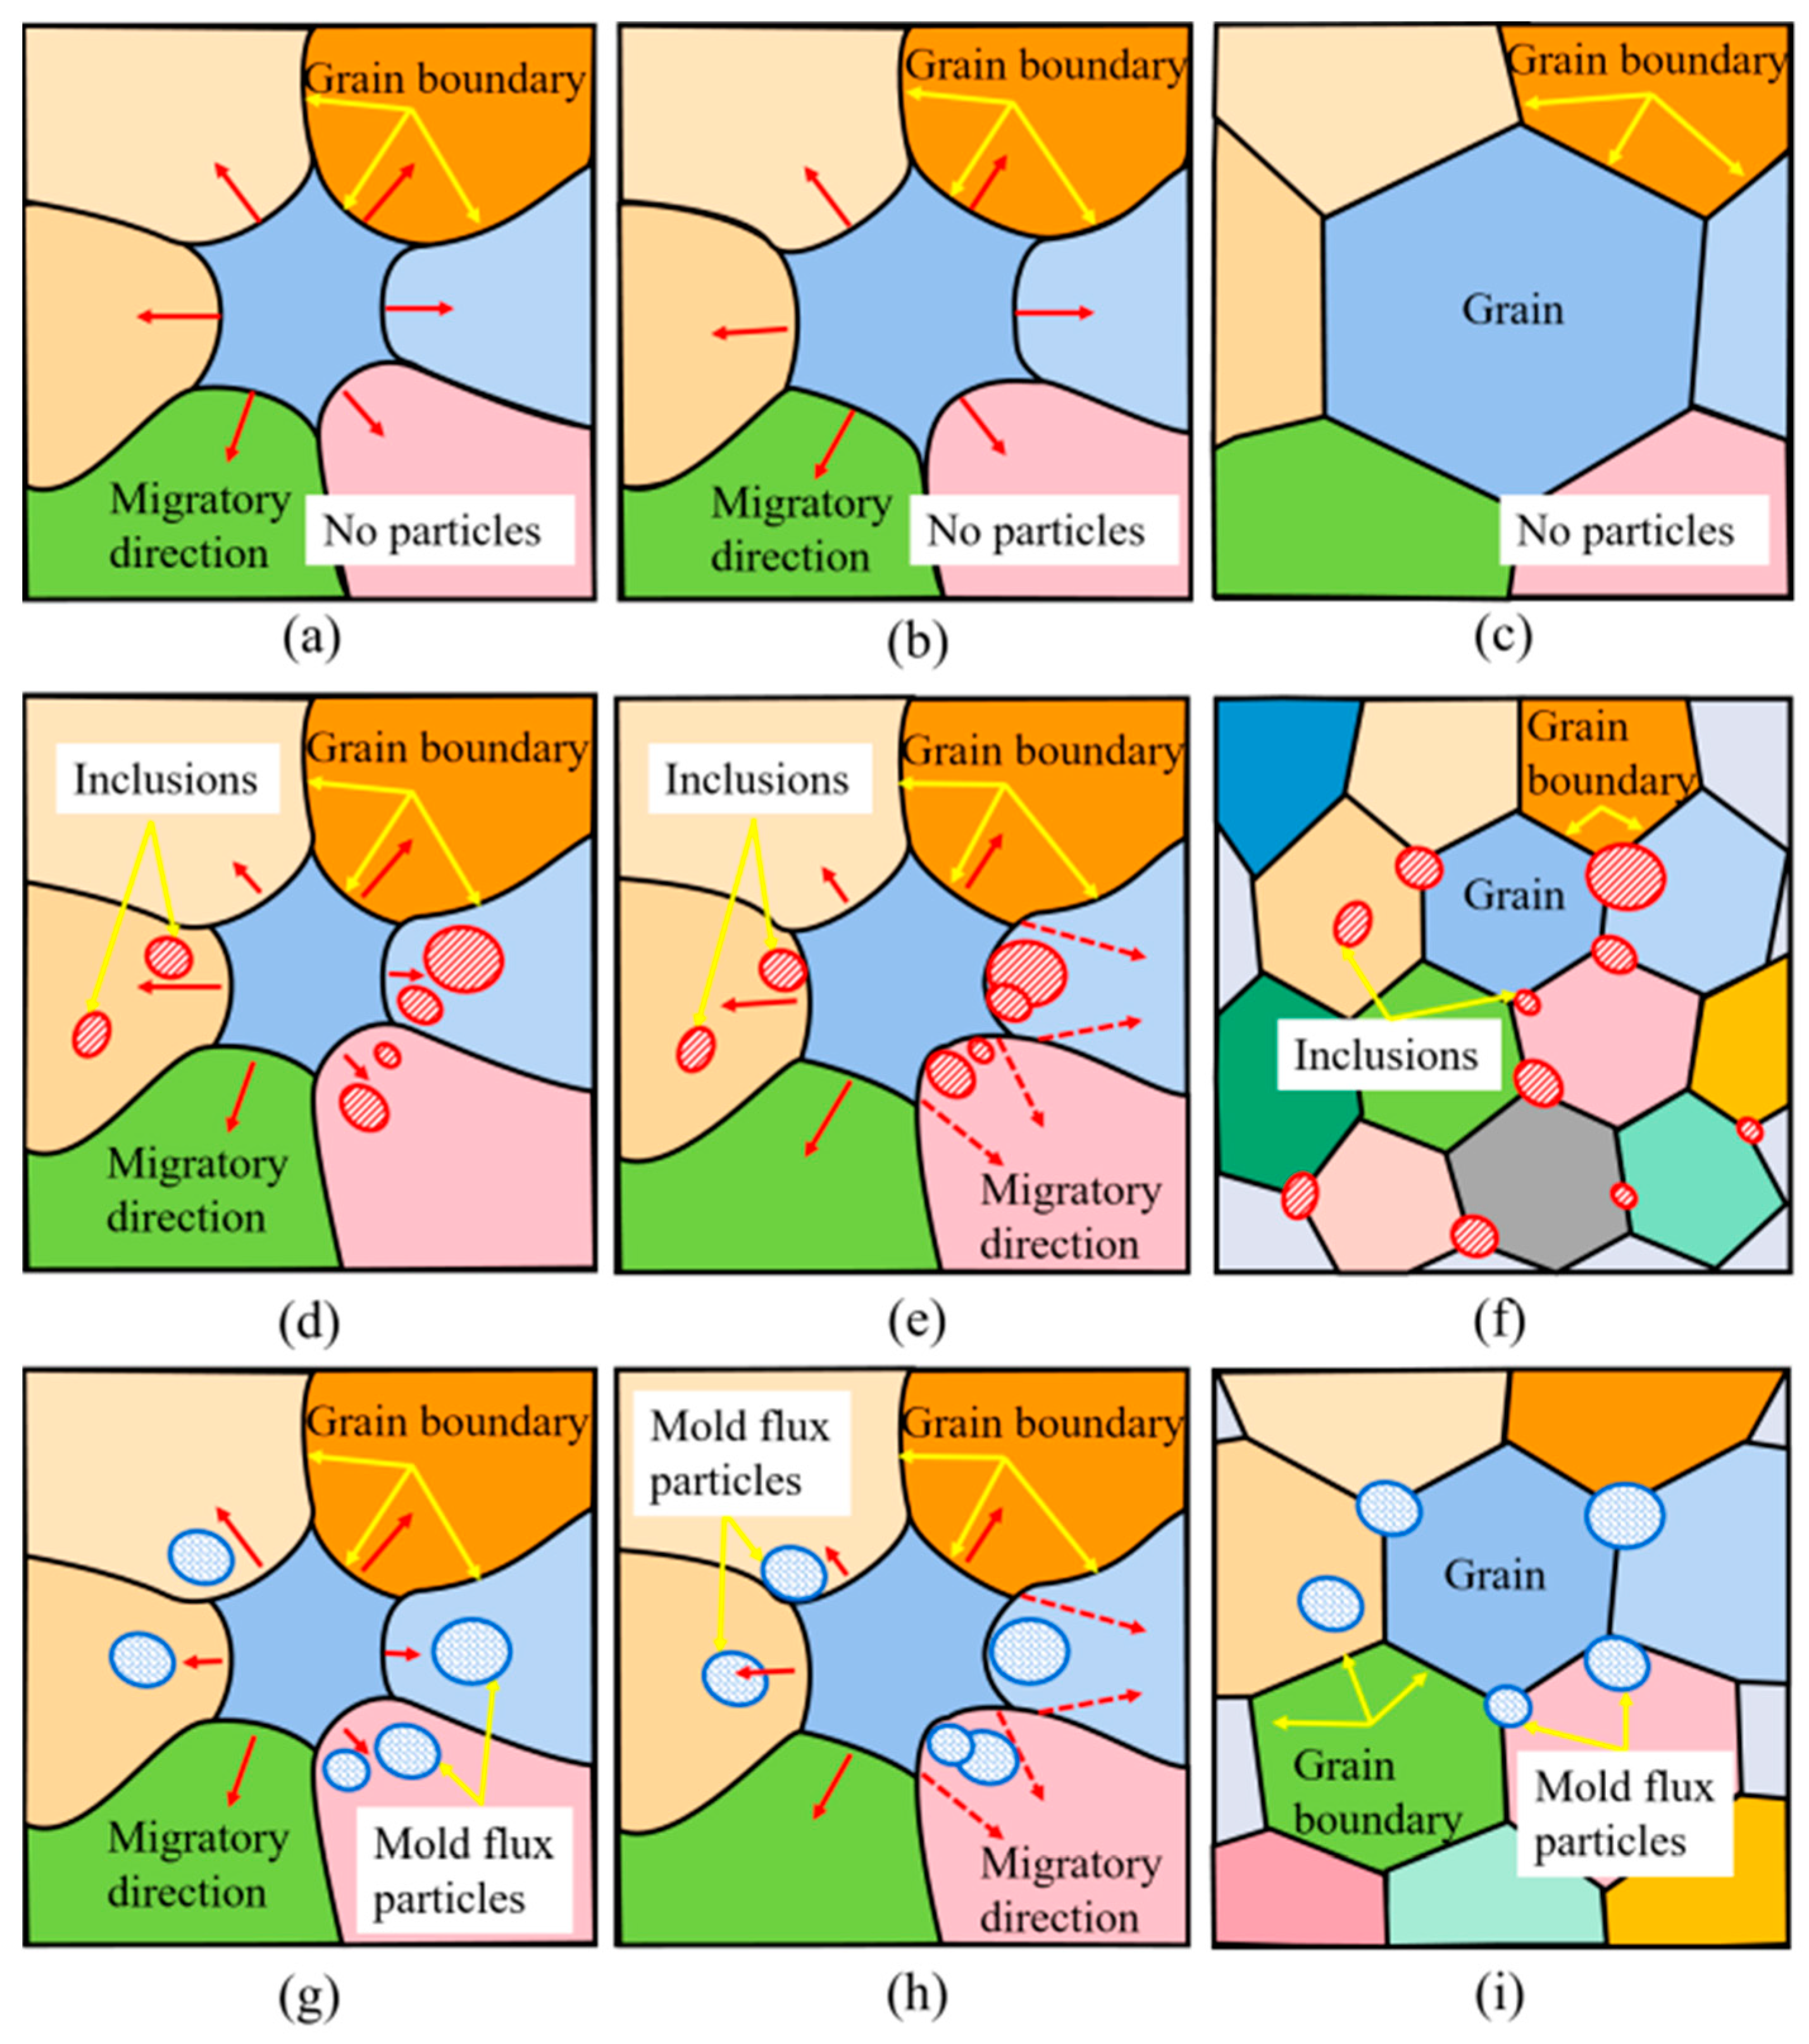
Figure 15.
Schematic diagrams of microstructure change during sliver defect formation. (a) Continuous casting slab. (b) Cold-rolled sheet. (c) Galvanized sheet.
Figure 15.
Schematic diagrams of microstructure change during sliver defect formation. (a) Continuous casting slab. (b) Cold-rolled sheet. (c) Galvanized sheet.

Table 1.
Chemical compositions of the hot-dip galvanized automobile exposed panels of the ultra-low carbon steel (wt%).
Table 1.
Chemical compositions of the hot-dip galvanized automobile exposed panels of the ultra-low carbon steel (wt%).
| C | Si | Mn | Al | P | S | N | T.O |
|---|---|---|---|---|---|---|---|
| 0.0011–0.0023 | 0.003–0.133 | 0.15–0.63 | 0.017–0.081 | 0.011–0.045 | 0.0039–0.015 | 0.0012–0.0023 | 0.0012–0.0019 |
Table 2.
Compositions of the mold powders (wt%).
| SiO2 | CaO | Al2O3 | MgO | Na2O/K2O | F- | Csolid | Basicity |
|---|---|---|---|---|---|---|---|
| 41.95 | 35.71 | 4.77 | 3.66 | 5.15 | 4.51 | 0.49 | 0.85 |
Table 3.
Compositions of particles on the Al2O3 sliver defect and mold flux sliver defect (wt%).
| Defect | Element | Al | O | Mg | Ca | Si | Na | K | F | C | Fe | Zn | Total |
|---|---|---|---|---|---|---|---|---|---|---|---|---|---|
| Al2O3 | 1 | 20.2 | 21.6 | / | / | / | / | / | / | 0.49 | 35.3 | 22.4 | 100 |
| 2 | 12.0 | 13.6 | / | / | / | / | / | / | 9.73 | 34.5 | 30.2 | 100 | |
| 3 | 26.4 | 23.8 | / | / | / | / | / | / | 1.47 | 26.2 | 22.1 | 100 | |
| Mold flux | 4 | 8.00 | 27.9 | 6.57 | / | 11.11 | / | 4.63 | / | / | 5.94 | 35.9 | 100 |
| 5 | 4.78 | 24.6 | / | 3.90 | 2.82 | 4.82 | / | / | 19.4 | 13.2 | 26.5 | 100 | |
| 6 | 11.17 | 23.2 | / | 23.4 | 8.21 | / | / | 6.09 | 6.16 | 11.20 | 10.5 | 100 |
Table 4.
Statistical results of crystal orientations and microtexture on different zones of samples 1, 5, and 9.
Table 4.
Statistical results of crystal orientations and microtexture on different zones of samples 1, 5, and 9.
| Sample | Zone | Zone Types | X (RD) | Y (TD) | Z (ND) | Max PD | Microtexture | |||
|---|---|---|---|---|---|---|---|---|---|---|
| OR | PD | OR | PD | OR | PD | |||||
| 1 | Zone 1 | Al2O3 DZ + Al2O3 | <114> | 2.05 | <001> | 2.03 | <001> | 2.65 | 2.68 | {001}<114> |
| 1 | Zone 2 | Al2O3 DZ − Al2O3 | <313> | 1.75 | <101> | 2.05 | <111> | 4.11 | 4.10 | {111}<313> |
| 5 | Zone 3 | MFDZ + MFP | <203> | 1.67 | <101> | 2.86 | <334> | 3.89 | 3.93 | {001}<203> |
| 5 | Zone 4 | MFDZ − MFP | <101> | 2.17 | <223> | 3.48 | <111> | 4.41 | 4.44 | {111}<101> |
| 9 | Zone 5 | NDZ | <101> | 4.89 | <434> | 2.56 | <111> | 5.69 | 5.84 | {111}<101> |
Remarks: “+” means with; “−” means without; OR is the abbreviation of orientation; PD is the abbreviation of polar density; and Max is the abbreviation of maximum.
Table 5.
Statistical results of grain size distribution of different zones in samples 1, 5, and 9.
| Sample | Zone | Zone Types | Min | Max | Difference between Max and Min | Average |
|---|---|---|---|---|---|---|
| 1 | Zone 1 | Al2O3 DZ with Al2O3 | 0.71 | 7.65 | 6.94 | 3.3 |
| 1 | Zone 2 | Al2O3 DZ without Al2O3 | 0.75 | 12.68 | 11.93 | 4.1 |
| 5 | Zone 3 | MFDZ with MFP | 0.71 | 11.74 | 11.03 | 3.9 |
| 5 | Zone 4 | MFDZ without MFP | 0.71 | 13.27 | 12.56 | 4.3 |
| 9 | Zone 5 | NDZ | 0.75 | 17.52 | 16.77 | 5.1 |
Remarks: Max is the abbreviation of maximum; Min is the abbreviation of minimum.
Disclaimer/Publisher’s Note: The statements, opinions and data contained in all publications are solely those of the individual author(s) and contributor(s) and not of MDPI and/or the editor(s). MDPI and/or the editor(s) disclaim responsibility for any injury to people or property resulting from any ideas, methods, instructions or products referred to in the content. |
© 2023 by the authors. Licensee MDPI, Basel, Switzerland. This article is an open access article distributed under the terms and conditions of the Creative Commons Attribution (CC BY) license (https://creativecommons.org/licenses/by/4.0/).
Share and Cite
MDPI and ACS Style
Zhang, Q.; Li, T.; Yang, J. Effect of Al2O3 Inclusions or Mold Flux Particles on Their Surrounding Microstructures of Sliver Defects on the Surface of Automobile Exposed Panel. Metals 2023, 13, 661. https://doi.org/10.3390/met13040661
AMA Style
Zhang Q, Li T, Yang J. Effect of Al2O3 Inclusions or Mold Flux Particles on Their Surrounding Microstructures of Sliver Defects on the Surface of Automobile Exposed Panel. Metals. 2023; 13(4):661. https://doi.org/10.3390/met13040661
Chicago/Turabian StyleZhang, Qing, Tingting Li, and Jian Yang. 2023. "Effect of Al2O3 Inclusions or Mold Flux Particles on Their Surrounding Microstructures of Sliver Defects on the Surface of Automobile Exposed Panel" Metals 13, no. 4: 661. https://doi.org/10.3390/met13040661
Note that from the first issue of 2016, this journal uses article numbers instead of page numbers. See further details here.