
Enhanced Fatigue Resistance of Nanocrystalline Ni50.8Ti49.2 Wires by Mechanical Training
by
 ,
,
Peng Chen
1,2,
Xiaorong Cai
1,2,*,
Na Min
3,
Yunfan Liu
4,
Zhengxiong Wang
1,
Mingjiang Jin
1,* and
Xuejun Jin
1,2 1
Institute of Phase Transformation and Complex Microstructure, School of Materials Science and Engineering, Shanghai Jiao Tong University, Shanghai 200240, China
2
Institute of Medical Robotics, Shanghai Jiao Tong University, Shanghai 200240, China
3
Key Laboratory for Microstructures, Shanghai University, Shanghai 200444, China
4
Institute of Forming Technology and Equipment, School of Materials Science and Engineering, Shanghai Jiao Tong University, Shanghai 200030, China
*
Authors to whom correspondence should be addressed.
Metals 2023, 13(2), 361; https://doi.org/10.3390/met13020361
Submission received: 5 January 2023
/
Revised: 7 February 2023
/
Accepted: 8 February 2023
/
Published: 10 February 2023
(This article belongs to the Special Issue Metallic Functional Materials: Development and Applications)
Abstract
:In this paper, the fatigue resistance of superelastic NiTi shape memory alloy (SMA) wires was improved by combining mechanical training and nanocrystallization. Fatigue tests were performed after mechanical training with a peak stress of 600 MPa for 60 cycles of nanocrystalline (NC) NiTi wires, and the associated microscopic mechanism was investigated by using transmission electron microscopy (TEM) and transmission Kikuchi diffraction (TKD). The results showed that stress-controlled training effectively improved the functional stability (the accumulated residual strain decreased by 83.8% in the first 5000 cycles) of NC NiTi SMA wires, as well as increased the average structural fatigue life by 187.4% (from 4538 cycles to 13,040 cycles). TEM observations and TKD results revealed that training-induced dislocations resulted in lattice rotation and preferential grain orientation. The finite element method (FEM) simulation results indicated that the training-induced preferential grain orientation tended to decrease the local stress concentration and strain energy density. Combined with fractography analysis, the uniform deformation caused by mechanical training changed the crack growth mode from multi-regional propagation to single-regional propagation, improving the structural fatigue life.
1. Introduction
NiTi shape-memory alloys (SMAs) are frequently employed in biomedical devices [1,2], aerospace engineering [3], and automotive applications [4] due to their distinctive superelasticity. In practice, thousands of cyclic martensitic phase transformations are generally performed to NiTi SMAs. Fatigue failure is one of the main remaining challenges in the application of SMAs. As previously reported, NiTi SMA wires subjected to thermomechanical cyclic loading within a certain strain amplitude (approximately 3.5%) tend to fail at thousands of cycles [5,6], severely restricting the commercial applications of NiTi SMA wires.
In contrast to that of traditional metals, fatigue of NiTi SMA involves functional and structural fatigue [7]. The functional degradation mainly refers to the gradual accumulation of residual strain () and the decrease in critical stress triggering stress-induced martensitic transformation () with increasing cycles. The functional degradation is primarily associated with the formation of dislocations near the austenite–martensite interfaces to coordinate the inconsistent deformation [8]. The reduction in grain size down to the nanometer scale is a practical and useful method for enhancing functional stability [9,10] due to the increased lattice compatibility [11]. Structural fatigue is governed by crack nucleation and propagation [12,13]. Compared to conventional structural engineering materials, stress-induced martensitic transformation occurs at the crack tips, along with plastic deformation for NiTi SMAs [14,15,16,17]. In this case, the increase in grain size results in enlarged plastic zones and phase transformation zones, which leads to a higher energy dissipation ahead of the crack tips [18,19]. Therefore, the fatigue crack growth rate can be lowered by increasing the grain size due to the subsequent increased resistance to crack propagation. However, previous experiments show that a longer structural fatigue life can be obtained by decreasing the grain size [20], indicating that the reduction of grain size may be benefit to delay crack nucleation. As mentioned above, it is difficult to restrain both crack nucleation and propagation at the same time by controlling grain size alone. Although the structural fatigue life can be increased as the grain size is decreased to the nanoscale range, great opportunity for further improvement remains.
Mechanical training is also a key method to improve the fatigue resistance of NiTi alloys [21,22,23]. During training, dislocations are generated in NiTi alloys to coordinate the deformation. Pre-introduced dislocations in the training process are considered to suppress the accumulation of defects in the subsequent cyclic loading fatigue process, resulting in a more stable stress–strain response [24,25]. Additionally, training is also beneficial to improve the structural fatigue life of NiTi SMA wires. Zhang et al. [6] reported that the dislocation-induced local residual stress field caused by stress-controlled training at 700 MPa for 20 cycles significantly reduces the macroscopic stress needed for martensite transformation in the subsequent strain-controlled fatigue test and improves the structural fatigue life by 10 times up to 18,242 cycles under a maximum strain of 2.5%. Nevertheless, the detailed microscopic mechanism of the effect of training on structural fatigue is still unclear.
In previous studies, the mechanical training was mainly performed on coarse-grain NiTi alloys. However, nanocrystalline NiTi wires generally show a better functional stability and a higher structural fatigue life [9,10,20]. In this paper, the mechanical training is applied to nanocrystalline NiTi wires to enhance the fatigue resistance, which refers to both the reduction of the functional fatigue and improvement of the structural fatigue life. Transmission electron microscopy (TEM) and transmission Kikuchi diffraction (TKD) were used to characterize the evolution of microstructures after training, including dislocation structures, grain orientations, and kernel average misorientation (KAM), as well as the distribution of grain boundary misorientation. Combined with finite element simulations, the present study revealed that the fatigue performance of nanocrystalline NiTi SMA wires can be further improved by mechanical training and proposes a comprehensive explanation for its microscopic mechanism.
2. Materials and Methods
Commercial polycrystalline superelastic Ni50.8Ti49.2 SMA wires of 0.15 mm in diameter used in this study were obtained from PeierTech, Jiangyin, China. After heat treatment at temperature of 733 K for 5 min, followed by cooling in air, the NiTi wires were mainly composed of the B2 phase, with an average grain size of 84 nm (Figure 1). The NiTi wires tested in this study were divided into two groups. One group was subjected to stress-control training, following by the strain-control fatigue test. The other group was directly subjected to the strain-control fatigue test for comparative analysis. The former is referred to as the “trained” sample, and the latter is the “as-received” sample. The “trained” sample underwent 60 stress-control cycles, with a stress rate of 20 MPa/s (Figure S1 in Supplementary material shows the Selection principle of training system). During each cycle, the sample was loaded from 0 to 600 MPa and then relaxed from 600 MPa back to the stress-free condition. The strain-control fatigue tests on superelastic NiTi wires for both the as-received and trained samples were performed by controlling the applied displacement, and the maximum tensile strain used in the cyclic tests was set to 5%. All the sample wires were cycled until failure, and the strain rate used for the superelastic fatigue tests was chosen to be 1 × 10⁻²/s. The length of nanocrystalline (NC) NiTi wires used for tests in the present study was approximately 15 mm for each sample. The training process and fatigue tests were performed on an ElectroForce DMA 3200 fatigue testing machine (TA Instruments, New Castle, DE, USA) at room temperature (296 ± 1 K). The experimental setup is shown in Figure 2. Two pairs of aided grips were adopted to hold the SMA wire in place to avoid breakage at the contact point under low cycle fatigue loading. Each test was repeated at least three times. The evolution of functional characteristics, such as , , total strain (), and pseudoelastic strain (), was quantitative analyzed from the measured stress–strain responses.
A JEM ARM-200F (JEOL, Tokyo, Japan) TEM instrument was employed to determine the grain sizes and microstructures at 200 kV. A precision ion thinner (PIPS 695, Gatan, Pleasanton, CA, USA) was used to fabricate the TEM samples, and the wires were manually ground to a 40 μm thickness using 800-grit sandpaper. The grain orientations and grain boundaries were characterized by the TKD technique, with a significantly improved spatial resolution in the range of 2–10 nm [26,27]. The ion thinned samples were used for the TKD scans, and a 500 × 500 nm2 area was scanned with a step size of 6 nm for each sample using a scanning electron microscope (SEM, TESCAN MIRA3, Brno, Czech Republic) equipped with an electron back-scatter diffraction (EBSD) detector. Fractography analysis was also performed using scanning electron microscopy in the secondary electron mode.
3. Results
3.1. Mechanical Characterization
The uniaxial strain-controlled cyclic fatigue tests were performed with a maximum strain of 5% for the as-received and trained samples, until failure occurred. The superelastic stress–strain responses and corresponding analysis are given in Figure 3 and Figure 4. The associated functional characteristics, i.e., , , and , are determined from the stress–strain curves, as schematically shown in Figure 3a. The accumulation of at cycle N is defined as the initial strain in the cycle N+1, as shown in Figure 3a.
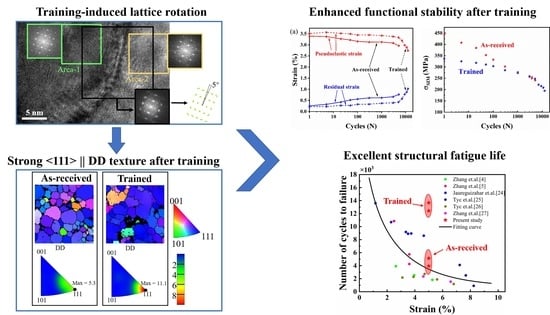
The evolution of residual and pseudoelastic strains with continuing cycles were calculated from the stress–strain curves in Figure 3b,c and shown in Figure 4a. According to Figure 4a, the residual strain increased during the fatigue tests, whereas the pseudoelastic strain decreased for both the as-received and trained samples. Compared to the as-received sample, the accumulated residual strain of the trained sample decreased by 83.8% in the first 5000 cycles, demonstrating that training suppressed dislocation accumulation during the fatigue tests. Figure 4b shows that decreased with repeated cycles for both samples. Considering , , and , the functional degradation for the trained sample was much slower compared to that of the as-received sample.
Notably, the evolution of residual strain, pseudoelastic strain, and all exhibited two-stage evolutions. Figure 4 is plotted with a logarithmic scale, and each curve had two different slopes. Figure 4c is an enlarged figure of the black square indicated in Figure 4b. According to Figure 4a–c, residual strain, pseudoelastic strain, and evolved gradually during the first 3000 and 5000 cycles for the as-received and trained samples, respectively, followed by a sharp change during the subsequent cycles. Compared with those of the as-received sample, the second stage continues over cycles. The two-stage evolution phenomenon was probably evidence of a change in the failure mode from functional degradation to structural fatigue. The difference in the rate and duration of the evolution of functional parameters between the as-received and trained samples could be because the rate of crack propagation in these two samples was different. The details will be discussed in Section 4.
In addition to the improvement in functional stability, training also significantly increased the structural fatigue life of NiTi wires. In this case, a 187.4% improvement in average structural fatigue life after training was observed. Figure 5 presents a comparison of the number of cycles to failure for the superelastic NiTi SMA wires under pull–pull cycles described in this work and previous studies [5,6,28,29,30,31]. The structural fatigue life usually decreases with an increase in the maximum strain applied during the strain-control fatigue tests. The number of cycles to failure for the two as-received samples was 5133 and 3943, which was in line with the trend presented by the data in the literature. However, the fatigue life of the two trained samples reached 13,660 and 12,420 under the maximum strain of 5%, which was much higher than that reported in the literature. Thus, reasonable training was an effective means to improve fatigue resistance. The trained NiTi wires with outstanding fatigue resistance in the present study are a promising candidate material for the execution component with a lager applied strain.
To investigate the underlying mechanism of training in the enhancement of fatigue resistance, the macroscopic mechanical responses during the training and evolution of the microstructure were analyzed. Figure 6 shows the evolution of total strain, residual strain, pseudoelastic strain, and that were evaluated from the stress–strain responses during training. The measurement method of the functional parameters is schematically shown in Figure 3a. According to Figure 6, residual strain increased during the first 40 cycles and then reached a stable stage, followed by relatively slow growth. After 60 cycles, the accumulated residual strain reached 4.16%. The dislocations that accompany the phase transformation are usually responsible for the accumulation of residual strain [32]. was 429.4 MPa for the first cycle, and decreased rapidly at first, and then gradually stabilized at approximately 300 MPa. The decrease in possibly resulted from the internal stress field caused by training-induced dislocations.
3.2. Microstructure Analysis
Figure 7a,b show the grain orientation maps for the as-received and the trained samples in the drawing direction (DD), transverse direction (TD), and normal direction (ND). Figure 7c,d show the corresponding inverse pole figures (IPFs) of these samples. The sample coordinate system used in the experiment is indicated in Figure 7a. The orientation of each grain is represented in IPF colors, and the black regions are undetected points according to TKD due to the high strain concentration. As shown in Figure 7a, the as-received sample had a weak <111> || DD texture with the maximum orientation intensity of 5.3 (Figure 7c). There was no obvious preferred orientation in the TD and ND. After the training process, the sample had a strong texture in the <111> orientation parallel to the DD, and the maximum orientation intensity increased to 11.1 (Figure 7d). In the TD and ND, the orientations of the grains were also more concentrated compared to those of the as-received sample. Based on the TKD results, we propose that the lattice rotation occurred during the training process, thus resulting in a strong <111> || DD texture. The Euler angles of each grain shown in Figure 7 were used to evaluate the amount of rotation due to training, and the calculated average rotation angle was 18° (Section 2, Supplementary Materials). The method of rotation angle computation as shown in ref. [33,34].
The comparison of the grain boundaries and the misorientations between the as-received and trained samples is shown in Figure 8a,b. Figure 8a shows that in the as-received sample, high-angle grain boundaries (HAGBs, >10°, marked by blue lines) were dominant, accounting for 70.6% of the boundaries, whereas the fraction of low-angle grain boundaries (LAGBs, 2–10°, marked by red lines) was only 29.4%. After training, the fraction of LAGBs increased to 59.6%. In some cases, several adjacent grains could not be distinguished in the IPF maps (the interfaces are marked by the white ovals in Figure 7b). Figure 8c,d presents the distributions of the KAM of the as-received and trained samples, respectively. Higher local misorientation regions were mostly distributed at the LAGBs, indicating that training-induced dislocations were associated with the formation of LAGBs. Figure 8e shows that the distribution of the local misorientations and average KAM values of the as-received and trained samples were 0.374 and 0.549, respectively. This result indicated that the geometrically necessary dislocations (GNDs) density increased by 46.8% after training because the GND density is proportional to the KAM value [35,36]. The significantly increased volume fraction of LAGBs with a high density of GNDs for the trained sample provided more evidence that lattice rotation occurred during training.
Figure 9, Figure 10 and Figure 11 show microstructural observation by TEM of the as-received and trained samples. According to Figure 9, we can see that there were few dislocations in the as-received sample. Geometrical phase analysis (GPA) was used to analyze the relevant atomic strain distribution (Figure 9d,e and Figure 10h–k). Figure 9d,e shows that the atomic strain distribution was uniform, with a relatively low level in the as-received sample. Figure 10a is the bright-field image of the trained sample. Figure 10a shows the existence of dislocation walls, which are marked by blue arrows, inside the grains in the trained sample. The high-resolution transmission electron microscope (HRTEM) image of the blue rectangle area in Figure 10a revealed that the dislocation wall divided the grain into two parts (Figure 10b). Figure 10c–e shows the fast Fourier transformation (FFT) patterns of the green, yellow, and red square domain in Figure 10b. The indexed FFT pattern sketch shown in Figure 10f reveals that there was a misorientation between the lattice planes on the two sides of the dislocation wall, indicating that the lattice rotation in a single grain was uneven. Figure 10g shows the inverse FFT pattern (IFFT) of area-1. Only a few dislocations remained in area-1, as identified in the IFFT image. Figure 10h,i and Figure 10j,k present the GPA results of the matrix (area-1) and the dislocation wall region (area-3), respectively. The atomic strain distribution was sparse in area-1, whereas this distribution was dense in area-3 in both the xx and yy directions. This result indicated that a higher degree of lattice distortion occurred in the region closer to the dislocation walls, corresponding to the higher density dislocations in area-3, as shown in Figure 10l.
Figure 11 shows the TEM analysis of a grain boundary. Figure 11a–c shows the FFT patterns for the yellow, blue, and pink square domain in Figure 11c. The FFT pattern of the area indicated by a pink square (Figure 11d) shows a superimposed image of Figure 11a,b, with a small deflection, indicating that this grain boundary was an LAGB. The corresponding IFFT of Figure 11d verified the presence of many dislocations at the grain boundary (Figure 11e). The GPA results (Figure 11f,g) demonstrated that there was a large amount of atomic strain distributed at the grain boundary, which is similar to that in the dislocation wall region. In particular, high-level shear strain existed in the grain boundary region (Figure 11g). The results of the IFFT and GPA of the grain boundary illustrated the existence of dislocations at the grain boundaries, which corresponded to the high KAM value at the interfaces of different grains detected by TKD. The presence of lattice strain indicated that internal stress remained inside the sample after training, leading to the decrease in during fatigue tests of the trained sample. On the other hand, the presence of many dislocations inside the grains and at the grain boundaries resulted in the accumulation of residual strain.
Compared to those of the as-received sample, the functional stability and structural fatigue life of the trained sample were effectively improved. The decreased misorientation of the grain boundaries and the FFT analysis both verified that lattice rotation occurred during training, leading to the strong <111> || DD texture. To our knowledge, the excellent fatigue resistance performance resulting from the preferred grain orientation after training has not been previously reported. The relationship between the lattice rotation and enhanced fatigue resistance will be discussed in the next section.
4. Discussion
4.1. Influence of Training on Functional Degradation
Generally, functional degradation is caused by dislocation plasticity [32,37], deformation twins [38,39,40], and residual martensite [32,41,42]. In this study, XRD results (see Figure S2 in Section 4, Supplementary Materials) and TEM observation (Figure 10a–e) indicated that no residual martensite or deformation twins were observed for the trained sample, which is in line with the previous research [9,43]. Therefore, the generation and accumulation of dislocations resulted in functional degradation, including the accumulation of residual strain and a decrease in during training.
Plastic deformation involving dislocation activities is generally considered to be a contributor to the evolution of texture [44,45,46]. During dislocation slipping, the shear stress on the slip plane is divided into two parts, a component stress parallel to the slip direction and component stress vertical to the slip direction. The former is the effective stress that causes dislocations to slip, and the latter tends to cause the crystal planes to rotate. In this study, TEM observations demonstrate that the lattice rotation resulting from training-induced dislocations is responsible for the enhanced <111> || DD texture of the trained sample (Figure 7b,d and Figure 10a–f).
The training-induced preferential grain orientation contributed to reduce the misorientation at the grain boundaries (Figure 8a,b). The incompatible strain at the grain boundaries reduced with the reduction in the misorientation of the adjacent grains, leading to a decrease in plastic deformation in the subsequent fatigue cycles. Besides, according to GPA results, training-induced dislocations caused a local internal stress field inside the sample (shown in Figure 10h–k and Figure 11f,g), which promoted martensite nucleation and lowered the critical external stress needed for martensite transformation during fatigue cycles (Figure 4b). The preferential grain orientation and decreased transformation stress caused by training-induced dislocations reduced the formation and slipping of dislocations, resulting in a lower accumulated residual strain for the trained sample at the same cycles (Figure 4a), i.e., an enhanced cyclic stability.
In this study, the training-induced <111> || DD texture was also a key factor for the improvement of the functional stability. The grains with the [111]B2 orientations have a larger transformation strain in the loading direction [47]. Therefore, a smaller volume fraction of B2 grains in the NiTi wires with a <111> || DD texture underwent martensitic transformation upon strain-controlled fatigue cycles. As the volume fraction of the martensite-austenite interface decreased, so did the plastic deformation. In addition, the calculated Taylor factor, which is equal to the inverse of the Schmid factor, has the minimum value for the <111> oriented grains [48]. This result indicated that the stress required for the martensitic transformation of the trained sample with a <111> || DD texture was the lowest. Thus, the driving force for the formation and movement was likewise the lowest, delaying functional degradation. As mentioned above, the suppressed dislocation activity during fatigue tests was the main factor that caused the outstanding functional stability of the trained sample.
4.2. Influence of Training on Structural Fatigue
The enhanced structural fatigue life due to training-induced preferential grain orientation was attributed to the reduced stress concentration and increased energy dissipation ahead of the crack tip. In addition to the dislocations introduced during processing, local stress concentration mainly resulted from incompatible strains near grain boundaries. To determine the strain distribution and induced strain energy during loading, finite element simulations were performed for the as-received and trained samples. The simulations are performed using a finite element multiphysics object-oriented simulation environment (MOOSE) using the model presented in reference [49,50,51]. The elastic constants and the mechanical properties used in the simulation are shown in Table S5 of supplementary according to ref. [52]. The grain orientations used in the simulations were assigned by the Euler angles extracted from the TKD results (Figure 12a,b). The orientations were indicated by the IPF colors. The tensile loading applied to the top and bottom boundaries was fixed in the y direction. Figure 12c,d presents the distribution of the shear strain () and strain in the loading direction () of the as-received sample. Section 3 in the Supplementary material shows the calculation details of finite element simulations. For the as-received sample, the local strain concentration at the grain boundary regions was caused by the uncoordinated transformation strain of grains with different orientations; this is in line with the results of the previous report [53]. The presence of shear strain in the as-received sample indicated that the lattice might rotate when under deformation. As for the trained sample, the strong <111> || DD texture enabled polycrystalline NiTi to exhibit phase transformation behavior similar to that of a single crystal. The grain orientations were highly uniform, so the shear strain was negligible (Figure 12f) and the strain in the loading direction was evenly distributed inside the sample (Figure 12g). The strain concentration near the grain boundaries was significantly reduced. Figure 12e,h shows the strain energy density calculated based on the stress and strain distribution in the as-received and the trained samples, respectively. The strain energy induced by deformation provides the energy needed to create crack surfaces and is thus the driving force of crack propagation [54]. Higher strain energy density in the as-received sample suggested faster crack growth and an earlier failure of the material.
The strong <111> || DD texture led to an increase in energy dissipation ahead of the crack tip. Sun et al. [18] proposed that energy dissipation due to phase transformation and plastic deformation in front of the crack tip has a shielding effect on the propagation of cracks, and NiTi alloys with larger grains exhibit better shielding against the crack opening, leading to a higher fatigue life. Similar to the large-grain samples, the trained sample with the strong <111> || DD texture was more prone to plastic deformation [55] and had the lowest [48]. Therefore, the sizes of the crack-tip phase transformation zone and the plastic zone were enlarged for the trained sample compared to those of the as-received sample, so the crack-tip shielding effect was enhanced, which increased the resistance to crack growth. Furthermore, the decreased value reduced the driving force of crack propagation. The training-induced <111> || DD texture contributed to reduce the driving force and increase the resistance to crack growth, slowing the crack propagation process and improving the structural fatigue life of NiTi SMA wires.
The fracture surfaces of the as-received and trained samples after fatigue tests until failure are shown in Figure 13. The fracture surfaces for both samples were divided into crack nucleation points, fatigue crack propagation areas, and ductile fracture areas. Surface scratches and impurities introduced during material processing generally act as the crack nucleation sites [56]. In this study, the surface state of both groups of NiTi wires was similar. The growth of cracks for the as-received sample was multi-regional, whereas that of the trained sample was single-regional. The difference was attributed to the effective driving force for crack growth. For the as-received sample, the applied stress was higher during the fatigue test (Figure 4b), and the local stress concentration caused by the anisotropy of the grains with different orientations was more severe; both contributed to the formation of persistent slip bands and micro-cracks. The persistent slip bands reduced the local stress intensity factor, and the micro-cracks evolved into macroscopic cracks [57,58]. Thus, the fatigue crack propagation is easier in the as-received sample. In the trained sample, the relatively uniform stress distribution and increased energy dissipation reduced the driving force and increased the resistance to crack propagation, so the cracks tended to propagate in the preferred direction.
Crack propagation also has an influence on the functional degradation. As mentioned in Section 3.2, the functional degradation involves two stages during the fatigue tests (Figure 4), which was different from previous reports [6,59,60,61]. Here, we propose a transition in the fatigue mode during the tests. During the first stage of fatigue (around 1–5000 cycles), functional fatigue dominated the degradation of material performance. Because the stress applied during the fatigue test for the as-received sample was much higher than that of the trained sample in the first stage (Figure 4b), the functional degradation of the as-received sample was faster. At approximately the 5000th cycle, cracks nucleate at the stress concentration regions on the wire surfaces, followed by the propagation of cracks until failure occurred. Thus, structural fatigue dominated the evolution of the functional parameters in the second stage (5000th cycle to failure). The duration of the second stage indicated the difference in propagation processes between the as-received and trained samples. As mentioned above, the effective driving force for crack growth for the trained sample with the <111> || DD texture was much lower. Thus, the second stage of the trained sample had more cycles. The change in fatigue mode resulted in a two-stage evolution of , residual strain, and pseudoelastic strain, and the slower crack propagation caused by the training-induced <111> || DD texture contributed to a longer structural life.
5. Conclusions
In this study, significantly enhanced fatigue resistance was achieved via performing a stress-controlled training on NC NiTi SMA wires. The associated microscopic mechanism was investigated based on detailed TKD and HRTEM analyses. The conclusions of this work can be summarized as follows:
- Using a stress-control mechanical training procedure with a peak stress of 600 MPa for 60 cycles at room temperature, the average structural fatigue life increased from 4538 to 13,040 cycles in the strain-control fatigue tests, with the maximum strain of 5%, and the functional stability was also greatly enhanced.
- Microstructure characterization shows that the <111> texture has been significantly enhanced after training by using the TKD technique. TEM observations demonstrate that the lattice rotation resulting from training-induced dislocations is responsible for the evolution of texture.
- The improvement in fatigue resistance was attributed to the training-induced preferential grain orientation, which led to the reduction of the driving force and an increase in the resistance to crack propagation. Finite element method simulation results reveal that training-enhanced <111> texture contributes to reduce the incompatible deformation between different grains.
This work proposes a concise and effective mechanical training strategy to enhance the fatigue resistance of NiTi wires, providing new inspiration for the microstructure design of high-performance shape memory alloys.
Supplementary Materials
The following supporting information can be downloaded at: https://www.mdpi.com/article/10.3390/met13020361/s1, Figure S1: The loading-unloading stress-strain curve of uniaxial tension with a peak stress of 700 MPa; Figure S2: X-ray diffraction profiles of the NiTi shape memory alloy wires; Table S1: The grain orientations extracted from the as-received sample; Table S2: The grain orientations extracted from the trained sample; Table S3: The grain orientations extracted from the as-received sample. The Euler angles are in degrees; Table S4: The grain orientations extracted from the trained sample; Table S5: The elastic constants and the mechanical properties used in the simulation.
Author Contributions
Conceptualization, X.C. and M.J.; methodology, P.C. and Y.L.; investigation, P.C., N.M., and Z.W.; writing—original draft preparation, P.C.; writing—review and editing, X.C. and M.J.; project administration, X.J. All authors have read and agreed to the published version of the manuscript.
Funding
This work was supported by the National Natural Science Foundation of China (grant number 51201100).
Institutional Review Board Statement
Not applicable.
Data Availability Statement
Data are available from the corresponding author on reasonable request.
Acknowledgments
We thank Yongjia Liu from the Instrumental Analysis Center of Shanghai Jiao Tong University for assistance with the mechanical performance testing of DMA.
Conflicts of Interest
The authors declare no conflict of interest.
References
- Shabalovskaya, S.A. On the nature of the biocompatibility and on medical applications of NiTi shape memory and superelastic alloys. Bio-Med. Mater. Eng. 1996, 6, 267–289. [Google Scholar] [CrossRef]
- Drukteinis, S.; Peciuliene, V.; Bendinskaite, R.; Brukiene, V.; Maneliene, R.; Nedzinskiene, E. Shaping Ability, Cyclic Fatigue Resistance and Fractographic Analysis of Hybrid and Reciprocating Nickel Titanium Endodontic Instruments. Metals 2020, 10, 172. [Google Scholar] [CrossRef]
- Hartl, D.J.; Lagoudas, D. Aerospace applications of shape memory alloys. Proc. Inst. Mech. Eng. Part G J. Aerosp. Eng. 2014, 221, 535–552. [Google Scholar] [CrossRef]
- Mohd-Jani, J.; Leary, M.; Subic, A.; Gibson, M.A. A review of shape memory alloy research, applications and opportunities. Mater. Des. 2014, 56, 1078–1113. [Google Scholar] [CrossRef]
- Zhang, Y.; You, Y.; Moumni, Z.; Anlas, G.; Zhu, J.; Zhang, W. Experimental and theoretical investigation of the frequency effect on low cycle fatigue of shape memory alloys. Int. J. Plast. 2017, 90, 1–30. [Google Scholar] [CrossRef]
- Zhang, Y.; Moumni, Z.; Zhu, J.; Zhang, W. Effect of the amplitude of the training stress on the fatigue lifetime of NiTi shape memory alloys. Scr. Mater. 2018, 149, 66–69. [Google Scholar] [CrossRef]
- Eggeler, G.; Hornbogen, E.; Yawny, A.; Heckmann, A.; Wagner, M. Structural and functional fatigue of NiTi shape memory alloys. Mater. Sci. Eng. A 2004, 378, 24–33. [Google Scholar] [CrossRef]
- Paranjape, H.M.; Bowers, M.L.; Mills, M.J.; Anderson, P.M. Mechanisms for phase transformation induced slip in shape memory alloy micro-crystals. Acta Mater. 2017, 132, 444–454. [Google Scholar] [CrossRef]
- Delville, R.; Malard, B.; Pilch, J.; Sittner, P.; Schryvers, D. Transmission electron microscopy investigation of dislocation slip during superelastic cycling of Ni–Ti wires. Int. J. Plast. 2011, 27, 282–297. [Google Scholar] [CrossRef]
- Delville, R.; Malard, B.; Pilch, J.; Sittner, P.; Schryvers, D. Microstructure changes during non-conventional heat treatment of thin Ni–Ti wires by pulsed electric current studied by transmission electron microscopy. Acta Mater. 2010, 58, 4503–4515. [Google Scholar] [CrossRef]
- Ahadi, A.; Sun, Q. Stress-induced nanoscale phase transition in superelastic NiTi by in situ X-ray diffraction. Acta Mater. 2015, 90, 272–281. [Google Scholar] [CrossRef]
- Robertson, S.W.; Pelton, A.R.; Ritchie, R.O. Mechanical fatigue and fracture of Nitinol. Int. Mater. Rev. 2013, 57, 1–37. [Google Scholar] [CrossRef]
- Glushko, O.; Kiener, D. Initiation of fatigue damage in ultrafine grained metal films. Acta Mater. 2021, 206, 116599. [Google Scholar] [CrossRef]
- Gollerthan, S.; Young, M.; Baruj, A.; Frenzel, J.; Schmahl, W.; Eggeler, G. Fracture mechanics and microstructure in NiTi shape memory alloys. Acta Mater. 2009, 57, 1015–1025. [Google Scholar] [CrossRef]
- Robertson, S.; Mehta, A.; Pelton, A.; Ritchie, R. Evolution of crack-tip transformation zones in superelastic Nitinol subjected to in situ fatigue: A fracture mechanics and synchrotron X-ray microdiffraction analysis. Acta Mater. 2007, 55, 6198–6207. [Google Scholar] [CrossRef]
- Tyc, O.; Molnárová, O.; Šittner, P. Effect of microstructure on fatigue of superelastic NiTi wires. Int. J. Fatigue 2021, 152, 106400. [Google Scholar] [CrossRef]
- Zhang, K.; Kang, G.; Sun, Q. High fatigue life and cooling efficiency of NiTi shape memory alloy under cyclic compression. Scr. Mater. 2019, 159, 62–67. [Google Scholar] [CrossRef]
- Chen, J.; Yin, H.; Sun, Q. Effects of grain size on fatigue crack growth behaviors of nanocrystalline superelastic NiTi shape memory alloys. Acta Mater. 2020, 195, 141–150. [Google Scholar] [CrossRef]
- Xie, G.; Wang, F.; Song, B.; Cheng, J.; Wang, J.; Zeng, X. Grain size dependence of cracking performance in polycrystalline NiTi alloys. J. Alloy. Compd. 2021, 884, 161132. [Google Scholar] [CrossRef]
- Yin, H.; He, Y.; Moumni, Z.; Sun, Q. Effects of grain size on tensile fatigue life of nanostructured NiTi shape memory alloy. Int. J. Fatigue 2016, 88, 166–177. [Google Scholar] [CrossRef]
- Karakoc, O.; Atli, K.; Evirgen, A.; Pons, J.; Santamarta, R.; Benafan, O.; Noebe, R.; Karaman, I. Effects of training on the thermomechanical behavior of NiTiHf and NiTiZr high temperature shape memory alloys. Mater. Sci. Eng. A 2020, 794, 139857. [Google Scholar] [CrossRef]
- Hayrettin, C.; Karakoc, O.; Karaman, I.; Mabe, J.; Santamarta, R.; Pons, J. Two way shape memory effect in NiTiHf high temperature shape memory alloy tubes. Acta Mater. 2019, 163, 1–13. [Google Scholar] [CrossRef]
- Chang, C.-Y.; Vokoun, D.; Hu, C.-T. Two-way shape memory effect of NiTi alloy induced by constraint aging treatment at room temperature. Met. Mater. Trans. A 2001, 32, 1629–1634. [Google Scholar] [CrossRef]
- Chu, K.; Sun, Q. Reducing functional fatigue, transition stress and hysteresis of NiTi micropillars by one-step overstressed plastic deformation. Scr. Mater. 2021, 201, 113958. [Google Scholar] [CrossRef]
- Perkins, J.; Bobowiec, P. Microstructural effects of martensitic transformation cycling of a Cu-Zn-Al alloy: Vestigial structures in the parent phase. Met. Mater. Trans. A 1986, 17, 195–203. [Google Scholar] [CrossRef]
- Trimby, P.W. Orientation mapping of nanostructured materials using transmission Kikuchi diffraction in the scanning electron microscope. Ultramicroscopy 2012, 120, 16–24. [Google Scholar] [CrossRef] [PubMed]
- Trimby, P.W.; Cao, Y.; Chen, Z.; Han, S.; Hemker, K.J.; Lian, J.; Liao, X.; Rottmann, P.; Samudrala, S.; Sun, J.; et al. Characterizing deformed ultrafine-grained and nanocrystalline materials using transmission Kikuchi diffraction in a scanning electron microscope. Acta Mater. 2014, 62, 69–80. [Google Scholar] [CrossRef]
- Jaureguizahar, S.M.; Chapetti, M.D.; Yawny, A.A. Fatigue of NiTi shape memory wires. Procedia Struct. Integr. 2016, 2, 1427–1434. [Google Scholar] [CrossRef]
- Tyc, O.; Heller, L.; Vronka, M.; Šittner, P. Effect of temperature on fatigue of superelastic NiTi wires. Int. J. Fatigue 2020, 134, 105470. [Google Scholar] [CrossRef]
- Tyc, O.; Pilch, J.; Sittner, P. Fatigue of superelastic NiTi wires with different plateau strain. Procedia Struct. Integr. 2016, 2, 1489–1496. [Google Scholar] [CrossRef]
- Zhang, Y.; Moumni, Z.; You, Y.; Zhang, W.; Zhu, J.; Anlas, G. Multiscale TRIP-based investigation of low-cycle fatigue of polycrystalline NiTi shape memory alloys. Int. J. Plast. 2018, 115, 307–329. [Google Scholar] [CrossRef]
- Hua, P.; Lin, H.; Sun, Q. Ultrahigh cycle fatigue deformation of polycrystalline NiTi micropillars. Scr. Mater. 2021, 203, 114108. [Google Scholar] [CrossRef]
- Cai, X.; Handwerker, C.A.; Blendell, J.E.; Koslowski, M. Shallow grain formation in Sn thin films. Acta Mater. 2020, 192, 1–10. [Google Scholar] [CrossRef]
- Jahedi, M.; Ardeljan, M.; Beyerlein, I.J.; Paydar, M.H.; Knezevic, M. Enhancement of orientation gradients during simple shear deformation by application of simple compression. J. Appl. Phys. 2015, 117, 214309. [Google Scholar] [CrossRef]
- Motz, C.; Schöberl, T.; Pippan, R. Mechanical properties of micro-sized copper bending beams machined by the focused ion beam technique. Acta Mater. 2005, 53, 4269–4279. [Google Scholar] [CrossRef]
- Gao, H.; Huang, Y.; Nix, W.; Hutchinson, J. Mechanism-based strain gradient plasticity? I. Theory. J. Mech. Phys. Solids 1999, 47, 1239–1263. [Google Scholar] [CrossRef]
- Xiao, Y.; Zeng, P.; Lei, L.; Zhang, Y. In situ observation on temperature dependence of martensitic transformation and plastic deformation in superelastic NiTi shape memory alloy. Mater. Des. 2017, 134, 111–120. [Google Scholar] [CrossRef]
- Gao, Y.; Casalena, L.; Bowers, M.; Noebe, R.; Mills, M.; Wang, Y. An origin of functional fatigue of shape memory alloys. Acta Mater. 2017, 126, 389–400. [Google Scholar] [CrossRef]
- Šittner, P.; Molnárová, O.; Kaderavek, L.; Tyc, O.; Heller, L. Deformation twinning in martensite affecting functional behavior of NiTi shape memory alloys. Materialia 2020, 9, 100506. [Google Scholar] [CrossRef]
- Chen, Y.; Tyc, O.; Kadeřávek, L.; Molnárová, O.; Heller, L.; Šittner, P. Temperature and microstructure dependence of localized tensile deformation of superelastic NiTi wires. Mater. Des. 2019, 174, 107797. [Google Scholar] [CrossRef]
- Polatidis, E.; Šmíd, M.; Kuběna, I.; Hsu, W.-N.; Laplanche, G.; Van Swygenhoven, H. Deformation mechanisms in a superelastic NiTi alloy: An in-situ high resolution digital image correlation study. Mater. Des. 2020, 191, 108622. [Google Scholar] [CrossRef]
- Belyaev, S.; Resnina, N.; Ponikarova, I.; Iaparova, E.; Rakhimov, T.; Ivanova, A.; Tabachkova, N.; Andreev, V. Damage of the martensite interfaces as the mechanism of the martensite stabilization effect in the NiTi shape memory alloys. J. Alloy. Compd. 2022, 921, 166189. [Google Scholar] [CrossRef]
- Polatidis, E.; Zotov, N.; Bischoff, E.; Mittemeijer, E. The effect of cyclic tensile loading on the stress-induced transformation mechanism in superelastic NiTi alloys: An in-situ X-ray diffraction study. Scr. Mater. 2015, 100, 59–62. [Google Scholar] [CrossRef]
- Li, H.; Chen, T.; Li, W.; Zhang, H.; Han, S.; Zhou, C.; Chen, Z.; Flores-Johnson, E.A.; Shen, L.; Lian, J.; et al. Grain size dependent microstructure and texture evolution during dynamic deformation of nanocrystalline face-centered cubic materials. Acta Mater. 2021, 216, 117088. [Google Scholar] [CrossRef]
- Madhavan, R.; Ray, R.; Suwas, S. Texture transition in cold-rolled nickel–40wt.% cobalt alloy. Acta Mater. 2014, 74, 151–164. [Google Scholar] [CrossRef]
- Madhavan, R.; Suwas, S. Micro-mechanisms of deformation texture evolution in nanocrystalline nickel-cobalt alloys. Acta Mater. 2016, 121, 46–58. [Google Scholar] [CrossRef]
- Buchheit, T.E.; Wert, J.A. Predicting the orientation-dependent stress-induced transformation and detwinning response of shape memory alloy single crystals. Met. Mater. Trans. A 1996, 27, 269–279. [Google Scholar] [CrossRef]
- Ono, N.; Satoh, A.; Ohta, H. A Discussion on the Mechanical Properties of Shape Memory Alloys Based on a Polycrystal Model. Mater. Trans. JIM 1989, 30, 756–764. [Google Scholar] [CrossRef]
- Alger, B.; Andrš, D.; Carlsen, R.W.; Gaston, D.R.; Kong, F.; Lindsay, A.D.; Miller, J.M.; Permann, C.J.; Peterson, J.W.; Slaughter, A.E.; et al. MOOSE Web Page. 2020. Available online: https://mooseframework.org (accessed on 2 August 2021).
- Simo, J.C.; Hughes, T.J.R. Computational Inelasticity: Volume 7 of Interdisciplinary Applied Mathematics; Springer: Secaucus, NJ, USA, 1998. [Google Scholar]
- Xu, L.; Solomou, A.; Baxevanis, T.; Lagoudas, D. Finite strain constitutive modeling for shape memory alloys considering transformation-induced plasticity and two-way shape memory effect. Int. J. Solids Struct. 2020, 221, 42–59. [Google Scholar] [CrossRef]
- Wagner, M.F.-X.; Windl, W. Elastic anisotropy of Ni4Ti3 from first principles. Scr. Mater. 2009, 60, 207–210. [Google Scholar] [CrossRef]
- Lackmann, J.; Niendorf, T.; Maxisch, M.; Grundmeier, G.; Maier, H. High-resolution in-situ characterization of the surface evolution of a polycrystalline NiTi SMA-alloy under pseudoelastic deformation. Mater. Charact. 2011, 62, 298–303. [Google Scholar] [CrossRef]
- Griffith, A.A. VI. The phenomena of rupture and flow in solids. Philos. Trans. R. Soc. Lond. Ser. A 1920, 221, 163–198. [Google Scholar]
- Paranjape, H.; Anderson, P.M. Texture and grain neighborhood effects on Ni–Ti shape memory alloy performance. Model. Simul. Mater. Sci. Eng. 2014, 22, 075002. [Google Scholar] [CrossRef]
- Rahim, M.; Frenzel, J.; Frotscher, M.; Pfetzing-Micklich, J.; Steegmüller, R.; Wohlschlögel, M.; Mughrabi, H.; Eggeler, G. Impurity levels and fatigue lives of pseudoelastic NiTi shape memory alloys. Acta Mater. 2013, 61, 3667–3686. [Google Scholar] [CrossRef]
- Cervellon, A.; Hémery, S.; Kürnsteiner, P.; Gault, B.; Kontis, P.; Cormier, J. Crack initiation mechanisms during very high cycle fatigue of Ni-based single crystal superalloys at high temperature. Acta Mater. 2020, 188, 131–144. [Google Scholar] [CrossRef]
- Frenzel, J. On the Importance of Structural and Functional Fatigue in Shape Memory Technology. Shape Mem. Superelasticity 2020, 6, 213–222. [Google Scholar] [CrossRef]
- Hua, P.; Chu, K.; Ren, F.; Sun, Q. Cyclic phase transformation behavior of nanocrystalline NiTi at microscale. Acta Mater. 2020, 185, 507–517. [Google Scholar] [CrossRef]
- Karakoc, O.; Hayrettin, C.; Canadinc, D.; Karaman, I. Role of applied stress level on the actuation fatigue behavior of NiTiHf high temperature shape memory alloys. Acta Mater. 2018, 153, 156–168. [Google Scholar] [CrossRef]
- Hou, H.; Simsek, E.; Ma, T.; Johnson, N.S.; Qian, S.; Cissé, C.; Stasak, D.; Al Hasan, N.; Zhou, L.; Hwang, Y.; et al. Fatigue-resistant high-performance elastocaloric materials made by additive manufacturing. Science 2019, 366, 1116–1121. [Google Scholar] [CrossRef]
Figure 1.
(a–c) show the bright-field TEM image, the SAED of the circled region in (a) and grain size distribution of the as-received NC NiTi sample, respectively.
Figure 1.
(a–c) show the bright-field TEM image, the SAED of the circled region in (a) and grain size distribution of the as-received NC NiTi sample, respectively.

Figure 2.
The geometrical representations of the real samples and the fatigue analysis apparatus.

Figure 3.
(a) Schematic diagram exhibiting how the relevant functional parameters were measured from the obtained stress–strain curves. The macroscopic stress–strain curves of nanocrystalline (NC) NiTi wires during fatigue tests until fracture: (b) as-received sample, and (c) trained sample.
Figure 3.
(a) Schematic diagram exhibiting how the relevant functional parameters were measured from the obtained stress–strain curves. The macroscopic stress–strain curves of nanocrystalline (NC) NiTi wires during fatigue tests until fracture: (b) as-received sample, and (c) trained sample.

Figure 4.
(a) indicates the evolution of pseudoelastic and residual strains, and (b) indicates the evolution of of the as-received and trained samples during fatigue tests. (c) is an enlarged view of the framed area in (b).
Figure 4.
(a) indicates the evolution of pseudoelastic and residual strains, and (b) indicates the evolution of of the as-received and trained samples during fatigue tests. (c) is an enlarged view of the framed area in (b).

Figure 5.
Comparison of structural fatigue life for NiTi SMA wires reported in previous research and this work [5,6,28,29,30,31].

Figure 6.
Evolution of critical stress to trigger stress-induced martensitic transformation (), total strain (), residual strain (), and pseudoelastic strain () during 60 cycles of training.
Figure 6.
Evolution of critical stress to trigger stress-induced martensitic transformation (), total strain (), residual strain (), and pseudoelastic strain () during 60 cycles of training.

Figure 7.
(a,b) The inverse pole figure (IPF) maps of the as-received and trained sample, respectively; (c,d) IPFs of the as-received and trained sample, respectively.
Figure 7.
(a,b) The inverse pole figure (IPF) maps of the as-received and trained sample, respectively; (c,d) IPFs of the as-received and trained sample, respectively.

Figure 8.
(a,c) show grain boundaries and kernel average misorientation (KAM) maps for the as-received sample, respectively. (b,d) are those for the trained sample. For (a,b), low-angle grain boundaries (LAGBs) are in red (2° < β < 10°), and high-angle grain boundaries (HAGBs) are in blue (β > 10°). (e) shows the distribution of KAM values for both samples.

Figure 9.
TEM observation of the as-received sample: (a) bright-field images; (b) high-resolution transmission electron microscope (HRTEM) images; (c–e) show the inverse fast Fourier transformation (IFFT) images and the geometric phase analysis (GPA) images of the pink square domain in (b).
Figure 9.
TEM observation of the as-received sample: (a) bright-field images; (b) high-resolution transmission electron microscope (HRTEM) images; (c–e) show the inverse fast Fourier transformation (IFFT) images and the geometric phase analysis (GPA) images of the pink square domain in (b).

Figure 10.
TEM observation of the trained sample: (a) bright-field image; (b) HRTEM image; (c–e) show the fast Fourier transformation (FFT) patterns; (f) is an indexed FFT pattern sketch of (e); (g,l) show the IFFT of (c,e); (h,i) and (j,k) are, respectively, the GPA results of area-1 and area-3 in (b).

Figure 11.
TEM observation of a grain boundary for the trained sample: (a,b,d) show the FFT patterns of the area indicated by yellow, blue and pink squares, respectively; (c) the HRTEM image; (e–g) show the IFFT patterns and GPA results of the area indicated by pink square.
Figure 11.
TEM observation of a grain boundary for the trained sample: (a,b,d) show the FFT patterns of the area indicated by yellow, blue and pink squares, respectively; (c) the HRTEM image; (e–g) show the IFFT patterns and GPA results of the area indicated by pink square.

Figure 12.
Grain orientations used in the simulations for (a) the as-received and (b) the trained samples, respectively. (c–e) are the contour plots of and the strain energy density of the as-received sample, respectively. (f–h) are the contour plots of and the strain energy density of the trained sample, respectively. The applied strain was 5%.

Figure 13.
Fracture surface of the nanocrystalline (NC) NiTi wire: (a) as-received, and (b) trained. The initiation points of the cracks are marked with white arrows.
Figure 13.
Fracture surface of the nanocrystalline (NC) NiTi wire: (a) as-received, and (b) trained. The initiation points of the cracks are marked with white arrows.

Disclaimer/Publisher’s Note: The statements, opinions and data contained in all publications are solely those of the individual author(s) and contributor(s) and not of MDPI and/or the editor(s). MDPI and/or the editor(s) disclaim responsibility for any injury to people or property resulting from any ideas, methods, instructions or products referred to in the content. |
© 2023 by the authors. Licensee MDPI, Basel, Switzerland. This article is an open access article distributed under the terms and conditions of the Creative Commons Attribution (CC BY) license (https://creativecommons.org/licenses/by/4.0/).
Share and Cite
MDPI and ACS Style
Chen, P.; Cai, X.; Min, N.; Liu, Y.; Wang, Z.; Jin, M.; Jin, X. Enhanced Fatigue Resistance of Nanocrystalline Ni50.8Ti49.2 Wires by Mechanical Training. Metals 2023, 13, 361. https://doi.org/10.3390/met13020361
AMA Style
Chen P, Cai X, Min N, Liu Y, Wang Z, Jin M, Jin X. Enhanced Fatigue Resistance of Nanocrystalline Ni50.8Ti49.2 Wires by Mechanical Training. Metals. 2023; 13(2):361. https://doi.org/10.3390/met13020361
Chicago/Turabian StyleChen, Peng, Xiaorong Cai, Na Min, Yunfan Liu, Zhengxiong Wang, Mingjiang Jin, and Xuejun Jin. 2023. "Enhanced Fatigue Resistance of Nanocrystalline Ni50.8Ti49.2 Wires by Mechanical Training" Metals 13, no. 2: 361. https://doi.org/10.3390/met13020361
Note that from the first issue of 2016, this journal uses article numbers instead of page numbers. See further details here.