
Formation of Lithium-Manganates in a Complex Slag System Consisting of Li2O-MgO-Al2O3-SiO2-CaO-MnO—A First Survey


1
Department of Mineralogy, Geochemistry, Salt Deposits, Institute of Disposal Research, Clausthal University of Technology, Adolph-Roemer-Str. 2A, 38678 Clausthal-Zellerfeld, Germany
2
Institute of Inorganic and Analytical Chemistry, Clausthal University of Technology, Arnold-Sommerfeld Str. 4, 38678 Clausthal-Zellerfeld, Germany
*
Author to whom correspondence should be addressed.
Metals 2023, 13(12), 2006; https://doi.org/10.3390/met13122006
Submission received: 23 November 2023
/
Revised: 8 December 2023
/
Accepted: 9 December 2023
/
Published: 13 December 2023
Abstract
:Due to the increasing demand for electromobility, the recovery of technologically relevant elements from spent Li-ion batteries is becoming increasingly important. Pyrometallurgical processing can deal with a broad range of input materials. Unfortunately, ignoble elements such as Li and Mn enter the slag. A novel approach to facilitate this processing is the Engineered Artificial Minerals (EnAM) strategy for the recovery of critical elements. The aim of this study is to investigate whether it is possible to stabilize Li in Li-manganates as the first crystallizate. For this purpose, synthetic oxide slags (Li, Mg, Al, Si, Ca, Mn) of varying compositions were made. The constituting compounds were identified using inductively coupled plasma optical emission spectrometry, powder X-ray diffraction, X-ray absorption near-edge structure analysis, and electron probe microanalysis. These results provide an understanding of the solidification process and the behavior of the elements of concern. Lithium-manganate(III) (LiMnO2) crystallized first, next to hausmannite (Mn2+Mn3+2O4) in a matrix consisting of wollastonite (CaSiO3) and larnite (Ca2SiO4). Within the structure of LiMnO2, Li and Mn can replace each other in certain proportions. By adding Al and Mg spinel, solid solutions between Mn2+Mn3+2O4, MnAl2O4, MgAl2O4 and LiMnO2 are expected and described by the stoichiometry formula: (Li(2x),Mg(1x),Mn(2+(1–x)))1+x(Al(2–z),Mn3+(z))2O4.
1. Introduction
At present, modern applications in electrics and electronics are predominantly based on the use of Li-ion batteries (LIBs). These batteries are mainly utilized in electric vehicles and storage systems, but also in laptops or mobile phones, and have therefore different lifetimes [1,2]. Conversely, this means that more and more natural resources are needed, including technologically relevant elements such as Li. The global reserves of Li are not evenly distributed and are not readily available in every country [3]. According to the United States Geological Survey [4], Li production increased by 21% from 2021 to 2022 (global reserves: 26,000,000 t). Mining of this element is limited to certain countries. Australia controls nearly 50% of mine production, followed by China and Chile [3,4,5]. The recycling of end-of-life LIBs is important in order to reduce dependence on these countries, close material cycles (keyword: circular economy) and avoid future raw material shortages. Common recycling methods for LIBs include the hydrometallurgy and pyrometallurgy (or a combination of both) routes [5,6,7,8]. During the pyrometallurgical recycling process, Li, as well as other elements such as Al or Mn, pass into the slag as an ignoble element or are lost as dust [1,9,10]. In order to recover the Li efficiently, cost-effectively and economically from the slag (e.g., by flotation), the element should be enriched in a single phase (Figure 1). That is the idea behind the Engineered Artificial Minerals (EnAM) approach. The procedure to effectively implement the EnAM strategy is based on characterizing the slag, identifying potential EnAMs and then modifying the slag system to optimize the amount, crystal size and habitus of this target phase. In unmodified industrial slags, Li is usually present in several different phases as well as partly in the matrix [10,11].
Elwert et al. [12] suggest that Li-aluminate (LiAlO2) is a promising EnAM for Li recovery because this compound occurs quite early during solidification and forms large idiomorphic to hypidiomorphic crystals [11,12]. These idiomorphic to hypidiomorphic crystals can be isolated from the rest of the slag via flotation [13]. During solidification and crystal formation, chemical processes occur that affect the formation of LiAlO2. For instance, besides LiAlO2, spinels are also formed as early crystals (XY2O4 with a cubic crystal structure), scavenging the Al out of the melt. This reaction occurs mainly when elements such as Mn or Mg are present in the slag system [14,15].
In LIBs, Li is used in the anode as LixCy (x = 1 and y = 6, typically) and in the cathode, e.g., as lithium metal oxides (LiMO2), commonly LiCoO2 (LCO) [7,16,17]. Due to the lower cost and the higher theoretical specific capacity, LiNixMnyCozO2 (x + y + z = 1; NMC) layered oxides will prevail over LCO [1,6,18]. In future slag systems, Mn will be present due to the use of NMC, presumably as a more cost-effective and health-friendly transition metal oxide in novel cathode materials. The spinel LiMn2O4 (LMO), LiMnO2 or Li and Mn-rich layered oxides have been intensively studied for Co replacements [16,19,20,21,22]. Despite the Jahn-Teller deformation of the Mn3+, which can destabilize the lattice framework, ongoing studies indicate that pure LiMnO2 electrodes will be available in the future [23]. When using pyrometallurgical processing to regain noble elements such as Co, Ni and Cu, the Li and Mn from LiNixMnyCozO2 will be present in future slags along with Al (cell and module cases) [24,25]. Thus, spinels (MgMn2O4, MgAl2O4, MnAl2O4 and Mn2+Mn3+2O4) will form as early crystallizates [26,27]. Spinel formation will decrease the amount of the EnAM LiAlO2 [10,11]. In addition to the competition from spinel, this phase (LiAlO2) also has a (limited) solid solution with SiO2, resulting in a Si concentration of 2–3 wt.% Si [13]. This would pose a challenge for subsequent hydrometallurgical processing (e.g., the need for hydrofluoric acid) for the recovery of Li.
For this reason, it was investigated whether a Li-manganate could serve as a suitable EnAM. In this way, Li and Mn could be recovered simultaneously. In an optimal outcome, the recovered Li-manganate (e.g., as LiMnO2) could be directly used again as cathode material.
Therefore, it is investigated whether Li-manganates can be stabilized in the slag system. Parameters potentially influencing the type of Mn compounds formed during solidification, such as the Mn concentration and oxidation state, need to be considered [28].
For this purpose, three different lab-scale melting experiments were performed under normal atmospheric conditions to obtain synthetic slags. The system of all experiments included Li and Mn, as well as Ca and Si, as slag-forming compounds. In one experiment, 2 wt.% Mg and in another, 2 wt.% Mg and 2 wt.% Al were added. The bulk qualitative mineralogical composition was determined by powder X-ray diffraction (PXRD). Electron probe microanalysis (EPMA) was used to analyze the element concentration of single grains. Lithium could not be determined with the EPMA system; therefore, virtual compounds were used to calculate the concentrations [29]. The use of virtual components containing a readily measurable element such as Mn enable better results than the direct measurement of, e.g., oxygen with limited precision. Therefore, for example, the stoichiometric calculation of oxygen is common practice in microprobe analysis. To determine the correct Li-manganates in the system, it is necessary to accurately determine the Mn concentration on the one hand and the oxidation state on the other. The Mn speciation was determined with laboratory-based X-ray absorption near edge structure (XANES).
2. Background
Here, the most important information about binary and ternary systems of the components Li2O, MgO, Al2O3, SiO2, CaO and MnO are summarized, with a special focus on the Mn-oxides and Li-manganates. They will enable a better understanding of the discussed reactions and processes.
2.1. Important Binary Phase Systems for Li-Manganates and Mn-Oxides
Due to the large number of Li-Mn-O compounds (Table 1), the special focus of this work is mainly on the compounds discovered/important in the samples. The relevant systems are discussed based on selected key publications.
For this study, the system (Li2O-MnOx, 1 ≤ x ≤ 2) is one of the most important binary systems. Several Li-manganates are known in the literature, with different concentrations and Mn oxidation states (Table 1). Some phases are described in more detail by Longo et al. [32] and Paulsen and Dahn [33]. Paulsen and Dahn [33] focus on the Li-spinel (Li(1+x)Mn(2–x)O4), which has a high stability field between 400 and 880 °C. The structure ranges from LiMn2O4 (Mn3.5+) to Li4Mn5O12 and can coexist with Li2MnO3 and/or Mn2O3. At temperatures above 880 °C, both Li2MnO3 and LiMn2O4 decompose into layered LiMnO2, Mn3O4 and O2. Below 400 °C, the only stable spinel compounds are LiMn1.75O4 as well as Li4Mn5O12. The spinels LiMn2O4 and Li2Mn3O7 are thermodynamically stable under acidic conditions. (Refs. [32,33,34]. In a temperature range between 1000 and 1060 °C, lithiated hausmannite (LixMn3–yO4, 0 ≤ x ≤ 1.33) coexists with LiMnO2 (rock salt type, orthorhombic). [33,34]. In the literature, no information is found on whether Mn2+ or Mn3+ is replaced by Li in lithiated hausmannite. In terms of ionic radii, Mn2+ would have to be replaced by Li [35]. In addition to temperature and pressure, the pH value also has an influence on the stability range of the Li-manganates. In addition, Mishra and Ceder [36] describe which compounds in the Li2O-MnOx system are affected by the Jahn-Teller distortion. According to the authors, layered structures (LiMnO2) and cubic spinels (LiMn2O4) are not affected. However, monoclinic layered and orthorhombic structures (e.g., LiMnO2) as well as tetragonal spinels (LiMn2O4) are affected [36].
An Important Li-free spinel in this system is hausmannite Mn2+Mn3+2O4 (MnO-Mn2O3). Under normal conditions (T = 25 °C; 1 atm), hausmannite can be considered a deformed spinel with a tetragonal crystal lattice. This deformation is due to the Jahn-Teller effect below 1172 °C from a deformation of the coordination octahedron around the Mn3+ position (M 2) [15,37,38].
The systems MnO-Al2O3 and Li2O-Al2O3 play a rather subordinate role for consideration in this work since these occur only as virtual components in the calculation of the Li-manganates.
One of the most relevant minerals in the MnO-Al2O3 system is galaxite (MnAl2O4). This mineral is part of a solid solution series in the cubic spinel (XY2O4) series. The Y position (octahedral site) is occupied mainly by Al and, above 1172 °C, also by Mn3+. Whereas the X position (tetrahedral site) is mainly occupied by Mn or Mg. In the cubic form of Mn3O4, gapless solid solutions with MnAl2O4 as well as MgAl2O4 are possible. For the tetragonal form, only limited mixtures are possible [15,39].
Important stable phases in the Li2O-Al2O3 system described by Konar [39] are: Li5AlO4, LiAlO2, LiAl5O8 (spinel), and LiAl11O17. For LiAlO2, the most known polymorphs are the α-phase (low temperature, cubic) and the γ-phase (high temperature, tetragonal).
2.2. Important Ternary Phase Systems Containing Li and Mn
A system consisting of Li2O, Al2O3 and MnOx has not yet been described in the literature.
In the Li2O-MgO-Al2O3 system, spinel solid solutions between MgAl2O4 and LiAl5O8 are described. The resulting mixture can be expressed by the following formula: (Li+, Mg2+, Al3+)[tetrahedral site](Li+, Mg2+, Al3+, Va)2[octahedral site]O4 [31]. There also is a solid solution between MgAl2O4 and γ-Al2O3 [11,12].
In the MgO-MnO-Al2O3 system, observed by Park et al. [40], spinel solid solutions between MgAl2O4 and MnAl2O4 are described.
Stable occurring compounds in the Li2O-Al2O3-SiO2 (LAS) system include eucryptite (LiAlSiO4), spodumene (LiAlSi2O6) or petalite (LiAlSi4O10). Further (meta)stable phases in the system are described by Konar et al. [41]. Because of the limited solid solution with Si, LiAlO2(Si) can be seen as part of this system [41].
Konar et al. [42] describe stable phases in the Li2O-MgO-SiO2 system. In the orthosilicate section (Li4SiO4-Mg2SiO4), Li2MgSiO4 can be included considering the miscibility gap between Li4SiO4-Li2MgSiO4. In the Li4SiO4 system, Li is replaced by Mg at the large-sized M-site (4e site).
In the CaO-SiO2-MnO system, solid solutions between Ca2SiO4, Mn2SiO4 and Mg2SiO4 are possible, as well as between CaSiO3, MnSiO3 and MgSiO3. The minerals larnite (Ca2SiO4) and wollastonite (CaSiO3) are important matrix-forming phases occurring within various slag systems. Larnite belongs to the olivine-group and wollastonite belongs to the pyroxene-like group. Under reducing conditions, both phases can incorporate Mn2+ and/or Mg2+ in the Ca position [43,44]. The ionic radius of Ca is slightly larger than that of Mn or Mg; hence, Ca occupies the larger M2-site [35,45].
3. Materials and Methods
3.1. Materials
The precursors for the melting experiments were prepared in the laboratory using the gel-combustion method. The chemicals used for the experiments were: Lithium nitrate (99.5%, Roth, Karlsruhe, Germany), magnesium nitrate hexahydrate (98%, Carl Roth, Karlsruhe, Germany), aluminum nitrate nonahydrate (98%, Carl Roth, Karlsruhe, Germany), Köstrosol® 0830 AS (Chemiewerk Bad Köstritz GmbH, Bad Köstritz, Germany), calcium nitrate tetrahydrate (99%, Carl Roth, Karlsruhe, Germany), manganese(II) nitrate tetrahydrate (98%, Carl Roth, Karlsruhe, Germany), and citric acid (99.5%, VWR chemicals, Darmstadt, Germany). The mass fractions for the required products used for the three experiments can be taken from Table 2.
For the preparation of Li-manganate(IV) (Li2MnO3) lithium hydroxide (98%+, Merck AG, Darmstadt, Germany) and citric acid monohydrate (99.5%, for analysis, Merck AG, Darmstadt, Germany) were used and for the preparation of galaxite (MnAl2O4) aluminum nitrate nonahydrate (Carl Roth) and manganese(II) nitrate tetrahydrate (Carl Roth).
The used references for XANES include: Mn2+O (alfa aesar, Thermo fisher GmbH, Kandel, Germany, 99%), Mn2.67+O4 (Sigma-Aldrich, St. Louis, MI, USA, 97%), LiMn3+O2 (Sigma-Aldrich, St. Louis, MI, USA, 99%), Mn3+2O3 (Sigma-Aldrich, St. Louis, MI, USA, 99%) and Mn4+O2 (Merck AG, Darmstadt, Germany, for synthesis, 86.94%). Microcrystalline cellulose Avicel® (Merck AG, Darmstadt, Germany) was used for the pellet preparation.
3.2. Methods
3.2.1. Experimental
The gel-combustion method was used to prepare a homogeneous precursor for the melt experiments. Common procedures [46,47] were adapted accordingly for the synthesis. The nitrates were dissolved in deionized water, and then the citric acid was added. Next, the solution was placed on a heating plate and slowly reduced from 200 to 250 °C. After the solution had a yellowish color, the SiO2 nanoparticles were added to the solution and the heating plate was set to 400 °C for self-combustion. The resulting pre-precursor was oxidized with ammonium nitrate in quartz crucibles at a heating rate of 10 °K/min to 480 °C in a muffle furnace (Nabertherm LE 1/11/R7, Nabertherm GmbH, Lilienthal, Germany) to remove the remaining carbon.
For the preparation of the reference material, Li2MnO3, the gel-combustion method was also used. However, the pre-precursor was thermally treated (1000 °C; 3 h) in air in a muffle furnace. The used galaxite (MnAl2O4) was prepared according to Wittkowski et al. [9] via solution combustion synthesis.
3.2.2. Melt Experiment
3.2.3. Determination of Melting Points
For an adjusted melting program, the melting point of the thermally treated precursors was determined via a heating microscope (EM301, Hesse Instrument e. K., Osterode am Harz, Germany). For this purpose, cubes (3 mm × 3 mm) were produced and optically analyzed under temperature influence (25–1000 °C, heating rate 80 °C/min; 1000–1500 °C, heating rate 20 °C/min). The melting point of the sample was assumed to be the flow point, according to DIN 51730 [48]. This refers to the temperature at which the sample has flowed apart to a third of the height it had at a hemispherical temperature.
3.2.4. Bulk Chemistry
The elemental content of the slag samples and the precursors were determined using inductively coupled plasma optical emission spectrometry (ICP-OES 5100, Agilent, Agilent Technologies Germany GmbH and Co. KG, Waldbronn, Germany), e.g., to determine a possible elemental loss (especially Li) during the melting experiment. The specimens were prepared by first preparing a fusion bead with sodium tetraborate in a platinum crucible at a maximum temperature of 1050 °C and then leaching with diluted hydrochloric acid. The results (double determination) were evaluated with a matrix-matched external calibration.
3.2.5. Speciation Analysis and Mineralogical Investigation
The Mn speciation was performed with laboratory-based X-ray absorption near-edge structure analysis (XANES, easyXES100; easyXAFS LLC, Renton, WA, USA). The laboratory instrument features an X-ray tube (W/Pd anode, 100 W, 25 kV, 3 mA), a SDD detector (AXAS-M1, KETEK, Munich, Germany), and a spherically curved crystal analyzer (SBCA, Si 110). For the measurement, pellets (diameter 16 mm) were prepared of 10 mg sample material and 80 mg microcrystalline cellulose (mixed and pressed for 2 min at 10 t). A detailed description of the laboratory-based instrument is given by Wittkowski et al. [11] and Seidler et al. [49]. The energy calibration of the device was performed using a Mn foil (Exafs Materials, Danville, CA, USA). The data were evaluated using a Python script similar to Athena [50]. The Mn edge of precursors, synthetic slag samples and references was scanned from 6482 eV to 6739 eV (step size of 0.25 eV, measuring time of 2 s per step) and from 6739 eV to 6899 eV (step size of 1 eV, measuring time of 1 s per step).
A mineralogical overview of the slag samples was obtained by PXRD (Panalytical X-Pert Pro Diffractometer) using a Co-X-Ray tube (Malvern Panalytical GmbH, Kassel, Germany, λ = 1.7902 Å, 40 kV, 40 mA). A step size of 0.0066° and a time per step of 150.45 s were used (2θ angular range was 5° to 100°). For the assignment of the individual phases, the pdf-2 ICCD XRD database [51] and the American Mineralogist Crystal Structure Database [52] were applied. The evaluated data were compared with the database of materials projects [53].
For element determination within the different phases/single crystals and grains, EPMA (Cameca SXFIVE FE Field Emission, CAMECA SAS, Gennevilliers Cedex, France) was used. For the quantification of the individual measurement points, the following lines were selected: Na (Kα), Mg (Kα), Al (Kα), Si (Kα), Ca (Kα) and Mn (Kα). Appropriate certified reference materials (CRM: PandH Developments Ltd.; Glossop, Derbyshire, UK and Astimex Standards Ltd.; Toronto, ON, Canada) were used for calibration. For the measurement, the prepared thin sections are coated with a fine carbon layer to ensure the conductivity of the sample. Measurements were performed at 15 kV and a beam size set to 0, with a mean diameter of less than 1 µm (100–600 nm; Schottky-type [54]). The measured intensities of X-rays emitted by the samples were evaluated using the X-PHI model [55].
Light elements such as Li are almost not analyzable by X-ray methods due to the long wavelength of Li Kα as well as the low fluorescence yield. Assuming that there are no other non-detectable light elements in the slag, the content of Li in the respective phases can be determined using virtual components [29]. For an accurate determination of the Li content, it is necessary that the other element concentrations in the grain be measured with the highest possible precision. Repeated measurements of the international standard rhodonite (MnSiO3; Astimex) were performed with each measurement campaign (Table 3).
4. Results
A potential element loss during the melt experiment was identified via ICP-OES. An overview of the mineralogical phases in the synthetic slag samples was provided by PXRD. The exact phase composition as well as microstructures were analyzed with EPMA. For an accurate phase assignment, the determination of the Mn oxidation state via XANES measurements was indispensable. Thus, during the following phase assignment via EPMA, Li-manganates with the same Mn content but higher/lower oxidation states were excluded (Table 4).
4.1. Determination of Melting Points
The beginning of vitrification is the temperature at which agglutination occurs at the interface of the particles. With the beginning of deformation, the first signs of softening, such as a change in the surface, occur on the cube. The half-cone point is the point at which the sample is only half as high as its baseline. At the melting point, the temperature is reached at which the sample flows apart. S1 has the highest melting point at 1205 ± 5 °C, S2 has the lowest at 1102 ± 5 °C and the melting point of S3 is 1144.7 ± 5 °C. (Figure 3).
4.2. Bulk Chemistry
4.3. Speciation Analysis and Mineralogical Investigation
4.3.1. XANES
The reference materials show a shift of the edge to higher energies with an increase in the oxidation state of Mn. The Li-manganates show a characteristic main-edge shoulder. The edge shift and the shape of the curves of the precursors S1 and S3 indicate an oxidation state of Mn2+ with a small trend towards Mn2.67+. Precursor S2 shows greater tendencies towards an oxidation state of Mn2.67+ (Figure 4).
The K-edges of slag samples S2 and S1 are shifted further to higher energies. Accordingly, the highest average Mn oxidation state should be present in S1. In the spectrum of S1, the characteristic main-edge shoulder of Li-manganate(III) (LiMnO2) can be detected. Compared to the references, the spectrum of S1 is similar to that of LiMnO2, with tendencies towards Mn3O4. The shifting and shape of the curves S2 and S3 are similar to Mn3O4. In relation to the slag samples, the spectrum S3 shows the lowest oxidation state (Figure 5).
4.3.2. PXRD
The results shown in Figure 6 provide an overview of the diffractograms of the three slag samples. All three samples show diffraction peaks that correspond to the phases wollastonite (CaSiO3), larnite (Ca2SiO4) and Li-manganate(III) (LiMnO2).
The Li-manganate reflexes are best described by the diffraction pattern of LiMnO2 (ICDD PDF2 00-035-0749) (Figure 6B). Due to line overlays with wollastonite, the presence of hausmannite (ICDD PDF2 00-024-0734) was not clearly verifiable. In the slag-forming phases (wollastonite, larnite), Ca can be replaced by Mn due to comparable ion radii [35]. Therefore, a solid solution between Ca-silicates and Mn-silicates can be expected (Figure 6C).
4.3.3. EPMA
The analysis of single mineral grains/crystals was carried out with EPMA. By means of point measurements, linescans and element distribution patterns, the element contents of individual compounds or grains were analyzed. In addition to the spatial chemical analysis, BSE(Z), micrographs were used to characterize the morphology of the slag samples and to obtain information about the processes during solidification.
The local compositions of the grains visible in the BSE contrast determined by EPMA indicate the following phases:
- Wollastonite: CaSiO3
- Larnite: Ca2SiO4
- Lithium-manganate: Li(1–x)Mn(1+0.33x)O2/Li(1+x)Mn(1–0.33x)O2
- Hausmannite: Mn2+Mn3+2O4
- Amorphous residual melt
Figure 7 shows an overview of the phases present in the slags. The regions of different brightness in the BSE images indicate grains/crystals of different phases with different chemical compositions. The Li-manganates (LiMnO2) are intergrown with hausmannite (Mn2+Mn3+2O4) in a matrix consisting of Ca and Si, as well as the amorphous residual melt.
Lithium-Manganate (LiMnO2)
The samples contain an oxide with about 58.5 wt.% Mn and no other measurable elements. After evaluation of all possible (Li)-Mn-oxides under consideration of the speciation analysis with XANES, it should be LiMnO2. This LiMnO2 forms 10 to 100 µm large idiomorphic to hypidiomorphic crystals in a Ca-silicate matrix and crystallizes first together with hausmannite. The LiMnO2 crystals have an average size of 25 µm and are often intergrown with hausmannite (Figure 7). Point measurements inside this phase show the incorporation of traces of Al (S3) (maximum 0.35 wt.%). The elements Ca, Si and Mg were not incorporated. The results of linescans within the crystals indicate that the Mn concentration does not decrease towards the crystal rims (Figure 8A). The path of the linescan is shown in Figure 8B.
The average value of Mn content in the investigated LiMnO2 grains over all three synthetic slag samples is in S1 58.82 wt.% ± 0.18, in S2 58.67 wt.% ± 0.20 and in S3 58.53 wt.% ± 0.35. In LiMnO2, the theoretical Mn content is 58.52 wt.% (Figure 9).
Based on the measurement results, for all samples, an average (N = 20) structure formula of LiMnO2 was obtained [29,56]. With respect to this average, there is a tendency toward a relative Mn enrichment compared with the stoichiometric formula LiMnO2. In Table 6, the minimum and maximum deviations from ideal LiMnO2 are listed.
Hausmannite (Mn2+Mn3+2O4) and Spinel (XY2O4)
Hausmannite was only detected in samples S1 and S3. The idiomorphic to hypidiomorphic hausmannite grains of S1 and S3 have approximately the same size as the Li-manganates. As shown in Figure 7A,C, A II, hausmannite can occur as individual grains in the matrix or as an intergrowth with LiMnO2. Within the crystals, an almost homogeneous Mn distribution could be observed. The incorporation of Al (average 1.17 wt.%) and Mg (average 0.69 wt.%) in slag sample S3 as well as Li (calculated using virtual compounds) in small amounts indicates possible spinel solid solutions between Li2Mn2O4, MgAl2O4, Mn3O4 and MnAl2O4. With the measured Mg, Al and Mn concentrations, the following mineral formula (Li(2x),Mg(1x),Mn(2+(1–x)))1+x(Al(2–z),Mn3+(z))2O4 can be calculated by stoichiometry (Table 7).
Matrix (CaSiO3; Ca2SiO4)
The main matrix-forming mineral is wollastonite (CaSiO3), followed by larnite (Ca2SiO4). Both phases form xenomorphic crystals. Within these phases, Mn and Mg are incorporated into the crystal lattice in different concentrations.
Compared to wollastonite, more Mn and Mg are incorporated in larnite. The lowest incorporation is seen in slag sample S3. Wollastonite belongs to the pyroxene-like group; therefore, solid solutions between MnSiO3 and CaSiO3 are possible (Figure 10A). Solid solutions between Mn2SiO4, Mg2SiO4 and Ca2SiO4 can occur as well because larnite belongs to the olivine group (Figure 10B).
Amorphous Phase
In every slag sample, there was a residual melt, which was located in interstices and fissures. The elements in this phase were not homogeneously distributed. The concentration of elements (e.g., Mg, Mn) in different grains in the respective slag samples also varies (Figure 11A,B). Thus, it was not possible to calculate a stoichiometric mineral formula for this phase. Furthermore, it was not possible to make statements about the possible Li content within this structure as well as the ratio between Mn2+/3+. The BSE(Z) image shows where the line scan measurements were taken in the S3 thin section (Figure 11C).
5. Discussion
The aim of this study was to produce a Li and Mn-rich slag and to investigate if it is possible to stabilize a Li-manganate in the melt and if this phase is suitable as a potential new EnAM. In addition, the influence of Mg and Al on the formation of spinel-like Mn oxides was also investigated. The experiments provide an overview of the chemical reactions/phase transformations that take place during the solidification of a slag system based on Ca-silicates. To investigate the influence of Al and Mg impurities, 2 wt.% of Mg was added to S2, and 2 wt.% of Mg and Al was added to S3. However, the results presented should serve as a first impression of which phases crystallize in a complex (Li, (Mg), (Al), Si, Ca, Mn) oxidic slag. The formation, stabilization and purity of possible Li-Mn-O EnAMs in slags, as well as the probable influence of Mg and Al on slag-forming phases, will be discussed in the following section.
5.1. Potential Li-Mn-O EnAM
The crystallized LiMnO2 forms idiomorphic to hypidiomorphic crystals. The crystal shape indicates that LiMnO2 (S1–S3), along with hausmannite (S1, S3), is the first to crystallize in the slag samples. Hausmannite and LiMnO2 are often found intergrown together in one idiomorphic crystal, indicating a decomposition process of an early crystallizate (“pseudomorphosis”). A decomposition of this kind is described by Longo et al. [32] and Paulsen and Dahn [33].
Possible reactions are:
3 LiMn2O4 → 3 LiMnO2 + Mn3O4 + O2
2 LiMn2O4 → LiMnO2 + LiMn3O4 + O2
16 Li2MnO3 → 4 LiMnO2 + 4 Mn3O4 + 16 Li2O + 5 O2
6 Li2MnO3 → 3 LiMnO2 + LiMn3O4 + 4 Li2O + 2 O2
According to this, the Mn in the precursor, which has an average oxidation state of Mn2.67+ (XANES, Figure 4), must be oxidized to Mn3.5+ (Equations (1) and (2)) or Mn4+ (Equations (3) and (4)), respectively, during the high temperature part of the melting experiment. From the observations, these phases decompose during solidification (cooling) with the release of oxygen due to the normal atmospheric conditions (see also Longo et al. [32]). Due to the more or less cubic crystal form of the LiMnO2 and Mn3O4 intergrowths (Figure 7A II), it is reasonable to suggest that a spinel (Equations (1) and (2)) has decomposed. There is an indication that Li and Mn can be replaced to a limited extent by each other within the LiMnO2, leading to a formula like Li1–xMn1+0.33xO2 or Li1+xMn1–0.33xO2 (Figure 9).
5.2. Influence of Mg and Al
According to this study, the addition of Mg has a positive influence on the suppression of hausmannite, as this phase was not found in S2. The addition of Al to S3 causes the formation of hausmannite and, thus, the occurrence of spinel solid solutions. Due to the presence of Mg, Al and Mn at oxidation states Mn2+ and Mn3+, solid solutions between the spinels Mn3O4, MgAl2O4 and MnAl2O4 can be observed. These solid solutions are caused by the Jahn-Teller effect, which has an influence on the Mn3+ above 1172 °C [15]. At temperatures above 1172 °C, the tetragonal crystal system changes to cubic (spinel). The octahedral site in the spinel is occupied by Mn3+ and Al3+ and the tetrahedral site by Mn2+ and Mg2+. Generally, the solid solution includes Li2Mn2O4 and could therefore be described by the following formula: (Li(2x),Mg(1x),Mn(2+(1–x)))1+x(Al(2–z),Mn3+(z))2O4. The Li content was calculated using the virtual compound LiMnO2. Point measurements and linescans in these small crystals show constant, homogeneous element concentrations. Therefore, a complete solid solution above 1172 °C is assumed. There were no dissolution lamellae, as observed by Wittkowski et al. [11].
The added Al has no influence on the matrix-forming phases (CaSiO3 and Ca2SiO4). In addition to the divalent Mn, Mg can also be incorporated into the crystal lattice of larnite and wollastonite and be located in the lattice position of Ca. Larnite belongs to the olivine group and additionally incorporates Mg and Mn2+, which means that there exists a solid solution between the end members Mg2SiO4, Ca2SiO4 and Mn2SiO4. In contrast, wollastonite belongs to the pyroxene-like mineral group. Within this group, solid solutions between MgSiO3, CaSiO3 and MnSiO3 are possible, but only those between CaSiO3 and MnSiO3 were identified. The cation position in the larnite is not completely occupied. This could be caused by rapid cooling. The crystal form and elemental composition of two phases, CaSiO3 and Ca2SiO4, suggest crystallization towards the end of solidification.
6. Conclusions and Outlook
The experiments and investigations have shown that it is possible to generate Li-manganate in a complex system (Li2O-MgO-Al2O3-SiO2-CaO-MnO). It was proven that LiMnO2 forms as an early crystallizate next to hausmannite (except S2). The manganese speciations are between 2 and 3, which is why part of the Mn2+ was incorporated into the matrix. Small amounts of Mg (2 wt.%) have no influence on phase formation. On the other hand, already 2 wt.% Al is sufficient to form spinel solid solutions between Mn2+Mn3+2O4, MnAl2O4 and MgAl2O4.
The observed Li-manganates only contain traces of other elements (S3: Al ≤ 0.35 wt.%), as is the case with LiAlO2, which forms a limited solid solution with SiO2 (2–3 wt.%). In the optimal case, this LiMnO2 could be directly reused (possibly after recrystallization or pyrolysis). In order to prevent spinel solid solutions and thus to avoid competitive reactions with Li-manganates as potential new EnAM, the aim for further experiments would be either to remove Al from the system or to stabilize higher Mn speciations in the slag, because it is to be expected that, especially in the case of Mn4+, no reaction with Al occurs.
Continuing studies are investigating whether higher Mn speciations (Mn4+) in the slag can be stabilized by pure oxygen so that further potential Li-manganate EnAMs (e.g., Li2MnO3, LiMn2O4) are formed and spinel formation with Al is suppressed. In this case, it is necessary to investigate whether a Li-manganate is formed as an early crystallizate or a Li-aluminate such as LiAlO2. Furthermore, the influence of Mg and Al (in different concentrations) must be investigated again.
In addition stability fields of phases are to be investigated in the future by means of thermal analysis (e.g., TG-DTA) in order to further optimize the cooling curves. Despite Li not being detectable inside the phases with EPMA, the results of PXRD and XANES show the formation of Li-manganates. For further experiments, spatially resolved mapping of Li with secondary ion mass spectrometry or laser ablation inductively coupled plasma mass spectrometry on the synthetic will be performed.
Author Contributions
Conceptualization, A.S.; validation, A.S.; formal analysis, A.S. and S.H.; investigation, A.S.; writing—original draft preparation, A.S.; writing—review and editing, A.S., S.H., T.S. and U.E.A.F.; visualization, A.S.; supervision, T.S.; project administration, T.S.; funding acquisition, T.S. All authors have read and agreed to the published version of the manuscript.
Funding
This research was funded by the German Research Foundation as part of the priority program: Engineered Artificial Minerals (EnAM)—a geometallurgical tool for the recovery of critical elements from waste streams (SPP 2315, ProjNo. 470309740). Sven Hampel was also funded by the German Research Foundation (SPP 2315, ProjNo. 470367641).
Data Availability Statement
The data presented in this study are available on request from the corresponding author.
Acknowledgments
We acknowledge the support by Open Access Publishing Fund of Clausthal University of Technology.
Conflicts of Interest
The authors declare no conflict of interest. The funders had no role in the design of the study, in the collection, analyses, or interpretation of data, in the writing of the manuscript, or in the decision to publish the results.
References
- Brückner, L.; Frank, J.; Elwert, T. Industrial Recycling of Lithium-Ion Batteries—A Critical Review of Metallurgical Process Routes. Metals 2020, 10, 1107. [Google Scholar] [CrossRef]
- Ma, X.; Azhari, L.; Wang, Y. Li-Ion Battery Recycling Challenges. Chem 2021, 7, 2843–2847. [Google Scholar] [CrossRef]
- Bae, H.; Kim, Y. Technologies of Lithium Recycling from Waste Lithium Ion Batteries: A Review. Mater. Adv. 2021, 2, 3234–3250. [Google Scholar] [CrossRef]
- U.S. Geological Survey Data Release for Mineral Commodity Summaries 2023: U.S. Geological Survey Data Release; United States Geological Survey: Reston, VA, USA, 2023.
- Chen, M.; Ma, X.; Chen, B.; Arsenault, R.; Karlson, P.; Simon, N.; Wang, Y. Recycling End-of-Life Electric Vehicle Lithium-Ion Batteries. Joule 2019, 3, 2622–2646. [Google Scholar] [CrossRef]
- Baum, Z.J.; Bird, R.E.; Yu, X.; Ma, J. Lithium-Ion Battery Recycling─Overview of Techniques and Trends. ACS Energy Lett. 2022, 7, 712–719. [Google Scholar] [CrossRef]
- Duan, X.; Zhu, W.; Ruan, Z.; Xie, M.; Chen, J.; Ren, X. Recycling of Lithium Batteries—A Review. Energies 2022, 15, 1611. [Google Scholar] [CrossRef]
- Mishra, G.; Jha, R.; Meshram, A.; Singh, K.K. A Review on Recycling of Lithium-Ion Batteries to Recover Critical Metals. J. Environ. Chem. Eng. 2022, 10, 108534. [Google Scholar] [CrossRef]
- Sommerfeld, M.; Vonderstein, C.; Dertmann, C.; Klimko, J.; Oráč, D.; Miškufová, A.; Havlík, T.; Friedrich, B. A Combined Pyro- and Hydrometallurgical Approach to Recycle Pyrolyzed Lithium-Ion Battery Black Mass Part 1: Production of Lithium Concentrates in an Electric Arc Furnace. Metals 2020, 10, 1069. [Google Scholar] [CrossRef]
- Elwert, T.; Strauß, K.; Schirmer, T.; Goldmann, D. Phase Composition of High Lithium Slags from the Recycling of Lithium Ion Batteries. World Metall.-Erzmetall 2012, 65, 163–171. [Google Scholar]
- Wittkowski, A.; Schirmer, T.; Qiu, H.; Goldmann, D.; Fittschen, U.E.A. Speciation of Manganese in a Synthetic Recycling Slag Relevant for Lithium Recycling from Lithium-Ion Batteries. Metals 2021, 11, 188. [Google Scholar] [CrossRef]
- Elwert, T.; Goldmann, D.; Schirmer, T.; Strauß, K. Recycling von Li-Ionen-Traktionsbatterien–Das Projekt LiBRi; Recycling und Rohstoffe: Neuruppin, Germany, 2012; pp. 679–690. [Google Scholar]
- Schirmer, T.; Qiu, H.; Li, H.; Goldmann, D.; Fischlschweiger, M. Li-Distribution in Compounds of the Li2O-MgO-Al2O3-SiO2-CaO System—A First Survey. Metals 2020, 10, 1633. [Google Scholar] [CrossRef]
- Pal, S.; Bandyopadhyay, A.K.; Mukherjee, S.; Samaddar, B.N.; Pal, P.G. MgAl2O4-γ-Al2O3 Solid Solution Interaction: Mathematical Framework and Phase Separation of α-Al2O3 at High Temperature. Bull. Mater. Sci. 2011, 34, 859–864. [Google Scholar] [CrossRef]
- Chatterjee, S.; Jung, I.-H. Critical Evaluation and Thermodynamic Modeling of the Al–Mn–O (Al2O3–MnO–Mn2O3) System. J. Eur. Ceram. Soc. 2014, 34, 1611–1621. [Google Scholar] [CrossRef]
- Akhmetov, N.; Manakhov, A.; Al-Qasim, A.S. Li-Ion Battery Cathode Recycling: An Emerging Response to Growing Metal Demand and Accumulating Battery Waste. Electronics 2023, 12, 1152. [Google Scholar] [CrossRef]
- Saroha, R.; Gupta, A.; Panwar, A.K. Electrochemical Performances of Li-Rich Layered-Layered Li2MnO3-LiMnO2 Solid Solutions as Cathode Material for Lithium-Ion Batteries. J. Alloys Compd. 2017, 696, 580–589. [Google Scholar] [CrossRef]
- Tosin Paese, L.; Zeller, P.; Chatain, S.; Guéneau, C. Thermodynamic Properties of LiNiO2, LiCoO2, and LiMnO2 Using Density-Functional Theory. Phys. Chem. Chem. Phys. 2023, 25, 20641–20656. [Google Scholar] [CrossRef]
- Mahara, Y.; Makimura, Y.; Oka, H.; Nakano, H.; Tajima, S.; Nonaka, T.; Sasaki, T. Appearance of the 4 V Signal without Transformation to Spinel-Related Oxides from Loose-Crystalline Rock-Salt LiMnO2. J. Power Sources 2021, 497, 229788. [Google Scholar] [CrossRef]
- Perumal, P.; Abhilash, K.P.; Selvin, P.C.; Sofer, Z. A Short Investigation on LiMn2O4 Wrapped with MWCNT as Composite Cathode for Lithium-Ion Batteries. Bull. Mater. Sci. 2021, 44, 243. [Google Scholar] [CrossRef]
- Xu, J.; Zhu, S.; Xu, Z.; Zhu, H. The Basic Physical Properties of Li2MnO3 and LiMn2O4 Cathode Materials. Comput. Mater. Sci. 2023, 229, 112426. [Google Scholar] [CrossRef]
- Vu, N.H.; Dao, V.-D.; Vu, H.H.T.; Van Noi, N.; Tran, D.T.; Ha, M.N.; Pham, T.-D. Hydrothermal Synthesis of Li2MnO3-Stabilized LiMnO2 as a Cathode Material for Li-Ion Battery. J. Nanomater. 2021, 2021, 9312358. [Google Scholar] [CrossRef]
- Zhu, X.; Meng, F.; Zhang, Q.; Xue, L.; Zhu, H.; Lan, S.; Liu, Q.; Zhao, J.; Zhuang, Y.; Guo, Q.; et al. LiMnO2 Cathode Stabilized by Interfacial Orbital Ordering for Sustainable Lithium-Ion Batteries. Nat. Sustain. 2020, 4, 392–401. [Google Scholar] [CrossRef]
- Ren, G.; Liao, C.; Liu, Z.; Xiao, S. Lithium and Manganese Extraction from Manganese-Rich Slag Originated from Pyrometallurgy of Spent Lithium-Ion Battery. Trans. Nonferrous Met. Soc. China 2022, 32, 2746–2756. [Google Scholar] [CrossRef]
- Ryohei, Y.A.G.I.; Scheinis, L.U.S. Recovery of Nickel and Cobalt from Black Mass. US 2023/0369667 A1, 16 November 2023. [Google Scholar]
- Svoboda, J.; Drdlíková, K.; Drdlík, D.; Kroupa, A.; Michalicka, J.; Maca, K. Doping of Alumina Ceramics by Manganese—Thermodynamical and Experimental Approach. PAC 2022, 16, 13–21. [Google Scholar] [CrossRef]
- Wu, H.; Liu, X.; Liu, X.; Zhang, J.; Yu, J. Effect of Alumina Content on the Crystal Structure, Lattice Thermal Expansion and Thermal Conductivity of Aluminium-Rich Spinel Solid Solutions. Mater. Chem. Phys. 2022, 288, 126366. [Google Scholar] [CrossRef]
- Wang, P.; Zhang, S.; Wang, Z.; Mo, Y.; Luo, X.; Yang, F.; Lv, M.; Li, Z.; Liu, X. Manganese-Based Oxide Electrocatalysts for the Oxygen Evolution Reaction: A Review. J. Mater. Chem. A 2023, 11, 5476–5494. [Google Scholar] [CrossRef]
- Schirmer, T. Stoichiometric Calculation of Lithium-Containing Phases Based on Spatially Resolved X-ray Analysis and Virtual Compounds. Adv. X-ray Anal. 2022, 65, 45–56. [Google Scholar]
- Freire, M.; Kosova, N.V.; Jordy, C.; Chateigner, D.; Lebedev, O.I.; Maignan, A.; Pralong, V. A New Active Li–Mn–O Compound for High Energy Density Li-Ion Batteries. Nat. Mater 2016, 15, 173–177. [Google Scholar] [CrossRef]
- Levi, E.; Zinigrad, E.; Teller, H.; Levi, M.D.; Aurbach, D.; Mengeritsky, E.; Elster, E.; Dan, P.; Granot, E.; Yamin, H. Structural and Electrochemical Studies of 3 V Li x MnO2 Cathodes for Rechargeable Li Batteries. J. Electrochem. Soc. 1997, 144, 4133–4141. [Google Scholar] [CrossRef]
- Longo, R.C.; Kong, F.T.; Kc, S.; Park, M.S.; Yoon, J.; Yeon, D.-H.; Park, J.-H.; Doo, S.-G.; Cho, K. Phase Stability of Li–Mn–O Oxides as Cathode Materials for Li-Ion Batteries: Insights from Ab Initio Calculations. Phys. Chem. Chem. Phys. 2014, 16, 11233–11242. [Google Scholar] [CrossRef]
- Paulsen, J.M.; Dahn, J.R. Phase Diagram of Li−Mn−O Spinel in Air. Chem. Mater. 1999, 11, 3065–3079. [Google Scholar] [CrossRef]
- Müller, H.A.; Joshi, Y.; Hadjixenophontos, E.; Peter, C.; Csiszár, G.; Richter, G.; Schmitz, G. High Capacity Rock Salt Type Li2MnO3−δ Thin Film Battery Electrodes. RSC Adv. 2020, 10, 3636–3645. [Google Scholar] [CrossRef]
- Shannon, R.D. Revised Effective Ionic Radii and Systematic Studies of Interatomic Distances in Halides and Chalcogenides. Acta Cryst. A 1976, 32, 751–767. [Google Scholar] [CrossRef]
- Mishra, S.K.; Ceder, G. Structural Stability of Lithium Manganese Oxides. Phys. Rev. B 1999, 59, 6120–6130. [Google Scholar] [CrossRef]
- Jarosch, D. Crystal Structure Refinement and Reflectance Measurements of Hausmannite, Mn3O4. Mineral. Petrol. 1987, 37, 15–23. [Google Scholar] [CrossRef]
- Kim, W.J.; Smeaton, M.A.; Jia, C.; Goodge, B.H.; Cho, B.-G.; Lee, K.; Osada, M.; Jost, D.; Ievlev, A.V.; Moritz, B.; et al. Geometric Frustration of Jahn–Teller Order in the Infinite-Layer Lattice. Nature 2023, 615, 237–243. [Google Scholar] [CrossRef]
- Konar, B.; Van Ende, M.-A.; Jung, I.-H. Critical Evaluation and Thermodynamic Optimization of the Li2O-Al2O3 and Li2O-MgO-Al2O3 Systems. Met. Mater. Trans. B 2018, 49, 2917–2944. [Google Scholar] [CrossRef]
- Park, J.S.; Kim, D.H.; Park, J.H. Thermodynamic Stability of Spinel Phase at the Interface Between Alumina Refractory and CaO-CaF2-SiO2-Al2O3-MgO-MnO Slags. J. Am. Ceram. Soc. 2015, 98, 1974–1981. [Google Scholar] [CrossRef]
- Konar, B.; Kim, D.-G.; Jung, I.-H. Critical Thermodynamic Optimization of the Li2O-Al2O3-SiO2 System and Its Application for the Thermodynamic Analysis of the Glass-Ceramics. J. Eur. Ceram. Soc. 2018, 38, 3881–3904. [Google Scholar] [CrossRef]
- Konar, B.; Kim, D.-G.; Jung, I.-H. Coupled Experimental Phase Diagram Study and Thermodynamic Optimization of the Li2O-MgO-SiO2 System. J. Am. Ceram. Soc. 2018, 101, 1711–1726. [Google Scholar] [CrossRef]
- Xie, X.; Gu, X. The Breakdown of Diopside to (Ca, Mg)SiO3 Perovskite–(Mg, Ca, Fe)SiO3 Glass–(Mg, Ca)SiO3 Glass–(Mg, Ca)SiO3 Majorite in a Melt Vein the Suizhou L6 Chondrite. Acta Geochim. 2023, 42, 183–194. [Google Scholar] [CrossRef]
- Abrecht, J.; Peters, T. Hydrothermal Synthesis of Pyroxenoids in the System MnSiO3–CaSiO3 at Pf = 2 Kb. Contrib. Mineral. Petrol. 1975, 50, 241–246. [Google Scholar] [CrossRef]
- Kang, Y.-B.; Jung, I.-H.; Decterov, S.A.; Pelton, A.D.; Lee, H.-G. Critical Thermodynamic Evaluation and Optimization of the CaO–MnO–SiO2 and CaO–MnO–Al2O3 Systems. ISIJ Int. 2004, 44, 965–974. [Google Scholar] [CrossRef]
- Blank, D.H.A.; Kruidhof, H.; Flokstra, J. Preparation of YBa2Cu3O7-δ by Citrate Synthesis and Pyrolysis. J. Phys. D Appl. Phys. 1988, 21, 226–227. [Google Scholar] [CrossRef]
- Ehi-Eromosele, C.O.; Ajayi, S.O.; Onwucha, C.N. Influence of Fuels in the Sol-Gel Combustion Synthesis of Li2MnO3 Positive Electrode Material for Li-Ion Battery. Mater. Chem. Phys. 2021, 259, 124055. [Google Scholar] [CrossRef]
- DIN 51730; Prüfung Fester Brennstoffe Bestimmung Des Asche-Schmelzverhaltens. DIN e.V.: Berlin, Germany, 2022.
- Seidler, G.T.; Mortensen, D.R.; Remesnik, A.J.; Pacold, J.I.; Ball, N.A.; Barry, N.; Styczinski, M.; Hoidn, O.R. A Laboratory-Based Hard X-ray Monochromator for High-Resolution X-ray Emission Spectroscopy and X-ray Absorption near Edge Structure Measurements. Rev. Sci. Instrum. 2014, 85, 113906. [Google Scholar] [CrossRef]
- Ravel, B.; Newville, M. ATHENA, ARTEMIS, HEPHAESTUS: Data Analysis for X-Ray Absorption Spectroscopy Using IFEFFIT. J. Synchrotron Radiat. 2005, 12, 537–541. [Google Scholar] [CrossRef]
- Gates-Rector, S.; Blanton, T. The Powder Diffraction File: A Quality Materials Characterization Database. Powder Diffr. 2019, 34, 352–360. [Google Scholar] [CrossRef]
- Downs, R.T.; Hall-Wallace, M. The American Mineralogist Crystal Structure Database. Am. Mineral. 2003, 88, 247–250. [Google Scholar]
- Huck, P.; Gunter, D.; Cholia, S.; Winston, D.; N’Diaye, A.T.; Persson, K. User Applications Driven by the Community Contribution Framework MPContribs in the Materials Project. Concurr. Comput. 2016, 28, 1982–1993. [Google Scholar] [CrossRef]
- Jercinovic, M.J.; Williams, M.L.; Allaz, J.; Donovan, J.J. Trace Analysis in EPMA. IOP Conf. Ser. Mater. Sci. Eng. 2012, 32, 012012. [Google Scholar] [CrossRef]
- Merlet, C. Quantitative Electron Probe Microanalysis: New Accurate CI>(Pz) Description. In Electron Microbeam Analysis; Springer: Berlin/Heidelberg, Germany, 1992; pp. 107–115. [Google Scholar]
- Schwab, B.E. Working with Electron Microprobe Data from a High Pressure Experiment—Calculating Mineral Formulas, Unit Cell Content, and Geothermometry. Available online: https://d32ogoqmya1dw8.cloudfront.net/files/NAGTWorkshops/petrology/teaching_examples/Schwab_updated_file.pdf (accessed on 29 September 2023).
Figure 1.
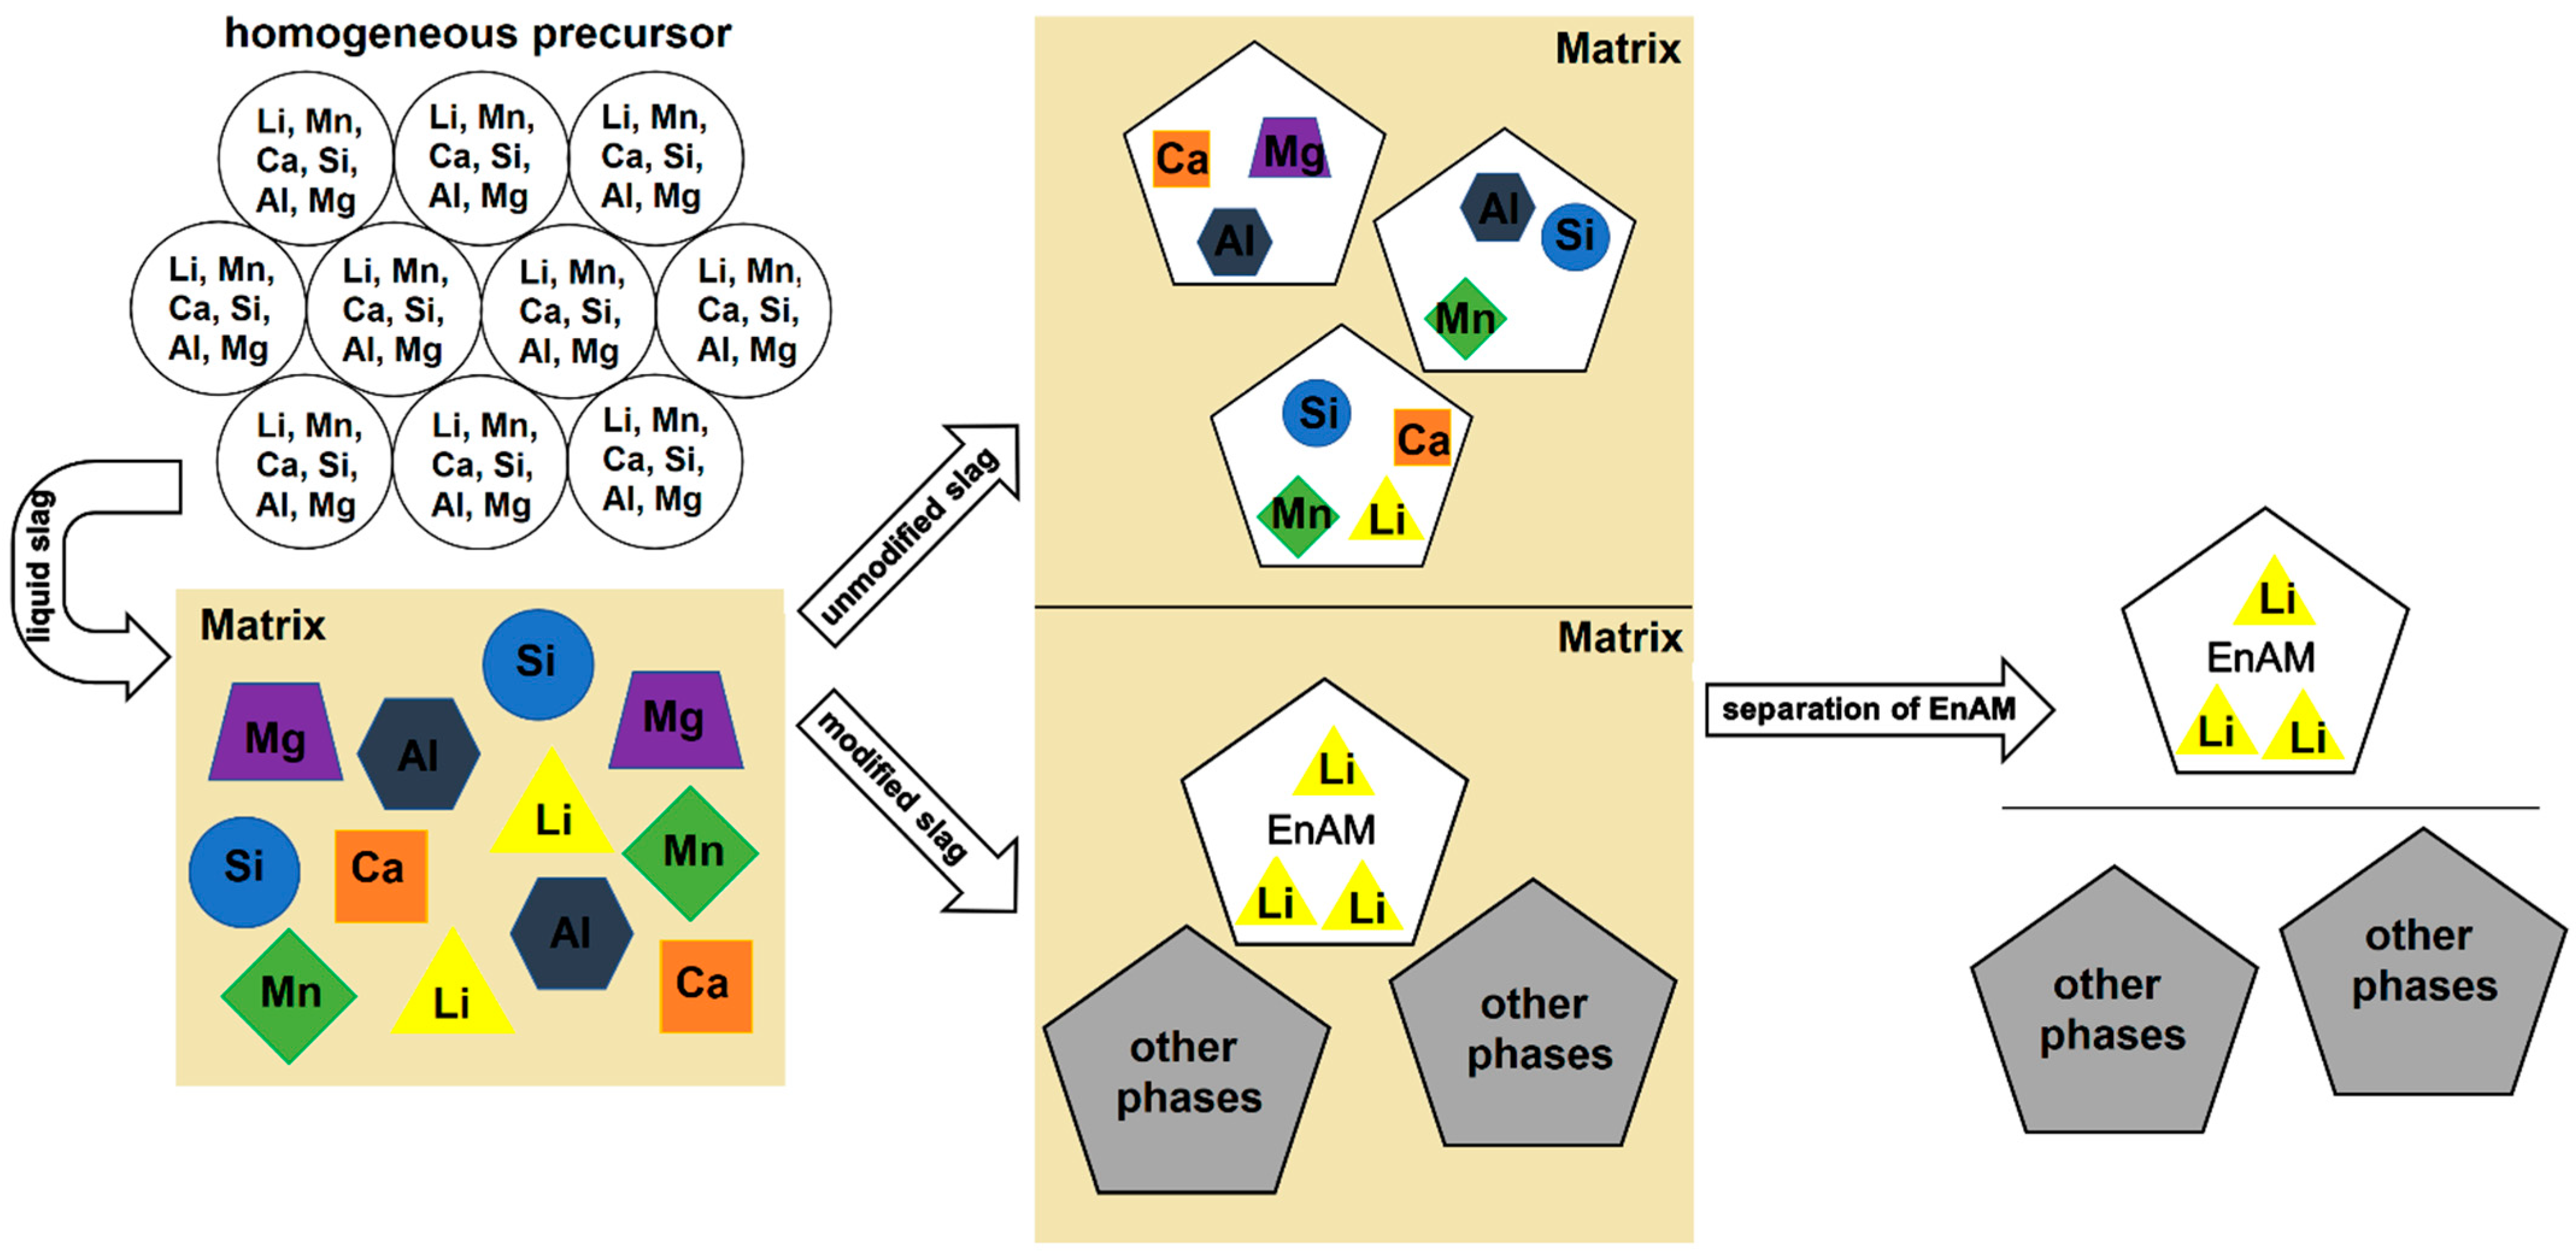
Sketch of the strategy behind EnAM experiments. The aim is to use a suitable synthesis route to produce a homogeneous precursor in which the elements are evenly distributed. After determination of the melting point, the precursor is melted. The individual phases crystallize out of the liquid slag. After the analysis of the slag has been completed, the experiment can be optimized (e.g., temperature, atmosphere, cooling rate, pressure) so that Li is present in a single phase (ideally an early crystallizate), which can be easily separated from the rest of the slag (matrix).
Figure 1.
Sketch of the strategy behind EnAM experiments. The aim is to use a suitable synthesis route to produce a homogeneous precursor in which the elements are evenly distributed. After determination of the melting point, the precursor is melted. The individual phases crystallize out of the liquid slag. After the analysis of the slag has been completed, the experiment can be optimized (e.g., temperature, atmosphere, cooling rate, pressure) so that Li is present in a single phase (ideally an early crystallizate), which can be easily separated from the rest of the slag (matrix).

Figure 2.
We used a heating program for the melting experiments. The selected heating rates (2.90 °C/min and 1.49 °C/min) are intended not to heat the samples too quickly, which should also reduce the Li loss. The slow cooling (0.38 °C/min) should ensure that the phases have enough time to form large crystals.

Figure 3.
Overview of the results of melting point determination with the melting microscope. According to DIN 51730, in addition to the start point, a distinction can also be made between the beginning of vitrification, the beginning of deformation, the half-cone point and the melting point.
Figure 3.
Overview of the results of melting point determination with the melting microscope. According to DIN 51730, in addition to the start point, a distinction can also be made between the beginning of vitrification, the beginning of deformation, the half-cone point and the melting point.

Figure 4.
Recorded spectra of the precursors together with the measured references. The precursors have a Mn speciation of >2 and <3.
Figure 4.
Recorded spectra of the precursors together with the measured references. The precursors have a Mn speciation of >2 and <3.

Figure 5.
Spectra of the slags together with the measured references. The slags have a Mn speciation of >2 and ≤3. The slags show higher Mn speciation compared to the precursors. Therefore, the presence of Mn4+ can almost certainly be excluded.
Figure 5.
Spectra of the slags together with the measured references. The slags have a Mn speciation of >2 and ≤3. The slags show higher Mn speciation compared to the precursors. Therefore, the presence of Mn4+ can almost certainly be excluded.

Figure 6.
(A) XRD patterns of sample S1–S3. The identified phases are: LiMnO2 (L) (ICDD PDF2: 00-035-0749), wollastonite (W) (ICDD PDF2: 01-084-0654) and larnite (C) (ICDD PDF2: 00-029-0369). (B) LiMnO2 reflex in all three slag samples. (C) Solid solutions can be identified between CaSiO3 and MnSiO3 (ICDD PDF2: 01-076-0523). Additionally, solid solutions can be detected between Ca2SiO4 and Mn2SiO4 (ICDD PDF2: 00-035-0748).

Figure 7.
BSE(Z) micrographs of the slags S1–S3. (A–C) Overview of S1 (A), S2 (B) and S3 (C). Dark gray: Matrix (wollastonite (CaSiO3) and larnite (Ca2SiO4); medium gray: Li-manganates (LiMnO2); light gray: hausmannite (Mn3O4). (A II) A detailed image of the intergrowth between LiMnO2 and Mn2+Mn3+2O4 in S1. Representative of the intergrowths in S3.

Figure 8.
(A) Elemental distribution of Ca, Si and Mn in a line scan through a Mn oxide grain consisting of LiMnO2 and Mn3O4(Li) in S1. Only small amounts of Mn are incorporated in the matrix. Within the individual LiMnO2 and Mn3O4(Li) sections of the grain, the elements are almost homogeneously distributed. No decrease or increase in the element concentration could be observed around the grain boundary. (B) BSE(Z) image showing the path of the line scan (A: start, B: end, step size: 2.6 µm).

Figure 9.
Measured Mn concentrations in different grains in the slag samples S1–S3. Pure stoichiometric LiMnO2 has a Mn concentration of 58.52 wt.%, as indicated by the upper dotted line. Varying Mn concentrations are observed in the different grains and slags. Measurements on the reference material rhodonite (MnSiO3) show that the Mn concentration can be determined with an accuracy of ±0.05 wt.%.

Figure 10.
B: birgmanite (MgSiO3), P: pyroxmangite (MnSiO3), W: wollastonite (CaSiO3), F: forsterite (MgSi2O4), T: tephorite (MnSi2O4), L: larnite (CaSi2O4)). (A) Up to 3 wt.% Mn was incorporated into the crystal lattice of CaSiO3. (B) Comparatively more Mn (max. 9.05 wt.%) was incorporated into the structure of Ca2SiO4 and additional Mg (max. 5.76 wt.%).

Figure 11.
(A,B) Line scans of the residual melt in S3. The element concentrations, especially Mn, vary within the analyzed regions. Compared to grain A, grain B has higher Mg and lower Mn concentrations. (C) BSE(Z) image with the linescan locations (A and B). A is the start point, and B is the end point. Step size: 2.9 µm.


Table 1.
List of known Li-Mn-oxides. (1): taken from the materials project (preference); (2): Freire et al. (data from Ref. [30]); (3): Levi et al. (data from Ref. [31]). Red-marked rows: Important for this study. Indication of Mn and Li concentration in wt.%.
| Formula | Common/Observed System | Mn2+ | Mn3+ | Mn4+ | Mntotal | Li | Described in (Example) |
|---|---|---|---|---|---|---|---|
| MnO/m3m | Fm3̅m (1) | 77.45 | 77.45 | 0.00 | e.g., Slagatlas | ||
| Li2Mn3O4 | - | 67.91 | 67.91 | 5.72 | Uncommon | ||
| Li2Mn2O3 | P12₁/c (1) | 63.97 | 63.97 | 8.08 | Mater. P. mp-756298 | ||
| Li2MnO2 | P3̅m1 (1) | 54.49 | 54.49 | 13.77 | Mater. P. mp-19279 | ||
| Mn5O6 | - | 44.46 | 29.64 | 74.10 | 0.00 | Wei et al. [20] | |
| Mn4O5 | - | 36.66 | 36.66 | 73.32 | 0.00 | Uncommon | |
| Mn3O4 | spinel (1) | 24.01 | 48.02 | 72.03 | 0.00 | e.g., Slagatlas | |
| LiMn3O4 | C12/m1 (1) | 46.60 | 23.30 | 69.90 | 2.94 | Xu et al. [21] | |
| LiMn2O3 | C12/c1 (1) | 33.30 | 33.30 | 66.60 | 4.21 | Uncommon | |
| Li3Mn2O5 | P1̅, C12/m1 (1) | 28.22 | 28.22 | 56.44 | 10.70 | Uncommon | |
| Mn2O3 | Pbca (1) | 69.60 | 69.60 | 0.00 | e.g., Slagatlas | ||
| LiMn5O8 | spinel (1) | 67.06 | 67.06 | 1.69 | Uncommon | ||
| LiMnO2 | Pmmn (1) | 58.52 | 58.52 | 7.39 | M. M. Thackeray [22] | ||
| Li4Mn2O5 | Fm/3m (2) | 50.49 | 50.49 | 12.76 | Freire et al. [18] | ||
| Li3MnO3 | P12₁/c1 (1) | 44.39 | 44.39 | 16.83 | Uncommon | ||
| Li8Mn2O7 | P12₁/c1 (1) | 39.61 | 39.61 | 20.02 | Uncommon | ||
| Li5MnO4 | Pbca (1) | 35.76 | 35.76 | 22.59 | Hoang et al. [23] | ||
| Li12Mn2O9 | P1 (1) | 32.59 | 32.59 | 24.70 | Uncommon | ||
| LiMn6O12 | P1 (1) | 10.39 | 51.97 | 62.36 | 1.31 | Uncommon | |
| LiMn5O10 | P1 (1) | 12.44 | 49.76 | 62.20 | 1.57 | Uncommon | |
| LiMn4O8 | P2_13̅ (1) | 15.49 | 46.47 | 61.96 | 1.96 | Uncommon | |
| Li0.3MnO2 | spinel (3) | 18.51 | 43.20 | 61.71 | 2.34 | Levi et al. [19] | |
| LiMn3O6 | C1c1 (1) | 20.52 | 41.04 | 61.56 | 2.59 | Uncommon | |
| LiMn2O4 | Fd3̅m1 (1) | 30.38 | 30.38 | 60.76 | 3.84 | Mishra and Ceder [24] | |
| MnO2 | P4₂/mnm (1) | 63.19 | 63.19 | 0.00 | e.g., Slagatlas | ||
| Li2Mn4O9 | P3̅c1 (1) | 58.19 | 58.19 | 3.68 | Masquelier et al. [25] | ||
| Li4Mn5O12 | C12/c1 (1) | 55.56 | 55.56 | 5.62 | Masquelier et al. [25] | ||
| Li2MnO3 | C12/m1 (1) | 47.03 | 47.03 | 11.88 | Wang et al. [26] | ||
| Li4MnO4 | 37.45 | 37.45 | 18.93 | Uncommon | |||
| Li1+xMn2–xO4 | 0.00–30.38 | 30.38–55.56 | 55.56–60.77 | 3.84–5.62 | Paulsen and Dahn [27] | ||
| Li1-xMnO4 | 0.00–30.38 | 30.38–63.19 | 60.77–63.19 | 0.00–3.84 | Calderon et al. [28] | ||
| LixMn3–yO4 | 24.01–53.77 | 15.76–48.02 | 69.24–72.03 | 0.00–3.88 | Paulsen and Dahn [27] |
Table 2.
Element concentrations used for the preparation of the precursors, given in weight percent (wt.%). In S2, 2 wt.% of Mg and in S3, 2 wt.% of Mg and Al each were added. In all three experiments, the ratios used were Ca:Si = 1.01 and Mn:Li = 2.90.
Table 2.
Element concentrations used for the preparation of the precursors, given in weight percent (wt.%). In S2, 2 wt.% of Mg and in S3, 2 wt.% of Mg and Al each were added. In all three experiments, the ratios used were Ca:Si = 1.01 and Mn:Li = 2.90.
| Sample | S1 | S2 | S3 |
|---|---|---|---|
| Li2O | 4.1 | 4.1 | 3.8 |
| MgO | n.a. | 2.0 | 2.0 |
| Al2O3 | n.a. | n.a. | 2.0 |
| SiO2 | 41.3 | 40.8 | 40.4 |
| CaO | 41.8 | 41.2 | 40.6 |
| MnO2 | 12.7 | 11.9 | 11.2 |
Table 3.
The measurements on the CRM rhodonite prove that it is possible to detect the Mn content with ±0.05% accuracy (N = 20 from different days). Indication in wt.%. * The iron content was not measured.
Table 3.
The measurements on the CRM rhodonite prove that it is possible to detect the Mn content with ±0.05% accuracy (N = 20 from different days). Indication in wt.%. * The iron content was not measured.
| wt.% | Average Rhodonite | %StDev. Rhodonite | Ref. Rhodonite |
|---|---|---|---|
| MgO | 1.91 | 0.02 | 2.0 |
| Al2O3 | 0.013 | 0.004 | n.a. |
| SiO2 | 46.66 | 0.08 | 46.8 |
| CaO | 4.78 | 0.04 | 4.6 |
| MnO | 42.30 | 0.05 | 42.3 |
| FeO * | 4.34 | n.a. | 4.3 |
Table 4.
A selection of different Li-manganates and Mn oxides. The shown compounds have approximately the same Mn concentrations in one column but different oxidation states. For a correct phase assignment, it is important to determine the Mn speciation in the sample. Indication of Mntotal in wt.%.
Table 4.
A selection of different Li-manganates and Mn oxides. The shown compounds have approximately the same Mn concentrations in one column but different oxidation states. For a correct phase assignment, it is important to determine the Mn speciation in the sample. Indication of Mntotal in wt.%.
| Phase | Mntotal | Mnox. | Phase | Mntotal | Mnox. | Phase | Mntotal | Mnox. |
|---|---|---|---|---|---|---|---|---|
| Li2Mn3O4 | 67.9 | 2.0 | Li2Mn2O3 | 64.0 | 2 | LiMnO2 | 58.5 | 3.0 |
| LiMn2O3 | 66.6 | 2.5 | LiMn6O12 | 62.4 | 3.5 | Li1.1Mn2O4.35 | 58.7 | 3.5 |
| LiMn5O8 | 67.1 | 3.0 | MnO2 | 63.2 | 4 | Li2Mn4O9 | 58.2 | 4.0 |
Table 5.
Determined mole fraction, given in at.%, of precursor and crystallized slag samples with ICP-OES. The results should clarify whether a loss of elements is to be expected during the melting experiment.
Table 5.
Determined mole fraction, given in at.%, of precursor and crystallized slag samples with ICP-OES. The results should clarify whether a loss of elements is to be expected during the melting experiment.
| Raw Mix (at.%) | Product (at.%) | Recovery % | |||||||
|---|---|---|---|---|---|---|---|---|---|
| S1 | S2 | S3 | S1 | S2 | S3 | S1 | S2 | S3 | |
| Li2O | 14.3 | 14.6 | 13.7 | 14.0 | 14.5 | 13.8 | −2.3 | −0.6 | 0.7 |
| MgO | n.a. | 2.1 | 2.3 | n.a. | 2.2 | 2.2 | n.a. | 4.6 | −4.3 |
| Al2O3 | n.a. | n.a. | 1.8 | n.a. | n.a. | 1.8 | n.a. | n.a. | 1.3 |
| SiO2 | 37.4 | 35.6 | 35.6 | 37.7 | 35.6 | 35.6 | 1.0 | 0.1 | 0.0 |
| CaO | 41.0 | 40.5 | 39.3 | 40.8 | 40.4 | 39.3 | −0.3 | −0.2 | −0.1 |
| MnO | 7.3 | 7.3 | 7.1 | 7.4 | 7.4 | 7.1 | 1.1 | 0.2 | 0.2 |
Table 6.
Deviation from the average LiMnO2 composition. An average structure formula is given, as well as the structural formula based on the lowest (min. Li(1+x)Mn(1–0.33x)O2) and highest (max. Li(1–x)Mn(1+0.33x)O2) Mn concentration.
Table 6.
Deviation from the average LiMnO2 composition. An average structure formula is given, as well as the structural formula based on the lowest (min. Li(1+x)Mn(1–0.33x)O2) and highest (max. Li(1–x)Mn(1+0.33x)O2) Mn concentration.
| Sample | LiMnO2 (average) | LiMnO2 (min.) | LiMnO2 (max.) |
|---|---|---|---|
| S1 (N = 20) | Li1.00Mn1.00O2 | Li1.00Mn1.00O2 | Li0.95Mn1.02O2 |
| S2 (N = 20) | Li1.00Mn1.00O2 | Li1.02Mn0.99O2 | Li0.97Mn1.01O2 |
| S3 (N = 20) | Li1.00Mn1.00O2 | Li1.04Mn0.99O2 | Li0.96Mn1.01O2 |
Table 7.
The hausmannite spinel solid solution in S3 (N = 18) can be described with MnAl2O4, MgMn2O4, Li2Mn2O4 and Mn3O4. The ratio of Mn2+/3+ and the content of Li were determined by virtual components. The element fractions of the virtual components can be taken from the table. The structure formula of the compound can be established with the stoichiometric factors x and z.
| wt.% | Mn2+Al2O4 | MgMn3+2O4 | Li2Mn3+2O4 | Mn2+Mn3+2O4 | Total |
|---|---|---|---|---|---|
| Li2O | 0.0 | 0.0 | 0.8 | 0.0 | 0.8 |
| MgO | 0.0 | 1.1 | 0.0 | 0.0 | 1.1 |
| Al2O3 | 2.2 | 0.0 | 0.0 | 0.0 | 2.2 |
| MnO | 1.5 | 0.0 | 0.0 | 26.6 | 28.1 |
| Mn2O3 | 0.0 | 4.5 | 4.0 | 59.1 | 67.5 |
| total [%] | 3.8 | 5.6 | 4.7 | 85.7 | 99.7 |
| X | 0.06 | X, Z: stoichiometric factors | |||
| Z | 1.90 | (Li(2x),Mg(1x),Mn(2+(1–x)))1+x(Al(2z),Mn3+(z))2O4 | |||
Table 8.
Calculated structural formula of hausmannite (Mn3O4). For S3, the structural formula for the spinel solid solutions ((Li(2x),Mg(1x),Mn(2+(1–x)))1+x(Al(2–z),Mn3+(z))2O4) was considered. In S2, no hausmannite was found.
Table 8.
Calculated structural formula of hausmannite (Mn3O4). For S3, the structural formula for the spinel solid solutions ((Li(2x),Mg(1x),Mn(2+(1–x)))1+x(Al(2–z),Mn3+(z))2O4) was considered. In S2, no hausmannite was found.
| Sample | Hausmannite (Mn2+Mn3+2O4) |
|---|---|
| S1 (N = 20) | Mn2+1.00Mn3+2.00O4 |
| S3 (N = 18) | (Li(0.11)Mg(0.06)Mn2+(0.88))1.06(Al(0.10)Mn3+(1.90))2.00O4 |
Table 9.
Overview of the calculated structural formulas for wollastonite (CaSiO3) and larnite (Ca2SiO4).
Table 9.
Overview of the calculated structural formulas for wollastonite (CaSiO3) and larnite (Ca2SiO4).
| Sample | Wollastonite CaSiO3 | Larnite Ca2SiO4 |
|---|---|---|
| S1 (N = 22) | (Ca(1.00)Mn2+(0.02))1.02Si0.99O3 | Ca(1.73)Mn2+(0.15))1.88Si1.00O4 |
| S2 (N = 18) | (Ca(0.98)Mn2+(0.02))1.00Si1.00O3 | (Ca(1.73)Mn2+(0.04))1.77Si1.01O4 |
| S3 (N = 18) | (Ca(0.99)Mn2+(0.02))1.01Si1.00O3 | (Mg(0.08)Ca(1.73)Mn2+(0.12))1.92Si1.00O4 |
Disclaimer/Publisher’s Note: The statements, opinions and data contained in all publications are solely those of the individual author(s) and contributor(s) and not of MDPI and/or the editor(s). MDPI and/or the editor(s) disclaim responsibility for any injury to people or property resulting from any ideas, methods, instructions or products referred to in the content. |
© 2023 by the authors. Licensee MDPI, Basel, Switzerland. This article is an open access article distributed under the terms and conditions of the Creative Commons Attribution (CC BY) license (https://creativecommons.org/licenses/by/4.0/).
Share and Cite
MDPI and ACS Style
Schnickmann, A.; Hampel, S.; Schirmer, T.; Fittschen, U.E.A. Formation of Lithium-Manganates in a Complex Slag System Consisting of Li2O-MgO-Al2O3-SiO2-CaO-MnO—A First Survey. Metals 2023, 13, 2006. https://doi.org/10.3390/met13122006
AMA Style
Schnickmann A, Hampel S, Schirmer T, Fittschen UEA. Formation of Lithium-Manganates in a Complex Slag System Consisting of Li2O-MgO-Al2O3-SiO2-CaO-MnO—A First Survey. Metals. 2023; 13(12):2006. https://doi.org/10.3390/met13122006
Chicago/Turabian StyleSchnickmann, Alena, Sven Hampel, Thomas Schirmer, and Ursula E. A. Fittschen. 2023. "Formation of Lithium-Manganates in a Complex Slag System Consisting of Li2O-MgO-Al2O3-SiO2-CaO-MnO—A First Survey" Metals 13, no. 12: 2006. https://doi.org/10.3390/met13122006
Note that from the first issue of 2016, this journal uses article numbers instead of page numbers. See further details here.