Article

The Effect of Mn and Ti Ratio on Microstructure and Mechanical and Machinability Properties of 316 L Stainless Steel Used in Biomedical Applications

1
Department of Materials Science Engineering, Faculty of Engineering, Transportation Technologies Institute, Gebze Technical University, Kocaeli 41400, Türkiye
2
Department of Biomedical Engineering, Karabuk University, Karabuk 78050, Türkiye
3
Department of Machine and Metal Technology, Technical Sciences Vocational School, Aksaray University, Aksaray 68100, Türkiye
*
Author to whom correspondence should be addressed.
Metals 2023, 13(11), 1804; https://doi.org/10.3390/met13111804
Submission received: 15 September 2023 / Revised: 22 October 2023 / Accepted: 23 October 2023 / Published: 26 October 2023
(This article belongs to the Topic Advanced Processes in Metallurgical Technologies)

Abstract

:
In this study, titanium (Ti) and manganese (Mn) element powders in determined amounts (0.35–0.75 and 1.5 wt %) were added into the 316 L stainless steel matrix by means of powder metallurgy (PM) technology, either individually or in pairs, and the desired composition was obtained as a powder mixture. The powders used in the study were cold-pressed tensile sample molds prepared in ASTM E8M standards, unidirectionally cold-pressed under 750 MPa compression pressure and formed into blocks. After pressing, the raw strength samples were sintered in an atmosphere-controlled tube furnace at 1250 °C for two hours in an argon atmosphere. The microstructure and mechanical properties of the produced PM steels were characterized using an optical microscope, SEM, EDS, tensile test, and hardness test. The results showed that the stainless steel samples with 0.35 (Ti and Mn) added to 316 L stainless steel had the highest yield strength, tensile strengths, and hardness strengths. However, with the addition of 0.75–1.5 Ti, 0.75–1.5 Mn and 0.75–1.5 (Ti and Mn) to 316 L stainless steel, a decrease was observed in the mechanical properties. Moreover, the stainless steel sample with 0.35 (Ti and Mn) added to 316 L stainless steel is better than other samples in terms of surface quality.

1. Introduction

Powder metallurgy (PM) is a method of producing parts by mixing metal powders homogeneously in a certain ratio, compressing them in precision molds at pressures in accordance with the desired technical values, and then sintering them under controlled atmospheric conditions [1]. One of the biggest advantages of this production method is that it can easily produce powder metal steel with the desired chemical composition [2]. Engineering materials produced with this method often need to be subjected to machining processes in order to be ready for use [3,4]. The machining process can be defined as the cutting tool and the workpiece moving relative to each other and removing pieces in the form of chips from the main material [5,6]. In this way, the desired dimensions and surface quality are achieved.
Steels have great importance among the material groups used in engineering applications. Non-alloy steels basically consist of iron, carbon, and manganese elements. In addition, they also contain very low amounts of silicon, phosphorus, and sulfur elements. Alloy steels are derived by introducing various alloying elements in different proportions into iron matrix structures [7]. Stainless steels are typically defined as iron-based alloys comprising a minimum of 10.5% chromium (by weight) and a maximum of 1.2% carbon (by weight) [8]. Owing to their characteristics such as high strength, hardness, ductility, weldability, durability, ease of forming and machining, as well as excellent fire resistance, they find extensive utilization in industries such as aviation, chemical, petrochemical, food, pharmaceuticals, and nuclear power plants [9]. Stainless steels can be categorized into three types based on their chemical composition: austenitic stainless steel, ferritic stainless steel, and martensitic stainless steel. Among these, austenitic stainless steel constitutes 70% of the total stainless steel production and is the most widely employed grade of stainless steel worldwide [10]. The crystalline structure of austenitic stainless steels is a face-centered cube (FCC). Due to this structural arrangement, austenitic stainless steels are recognized for their ease of machinability, weldability, and remarkable corrosion resistance, making them suitable for a diverse range of applications. The stabilizing alloy elements of the austenitic phase because it has a crystalline structure in the form of a face centered cube (FCC), which is the same as the crystalline structure of austenitic steel. As for the secondary alloying elements that are found in austenitic steels, they are Mo, Cu, N, Nb, Ti, Mn, S, Si, C, and Al. They are divided according to their effect on the crystalline structure of the steel to stabilizers of the ferrite phase or the austenitic phase. 316 L stainless steel is one of the best and most common types of stainless steel in biomedical applications because of its cheap price, high mechanical qualities, good corrosion resistance, and ease of forming for the manufacture of biomedical metals. Titanium element is used to prevent the formation of chromium carbide in austenitic stainless steels with high carbon content. It also improves mechanical properties at high temperatures. The general properties of titanium can be listed as non-toxic, antimagnetic, low specific gravity, superior mechanical properties, high biocompatibility, elastic modulus close to the bone, and high corrosion resistance. The Mn element used as a stabilization element for the austenitic phase has an allotropic structure. In addition, Mn prevents the formation of FeS, which accumulates at grain boundaries and causes brittleness in steel by combining with sulfur and the formation of manganese sulfide MnS. Its price is low, so it can be used instead of other alloying elements such as high-priced nickel [11]. Some studies in the literature have investigated how the addition of alloying elements changes the mechanical properties. For example, Gulsoy et al. [12] investigated the effect of Zr, Nb, and Ti additions to 316 L stainless steel on its mechanical and electrochemical properties and biocompatibility. The authors reported that the mechanical, corrosion, and biocompatibility properties of Zr, Nb, and Ti-added alloys are better than the 316 L alloy, and that Ti-added alloys have better properties than other alloys. Ali et al. [13] investigated the effects of varying boron, titanium, and niobium additions to 316 L stainless steel on its physical and mechanical properties. The authors reported that microhardness increased for all alloy compositions, tensile strength decreased, and compressive strength increased for the alloy containing equal concentrations of niobium and titanium additions. Albahlol et al. [14] examined the influence of Al2O3 addition on the microstructure and mechanical characteristics of 316 L stainless steel. Their findings revealed that it is possible to create novel composite materials by layering 316 L and Al2O3, and that these materials are well-suited for application as alternative prosthetic materials in the field of biomedical engineering.
From the literature review, mechanical properties improve with the addition of alloying elements. At the same time, it has been observed that studies on the production of 316 L alloy using the powder metallurgy technique by adding different alloying elements are quite limited. In this study, the element titanium (Ti) was chosen because it is a biocompatible element, and its density is low and is close to the density of bone. The element manganese (Mn) was chosen because it is cheap and stabilizes the austenitic phase and is an alternative to the element nickel, which is an expensive element with high toxicity. In this study, the effects of adding Mn and Ti at different weight percentages to 316 L stainless steel on its mechanical and machinability properties were examined.

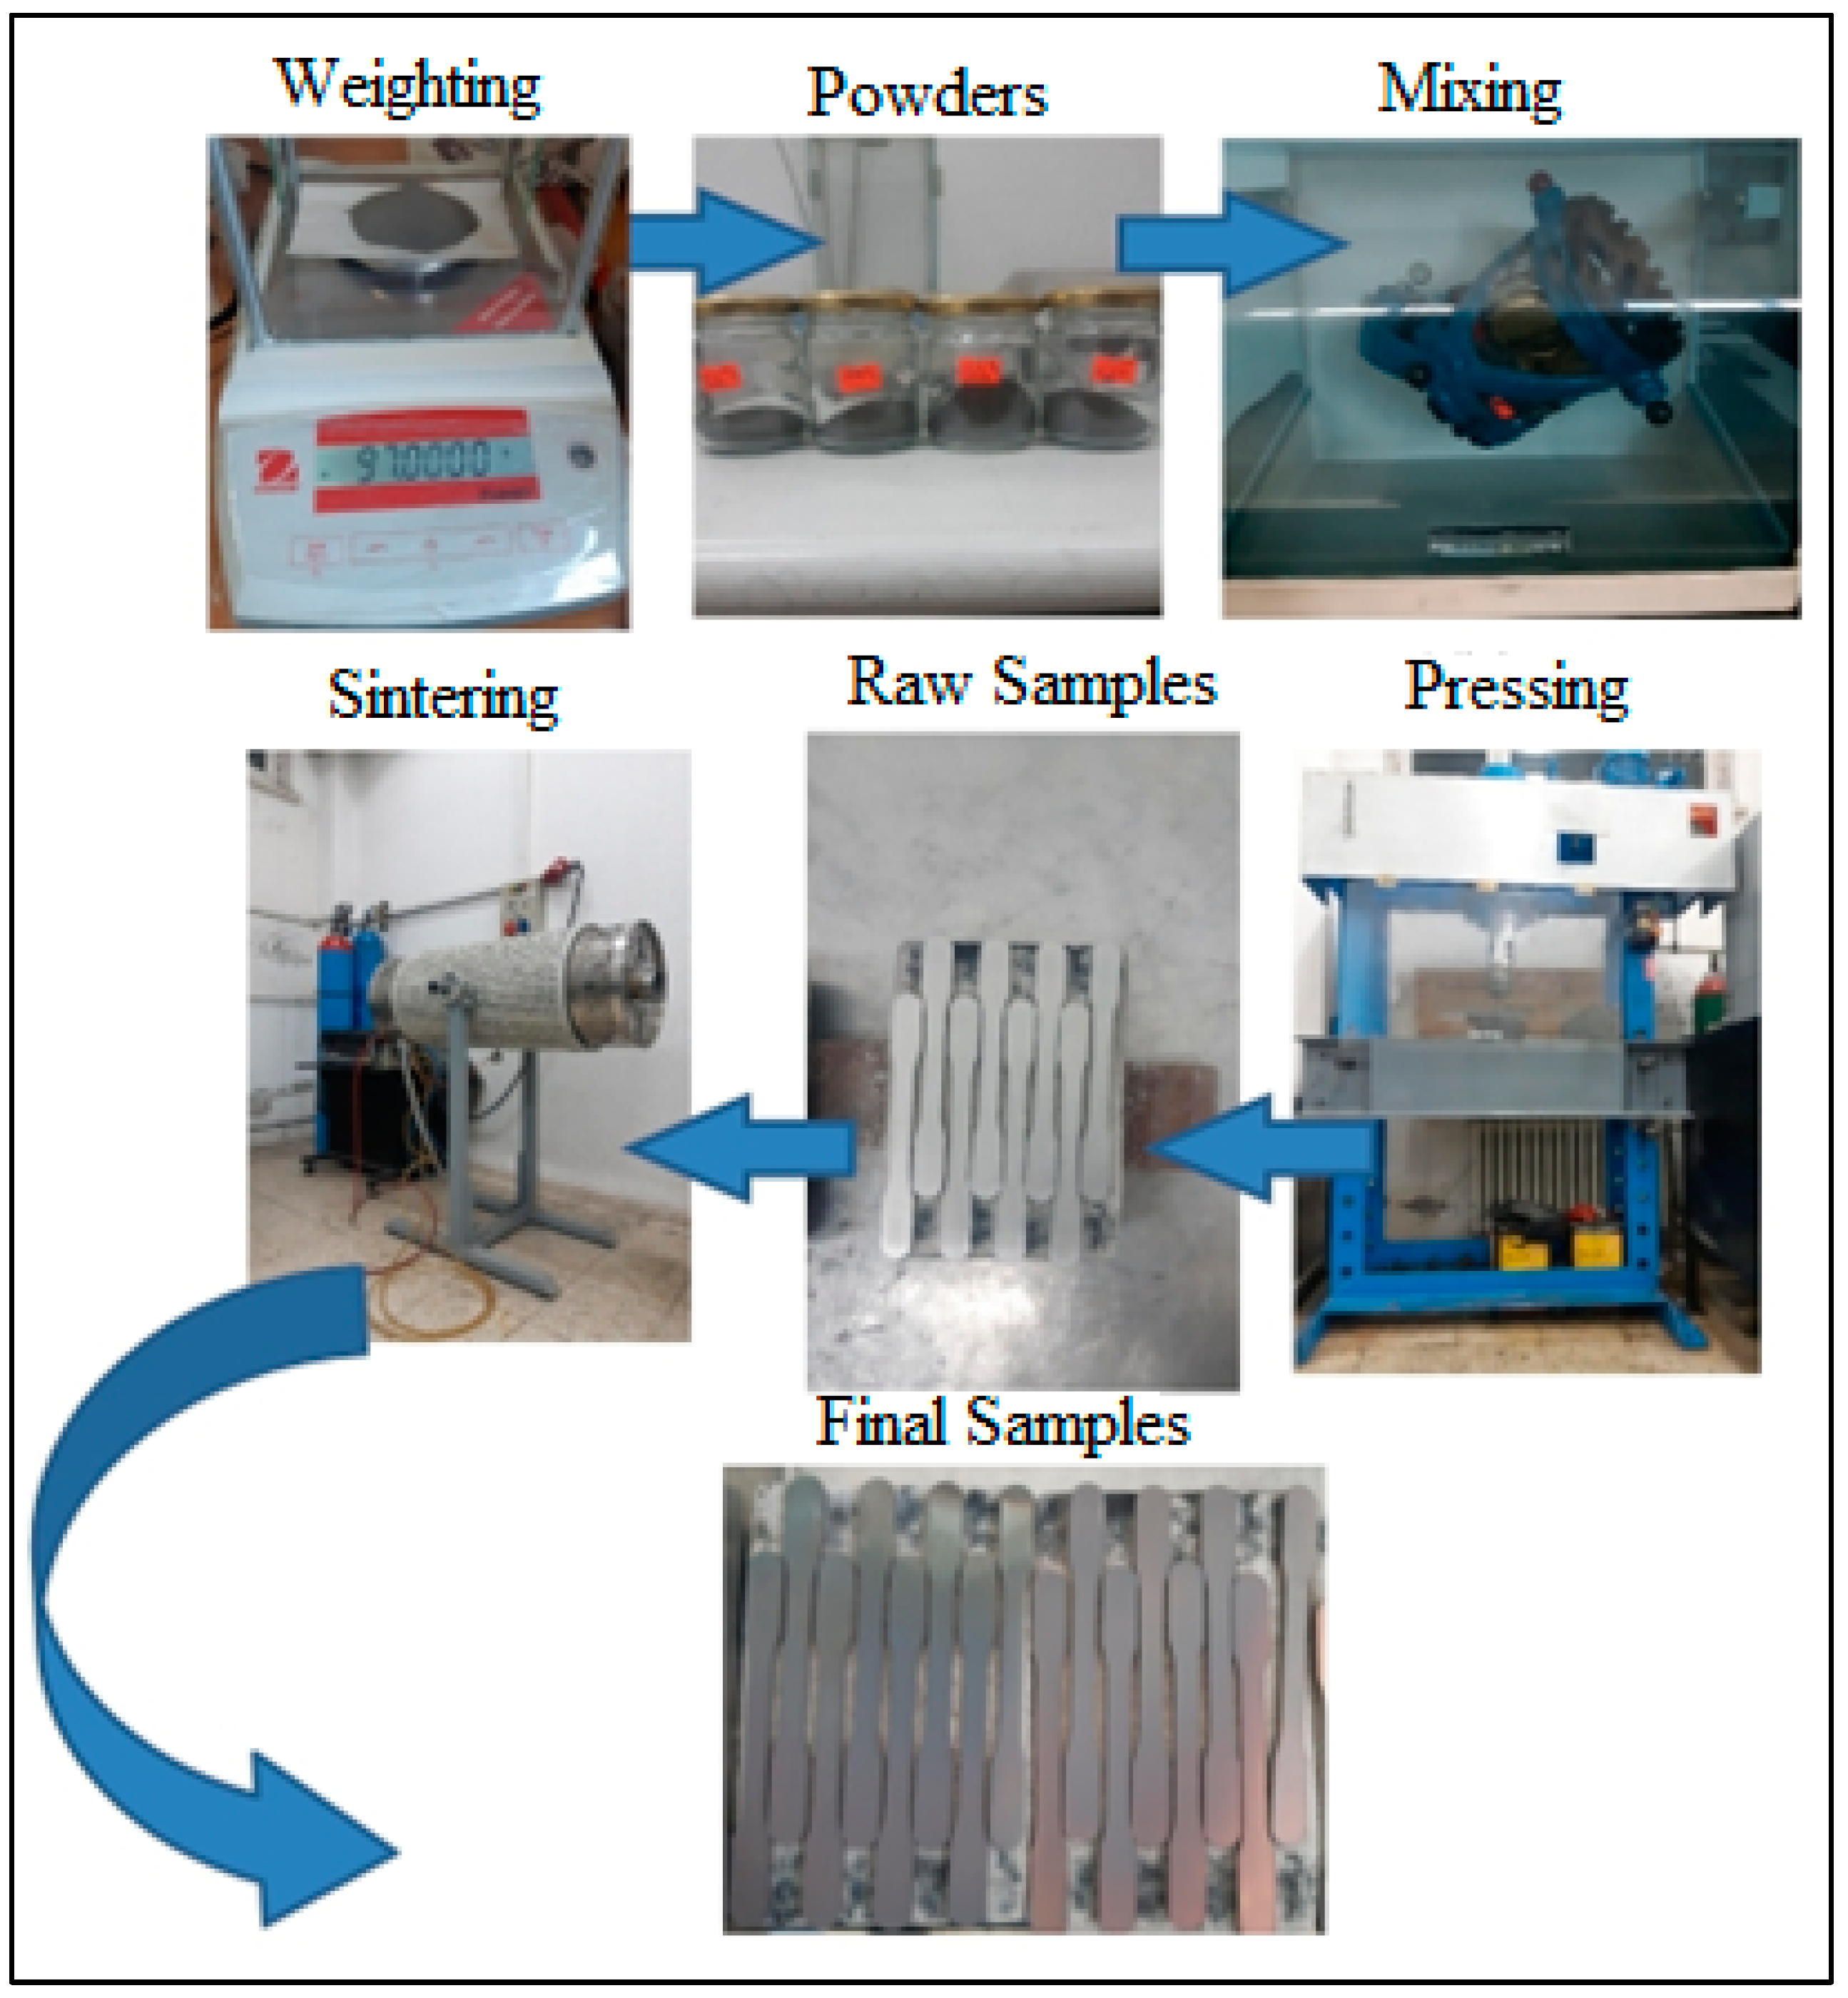
2. Materials and Methods

The properties of Mn, Ti and 316 L powders used in the study to form a modified alloy of stainless steel via the PM method are shown in Table 1.
Alloy steel samples were produced by mixing in the chemical compositions shown in Table 2. The samples produced were subjected to machinability, tensile, and hardness tests and their microstructures were examined; density, porosity, and average particle size were calculated. The results were evaluated. After being unidirectionally cold-pressed at 750 MPa compression pressure, the mixed powders were shaped into blocks in an ASTM E8M powder metal drawing sample mold. The sintering process was performed in a Protherm PTF 16/75/610 brand atmosphere-controlled furnace with a maximum temperature of 1600 °C. The sintering procedure took 2 h at 1250 °C in an argon environment. The temperature was raised at a rate of 5 °C/min. The samples were then heated to sintering temperatures and held there for 2 h before being cooled to room temperature at a rate of 5 °C/min. A total of 50 samples were prepared, with 5 samples for each composition.
The weighing of the powders was carried out using a RADWAG AS.60.220 C/2 brand digital precision balance with an accuracy of 0.0001, in line with the amount given in Table 2, and the weighed powder mixtures were blended with balls for two hours using a Willy A. Bachofen AG T2F Turbula brand triaxial mixer for homogeneous mixing. Figure 1 shows the stages of work to prepare samples using the PM metallurgy method, where the process begins with weighing the dust of Ti, Mn and 316 L. After the weighing process, the mixing process, which lasted for two hours, was started in the triaxial mixer, then the pressure process was initiated to transform the powder into a solid mixture using the mold prepared in the dimensions of the standard tensile test sample prepared according to ASTM E8M [15]. The samples at this stage are green; that is, their mechanical properties are weak. It was then heated to the sintering temperature of 1250 °C, with the temperature gradually increasing by 5 °C per minute. It was kept at this temperature for 2 h. Then, the cooling process was carried out under the same conditions. At this stage, which is called sintering, argon was used as the shielding gas (see Figure 1).
The sintered tensile specimens’ surfaces were sanded with a PRESI MECAPOL P262 brand apparatus to prepare them for hardness testing. The HV0.5 (0.5 kg.) load was applied in Vickers microhardness testing, and the hardness value was calculated by taking measurements from 10 different places for each sample. The samples were broken after using a tensile test at a tensile speed of 1 mm/min using a SHIMADZU tensile testing machine. Following each test, (stress. strain%) diagrams were produced, and the yield strength (0.2%), tensile strength, and elongation% values of the samples were obtained. For density measurements of PM steel samples, a RADWAG AS.60.220 C/2 precision balance with a RADWAG AS density measurement kit and the Archimedes principle using pure water were used. Three density measurements were carried out for each sample and then the average of these measurements was calculated.
Optical and scanning electron microscopes (SEM) were employed for microstructural examinations. Microstructure analysis was conducted using a Nikon ECLIPSE L150 microscope with a magnification range of 50× to 1000×. Mounting samples were prepared using sanding and polishing techniques. These samples underwent electrolytic etching in a solution consisting of 10 g of oxalic acid dissolved in 90 milliliters of distilled water, subjected to a current of 2 amps and a voltage of 12 volts. Photos of various sizes were taken from different regions of each sample, ensuring they accurately represented the entire microstructure. Grain sizes of the PM 316 L steel specimens were calculated on optical micrographs using the mean linear intercept method.
Machining experiments were carried out on samples with varying compositions on a CNC milling machining center featuring an 18.5 kW motor and a spindle speed of 6000 rpm. The experimental setup is depicted in Figure 2. For these tests, CVD TiAlN + TiCN coated tungsten carbide (WC–Co) inserts with the ISO designation SDMT06T204.F57 and KWKP35S quality, supplied by Walter, were employed. Three distinct cutting speeds (150, 225, and 300 m/min), a consistent feed rate of 0.06 mm/tooth, and a depth of cut of 0.6 mm were selected as the cutting parameters for milling experiments conducted on all test samples.
The Mitutoyo Surftest 211 instrument was employed to determine the roughness values of the machined surfaces. These measurements were conducted following the ISO 4287 standards [16]. The average surface roughness (Ra) value was calculated by taking the mean of the roughness values measured from three distinct regions of each machined sample. To ascertain the temperature within the cutting zone, a high-resolution (320 × 240 pixels) infrared camera (FLIR E60 model) with a frame rate of 60 Hz, offering real-time measurement and thermographic monitoring, was utilized.

3. Results

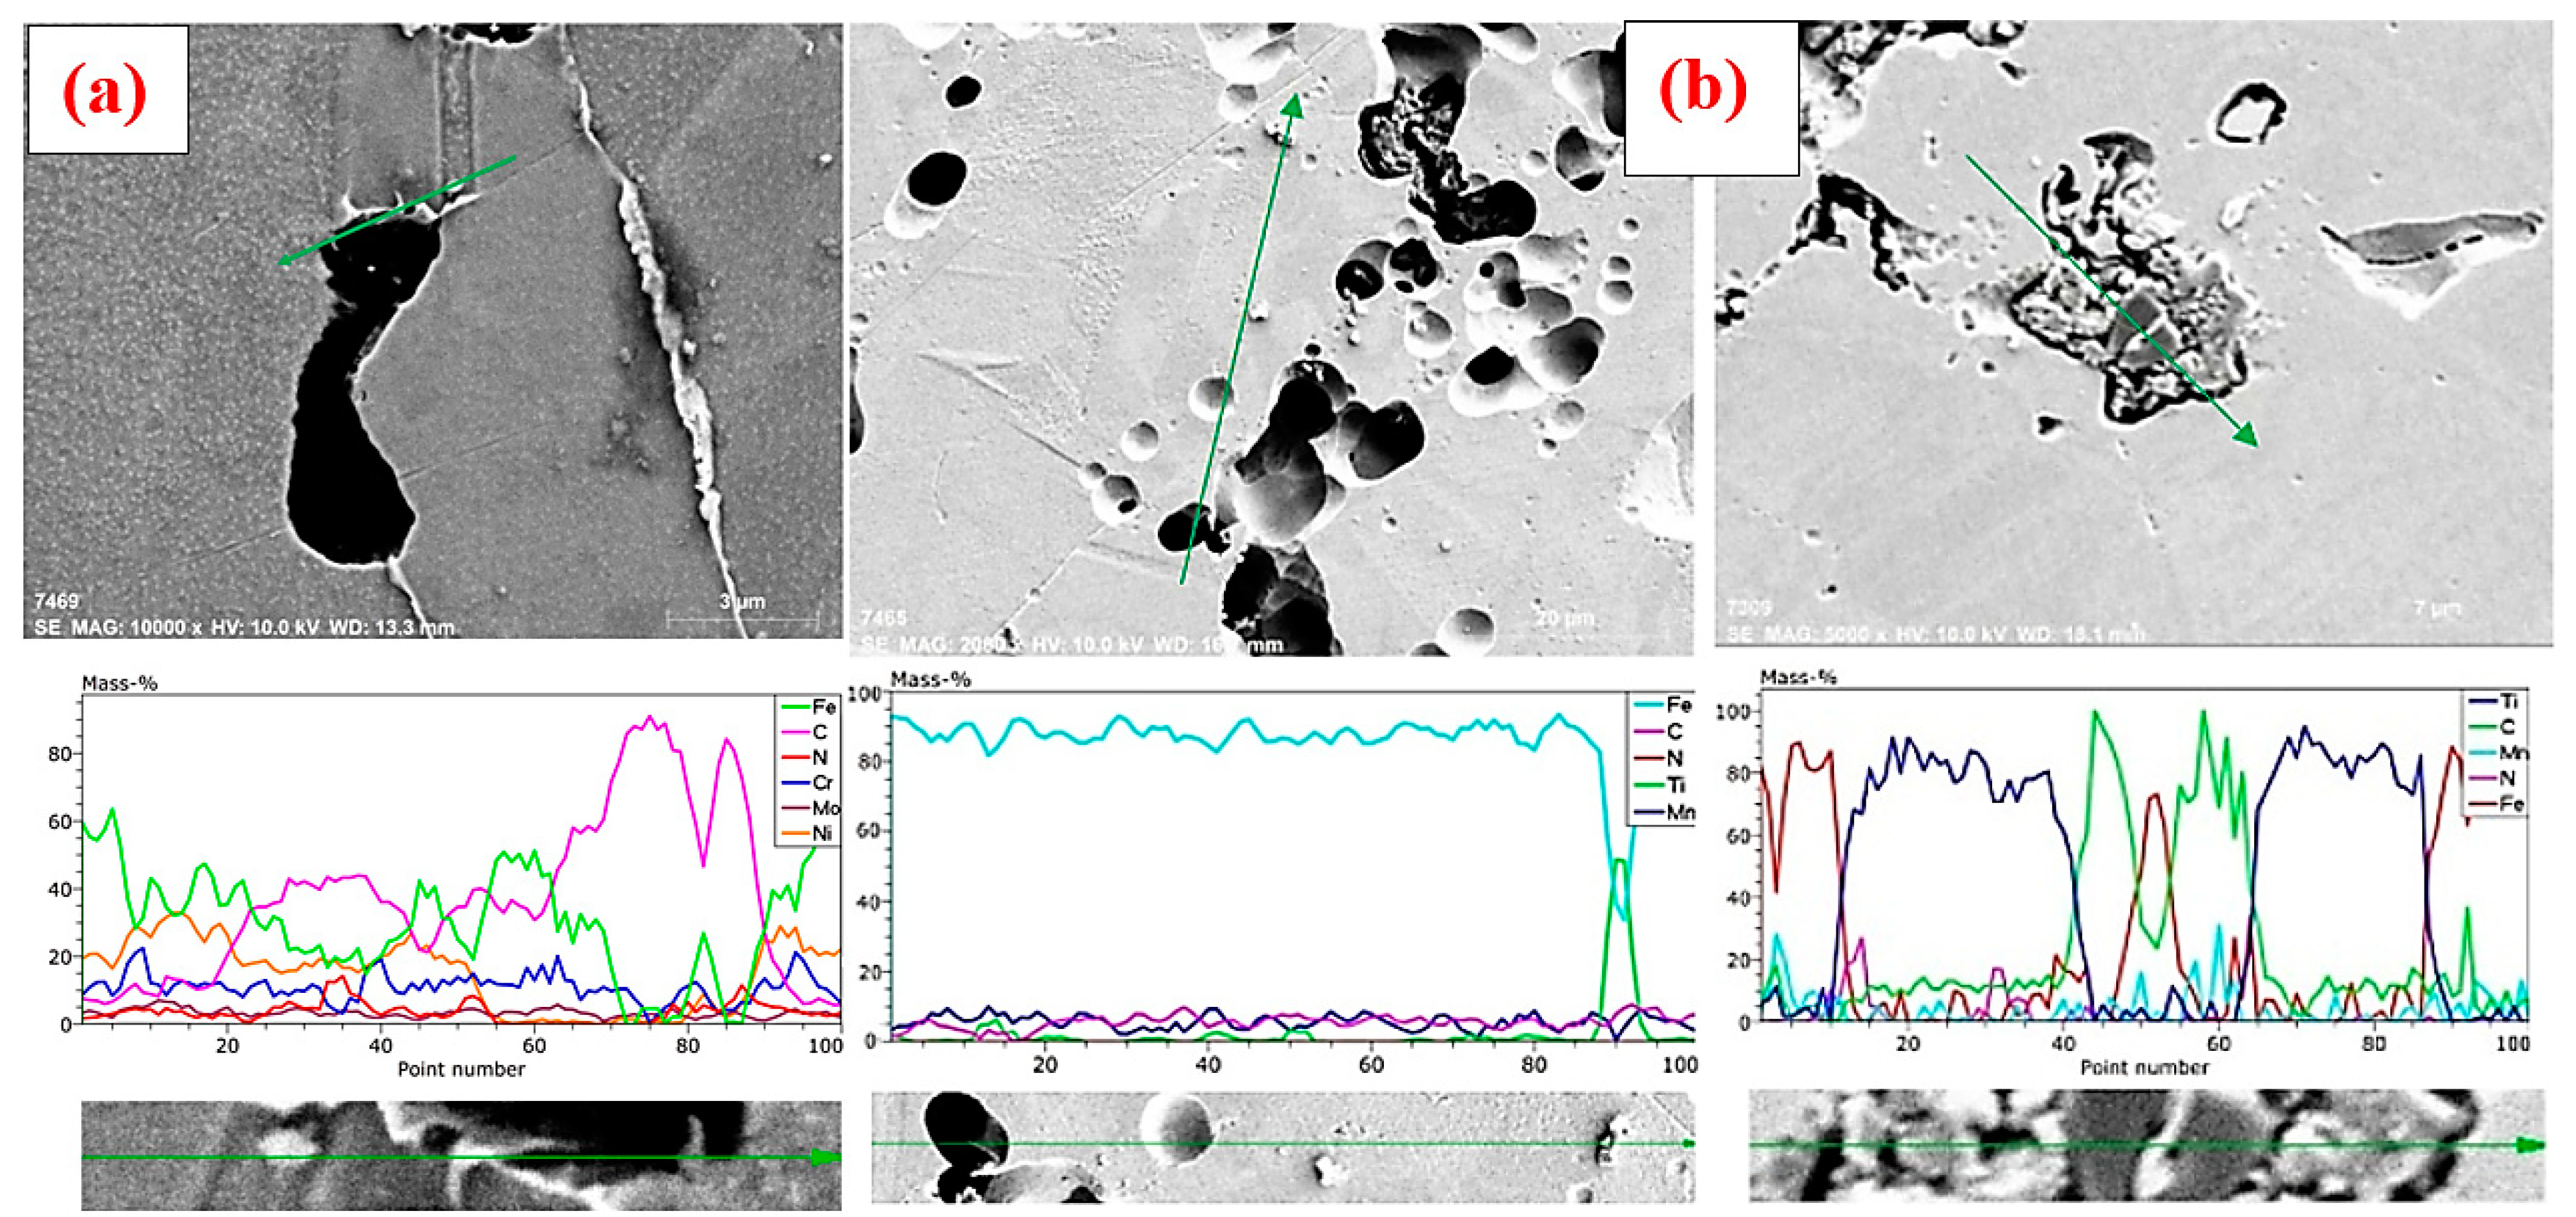
3.1. Microstructure Results and Evaluation

The microstructure images of the samples produced via the PM technique were taken at a pressure of 750 MPa and sintered in an atmosphere of argon at a temperature of 1250 °C for two hours. Figure 3 shows the optical microscope images of the samples produced by the PM method before and after the alloying elements (Ti and Mn) were added.
It can be observed from the microscopic images that when 0.35 of Ti and Mn were added to stainless steel, the grain size in the microstructure became smaller, and when the amount of alloying elements (Ti and Mn) was increased to 0.75 and 1.5, an increase in the grain size was observed. Moreover, upon examination of Figure 3 and Figure 4, which depict optical micro-scope and SEM microstructure images taken from all compositions of 316 L that were produced, it can be observed that twin structures have formed, consistent with similar findings in the literature [17,18,19].
It was also observed that there are pores in the fine structure of the samples, the proportion of which increases with the increase in the proportion of added alloying elements, and these pores have a spherical and small shape. Table 3 shows results of relative density, relative porosity, and average grain dimension of the samples. In Table 3, the relative density, relative porosity, and average grain size are calculated for the samples prepared via the PM method at a temperature of 1250 °C for 2 h and a pressure of 750 MPa. The results show that the effect of Ti, Mn, and Ti-Mn content on the grain size of 316 L stainless steel depends on the processing method and conditions. Specifically, increasing Ti, Mn, and Ti-Mn content tends to lead to finer and more uniform grain size in 316 L stainless steel. This finding is consistent with the results of Ertuğrul et al. [20], who observed a similar average grain size of approximately 16.5 um for 316 L produced using microwave sintering at 1250 °C.
It can be noted from the table that the relative density decreases with the increase in the weight percentage of the alloying elements (Ti-Mn) compared to Alloy I, which represents the stainless steel alloy without the addition of (Ti-Mn). For example, when Ti was added in certain proportions (0.35–0.75 and 1.5 wt %), a decrease was observed in the relative density of samples (Alloys II–V and VI) % of the original sample without addition (Alloy I), and the reason for this is because the addition of Ti and Mn leads to an increase in porosity. There are studies in the literature that demonstrate that the addition of alloying elements increases porosity. For example, Erden et al., in their study, determined that the addition of Mo to unalloyed steel increases the number of pores [21], while the porosity increases with the increase in the weight percentage of the alloying elements. For example, when the two elements (Ti-Mn) were added, the relative porosity increased from 8.06% in Alloy I to which alloying elements the samples (Alloy IV–VII and X) were added 9.11–9.21 and 12.01% in, respectively. On other hand, it can also be seen in Table 3 that the average grain dimensions in the microstructure of stainless steel 316 L become smaller when adding alloying elements (Ti, Mn) with a small weight ratio (0.35 wt %) compared to the basic stainless steel (Alloy I), whose average grain dimensions are 21.25 μm, as the average grain dimensions increase in Alloy II, III, and IV (20.45–19.46 and 19.01) μm, respectively. This is explained by the formation of the precipitates of carbides and nitrides such as TiC(N), MnC(N), and TiMnC, which have a relatively small size and are located on the grain boundaries, causing an obstruction to the expansion of the grain boundaries during recrystallization and the formation of the austenitic phase, which leads to a decrease in the size of the grains compared to the size of the grains in Alloy I, which does not contain additional elements. It was noted that the effect of alloying elements is greater in Alloy IV because three types of precipitates are formed, namely titanium carbide and nitride TiC(N); manganese carbide and nitride MnC(N); and titanium and manganese carbide nitride TiMnC(N), which leads to a greater impediment to the expansion of the grain boundaries in the stage of crystallization in the austenitic phase. Thus, smaller grains are formed. Whereas when the weight percentage of the alloying elements is increased to above (0.35 wt %) to become (0.75 wt %) in Alloys V, VI, and VII, the grain size becomes larger, respectively, and with the continuation of the increase in the weight percentage of the alloying elements to 1.5%, significant increases in the size of the granules to 23.43−28.38 μm, and 31.51 μm were noted. This is explained by the fact that when alloying elements are added in large proportions by weight, this leads to the formation of precipitates with large grains in the austenitic phase, which causes gaps in the crystalline structure. It can be noted that the largest size of the grains was in Alloy VIII, which contains 1.5% titanium. From Figure 4, which depicts the SEM image and the EDS point of the basic Alloy I, it can be seen that at the matrix there is an amount of iron and carbon, indicating the precipitation of cementite (Fe3C). Different precipitates were observed. For example, when spectrum 4 is examined, it can be observed that levels of Cr, Si, Mo, N, and C are high. Here, it is considered to be a precipitate of CrSiMoC(N). As a matter of fact, it has been stated in the literature that binary and multiple precipitates are formed in the matrix and grain boundaries [21].
Figure 5 shows the SEM microstructure image taken from Alloy X with 1.5% (Ti + Mn) added. It was observed that new precipitates such as TiC(N), MnC(N) and TiMnC (N) were formed from the received point EDSs. Figure 6 presents the results of the EDS line analysis of Alloy I and Alloy X, which shows the presence of Ti and Mn elements on the precipitates in the form of TiC(N), MnC(N), and TiMnC(N).

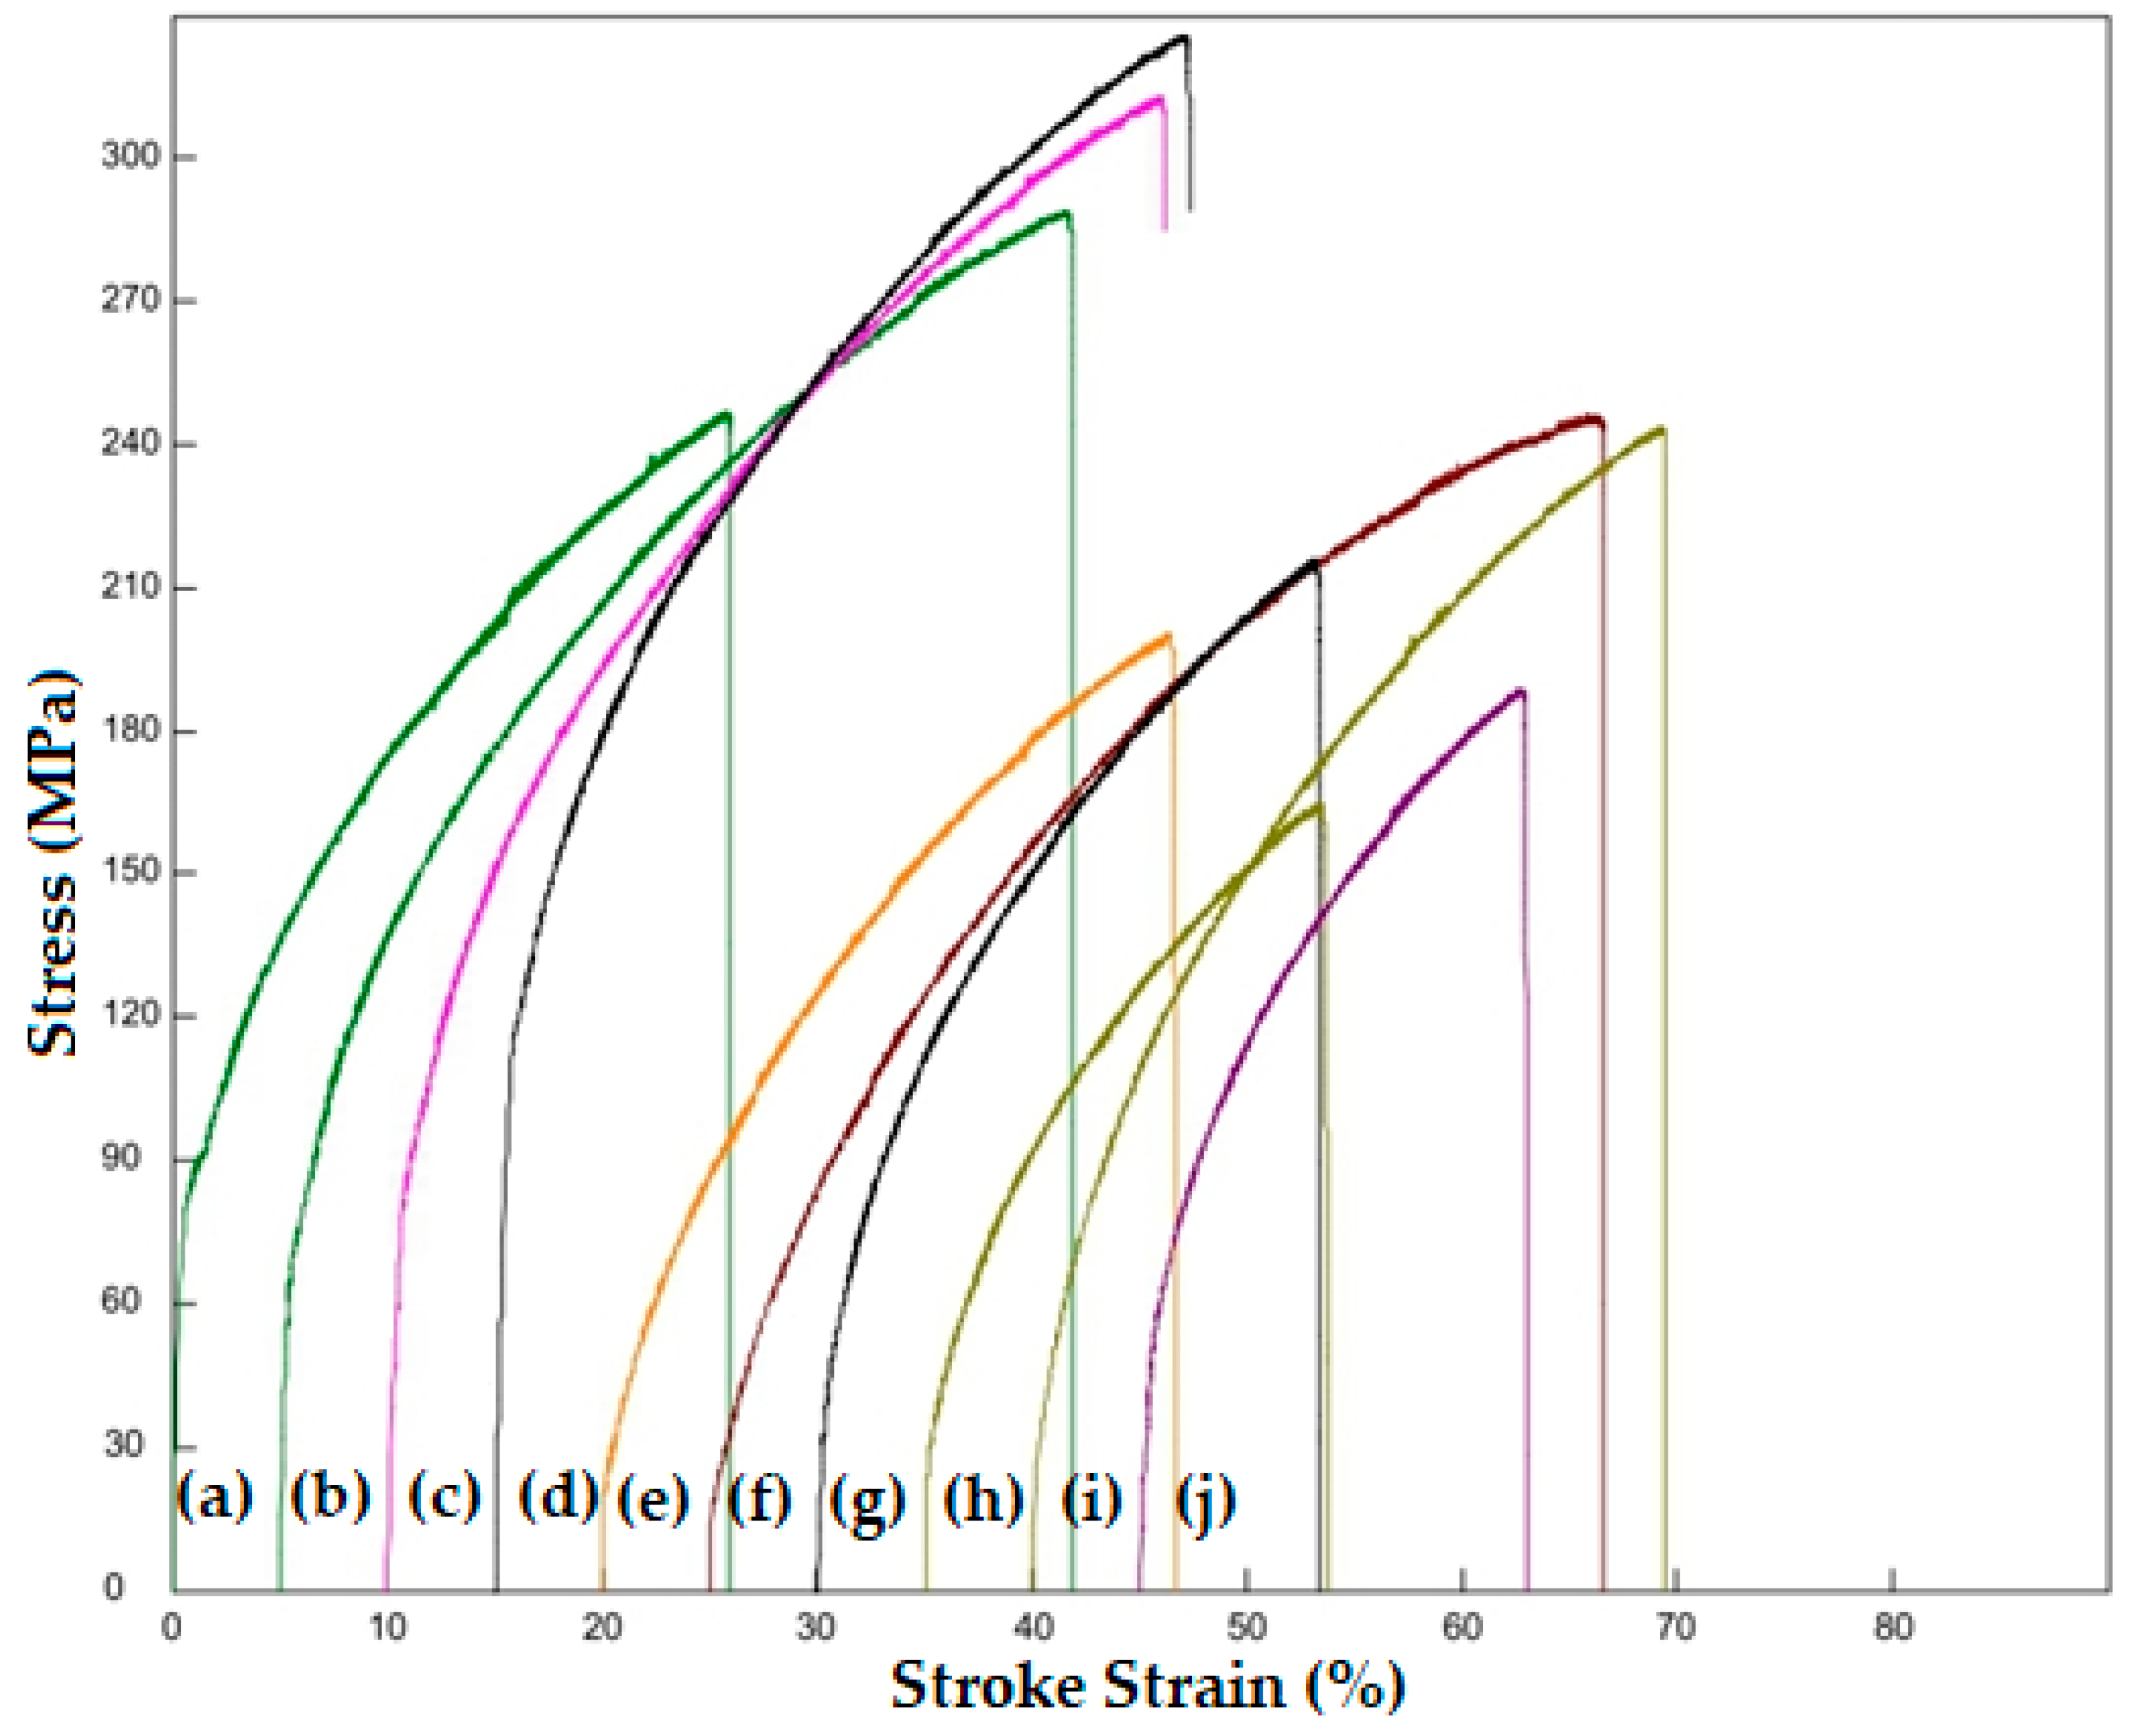
3.2. Evaluation of Mechanical Test Results

Figure 7 shows the tensile test curves for stainless steel 316 L before and after adding alloying elements (Ti-Mn), where it shows the yield point, the maximum stress, and the percentage of elongation for all samples.
When Figure 7 and Table 4 are examined, it is thought that this increase in tensile strength and hardness occurs through strength increasing mechanisms such as precipitate hardening with the formation of carbide, nitride and carbonitride precipitates on the matrix and refinement of grain size as seen in the microstructure pictures [21]. Moreover, an increase in tensile strength was observed when 0.35 wt % Ti and Mn were added. In Alloys II–III and IV, it was 290–314 and 327 MPa, respectively; that is, the tensile strength increased by 16.93–26.61 and 31.85%, respectively, compared to the original Alloy I (248 MPa). The effect of the alloy elements in the solid solution on the recrystallisation of austenite is very weak. The inhibition of the grain boundary movement by precipitated particles is much more effective than dissolved atoms [22]. The hardness of the austenite matrix in the produced material was approximately 97 HV; this is lower than the hardness of full density 316 L stainless steel and some similar samples [13,23]. However, the hardness values of the samples (Table 2) were comparable to some similar alloys. For example, Pandya et al. [24] investigated the effect of sintering temperature on the densification response and mechanical behavior of 316 L stainless steel. They reported that the hardness changed from 97 to 126 HV as the density increased from 83% to 90%. In another study, the measured hardness of PM 316 L stainless steel samples with 15.6% porosity were 160 HV; this was higher than the alloys studied [25]. Studies may report different hardness values due to process differences such as sintering temperature and sintering atmosphere. For example, 316 L stainless steel samples sintered in a nitrogen atmosphere exhibit higher hardness than those sintered in an argon or vacuum atmosphere [26]. The strength of 316 L stainless steel also increases significantly when the sintering atmosphere is changed from Ar to N2 [27].
The hardness of the alloys followed a parallel trend and increased with the addition of 0.35 wt % Ti, 0.35 wt % Mn, and 0.35 wt % Ti-Mn by weight. The presence of carbides, nitrides, or carbonitrides such as TiC, TiN, TiMnC(N), and TiMnCrC(N) can significantly affect the hardness of 316 L stainless steel [27]. Figure 4, Figure 5 and Figure 6 show a particle precipitated at the grain boundary. The transmission electron microscopy (TEM) thin foil examination of AISI 316 L steel revealed that the precipitates were M23C6 carbides in the temperature range of 500–900 °C, formed by heterogeneous nucleation at grain boundaries, twin boundaries, and dislocation networks within grains. [28]. The M23C6 carbides in this study were rich in chromium and had relatively low nickel and iron content. While the number of precipitates is affected by the addition of Ti and Mn, the main phase remains austenite and single and multiple additions of Ti and Mn do not alter the existing phases. According to the Schaeffler diagram [29] based on Cr and Ni content (austenite stabilizer), the primary phase of the produced material is still austenite.
When the percentage of Ti and Mn was increased to (0.75–1.5 wt %), there was a decrease in tensile strength, with the lowest value being 166 MPa in alloy VIII. That is, the tensile strength of Alloy VIII decreased by 33.06% compared to Alloy I, where no alloying element was added. In all compositions except Alloy 10, the percent elongation value is higher than Alloy I. However, when the alloying element addition was increased to 0.75 and 1.5 weight percent, a decrease in tensile strength and hardness values was observed.
This decrease in tensile strength and hardness values can be attributed to the increase in the size of the precipitates formed at the matrix and grain boundaries, the increase in the number of pores, and the increase in the grain size of the material, because large precipitates do not prevent the dislocation movement sufficiently compared to small precipitates. Grain boundaries, like precipitates, also inhibit dislocation movement. Likewise, coarse-grained materials have shorter grain boundaries. The decrease in grain boundary length resulted in a decrease in strength due to fewer obstacles to prevent dislocation movement. Another reason for the decrease in strength can be expressed as the increase in the number of pores in the material with the addition of alloying elements [30,31].
After the tensile test, fracture surface images of unalloyed PM, PM 316 L, and Ti-Mn added 316 L PM steel samples sintered at 1250 °C were taken. Figure 8 shows the fractured surface images. As seen in the SEM images of 316 L steel samples with different Ti-Mn contents (Figure 8), all of the fractured surfaces with pores exhibited partially ductile (honeycomb) and partially brittle (cleavage planes) structures. It was clearly seen that there were pores on all the broken surfaces. This shows that the fractures occur through the coalescence and propagation of microvoids.
Additionally, large voids were observed in alloyed 316 L steel samples containing 0.35–0.75 and 1.5 wt % Ti, Mn, and (Ti-Mn). These voids are indicative of the removal of precipitates such as TiC, TiN, MnC, MnN, and TiMnC(N) by pulling them under heavy tensile loading conditions. Shanmugasundaram and Chandramouli [32] found that such voids were formed on the fracture surfaces of powder metallurgy steel containing Cr, Ni, and Mo. This has been attributed to carbide formation and the detachment of carbide from the surface during heavy deformation. Figure 9 shows the fracture surface and point EDS results for Alloy VIII.
The EDS point analysis of the fracture surface of Alloy VIII reveals the presence of Cr-, Si-, and Mn-rich precipitates in the steel. This observation indicates the formation of precipitates like CrMnC, SiC, and CrMoC(N) in the steel during sintering or post-sintering cooling. These precipitates significantly influence the fracture surface morphology of the alloyed powder metallurgy steel.

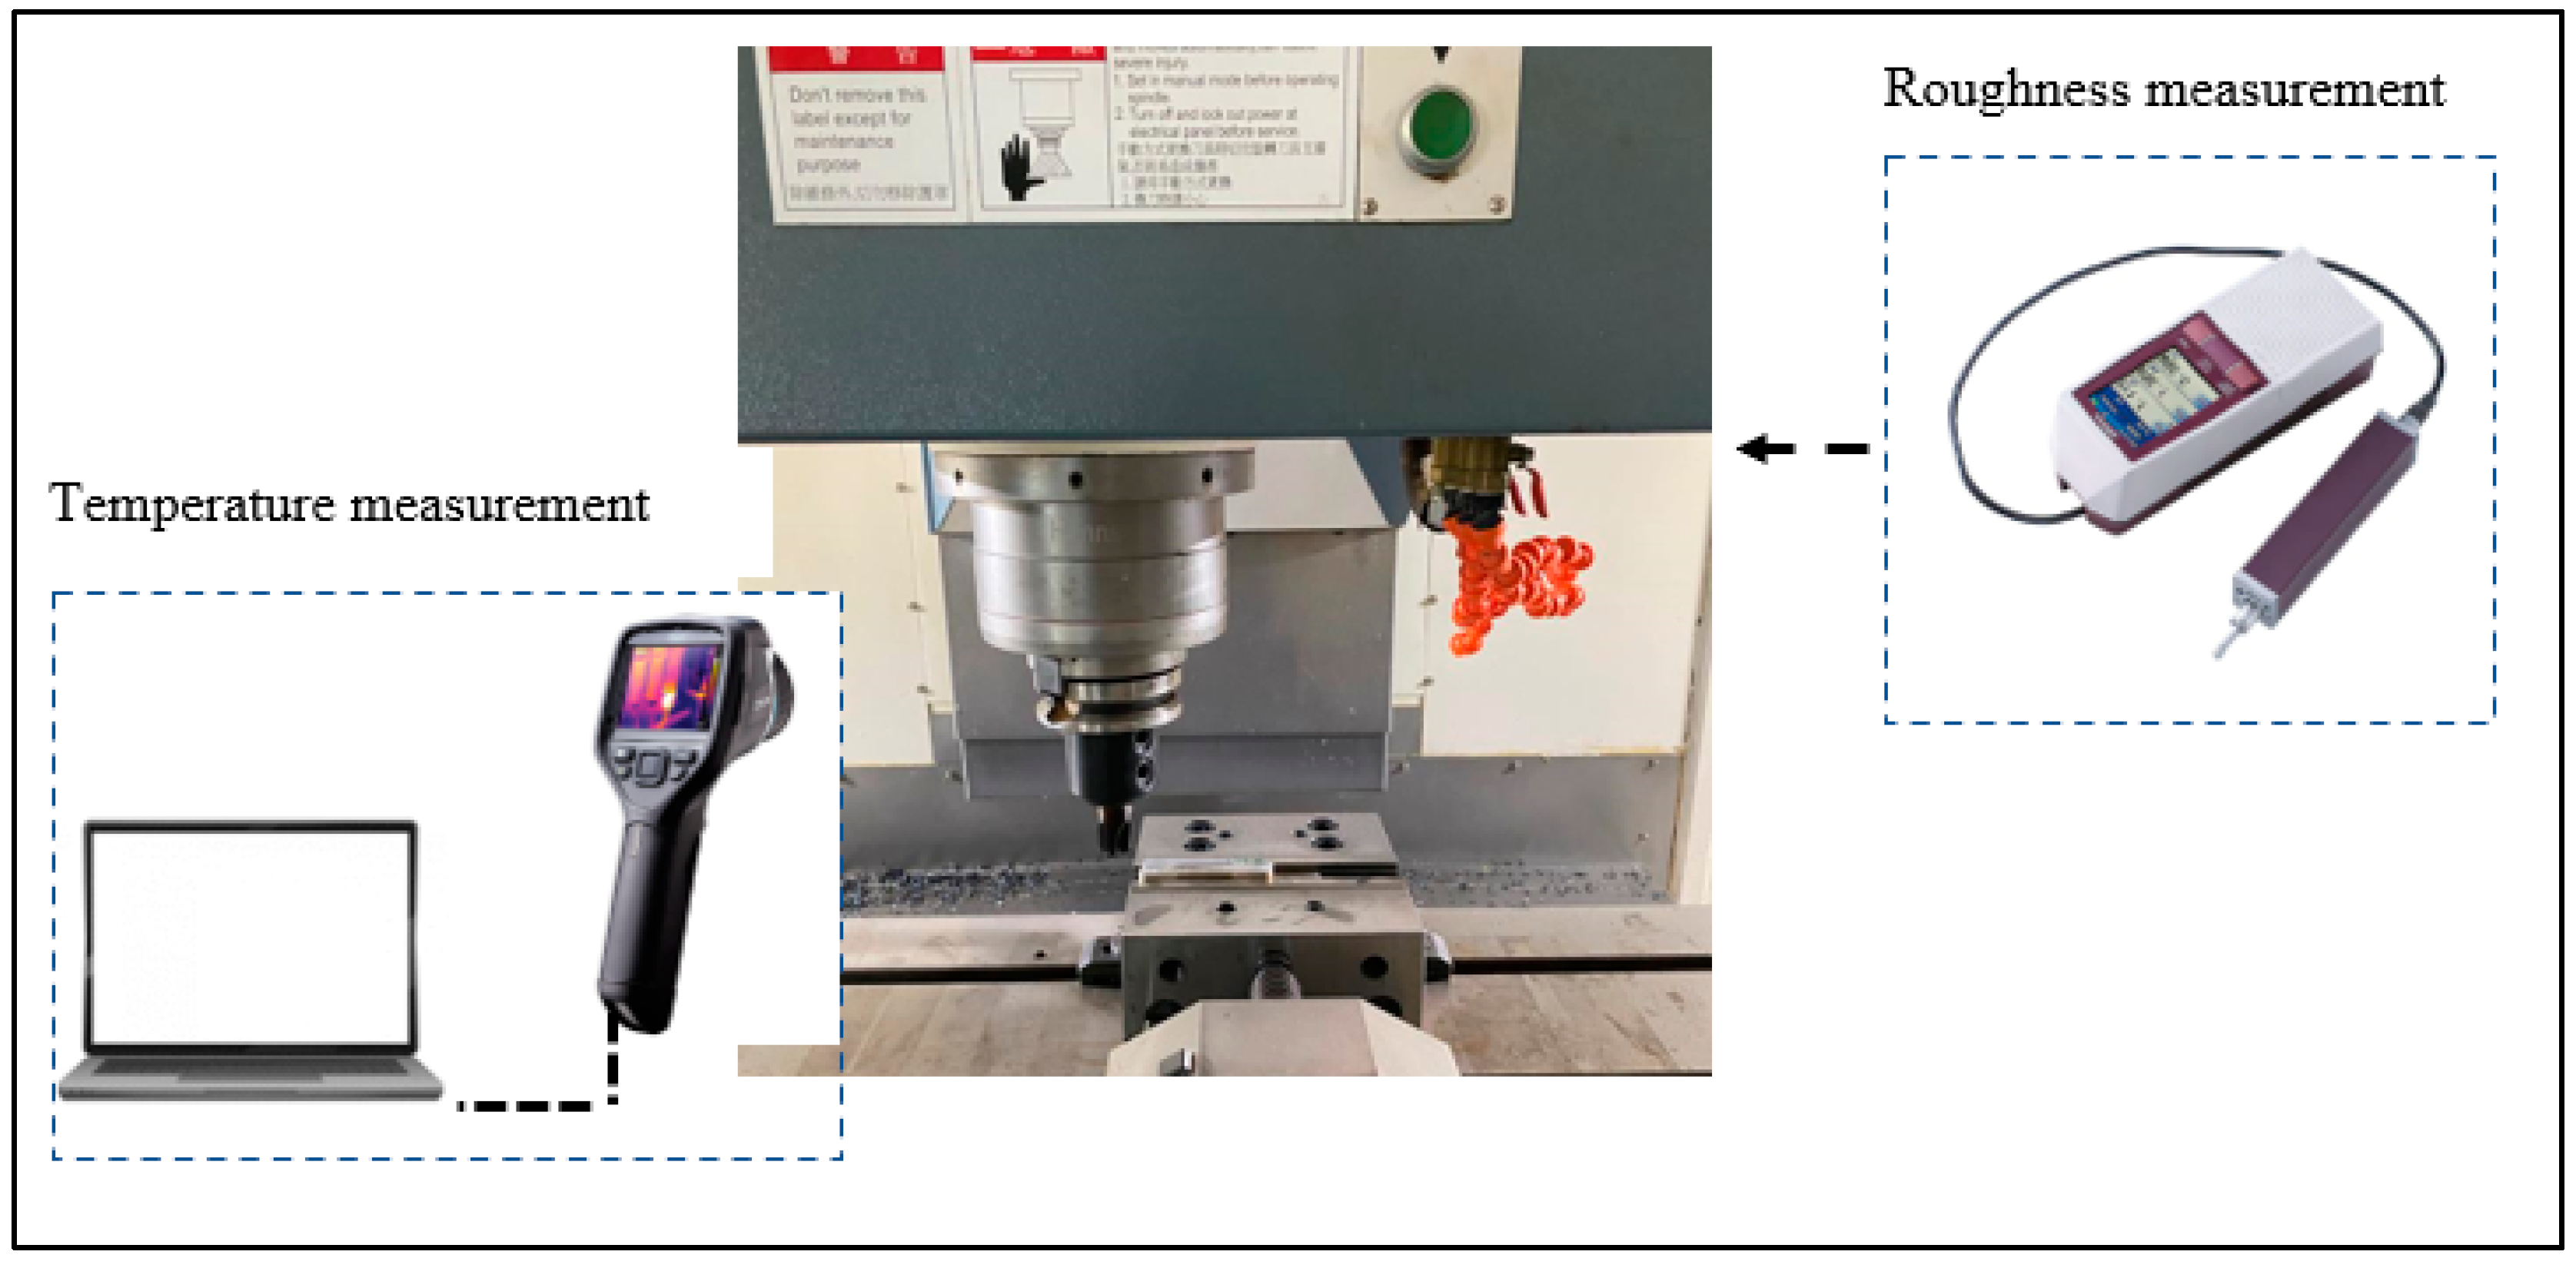
3.3. Evaluation of Milling Test Results

Surface quality plays a pivotal role in determining the functionality and efficiency of mechanical components [33]. Surface roughness (Ra) stands as a key parameter that provides insight into the characteristics of a machined surface. The surface roughness of a material during machining is notably affected by variations in machining parameters, such as cutting speed, feed rate, and depth of cut [34]. Figure 10 illustrates the alterations in surface roughness obtained as a result of the experimental investigation. These values represent the averages of three measurements.
Upon examination of Figure 10, it is evident that the highest surface roughness value is consistently observed at a cutting speed of 150 m/min across all samples. Analyzing the measurements taken from tests conducted on all samples (Alloy I-X), we observe a reduction in Ra of 27.27%, 25.80%, 24.87%, 39.53%, 25.02%, 18.91%, 20.97%, 31.22%, 30.33%, and 10.71% as the cutting speed increases from 150 to 225 m/min, respectively. A 100% increase in the cutting speed results in a Ra reduction of 41.21%, 44.51%, 35.02%, 54.65%, 38.63%, 39.72%, 36.58%, 45.26%, 40.07%, and 8.92% across all samples. The trend across all samples (Alloy I-X) is a decrease in Ra as the cutting speed rises. This trend may be attributed to the reduction in the tool–chip contact area and the diminishing shear strength of the material due to the increased temperature with higher cutting speeds [6,35].
When examining the results regarding the influence of alloying elements on surface roughness, it becomes evident that alloys with 0.35% Ti and Mn additions (Alloys II, III, and IV) exhibit lower surface roughness values than Alloy I. Specifically, Alloy IV demonstrates approximately 34.09%, 31.85%, and 37.11% improvements in yield strength, maximum tensile strength, and hardness when compared to Alloy I. In terms of surface quality, Alloy IV performs approximately 153.84% better. The highest Ra value, 2.85 μm, is observed in the milling of Alloy VIII at a cutting speed of 150 m/min, whereas the lowest surface roughness value, 0.390 µm, is measured in the machining of Alloy IV at a cutting speed of 300 m/min. It is noteworthy that when Ti and Mn additions exceed 0.35 wt % (Alloys V–X), the average roughness of the machined surface increases due to an accumulation of added alloying elements, i.e., (TiC(N), MnC(N), and TiMnC(N) that accumulate at the grain boundaries, leading to the formation of large pores and resulting in increased surface roughness after the milling process.
Figure 11 illustrates the temperature distribution within the cutting zone during the processing of all samples. The bar graphs clearly indicate that, for all samples, the highest cutting temperature is observed at the highest cutting speed, while conversely, the lowest cutting temperature is recorded at the lowest cutting speed. There is a tendency for cutting temperature to increase with the rise in cutting speed. The temperature values exhibit an approximate 56% increase with a 50% increase in cutting speed (Vc, m/min), while this rate of increase decreases to about 32% with a 100% increase in cutting speed (Vc, m/min).
Cutting speed plays a pivotal role in heat generation during machining. The chips serve as a means to efficiently dissipate a substantial portion of the heat generated in the machining process away from the cutting zone. Consequently, the performance of cutting tools is influenced by the extent of contact between the chip and the tool. An escalation in cutting speed results in a proportional increase in the contact length between the chip and the cutting tool, consequently leading to an elevation in cutting temperature [36].

4. Conclusions

In this study, the effect of adding Ti and Mn elements to a 316 L stainless steel alloy produced using the powder metallurgy method was studied under cold pressure (750 MPa) and sintering temperature (1250 °C) for two hours in an argon atmosphere, and the following results were obtained:
  • When Ti and Mn (0.35 wt %) are added by weight to the original steel alloy without additives, the tensile strength, yield strength, and hardness of the steel alloy increase because the elements precipitate formation, and these precipitates prevent grain growth.
  • When Ti and Mn are added together at the same weight percentage (0.35 wt %), better properties are obtained than when Ti or Mn are added via monotherapy, because when the two elements TiC(N) are added together, all kinds of precipitates are formed, namely, MnC(N) and TiMnC(N), which prevents the expansion of boundaries during recrystallization and sintering.
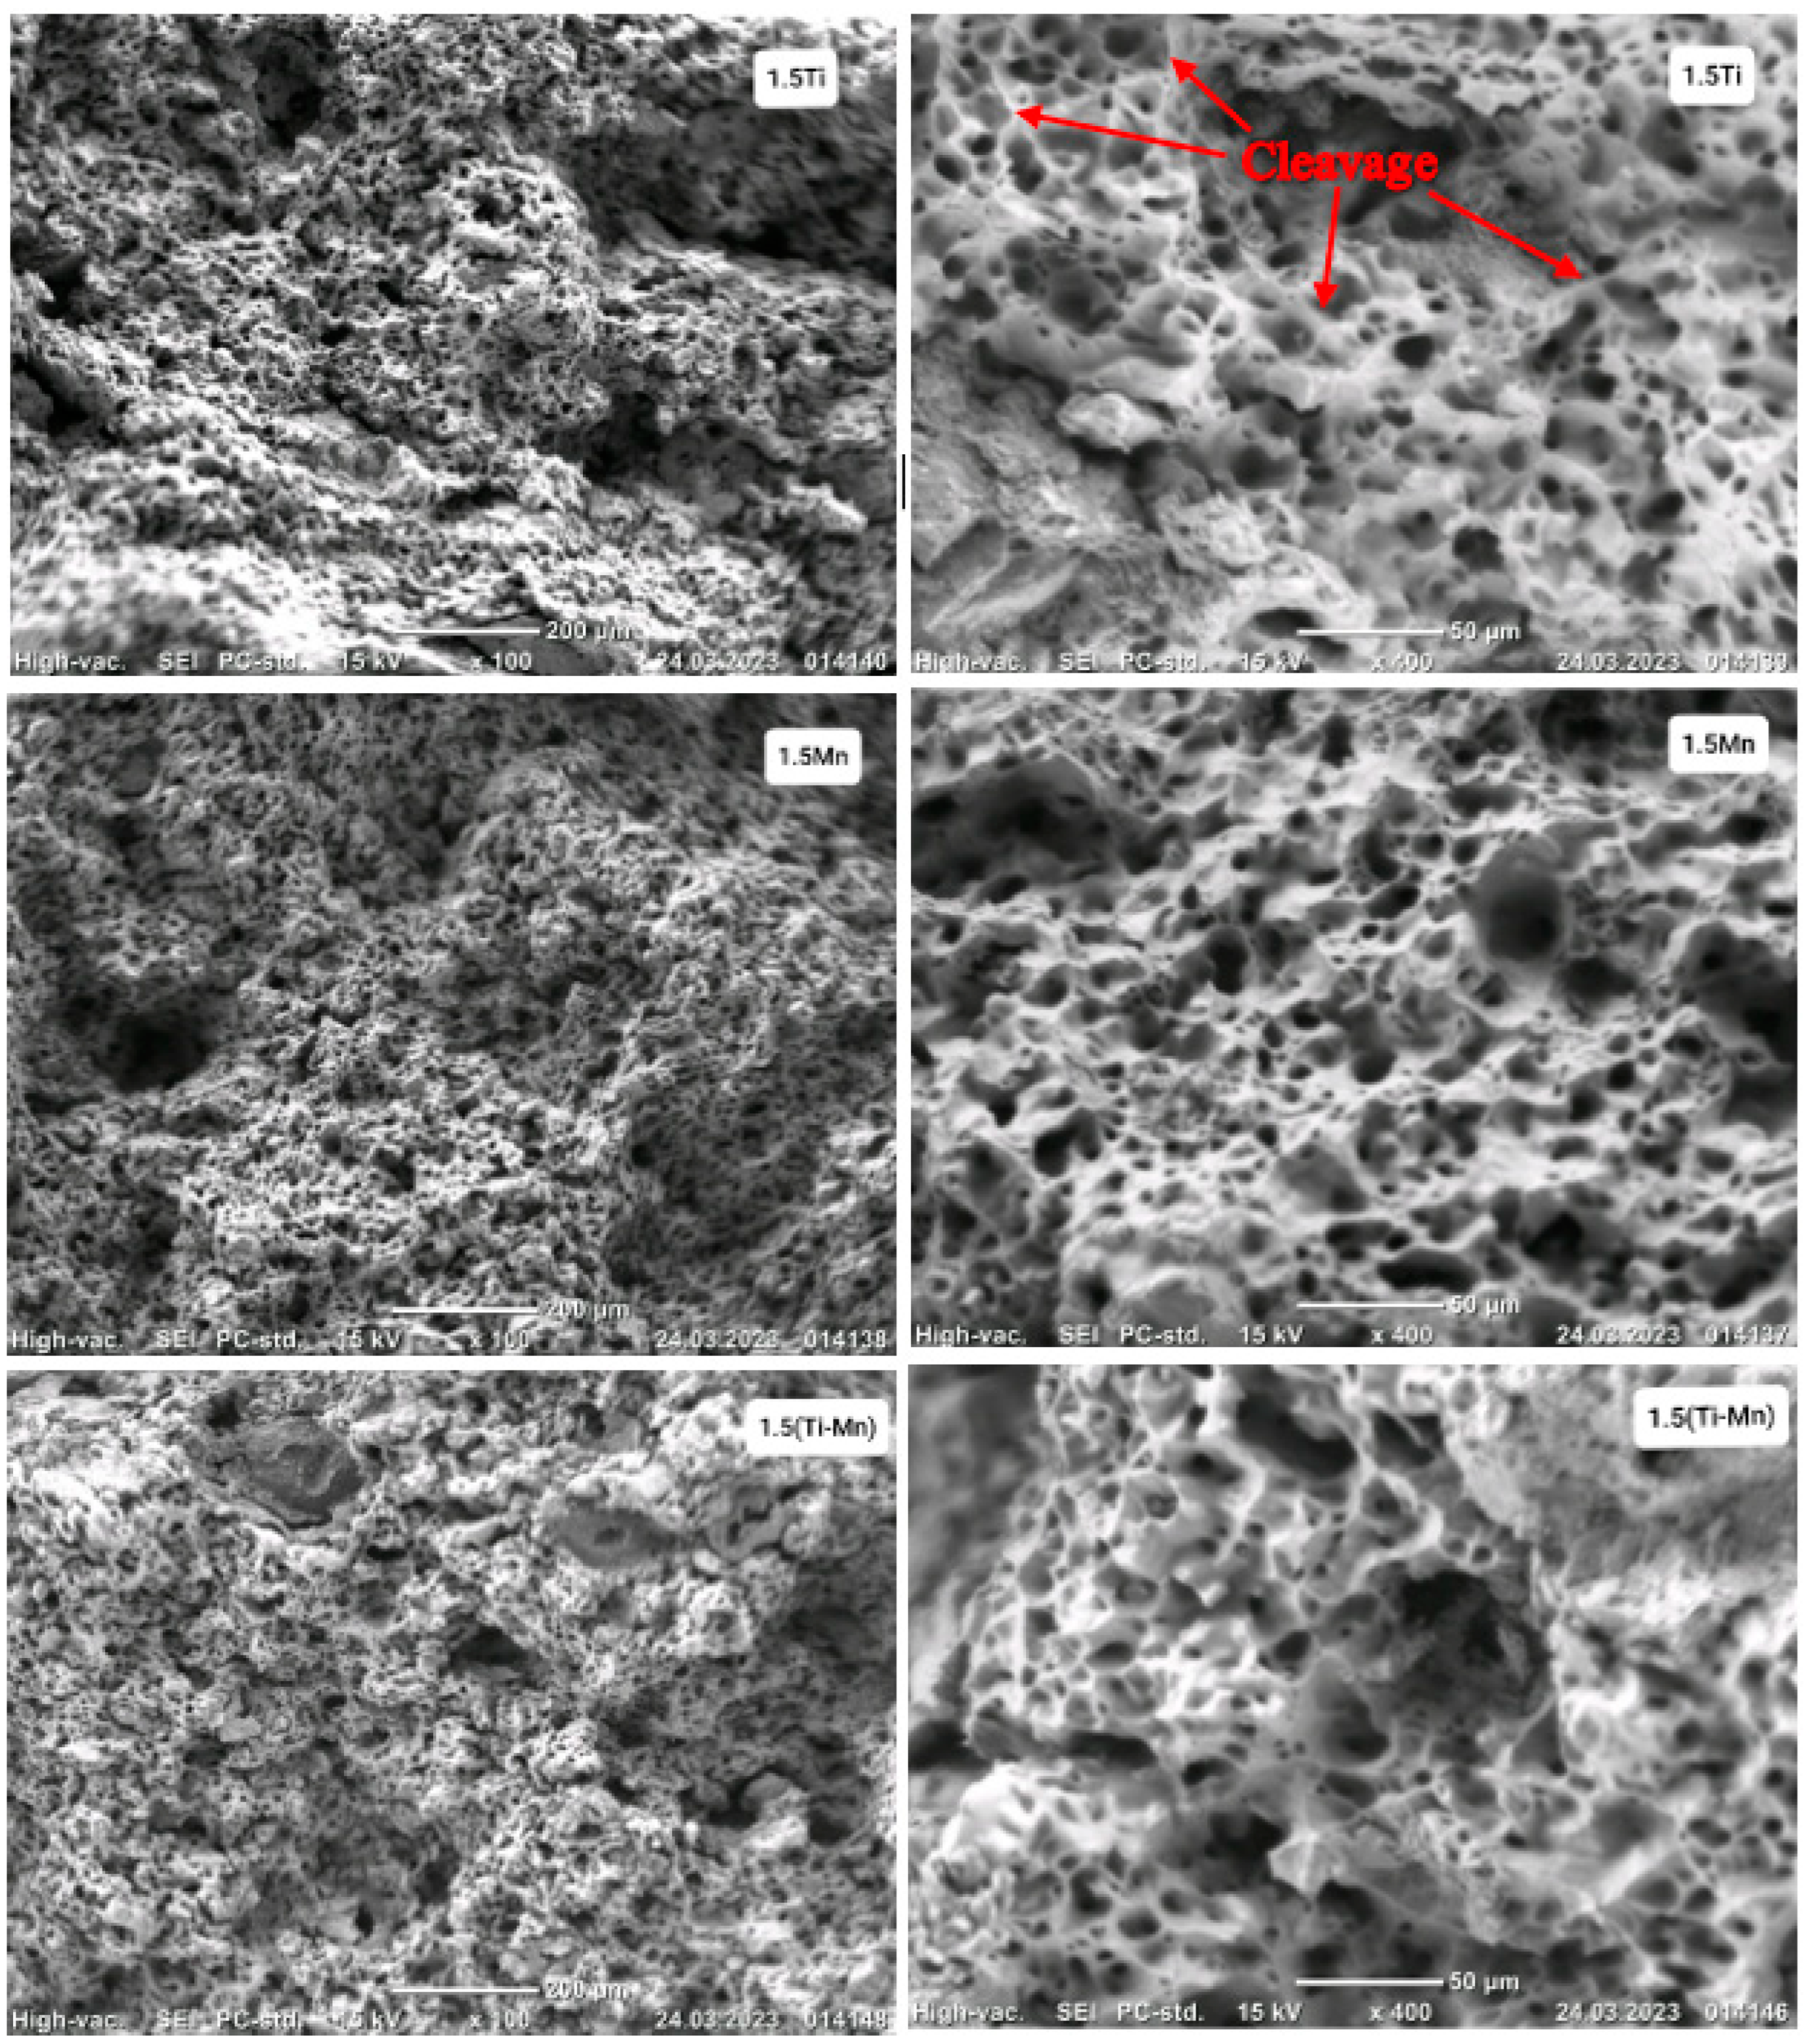
  • When the weight percent of Ti and Mn is increased above (0.35 wt %), a decrease in mechanical properties is observed, which is thought to cause the fragility of the microstructure and weak mechanical properties due to the excessive deposition of carbide and nitride in the grain boundaries of alloying elements. The higher the percentage of Ti and Mn added, the more noticeable the increase in relative porosity due to the deposition of carbides and nitrides of titanium and manganese at the grain boundaries and the formation of microscopic voids in the crystalline structure.
  • In order to precipitate all carbide and nitrate forms of TiC(N) alloying elements, when Ti and Mn are added at the rate of 0.35 wt % in the alloy where Ti and Mn are added together, the grain size decreases. Such precipitates inhibit the dislocation movement and cause an increase in mechanical properties such as yield strength, tensile strength, and hardness.
  • When Mn was added at a rate higher than 0.35 wt %, it was noticed that the tensile strength remained almost the same, but the yield strength decreased by almost half compared to the original alloy that did not contain the additive. This is because the percentage of sediment formed by manganese (Mn) was much smaller than the percentage of sediment formed by titanium (Ti), according to what was observed via EDS analysis, and as large amounts of MnC(N) do not accumulate on the grain boundaries, its negative impact on the mechanical properties is less.
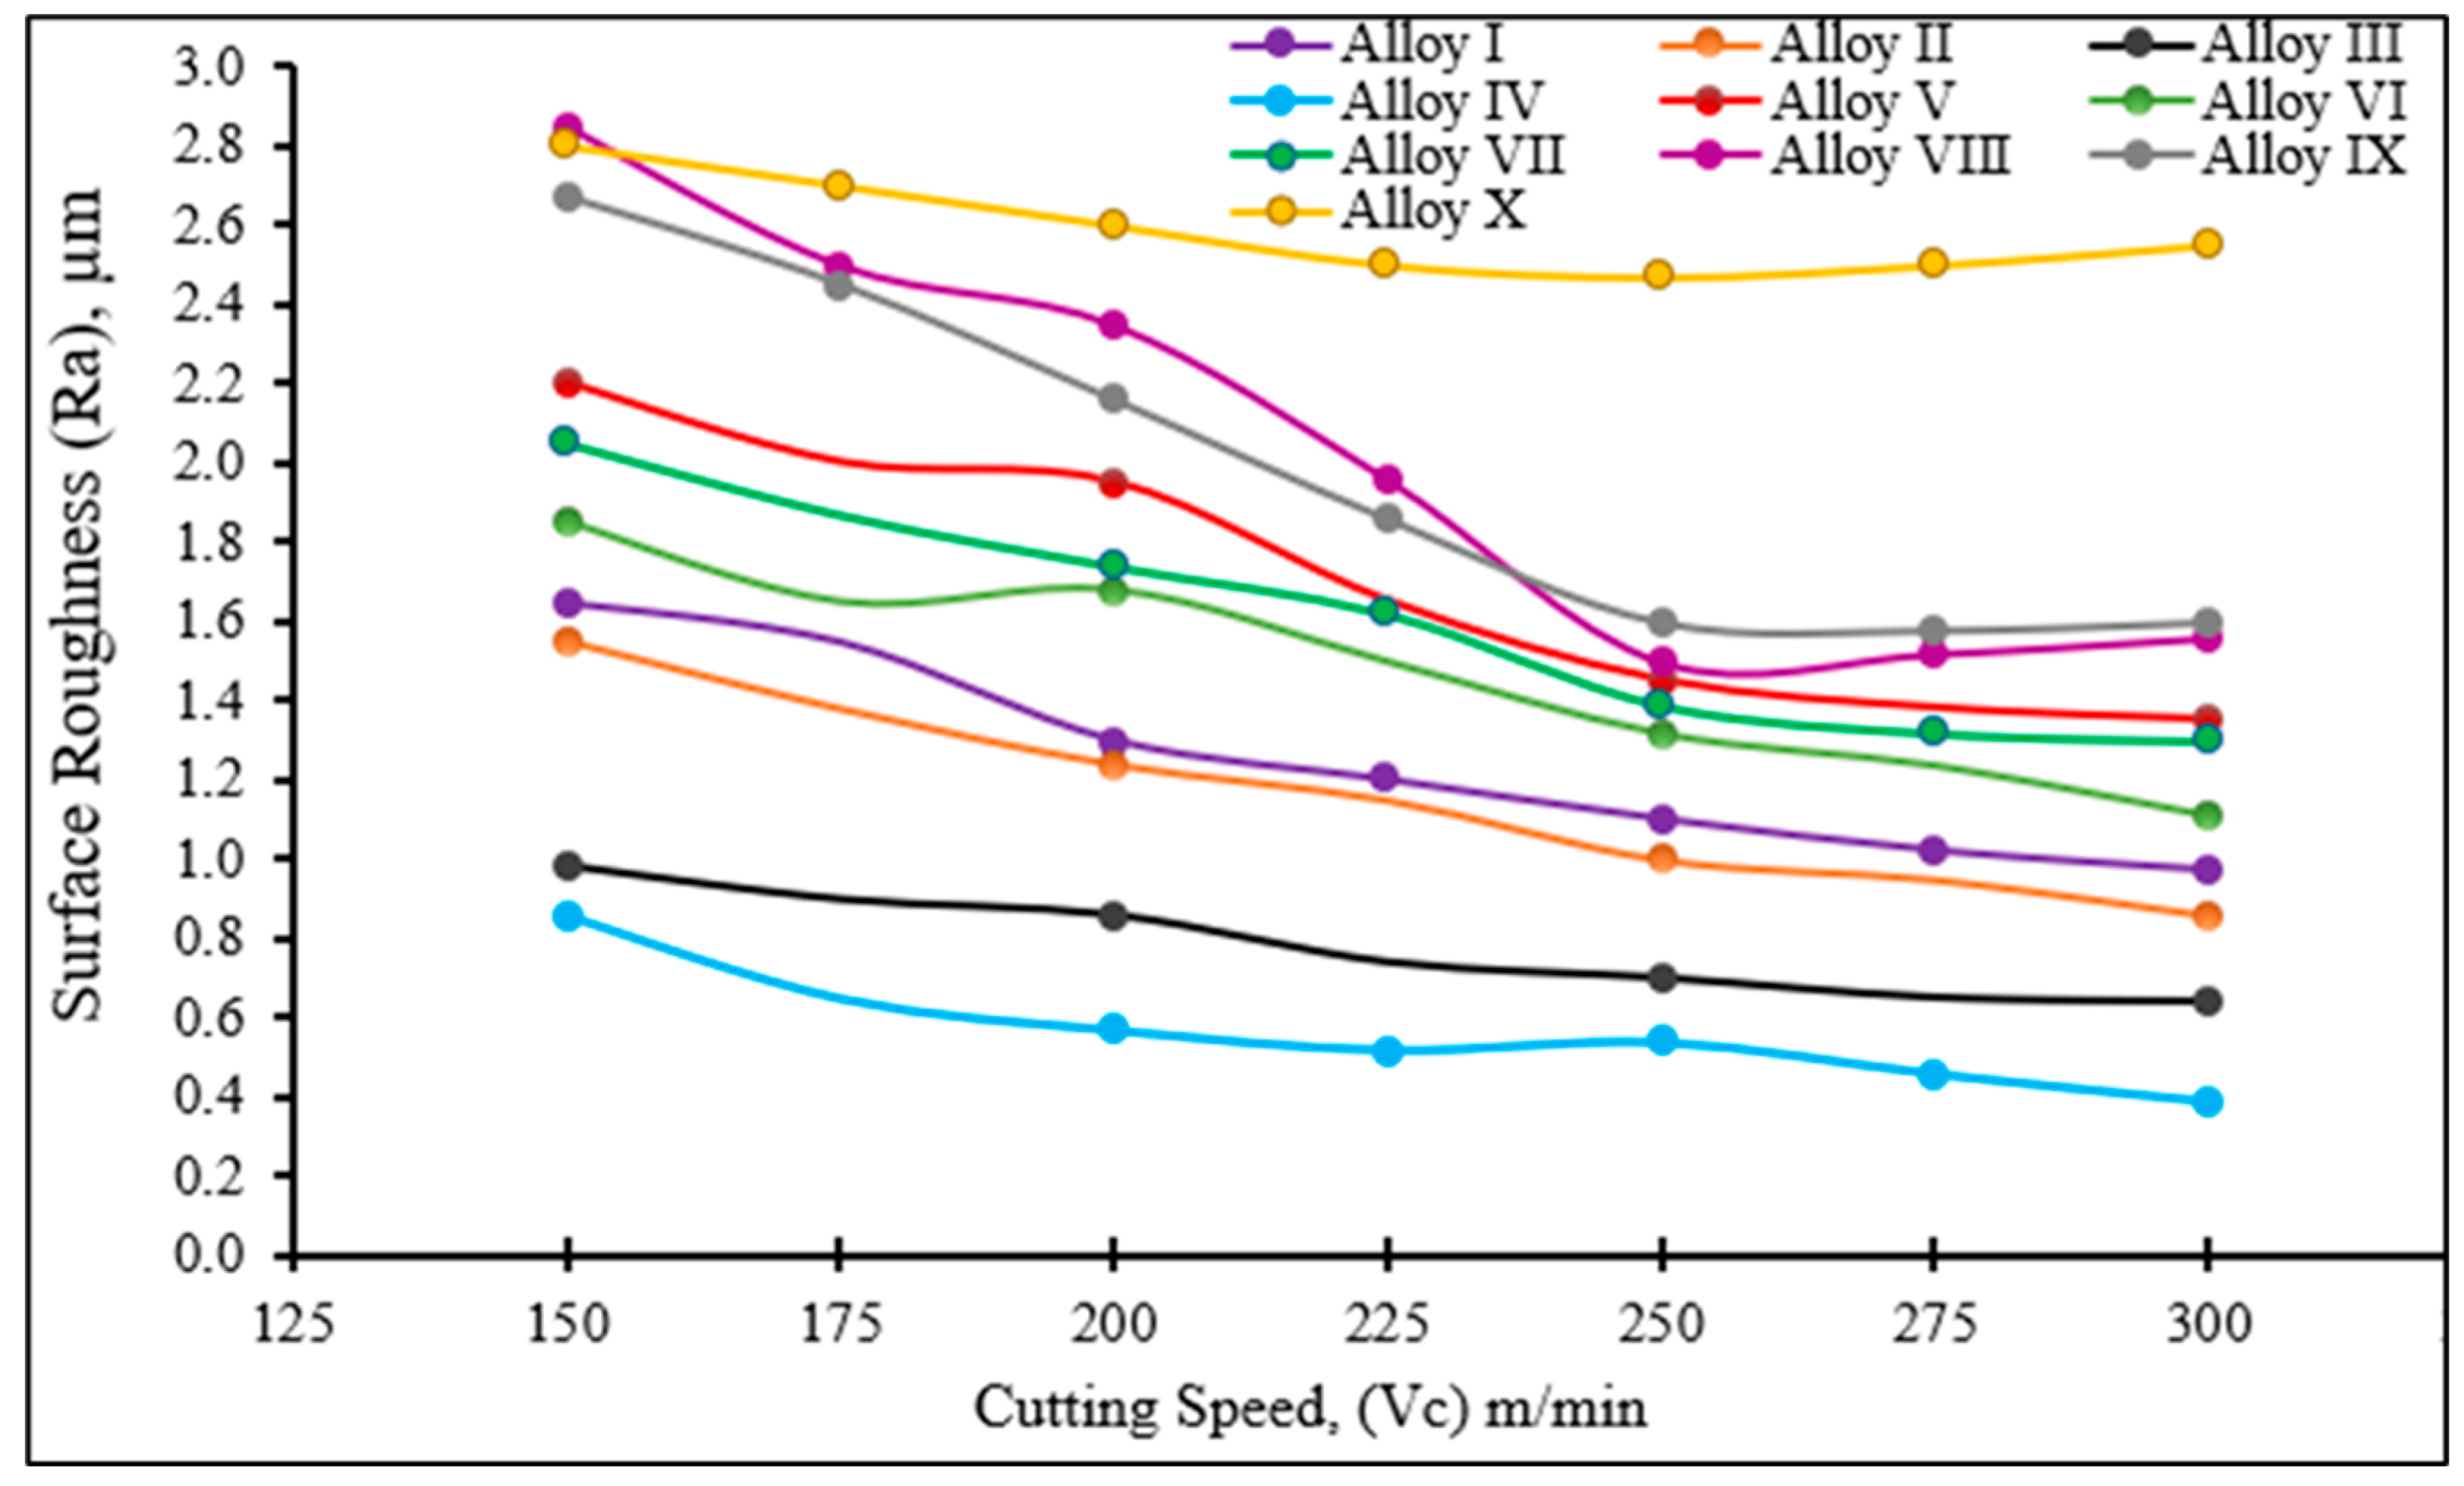
  • It was seen that the Ra values decreased with increasing cutting speed.
  • When Ti and Mn are added at 0.35 wt % to stainless steel 316 L and the milling process is applied, the average surface roughness (Ra) decreases due to the ease of extracting chips when the tensile strength and yield strength increase and the ductility decreases.
  • Ti and Mn were added at percentages higher than 0.35 wt % and the milling process was applied to the alloys; an increase in the average surface roughness (Ra) was noticed because the sediment accumulates at the grain boundaries and forms large pores.
  • When the cutting speed was increased in all samples, the cutting temperature increased due to the increase in the contact length between the cutting tool and the chips.

Author Contributions

M.T., A.M.T., M.A. and M.A.E. designed the experiments; M.T., A.M.T., M.A. and M.A.E. performed the experiments. M.T., A.M.T., M.A. and M.A.E. analyzed the data and wrote the paper. M.T., A.M.T., M.A. and M.A.E. directed the research and contributed to the discussion and interpretation of the results. All authors have read and agreed to the published version of the manuscript.

Funding

This work was supported by the Scientific Research Projects Coordination Unit of Karabuk University (Project No: KBÜBAP-22-DS-061).

Data Availability Statement

Not applicable.

Acknowledgments

The authors would like to thank the Scientific Research Projects Coordination Unit of Karabuk University (Project No: KBÜBAP-22-DS-061) for supporting this research work.

Conflicts of Interest

The authors declare no conflict of interest.

References

  1. German, R.M. Powder Metallurgy of Iron and Steel; John Wiley & Sons, Inc.: New York, NY, USA, 1998. [Google Scholar]
  2. German, R.M. Powder Metallurgy & Particulate Materials Processing; Metal Powder Industry Federation: Princeton, NJ, USA, 2005. [Google Scholar]
  3. Trent, E.M.; Wright, P.K. Metal Cutting: Theory and Application; Butterwort Heinemann: Auckland, New Zealand, 2000. [Google Scholar]
  4. Groover, M.P. Fundamentals of Modern Manufacturing: Materials, Processes and Systems; John Wiley & Sons: Hoboken, NJ, USA, 2020. [Google Scholar]
  5. Black, J.T.; Kohser, R.A. DeGarmo’s Materials and Processes in Manufacturing, 13th ed.; John Wiley & Sons: Hoboken, NJ, USA, 2020. [Google Scholar]
  6. Jawaid, A.; Koksal, S.; Sharif, S. Cutting performance and wear characteristics of PVD coated and uncoated carbide tools in face milling Inconel 718 aerospace alloy. J. Mater. Process. Technol. 2001, 116, 2–9. [Google Scholar] [CrossRef]
  7. Llewellyn, D.T.; Hudd, R.C. Steels: Metallurgy and Applications, 3rd ed.; Reed Educational and Professional Publishing Ltd.: Oxford, UK, 1998; pp. 15–40. [Google Scholar]
  8. Iversen, A.; Leffler, B. Aqueous Corrosion of Stainless Steels. In Shreir’s Corrosion; Elsevier: Amsterdam, The Netherlands, 2010. [Google Scholar]
  9. Ashraf, M.; Gardner, L.; Nethercot, D.A. Compression strength of stainless steel cross-sections. J. Constr. Steel Res. 2006, 62, 105–115. [Google Scholar] [CrossRef]
  10. Novak, C.J. Handbook of Stainless Steels; Peckner, D., Bernstein, I.M., Eds.; McGraw-Hill: New York, NY, USA, 1977. [Google Scholar]
  11. Ertenli, M.F.; Erdal, E.; Buyukkaragoz, A.; Kalkan, I.; Aksoylu, C.; Özkılıç, Y.O. Lateral torsional buckling of doubly-symmetric steel cellular I-Beams. Steel Compos. Struct. 2023, 46, 709–718. [Google Scholar] [CrossRef]
  12. Gulsoy, H.O.; Pazarlioglu, S.; Gulsoy, N.; Gundede, B.; Mutlu, O. Effect of Zr, Nb and Ti addition on injection molded 316L stainless steel for bio-applications: Mechanical, electrochemical and biocompatibility properties. J. Mech. Behav. Biomed. Mater. 2015, 51, 215–224. [Google Scholar] [CrossRef]
  13. Ali, S.; Irfan, M.; Niazi, U.M.; Rani, A.M.A.; Rashedi, A.; Rahman, S.; Trefil, A. Microstructure and mechanical properties of modified 316L stainless steel alloy for biomedical applications using powder metallurgy. Materials 2022, 15, 2822. [Google Scholar] [CrossRef] [PubMed]
  14. Albahlol, O.A.A.; Elkilani, R.; Çuğ, H.; Erden, M.A.; Özmen, R.; Esen, I. Investigation of microstructure and mechanical properties of layered material produced by adding Al2O3 to 316L stainless steel. Metals 2023, 13, 1226. [Google Scholar] [CrossRef]
  15. ASTM E8/E8M; Standard Test Methods for Tension Testing of Metallic Materials ASTM E8/E8M. American Society for Testing and Material: West Conshohocken, PA, USA, 2013.
  16. ISO 4287; Geometrical Product Specifications (GPS)—Surface Texture: Profile Method—Terms, Definitions and Surface Texture Parameters. ISO: Geneva, Switzerland, 1982.
  17. Schramm, R.E.; Reed, R.P. Stacking fault energies of seven commercial austenitic stainless steels. Metall. Trans. A 1975, 6, 1345–1351. [Google Scholar] [CrossRef]
  18. Chowdhury, S.G.; Das, S.; De, P.K. Cold rolling behaviour and textural evolution in AISI 316L austenitic stainless steel. Acta Mater. 2005, 53, 3951–3959. [Google Scholar] [CrossRef]
  19. Fang, K.; Luo, K.; Wang, L. Effect of microstructure on mechanical properties of 316 LN austenitic stainless steel. Coatings 2022, 12, 1461. [Google Scholar] [CrossRef]
  20. Ertugrul, O.; Park, H.S.; Onel, K.; Willert-Porada, M. Effect of particle size and heating rate in microwave sintering of 316L stainless steel. Powder Technol. 2014, 253, 703–709. [Google Scholar] [CrossRef]
  21. Erden, M.A.; Uzun, F.G.; Akgün, M.; Gökçe, H. Influence of Ti and Nb addition on the microstructure, mechanical, and machinability properties of 316L stainless steel fabricated by powder metallurgy. Mater. Test. 2023, 65, 1237–1253. [Google Scholar] [CrossRef]
  22. Paital, S.R.; Dahotre, N.B. Wettability and kinetics of hydroxyapatite precipitation on a laser-textured Ca–P bioceramic coating. Acta Biomater. 2009, 5, 2763–2772. [Google Scholar] [CrossRef]
  23. Becker, B.S.; Bolton, J.D.; Eagles, A.M. Sintering of 316L stainless steels to high density via the addition of chromium—Molybdenum dibromide powders Part 1: Sintering performance and mechanical properties. Proc. Inst. Mech. Eng. Part L 2000, 214, 139–152. [Google Scholar] [CrossRef]
  24. Pandya, S.; Ramakrishna, K.S.; Annamalai, A.R.; Upadhyaya, A. Effect of sintering temperature on the mechanical and electrochemical properties of austenitic stainless steel. Mater. Sci. Eng. A 2012, 556, 271–277. [Google Scholar] [CrossRef]
  25. Uzunsoy, D. Investigation of dry sliding wear properties of boron doped powder metallurgy 316L stainless steel. Mater. Des. 2010, 31, 3896–3900. [Google Scholar] [CrossRef]
  26. Dewidar, M. Influence of processing parameters and sintering atmosphere on the mechanical properties and microstructure of porous 316L stainless steel for possible hard-tissue applications. Int. J. Mech. Mech. Eng. 2012, 12, 10–24. [Google Scholar]
  27. Rawers, J.; Croydon, F.; Krabbe, R.; Duttlinger, N. Tensile characteristics of nitrogen enhanced powder injection moulded 316L stainless steel. Powder Metall. 1996, 39, 125–129. [Google Scholar] [CrossRef]
  28. Sahlaoui, H.; Makhlouf, K.; Sidhom, H.; Philibert, J. Effects of ageing conditions on the precipitates evolution, chromium depletion and intergranular corrosion susceptibility of AISI 316L: Experimental and modeling results. Mater. Sci. Eng. A 2004, 372, 98–108. [Google Scholar] [CrossRef]
  29. Schaeffler, A. Constitution diagram for stainless steel weld metal. Met. Prog. 1949, 56, 680. [Google Scholar]
  30. Kurt, B.; Özdoğan, L.; Güney, B.; Bölükbaşı, Ö.S.; Günen, A. Characterization and wear behavior of TiBC coatings formed by thermo-reactive diffusion technique on AISI D6 steel. Surf. Coat. Technol. 2020, 385, 497–508. [Google Scholar] [CrossRef]
  31. Guldibi, A.S.; Demir, H. Aging effect on microstructure and machinability of Corrax steel. Eng. Technol. Appl. Sci. Res. 2020, 10, 5168–5174. [Google Scholar] [CrossRef]
  32. Shanmugasundaram, D.; Chandramouli, R. Tensile and impact behaviour of sinter-forged Cr, Ni and Mo alloyed PM steels. Mater. Des. 2009, 30, 3444–3449. [Google Scholar] [CrossRef]
  33. de Campos Carolo, L.; Ordoñez, R.E.C. A review on the influence of process variables on the surface roughness of Ti-6Al-4V by electron beam powder bed fusion. Addit. Manuf. 2022, 59, 103103. [Google Scholar] [CrossRef]
  34. Arbizu, I.P.; Pérez, C.J.L. Surface roughness prediction by factorial design of experiments in turning processes. J. Mater. Process. Technol. 2003, 143–144, 390–396. [Google Scholar] [CrossRef]
  35. Abbas, A.T.; Pimenov, D.Y.; Erdakov, I.N.; Mikolajczyk, T.; El Danaf, E.A.; Taha, M.A. Minimization of turning time for high strength steel with a given surface roughness using the Edgeworth–Pareto optimization method. Int. J. Adv. Manuf. Technol. 2017, 93, 2375–2392. [Google Scholar] [CrossRef]
  36. Kıvak, T.; Sarıkaya, M.; Yıldırım, Ç.V.; Şirin, Ş. Study on turning performance of PVD TiN coated Al2O3+ TiCN ceramic tool under cutting fluid reinforced by nano sized solid particles. J. Manuf. Process. 2020, 56, 522–539. [Google Scholar] [CrossRef]
Figure 1. Schematic representation of powder metallurgy production stages.
Metals 13 01804 g001
Figure 2. Schematic representation of milling experiments.
Metals 13 01804 g002
Figure 3. Optical microscope images of samples produced by the PM method before and after adding Ti and Mn (500×).
Metals 13 01804 g003
Figure 4. SEM and spot EDS results from Alloy I.
Metals 13 01804 g004
Figure 5. SEM image and EDS points for Alloy X.
Metals 13 01804 g005
Figure 6. SEM image and EDS for Alloy I (a) and Alloy X (b).
Metals 13 01804 g006
Figure 7. Tensile curves of 316 L PM steels containing different ratios of Ti-Nb (a—16 L; b—16 L + 0.35 Ti; c—16 L + 0.35 Mn; d—16 L + 0.35 (Ti + Mn); e—16 L + 0.75 Ti; f—16 L + 0.75 Mn; g—16 L + 0.75 (Ti + Mn); h—16 L + 1.5 Ti; i—16 L + 1.5 Mn; j—16 L + 1.5 (Ti + Mn)).
Metals 13 01804 g007
Figure 8. Fractured surface images of samples (100×–400×).
Metals 13 01804 g008aMetals 13 01804 g008bMetals 13 01804 g008c
Figure 9. Fracture surface (1000×) and point EDS results for Alloy VIII.
Metals 13 01804 g009
Figure 10. Surface roughness assessment.
Metals 13 01804 g010
Figure 11. Cutting temperature assessment.
Metals 13 01804 g011
Table 1. Powders and their properties.
Elemental PowdersPowder Size (µm)Density (g/cm3)Purity Value %Company
316 L<149 7.9599.9Höganas
Ti454.5499.9Aldrich
Mn457.4399.9Aldrich
Table 2. The samples and their composition.
No.Alloy NameTi (wt %)Mn (wt %)316 L (wt %)
Alloy I316 L 0.17100
Alloy II316 L + 0.35 Ti0.35 99.65
Alloy III316 L + 0.35 Mn 0.3599.65
Alloy IV316 L + 0.35 (Ti + Mn)0.350.3599.30
Alloy V316 L + 0.75 Ti0.75 99.25
Alloy VI316 L + 0.75 Mn 0.7599.25
Alloy VII316 L + 0.75 (Ti + Mn)0.750.7598.50
Alloy VIII316 + 1.5 Ti1.5 98.50
Alloy IX316 + 1.5 Mn 1.598.5
Alloy X316 L + 1.5 (Ti + Mn)1.51.597
Table 3. Relative density, relative porosity, and average grain dimension of the samples after the sintering process.
No.AlloyTheoretical Density
(g/cm3)
Density after Sintering (g/cm3)Relative Density
%
Relative
Porosity
%
Average Grain
Dimensions
µm
I316 L7.957.30991.93728.062821.25
II316 L + 0.35 Ti7.93787.206990.79229.207820.45
III316 L + 0.35 Mn7.94817.317992.07117.928919.46
IV316 L + 0.35 (Mn + Ti)7.936197.212790.88369.116419.01
V316 L + 0.75 Ti7.924427.118389.827410.172623.66
VI316 L + 0.75 Mn7.94617.214090.78669.213323.3
VII316 L + 0.75 (Mn + Ti)7.92047.145090.21019.789924.12
VIII316 L + 1.5 Ti7.89856.959688.112911.887131.51
IX316 L + 1.5 Mn7.94227.065488.960211.039723.43
X316 L + 1.5 (Mn + Ti)7.891056.942887.983212.016828.38
Table 4. Mechanical properties of 316 L PM steels containing different ratios of Ti-Mn.
No.AlloyMaximum Tensile Strength (MPa)Elongation (%)Hardness (Hv)
I316 L24825.7997
II316 L + 0.35 Ti29036.57107
III316 L + 0.35 Mn31435.91127
IV316 L + 0.35 (Mn + Ti)32732.11133
V316 L + 0.75 Ti20126.3088
VI316 L + 0.75 Mn24740.7995
VII316 L + 0.75 (Mn + Ti)21723.1091
VIII316 L + 1.5 Ti16618.3873
IX316 L + 1.5 Mn24529.1595
X316 L + 1.5 (Mn + Ti)19017.7290
Disclaimer/Publisher’s Note: The statements, opinions and data contained in all publications are solely those of the individual author(s) and contributor(s) and not of MDPI and/or the editor(s). MDPI and/or the editor(s) disclaim responsibility for any injury to people or property resulting from any ideas, methods, instructions or products referred to in the content.

