
An Overview on Atomistic Mechanisms of Heterogeneous Nucleation

Brunel Centre for Advanced Solidification Technology (BCAST), Brunel University London, Uxbridge UB8 3PH, UK
*
Author to whom correspondence should be addressed.
Metals 2022, 12(9), 1547; https://doi.org/10.3390/met12091547
Submission received: 1 August 2022
/
Revised: 2 September 2022
/
Accepted: 13 September 2022
/
Published: 19 September 2022
(This article belongs to the Special Issue Heterogeneous Nucleation, Grain Initiation and Grain Refinement: Reports from the LiME Research Hub in the UK)
Abstract
:Our current understanding of heterogeneous nucleation has been dominated by the classical nucleation theory (CNT) with little progress of significance being made in past 100 years. In recent years under the financial support from EPSRC for the LiME Research Hub, we have made substantial progress on understanding heterogeneous nucleation at atomic level using a combination of molecular dynamics simulations and advanced high-resolution electron microscopy. We found that heterogeneous nucleation proceeds through a three-layer nucleation mechanism to produce a 2D nucleus. The atomistic mechanisms responsible for accommodating lattice misfit are dependent on misfit (f): (1) for systems with small negative misfit (−12.5% < f < 0), misfit is accommodated by dislocation mechanism; (2) for systems with small positive misfit (0 < f < 12.5%), misfit is accommodated by vacancy mechanism; and (3) for systems with large misfit (|f| > 12.5%), misfit is accommodated in two steps: formation of coincidence site lattice during prenucleation to accommodate the major misfit (fcsL) and the residual misfit (fr) is accommodated during heterogeneous nucleation by the dislocation mechanism if the residual misfit is less than 0 or by the vacancy mechanism if the residual misfit is larger than 0. Further analysis suggests that heterogeneous nucleation is spontaneous thus barrierless and deterministic rather than stochastic.
1. Introduction
Understanding nucleation is of vital importance to both science and technology, such as ice nucleation for climate change [1,2], the solidification and casting of advanced metallic materials [3], the manipulation of nucleation of molecular crystals in the context of drug design and production [4] and protein crystal formation in living beings [5]. However, our current understanding of nucleation is far from complete [6,7,8,9,10]. Theoretically, nucleation research has been dominated by the classical nucleation theory (CNT) for more than a century with little significant progress [11,12]. Currently, there is a massive gap of 1010 m−3s−1 in the homogeneous nucleation rate of ice between CNT-based computer simulations and experimental measurements that has triggered an intense debate between theoreticians and experimentalists [2]. Practically, the CNT provides little guidance to nucleation control in important industrial processes. For example, although TiB2-based grain refiners have been used in metallurgical industry for over 80 years [13], they were mainly developed by trial-and-error with little help from the CNT.
In the homogeneous CNT, a nanoscale nucleus is formed through structural fluctuation and a solid/liquid interface is created as a by-product [14,15,16,17,18]. In the homogeneous CNT, continuum thermodynamics was applied to determine the critical nucleus size and the energy barrier for its formation and statistical mechanics was utilised to formulate the nucleation rate that describes the nucleation kinetics [19,20,21]. Core to the CNT is its capillarity assumption (thermodynamics) and its fluctuation mechanism for nucleus creation (kinetics). Such assumptions encompass most of the strengths and weaknesses of the theory [2]. Although there have been challenges to the capillary approximation, the homogeneous CNT is conceptually simple, mathematically rigorous and widely applicable to describe qualitatively many phase transformations and has dominated our thinking for more than a century.
The heterogeneous CNT is an outcome of direct application of the homogeneous CNT to the case of heterogeneous nucleation, where a substrate facilitates the nucleation process by reducing the energy barrier [22,23]. The potency (P) of a substrate is characterized by: P = 1/F(θ), and F(θ) = (2 + cosθ)(1 − cosθ)2/4, where θ is the contact angle defined by the Young’s equation [14]. The smaller the contact angle θ is, the more potent (higher P) the substrate is. However, it is not a trivial task to determine θ, and so far, there have been very few data available for θ in the literature [24,25]. In addition, there have been challenges to the validity of heterogeneous CNT. Cantor [26] realised that when θ < 10°, spherical cap formation becomes unphysical, and the heterogeneous CNT breaks down. Cantor and co-workers [27,28] also found that the experimentally measured nucleation undercooling data do not fit CNT description when θ > 40°. Therefore, they suggested that heterogeneous nucleation is better described as an adsorption process at the liquid/substrate interface rather than a spherical cap formation process [29,30]. More recently, based on their atomistic simulation results, Fan and Men [12] have concluded that heterogeneous CNT is invalid since its prerequisite for the Young’s equation is not satisfied in all practical cases for heterogeneous nucleation.
Nucleation potency of a substrate is closely related to the lattice misfit between the substrate and the new solid phase, f [31,32]. Practically, lattice misfit has been used as a parameter to search for grain refiners, and there has been computer software, such as edge-to-edge matching approach [33,34], to identify low misfit substrates. Theoretically, based on the CNT, Turnbull and Vonnegut [31] proposed a simple crystallographic model, which suggests that there exists a linear relationship between nucleation undercooling, ΔTn, and misfit. However, Gránásy et al. [35] pointed out that the barrier of heterogeneous nucleation was not a monotonical function of the misfit, based on their modelling work with phase field crystal model. In addition, by realising the importance of structural templating, Fan [34] proposed an epitaxy nucleation model, which predicts that when 0 < |f| <12.5%, nucleation undercooling increases with increasing |f|. Interestingly, the recent experimental observations [36,37] showed that ΔTn increased initially with increasing the misfit, and reached a peak around f = 13%, and then decreased with further increase in the misfit. More recently, Fan and co-workers [11,38,39] developed a three-layer nucleation mechanism, which predict that when 0 < |f| <12.5%, nucleation undercooling increases linearly with increasing |f|, where f can be either actual misfit when |f| <12.5% or residual misfit (fr) after the misfit accommodated by the coincidence site lattice (fCSL) when |f| >12.5%.
Atomistic simulation has been widely employed to understand the microscopic details of heterogeneous nucleation [40,41,42,43,44,45,46,47], due to the difficulties involved in experimental observations of the nucleation process [48]. With Monte Carlo simulations of the crystal nucleation on a flat crystalline surface using the Lennard-Jones potential, Sear et al. [47] found that the substrate surface lattice strongly influenced the nucleation rate, which decreases with increasing the misfit when the misfit is less than 10% and becomes scattered with further increase in the misfit. They found that nucleation was epitaxial when the misfit was small, and epitaxy might be absence for systems with large misfit [47]. Classical MD simulations for ice formation on kaolinite conducted by Sosso et al. [43] showed that the nucleus had a strong two-dimensional character, and that the critical nucleus was substantially smaller than that found for homogeneous nucleation. In addition, with ab initio MD simulations of the Al(l)/TiB2(s) interface, Wang et al. [40] revealed that the growth of the first three layers of α-Al at the interface was frustrated by the lattice misfit (f = −4.2%) between solid Al and TiB2 at a small undercooling of 2 K. Furthermore, Fujinaga et al. [46] reported that a thin solid Al layer, which initially appeared in the liquid Al on surfaces of a cubic Ti particle, could grow to a spherical cap of fcc Al under an undercooling of 60 K, which was regarded as athermal heterogeneous nucleation by the authors. It seems that there has been an increasing interest in understanding of the atomistic mechanisms of heterogeneous nucleation process using atomistic simulations, and so far, the exact atomistic mechanisms of heterogeneous nucleation are still desirable.
In the recent years, using classical MD simulations, we investigated systematically the effect of lattice misfit on the atomistic mechanisms of the heterogeneous nucleation [11,38,39]. We found that heterogeneous nucleation completes within three atomic layers to generate a 2D nucleus (a crystal plane of the solid), with the specific atomistic mechanisms for accommodating lattice misfit being dependent on the sign and amplitude of the lattice misfit [11,38,39]. In this paper we provide a concise overview on the atomistic mechanisms of heterogeneous nucleation as a function of lattice misfit. After a brief review of atomistic nucleation research in the literature, we present the methodology used for the MD simulations and data analysis in Section 2, and the concept of prenucleation and precursor for heterogeneous nucleation in Section 3. This is followed by a detailed description of the atomistic mechanisms of heterogeneous nucleation as a function of lattice misfit in Section 4. An in-depth discussion of the nature of heterogeneous nucleation is offered in Section 5 before a summary in Section 6.
2. MD Simulation of Heterogeneous Nucleation
A generic system was created to simulate heterogeneous nucleation process to make the simulation results generally applicable. This nucleation system consists of a generic liquid and a generic fcc substrate with its z axis being normal to the {111} surface. We chose aluminium as the generic liquid since it is representative of many metals in terms of liquid metal structures. The generic fcc substrate lattice is built using pinned aluminium atoms with a specified lattice parameter to pre-set the lattice misfit [49]. This generic system has two major advantages: (1) it allows the simulation of nucleation systems with substrates of high melting temperatures (Tl) that are similar to the nucleant particles used in industrial practice (e.g., TiB2 with Tl = 3498 K) and (2) this makes it possible to simulate the effect of lattice misfit alone without the interference from chemical interaction between the liquid and the substrate and/or the substrate surface roughness at atomic level [50,51]. For simplicity, we have used the generic terms “the liquid” and “the substrate”.
The initial dimensions were 48× 30× 15 for the liquid and 48× 30× 6 for the substrate, with the total number of atoms in the system being 5040. Periodic boundary conditions were imposed in the x()- and y()-directions. A vacuum region was inserted with periodic boundary conditions in the z-direction, and the extent of the vacuum region was 60 Å. The initial configuration of the fcc materials has a lattice parameter a = 4.126 Å, which corresponds to the value for aluminium obtained at its calculated melting point. The substrate was assigned a varied lattice misfit with the solid aluminium, which can be either negative or positive, as will be presented in the following section.
The EAM (embedded atom method) potential for aluminium, developed by Zope and Mishin [52], was used in this work. The predicted melting temperature for pure Al is 870 ± 4 K with this potential [52]. During the simulation, the Al atoms above the substrate were allowed to move freely under the effect of the interatomic potential. The substrate atoms were excluded from the equations of motion, but the forces they exert on the adjacent atoms were included. All the MD simulations were performed using the DL_POLY_4.08 MD package [53]. The equations of motion were integrated by means of the Verlet algorithm with a time step of 0.001 ps and the Berendsen NVT ensemble was used for the temperature control. The liquid was prepared by heating the system to a temperature of 1400 K with steps of 50 K, each lasting 100,000 MD steps.
The nucleation temperature, Tn, for each specified nucleation system was determined using the variable step search method. The equilibrated configuration of the liquid at 1400 K was cooled to a desired temperature with a step of 50 K and at each temperature step the system was allowed to run for 1,000,000 MD time steps to equilibrate. The initial nucleation temperature, T1, was determined by monitoring variation in total energy and trajectory of the system during the equilibration. This means that exact nucleation occurred in the temperature interval between T1 and T1 + 50 K. A more accurate nucleation temperature, T2, was determined by a finer search in this reduced temperature interval with a temperature step of 5 K. Finally, the nucleation temperature, Tn, was determined by an even finer search between T2 and T2 + 5 K with a temperature step of 1 K. This approach allows the nucleation temperature to be determined within an error of ±1 K.
The atomic ordering in the liquid adjacent to the liquid/substrate interface was quantified using the atomic density profile for ordering along the z direction and in-plane order parameter for ordering in the x-y plane. Atomic density profile, ρ(z), is defined as [54]:
where Nz is the number of atoms between z − Δz/2 and z + Δz/2 at time t, Δz is the width of the bin, a 10th of the layer spacing in this study. The angled brackets indicate a time-averaged quantity, and Lx and Ly are the x and y dimensions of the cell.
The in-plane order parameter, S(z), is defined as [55]:
where the summation is over all atoms labelled j within a given bin of width, Δz, of one layer spacing and K is a reciprocal lattice vector and rj is the position vector of the jth atom in the Cartesian space. We chose such that exp(iK·rj) = 1 for any rj in a perfect fcc lattice with a (111) surface orientation. When all the atoms are at their perfect fcc (111) sites, the S(z) will be 1 and the order parameter reduces the further they are away from their ideal positions.
The atomic arrangement in the liquid adjacent to the interface during the simulation is characterized by the time-averaged atomic positions [56] and local bond-order analysis [57]. The time-averaged atomic positions in the individual layers of the liquid within 10 ps were taken from the trajectory of the simulation. With this approach, the solid atoms can be distinguished from the liquid atoms, where the solid atoms usually vibrate at their equilibrium positions and the liquid atoms can move more than one atomic spacing [56]. The local bond-order analysis is another approach widely used in atomistic simulations to distinguish the solid atoms from the liquid atoms in the bulk liquid [58]. To perform the local bond-order analysis, the local bond-order parameters, ql(i), was calculated as [57]:
where the (2l + 1) dimensional complex vector qlm(i) is the sum of spherical harmonics, Ylm(rij), over all the nearest neighbouring atoms of the atom i. Two neighbouring atoms i and j can be recognized to be connected if the correlation function, q6(i)·q6(j), of the vector q6 of neighbouring atoms i and j exceeds a certain threshold, 0.1 in this study. To distinguish the solid atoms from the liquid atoms, a threshold on the number of connections that an atom has with its neighbours is set to 6.
3. Prenucleation and Precursor for Heterogeneous Nucleation
Atoms in the liquid may exhibit pronounced atomic ordering at the liquid/substrate interface even above the liquidus [49,59,60,61,62,63,64,65]. In our previous work [49,66], we have defined prenucleation as substrate-induced atomic ordering in the liquid adjacent to a liquid(L)/substrate(N) interface (the L/N interface) at temperatures above the nucleation temperature (Tn). Our MD investigations have confirmed that prenucleation is promoted by decreasing the temperature [49], reducing the lattice misfit between the solid and the substrate [49], attractive chemical interaction between the liquid and the substrate atoms [50] and an atomically smooth substrate surface [51]. For a given nucleation system (fixed liquid and substrate), prenucleation produces the highest level of atomic ordering at the L/N interface at the nucleation temperature but right before the onset of nucleation (t = 0 ps). We define such an atomic arrangement at the L/N interface as a precursor for heterogeneous nucleation. Thus, precursor represents the finishing point of prenucleation and the starting point of heterogeneous nucleation. In this section, we use two specific cases to demonstrate the importance of precursor to heterogeneous nucleation.
Figure 1 presents the precursor of a generic nucleation system with −8% misfit at the onset of heterogeneous nucleation (Tn = 760 K and t = 0 ps). A snapshot of the system (front view, Figure 1a) reveals that there is significant atomic layering in the liquid adjacent to the L/N interface. As quantified by the atomic density profile (ρ(z)) in Figure 1b and the in-plane atomic order parameter (S(z)) in Figure 1c, there are six atomic layers at the interface, at least three of which contain some degree of in-plane atomic ordering. The detailed atomic arrangement in the first four atomic layers is presented in Figure 1d–g by the time averaged atomic positions. There are substantially ordered regions in the first layer (L1) and the second layer (L2), and such ordered regions become less significant in the third layer (L3) and almost non-existence in the fourth layer (L4).
Precursor is a 2D ordered structure at the L/N interface, as shown in Figure 2 by the arrangement of solid atoms at the interface. Through local bond-order analysis, we can distinguish solid atoms from the liquid atoms. By removing the liquid atoms from the simulation system, Figure 2a shows that 2D ordered structure in the system with −8% misfit at the onset of heterogeneous nucleation (Tn = 760 K and t = 0 ps), with a vertical section of the system being shown in Figure 2d. In addition, Figure 2 suggests that a solid atom can only be supported by the solid atoms in its immediate underneath layer, and this is called structural templating, as will be further discussed later.
Another important aspect of prenucleation is that in some cases prenucleation may produce a new substrate to replace the original one for heterogeneous nucleation. This is demonstrated here by the prenucleation process in the Cu(s)/Pb(l) system (Figure 3). The details of the simulation on the Cu(s)/Pb(l) system can be found in Reference [39]. Our MD simulations found that {111} Cu substrate nucleates solid Pb according to the following orientation relationship (OR):
{111}<110>Pb//{111}<110>Cu.
According to this OR, the calculated lattice misfit between the solid Pb and the Cu substrate is 27.3%, being obviously a system with large misfit (|f| > 12.5%).
At a temperature above the melting point of Pb (Tl = 618 K), a completely ordered Pb layer formed on the {111} Cu substrate (Figure 3a). A detailed analysis of atomic arrangement reveals that the solid Pb layer has a CSL (coincidence site lattice) relationship with the Cu substrate (Figure 3b), as further demonstrated by the unit cell of CSL in Figure 3c, d. Since structural templating is a critical atomistic mechanism for heterogeneous nucleation, here we use atomic matching rule (AMR) to describe the CSL, instead of the conventional Σ notations for grain boundaries:
where dPb<110> is the atomic spacing along <110>Pb direction, and dCu<110> is the atomic spacing along <110>Cu direction. More generally, the atomic matching rule can be expressed as:
where dS and dN are the atomic spacings of the solid and the substrate according to the specified OR, respectively. Thus, we can express the lattice misfit as:
where fCSL is lattice misfit accommodated by the CSL, and fr is the residual lattice misfit remaining after the CSL. In the case of the Cu(s)/Pb(l) system, we have the CSL accommodated misfit of 25% and the residual misfit of 2.3%.
3dPb<110> = 4dCu<110>,
Therefore, the formation of CSL during the prenucleation has converted the original system with a large positive misfit (27.3%) into a new system with a small positive misfit (2.3%). The original {111}Cu substrate is now replaced by CSL Pb as the new substrate.
Here we offer a practical case to demonstrate the formation of a new substrate through prenucleation. Figure 4a shows a HAADF image of the Al3Ti 2DC (two-dimensional compound) formed at the Al/TiB2 interface formed during the production process of Al-5Ti-1B grain refiner [67]. The (112) Al3Ti 2DC becomes the new terminating layer of (0001) TiB2, which changes the original substrate with −4.22% misfit into an extremely potent TiB2/Al3Ti 2DC substrate (the new substrate with 0.09% misfit). It is this new TiB2/Al3Ti 2DC substrate that settles the decades-long debate on what makes the Al-5Ti-1B grain refiner effective for grain refinement of Al-alloys [67].
4. Atomistic Mechanisms of Heterogeneous Nucleation
Heterogeneous nucleation is strongly dependent on the lattice misfit, with the specific mechanisms for accommodating lattice misfit being a function of the sign (negative or positive) and amplitude (large or small) [11,38,39]. In this section, we first offer a new definition of heterogeneous nucleation to separate heterogeneous nucleation from grain initiation. We then present the detailed atomistic mechanisms of heterogeneous nucleation in systems with small negative misfit (−12.5% < f < 0), small positive misfit (0 < f < 12.5%) and large misfit (|f| > 12.5%). In addition, local atomic ordering exists in amorphous solid [68], and this locally ordered structures can be used to test the limit of structural templating. The MD simulation results is also presented at the end of this section.
4.1. Definition of Heterogeneous Nucleation
The classical nucleation theory describes heterogeneous nucleation as a stochastic process that generates a hemisphere of a critical radius on a given substrate so that the hemisphere can grow isothermally without an energy barrier. Our recent work on atomistic mechanisms of heterogeneous nucleation suggests that this hemisphere formation process is deterministic rather than stochastic and better to be described as grain initiation [12]. Based on this we have redefined heterogeneous nucleation at atomic level as the process that creates a 2D nucleus (effectively a crystal plane of the solid) that has the potential to template further growth.
Now we put the new definition of heterogeneous nucleation into context of early stages of solidification. As schematically illustrated in Figure 5, early stages of solidification consist of the following steps [12]:
- Prenucleation: to generate a precursor for heterogeneous nucleation.
- Three-layer heterogeneous nucleation: to generate a 2D nucleus, which is a crystal plane of the solid.
- Constrained cap formation: spherical cap formation by lowering the temperature to overcome the energy barrier due to curvature constrain. The outcome of constrained cap formation is a hemisphere of the solid.
- Grain initiation: a grain is initiated if the spherical cap can grow beyond the hemisphere.
- Free growth: beyond the hemisphere the solid can grow isothermally without any energy barrier.
4.2. Heterogeneous Nucleation on a Substrate with Small Negative Misfit
Using MD simulations, we systematically investigated the atomistic mechanisms of heterogeneous nucleation in systems with varying negative lattice misfit. We found that when −12.5% < f < 0, heterogeneous nucleation completes within three atomic layers through a dislocation mechanism to produce a 2D nucleus (a crystal plane of the solid). This dislocation mechanism is illustrated in Figure 6 using the system with −8% misfit. As shown in Figure 1, at the onset of heterogeneous nucleation (t = 0 ps), prenucleation has provided a precursor with significant amount of atomic ordering in the liquid adjacent to the L/N interface. Building on such atomic ordering, heterogeneous nucleation occurs spontaneously to increase the atomic ordering. At the end of the nucleation process (t = 50 ps, Tn = 760 K), the system has nine atomic layers (Figure 6a,b) and each layer contains significant levels of in-plane atomic ordering (Figure 6c). Detailed analysis of atomic arrangement in the individual layers has confirmed the existence of an edge dislocation network as marked by the solid brown lines in Figure 6d, a screw dislocation network in L2 as marked by the solid blue lines in Figure 6e and a perfect crystal plane of {111} Al, which is the 2D nucleus as an outcome of heterogeneous nucleation. The 2D nucleus not only has the same hexagonal atomic arrangement but also has the same atomic spacing as {111} Al.
Figure 7 shows the ordered structure formed at the end of heterogeneous nucleation (t = 50 ps and Tn = 760 K) in the system with −8% misfit. A 3D view (Figure 7a) and a top view (Figure 7b) show a 2D ordered structure as a consequence of structural templating; and a top view (Figure 7c) and a front view (Figure 7d) of the A-A slab marked in Figure 7b show the arrangement of solid atoms in the S/N interface (L1–L3) and the diffuse L/S interface (L4–L9). Figure 7 clearly illustrated the basic principle of structural templating that a solid atom can only “sit” at the local low energy positions provided by the solid atoms.
Negative misfit means that the solid has smaller atomic spacing than that of the substrate. As shown in Figure 8a, the difference in atomic spacing (da) between the substrate surface (denoted as L0) and the 2D nucleus (L3) is bridged through two intermediate layers, L1 and L2. In addition, Figure 8a revealed that the atomic spacing in the transitional layers (L1 and L2) decreases with increasing time until it becomes a constant at the end of nucleation. However, the most important finding is that the lattice misfit is largely accommodated in L1 through the formation of an edge dislocation network (Figure 8b) and that the formation of the screw dislocation network in L2 has led to a twist (α) of L2 relative to the substrate orientation (Figure 8c).
MD simulations of systems with different misfit suggest that lattice misfit is the most important structural parameter that affects heterogeneous nucleation. As shown in Figure 9, the accommodated misfit (fa) in L1, the total twist angle (α) and the nucleation undercooling (ΔTn) are all monolithic increasing function of the amplitude of misfit (|f|).
It is straightforward to work out the following relationship between the twist angle (α) and the lattice misfit (f) in consideration that there are three sets of edge dislocations in L1:
where b is the amplitude of the Burger’s vector, and Sd is the edge dislocation spacing.
Since there is no relative twist in other layers rather than L2, the twist angle α represents the overall twist of the solid relative to the substrate, and this twist has become the signature of heterogeneous nucleation in systems with negative misfit. This has been tested in the well-known system Al/TiB2 system, where exists a misfit of −4.2% between the solid Al and the TiB2 substrate with a (0001) surface termination. As shown by the HRTEM (high resolution transmission electron microscope) image of the Al/TiB2 interface in Figure 10, relative to the (0001) TiB2 surface, the first Al layer has no twist and the rest of solid Al has twisted 4.7°.
To sum up, heterogeneous nucleation in systems with small negative misfit (−12.5% < f < 0) completes within three atomic layers: L1 accommodates misfit through a network of edge dislocations; L2 twists an angle α through a network of screw dislocations to release the strain energy in L1; and L3 is the 2D nucleus.
4.3. Heterogeneous Nucleation on a Substrate with Small Positive Misfit
According to the definition of lattice misfit (Equation (4)), positive misfit means the atomic spacing of the solid is larger than that of the substrate. To maintain coherency across the S/N interface, the stresses experienced by atoms at the interface in the systems with positive misfit will be very different from that in the systems with negative misfit. Our MD simulations have confirmed that when 0 < f < 12.5% heterogeneous nucleation also completes within three atomic layers but through a vacancy mechanism. Here we use the nucleation process in the system with 8% as an example to illustrate the three-layer vacancy nucleation mechanism. Figure 11 shows snapshots of atomic arrangement in the first three layers at the end of heterogeneous nucleation in the system with 8% misfit (Tn = 739 K and t = 50 ps). The atomic arrangement in L1 (Figure 11a) has an epitaxy relationship with the substrate (L0) as shown by the superposition of L1 on top of L0 (Figure 11b). Detailed analysis revealed that L2 (Figure 11c) contains about 16% vacancies relative to L1. L3 (Figure 11d) is a {111} Al plane that has been treated as the 2D nucleus, which is an outcome of heterogeneous nucleation.
Figure 12a presents the quantified average in-plane atomic spacing (da) as a function of positions of atomic layers with the top surface layer of the substrate being designated as L0. The close match of atomic spacing between L1 and L0 confirms the epitaxy relationship between them. The structural transition between the substrate (L0) and the solid (L3) is delivered through L2, which has an intermediate atomic spacing (see Figure 12a). Within the experimental error, all the misfit (8%) between the solid and the substrate is accommodated by L2 (Figure 12b) through the formation of 16% vacancies in L2 (Figure 12c).
Our analysis has shown that there is a simple relationship between the vacancy fraction (fv) in L2 and the lattice misfit (f) between the solid and the substrate:
Figure 13 shows that both the measured vacancy fraction (fv) and the nucleation undercooling (ΔTn) are all monolithic increasing function of lattice misfit, suggesting again that lattice misfit is the most important parameter affecting heterogeneous nucleation.
Different from the previous case with small negative misfit, after heterogeneous nucleation in systems with small positive misfit the solid has the same orientation with the substrate. This has also been confirmed by our experimental observation that there is no twist between hcp Mg and the fcc MgO substrates (Figure 14) [69,70].
Magnesia (MgO) in Mg-alloys has an fcc crystal structure but two distinctive morphologies, octahedral with {111} surface termination (designated as MgO{111}) and cubic with {100} surface termination (designated as MgO{100}) [70]. It has been confirmed that both MgO{111} and MgO{100} have a lattice misfit of 7.9% with hcp Mg and that both can nucleate Mg (Figure 14) [70]. It is clearly shown by the HRTEM images in Figure 14 that there is no twist between the solid Mg and the MgO substrate in both cases.
To sum up, heterogeneous nucleation in systems with small positive misfit also completes within three atomic layers: L1 has an epitaxy relationship with the substrate; L2 accommodates all the misfit by formation of a population of vacancies; and L3 is a perfect plane of the solid that is regarded as the 2D nucleus.
4.4. Heterogeneous Nucleation on a Substrate with Large Misfit
As has discussed in Section 3, systems with large misfit (|f| > 12.5%) are converted into systems with small misfit through the formation of a coincidence site lattice (CSL) on top of the original substrate surface that acts as the new substrate for the converted new systems [39]. Using the Cu(s)/Pb(l) system as an example, we have demonstrated in Figure 3 that the CSL formed during prenucleation acts as a new substrate for heterogeneous nucleation and accommodates 25% of the original misfit leaving a residual misfit of 2.3%.
Figure 15a shows the time averaged atomic positions in the CSL layer (L0) at the end of nucleation (t = 190 ps at Tn = 594 K). The first layer of Pb (L1) has an epitaxial relationship with the CSL layer (Figure 15a) as demonstrated by the superposition of the L1 on top of the CSL layer (Figure 15b). As shown by the snapshot of L2 in Figure 15c, the residual misfit of 2.3% is accommodated by the 4.5% vacancies in L2 (Figure 16a). L3 (Figure 15d) is a perfect {111} plane of the fcc Pb and becomes the 2D nucleus for the subsequent growth.
Figure 16b is a plot of the quantified average in-plane atomic spacing against the position of the individual layers. The close match of atomic spacing between L1 and the CSL layer provides further support to the epitaxy relationship between L1 and the CSL layer. After L2, the atomic spacing of the rest of the layers reached a constant value that is the atomic spacing of solid Pb.
In summary, heterogeneous nucleation in systems with large misfit occurs in two distinctive steps: (1) formation of CSL (the new substrate) during prenucleation converts the system from large misfit into small misfit; and (2) heterogeneous nucleation through either the dislocation mechanism (if the residual misfit is less than 0) or a vacancy mechanism (if the residual misfit is larger than 0).
4.5. Heterogeneous Nucleation on Amorphous Substrate
To test the applicability limit of the above nucleation mechanism we have investigated heterogeneous nucleation of Al on amorphous substrates [68]. We first generated a 2D amorphous substrate by “compressing” a single layer of Al liquid into a flat plane by keeping the (x, y) coordinates unchanged while setting z = 0 Å for all the atoms in the layer. This 2D amorphous layer is then used as a substrate with pinned atoms to form a simulation system with liquid Al. Our MD simulations revealed that nucleation in this system occurs heterogeneously at Tn = 579 K. Figure 17a shows the atomic arrangement in the 2D amorphous substrate (A1) with a local area marked by the blue square being enlarged in Figure 17b. The red circle (rN = 1 nm) in Figure 17a,b marks the region where heterogeneous nucleation took place. It is believed that this local area in the red circle represents an ordered local atomic cluster. The time averaged atomic positions in L1–L4 are shown in Figure 17c–f, respectively. The purple circle marks the position of 2D nucleus, with approximately rn = 0.91 nm. It is interesting to note that a flat surface with ordered atomic arrangement as small as rN = 1 nm can still act as sites for heterogeneous nucleation.
However, in the cases of 3D amorphous substrates with an atomically rough surface, we found that nucleation occurred homogeneously at Tn = 457 K in the liquid, with the 3D amorphous substrate being irrelevant. Figure 18 presents the time averaged atomic positions in the relevant atomic layers (Li, with L0 being the 3d amorphous substrate) as a function of simulation time (t). At this temperature, a 3D nucleus (rn = 0.65 nm) was generated approximately in L23 of the simulation system at t = 300 ps, as marked in Figure 18 by the purple circles. The 3D nucleus then grows with increasing time as marked by the blue circles.
In summary, a 2D amorphous substrate with ordered regions as small as rN = 1 nm can act as sites for heterogeneous nucleation while an atomically rough 3D amorphous surface has no templating power for heterogeneous nucleation, where homogeneous nucleation occurs in the liquid, being independent of the 3D amorphous substrate.
5. General Discussion
5.1. Atomistic Mechanisms of Heterogeneous Nucleation
In Section 4, we have presented atomistic mechanisms for heterogeneous nucleation in systems with varying misfit. We found that building on the atomic ordering in the precursor provided by the prenucleation process heterogeneous nucleation completes within the first three atomic layers, with the first and second layers accommodating the lattice misfit and the third layer being the 2D nucleus, which marks the end of heterogeneous nucleation and the onset of crystal growth [11,38,39]. For simplicity, we refer this atomistic mechanism as the three-layer nucleation mechanism, as schematically illustrated in Figure 19.
Let us first discuss the evolution of atomic ordering during heterogeneous nucleation. Using local bond-order analysis [57] in MD simulation, we can distinguish between solid atoms from liquid atoms. Figure 20 is a plot of fraction of solid atoms (fs) in the nine atomic layers during heterogeneous nucleation as a function of normalised time (t/t2, t2 is the nucleation finishing time) for the systems with −6% and −8% misfit. The data for systems with −2% and −4% misfit have been excluded in Figure 20 due to the large scatter of data in such systems in which the simulation cell size is smaller than or close to the dislocation spacing. Figure 20 suggests that within experimental error the two systems have the same fs at the onset of heterogeneous nucleation (t = 0 ps), follow the same pathway of solidification (increasing solid fraction) and finish with the same level of atomic ordering at the end of nucleation (t = t2), although the systems with different misfit may have very different Tn and t2. By fitting the data in Figure 20, we can easily obtain the following expression for the fraction of solid atoms, fs:
where fs1 and fs2 are the fractions of solid atoms at the start (t = t1 = 0 ps) and finish (t = t2) points of heterogeneous nucleation, respectively. For the specific systems in our study, we have the fraction of solid atoms fs1 = 0.16 at t1 and fs2 = 0.63 at t2 (Figure 20). This is interesting and worth of further investigation. Figure 21 presents the fraction of solid atoms, fs, in each atomic layer at the start (Figure 21a) and the finish (Figure 21b) of heterogeneous nucleation in systems with different misfit. Figure 21 confirms that systems with varying misfit have the same atomic arrangement at both the onset of nucleation (Figure 21a) and the end of nucleation (Figure 21b). Therefore, it can be concluded that at nucleation temperature (Tn) heterogeneous nucleation in systems with different lattice misfit starts from the same precursor (same atomic ordering at the L/N interface), follows the same solidification path (the way to increase the fraction of solid atoms) and finishes with the same level of atomic ordering at the end of the nucleation process, although such systems may have very different nucleation undercooling (ΔTn) and nucleation time (t2).
This interesting nucleation pathway is understandable in view of the three-layer nucleation mechanism. Firstly, systems with different misfit would have different atomic ordering at the L/N interface, with the fraction of solid atoms increasing with decreasing the misfit. However, the larger the misfit, the larger the ΔTn, and consequently the more increase in atomic ordering. Therefore, it is possible that the difference in atomic ordering caused by the misfit is levelled off by that introduced by ΔTn. Consequently, systems with different misfit have the same precursor at the nucleation temperature. In addition, from the MD simulation results presented in Section 4, it appears that a certain level of atomic ordering at the L/N interface is required to trigger the onset of nucleation. This may imply that heterogeneous nucleation in systems with different misfit may start from the same precursor. Secondly, as will be discussed later heterogeneous nucleation ends by creating two interfaces, the S/N and L/S interfaces. At the nucleation temperature, atomic ordering decreases in the S/N interface and increases in the L/S interface with increasing the misfit. The opposite effects of the misfit on atomic ordering in the two interfaces may cancel each other leading to a constant level of atomic ordering at the end of heterogeneous nucleation in systems with different misfit. Finally, as will be discussed in more detail in the following section, heterogeneous nucleation proceeds layer-by-layer through structural templating. This means that although the kinetics of atomic ordering is different for systems with different misfit it is the structural templating that makes the atomic ordering follow the same pathway (Figure 20).
Now let us discuss the effect of lattice misfit (f) on nucleation undercooling (ΔTn). Figure 22 is a plot of ΔTn against the real value of misfit. it is not surprising to see that ΔTn is a complex function of the misfit. For systems with |f| < 12.5%, ΔTn increases with increasing |f|. While for systems with large misfit (|f| > 12.5%), ΔTn is closely related to the residual lattice misfit (fr). It is also noted that ΔTn decreases slightly with increasing number of atoms in the simulation cell. This means that the smaller the system is, the higher the melting point and hence the larger ΔTn. However, such effect of system size on ΔTn is insignificant compared with that of misfit, and this is mainly caused by the implementation of periodical conditions during the MD simulations.
Figure 23 is a plot of nucleation undercooling for all the systems we have simulated as a function of the absolute value of misfit when |f| < 12.5% or residual misfit (fr) when |f| > 12.5%. It is interesting to note that heterogeneous nucleation undercooling is a unique function of lattice misfit and increases linearly with increasing |f| regardless the sign of the misfit although systems with positive and negative misfit have different nucleation mechanisms in terms of the ways they accommodate lattice misfit. To a good approximation (R2 = 0.978), ΔTn can be expressed as a simple function of misfit |f|:
where α is a constant and α =17.82 K in the case of aluminium. Equation (11) is in good agreement with the simple crystallographic theory of heterogeneous nucleation postulated by Turnbull and Vonnegut [31] and the epitaxial nucleation model by Fan [32]. Both models predict that the undercooling for heterogeneous nucleation is linearly proportional to the lattice misfit. In addition, the linear relationship between ΔTn and misfit, f, is also validated by the experimental data (Table 1 and Figure 24) extracted from the early work of Cantor and co-workers [25,28,31,71,72,73,74].
The atomistic mechanisms for accommodating lattice misfit during heterogeneous nucleation is illustrated schematically in Figure 25 and is summarised below:
- For systems with small negative misfit (−12.5% < f < 0), misfit is accommodated by dislocation mechanism; edge dislocation network in L1 and screw dislocation network in L2.
- For systems with small positive misfit (0 < f < 12.5%), misfit is accommodated by vacancy mechanism; L1 is epitaxy to the substrate and L2 contains vacancies to accommodate all the misfit.
- For systems with large misfit (|f| > 12.5%), misfit is accommodated in two steps: formation of CSL during prenucleation to accommodate the majority of lattice misfit (fCSL), and the residual misfit fr (fr = f – fcsl) is accommodated during heterogeneous nucleation by dislocation mechanism if the residual misfit is less than 0, or by vacancy mechanism if the residual misfit is larger than 0.
5.2. Structural Templating
One of the major advances in our solidification research is the realisation that structural templating plays a critical role in solidification processes, such as prenucleation [49], heterogeneous nucleation [11,38,39] and crystal growth [12]. In this section we discuss further structural templating during heterogeneous nucleation.
Figure 26 presents the evolution of the ordered structures in the first three layers (L1, L2 and L3) on the substrate (L0) during heterogeneous nucleation at Tn = 760 K in a system with −8% misfit. In Figure 26, the solid atoms in the ith layer is superimposed on top of these in the (i − 1)th layer, with L3 being the 2D nucleus produced at the end of the nucleation process (t = t2 = 50 ps). Figure 26 provides a comprehensive demonstration of the structural templating principle that solid atoms in the ith layer only “sit” on the solid atoms in the (i − 1)th layer. However, it is noted in Figure 26 that there are “holes” (“liquid” atoms) in L1 and L2 at the end of heterogeneous nucleation. This anomaly is due to the failure of local bond-order analysis, and this will be discussed further here.
Figure 27 is a 2D illustration of structural templating. The locally ordered solid atoms (filled circles in Figure 27a) have lower mobility compared with liquid atoms above them. The potential energy of the potential solid atoms above the solid layer is schematically illustrated in Figure 27b, with the energy maxima being marked by the red dots and energy minima by green dots. Obviously, the energy minima will be the most likely positions for the next layer of solid atoms, as marked by the dashed open circles in Figure 27c. Therefore, structural templating can be defined as an atomistic process in which solid atoms provide potential low energy position for the next layer of potential solid atoms.
Figure 28a shows the time averaged atomic positions of atoms in L1 superimposed on these in the substrate (L0) at the end of heterogeneous nucleation (Tn = 760 K, t2 = 50 ps) in a system with −8% misfit and 80,000 atoms. Normal solid atoms in L1 vibrate around their equilibrium positions and appear in Figure 27 as a blob of dots, which occupy either the “B” positions or the “C” positions in L1, where “B” and “C” represents the atomic positions of ABCA… stacking sequence in the fcc lattice. Such solid atoms are denoted as “B” atoms and “C” atoms. However, the atoms located at the nodes of dislocation network in L1 can hop between the “B” and “C” positions (denoted as “BC” atoms), with their trajectories forming a circular pattern centred on top of a substrate atom underneath (Figure 28b). This suggests that such “BC” atoms (solid atoms) have higher mobility and thus higher potential energy than those of normal solid atoms. It is obviously that the local bond-order analysis has failed to classify such node atom as solid in Figure 27. It is interesting to note that, such “BC” atoms are perfectly capable of templating solid atoms in the next atomic layer occupying the “A” positions, as demonstrated in Figure 28c,d by superimposing L2 on L1.
- Only solid atoms in the (i − 1)th layer can template solid atoms in the ith layer. This means no solid atoms can “sit” on top of liquid atoms.
- In an ordered patch, the number of solid atoms in the ith layer is always less than that in the (i − 1)th layer. This is the physical origin of curvature development during crystal growth, as will be discussed elsewhere [12].
- In the case of fcc Al with an ABCA… stacking sequence, if the position of (i − 1)th layer is assumed to “A”, the positions of the solid atoms in the ith layer can be: (1) located at either “B” or “C” positions in a normal ordered region; (2) located between “B” and “C” positions in the core of a dislocation; and (3) found in both “B” and “C” positions at the nodes of a dislocation network, and the trajectories of such atoms form a circular pattern centred on top of a solid atom in the (i − 1)th layer (see Figure 28).
- Although atoms that hop between “B” and “C” positions have higher mobility than those located at either “B” or “C” positions, they can template solid atoms in the (i + 1)th layer in position “A”.
5.3. Nature of Heterogeneous Nucleation
5.3.1. Heterogeneous Nucleation Transforms a L/N Interface into a S/N Interface plus a L/S Interface
As demonstrated in Figure 1, the starting point of heterogeneous nucleation is the precursor produced by prenucleation. This precursor is effectively the diffuse L/N interface, which has 6 atomic layers (Figure 1a,b) with the first three layers containing some degree of in-plane atomic ordering (Figure 1c). Therefore, the precursor represents the highest level of atomic ordering at the L/N interface and hence the lowest interfacial energy (γLN). At the end of heterogeneous nucleation (Figure 6), there are nine atomic layers between the bulk liquid and the substrate (Figure 6a,b), among which, the first three layers (L1, L2 and L3) form the S/N interface and the later six layers (L4–L9) constitute the L/S interface. The L/S interface here is equivalent to a L/N interface with 0% misfit and is hence capable of templating substantial in-plane atomic ordering (Figure 6c). Therefore, heterogeneous nucleation can be regarded as a process that transforms a L/N interface (the precursor) into two interfaces at the nucleation temperature; one is the S/N interface, and the other is the L/S interface. This new concept of heterogeneous nucleation is helpful for analysing the heterogeneous nucleation process at atomic level.
Firstly, it is helpful for understanding the atomic arrangement at various interfaces and their effect on interfacial energies. By ignoring the chemical interaction between the substrate and the liquid, interfacial energies, γLN and γLS are closely related to the amount of ordered atoms in the interface (diffused interface is a region). At a given temperature, γLN and γLS decrease with increasing interfacial solid atoms. Similarly, the γSN is closely related to the number of defects in the S/N interface. When the misfit is 0%, the L/N and L/S interfaces become the same while the S/N interface disappears. This situation simply represents the case for crystal growth and ΔTn = 0 K. For a given temperature, the amount of ordered atoms in the L/N interface decreases and γLN increases with increasing the misfit, while the γLS remains constant. However, increase in the misfit leads to a decrease in Tn, which in turn causes the increase in atomic ordering in the L/N interface. The overall effect of increasing misfit is that systems with different misfit have the same atomic ordering in the L/N interface and thus the same γLN at their perspective nucleation temperatures (see Figure 20 and Figure 21). This appears to suggest that heterogeneous nucleation in systems with different misfit occurs at different temperature but with the same atomic ordering in the L/N interface. In other words, heterogeneous nucleation always starts with the same precursor. On the other hand, at the end of heterogeneous nucleation, the number of defects in the S/N interface increases and γSN increases with increasing the misfit while the amount of atomic ordering in the L/S interface increase and γLS decreases with decreasing Tn as a consequence of increasing the misfit. However, according to the recent MD assessment of temperature effect on γLS of Al by Sun et al. [75], for the range of undercooling for heterogeneous nucleation in systems of concern, the change in γLS caused by changes in Tn is within the experimental error. Therefore, with reasonable accuracy we can assume that γLS is a constant for systems with varying misfit. Based on this analysis, we can conclude that heterogeneous nucleation undercooling (ΔTn) is closely associated with the number of structural defects in the first two atomic layers (i.e., the S/N interface), which is a function of lattice misfit. The interfacial free energy of the S/N interface (γSN) can be taken as the energy of all defects in the first three layers. For systems with negative misfit, in consideration of strain energy caused by screw dislocation is 2/3 of that of edge dislocation [76], we have the following equation for the S/N interfacial energy [32]:
where D is a materials constant, μ the shear modulus of the solid, ν the poison’s ratio of the solid, b is the value of Burger’s vector and β is another materials constant and β = 1.24 in the case of Al.
For systems with positive misfit, we assume that all the misfit strain will be released by the formation of vacancies in L2 during heterogeneous nucleation, and then we have
where Ev is the formation energy of a vacancy and fv is the vacancy fraction in L2. For the system with 8% misfit, fv = 16%, Ev = 0.69 ± 0.03 eV for Al [77] and ra = 1.3 Å, we have γSN = 21 meVÅ−2 = 0.336 JÅ−2. This is in the right range for a semi-coherent interface.
In addition, this new concept has been deployed to formulate heterogeneous nucleation and we have derived the following equations for nucleation undercooling [12]:
Since γLS – γLN and Δfs are independent of the misfit (f), and γSN ∝ f, we have ΔTn ∝ f. This is consistent with Equation (11) obtained from the MD simulation results (Figure 23).
5.3.2. Heterogeneous Nucleation Is Spontaneous thus Barrierless
During our MD simulations, we monitor the changes in total energy of the simulation system. Figure 29 is a typical example of the total energy changes during the heterogeneous nucleation in a system with −8% misfit at temperature Tn = 760 K. We use t1 to mark the onset of heterogeneous nucleation where the total energy starts to decrease. The total energy decreases at a slower pace during nucleation (t1 < t ≤ t2), continues to decrease at an accelerated pace after nucleation (t2 < t ≤ t3), and becomes a constant after the completion of solidification (t > t3). We found that in all the simulation cases the total energy of the system always decreases during heterogeneous nucleation at the nucleation temperature [12]. This suggests that heterogeneous nucleation occurs spontaneously (a downhill process) without any energy barrier [12]:
where ΔGn is the free energy change for heterogeneous nucleation, γLN, γLS and γSN are the interfacial energies of the L/N, L/S and S/N interfaces, respectively; nL is the number of atoms in one atomic layer; and Aa is the projected area of an atom. This is in great contrast to the classical heterogeneous nucleation theory, in which heterogeneous nucleation has an energy barrier.
From Equation (17) we have:
This suggests that the well-known Young’s equation below is not applicable to heterogenous nucleation:
where θ is the contact angle defined by the Young’s equation. It is important to note that θ is only meaningfully defined when γLN ≤ γSN + γLS. In all the cases for heterogeneous nucleation, the substrate is always wetted by the liquid, and certain degree of atomic ordering exists in the L/N interface. γSN + γLS < γLN means that the nucleated solid phase can always wet spontaneously the substrate, making the Young’s equation unphysical for the cases of heterogeneous nucleation. In addition, the CNT for heterogeneous nucleation is based on the concept of Gibb’s dividing interfaces with zero thickness. However, we now understand that all interfaces are regions of limited thickness. This makes the triple point ill-defined to apply the Young’s equation.
5.3.3. Heterogeneous Nucleation Is Deterministic rather Than Stochastic
The classical nucleation theory (CNT) describes both homogeneous and heterogeneous nucleation as a stochastic process, where the nucleus (3D) with a critical size is generated by fluctuation in local atomic arrangement and local temperature, and thus time is required to allow for the appearance of the nucleus with a critical size and thus is time dependent. However, in our new description of heterogeneous nucleation, building on the precursor generated by prenucleation, formation of a 2D nucleus occurs through structural templating without the need of neither structural nor temperature fluctuations. Therefore, heterogeneous nucleation in the new nucleation theory is a deterministic process. In addition, Figure 20 and Figure 21 suggest that for a generic nucleation system of Al/substrate of varying misfit heterogeneous nucleation starts with the same precursor, proceeds with the same ordering pathway and ends up with the same nucleus although the nucleation temperatures are different. This also implies that heterogeneous nucleation is deterministic.
6. Summary
In this overview, we provide a comprehensive understanding on the atomistic mechanism of heterogeneous nucleation, based on our recent results of the MD simulations. We found that, building on the atomic ordering in the precursor provided by the prenucleation process, heterogeneous nucleation completes within the first three atomic layers, with the first and second layers accommodating the lattice misfit and the third layer being the 2D nucleus, which marks the end of heterogeneous nucleation and the onset of crystal growth.
The starting point of heterogeneous nucleation is the precursor produced by prenucleation. This precursor is effectively the diffuse L/N interface, which has six atomic layers with the first three layers containing some degree of in-plane atomic ordering. The precursor represents the highest level of atomic ordering at the L/N interface. One of the major advances in our solidification research is the realisation that structural templating plays a critical role in solidification processes, such as prenucleation, heterogeneous nucleation and crystal growth. The essential features of structural templating are:
- Only solid atoms in the (i − 1)th layer can template solid atoms in the ith layer. This means no solid atoms can “sit” on top of liquid atoms;
- In an ordered patch, the number of solid atoms in the ith layer is always less than that in the (i − 1)th layer. This is the physical origin of curvature development during crystal growth;
- In the case of fcc Al with an ABCA… stacking sequence, if the position of (i − 1)th layer is assumed to “A”, the positions of the solid atoms in the ith layer can be: (1) located at either “B” or “C” positions in a normal ordered region; (2) located between “B” and “C” positions in the core of a dislocation; and (3) found in both “B” and “C” positions at the nodes of a dislocation network, and the trajectories of such atoms form a circular pattern centred on top of a solid atom in the (i − 1)th layer;
- Although atoms that hop between “B” and “C” positions have higher mobility than those located at either “B” or “C” positions, they can template solid atoms in the (i + 1)th layer in position “A”.
- The atomistic mechanisms for accommodating lattice misfit are described as:
- For systems with small negative misfit (−12.5% < f < 0), misfit is accommodated by dislocation mechanism, i.e., edge dislocation network in L1 and screw dislocation network in L2;
- For systems with small positive misfit (0 < f < 12.5%), misfit is accommodated by vacancy mechanism, where L1 is epitaxy to the substrate and L2 contains vacancies to accommodate all the misfit;
- For systems with large misfit (|f| > 12.5%), misfit is accommodated in two steps: formation of CSL during prenucleation to accommodate the majority of the misfit (fCSL), and the residual misfit fr (fr = f – fcsl) is accommodated during heterogeneous nucleation by dislocation mechanism if the residual misfit is less than 0 or by vacancy mechanism if the residual misfit is larger than 0.
The nature of heterogeneous nucleation is to transform a L/N interface (the precursor) into two interfaces at the nucleation temperature; one is the S/N interface, and the other is the L/S interface. The process of the heterogeneous nucleation is spontaneous thus barrierless, deterministic rather than stochastic and athermal rather than thermally activated.
Author Contributions
Z.F. conducted conceptualization of the research, development of the research approach, funding acquisition, supervision and original draft writing; H.M. conducted MD simulations and visualization, and all the authors contributed to review and editing of the manuscript. All authors have read and agreed to the published version of the manuscript.
Funding
This work has been funded by the EPSRC of the UKRI under the grant number EP/N007638/1.
Institutional Review Board Statement
Not applicable.
Informed Consent Statement
Not applicable.
Data Availability Statement
All data is available in the main text.
Conflicts of Interest
The authors declare no conflict of interest.
References
- Bartels-Rausch, T. Chemistry: Ten things we need to know about ice and snow. Nature 2013, 494, 27–29. [Google Scholar] [CrossRef]
- Sosso, G.C.; Chen, J.; Cox, S.J.; Fitzner, M.; Pedevilla, P.; Zen, A.; Michaelides, A. Crystal nucleation in liquids: Open questions and future challenges in molecular dynamics simulations. Chem. Rev. 2016, 116, 7078–7116. [Google Scholar] [CrossRef] [PubMed]
- Greer, A.L. Overview: Application of heterogeneous nucleation in grain-refining of metals. J. Chem. Phys. 2016, 145, 211704. [Google Scholar] [CrossRef] [PubMed]
- Erdemir, D.; Lee, A.Y.; Myerson, A.S. Polymorph selection: The role of nucleation, crystal growth and molecular modelling. Curr. Opin. Drug Discov. Devel. 2007, 10, 746–755. [Google Scholar] [PubMed]
- Michaels, T.C.T.; Šarić, A.; Curk, S.; Bernfur, K.; Arosio, P.; Meisl, G.; Dear, A.J.; Cohen, S.I.A.; Dobson, C.M.; Vendruscolo, M.; et al. Dynamics of oligomer populations formed during the aggregation of Alzheimer’s Aβ42 peptide. Nat. Chem. 2020, 12, 445–451. [Google Scholar] [CrossRef]
- Wolde, P.R.; Frenkel, D. Homogeneous nucleation and the Ostwald step rule. Phys. Chem. Chem. Phys. 1999, 1, 2191–2196. [Google Scholar] [CrossRef]
- Vekilov, P.G. Two-step mechanism for the nucleation of crystals from solution. J. Cryst. Growth 2005, 275, 65–76. [Google Scholar] [CrossRef]
- Gebauer, D.; Völkel, A.; Cölfen, H. Stable prenucleation calcium carbonate clusters. Science 2008, 322, 1819–1822. [Google Scholar] [CrossRef]
- Smeets, P.J.M.; Finney, A.R.; Habraken, W.J.E.M.; Nudelman, F.; Friedrich, H.; Laven, J.; De Yoreo, J.J.; Rodger, P.M.; Sommerdijk, N.A.J.M. A classical view on nonclassical nucleation. Proc. Natl. Acad. Sci. USA 2017, 114, E7882–E7890. [Google Scholar] [CrossRef]
- Gebauer, D.; Raiteri, P.; Gale, J.D.; Cölfen, H. On classical and non-classical views on nucleation. Am. J. Sci. 2018, 318, 969–988. [Google Scholar] [CrossRef] [Green Version]
- Fan, Z.; Men, H.; Wang, Y.; Que, Z.P. A new atomistic mechanism for heterogeneous nucleation in the systems with negative lattice misfit: Creating a 2D template for crystal growth. Metals 2021, 11, 478. [Google Scholar] [CrossRef]
- Fan, Z.; Men, H. Heterogeneous nucleation and grain initiation on a single substrate. Metals 2022, 12, 1454. [Google Scholar] [CrossRef]
- Easton, M.A.; Qian, M.; Prasad, A.; StJohn, D.H. Recent advances in grain refinement of light metals and alloys. Curr. Opin. Solid State Mater. Sci. 2016, 20, 13–24. [Google Scholar] [CrossRef]
- Kelton, K.F.; Greer, A.L. Nucleation in Condensed Mater: Applications in Materials and Biology; Elsevier Science: Oxford, UK, 2010. [Google Scholar]
- Nose, S.; Yonezawa, F. Isothermal-isobaric computer simulations of melting and crystallization of a Lennard-Jones system. J. Chem. Phys. 1986, 84, 1803–1814. [Google Scholar] [CrossRef]
- Auer, S.; Frenkel, D. Prediction of absolute crystal nucleation rate in hard-sphere colloids. Nature 2001, 409, 1020–1023. [Google Scholar] [CrossRef]
- Shibuta, Y.; Sakane, S.; Takaki, T.; Ohno, M. Submicrometer-scale molecular dynamics simulation of nucleation and solidification from undercooled melt: Linkage between empirical interpretation and atomistic nature. Acta Mater. 2016, 105, 328–337. [Google Scholar] [CrossRef]
- Mahata, A.; Zaeem, M.A.; Baskes, M. Understanding homogeneous nucleation in solidification of aluminum by molecular dynamics simulations. Model. Simul. Mater. Sci. Eng. 2018, 26, 025007. [Google Scholar] [CrossRef]
- Volmer, M.; Weber, A.Z. Nucleus formation in supersaturated systems. Z. Für Phys. Chem. 1926, 119, 277–301. [Google Scholar] [CrossRef]
- Becker, R.; Döring, W. Kinetic treatment of nucleation in supersaturated vapors. Ann. Phys. 1935, 24, 719–752. [Google Scholar] [CrossRef]
- Zeldovich, J.B. On the theory of new phase formation. Cavitation. Acta Physicochim. USSR 1943, 18, 1–22. [Google Scholar]
- Turnbull, D. Kinetics of heterogeneous nucleation. J. Chem. Phys. 1950, 18, 198. [Google Scholar] [CrossRef]
- Turnbull, D. Kinetics of solidification of supercooled liquid mercury droplets. J. Chem. Phys. 1952, 20, 411–424. [Google Scholar] [CrossRef]
- Moore, K.I.; Zhang, D.L.; Cantor, B. Solidification of Pb particles embedded in Al. Acta Metall. Mater. 1990, 38, 1327–1342. [Google Scholar] [CrossRef]
- Wang, Y.; Liu, X.; Hoose, C.; Wang, B. Different contact angle distributions for heterogeneous ice nucleation in the community atmospheric aodel version 5. Atmos. Chem. Phys. 2014, 14, 10411–10430. [Google Scholar] [CrossRef]
- Cantor, B. Heterogeneous nucleation and adsorption. Philos. Trans. R. Soc. Lond. Ser. A Math. Phys. Eng. Sci. 2003, 361, 409–417. [Google Scholar] [CrossRef]
- Kim, W.T.; Cantor, B. Solidification behaviour of Pb droplets embedded in a Cu matrix. Acta Metall. Mater. 1992, 40, 3339–3347. [Google Scholar] [CrossRef]
- Kim, W.T.; Cantor, B. Heterogeneous nucleation of Al2Cu in Al-Cu eutectic liquid droplets embedded in an Al matrix. Acta Metall. Mater. 1994, 42, 3045–3053. [Google Scholar] [CrossRef]
- Kim, W.T.; Zhang, D.L.; Cantor, B. Nucleation of solidification in liquid droplets. Metall. Trans. A 1991, 22A, 2487–2501. [Google Scholar] [CrossRef]
- Kim, W.T.; Cantor, B. Solidification of tin droplets embedded in an aluminium matrix. J. Mater. Sci. 1991, 26, 2868–2878. [Google Scholar] [CrossRef]
- Turnbull, D.; Vonnegut, B. Nucleation catalysis. Ind. Eng. Chem. 1952, 44, 1292–1298. [Google Scholar] [CrossRef]
- Fan, Z. An epitaxial model for heterogeneous nucleation on potent substrates. Metall. Mater. Trans. A 2013, 44, 1409–1418. [Google Scholar] [CrossRef] [Green Version]
- Zhang, M.X.; Kelly, P.M.; Easton, M.A.; Taylor, J.A. Crystallographic study of grain refinement in aluminum alloys using the edge-to-edge matching model. Acta Mater. 2005, 53, 1427. [Google Scholar] [CrossRef]
- Zhang, M.X.; Kelly, P.M.; Qian, M.; Taylor, J.A. Crystallography of grain refinement in Mg–Al based alloys. Acta Mater. 2005, 53, 3261. [Google Scholar] [CrossRef]
- Tóth, G.I.; Tegze, G.; Pusztai, T.; Gránásy, L. Heterogeneous crystal nucleation: The effect of lattice mismatch. Phys. Rev. Lett. 2012, 108, 025502. [Google Scholar] [CrossRef]
- Wang, L.; Yang, L.; Zhang, D.; Xia, M.; Wang, Y.; Li, J.G. The role of lattice misfit on heterogeneous nucleation of pure aluminium. Metall. Mater. Trans. A 2016, 47, 5012–5022. [Google Scholar] [CrossRef]
- Wang, L.; Lu, W.Q.; Hu, Q.D.; Xia, M.X.; Wang, Y.; Li, J.G. Interfacial tuning for the nucleation of liquid AlCu alloy. Acta Mater. 2017, 139, 75–85. [Google Scholar] [CrossRef]
- Fan, Z.; Men, H. A molecular dynamics study of heterogeneous nucleation in generic liquid/substrate systems with positive lattice misfit. Mater. Res. Express 2020, 7, 126501. [Google Scholar] [CrossRef]
- Men, H.; Fan, Z. Heterogeneous nucleation mechanisms in systems with large lattice misfit demonstrated by the Pb(l)/Cu(s) system. Metals 2022. in print. [Google Scholar]
- Wang, J.S.; Horsfield, A.; Schwingenschlögl, U.; Lee, P.D. Heterogeneous nucleation of solid Al from the melt by Al3Ti: Molecular dynamics simulations. Phys. Rev. B 2010, 82, 184203. [Google Scholar] [CrossRef]
- Wearing, D.; Horsfield, A.P.; Xu, W.W.; Lee, P.D. Which wets TiB2 inoculant particles: Al or Al3Ti? J. Alloys Compd. 2016, 664, 460–468. [Google Scholar] [CrossRef]
- Palafox-Hernandez, J.P.; Laird, B.B. Orientation dependence of heterogeneous nucleation at the Cu-Pb solid-liquid interface. J. Chem. Phys. 2016, 145, 211914. [Google Scholar] [CrossRef] [PubMed]
- Sosso, G.C.; Li, T.S.; Donadio, D.; Tribello, G.A.; Michaelides, A. Microscopic mechanism and kinetics of ice formation at complex interfaces: Zooming in on kaolinite. J. Phys. Chem. Lett. 2016, 7, 2350–2355. [Google Scholar] [CrossRef] [PubMed]
- Cabriolu, R.; Li, T.S. Ice nucleation on carbon surface supports the classical theory for heterogeneous nucleation. Phys. Rev. E 2015, 91, 052402. [Google Scholar] [CrossRef] [PubMed]
- Lin, H.H.; Li, T.; Li, H. Molecular dynamics study on the heterogeneous nucleation of liquid Al-Cu alloys on different kinds of copper substrates. Phys. Chem. Chem. Phys. 2018, 20, 29856–29865. [Google Scholar] [CrossRef] [PubMed]
- Fujinaga, T.; Shibuta, Y. Molecular dynamics simulation of athermal heterogeneous nucleation of solidification. Comput. Mater. Sci. 2019, 164, 74–81. [Google Scholar] [CrossRef]
- Mithen, J.P.; Sear, R.P. Computer simulation of epitaxial nucleation of a crystal on a crystalline surface. J. Chem. Phys. 2014, 140, 084504. [Google Scholar] [CrossRef] [PubMed]
- Greer, A.L. Liquid metals: Supercool order. Nat. Mater. 2006, 5, 13–14. [Google Scholar] [CrossRef]
- Men, H.; Fan, Z. Prenucleation induced by crystalline substrates. Metall. Mater. Trans. A 2018, 49, 2766–2777. [Google Scholar] [CrossRef]
- Fang, C.M.; Men, H.; Fan, Z. Effect of substrate chemistry on prenucleation. Metall. Mater. Trans. A 2018, 49, 6231–6242. [Google Scholar] [CrossRef]
- Jiang, B.; Men, H.; Fan, Z. Atomic ordering in the liquid adjacent to an atomic-level rough substrate surface. Comput. Mater. Sci. 2018, 153, 73–81. [Google Scholar] [CrossRef]
- Zope, R.R.; Mishin, Y. Interatomic potentials for atomistic simulations of the Ti-Al system. Phys. Rev. B 2003, 68, 024102. [Google Scholar] [CrossRef]
- Todorov, I.T.; Smith, W.; Trachenko, K.; Dove, M.T. DL_POLY_3: New dimensions in molecular dynamics simulations via massive parallelism. J. Mater. Chem. 2006, 16, 1911–1918. [Google Scholar] [CrossRef] [Green Version]
- Hashibon, A.; Adler, J.; Finnis, M.W.; Kaplan, W.D. Ordering at solid-liquid interfaces between dissimilar materials. Interface Sci. 2001, 9, 175–181. [Google Scholar] [CrossRef]
- Hook, J.R.; Hall, H.E. Solid State Physics, 2nd ed.; Wiley: Chichester, UK, 1991. [Google Scholar]
- Jackson, K.A. The interface kinetics of crystal growth processes. Interface Sci. 2002, 10, 159–169. [Google Scholar] [CrossRef]
- Steinhardt, P.J.; Nelson, D.R.; Ronchetti, M. Bond-orientational order in liquids and glasses. Phys. Rev. B 1983, 28, 784–805. [Google Scholar] [CrossRef]
- Baumgartner, J.; Dey, A.; Bomans, P.H.H.; Coadou, C.L.; Fratzl, P.; Sommerdijk, N.A.J.M.; Faivre, D. Nucleation and growth of magnetite from solution. Nat. Mater. 2013, 12, 310–314. [Google Scholar] [CrossRef]
- Kaplan, W.D.; Kauffmann, Y. Structural order in liquids induced by interfaces with crystal. Annu. Rev. Mater. Res. 2006, 36, 1–48. [Google Scholar] [CrossRef]
- Oh, S.H.; Kauffmann, Y.; Scheu, C.; Kaplan, W.D.; Rühle, M. Ordered liquid aluminium at the interface with sapphire. Science 2005, 310, 661–663. [Google Scholar] [CrossRef]
- Kauffmann, Y.; Oh, S.H.; Koch, C.T.; Hashibon, A.; Scheu, C.; Rühle, M.; Kaplan, W.D. Quantitative analysis of layering and in-plane ordering at an alumina-aluminium solid-liquid interface. Acta Mater. 2011, 59, 4378–4386. [Google Scholar] [CrossRef]
- Geysermans, P.; Gorse, D.; Pontikis, V. Molecular dynamics study of the solid-liquid interface. J. Chem. Phys. 2000, 113, 6382–6389. [Google Scholar] [CrossRef]
- Hashibon, A.; Adler, J.; Finnis, M.W.; Kaplan, W.D. Atomistic study of structural correlations at a liquid-solid interface. Comp. Mater. Sci. 2002, 24, 443–452. [Google Scholar] [CrossRef]
- Yang, Y.; Olmsted, D.L.; Asta, M.; Laird, B.B. Atomistic characterization of the chemically heterogeneous Al-Pb solid-liquid interface. Acta Mater. 2012, 60, 4960–4971. [Google Scholar] [CrossRef]
- Palafox-Hernandez, J.P.; Laird, B.B.; Asta, M. Atomistic characterization of the Cu-Pb solid-liquid interface. Acta Mater. 2011, 59, 3137–3144. [Google Scholar] [CrossRef]
- Men, H.; Fang, C.M.; Fan, Z. Prenucleation at the liquid/substrate interface: An overview. Metals 2022. in review. [Google Scholar]
- Fan, Z.; Wang, Y.; Zhang, Y.; Qin, T.; Zhou, X.R.; Thompson, G.E.; Pennycook, T.; Hashimoto, T. Grain refining mechanism in the Al/Al-Ti-B system. Acta Mater. 2015, 84, 292–304. [Google Scholar] [CrossRef]
- Men, H.; Fan, Z. Molecular dynamics simulations on effect of surface roughness of amorphous substrate on nucleation in liquid Al. Metals 2022, 12, 1529. [Google Scholar] [CrossRef]
- Fan, Z.; Wang, Y.; Xia, M.X.; Arumuganathar, S. Enhanced heterogeneous nucleation in AZ91D alloy by intensive melt shearing. Acta Mater. 2009, 57, 4891–4901. [Google Scholar] [CrossRef]
- Wang, Y.; Zhou, L.; Fan, Z.Y. Mechanism of zirconium poisoning effect on TiB2 inoculation in aluminium alloys. In Light Metals; Springer: Cham, Switzerland, 2016; pp. 725–729. [Google Scholar]
- O’reilly, K.A.Q.; Cantor, B. Solidification behavior of Al particles embedded in a Zr aluminide matrix. Acta Metall. Mater. 1995, 43, 405–417. [Google Scholar] [CrossRef]
- Zhang, D.L.; Cantor, B. Melting behavior of In and Pb particles embedded in an Al matrix. Acta Metall. Mater. 1991, 39, 1595–1602. [Google Scholar] [CrossRef]
- Goswami, R.; Chattopadhyay, K.; Kim, W.T.; Cantor, B. Heterogeneous nucleation of Pb particles embedded in a Zn matrix. Metall. Trans. A 1992, 23A, 3207. [Google Scholar]
- Zhang, D.L.; Cantor, B. Heterogeneous nucleation of In particles embedded in an AI matrix. Phil. Mag. A 1990, 62, 557–572. [Google Scholar] [CrossRef]
- Sun, Y.; Zhang, F.; Song, H.J.; Mendelev, M.I.; Wang, C.-Z.; Ho, K.-M. Temperature dependence of the solid-liquid interface free energy of Ni and Al from molecular dynamics simulation of nucleation. J. Chem. Phys. 2018, 149, 174501. [Google Scholar] [CrossRef] [PubMed]
- Hirth, J.P.; Lothe, J. Theory of Dislocations, 2nd ed.; John Wiley: New York, NY, USA, 1982. [Google Scholar]
- Gillan, M.J. Calculation of the vacancy formation energy in aluminium. J. Phys. Condens. Matter 1989, 1, 689. [Google Scholar] [CrossRef]
Figure 1.
Precursor of heterogeneous nucleation [11]. Precursor represents the atomic arrangement at the L/N interface at the end of prenucleation or at the onset of nucleation. (a) A snapshot, and (b) atomic density profile, ρ(z), and (c) in-plane order parameter, S(z), as a function of the distance, z, from the substrate surface (z = 0 Å) for the simulation system with −8% misfit at t = 0 ps and Tn = 760 K. There are 6 notable atomic layers in the liquid, but only the first three layers contain some degree of in-plane ordering. (d–g) show the time-averaged atomic positions in the first (L1), second (L2), third (L3) and forth (L4) layers at the L/N interface. It exhibits substantially ordered structure in the L1 and L2, and less ordered in the L3, and disordered in the L4.
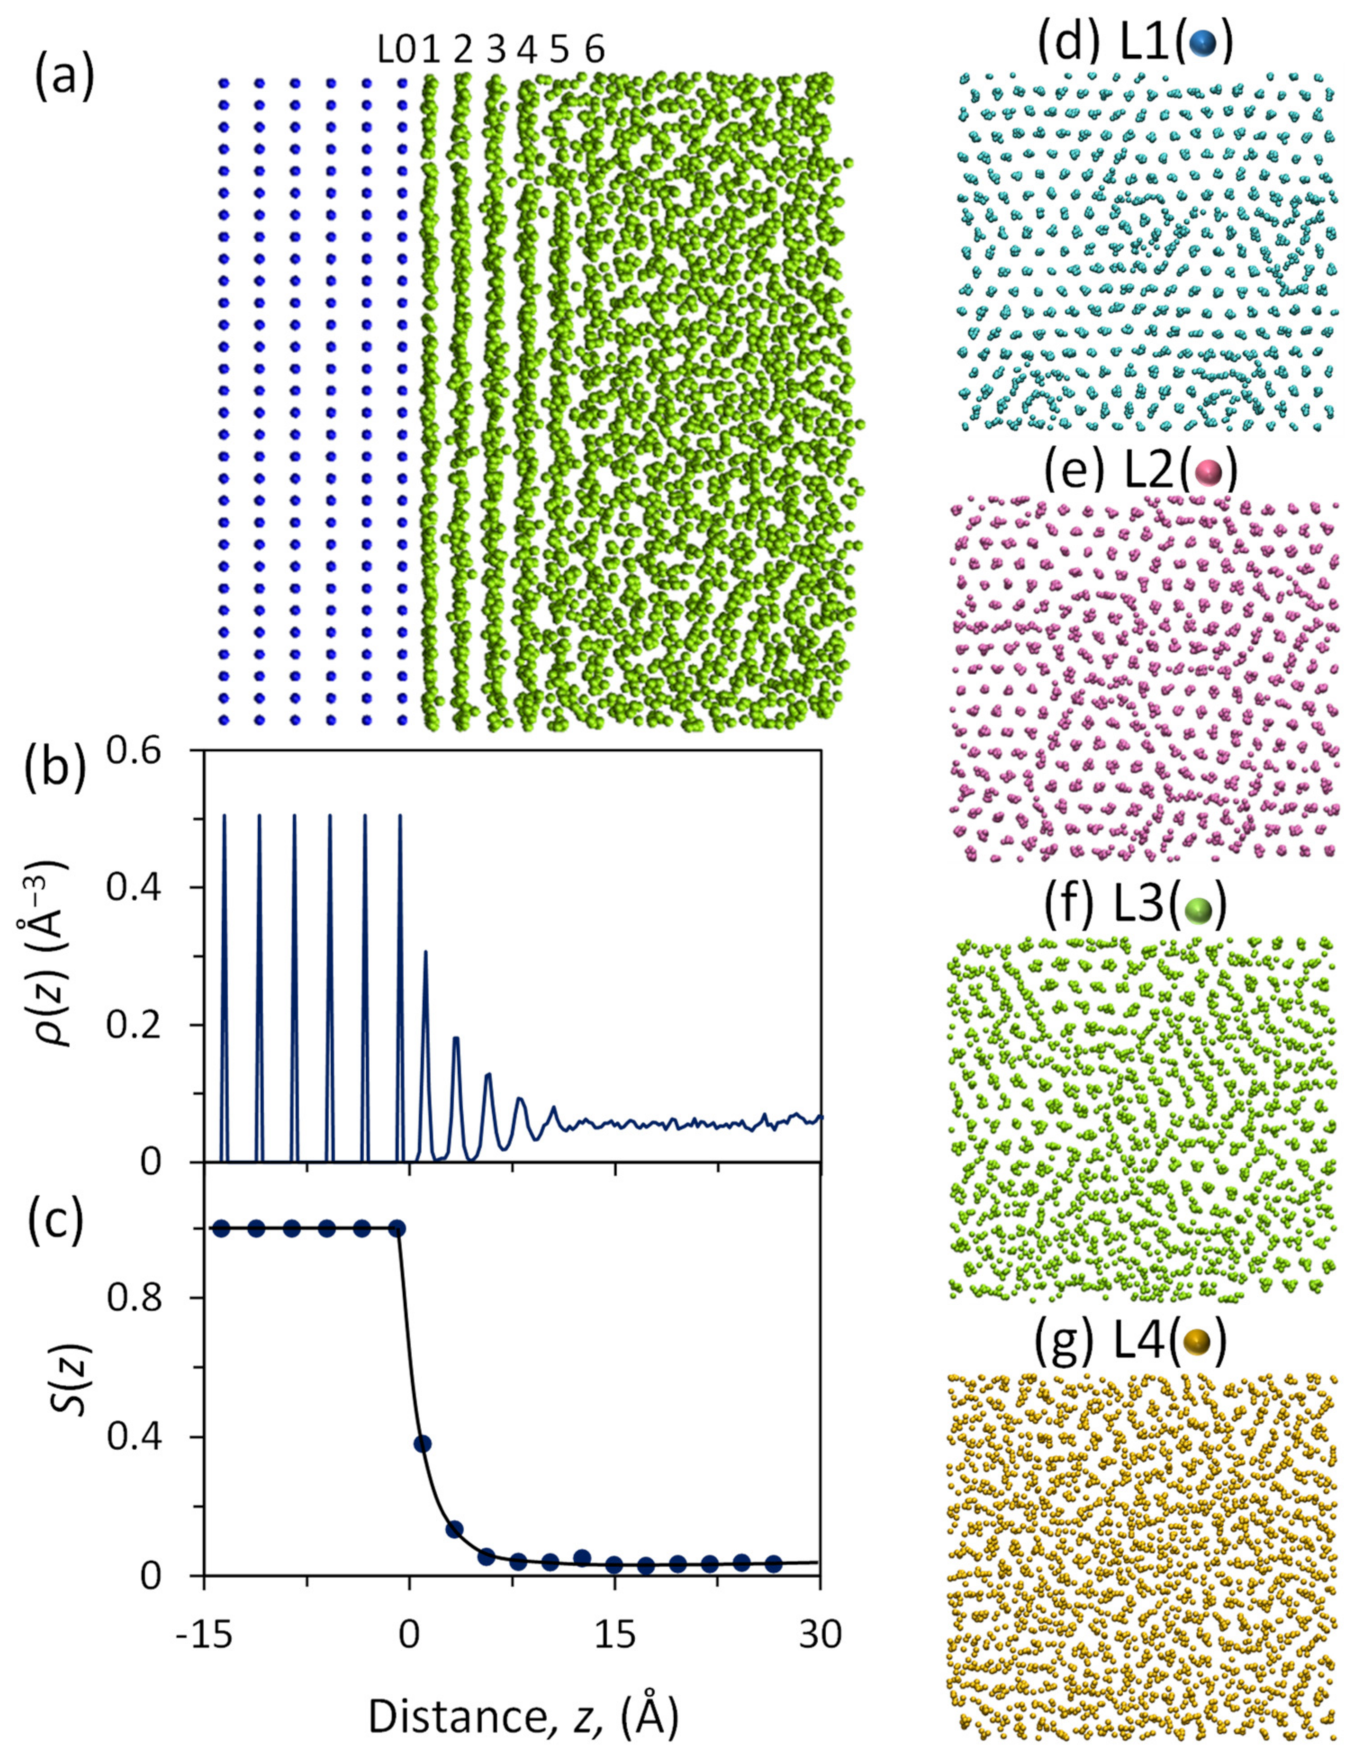
Figure 2.
2D ordered structure at the onset of heterogeneous nucleation. (a) A 3D view and (b) a top view of the arrangement of solid atoms on the substrate at the onset of heterogeneous nucleation (t = 0 ps and Tn = 760 K) in the system with −8% misfit showing a 2D ordered structure as a consequence of structural templating; (c) a top view and (d) a front view (A-A slab section) of (b) showing the arrangement of solid atoms in the diffuse L/N interface. The liquid atoms have been removed from the snapshot of the simulation system with the local bond-order analysis.
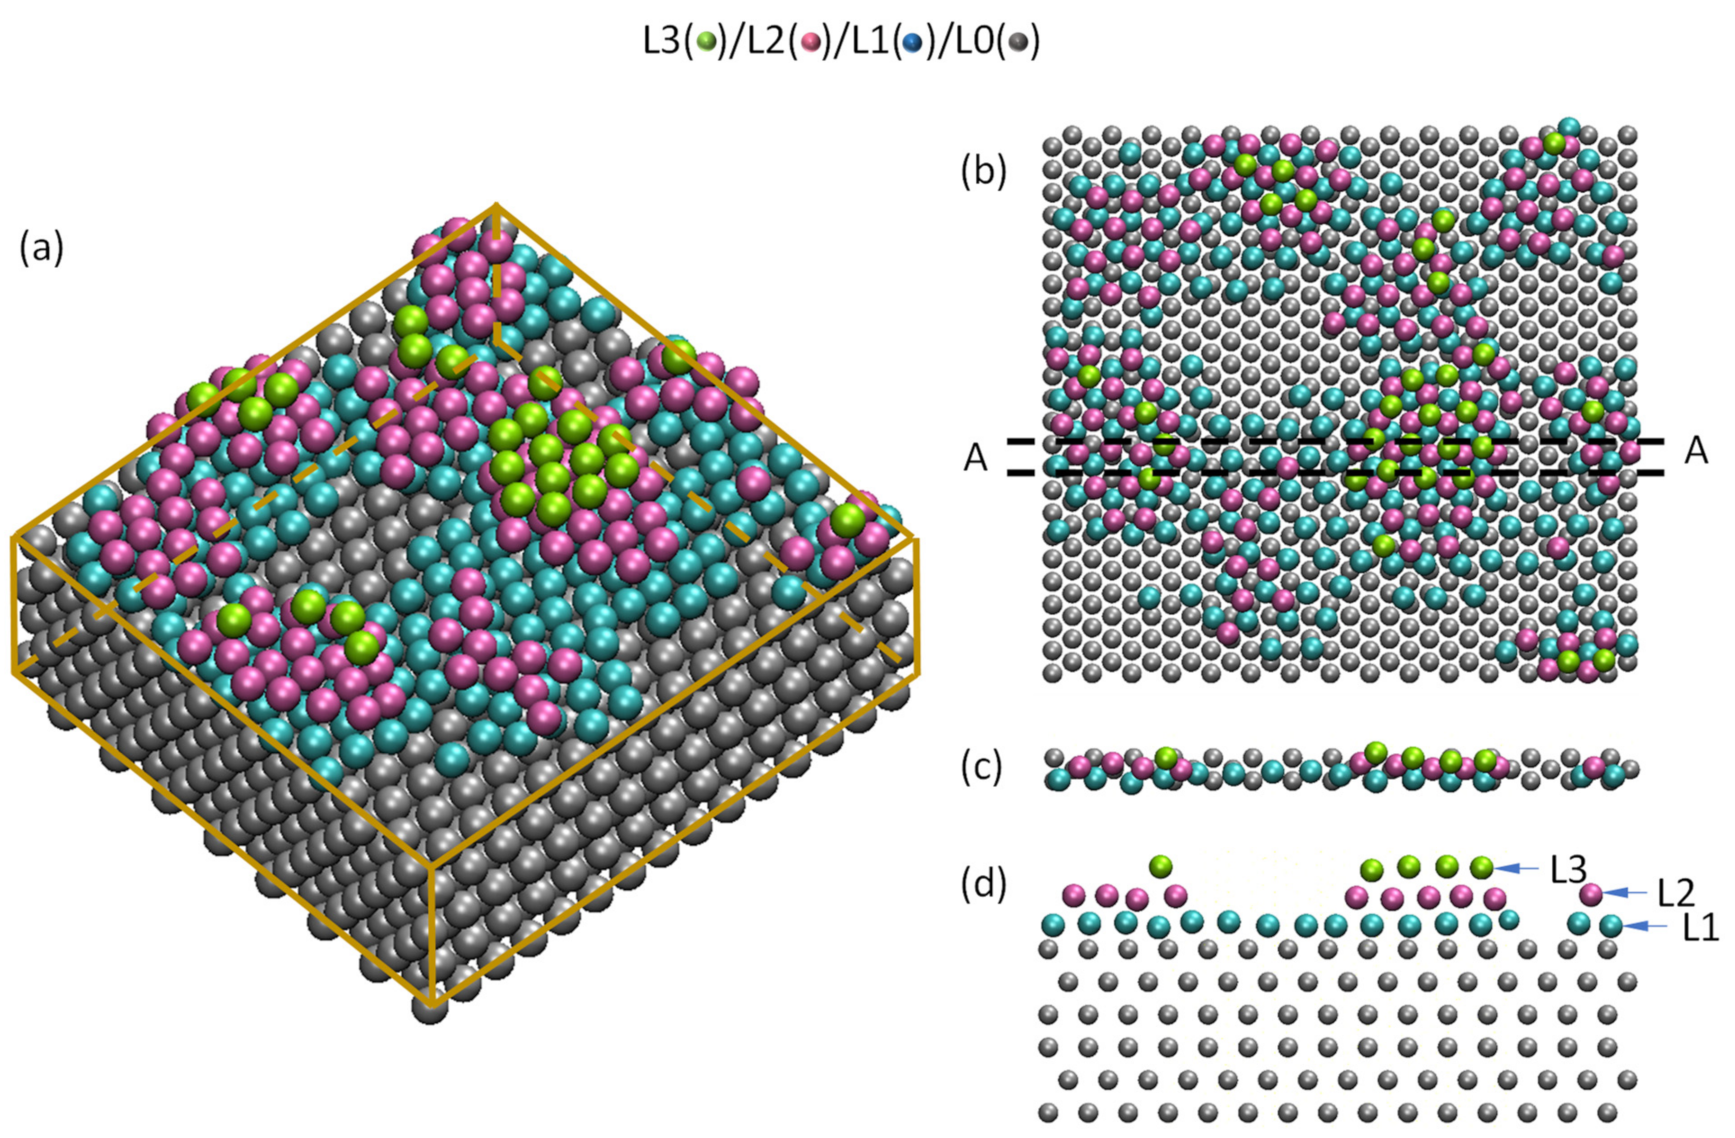
Figure 3.
A new substrate is produced by prenucleation in the Pb(l)/Cu(s) system equilibrated at 625 K (Tl = 618 K) [39]. (a) Time averaged atomic positions showing a completely ordered Pb layer, which will act as the new substrate for heterogeneous nucleation; (b) time averaged atomic positions in the ordered Pb layer superimposed on that of the top layer of the Cu surface (L1Cu) showing that the ordered Pb layer (a) is a coincidence site lattice (CSL) relative to L1Cu; (c) snapshot of CSL/L1Cu showing the matching pattern in the CSL unit cell; and (d) schematic illustration of the CSL unit cell showing the matching rule, 3dPb = 4dCu, where d is the atomic spacing along the <011> directions.
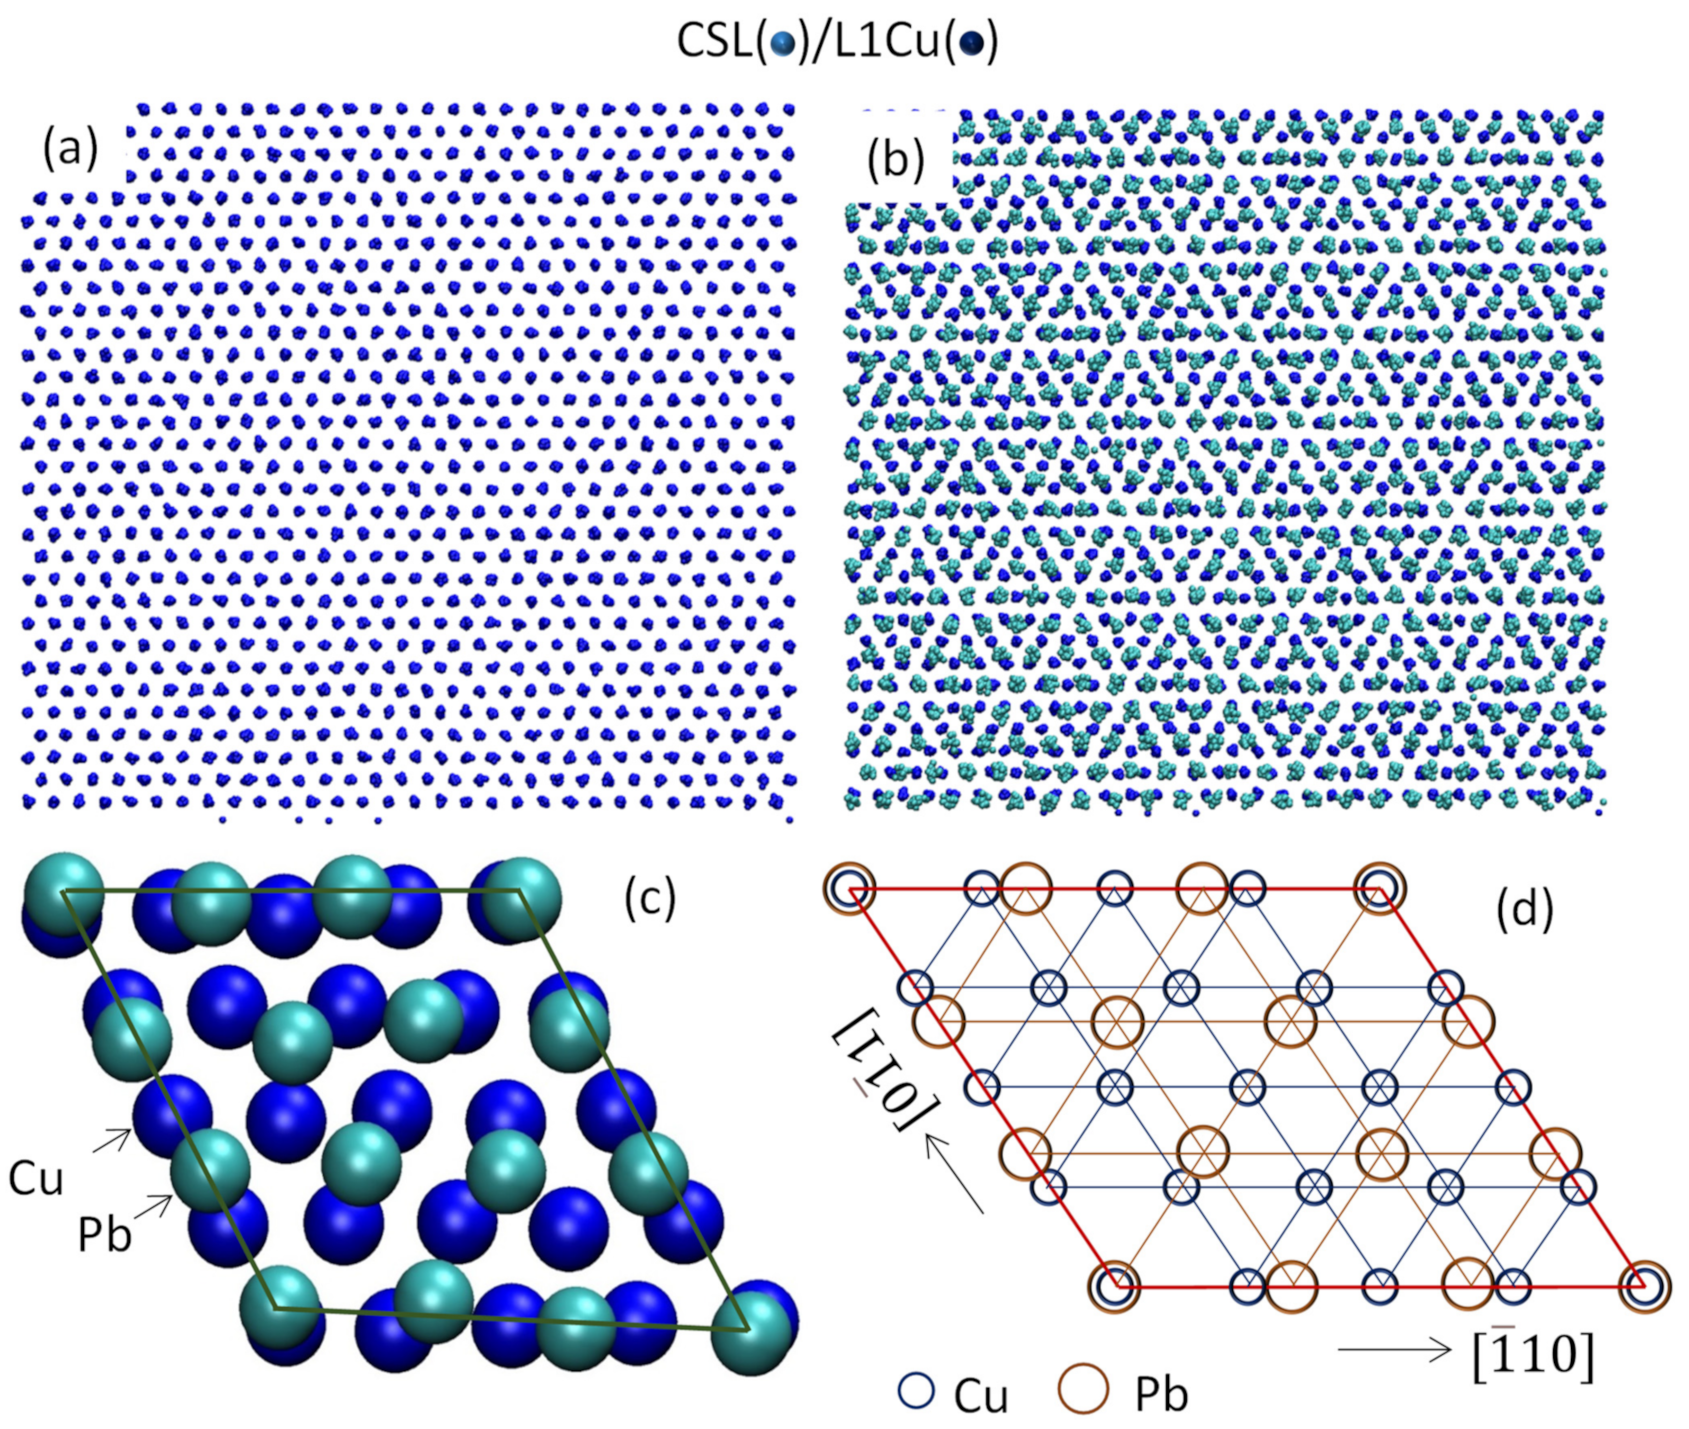
Figure 4.
Formation of the (112) Al3Ti 2DC as new substrate in the Al/TiB2 system [67] (Copyright 2017 The Minerals, Metals & Materials Society. Used with permission). (a) HAADF image showing the existence of (112) Al3Ti 2DC (2-dimensional compound) on top of the TiB2 surface; (b) Ti-terminated (0 0 0 1) plane of TiB2 surface, (c) (112) Al3Ti 2DC; (d) (111) plane of Al; and (e) 3D construction of the Al3Ti 2DC layer on TiB2 surface. It indicates that Al3Ti 2DC forms at the interface of the liquid Al/TiB2, and changes the (0001) TiB2 (−4.22% misfit) into an extremely potent TiB2/Al3Ti 2DC substrate (0.09% misfit).

Figure 5.
Schematic illustration of the early stages of solidification processes on a single substrate. Heterogeneous nucleation through the 3-layer nucleation mechanism delivers a 2D nucleus. However, further growth is constrained by the curvature of the L/N interface and can only occur by increasing the undercooling. Grain initiation is completed by growing the solid beyond the hemisphere where free growth is possible isothermally.
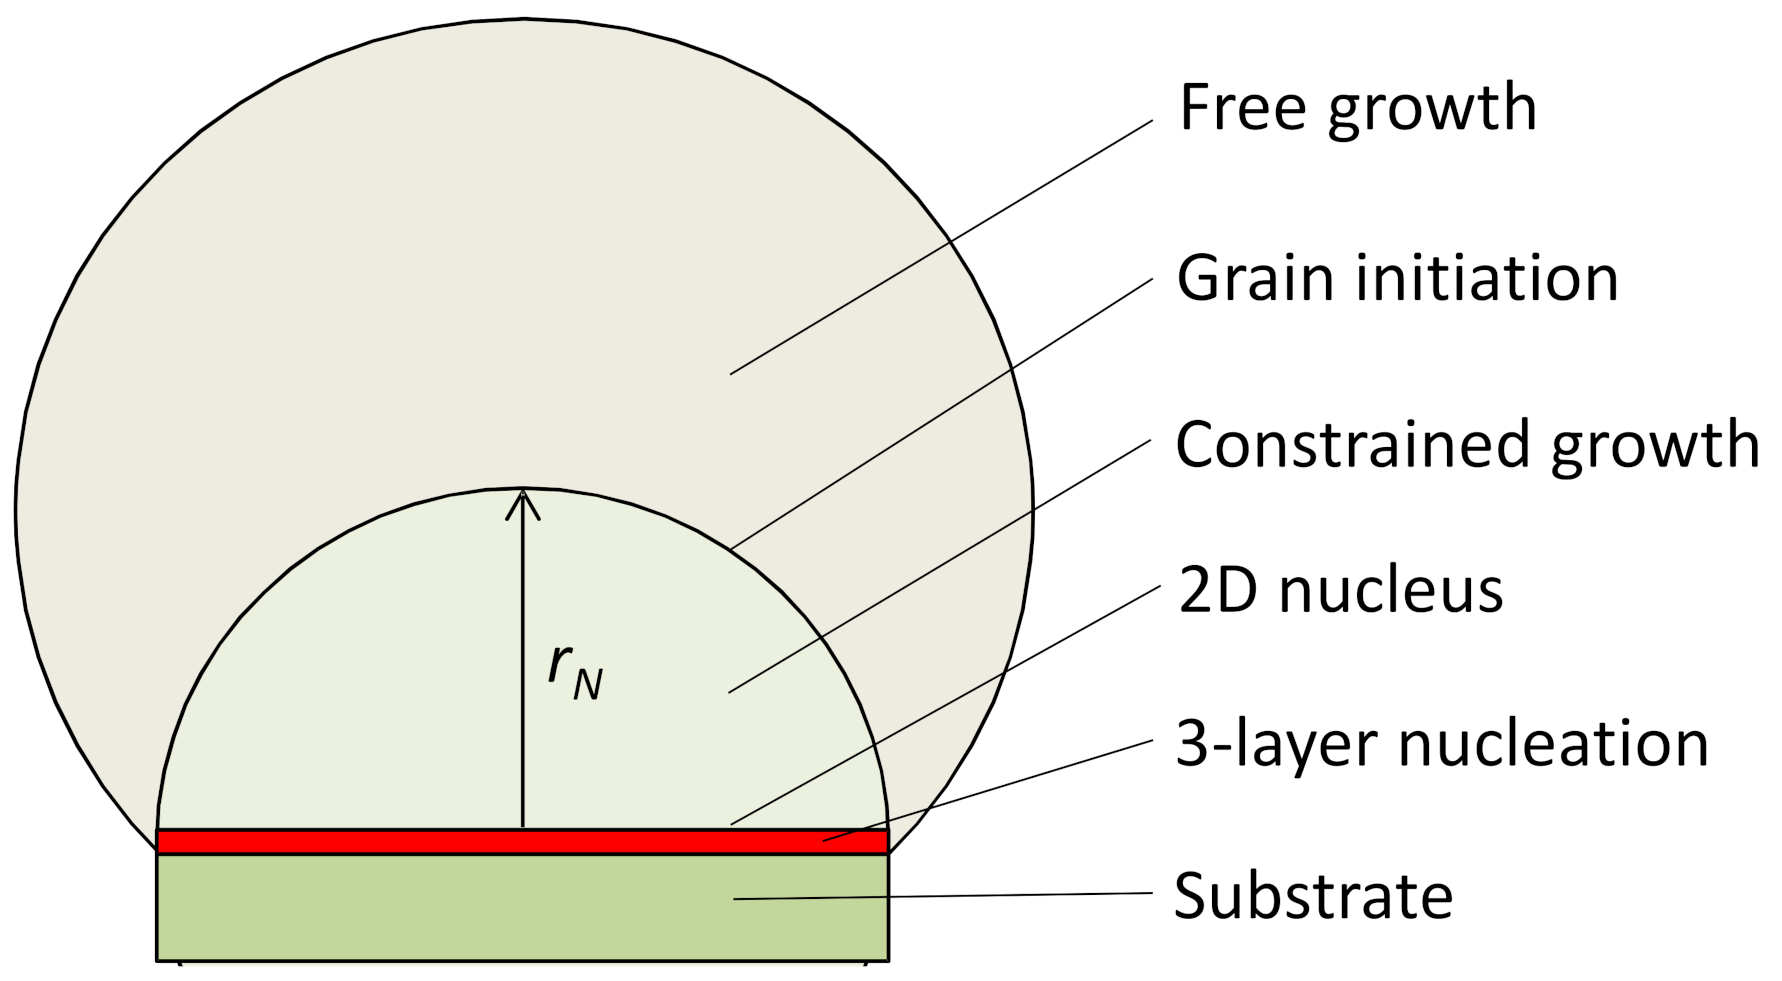
Figure 6.
Heterogeneous nucleation produces a 2D nucleus (L3) which is a crystal plane of the new phase [11]. The atomic arrangement at the end of heterogeneous nucleation (t = 50 ps) in the simulation system with −8% misfit at Tn = 760 K. (a) A snapshot, and (b) the quantified atomic density profile, ρ(z), and (c) in-plane atomic order parameter, S(z), as a function of the distance, z, from the substrate surface (z = 0 Å). Time-averaged atomic positions in (d) L1 on top of L0 (substrate surface) showing the partial edge dislocation network; (e) L2 on top of L1 showing the partial screw dislocation network; and (f) L3 showing the 2D nucleus which is a plane of the new phase ({111} of Al). b1, b2, b3 and the arrows represent the Burges vectors of the Shockley partial dislocations in L1 and L2. B and C in (d) and (e) represent the stacking sequence of fcc{111}.
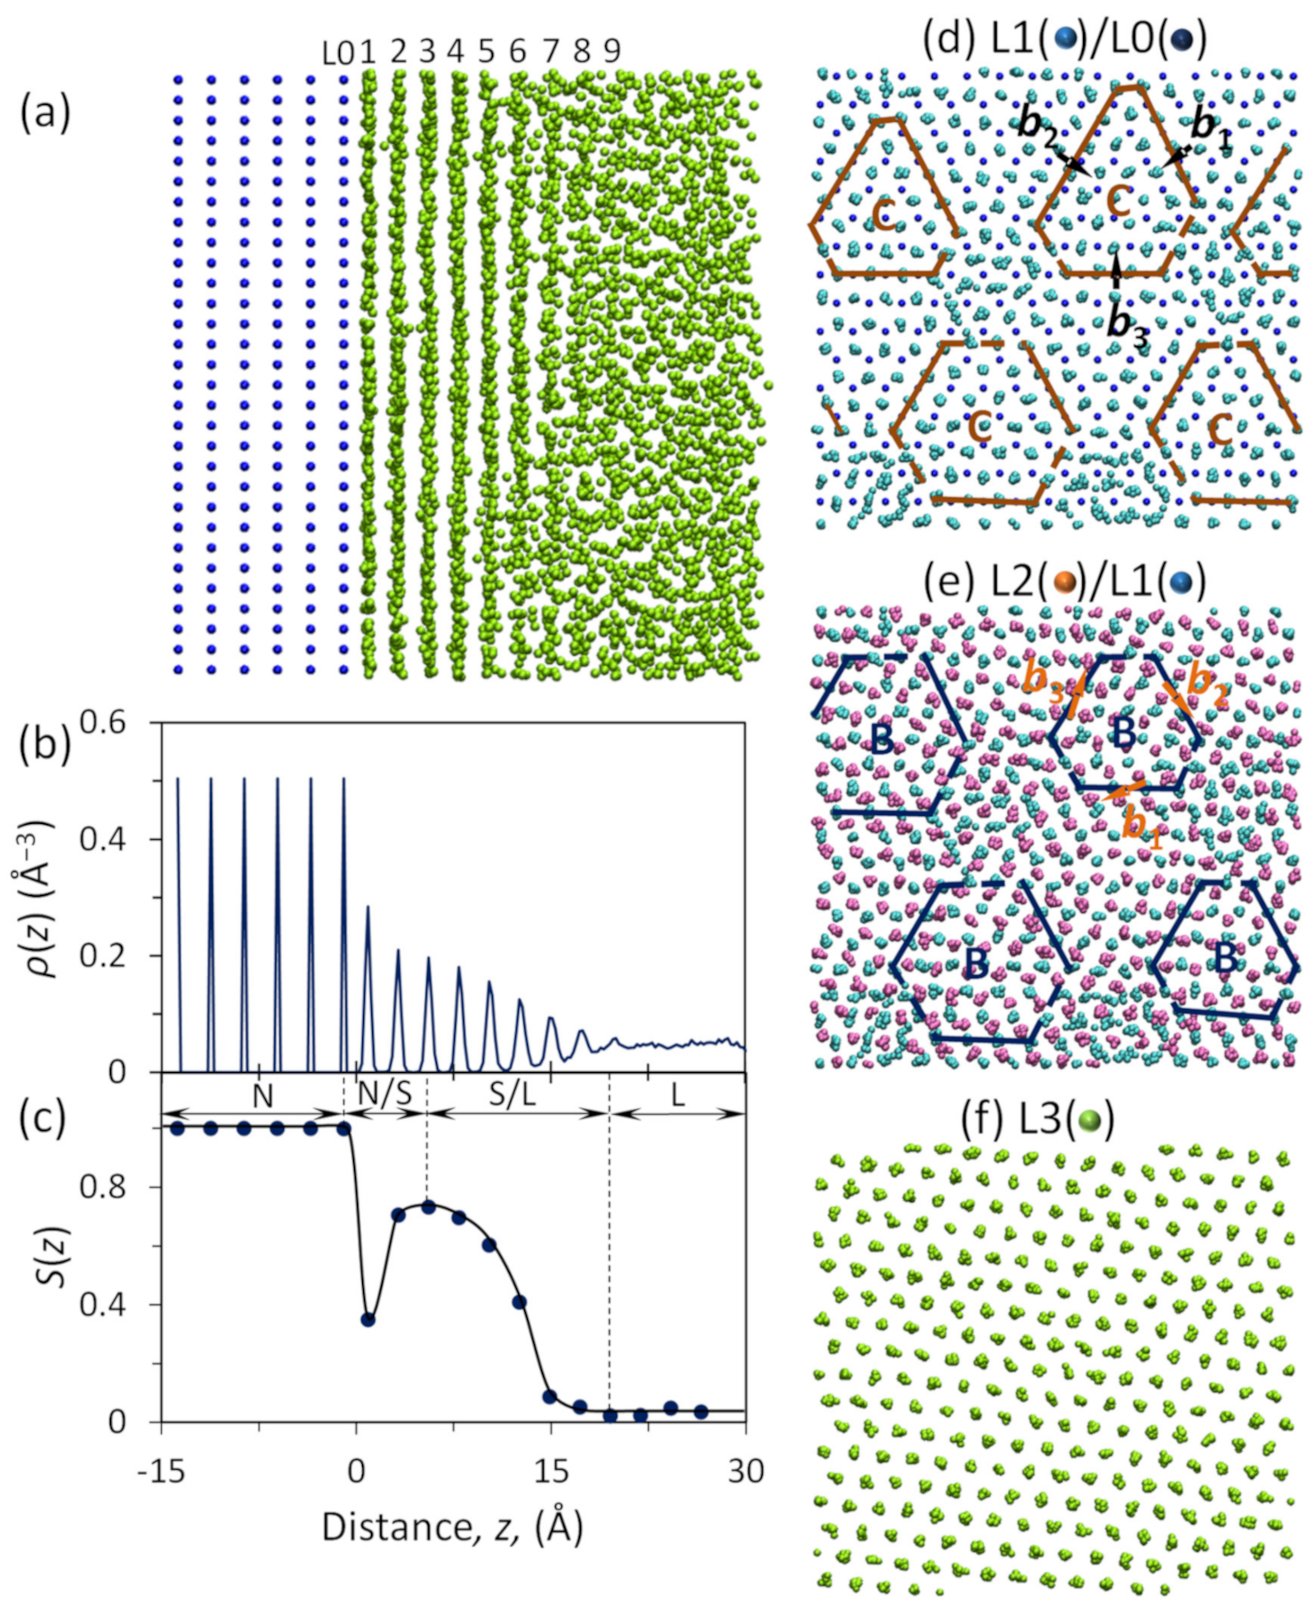
Figure 7.
Ordered structure at the end of heterogeneous nucleation. (a) A 3D view and (b) a top view of the arrangement of solid atoms on the substrate at the end of heterogeneous nucleation (t = 50 ps and Tn = 760 K) in the system with −8% misfit showing a 2D ordered structure as a consequence of structural templating; (c) a top view and (d) a front view (A-A slab section) of (b) showing the arrangement of solid atoms in the S/N interface (L1–L3) and the diffuse L/S interface (L4–L9).
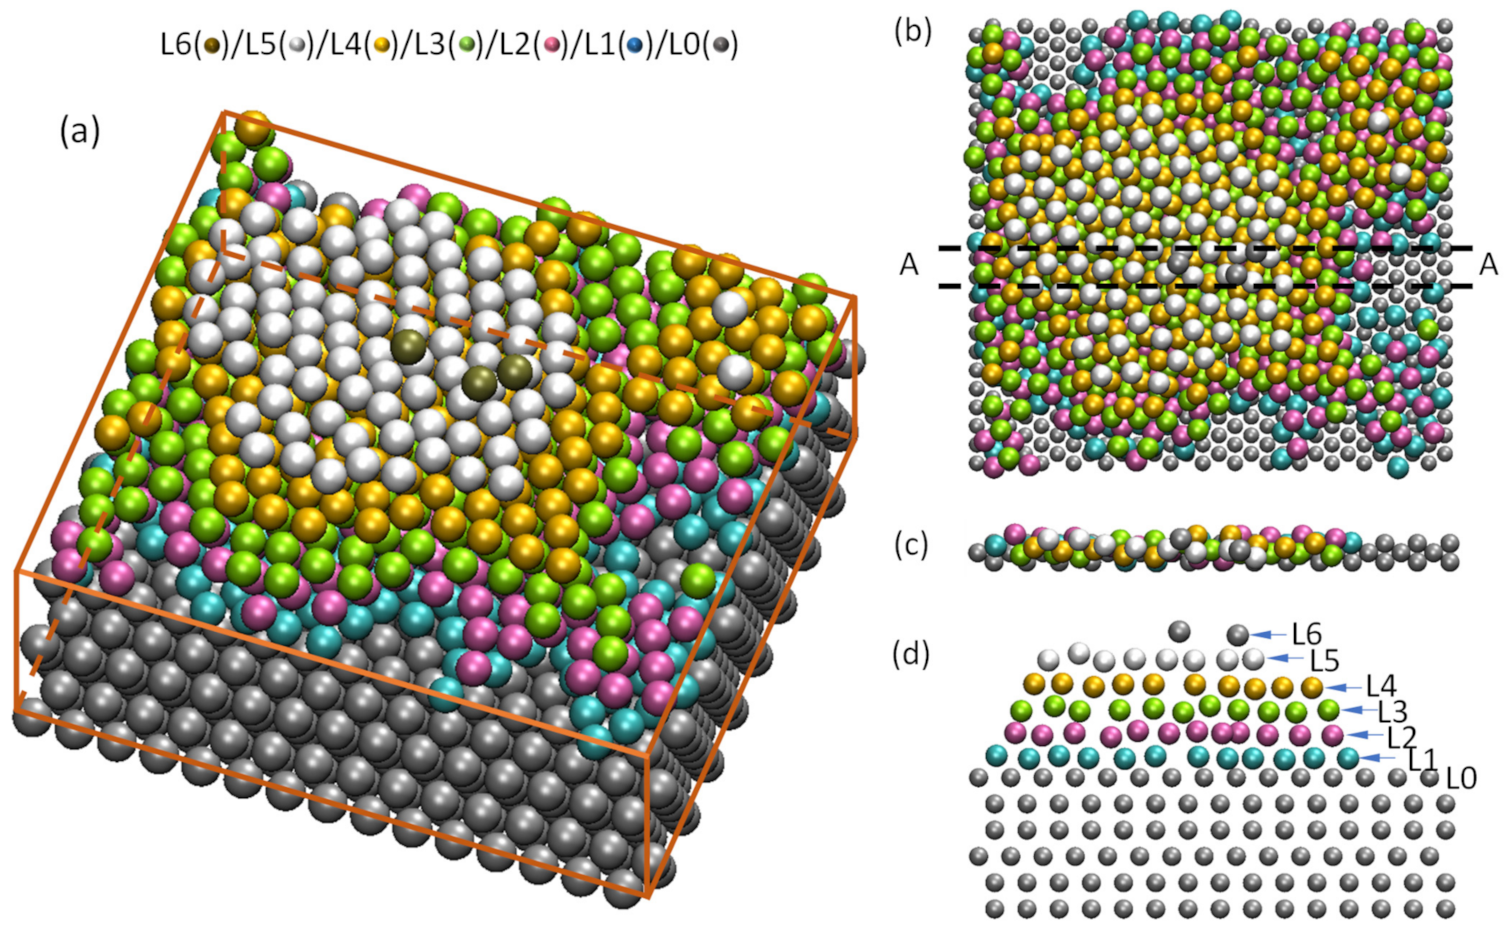
Figure 8.
Mechanisms of heterogeneous nucleation demonstrated by a system with −8% misfit. (a) Average in-plane atomic spacing (da) in the individual layer as a function of time showing the structural transition from the substrate to the new solid within the first 3 atomic layers; (b) lattice misfit accommodated in each atomic layer showing that the misfit between the substrate and the solid is mainly accommodated by the 1st layer (L1); and (c) the twist angle of each layer relative to the previous layer showing that L2 twists an angle (α = 5°) relative to L1.
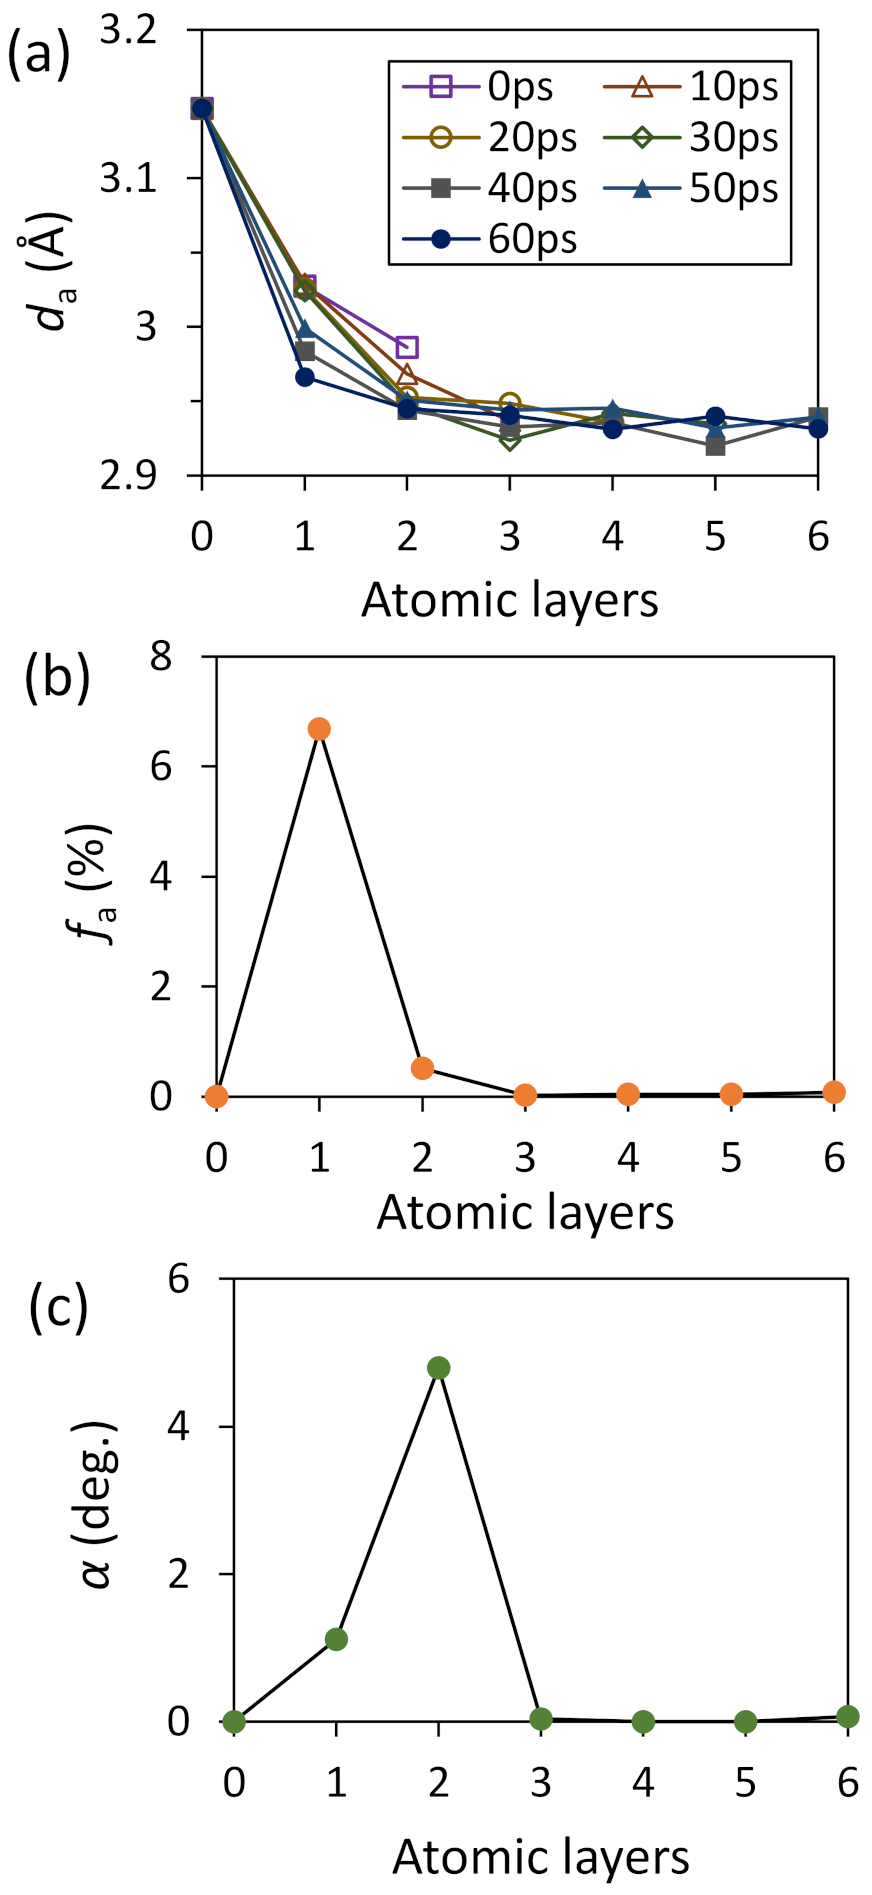
Figure 9.
Effect of lattice misfit [11]. (a) lattice misfit accommodated by L1 (fa), (b) the total twist angle (α) of the solid relative the substrate; and (c) the nucleation undercooling (ΔTn) as a function of the initial lattice misfit (f).
Figure 9.
Effect of lattice misfit [11]. (a) lattice misfit accommodated by L1 (fa), (b) the total twist angle (α) of the solid relative the substrate; and (c) the nucleation undercooling (ΔTn) as a function of the initial lattice misfit (f).

Figure 10.
Experimental validation of lattice twist in systems with negative misfit [67] (Copyright 2017 The Minerals, Metals & Materials Society. Used with permission). High resolution TEM micrograph showing that on the (0001) TiB2 substrate there exists an epitaxial first layer (L1(Al)) and a twist of the solid Al relative to the TiB2 substrate. {111} Al has a is misfit of −4.2% with the (0001) TiB2 substrate. The tilting experiment during TEM examination has confirmed a 4.7° twist of Al relative to the TiB2 substrate.
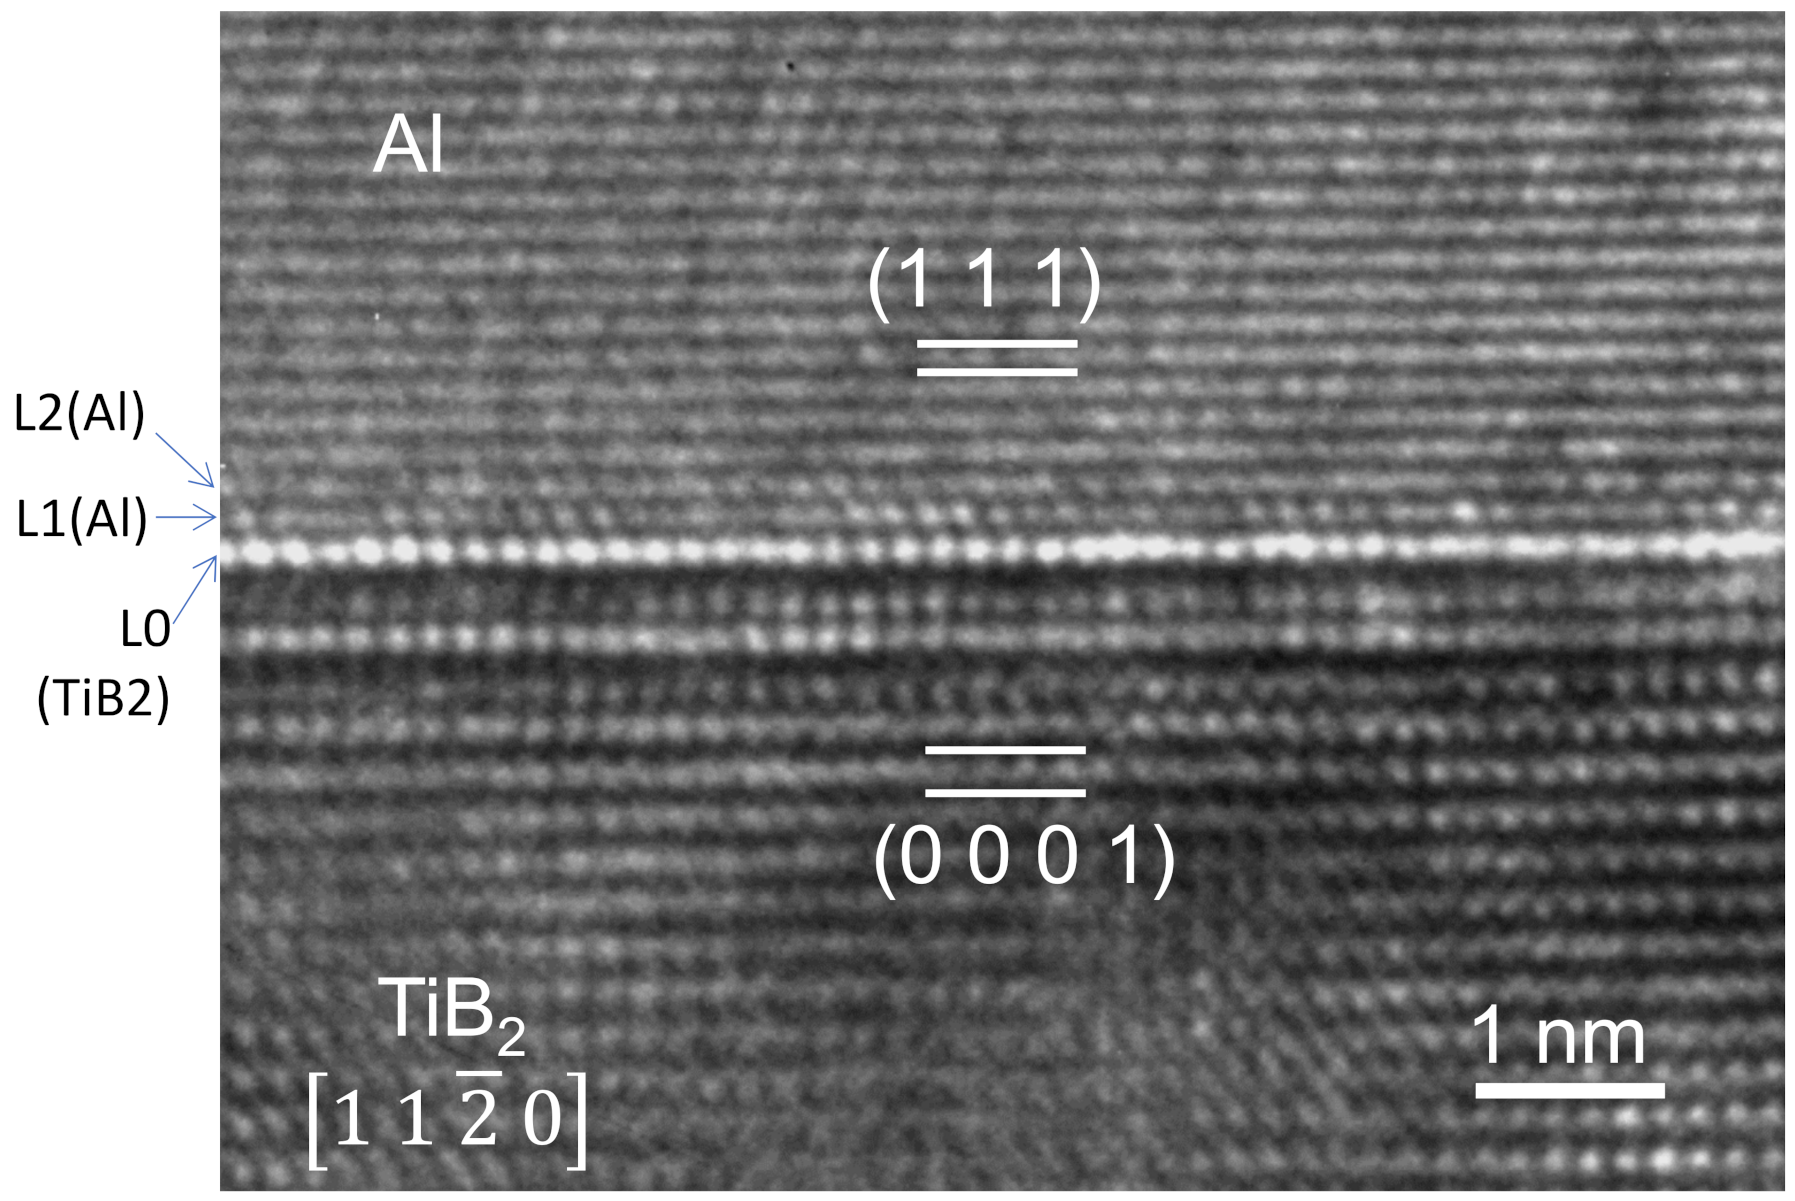
Figure 11.
Heterogeneous nucleation mechanism in systems with positive misfit [38]. For the system with 8% misfit, nucleation occurred at Tn = 739 K and finished at t = 50 ps. (a) A snapshot of L1 and (b) a snapshot of L1 on top of L0 (the substrate) showing epitaxy relationship between L1 and L0; (c) a snapshot of L2 showing the existence of vacancies in L2; and (d) a snapshot of L3 showing the 2D nucleus which is a plane of the solid.
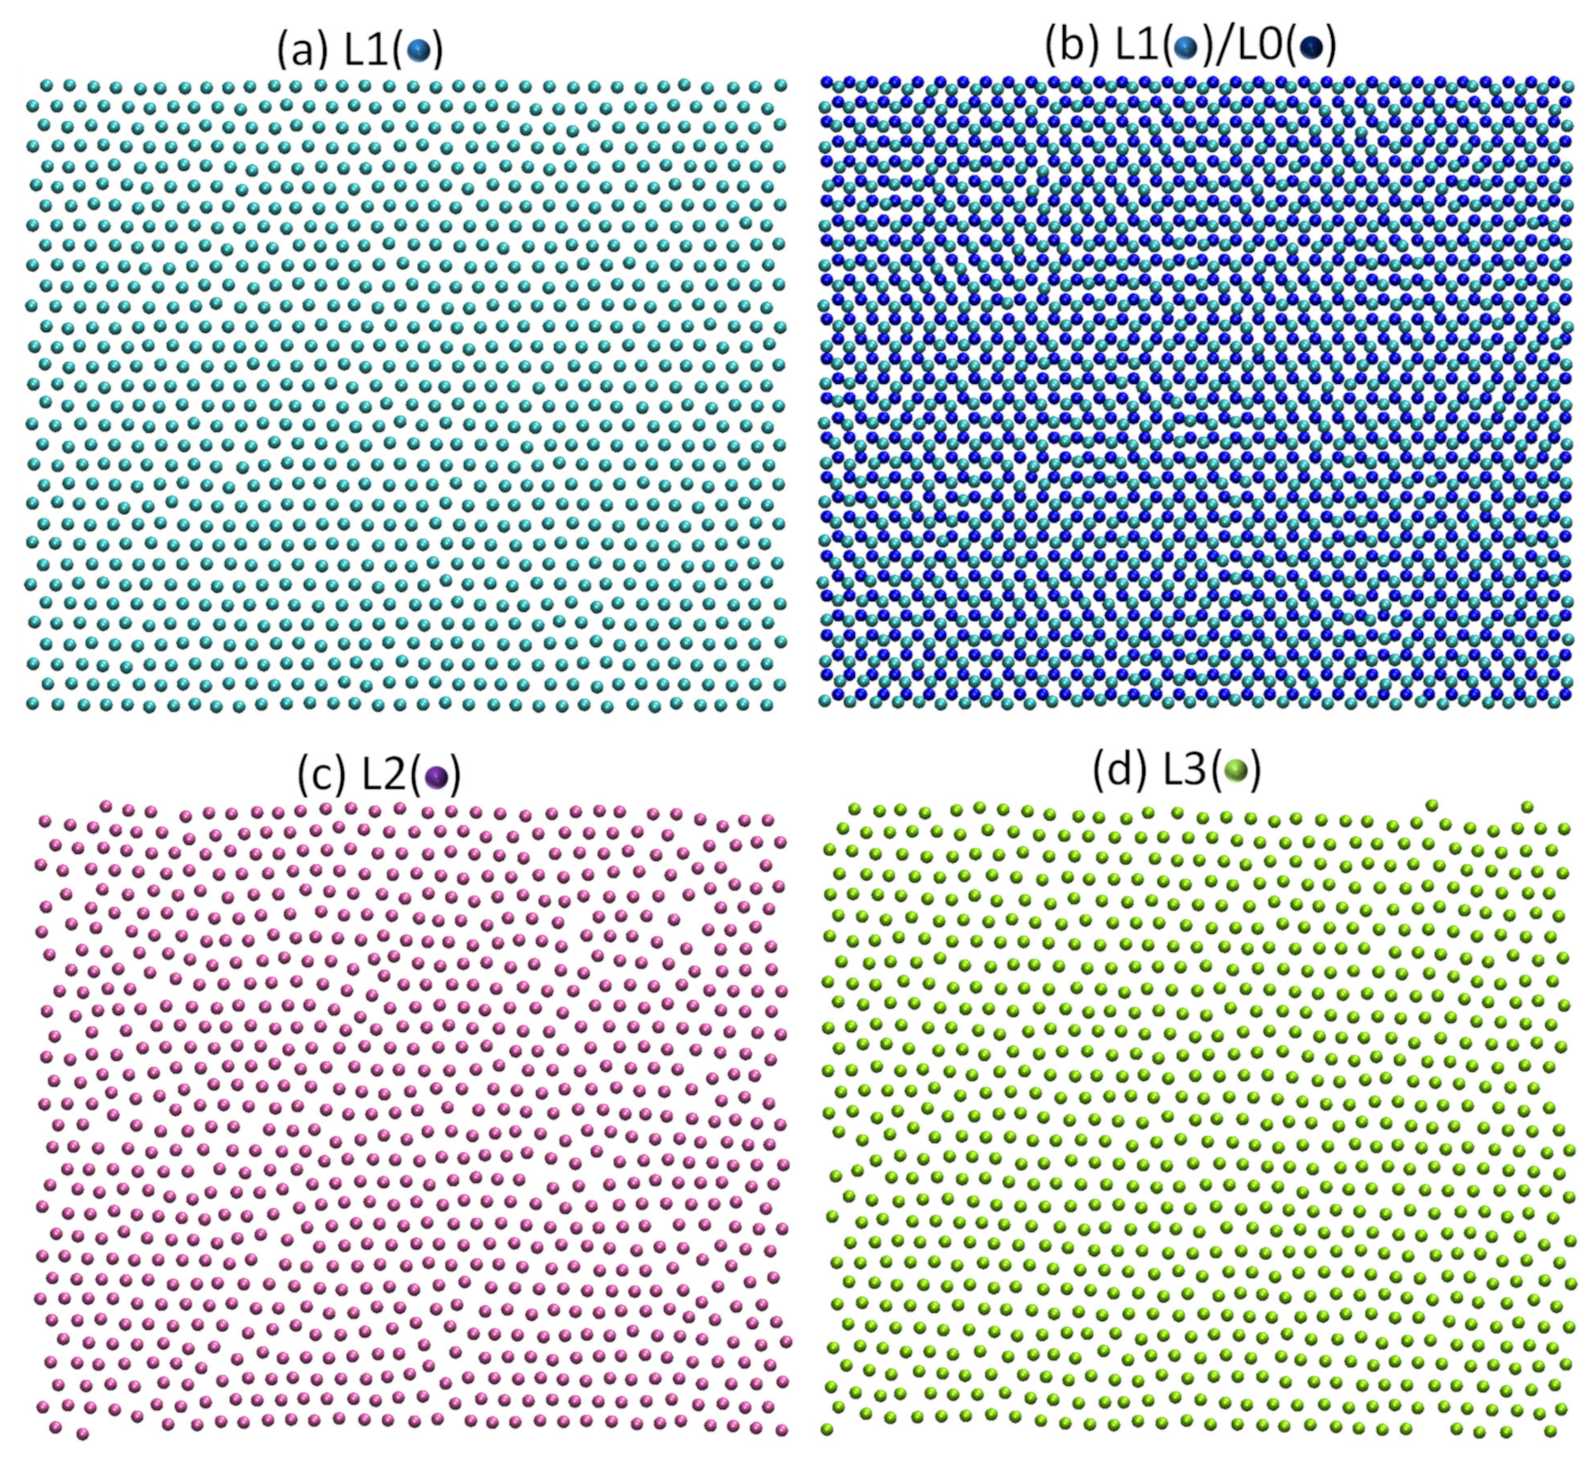
Figure 12.
Evolution of atomic ordering during heterogeneous nucleation in the systems with positive misfit [38]. The simulation system has 8% lattice misfit and is equilibrated at Tn = 739 K for t = 1 ns. (a) Average atomic spacing (da) in the ordered regions of each atomic layer as a function of time showing the structural transition from the substrate to the solid is complete within 3 atomic layers (L1, L2 and L3); (b) accommodated misfit in each atomic layer (fa) showing the lattice misfit is mainly accommodated by L2; and (c) vacancies in each atomic layer (fv) showing the misfit is accommodated in L2 by formation of vacancies in L2.
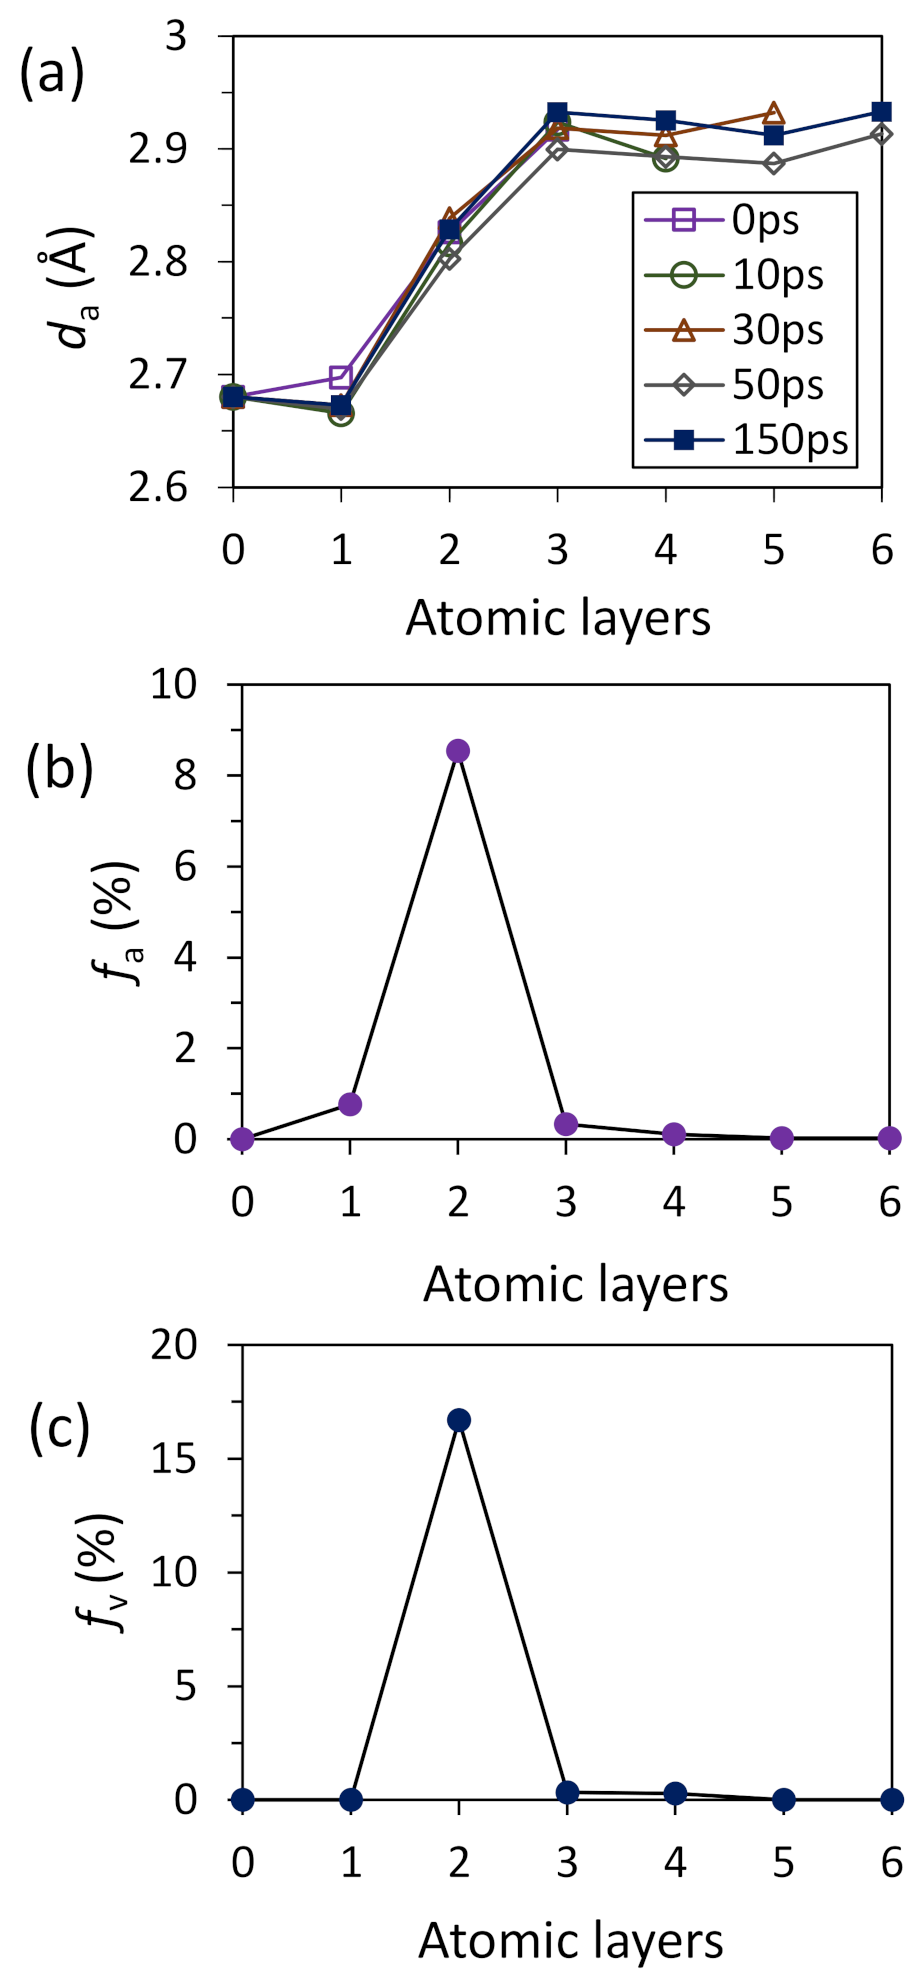
Figure 13.
Effect of lattice misfit [38]. (a) The quantified vacancy concentration in L2 (fv) and (b) nucleation undercooling (ΔTn) as a function of the initial lattice misfit (f).
Figure 13.
Effect of lattice misfit [38]. (a) The quantified vacancy concentration in L2 (fv) and (b) nucleation undercooling (ΔTn) as a function of the initial lattice misfit (f).
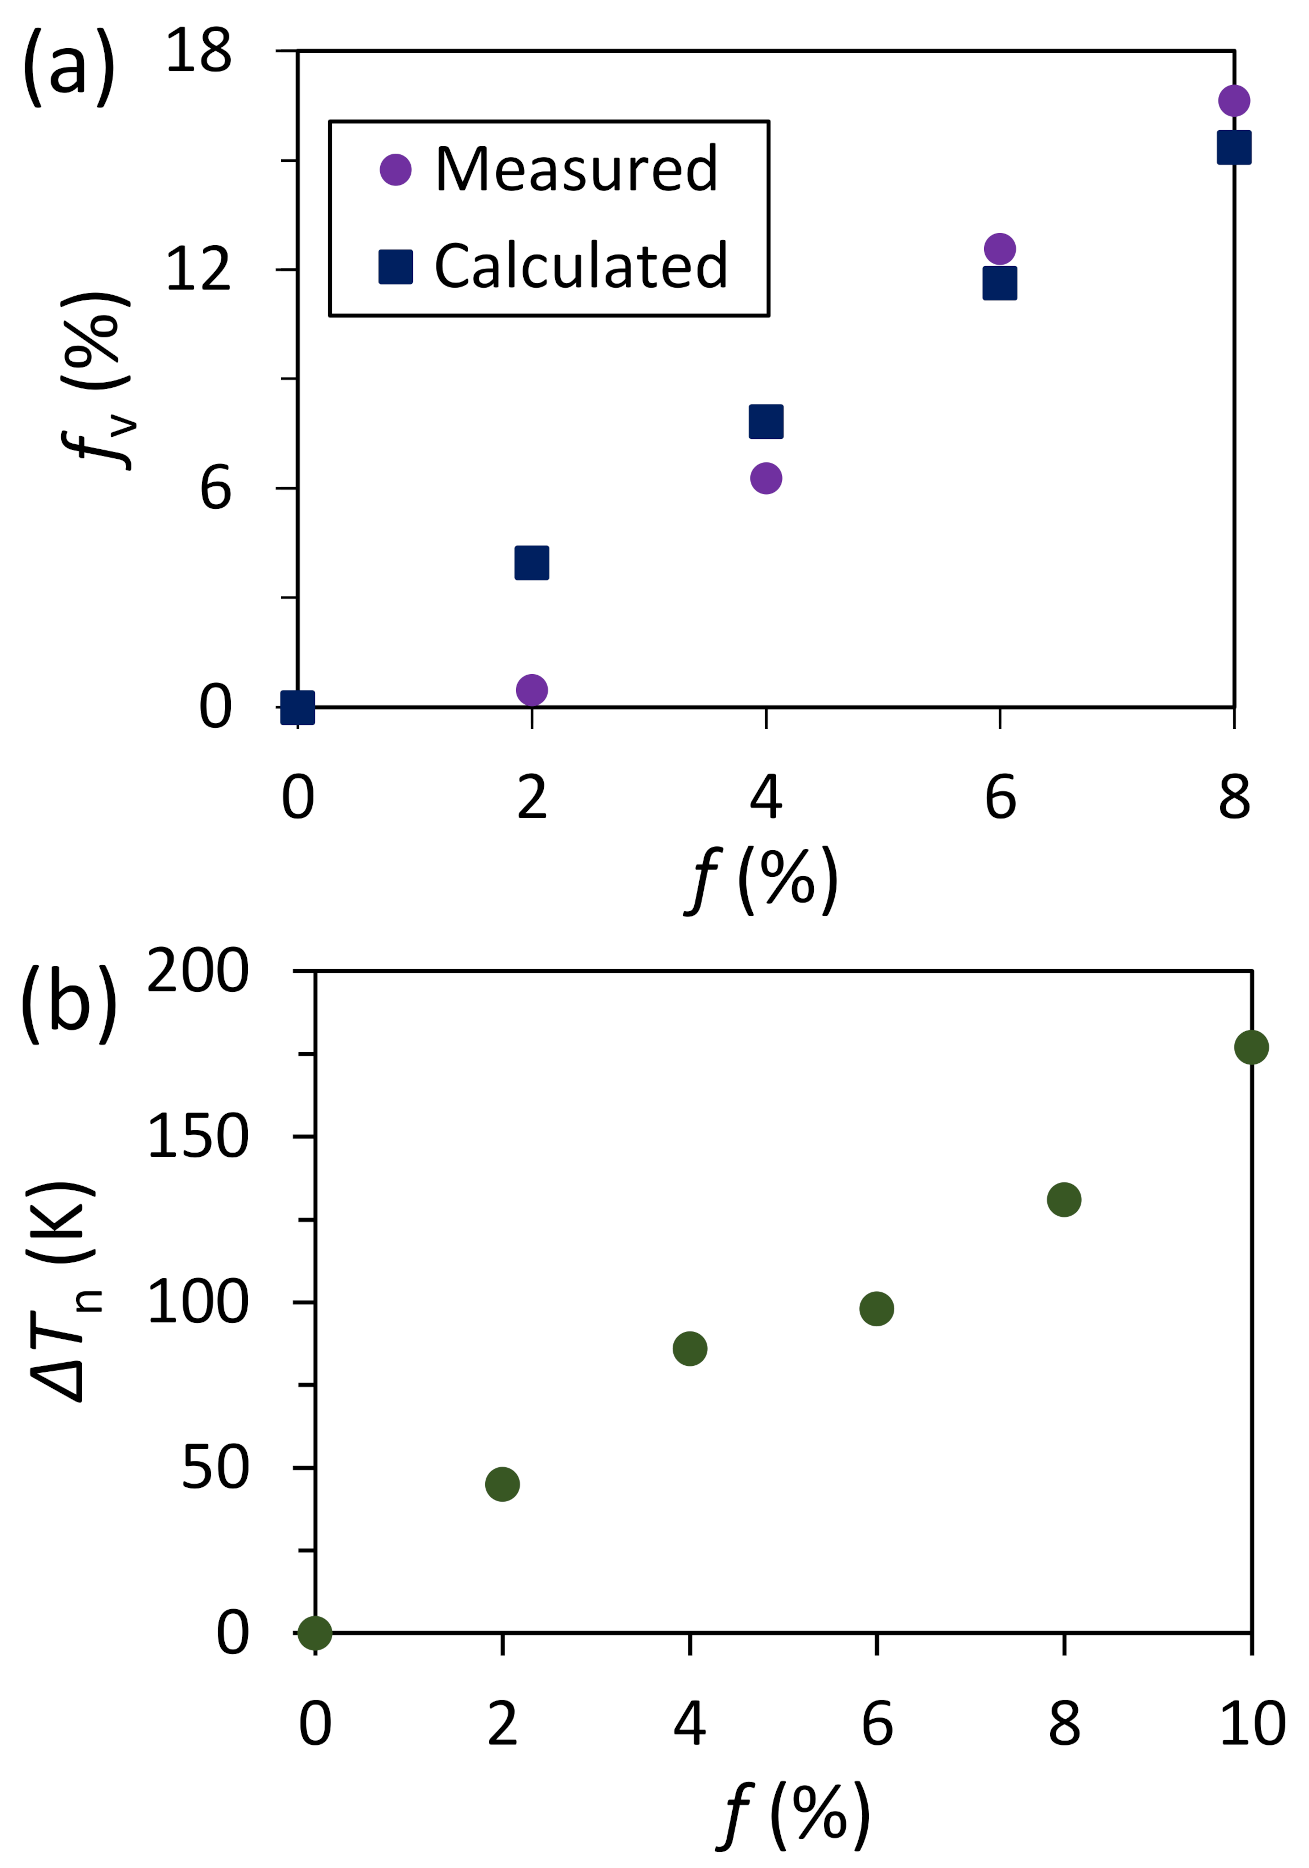
Figure 14.
Experimental validation of lattice twist in systems with positive misfit [70]. Experimental evidence for no lattice twist after heterogeneous nucleation in systems with positive misfit. High resolution TEM images showing nucleation of α-Mg on {111} terminated MgO (a) and {001} terminated MgO (b) suggesting that there is no twist between the solid and the substrate. In both cases the lattice misfit is 7.9%.
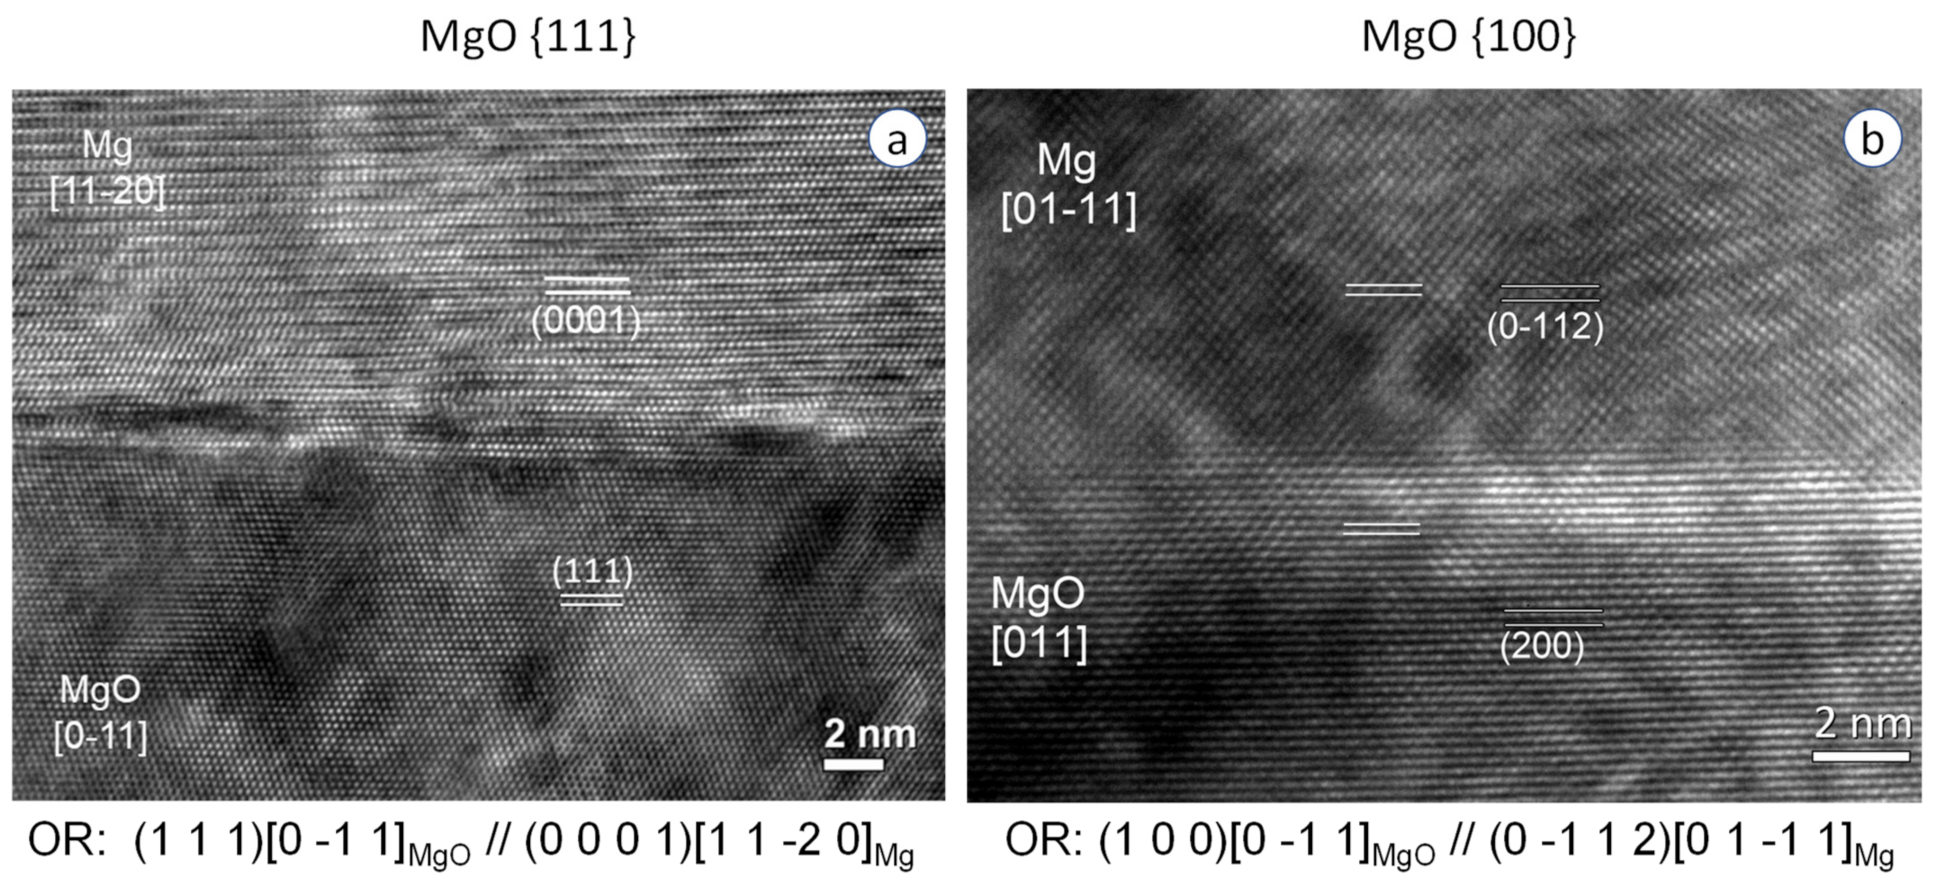
Figure 15.
Nucleation mechanism in systems with large misfit [39]. The simulation system: Pb(l)/Cu(s); Tn = 594 K; 27% misfit; t2 = 190 ps. (a) Time-averaged atomic positions in the coincidence site lattice (CSL, the new substrate) showing CSL as a mechanism to accommodate the major lattice misfit (fCSL = 25%); (b) time-averaged atomic positions in L1/CSL showing the epitaxial relationship between L1 and the CSL; (c) a snapshot of L2 showing the existence of vacancies as a mechanism to accommodate the residual lattice misfit (fr = 2.3%); and (d) time-averaged atomic positions of L3 showing a plane of {111} Pb as a 2D nucleus that demarcates the end of nucleation and the start of crystal growth.

Figure 16.
Atomic arrangement in solidified systems with large misfit [39]. The simulation system: Pb(l)/Cu(s); Tn = 594 K; and t = 1 ns. (a) Vacancy concentration, fv, and (b) average in-plane atomic spacing, da, of the individual atomic layers at the Pb/Cu interface as a function of atomic layers.
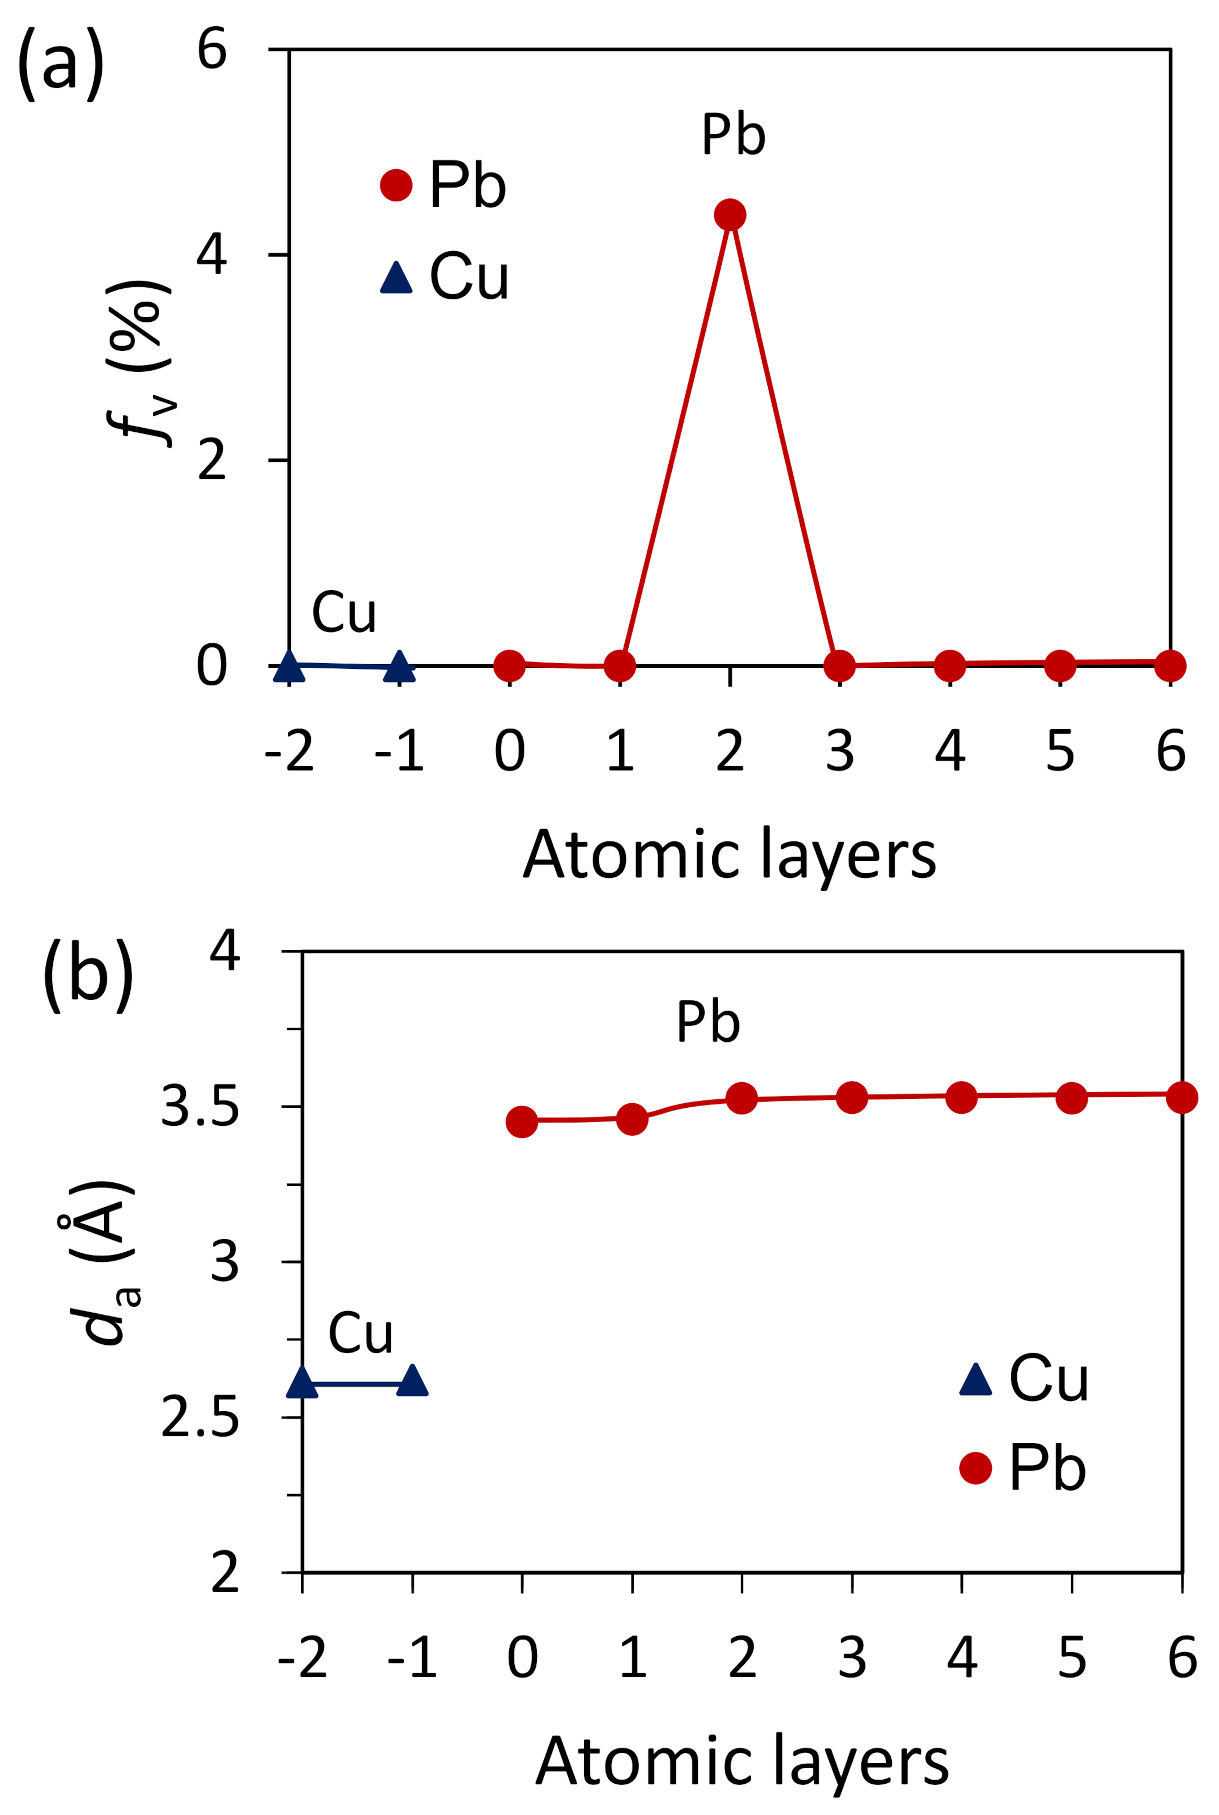
Figure 17.
Heterogeneous nucleation on 2D amorphous substrate. Time averaged atomic positions (a) the 2D amorphous substrate (A1), and (c–f) the first 4 atomic layers (L1–L4) at t = 10 ps showing the heterogeneous formation of a solid particle on the 2D amorphous substrate at an undercooling of ΔTn = 311 K. The 2D amorphous substrate was created by quenching the liquid Al from 900 K. A 2D nucleus of rn = 0.91 nm (marked with purple circles) was formed on a patch (the red circle) in the substrate surface A1. The substrate patch is magnified to show the atomic arrangement in the patch in (b).
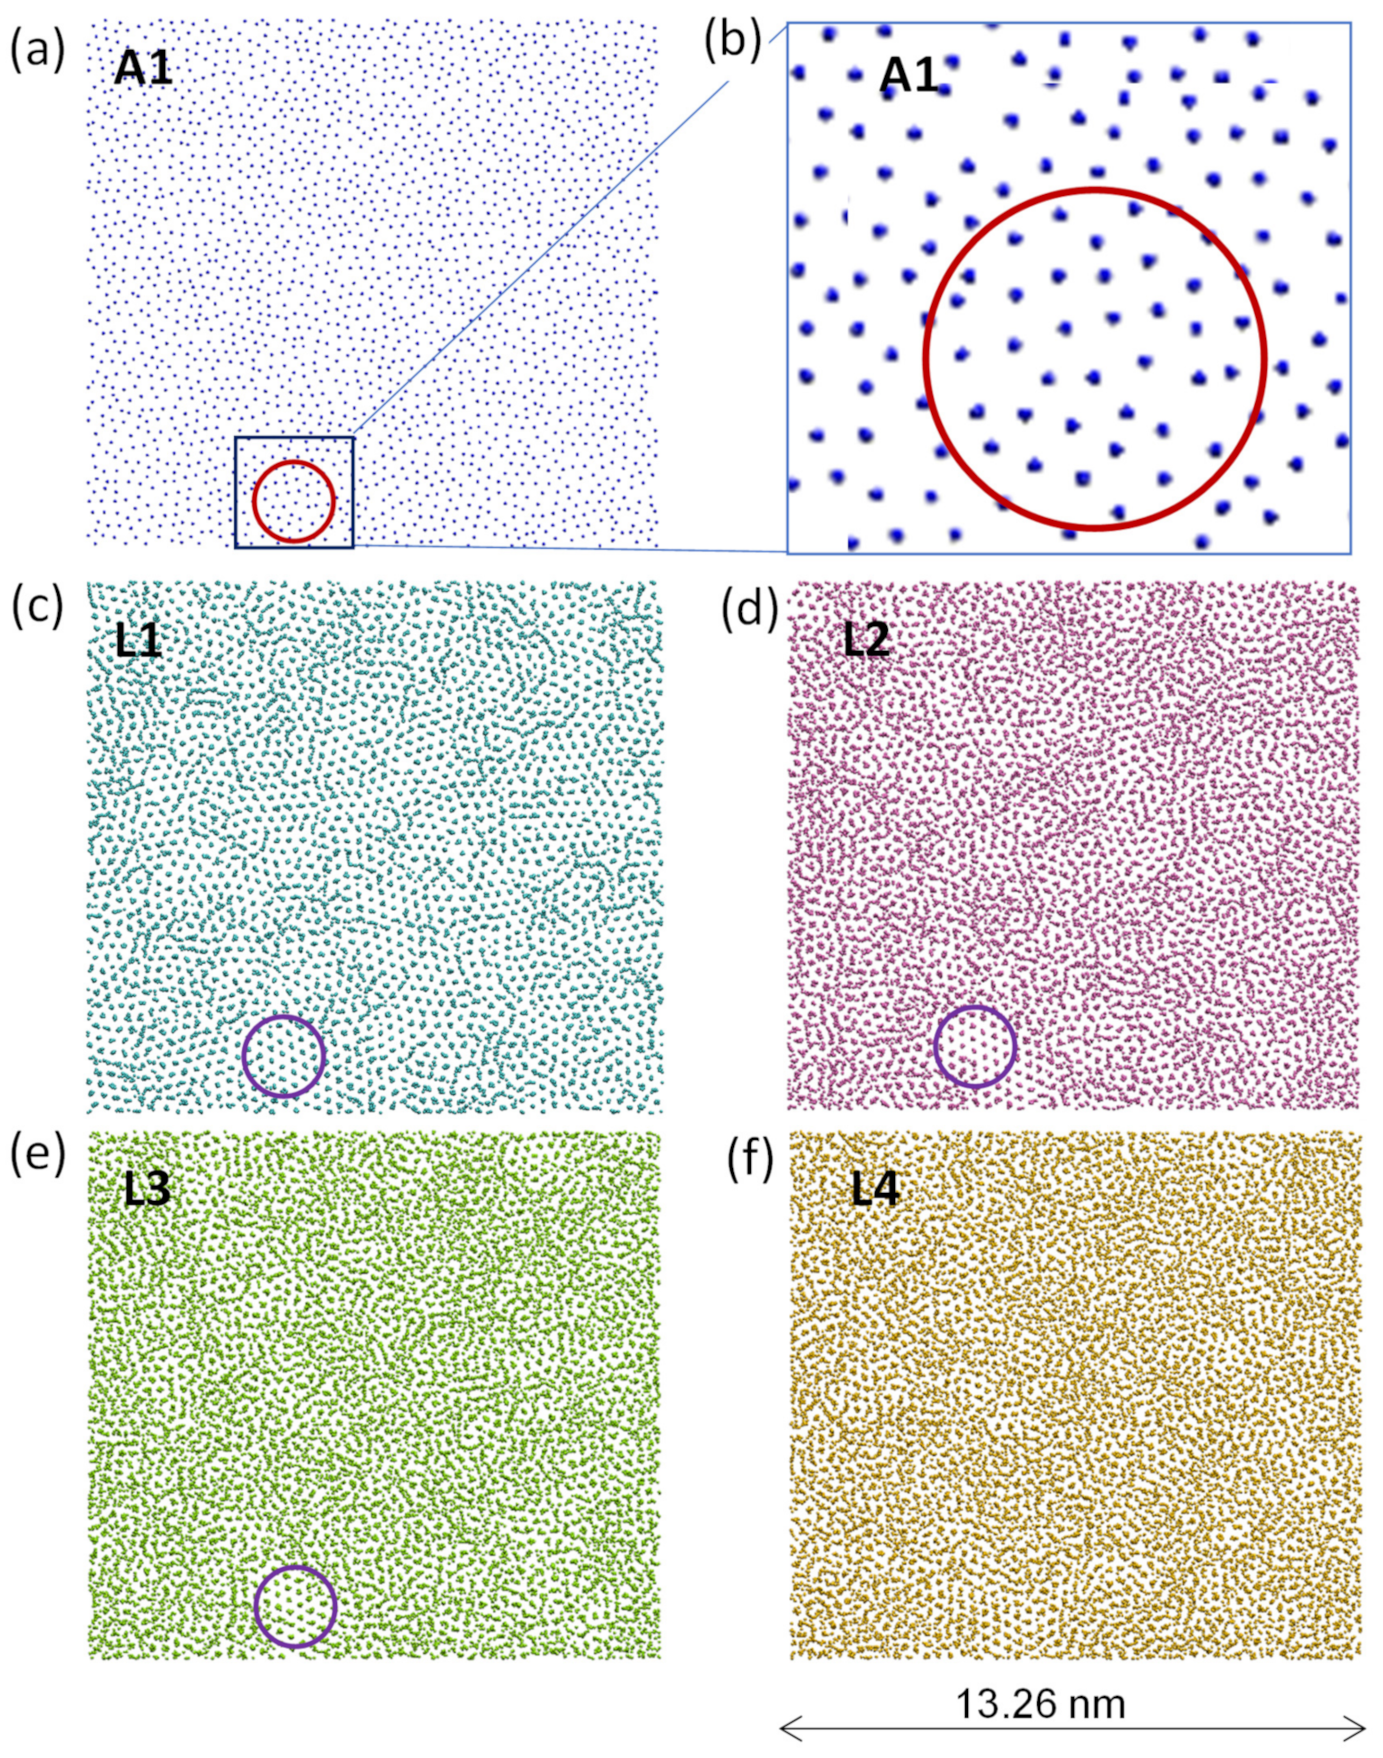
Figure 18.
Nucleation becomes homogeneous when the amorphous substrate surface is rough. Time-averaged atomic positions in the relevant atomic layers (L0 denotes the substrate) showing the evolution of a solid cluster formed homogeneously in the bulk liquid far away from the L/N interface at an undercooling of ΔTn = 433 K. The amorphous substrate with rough surface was created by quenching the liquid from 900 K (denoted as 3D amorphous). A nucleus of r* = 0.65 nm (marked with purple circles) was formed around L25 at t = 300 ps and then grows with time (marked with blue circles). The red squares mark the area where nucleation occurs.
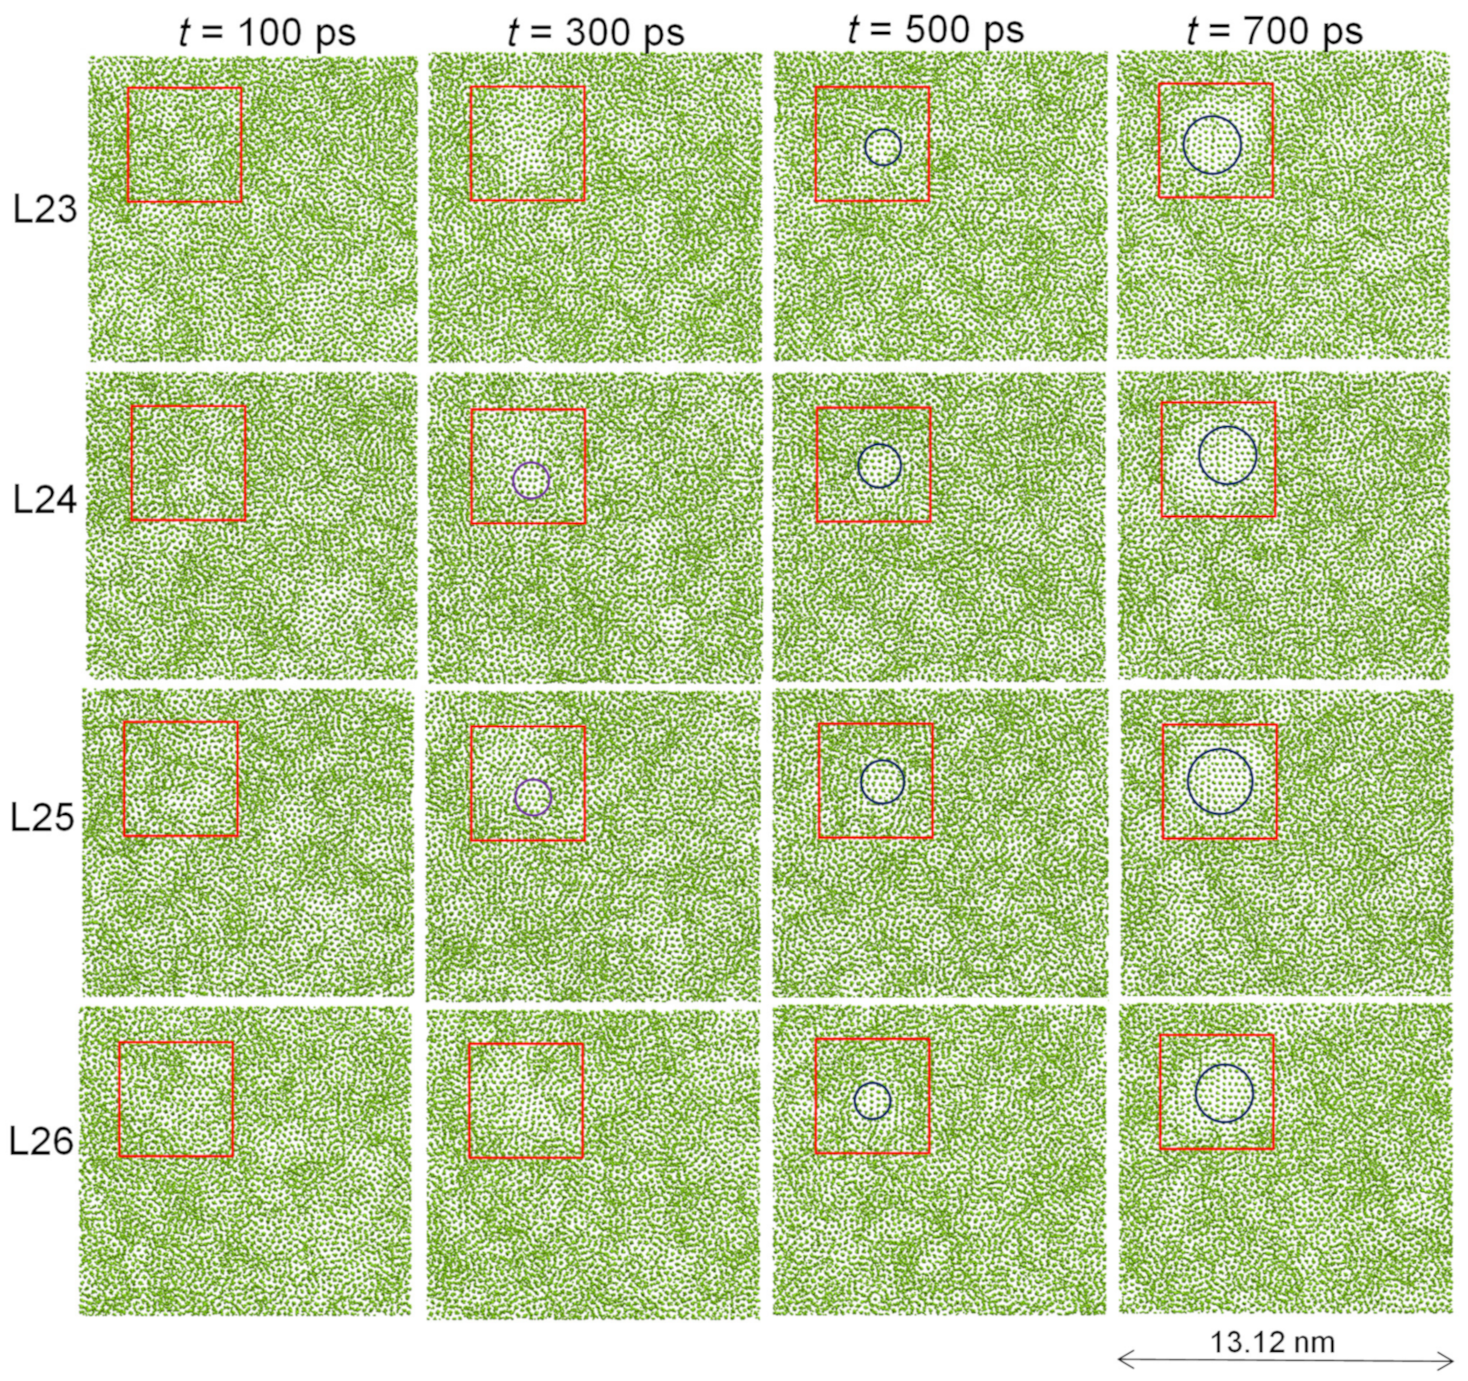
Figure 19.
Schematic illustration of the 3-layer nucleation mechanism. At the nucleation temperature, heterogeneous nucleation starts with a precursor created by the prenucleation, proceeds layer-by-layer through a structural templating mechanism, and completes within 3 atomic layers (marked as L1, L2 and L3) to provide a 2D nucleus (a crystal plane of the solid) which can template further growth of the solid.
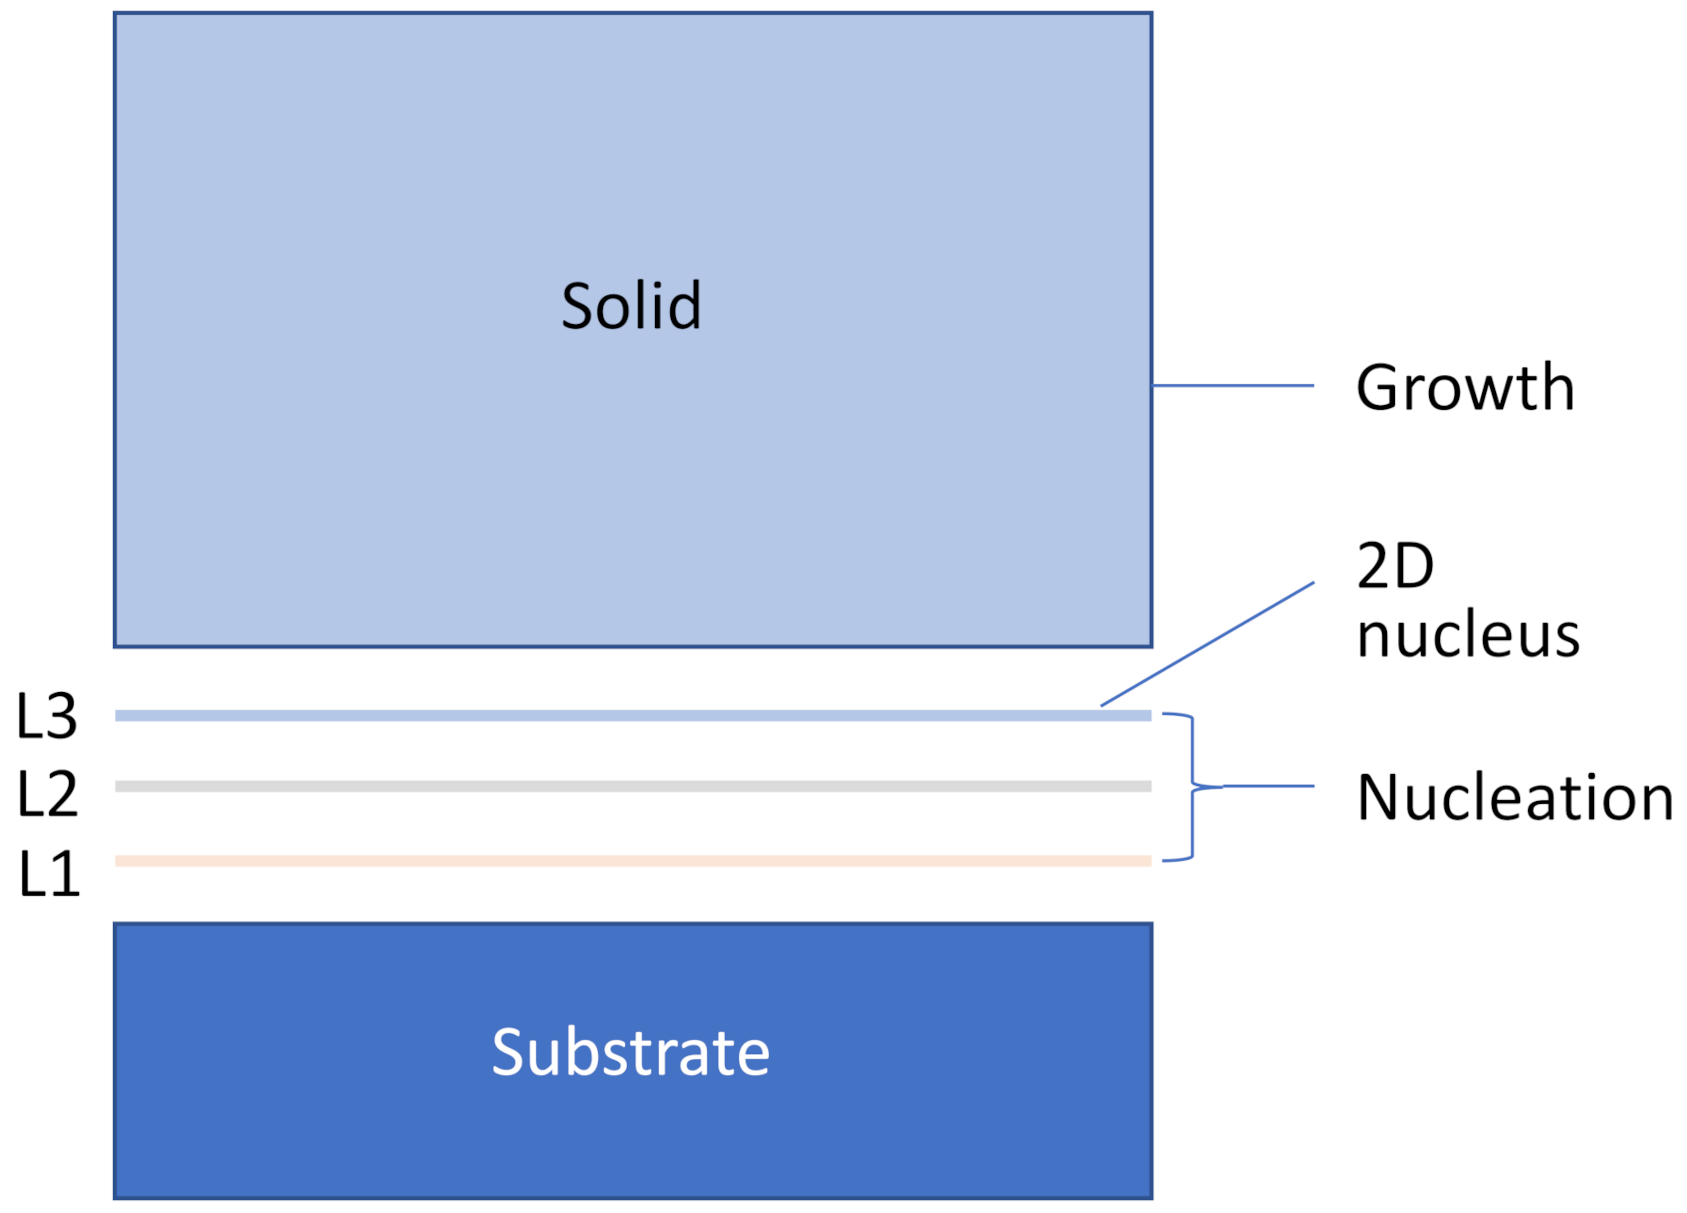
Figure 20.
Evolution of atomic ordering during heterogeneous nucleation. Fraction of solid atoms (fs) in the 9 layers of atoms above the substrate is plotted as a function nucleation time (t) normalised by the nucleation finish time (t2) for the systems with −6% and −8% misfit. For a good approximation, the data can be fitted as the fraction of solid atoms fs = 0.16 + 0.47t2.
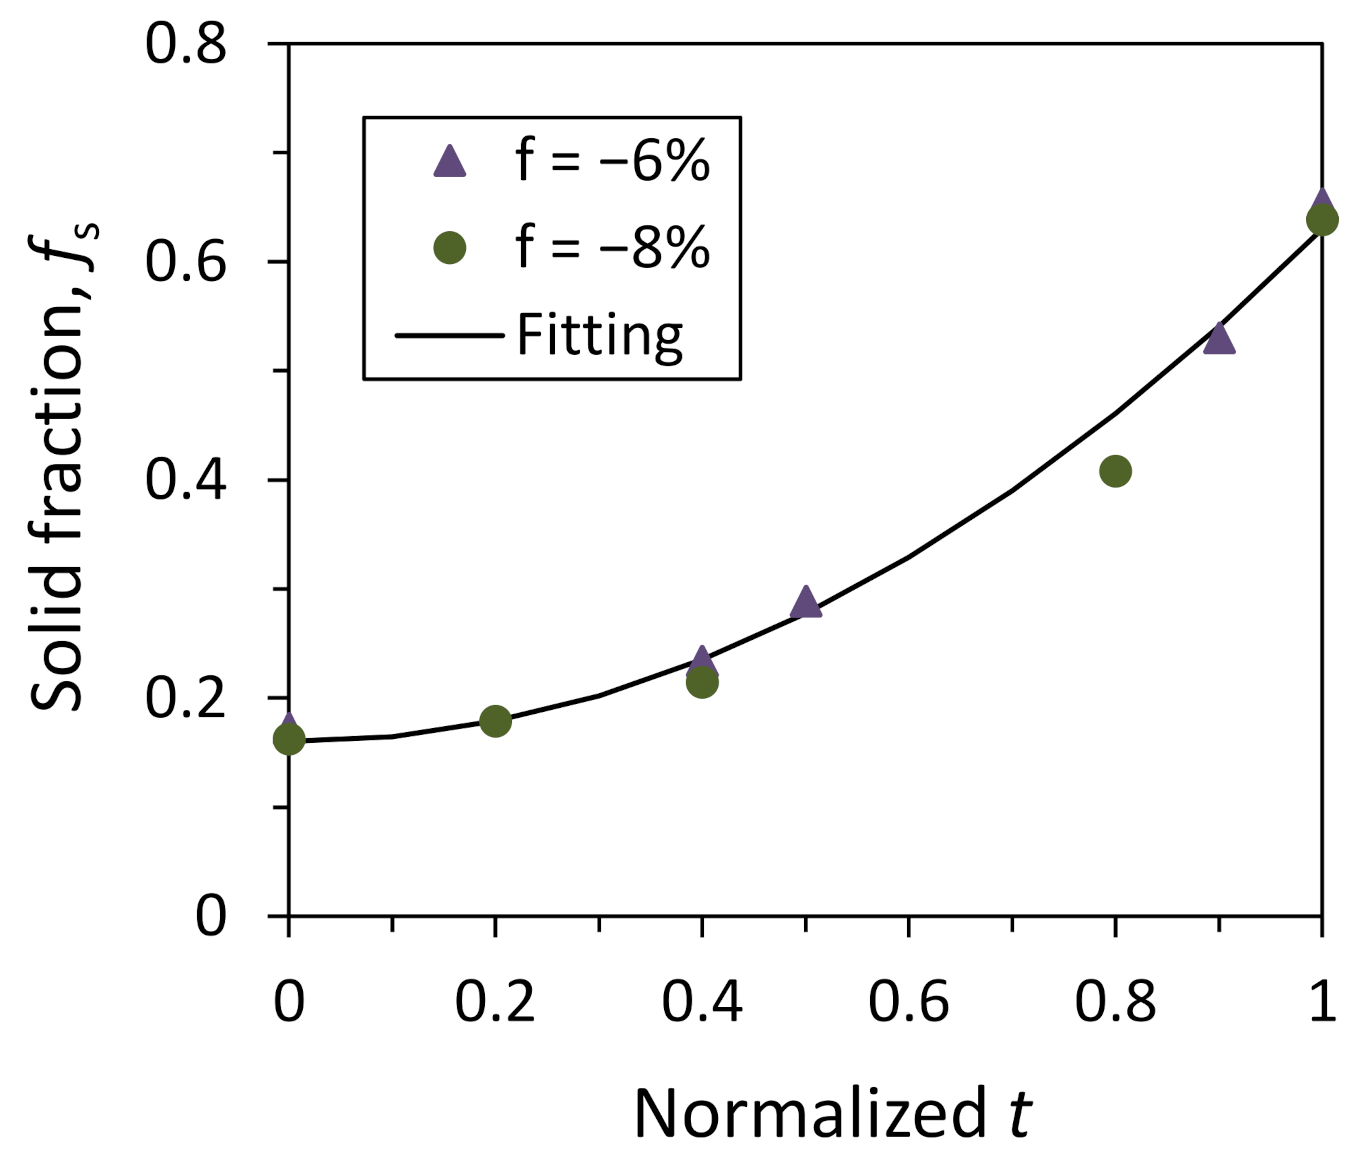
Figure 21.
Comparing solid fractions at onset and end of the nucleation. Fraction of solid atoms (fs) in the individual layers for the systems with −6% and −8% misfit is plotted (a) at the onset of heterogeneous nucleation (t1); and (b) at the end of nucleation (t2). As a good approximation, it can be assumed that all the systems with varying misfit at their perspective nucleation temperature (Tn) have the same level of atomic ordering at both the start and the end of heterogeneous nucleation. The dashed line in (b) represents the general trend of fraction of solid atoms corrected for the underestimate due to the limitation of local bond-order analysis [12,66].

Figure 22.
Nucleation undercooling v.s. lattice misfit. Nucleation undercooling (ΔTn) obtained by MD simulations [11,38,39] as a function of lattice misfit (f) shows that ΔTn is a complex function of lattice misfit.
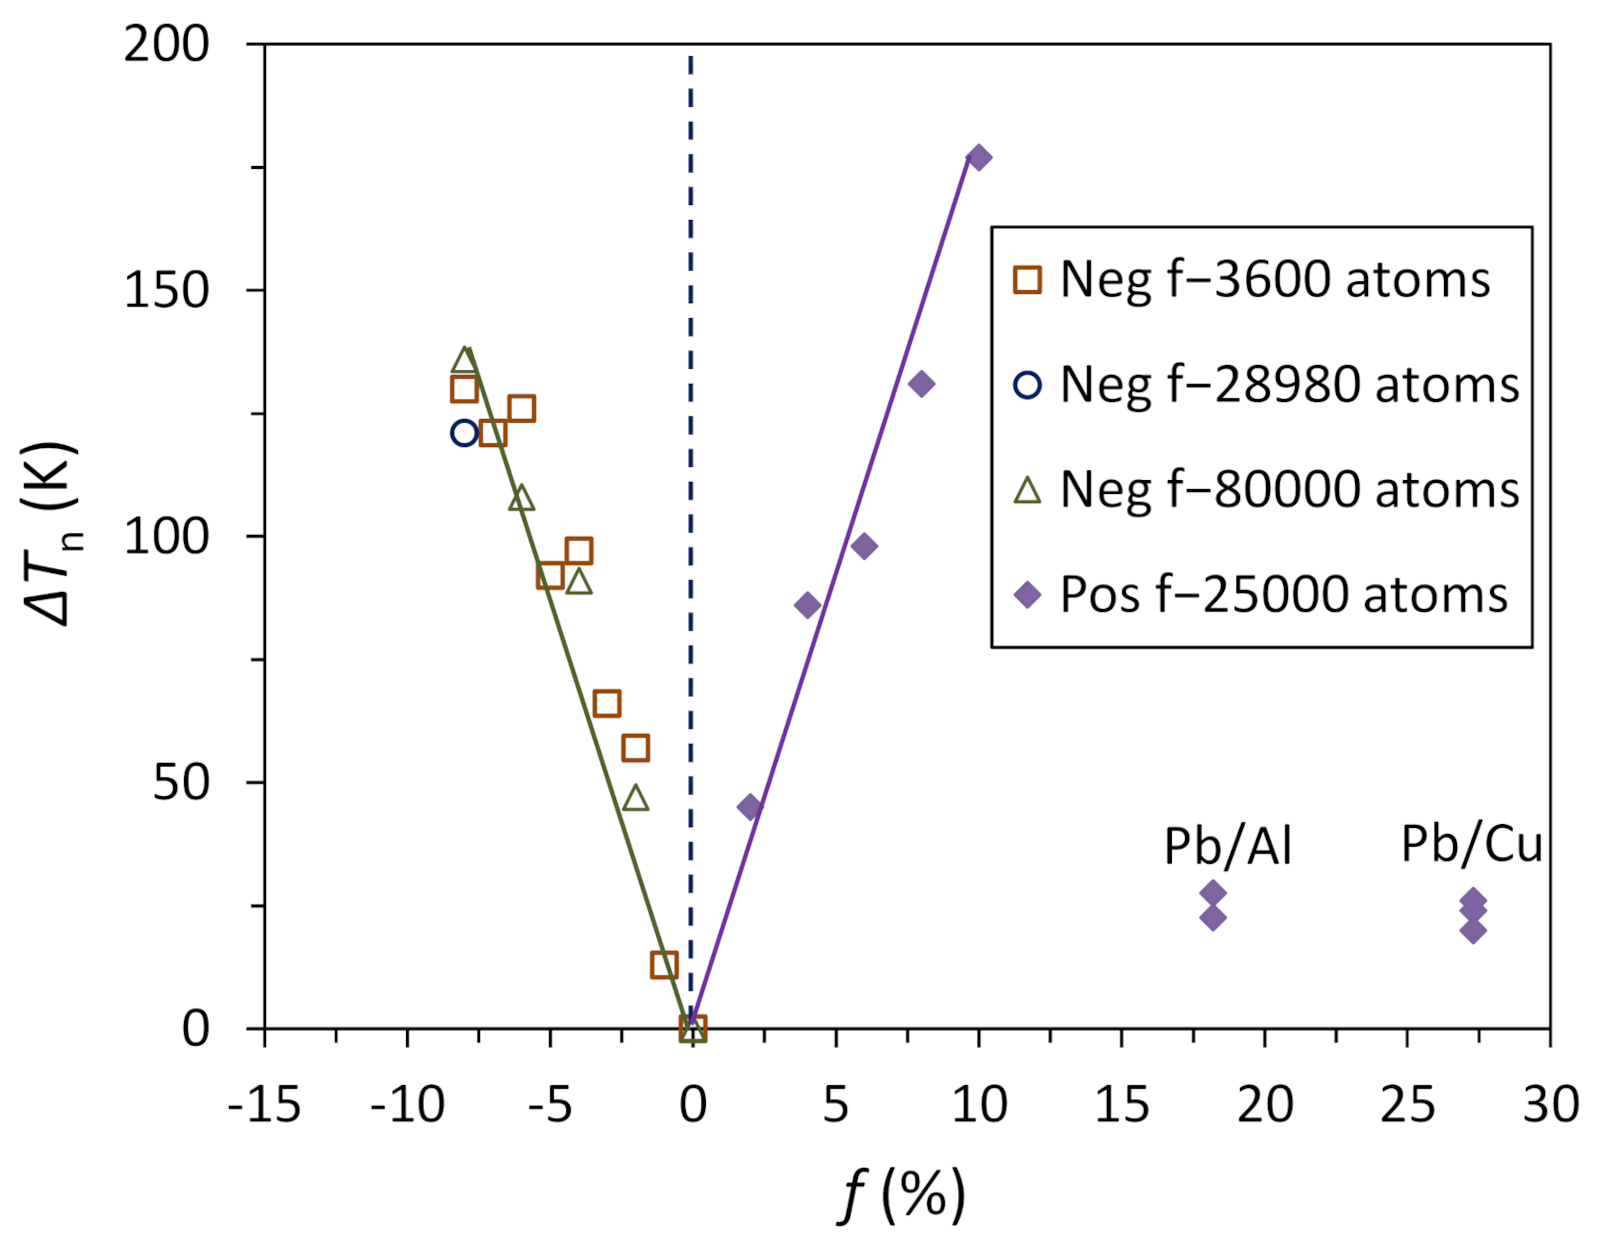
Figure 23.
Nucleation undercooling (from MD simulations) v.s. absolute value of lattice misfit. Nucleation undercooling (ΔTn) obtained by MD simulations is plotted as a function of lattice misfit (f) or residual misfit (fr). It shows that ΔTn is a unique linear function of lattice misfit |f|. The linear fitting of the MD data suggests that ΔTn = 17.82|f| with R2 = 0.978. The scatter of data is mainly caused by the variation of size of the simulation systems since ΔTn decreases slightly with increasing the size of the simulation cells.

Figure 24.
Nucleation undercooling (from experiments) v.s. absolute value of lattice misfit. Nucleation undercooling is derived from experimental results on solidification of droplets embedded in matrix from the literature [25,28,31,71,72,73,74]. ΔTn is plotted as a function of misfit (f) or residual misfit (fr). It shows that ΔTn is a unique linear function of lattice misfit |f|. The linear fitting of the experimental data suggests that ΔTn = 10.6|f| with R2 = 0.86.
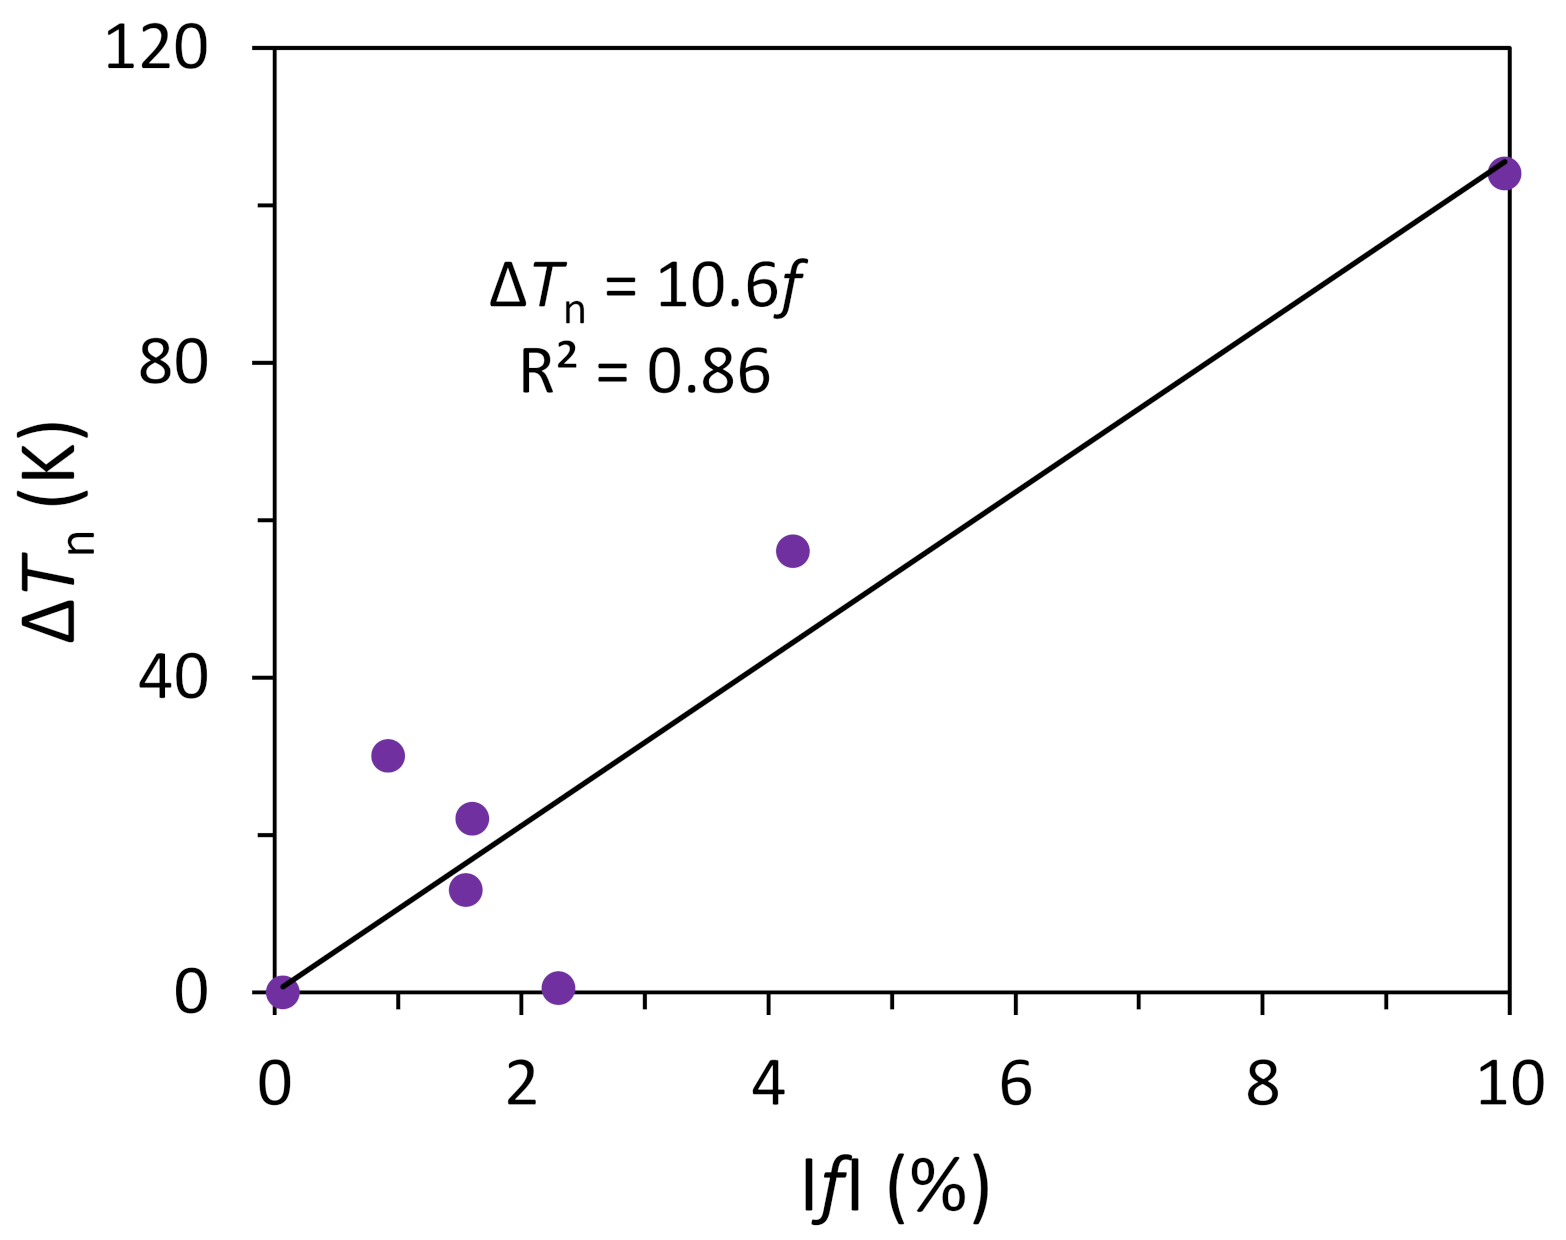
Figure 25.
Summary of nucleation mechanisms. Schematic illustration of mechanisms for accommodating lattice misfit and nucleation undercooling (ΔTn) as a function of lattice misfit (f). For systems with small negative misfit (−12.5% < f < 0), nucleation takes place through a three-layer dislocation mechanism; for systems with small positive misfit (0 < f < 12.5%), nucleation takes place through a three-layer vacancy mechanism; for systems with large misfit (|f| > 12.5%), nucleation takes place by two distinctive steps: (1) prenucleation creates CSL to accommodate the majority of the misfit (fcsl); and (2) heterogeneous nucleation at the nucleation temperature to create a 2D nucleus through either a three-layer dislocation mechanism if the residual misfit is less than 0 or a three-layer vacancy mechanism if the residual misfit is larger than 0.
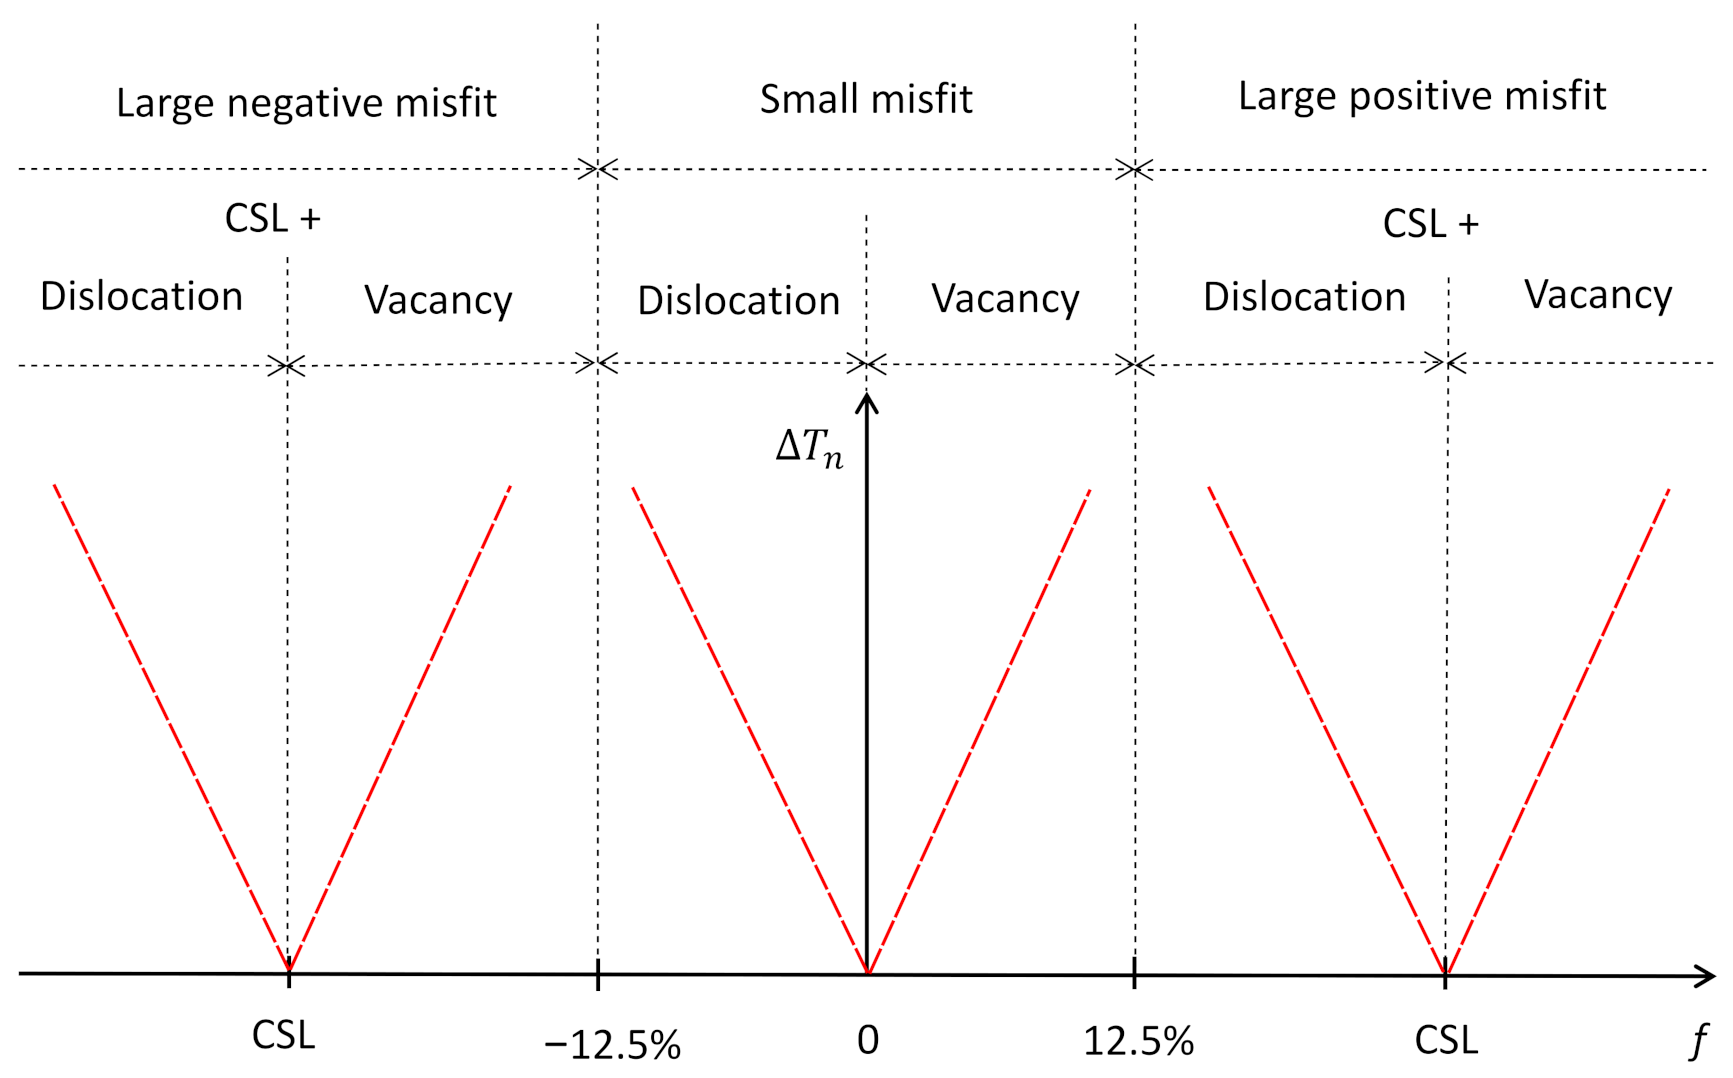
Figure 26.
Structural templating as a mechanism for extending the ordered structure during nucleation process [11]. The simulation system: −8% misfit, Tn = 760 K. Atomic arrangements of the solid atoms at the interface as a function of time: (a) t = 0 ps, (b) 20 ps, (c) 40 ps and (d) 50 ps. Liquid atoms have been removed from snapshots using the local bond-order analysis. Starting from the precursor, nucleation proceeds layer-by-layer through structural templating.
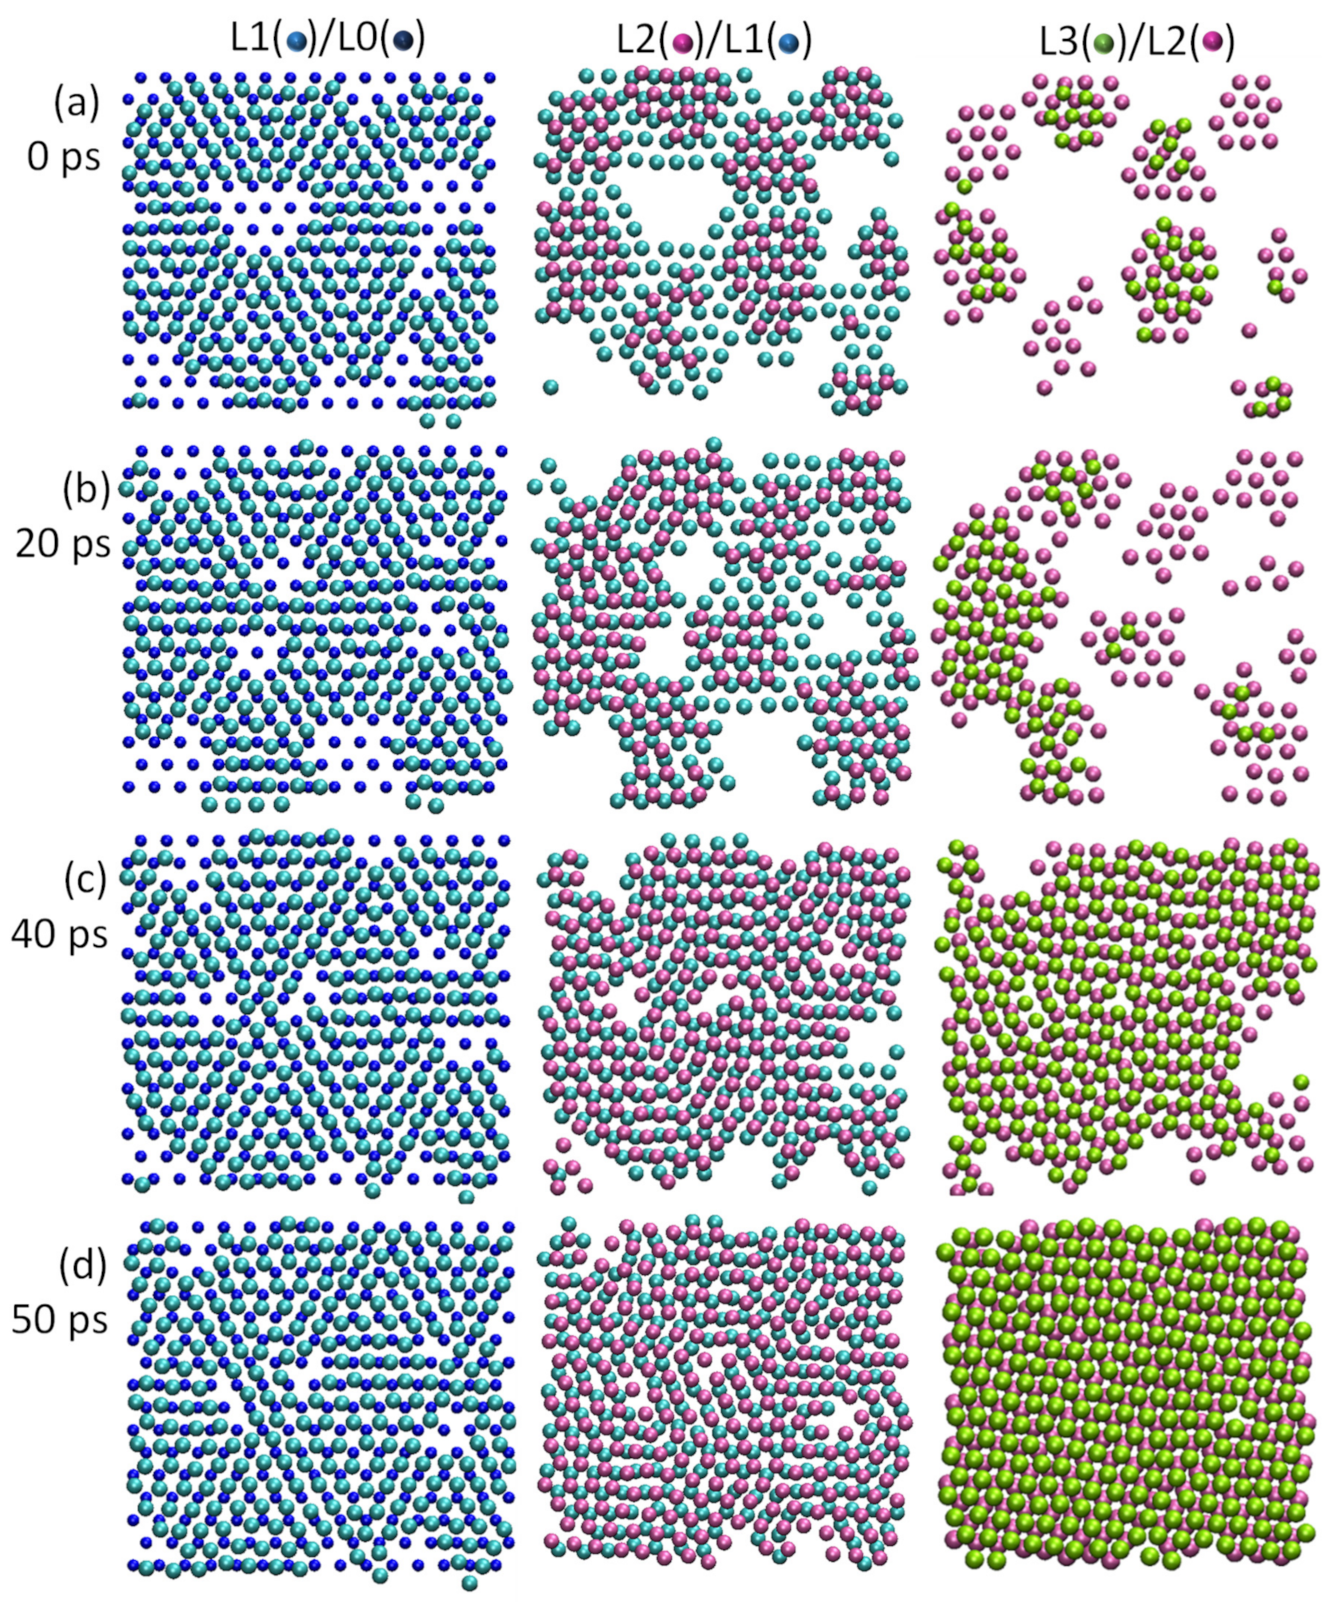
Figure 27.
A 2D illustration of structural templating as a mechanism for transforming liquid atoms into solid atoms at the crystalline/liquid interface. (a) Front view of the equilibrium atomic positions in a crystalline plane; (b) schematic illustration of the potential energy (G) of an atom in the next atomic layer as a function of its position (x). The potential energy has maxima (red dots) right above the solid atoms and minima (green dots) between the two solid atoms; and (c) schematic illustration of the potential equilibrium atomic positions in the next layer (the dashed circles).
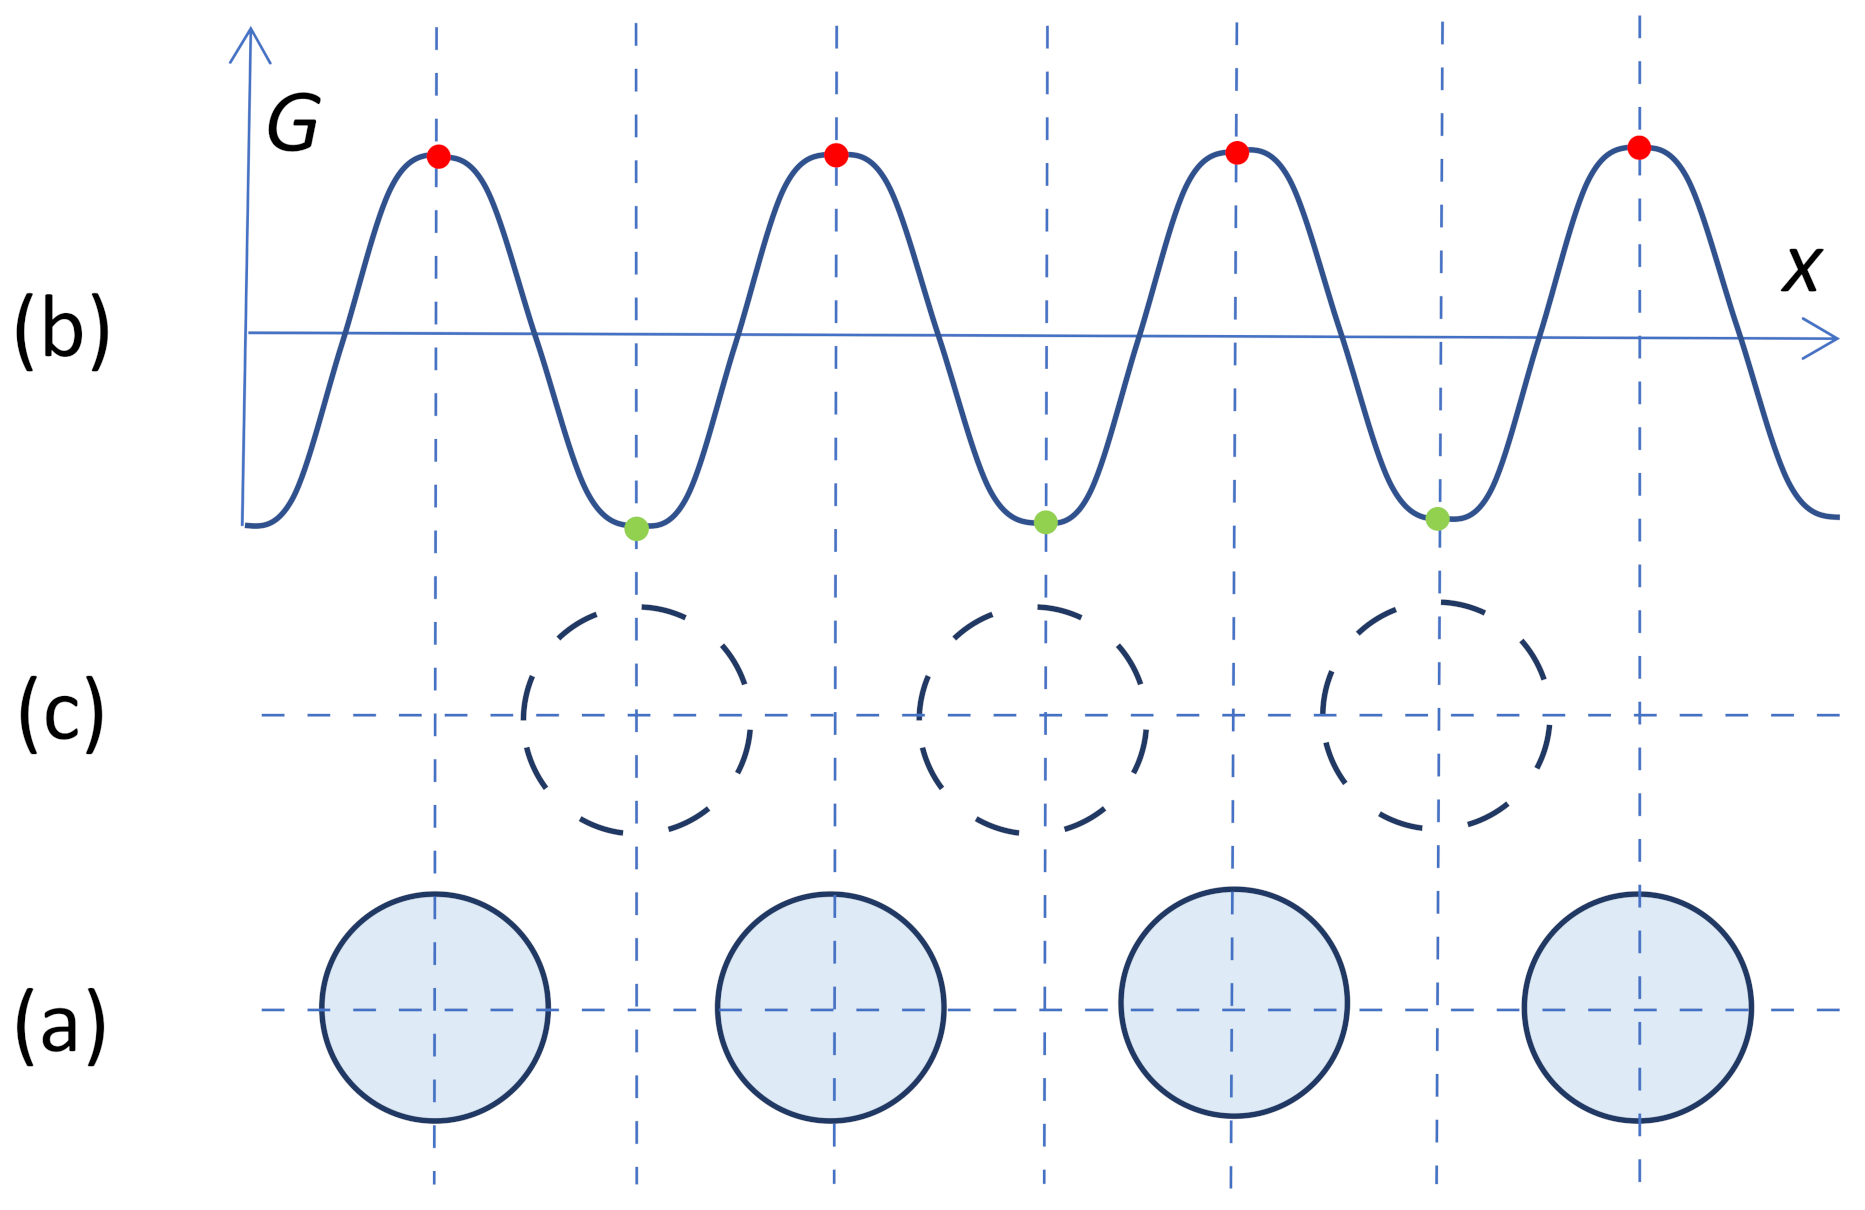
Figure 28.
Structural templating. Time averaged atomic positions of atoms in (a,b) the L1 superimposed on L0 and (c,d) the L2 superimposed on the L1 at the end of heterogeneous nucleation (Tn = 760 K, t2 = 50 ps) in a system with −8% misfit and 80,000 atoms. Normal solid atoms occupy either the “B” or “C” positions in L1, where “B” and “C” represents the atomic positions of ABCA… stacking sequence in the fcc lattice. The brown lines in the (b) represent the dislocation lines. It is noted that the atoms located at the nodes of dislocation network in L1 can hop between the “B” and “C” positions (denoted as “BC” atoms), with their trajectories forming a circular pattern centred on top of a substrate atom underneath. This suggests that the structural templating mechanism can take effect even in the node regions.
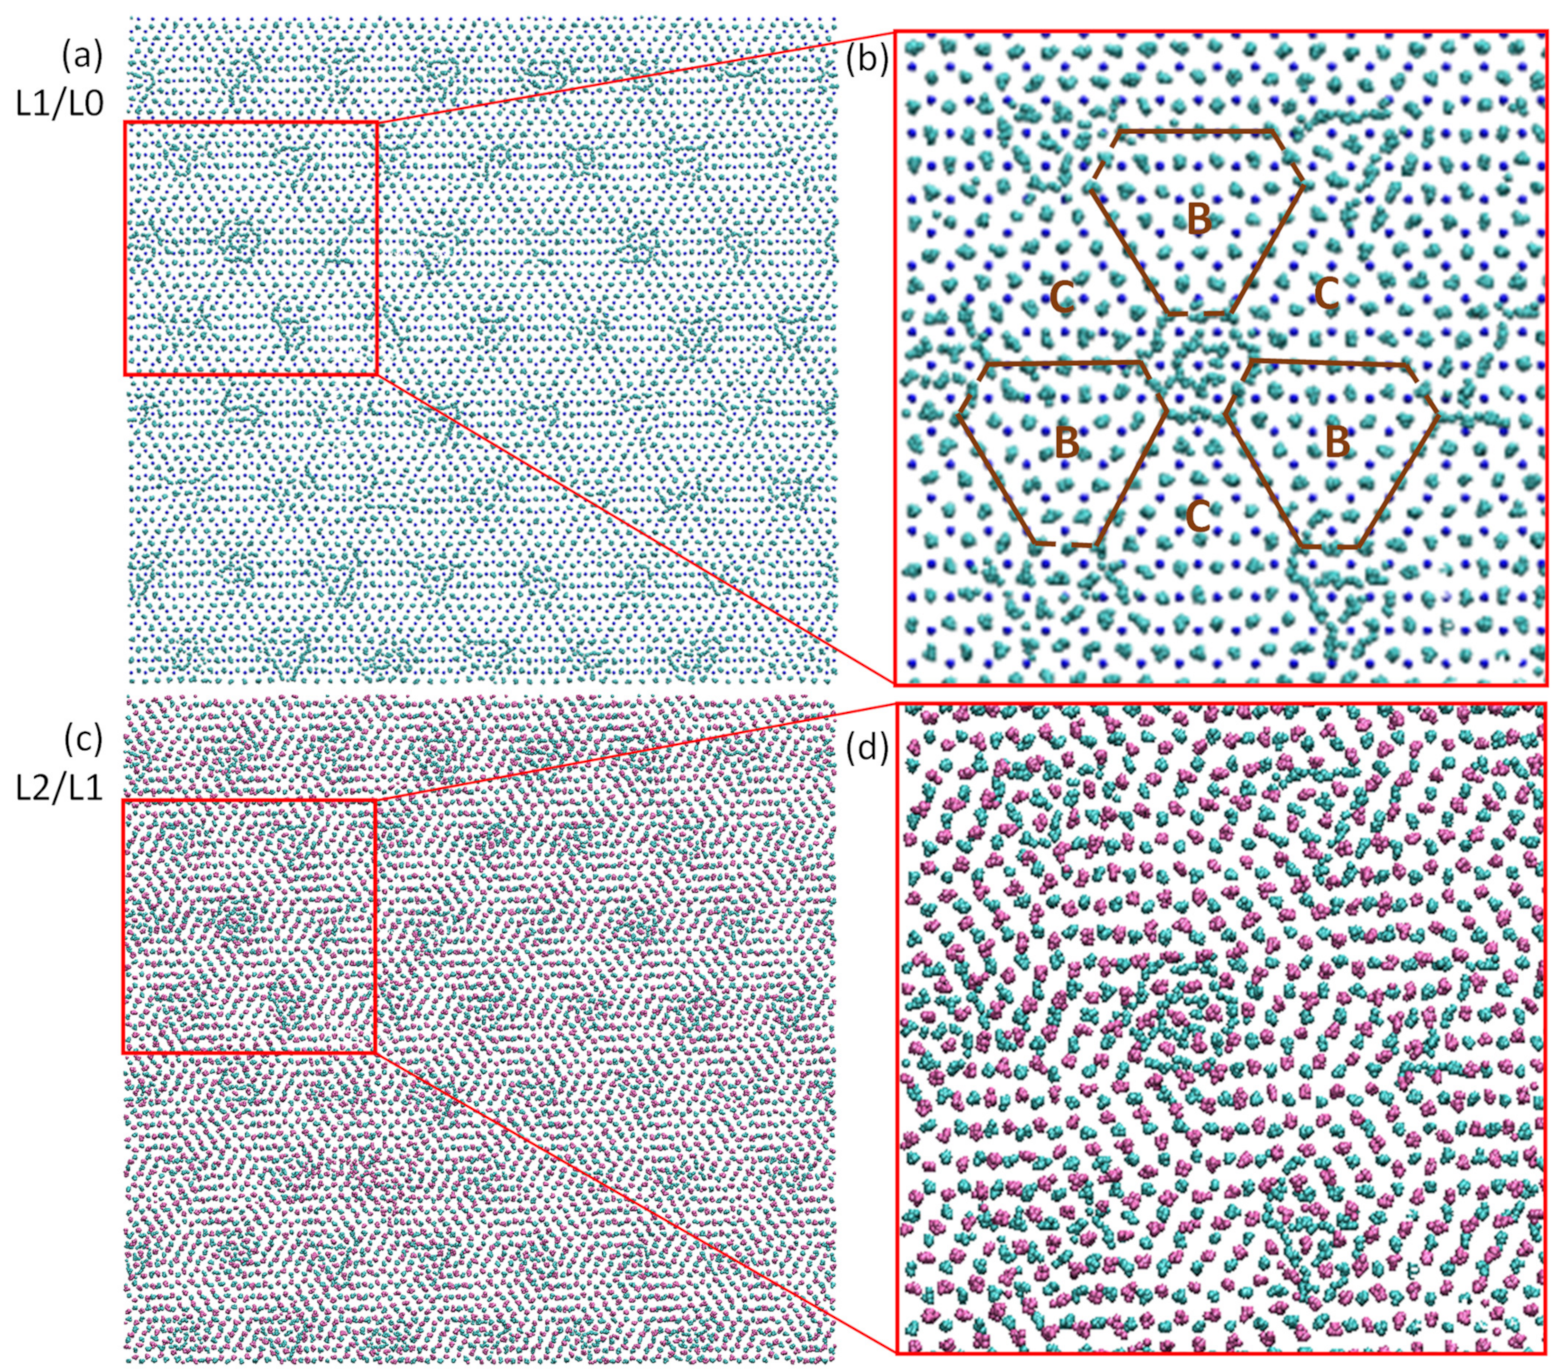
Figure 29.
Total energy change in the simulation system during the nucleation [11]. Evolution of total energy (Et) of the system with −8% misfit is plotted as a function of t during the simulation at Tn = 760 K. t1 marks the onset of nucleation, t2 the end of nucleation and t3 the end of solidification. L and S denote the liquid and the solid phases, respectively.
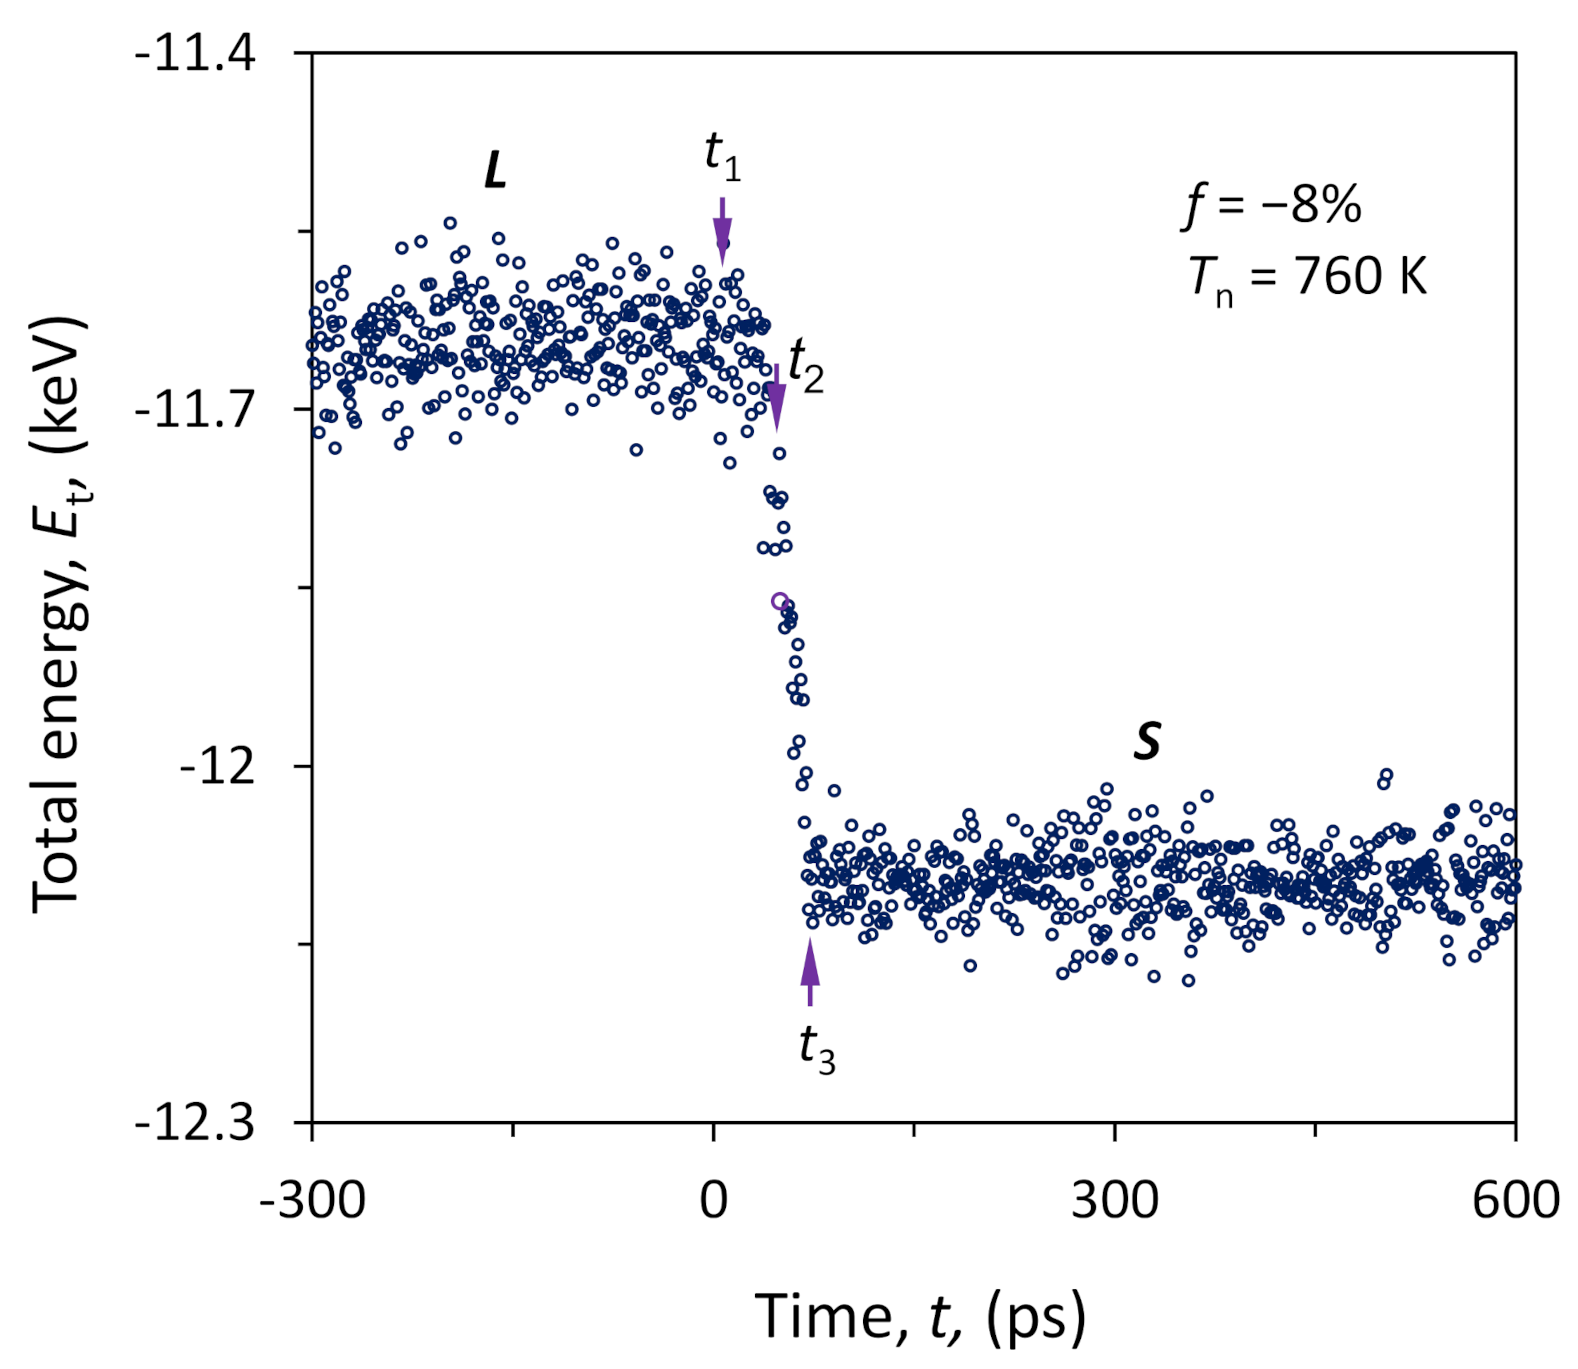

Table 1.
Orientation relationship (OR), misfit (f) or residual misfit (fr) and nucleation undercooling (ΔTn) derived from experimental results on solidification of droplets embedded in matrix from the literature [25,28,31,71,72,73,74]. The OR was examined by transmission electron microscopy and electron probe microanalysis, the misfit was calculated according to the OR, and the ΔTn was obtained by differential scanning calorimeter.
| Droplets | Matrix | OR | f or fr (%) | ΔTn (K) |
|---|---|---|---|---|
| Al | Al3Zr | {001}<100>Al//{00l}<100>Al3Zr | 0.07 | 0 |
| Cd | Al | {0001}<11-20>Cd//{111}<110>A1 | 4.2 | 56 |
| Sn | Al | {1 00}<010>Sn//{1 1 1}<-211>AI; {1 00}<011>Sn//{1 00}<0 11>Al | −9.96 | 104 |
| Pb | Al | {111}<011>Pb//{111}<011>Al | −1.6 | 22 |
| Pb | Zn | (111)<1-10>Pb//(0001)<11-20>Zn | −0.92 | 30 |
| Pb | Cu | {100}<010>Pb//{100}<010>Cu | 2.3 | 0.5 |
| In | Al | {111}<110>In//{111}<110>Al | 1.55 | 13 |
Publisher’s Note: MDPI stays neutral with regard to jurisdictional claims in published maps and institutional affiliations. |
© 2022 by the authors. Licensee MDPI, Basel, Switzerland. This article is an open access article distributed under the terms and conditions of the Creative Commons Attribution (CC BY) license (https://creativecommons.org/licenses/by/4.0/).
Share and Cite
MDPI and ACS Style
Fan, Z.; Men, H. An Overview on Atomistic Mechanisms of Heterogeneous Nucleation. Metals 2022, 12, 1547. https://doi.org/10.3390/met12091547
AMA Style
Fan Z, Men H. An Overview on Atomistic Mechanisms of Heterogeneous Nucleation. Metals. 2022; 12(9):1547. https://doi.org/10.3390/met12091547
Chicago/Turabian StyleFan, Zhongyun, and Hua Men. 2022. "An Overview on Atomistic Mechanisms of Heterogeneous Nucleation" Metals 12, no. 9: 1547. https://doi.org/10.3390/met12091547
Note that from the first issue of 2016, this journal uses article numbers instead of page numbers. See further details here.