
Prediction of Spherical Sheet Springback Based on a Sparrow-Search-Algorithm-Optimized BP Neural Network


School of Mechanical Engineering, Jiangsu University of Science and Technology, Zhenjiang 212003, China
*
Author to whom correspondence should be addressed.
Metals 2022, 12(8), 1377; https://doi.org/10.3390/met12081377
Submission received: 29 June 2022
/
Revised: 10 August 2022
/
Accepted: 16 August 2022
/
Published: 19 August 2022
(This article belongs to the Special Issue Application of Neural Networks in Processing of Metallic Materials)
Abstract
:Springback is an unavoidable problem in cold-forming processes and affects the efficiency and quality of the processing of outer sheets for ships. Therefore, effective control and prediction of sheet-forming springback is particularly important in the field of cold-bending processes. To this end, this paper presents research on cold-bending springback prediction based on a study of the multipoint cold-bending process combined with intelligent algorithms, as well as research on the multipoint cold-bending production of ship-hull plates. The forming process of spherical sheets was simulated by a finite element simulation. The amount of springback under different processes was studied, and the forming state and springback state were briefly analyzed. Then an in-depth study of machine learning was carried out, and the sparrow search algorithm (SSA) was introduced based on a back-propagation neural network (BPNN). The purpose of this integration was to prevent the BP neural network model from falling into local optimal solution problems. Then simulation data were obtained with the help of a simulation to build a backpropagation neural network prediction model, which was optimized based on the sparrow search algorithm, and training tests were conducted. Then the prediction results of the model were compared with the simulation data to verify that the prediction accuracy performance of the sparrow-search-algorithm-optimized BPNN model was improved. Finally, the prediction model based on the SSA–BPNN algorithm was compared with the prediction models of different algorithms, and the prediction results showed that SSA–BPNN outperformed other algorithms in prediction accuracy and speed; its prediction error was within 4%, which meets on-site processing requirements. The sparrow-search-algorithm-based optimization of BPNN was confirmed to have strong applicability in springback prediction.
1. Introduction
The processing methods for ship-hull plates are generally divided into two types: hot forming and cold forming. With the advancement of shipbuilding intelligence, and due to the high labor intensity and harsh working environment of water–fire processing [1,2,3], large multipoint cold-forming processing equipment gradually began to replace water–fire-bending equipment. Multipoint cold-forming processes have many advantages in terms of efficiency and labor intensity. The technology involves the use of a discrete mold, which simulates the shape of the surface required for processing. The sheet-forming process is completed by pressing the upper and lower dies against each other. However, springback and residual stresses in cold-forming processes are unavoidable problems. This study focused on the prediction of springback in the cold forming of sheet metal.
In traditional processing, the determination of process parameters often relies on the actual work experience of frontline workers, so the springback data obtained by the original analysis method could not be intuitively applied in machine learning, and the research costs were high. However, with the development of finite element simulation technology, the numerical simulation of springback provides an effective way to study the springback of sheet-forming processes [4,5]. Shen verified the effectiveness of the numerical method in a study of springback through the use of a display dynamic finite element method in simulating the multipoint forming process, with an implicit finite-element-based simulation of the springback process, and compared the simulation data with experimental results [6,7]. Su attained fast springback compensation control for a two-dimensional hull plate by using theoretical calculation and numerical simulation [8]. The finite element simulation technique has provided a basis for the study of the factors influencing springback.
The traditional approach to springback prediction is based on bending theory. Bending springback was estimated based on basic bending theory, considering the thickness ratio, normal anisotropy, and the strain–hardening index [9,10,11]. Along with the rise of machine learning, the introduction of intelligent algorithms was found to be very effective in solving the highly nonlinear problem of sheet springback prediction, and most scholars started to combine machine learning and numerical simulation to study sheet-forming springback prediction. Froitzheim used an artificial neural network model to effectively predict springback-relevant geometric variables in his study of multistep forming for three-point bending [12]. Serban implemented the construction of an artificial neural network by using 126 sets of data obtained from finite element analysis for predicting the springback in the cylindrical bending of metal sheets [13]. Abebe used radial basis functions instead of numerical simulation models to predict the springback of metal sheets after forming and verified the numerical results of radial basis function prediction and finite element simulation results through comparing their respective reliability [14]. Guo proposed a bending-springback angle-prediction method based on an error back-propagation neural network containing a spline function. The model can quickly and accurately predict the springback angle during the air-bending process of V-shaped dies [15]. S.C. Ma analyzed the results of V-bending tests by using artificial neural networks and finite element simulations, respectively, in order to improve the accuracy of the springback prediction of rigid strength steels under various conditions, confirming that artificial neural networks and numerical simulations are effective tools for springback prediction [16]. Gondo used artificial neural networks in multi-pass conventional spinning artificial neural networks to form the distribution of the raceway parameters of cylindrical cups, with respect to the thickness distribution of the entire height of the workpiece; artificial neural networks were used to achieve the path parameter solutions required for constant thickness [17]. Yang proposed a genetic-algorithm-based back-propagation neural network optimization model for predicting and optimizing the wall angles of variable-wall-angle circular tables [18]. Dib adopted a single classifier and an ensemble classifier for defect prediction in sheet-metal forming under variability [19]. Trzepiecinski used a genetic algorithm based on a multilayer perceptron to improve the prediction of springback in sheet metal formation [20]. However, all the above studies were conducted for the springback of thin and single-curvature sheets. The sheet forming for ship hulls involves medium–thick sheets and complex forming curvatures. Therefore, it is difficult for the abovementioned algorithms to meet the requirements of springback prediction for ship-hull-sheet processing.
In order to solve the difficult problem of predicting the springback in ship-hull-sheet processing, this paper proposes a method of predicting plate rebound based on a sparrow search algorithm with an optimized back-propagation neural network. Thus, in this study, we carried out the following steps: (1) we obtained a large amount of data through finite element simulation to prepare for the building of our model; (2) we added a sparrow search optimization algorithm to the BPNN algorithm to build an SSA–BPNN prediction model; and (3) our proposed SSA–BPNN model was validated and confirmed to be reliable for the prediction of the springback of ship-hull sheets.
2. Finite Element Simulation Analysis
2.1. Definition of Simulation Parameters
Q235 and Q355 are widely used in marine engineering because of their better overall performance, strength, plasticity, and welding properties. The mechanical properties of these two materials are shown in Table 1, where E is Young’s modulus; is the yield strength; is Poisson’s ratio; is density; K is the strengthening factor; n is the strain–hardening exponent; is the thickness anisotropy coefficient; and r0, r45, and r90 are the anisotropy coefficients obtained at 0°, 45°, and 90°, respectively, according to the rolling direction of the sheet.
The principle of the multipoint forming of spherical sheets is shown in Figure 1. The multipoint cold-forming technique involves disassembling the traditional, unified die into several self-adjusting punches. In the forming process, the concave die—consisting of discrete square ball-hinged punches—is first adjusted to the spherical surface required for the target. The discrete punches of the upper die are moved vertically downward under the stress offered by the hydraulic punch, until the upper, concave dies come into contact with each other to complete the stamping. In this study, a series of experiments were conducted on spherical sheets.
2.2. Finite-Element-Analysis Procedure for Multipoint Cold Bending
Springback is currently a difficult problem in multipoint cold bending. It directly affects the processing accuracy. In the actual production process, springback is influenced by many production factors. It is important to study the influences of different factors on the springback of the sheet. Combined with the actual situation of field processing, the abovementioned influencing factors were analyzed, as shown in Table 2.
Considering that there are many influencing factors, in this paper, it is not possible to study every variable, so some variables needed to be appropriately simplified during the simulation.
- (1)
- In this study, the numerical simulation did not use crimp-forming, so the crimp-sheet variables were not the research object.
- (2)
- The pressure-holding time of multipoint cold bending was set by the on-site processing personnel according to the sheet thickness and sheet material, generally 15~20 s, and there was no obvious regularity, so it was not used as the research object.
- (3)
- The curvature radius of the die was determined by the bending radius of the target shape, so this variable ultimately depended on the sheet variable.
- (4)
- If the punch feed speed is too small, then the forming will be too slow. If it is too fast, then the sheet will be damaged. Generally, on-site processing is a fixed value.
- (5)
- Once all the upper basic bodies of the rows are in contact with the sheet, according to the sheet-pressing process, the [5 MPa], [8 MPa], and [16 MPa] buttons are pressed in sequence. The highest pressure is not used every time. the material and shape are selected depending on the sheet’s purpose, and the punching force for the general thickness and strength of the sheet is a fixed value.
- (6)
- The pressing amount of the punch is mainly determined by the bending radius of the target sheet shape, and this variable ultimately depends on the sheet variable.
- (7)
- The length, width, and bending angle of the sheet determine the bending radius. The bending angle and bending radius can be calculated to obtain the length and width of the sheet. The length, width, and bending angle of the sheet, or the bending angle and bending radius, can all be used as influencing factors, but the sheet shape is expressed by the bending radius; therefore, the bending radius is considered an influencing factor.
- (8)
- The ship-hull sheets used in multipoint forming are medium–thick sheets; therefore, in the actual bending process, there is no need for lubrication. In the finite element simulation in this study, we set the friction coefficient between the upper die, lower die, and sheet to a fixed value (μ = 0.2).
- (9)
- In cold-bending processing, because the ship-hull sheet is a medium–thick sheet, the site’s environment temperature has little influence on the processing quality; therefore, the influencing factor of temperature was not used as a main influencing factor.
In summary, the sheet thickness, material, bending radius, and bending angle are the relevant influencing factors. There are three forms of sheet springback: the bending radius (R) increases, the bending angle (θ) becomes larger, and the displacement (d) along the thickness direction decreases. The relationship between the three is shown in Figure 2.
Presently, the sheet types which are most frequently processed by multipoint cold-bending CNC bending machines are spherical sheets, sail-shaped sheets, saddle-shaped sheets, and twisted sheets. The target surface is attained by pre-adjusting the height of the lower press head and then adjusting the height of the upper press head for stamping. Based on the on-site processing situation, this section presents our simulation of the shaping stage of multipoint cold bending to investigate the deformation that occurs during the multipoint cold-bending process. A multipoint cold-bending finite element model was established with a lower die composed of 12 × 12 square indenter squares and an upper die composed of 11 × 11 square indenter squares; the size of each square indenter was 60 mm × 60 mm, each indenter was spaced by 2 mm, and the sheet size was 600 mm × 600 mm. The parameter settings of the finite element simulation are shown in Table 3.
A spherical sheet is a steel sheet with the same curvature in the xoz and yoz planes. In this study, the simulation process was performed by using a Q235 material with an 8 mm thickness and a 1700 mm radius of curvature. The models of the lower die, the upper die, and the steel sheet were created by using 3D software. Afterwards, the models were imported into the finite-element-simulation software. The material properties of the experimental material were imported into the simulation software. The MAT_36 material model was selected for the finite element simulation. The model was a three-parameter Barlat material model, which guaranteed reliable analysis results regardless of the thickness anisotropy coefficient. The cell type was selected as a shell cell (BT cell #2). In general, three or five integration points along the thickness are chosen for the stamping and forming simulation, and seven are chosen for the postprocessing springback. For the meshing, the maximum mesh size of the mold is 8 mm, the minimum is 0.5 mm, and the sheet cell size is 16 mm. After the meshing was completed, the mold was preprocessed for boundary checking, as shown in Figure 3.
The whole process can be divided into the following steps:
- (1)
- Cell-type and integration-point selection;
- (2)
- Mesh division;
- (3)
- Selection of sheet-material parameters;
- (4)
- Definition of the contact and friction treatment and the positioning of the tool;
- (5)
- Setting the parameters of the stamping and forming processes;
- (6)
- Setting of the control parameters;
- (7)
- Calculation of the solution.
The forming file is imported into EtaPostProcessor in the simulation software after the solver has been calculated, and the formed sheet can be studied for various parameters. At a feed rate of 200 mm/s, the upper and lower molds of the spherical part were closed at 3 s. The forming process was completed, and the sheet was formed, as shown in Figure 4.
Figure 4 shows the effect of the spherical-part-forming effect. The figure shows that the shape of the deformed part is smooth, and it is obvious that the part formed a spherical shape.
Figure 5 shows the displacement contours of the sheet after deformation, relative to the initial position; from the figure, it can be seen that the displacement trend is spherical, the center displacement is the largest, the edge displacement is the smallest, and the displacement change is spread out in all directions, with the center of the sheet as the center.
Figure 6 shows the isometric graph of the thickness change of the sheet after deformation; from the graph, it can be seen that the thickness of the sheet near the center of the four edges of the sheet increases slightly, the thickness of the surrounding area near the center of the sheet reduces slightly, and the thickness of most of the area remains normal. The area around the center of the sheet becomes thinner due to the first compression of the indenter, and the sheet in this area is subject to tensile stress; the edge of the sheet becomes thicker due to extrusion stress. The maximum thinning of the spherical sheet is (8 − 7.970)/8 = 0.38%, and the maximum thickening is (8.023 − 8)/8 = 0.29%, which shows that the thickness of the sheet changed very little.
From the stress-distribution diagram in Figure 7, it can be seen that the stress is evenly distributed along the center of the sheet to the surrounding area, with most of it distributed between 158 and 241 MPa. The stress value is less than the material yield limit, meaning that the area is in the elastic-deformation stage. The stress value near the four corners of the sheet is above 241 MPa, which is greater than the material yield limit, and the sheet in this area undergoes plastic deformation.
When opening the file in the EtaPostProcessor, the changes can be viewed in two separate frames: the first shows the forming result without springback, and the second shows the forming result with springback. By clicking on the sheet displacement, one can determine whether the sheet has sprung back, and the value of the springback can be determined by looking at the maximum amount of springback after punching and forming.
Comparing the results of the second frame (Figure 8b) with those of the first frame (Figure 8a), it is clear that the sheet springback was generated as a result of the elastic stress release. In frame (Figure 8b), it can be seen that the springback of the spherical sheet was symmetrically distributed. The maximum amount of springback can be seen in the four corner regions of the sheet.
The above simulation results meet the processing requirements. The software can obtain the rebound size, thinning rate, and forming state of the plate before and after springback, and in other related situations. Using the above simulation steps, more sets of finite element simulations were performed in this study, in which we changed the material, the plate thickness, and the bending radius to obtain more springback data. In Table 4, is the target bending radius of the sheet in the XOZ plane, is the target bending radius of the sheet in the YOZ plane, is the thickness of the sheet, is the maximum springback, and is the springback radius at the center of the sheet.
Using the data samples created in the finite element simulation, 160 of the sets of conformal parameters and springback results were randomly chosen as training groups. The remaining 6 groups were selected as test groups. These data were imported for the BPNN prediction model.
3. Establishment of the Machine Learning Model
The springback in sheet forming is an extremely complex nonlinear problem. The magnitude of springback is influenced by several factors: material properties, geological conditions, and processing. It is difficult to develop a valid mathematical formulation between these factors. A more effective approach is to use machine learning to explore the relationship between sheet-forming factors and springback results in order to predict the magnitude of springback and compensate accordingly. Today, various machine learning methods have been introduced into the study of predicting sheet springback. For example, artificial neural networks and support vector machines have achieved good results in the field of cold-bending springback prediction. However, the above algorithms can fall into local optimal solution problems. Therefore, a springback prediction model, SSA–BPNN, is proposed in this paper. Relying on the powerful nonlinear mapping ability and elastic structure of BPNN, as well as the strong fault tolerance, the problems that arise in predicting the bending springback of sheets were solved.
3.1. Sparrow Search Algorithm Theory
The sparrow search algorithm is a novel population-strengthening algorithm that was proposed in 2020. This algorithm is mainly derived from the foraging and anti-predatory behavior of sparrows. The algorithm has the following advantages:
- (1)
- It is easy to implement and is highly adaptable for a variety of optimization problems.
- (2)
- It has some global search and local focus capabilities.
- (3)
- It is scalable, stable, and robust.
- (4)
- It requires only a small number of parameters to be adjusted.
The sparrow search algorithm process is as follows:
Step 1: Formation of a sparrow population, with the population expression in the following form:
where is the dimensionality of the variable to be optimized, and is the population size.
Step 2: Initialize the sparrow population and calculate the fitness to obtain the individual fitness values, the global optimum, the worst fitness values, and the positions corresponding to them, with the following fitness values for all sparrows:
Step 3: The finder, who is the first to search for food, has a better fitness value; in addition, the finder acts as a searcher for the whole sparrow flock and provides food locations for the joiners. The finder has a larger search range than the joiners, and the finder location is updated, as in Equation (3).
where is the number of current iterations; is the maximum number of iterations; is the location information of the ith sparrow in the jth dimension; is a random number from 0 to 1; is an early-warning value and ranges from 0 to 1; is a safe value in the range 0.5–1; Q is a random number and is normally distributed; and is a matrix with all elements in the matrix being 1. If , then the predator is not nearby, and the discoverer can search extensively. Conversely, all sparrows have to find other safe locations to forage.
Step 4: The joiners monitor the finder at all times, and whenever they find that the finder has found better food, they will fly to the finder’s location to obtain it, and if they do, then they obtain the food found by the finder, and the joiner’s location will be updated, as in Equation (4).
where is the optimal position where the finder is located, is the current global worst position, is a matrix with one row and d columns, and each element has a random value of 1 or −1 and has . When , the ith joiner has not caught any food and needs to fly elsewhere to forage.
Step 5: Randomly generate the initial position of the vigilantes, with the vigilantes’ positions updated, as in Equation (5).
where is the current global optimum position; is a normally distributed random number with a mean of 0 and a variance of 1; is a random number within the range of −1–1; is the current fitness value of a single sparrow; and are the current global optimum and worst fitness value, respectively; and is a very small constant. When > , the sparrows are at the population boundary and vulnerable to attack. When = , danger approaches the sparrows in the middle of the population, and they fly towards other sparrows to ensure safety.
Step 6: Obtain the present best value. If the best value is better than the best value of the previous generation, then update the best value; otherwise, continue to iterate until the requirement is satisfied. Finally, the algorithm obtains the global best fitness value, and the localization of the global best fitness value is determined.
According to the rules of setting the parameters of the sparrow search algorithm and related experiences, the final setting of the basic parameters of the sparrow search algorithm is shown in Table 5. The sparrow search algorithm’s parameter-setting rules are as follows:
- (1)
- The population size must balance the relationship between search intensity and computational volume; the population size for the algorithm’s searching ability is enhanced but will lead to an increase in computational volume.
- (2)
- The number of discoverers is generally taken as 20% of the population size.
- (3)
- The number of vigilantes is generally taken to be 10–20% of the population size.
- (4)
- The safety threshold ranges from 0.5 to 1.
- (5)
- The specific value of the dimension of sparrows is determined based on the total number of weights and thresholds.
- (6)
- The location range specific values of sparrows are determined according to the actual solving problem.
3.2. Introduction of BBNN Model
The concept of the BP neural network can be traced back to 1986, when it was proposed by Rumelhart and McCelland. It is a multilayer feedforward neural network that allows both the forward propagation of signals and the reverse transmission of errors. When forward propagation is performed, the implicit layer processes the input quantity and then transmits it to the output layer. If the output does not meet the desired value, then backward propagation begins. The weights and thresholds are adjusted according to the prediction error. This is shown in Figure 9. In Figure 9, x1, x2, …, xi are the network inputs; y1, y2, …, yk are the network outputs; and are the BP neural network weights; and and are the BP neural network thresholds.
Before the BPNN starts its prediction, the network can be trained to achieve the function of prediction with associative memory, and the training process is as follows.
Step 1: Initialize the network of BPNN. The numbers of nodes in the input, hidden, and output layers are determined based on the sample data to be trained, and the weights and thresholds are initialized. These are initialized with consideration of the training metrics, the learning rate, the number of training sessions, and appropriate neuron activation functions. The number of nodes in the hidden layer is solved according to Equation (6).
Step 2: Solve the hidden layer. The jth implicit layer neuron can be represented as in Equation (7).
where is the jth neuron in the hidden layer, is the weight between the ith input and the jth implied, is the ith input in the input layer, is the threshold of the jth implied, and is the activation function of the hidden layer. The activation function of the hidden layer used in this paper is given in Equation (8).
Step 3: Solve the output layer.
where is the kth neuron in the output layer, is the weight between the jth implicit and the kth output, is the jth neuron in the implicit layer, and is the threshold for the kth output. The output layer activation function used in this paper is shown in Equation (10).
Step 4: The prediction error is calculated from the predicted and true outputs of the network and the weights and thresholds are updated to reduce the prediction error.
Step 5: Determine whether the algorithm is finished iterating. If not, return to Step 2.
In this paper, the BP neural network uses a basic three-layer structure, with six inputs and two outputs, and the number of iterations is usually between 1000 and 10,000. In this study, the chosen maximum number of iterations was 1000. The learning rate is as large as possible to avoid causing oscillations. In this study, 0.01 was chosen as the learning rate. The training target error is usually within 0.001~0.00001. In this study, 0.001 was chosen as the training target error. The bipolar S-type function in the implicit layer and the linear function in the output layer were used as transfer functions in this study. The LM algorithm was chosen for the learning and training functions, which have high operational efficiency for small- and medium-sized networks and can be adapted well to nonlinear problems. The LM algorithm is the most widely used nonlinear least squares algorithm. It is an algorithm that uses a gradient to find the maximum (minimum) value; figuratively speaking, it is a “mountain climbing” method. The algorithm has the advantages of both the gradient method and the Newton method. Based on these advantages, this study used the LM algorithm for the learning–training function. The performance function uses the mean squared error (MSE) of the formation metric, which is calculated as follows:
where is the true value of the ith sample, is the predicted value of the ith sample, and n is the number of samples.
The number of nodes in the hidden layer is calculated by using Equation (6). The number of nodes of the hidden layer can be in the range of 4–13. The mean square error is obtained by training after taking the number of nodes of the hidden layer, and all the results are shown in Table 6. In Table 6, it can be seen that, when the node value is 10, a minimum mean square error of 0.015 can be obtained. At this time, the BPNN fitting effect is optimal, and the three-layer structure of BPNN is finally determined as 6-10-2.
3.3. Establishment of the SSA–BPNN Model
Because the rate of convergence of the BPNN is slow, and because there are local minima, it was necessary to minimize the global error of the network by optimizing the original weights and thresholds of the BPNN. The sparrow search algorithm was used to improve the weights and thresholds of the BPNN so that it could output prediction results with higher accuracy; the main algorithm flow is shown in Figure 10. The operational steps are as follows:
Step 1: Calculate the dimension of the variable being optimized, as shown in Equation (12). Determine the maximum number of iterations, the population size, the number of discoverers, the number of vigilantes, and the upper and lower bounds on the position. Initialize the population position. Additionally, import the dataset (Table 3).
where is the number of input layers, m is the number of implied layers, and n is the number of output layers.
Step 2: Calculate the population fitness: record the global optimal fitness value and the global optimal position; rank the fitness values; update the positions of discoverers, joiners, and vigilantes; and calculate their fitness values separately. The fitness function is presented in Equation (13). The smaller the value of fitness, the better the fitness value of the individual.
where is the true value of the ith sample, and is the predicted value of the ith sample.
Step 3: If a value smaller than the existing fitness value appears, update the current fitness value and sparrow position.
Step 4: Optimization ends when the fitness value reaches the minimum value or reaches the maximum number of iterations. Otherwise, return to Step 2.
Step 5: The position of the sparrow with the smallest fitness value is assigned to the weights and thresholds of the neural network, allowing the best weights and thresholds to be obtained.
3.4. Defining Evaluation Indicators
(1) Evaluation of model training accuracy:
The purpose of springback prediction is to improve processors’ efficiency. The data-processing efficiency is a very important indicator for the efficiency of the model; therefore, the training time of the model needs to be considered. In this study, the time of model training was used as an indicator of model efficiency. The fewer the number of model iterations, the faster the convergence, and the higher the prediction efficiency of the model.
(2) Precision evaluation index:
The accuracy of the results needs to be evaluated after the training of the model. In this study, two indicators were used to evaluate the accuracy: the coefficient of determination () and the mean squared error (MSE).
The coefficient of determination () is between 0 and 1; the closer it is to 1, the better the regression fit. It is generally believed that the model fit should be better than 0.8.
where is the predicted value, is the true value, and n is the sample size.
The mean squared error is the ratio of the sum of squares of the deviations in the observations, to the true value, and to the number of observations.
MSE is a very common loss function used in linear regression. The linear regression process tries to keep the value of this loss function to a minimum. Then it can be used for comparisons between models. MSE can evaluate the degree of variation in the data, and the smaller the value of MSE, the more accurately the prediction model describes the data.
4. Results and Discussion
In this study, the algorithm was implemented by using MATLAB 2018a software. The trained model of the algorithm was used to detect the test group. The same test group was also predicted by using the unoptimized BPNN model. The test results are shown in Table 7.
Comparing the data in Table 7, we see that both the BPNN and the SSA–BPNN models achieve satisfactory results as far as the decision coefficient () is concerned. When comparing the other two evaluation metrics, however, SSA–BPNN has a definite advantage. Firstly, in terms of mean squared error (MSE), the mean squared error of the two predicted values in SSA–BPNN is clearly smaller and closer to zero. This indicates that the prediction accuracy of SSA–BPNN is higher. Secondly, in terms of the model computation time, SSA–BPNN has a more obvious advantage, with the SSA–BPNN model taking only about 0.0063 s to compute.
In addition, the sparrow-search-algorithm-optimized BPNN must be observed by judging the trend of the fitness function to see whether it meets the requirements.
Figure 11 shows the optimal sparrows for each generation of a sparrow flock, with a population size of 30. As seen in Figure 11, the fitness value of the SSA–BPNN reaches the lowest point and then remains unchanged, indicating that the fitness value has been optimized.
The specific results of the predictions using the SSA–BPNN model and the standard BPNN model are shown in Table 8 and Table 9 and Figure 12 and Figure 13.
It can be seen from Figure 12 and Figure 13 that the fitting performance using the predicted results of the SSA–BPNN model is better than that of the BPNN. From Table 9, it can be seen that average relative errors of SSA–BPNN in predicting the maximum springback and springback radius are 2.9% and 0.9%, respectively. These are significantly smaller than 5.2% and 2.7%, respectively, of BPNN and have obvious advantages in stability and prediction accuracy. As can be seen from Table 9, the overall relative error of the SSA–BPNN model is smaller than that of the basic BPNN; moreover, the relative error of individual values is smaller than that of the basic BPNN. The BPNN seems to have become trapped in a locally optimal solution. Therefore, it can be said that the SSA–BPNN model established in this paper has potential for solving the problem of sheet springback prediction.
5. Conclusions
In this paper, a hull-plate-forming rebound-prediction method based on an SSA–BPNN model is proposed. The method is based on the sparrow search theory and a BP neural network model. The results show that the proposed method can achieve high prediction accuracy and efficiency and is able to realize machine learning for springback prediction in ship-hull-sheet processing. This study provides a reference for solving the springback problem. The conclusions of this paper can be summarized as follows:
- The SSA–BPNN prediction model used in this paper can be applied to the prediction of springback in the multipoint forming of ship-hull sheets. We found that machine learning has a strong advantage in solving the problems of springback prediction; this conclusion was reached through an in-depth study of the algorithm, which led to a successful application of machine learning in the prediction of springback in ship-hull-sheet-forming processes.
- In this paper, SSA–BPNN was shown to be clearly superior in predicting ship-hull-sheet-processing springback. The proposed SSA–BPNN model was compared with the BPNN model. Although both can reach a coefficient of determination of 0.99, the SSA–BPNN model was more accurate in terms of prediction accuracy. The absolute mean errors of and were 44.5% and 68.1% lower, respectively, than those of the BPNN model. In terms of efficiency, the SSA–BPNN model was faster in terms of computational speed, reaching a result in about 0.0063 s.
- There is still a lot of room for improvement in future research. In this study, the research object has limitations. For example, only two materials (Q235 and Q345) were simulated in this study. Future studies will be conducted for a variety of materials and different shapes of sheets to increase the sample size. Additionally, more advanced algorithms will be added for cross-sectional comparison studies in the future.
Author Contributions
Conceptualization, L.L., Z.Z. and B.X.; methodology, L.L.; software, Z.Z.; investigation, L.L. and Z.Z.; data curation, B.X.; writing—original draft preparation, L.L. and Z.Z.; writing—review and editing, B.X. and Z.Z.; supervision, B.X. All authors have read and agreed to the published version of the manuscript.
Funding
This research was funded by The National Defense Basic Scientific Research Project (NO. JCKY2021414B011), the RO-RO Passenger Ship Efficient Construction Process and Key Technology Research (Project No. CJ07N20) and the Intelligent Methanol-Fueled New Energy Ship R&D Project (Guangdong Natural Resources Cooperation [2021] No. 44).
Institutional Review Board Statement
Not applicable.
Informed Consent Statement
Not applicable.
Data Availability Statement
Not applicable.
Acknowledgments
This research was supported by the high-tech ship project of the Ministry of industry and information technology: The RO-RO Passenger Ship Efficient Construction Process and Key Technology Research—The National Defense Basic Scientific Research Project. Additionally, we received funding from the Intelligent Methanol-Fueled New Energy Ship R&D Project.
Conflicts of Interest
The authors declare no conflict of interest.
References
- Hyun, C.M.; Kim, D.K.; Mun, S.H.; Park, J.S.; Dohr, K.W. A study on the concave type hull plate forming using induction heating system. J. Soc. Nav. Archit. Korea 2019, 56, 128–134. [Google Scholar] [CrossRef]
- Park, J.; Kim, D.; Hyun, C.; Shin, J.; Ko, K.H. Thermal forming automation system for curved hull plates in shipbuilding: Analysis and design. Int. J. Comput. Integr. Manuf. 2016, 29, 287–297. [Google Scholar] [CrossRef]
- Michaud, R.A.; Giacomin, A.J. Sheet temperature in thermoforming. J. Plast. Film Sheeting 2011, 27, 293–330. [Google Scholar] [CrossRef]
- Nguyen, D.T.; Kim, Y.S.; Jung, D.W. Finite element method study to predict spring-back in roll-bending of pre-coated material and select bending parameters. Int. J. Precis. Eng. Manuf. 2012, 13, 1425–1432. [Google Scholar] [CrossRef]
- Fu, Z.M.; Zhao, Z.F.; Xu, J.; Yu, X.L. Springback simulation study for air-bending forming of sheet metal. Optoelectron. Adv. Mater.-Rapid Commun. 2016, 10, 288–293. [Google Scholar]
- Shen, W.; Yan, R.J.; Li, S.Y.; Xu, L. Spring-back analysis in the cold-forming process of ship hull plates. Int. J. Adv. Manuf. Technol. 2018, 96, 2341–2354. [Google Scholar] [CrossRef]
- Shen, W.; Yan, R.J.; Lin, Y.; Fu, H.Q. Residual stress analysis of hull plate in multi-point forming. J. Constr. Steel Res. 2018, 148, 65–76. [Google Scholar] [CrossRef]
- Su, S.J.; Jiang, Y.C.; Xiong, Y.P. Multi-point forming springback compensation control oftwo-dimensional hull plate. Adv. Mech. Eng. 2020, 12, 1687814020916094. [Google Scholar] [CrossRef]
- Zhang, S.; Wu, J.J. Springback prediction of three-dimensional variable curvature tube bending. Adv. Mech. Eng. 2016, 8, 1687814016637327. [Google Scholar] [CrossRef]
- Xu, L.Z.; Shen, W.; Yan, R.J. Predictive and control models of the spring-back in thick hull plate forming. Int. J. Mater. Form. 2019, 12, 603–614. [Google Scholar] [CrossRef]
- Leu, D.K.; Zhuang, Z.W. Springback prediction of the vee bending process for high-strength steel sheets. J. Mech. Sci. Technol. 2016, 30, 1077–1084. [Google Scholar] [CrossRef]
- Froitzheim, P.; Stoltmann, M.; Fuchs, N.; Woernle, C.; Flugge, W. Prediction of metal sheet forming based on a geometrical model approach. Int. J. Mater. Form. 2020, 13, 829–839. [Google Scholar] [CrossRef]
- Serban, F.M.; Grozav, S.; Ceclan, V.; Turcu, A. Artificial neural networks model for springback prediction in the bending operations. Teh. Vjesn.-Tech. Gaz. 2020, 27, 868–873. [Google Scholar] [CrossRef]
- Abebe, M.; Yoon, J.S.; Kang, B.S. Radial basis functional model of multi-point dieless forming process for springback reduction and compensation. Metals 2017, 7, 528. [Google Scholar] [CrossRef]
- Guo, Z.F.; Tang, W.C. Bending angle prediction model based on bpnn-spline in air bending springback process. Math. Probl. Eng. 2017, 2017, 7834621. [Google Scholar] [CrossRef]
- Ma, S.C.; Kwon, E.-P.; Sang-Don, M.; Choi, Y. Prediction of Springback after V-Bending of High-Strength Steel Sheets Using Artificial Neural Networks. Trans. Mater. Process. 2020, 29, 338–346. [Google Scholar] [CrossRef]
- Gondo, S.; Arai, H. Effect and control of path parameters on thickness distribution of cylindrical cups formed via multi-pass conventional spinning. J. Intell. Manuf. 2022, 33, 617–635. [Google Scholar] [CrossRef]
- Yang, S.; Suk, K.Y. Optimization of Process Parameters of Incremental Sheet Forming of Al3004 Sheet Using Genetic Algorithm-BP Neural Network. J. Korea Acad.-Ind. Coop. Soc. 2020, 21, 560–567. [Google Scholar] [CrossRef]
- Dib, M.A.; Oliveira, N.J.; Marques, A.E.; Oliveira, M.C.; Fernandes, J.V.; Ribeiro, B.M.; Prates, P.A. Single and ensemble classifiers for defect prediction in sheet metal forming under variability. Neural Comput. Appl. 2020, 32, 12335–12349. [Google Scholar] [CrossRef]
- Trzepiecinski, T.; Lemu, H.G. improving prediction of springback in sheet metal forming using multilayer perceptron-based genetic algorithm. Materials 2020, 13, 3129. [Google Scholar] [CrossRef]
Figure 1.
Multipoint-forming principle.

Figure 2.
Simplified diagram of springback.

Figure 3.
Preprocessing model.
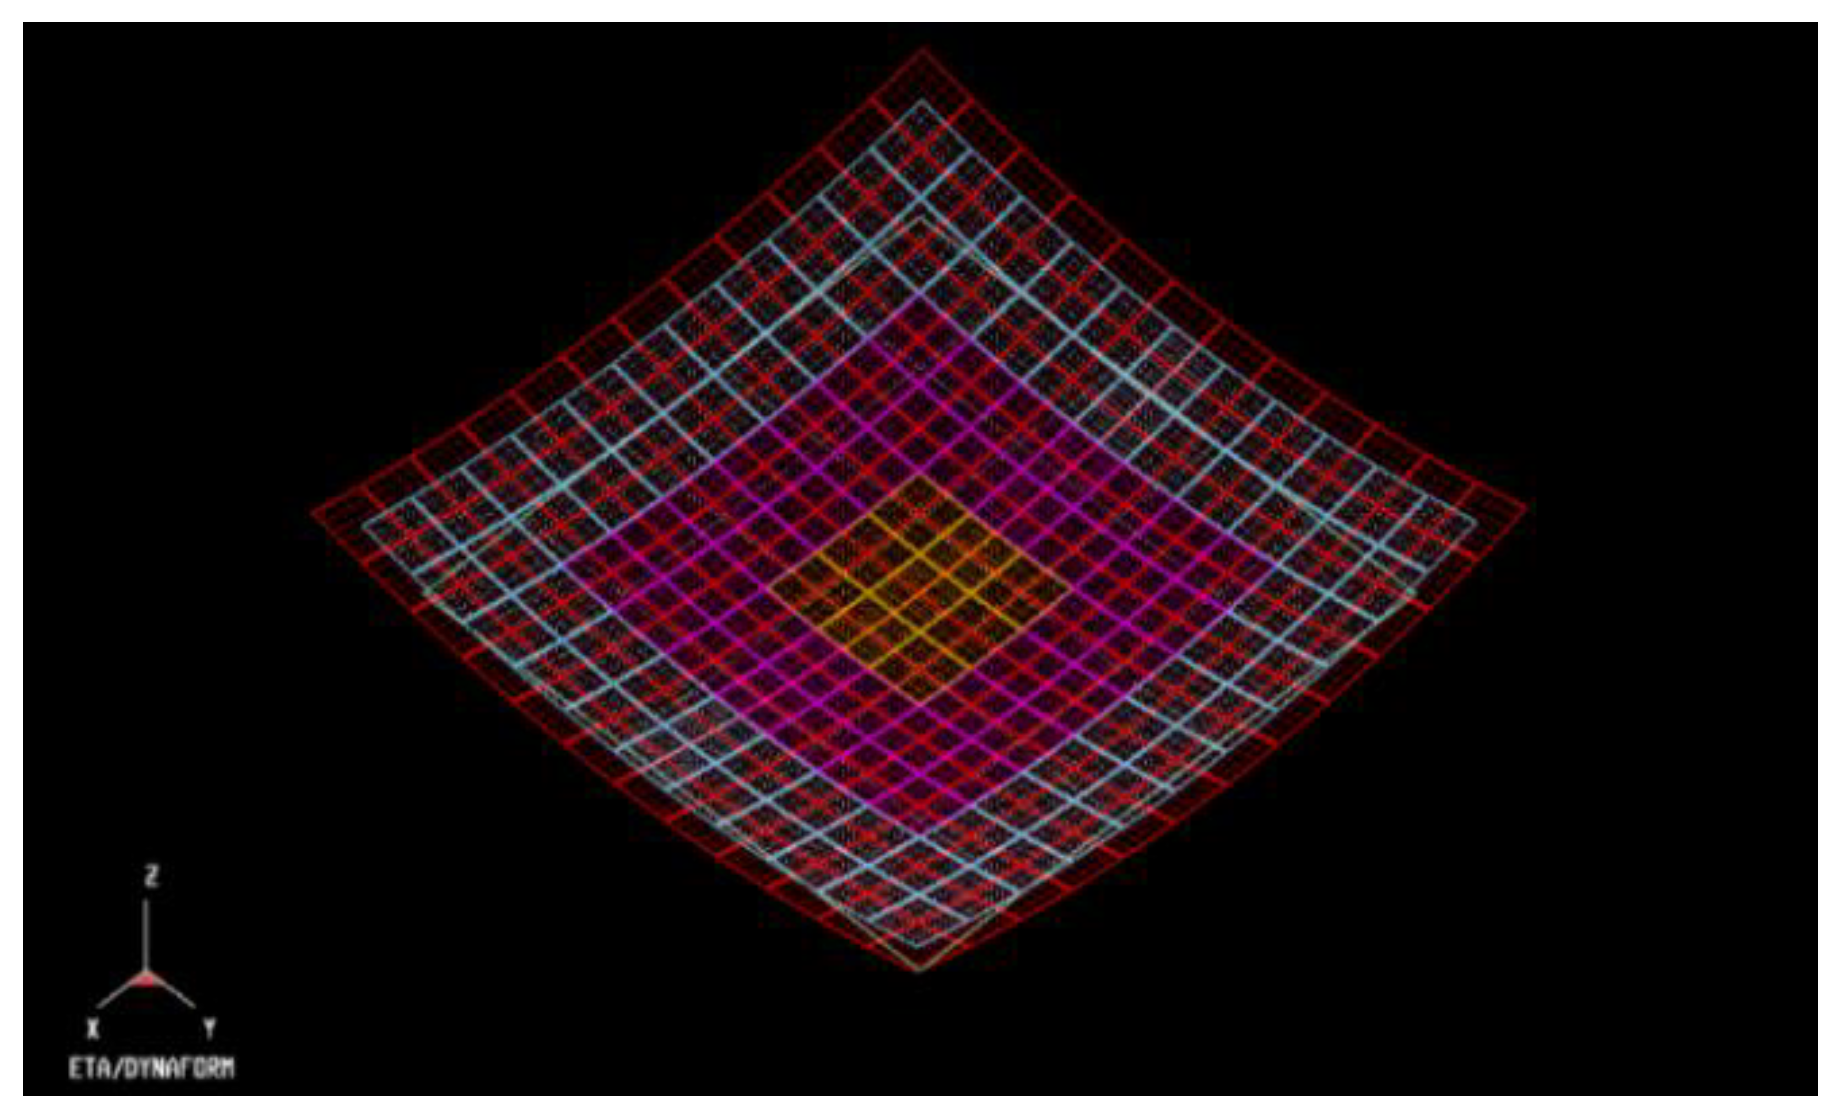
Figure 4.
Spherical-part-forming effect.

Figure 5.
Contour diagram of deformation displacement of the spherical part.

Figure 6.
Contour map of thickness change.

Figure 7.
The stress-distribution diagram.

Figure 8.
The springback results: (a) before springback and (b) after springback.

Figure 9.
The topology structure diagram of BPNN.

Figure 10.
The algorithm flow of the optimized BPNN based on the sparrow search algorithm.

Figure 11.
The fitness curve.

Figure 12.
Comparison diagram of prediction results of maximum springback.

Figure 13.
Comparison diagram of prediction results of springback radius.


Table 1.
Material properties.
| Material | E (GPa) | (MPa) | K (MPa) | n | r | ||||
|---|---|---|---|---|---|---|---|---|---|
| Q235 | 207 | 241.7 | 0.28 | 7830 | 680.84 | 0.167 | 1.5 | 1.2 | 1.3 |
| Q345 | 207 | 354.26 | 0.28 | 7830 | 814.94 | 0.134 | 1 | 0.88 | 0.95 |
Table 2.
Influencing factors of springback.
| Variable Type | Influencing Factors |
|---|---|
| Sheet variables | Sheet length, sheet width, bending radius, sheet thickness, material |
| Upper die variables | Feed rate, punching force |
| Lower die variables | Lower die radius of curvature |
| Contact surface variables | The surface contact friction coefficient |
| Bending setting variables | Bending holding time, bending angle |
| Crimp variables | Crimp material, crimp thickness, crimp force |
Table 3.
Parameters in finite element simulation.
| Variable Name | Range of Values |
|---|---|
| Sheet type | Q235/Q345 |
| Sheet size | 600 mm × 600 mm |
| Sheet thickness | 5~25 mm |
| Maximum punching force | 200 KN |
| Punch size | 60 mm × 60 mm |
| Friction coefficient between upper die, lower die, and sheet | 0.2 |
| Bending radius | 1700~2000 mm |
Table 4.
Results of partial molding simulation data.
| Number | t (mm) | (mm) | (mm) | (MPa) | K (MPa) | N | (mm) | (mm) |
|---|---|---|---|---|---|---|---|---|
| 1 | 8 | 1700 | 1700 | 241.7 | 680.84 | 0.167 | 3.887 | 1904 |
| 2 | 8 | 1800 | 1800 | 241.7 | 680.84 | 0.167 | 4.325 | 2081 |
| 3 | 8 | 1900 | 1900 | 241.7 | 680.84 | 0.167 | 4.812 | 2262 |
| 4 | 8 | 2000 | 2000 | 241.7 | 680.84 | 0.167 | 5.037 | 2463 |
| 5 | 8 | 1700 | 1700 | 354.26 | 814.94 | 0.134 | 7.355 | 2150 |
| 6 | 8 | 1800 | 1800 | 354.26 | 814.94 | 0.134 | 8.149 | 2420 |
| 7 | 8 | 1900 | 1900 | 354.26 | 814.94 | 0.134 | 9.030 | 2667 |
| 8 | 8 | 2000 | 2000 | 354.26 | 814.94 | 0.134 | 9.691 | 2981 |
| 9 | 9 | 1700 | 1700 | 241.7 | 680.84 | 0.167 | 3.274 | 1925 |
| 10 | 9 | 1800 | 1800 | 241.7 | 680.84 | 0.167 | 4.242 | 2049 |
| 11 | 9 | 1900 | 1900 | 241.7 | 680.84 | 0.167 | 4.394 | 2231 |
| 12 | 9 | 2000 | 2000 | 241.7 | 680.84 | 0.167 | 4.881 | 2376 |
| 13 | 9 | 1700 | 1700 | 354.26 | 814.94 | 0.134 | 7.335 | 2104 |
| 14 | 9 | 1800 | 1800 | 354.26 | 814.94 | 0.134 | 7.966 | 2314 |
| 15 | 9 | 1900 | 1900 | 354.26 | 814.94 | 0.134 | 8.789 | 2603 |
| 16 | 9 | 2000 | 2000 | 354.26 | 814.94 | 0.134 | 9.640 | 2819 |
| 17 | 10 | 1700 | 1700 | 241.7 | 680.84 | 0.167 | 3.045 | 1863 |
| 18 | 10 | 1800 | 1800 | 241.7 | 680.84 | 0.167 | 3.897 | 2006 |
| 19 | 10 | 1900 | 1900 | 241.7 | 680.84 | 0.167 | 4.188 | 2182 |
| 20 | 10 | 2000 | 2000 | 241.7 | 680.84 | 0.167 | 4.497 | 2381 |
| 21 | 10 | 1700 | 1700 | 354.26 | 814.94 | 0.134 | 6.933 | 2068 |
| 22 | 10 | 1800 | 1800 | 354.26 | 814.94 | 0.134 | 7.479 | 2286 |
| 23 | 10 | 1900 | 1900 | 354.26 | 814.94 | 0.134 | 8.087 | 2523 |
| 24 | 10 | 2000 | 2000 | 354.26 | 814.94 | 0.134 | 8.672 | 2750 |
| 25 | 11 | 1700 | 1700 | 241.7 | 680.84 | 0.167 | 2.847 | 1874 |
| 26 | 11 | 1800 | 1800 | 241.7 | 680.84 | 0.167 | 3.628 | 1991 |
| 27 | 11 | 1900 | 1900 | 241.7 | 680.84 | 0.167 | 3.664 | 2123 |
| 28 | 11 | 2000 | 2000 | 241.7 | 680.84 | 0.167 | 4.136 | 2287 |
| 29 | 11 | 1700 | 1700 | 354.26 | 814.94 | 0.134 | 6.592 | 2035 |
| 30 | 11 | 1800 | 1800 | 354.26 | 814.94 | 0.134 | 7.209 | 2233 |
| 31 | 11 | 1900 | 1900 | 354.26 | 814.94 | 0.134 | 7.661 | 2440 |
| 32 | 11 | 2000 | 2000 | 354.26 | 814.94 | 0.134 | 8.214 | 2638 |
Table 5.
Basic parameters of sparrow search algorithm.
| Parameter Name | Value | Description |
|---|---|---|
| Population size | 30 | - |
| Initial location | [−5, 5] | Randomly generated |
| Number of discoverers | 20% | - |
| Number of vigilantes | 10% | - |
| Safety threshold | 0.8 | - |
| Sparrow dimension | 81 | - |
| Sparrow position upper and lower limits | −5~5 | - |
| SSA maximum number of iterations | 30 | - |
Table 6.
MSE of different hidden-layer nodes.
| Nodes | ||||||||||
| MSE | 0.018 | 0.023 | 0.035 | 0.022 | 0.033 | 0.020 | 0.015 | 0.026 | 0.017 | 0.034 |
Table 7.
Comparison of prediction effect between BPNN and SSA–BPNN.
| Evaluation Indicators | BPNN | SSA–BPNN | ||
|---|---|---|---|---|
| 0.99 | 0.99 | |||
| MSE | 0.0138 | 0.0138 | 0.0004 | 0.0005 |
| Time | 0.06833 s | 0.006261 s | ||
Table 8.
Comparison of prediction results between BPNN and SSA–BPNN.
| n | t | K | n | Simulated Values | BPNN | SSA–BPNN | |||||
|---|---|---|---|---|---|---|---|---|---|---|---|
| 1 | 8 | 1700 | 354.26 | 814.94 | 0.134 | 7.355 | 2150 | 7.600 | 2227.7 | 7.558 | 2120.4 |
| 2 | 9 | 1800 | 241.7 | 680.84 | 0.167 | 4.242 | 2049 | 4.205 | 2061.5 | 4.279 | 2060.4 |
| 3 | 9 | 1900 | 354.26 | 814.94 | 0.134 | 8.789 | 2603 | 8.651 | 2583.8 | 8.666 | 2585.5 |
| 4 | 10 | 2000 | 241.7 | 680.84 | 0.167 | 4.497 | 2381 | 3.980 | 2338.2 | 4.614 | 2359.1 |
| 5 | 11 | 1700 | 241.7 | 680.84 | 0.167 | 2.847 | 1874 | 3.194 | 1746.5 | 3.123 | 1877.3 |
| 6 | 11 | 1800 | 354.26 | 814.94 | 0.134 | 7.209 | 2233 | 7.076 | 2292.7 | 7.216 | 2200.0 |
Table 9.
Comparison of relative errors between BPNN and SSA–BPNN.
| Model | Index | 1 | 2 | 3 | 4 | 5 | 6 | MAE |
|---|---|---|---|---|---|---|---|---|
| BPNN | 3.33% | 0.88% | 1.57% | 11.50% | 12.19% | 1.84% | 5.21% | |
| 3.61% | 0.61% | 0.74% | 1.80% | 6.80% | 2.67% | 2.70% | ||
| SSA–BPNN | 2.76% | 0.87% | 1.40% | 2.59% | 9.68% | 0.09% | 2.89% | |
| 1.38% | 0.56% | 0.67% | 0.92% | 0.18% | 1.48% | 0.86% |
Publisher’s Note: MDPI stays neutral with regard to jurisdictional claims in published maps and institutional affiliations. |
© 2022 by the authors. Licensee MDPI, Basel, Switzerland. This article is an open access article distributed under the terms and conditions of the Creative Commons Attribution (CC BY) license (https://creativecommons.org/licenses/by/4.0/).
Share and Cite
MDPI and ACS Style
Li, L.; Zhang, Z.; Xu, B. Prediction of Spherical Sheet Springback Based on a Sparrow-Search-Algorithm-Optimized BP Neural Network. Metals 2022, 12, 1377. https://doi.org/10.3390/met12081377
AMA Style
Li L, Zhang Z, Xu B. Prediction of Spherical Sheet Springback Based on a Sparrow-Search-Algorithm-Optimized BP Neural Network. Metals. 2022; 12(8):1377. https://doi.org/10.3390/met12081377
Chicago/Turabian StyleLi, Lei, Zheng Zhang, and Binjiang Xu. 2022. "Prediction of Spherical Sheet Springback Based on a Sparrow-Search-Algorithm-Optimized BP Neural Network" Metals 12, no. 8: 1377. https://doi.org/10.3390/met12081377
Note that from the first issue of 2016, this journal uses article numbers instead of page numbers. See further details here.