
Influence of Plunge Depth on Temperatures and Material Flow Behavior in Refill Friction Stir Spot Welding of Thin AA7075-T6 Sheets: A Numerical Study


Department of Mechanical Engineering, Universiti Teknologi PETRONAS, Seri Iskandar 32610, Malaysia
*
Author to whom correspondence should be addressed.
Metals 2022, 12(6), 927; https://doi.org/10.3390/met12060927
Submission received: 13 May 2022
/
Revised: 24 May 2022
/
Accepted: 26 May 2022
/
Published: 27 May 2022
(This article belongs to the Topic Development of Friction Stir Welding and Processing)
Abstract
:Plunge depth is one of the most important process parameters that affect the joint strength in refill friction stir spot welding (refill FSSW). In this study, a three-dimensional numerical model is developed using the Lagrangian incremental formulation in DEFORM-3D to simulate the refill FSSW process of thin AA7075-T6 sheets. The numerical model is verified by comparing the obtained temperatures at specific locations with the temperatures from the previous experimental studies. Material flow and temperature behaviors at three different plunge depths are analyzed using the numerical model. The temperatures and effective strains in the weld zone increased with an increase in plunge depth. The movement of the material in the stir zone is enhanced and a larger extent of material from the bottom sheet is involved in the stirring with the increase in plunge depth. The width and thickness of the stir zone are identified from the numerical model and are consistent with the experimental study from the literature. The increase and decrease in joint strength with the increase in plunge depth reported in the literature are correlated to the material flow behavior in the numerical models.
1. Introduction
Solid-state joining processes, such as friction stir welding (FSW) and friction stir spot welding (FSSW), have the capability of overcoming problems, such as porosity and liquation cracking, which are seen in fusion welding [1]. Refill FSSW, a variant of FSSW, patented by Helmholtz-Zentrum Hereon, can produce a spot weld without an exit hole which cannot be avoided in FSSW [2]. The refill FSSW has advantages over FSSW as it increases weld volume and eliminates fatigue, stress concentration, and corrosion cracking [3]. The tool setup of the refill FSSW consists of an independently moving shoulder and probe and a clamping ring. The probe and shoulder have vertical and rotary motions where they plasticize material by frictional heating. The clamping ring, with the help of a backing anvil, holds the workpiece tightly together and prevents the material adjacent to the shoulder’s outer periphery from flashing out during the process. Based on the sequence of shoulder/probe vertical movement, the refill FSSW is characterized as shoulder plunging and probe plunging variants [4]. The variant of shoulder plunging is most preferred as it produces weld with a larger weld volume and strength compared to the probe plunging variant [2]. The stages in the shoulder plunging variant of the refill FSSW process are shown in Figure 1.
Stage 1: In the beginning stage, the workpiece is firmly held together by a clamping ring and backing anvil. The frictional contact of the rotating shoulder and probe with the workpiece is not initiated.
Stage 2: In this shoulder plunging stage, the rotating shoulder plunges into the workpiece while the probes move in the vertical direction opposite to the shoulder. The workpiece is heated due to frictional heating and the plasticized material is filled in the reservoir created by the vertical movement of the shoulder and the probe.
Stage 3: By reversing the probe and shoulder direction in this stage, the plasticized material in the reservoir is pushed back into the workpiece.
Stage 4: In this stage, the vertical and rotating movements of the shoulder and probe are stopped, and the clamping ring is released leaving a spot weld without a keyhole.
From the previous experimental studies, it is observed that plunge depth (PD) is the most significant parameter in affecting mechanical properties, material mixing, and microstructure characteristics in refill FSSW of aluminum alloys [5,6,7,8,9,10,11,12,13,14,15]. It should be noted that although the joint strength increases with the increase in PD, it drops when the PD is further increased. The maximum joint strength of the refill FSSW welds is observed when the PD is between 60% and 65% of the joint’s effective thickness [7,8,10,12,13]. Shen et al. [6] revealed with the increase in PD, nugget thickness, heat, and material mixing are improved, which is the reason for the increase in joint strength. Yue et al. [7] reported that the effective bonding increased with an increase in PD. The joint strength is increased initially with an increase in PD and thereafter decreased. The hook height, which is a result of material flow, increased with an increase in PD, thereby reducing the effective joint thickness and joint strength. The study conducted by Kubit et al. [8] revealed that more material is involved in the stirring with an increase in PD, hence the joint strength is increased. Microscopic observations from the study by Luty et al. [9] disclosed that the volume of material mixing is increased, and the thickness of the top sheet is reduced with an increase in PD. Kluz et al. [12,13] also reported that joint strength first increases and then decreases with a further increase in PD. The decrease in joint strength with an additional increase in PD is associated with the weakening of the bottom sheet by the shoulder in the second stage. Sun et al. [14] and Yamin et al. [15] investigated the effect of PD in refill FSSW, and their reported findings also support the statement that the joint strength first increases with PD and then decreases further. In both the studies, the decrease in joint strength after increasing is associated with the increase in height of the hook as the hook promoted crack propagation.
The numerical models developed based on the Lagrangian incremental formulation in DEFORM-3D are able to withstand severe deformations and predict temperatures and material flow in similar processes, such as FSW, FSSW, and friction stir processing (FSP) [16,17,18]. A thermo-mechanical model with the probe plunging variant of refill FSSW is developed by Muci-Küchler et al. [19] using Abaqus-Explicit code. The model is validated with experimental results, and temperatures and material flow results are presented. The simulation in this study is restricted only to the plunging stage. Ji et al. [20,21] developed a numerical model using Ansys-Fluent to study the material flow velocities in refill FSSW. Their studies reported that material flow is enhanced with the increase in rotational speed and by adding geometrical features to the tools. The actual material flow behavior is not presented as the analysis was done using different models at different PD and mainly focused on material flow velocities. Malik et al. [22], using DEFORM-3D, refilled the exit hole by multi-stage operations which are different from conventional refill FSSW. Although the exit hole is refilled, quantitative results, for instance, temperature, strain, and material flow velocities, are not presented. An axisymmetric numerical model was developed by Kubit et al. [23] using Simufact Forming software. This numerical study presents two-dimensional material flow, which is consistent with the microstructural results of the joint. Zhang et al. [24] developed a three-dimensional numerical model using Coupled Eulerian-Lagrangian (CEL) formulation in ABAQUS and validated it with the experimental temperatures. The refill FSSW of magnesium alloy sheets is simulated, and material flow during the process is presented. Janga et al. [25] developed a thermos-mechanical model using Lagrangian incremental formulation in DEFORM-3D and validated the model against the experimental temperatures. The three-dimensional material flow, strain rates, and strain results are presented and correlated to the experimental results.
The influence of PD in refill FSSW is extensively investigated by experimental studies. Although the microstructural results from the start and stop experiments are used for studying material flow behavior, it is difficult to understand the material flow behavior during the process. A numerical model can provide a detailed understanding of the local material flow, as it can track material flow at every millisecond throughout the process. Few numerical studies presented the material flow and temperatures during refill FSSW. However, there are no numerical investigations when process parameters are varied. Moreover, it is rather challenging to investigate material flow in thin sheets. In the present study, a three-dimensional numerical model is developed to investigate the local material flow behavior of refill FSSW at different plunge depths.
2. Methodology: Finite Element Model of Refill FSSW
The refill FSSW process is simulated using an updated Lagrangian formulation, available in DEFORM-3D. The numerical simulations are a replication of the experimental studies from the previous work [15]. Hence, the material, dimensions of the tool geometries, and the process parameters of the refill FSSW are borrowed from the experimental study. The plunging and refilling stages are simulated by varying the plunge depth (PD) parameter of the refill FSSW process.
2.1. Geometry
The geometries used in the numerical model of refill FSSW consist of a toolset, workpiece, and a backing anvil. The detailed dimensions of geometries are shown in Figure 2. The geometries were modelled in CATIA (V5R20, Dassault Systèmes, Vélizy-Villacoublay, France) and thereafter imported and assembled in DEFORM-3D (version 10.2, Scientific Forming Technologies Corporation, Columbus, OH, USA). To increase the contact area and reduce the stress due to the sharp edge during the plunging stage, a fillet was added at the bottom edges of the shoulder [19,25]. The sheets in the experiment are clamped tightly between the backing anvil and clamping ring. Therefore, two sheets in the numerical model are assumed as a single sheet. To reduce the computational time, the length of the workpiece and the heights of the toolset are reduced.
2.2. Material Model and Meshing
The refill FSSW process involves high strain rates and temperature gradients. Therefore, the selection of suitable material law which can reflect the interaction of flow stress with strain rate, strain, and temperatures is important. The Johnson-Cook material law has been commonly used in the numerical modelling of the solid-state joining process [25,26], given by the equation as follows.
where the material flow stress is , represents the reference plastic strain rate, is the equivalent plastic strain, and is the plastic strain rate. The material constants -quasi-static yield strength, -strain hardening constant, -strengthening coefficient, - coefficient of thermal softening, and -coefficient of strain hardening are derivatives at the reference strain rate. The material applied for the workpiece is AA7075-T6. The material is loaded from the material library of DEFORM-3D and follows the Johnson-Cook material law. Using this law, the flow stress of the material varies with the change in strain, strain rate, and temperatures. The coefficients and constants used for the Johnson-Cook material law are from the study by Fang et al. [27]. Young’s modulus E = 68,900 MPa, Poisson’s ratio = 0.3, thermal conductivity 180.175 W/m K, specific heat capacity 870 J/kg K, and thermal expansion coefficient /K are the additional material properties.
2.3. Mesh, Boundary Conditions, Contact, and Simulation Controls
The shoulder and the probe are meshed with 70,000 elements, the clamping ring with 10,000, the backing anvil with 15,000 elements, and the workpiece with 180,000 elements, see Figure 3. Considering the nature of the refill FSSW, which involves intense deformation, an extensive remeshing scheme available in DEFORM is used. The remeshing scheme dependent on relative interference penetration is defined. Remeshing is triggered when the specified interference penetration depth (0.25) is reached or when the mesh/elements are severely deformed and become unusable.
The convective heat exchange between the surrounding environment and the refill FSSW setup (toolset, workpiece, and backing anvil) is defined with a coefficient h = 0.02 N/mm/s/K [25,28]. The heat transfer between contact interfaces of toolset and workpiece was defined with a heat transfer coefficient of 11 N/mm/s/K [16,25]. The emissivity during the simulation is assumed as 0.7 [29]. As the temperatures rise, tool slippage can occur due to incipient melting. Therefore, a friction coefficient that varies according to the surface temperature is recommended [30]. In the simulation, Coulomb’s friction law, with the friction coefficient that varies with the temperature, is used, as shown in Table 1.
The stages of the simulation are as follows:
- (a)
- Shoulder plunging: The rotating shoulder plunges into the workpiece with a plunging rate (PR) of 0.5 mm/s and a rotational speed (RS) of 3000 rpm. The rotating probe, with the same RS and with a PR of 0.625 mm/s, moves in the opposite vertical direction;
- (b)
- Probe refilling stage: The probe and shoulder reverse their direction after the specified PD, maintaining the same axial and rotational speeds. The time taken for the two stages is equal and the total time of the process varies with PD.
The refill FSSW is simulated with variations in the plunge depths (PD), while the parameters, such as plunge rate (PR) (0.5 mm/s) and rotational speed (RS) (3000 rpm), are kept unchanged. The models M1, M2, and M3 are simulated by three different PDs of 0.5 mm, 0.7 mm, and 0.9 mm, respectively. The total time of simulation for the models M1, M2, and M3 are 2 s, 2.8 s, and 3.6 s, respectively.
3. Results and Discussion
The numerical temperature results from the models M1, M2, and M3 at the locations T1 (weld center), T2 (4 mm away from the tool central axis), and T3 (7.5 mm away from the tool central axis) are plotted, see Figure 4. The numerical model is verified by comparing the temperature results of model M2 with experimental temperature results measured at the locations T1, T2, and T3 from the previous study [15]. The numerical model M2 is the replication of the previous experimental study conducted with the same process parameters (PD 0.7 mm, RS 3000 rpm, and PR 0.5 mm/s), material, and toolset. Good correspondence between numerical temperature results and experimental temperature results is observed at all three locations. The peak values of the temperatures measured in the experimental study are T1–495 °C, T2–386 °C, and T3–233 °C, and the peak temperatures obtained for model M2 from the simulation are T1–506 °C, T2–377 °C, and T3–246 °C. For model M1 and model M3, the peak temperatures at the location T1 are 475 °C and 540 °C, respectively. The peak temperatures in all three models are observed after the plunging stage and at the beginning of the refilling stage, at roughly 60% of the process time. The lower temperatures reported in model M1 when compared to model M2 are due to reduced PD and welding time. Likewise, the higher temperatures in model M3 are due to increased PD and welding time. In all the plots of the three models, at T1, there is a steep temperature rise initially, and then a gradual increase and thereafter a gradual drop towards the process end is observed. It is seen that the temperatures drop with an increase in distance from the tool central axis in all three models. The temperature curve behaviors at location T2 for the three models have identical behaviors to the temperature curve at location T1. At location T3, a gradual increase in temperatures and a flatter trajectory towards the end of the process are seen in all three models. The peak temperature values from the numerical models M1, M2, and M3 at the locations T1, T2, and T3 are summarized in Table 2.
The temperatures during the refill FSSW process have a direct impact on softening and stirring of the material. The temperature contours of the models M1, M2, and M3 are presented in Figure 5. For all the models, the temperature distribution is symmetrical about the tool central axis, and temperatures dropped with an increase in distance from the tool central axis. The maximum temperatures are observed within the outer periphery of the shoulder, the region where material stirring takes place, i.e., the stir zone (SZ). The maximum temperatures for the models M1, M2, and M3 are 490 °C, 520 °C, and 560 °C, respectively. These temperatures, when compared to the melting temperature of the material (635 °C), are 0.77 Tm, 0.81 Tm, and 0.88 Tm, respectively. The temperatures increased with the increase in PD, which can be attributed to longer welding times and an increase in the shearing of the material. In the SZ, the temperatures are in the range of 440 °C to 490 °C for the model M1, between 460 °C and 520 °C for the model M2, and between 490 °C and 560 °C for the model M3. It can be seen that the temperatures in the SZ crossed the solidus temperature, which is 475 °C [31], especially for the models M2 and M3. The (MgZn2), which are hardening precipitates present in the AA7075-T6 alloy, are rapidly dissolved in the SZ in this high-temperature range (475 °C to 560 °C) [32]. This will soften the material in the SZ and enhance the movement and shearing of the material.
The microstructure and grain size of the weld is determined by the strain, strain rate, and temperatures. The effective strain at the end of the refill FSSW process is shown in Figure 6. The effective strain contour in all three models is symmetrical about the tool’s central axis. It can be seen that with the increase in the PD, the effective strain is also increased. High strains (27–72 mm/mm) were observed within the SZ, and adjacent to it, there is a moderate strain zone (18–27 mm/mm). The strain contours from the simulation can be correlated to the microstructures obtained from the experimental results from the earlier study [15]. The shape of the high strain region zone is matching with the fine grain microstructure region in the SZ from the experiments. The fine grain microstructure is a result of dynamic recrystallization, which happens due to severe plastic deformations and temperatures in the SZ. The SZ from the simulation results can be distinguished by high plastic strain and high temperatures. The region of fine grains along the thickness of the weld cross-section increases with the increase in the PD, which can be observed from the microstructure in the experimental results presented by Yamin et al. [15]. Furthermore, from the simulation results, it can be seen that the width and thickness of the high strain region increase with the increase in the PD. Adjacent to the SZ, there is a thermo-mechanically affected zone (TMAZ), which experiences moderate temperatures and moderate plastic strains. The moderate plastic strain regions in all the models and high strain regions in model M3 are inconsistent with the microstructure results outside the shoulder periphery as these regions are wider. As identified from the microstructure results from the experimental results, TMAZ is a very narrow zone outside the shoulder periphery, and the moderate strain contour is wider in the simulation results. The material movement outside the shoulder periphery should be taken into consideration to identify the TMAZ, which is discussed in the following sections. The region which is affected only by the thermal cycles without mechanical movement of the material is the heat-affected zone (HAZ).
Material flow is one of the important factors in deciding the joint quality of the refill FSSW process [20,33]. Here, to analyze the material flow in the three models, the behavior of the material flow is tracked using the flownet option and point tracking marked across the cross-section, see Figure 7. The flownet is marked with fine circles (6) along the thickness of the workpiece. The initial positions of the points were located on one half of the cross-section due to the symmetric nature of the process. The points are located along the thickness with a vertical distance of 0.3 mm between them and horizontally separated by a distance of 0.5 mm. The location points P1–P9 represent the top of the sheet, points P10-P18 represent the middle of the top sheet, the points P19–P27 represent the interface between top and bottom sheets (note that the workpiece is modelled as a single sheet combining top and bottom sheets), and the points P28-P36 represent the middle of the bottom sheets.
The material flow during refill FSSW of the model M1 is illustrated in Figure 8. The material flow images of the top view and front view at 25 %, 50 % (end of plunging stage), 75%, and 100 % (end of refilling stage) are presented in Figure 8. At t = 0.5 s, i.e., when the PD is 0.25 mm, the material inside the shoulder inner diameter and underneath the probe has upward movement, see points P1-P4 and P10-P14 in Figure 8a. The material adjacent to the shoulder’s inner and outer periphery and the material underneath the shoulder are pulled inwards toward the reservoir. This material near the shoulder is sheared outwards, see the flownet direction in the top view of Figure 8a. At this time, the shearing of the material has just started, the material under the shoulder has already moved inwards slightly (see point P6), and the material adjacent to the shoulder’s inner periphery (see point P5) has started shearing outwards. The material in the bottom sheet at this stage is unmoved, see points P19–P27 and P28–P36. At the halfway stage of the refill FSSW process, the shoulder reached the PD of 0.5 mm. At this stage, the material underneath the probe moved upwards further, see points P1–P4, P10–P13, and P19–P22 in Figure 8b. The material, which is under the influence of the shoulder, moved inwards into the reservoir further as the PD increased, see points P5–P7, P14–P16, and P23–P25 (interface) [34]. The movement of the material in the middle of the bottom is mostly unmoved, except for the little inward movement of the material under the shoulder influence, see points P32–P34. After more material adjacent to the shoulder’s outer periphery is pulled inwards to the inner periphery region (points P7, P16, and P25), the material in this region is further sheared outwards due to the rotation of the shoulder, see the movement of the flownet and the points P5–P7, P14–P16, and P24 in the top view of Figure 8b. The material outside the shoulder periphery, which is at a distance of 3.5 mm away or more from the tool central axis, is unmoved, see points P8–P9, P17–P18, P25–P26, and P35–P36. To summarize the overall material flow in the plunging stage, there is an upward movement of the material inside the shoulder periphery, squeezing of the material inwards into the reservoir from the shoulder’s outer periphery, and a strong shearing of the material outwards, which is nearby the shoulder’s inner periphery. The material movement patterns and the movement of the material from the bottom sheet (interface shape) are consistent with the experimental results from the earlier studies [33,34]. The refilling stage in refill FSSW of model M1 is illustrated in Figure 8c,d. The plasticized material which moved into the reservoir in the plunging stage is refilled back into the workpiece by the probe movement. The material under the influence of the shoulder’s rotation continued shearing outwards, see the flownet movement and the points P4–P6, P14–P16, and P23–P25 in the top view of Figure 8c,d. Around the shoulder periphery, there is intermixing of the material of both sheets, see points P23–P25, which moved into the top sheet material. This is also an indication that material movement is higher near the shoulder affected region than at the center. Towards the end of the process, the outward shearing of the plasticized in the SZ is enhanced. The outward shearing of the material under the influence of the shoulder is more compared to the material away from the shoulder periphery and material at the center, see the flownet movement in the top view of Figure 8d. A refilled weld is seen at the end of the refilling stage, see the front view in Figure 8d. The material movement outside the shoulder diameter is restricted to a narrow region (TMAZ) less than 0.5 mm. It can be seen that the material, which is at 3.5 mm from the tool central axis, hardly moved during the process, see points P8–P9, P17–P18, P25–P26, and P35–P36.
The material flow in model M2 is presented in Figure 9. The material flow patterns are similar to that of the material flow in model M1. The material flow during the plunging stage when the shoulder reached the PD of 0.5 mm is already illustrated in Figure 8, hence the material flow at the end of the plunging stage (PD = 0.7 mm) is presented in Figure 9a. It can be seen that the shoulder plunged into the bottom sheet at this stage, and the material from the bottom sheet moved upwards, see points P19–P22 (interface). As the PD increased from 0.5 mm to 0.7 mm, more material from the bottom sheet, near the shoulder region, was squeezed towards the reservoir, see points P24, P25 position, and interface shape in the front view of Figure 9a. The material in the middle of the bottom sheet, which hardly moved at the PD =0.5 mm, moved slightly upwards and inwards, see points P28–P34. Although the shearing of the material under the shoulder is similar to that of model M1, more material from the bottom sheet is sheared outwards comparatively, see the top view of Figure 9a. The points P4–P7, P14–P16 from the top sheet, and the points P23-P25 from the bottom sheet are strongly sheared outwards, indicating the increased outward shearing with the increase in PD, see Figure 9a top view. In the refilling stage, while the material in the reservoir is being refilled, the outward shearing of the material continued, see the flownet movement and points P3–P6, P12–P16, P22–P25, and P33 in the top view of Figure 9b,c. More material and stronger outward shearing of the material are observed adjacent to the shoulder’s inner periphery compared to model M1. Moreover, the outward movement of the plasticized material at the center is enhanced when compared to model M1, see flownet thickness in the top view of Figure 9c. The material outside the shoulder periphery has negligible movement during plunging, but during the refilling stage, it is slightly pulled inwards, see points P17, P26, and P35 in Figure 9b,c. Hence, it can be confirmed that the range of material movement outside the shoulder periphery is extended when the PD is increased.
The material flow in the model M3 during refill FSSW is shown in Figure 10. When compared with models M1 and M2 at the end of the plunging stage, the material flow patterns are the same, but a larger amount of the material from the bottom sheet is squeezed inwards and has also moved upwards into the reservoir, see points P19–P25, and P28–P34 in the front view of Figure 10a. Furthermore, a stronger outward shearing of the material is observed compared to models M1 and M2, see the flownet distribution in the SZ in the top view of Figure 10a–c. From the flownet, it can be observed that the outward movement of the material is higher adjacent to the shoulder’s inner periphery and decreased towards the weld center, see the top view of Figure 10c. Due to the increase in PD, the temperatures and plasticization of the material are increased, and more material has enhanced movement. The range of the material movement outside the shoulder periphery further increased compared to the model M2, see points P8, P17, P26, and P35 in the front view of Figure 10b,c.
To analyze the local behavior of the material flow further, time-averaged velocities of the points located in Figure 7, during the refill FSSW of all the three models, are plotted in Figure 11. In all three models, it can be observed that material velocities are higher for the material under the shoulder next to the material adjacent to the shoulder outer periphery, consistent with the earlier study [20]. As the distance increased from the tool central axis, the average velocities increased up to a distance of shoulder outer diameter (3 mm) and then dropped to a minimum outside the shoulder periphery at 4 mm. The highest velocity of the material here is due to squeezing the material inwards and strong outward shearing. For model M1, the highest average velocity is 19 mm/s, followed by 18.3 mm/s, see the corresponding points P16 and P7 in Figure 8. With the increase in PD, the velocities in the bottom sheet increased. The same can be observed from the material flow analysis discussed earlier. For model M2, the highest average velocity is 13.3 mm/s, followed by 9.6 mm/s and 8.5 mm/s, see the corresponding points P25, P16, and P7 in Figure 9. For model M3, the highest average velocity is 14.4 mm/s, followed by 12 mm/s and 10 mm/s, see the corresponding points P25, P16, and P7 in Figure 10. As the PD increases, the average velocities within the shoulder inner diameter also increase, see Figure 10. This increase in average velocities is consistent with the material flow results discussed earlier, see flownet in Figure 8, Figure 9 and Figure 10. The averaged velocities in the bottom sheet inside the shoulder periphery are increased by 23.9 % from model M1 to M2 and 47.5 % from M1 to M3. From the material flow velocity results, it is further confirmed that there is no considerable material movement after a distance of 3.5 mm from the tool’s central axis.
The lap shear strengths (LSS) reported in the literature [15] for model 1, model 2, and model 3 are 895 N, 3069 N, and 2433 N, respectively. From the experimental LSS tests, it is observed that change in PD has a significant effect on joint strength. With the increase in PD = 0.5 mm to PD = 0.7 mm the LSS increased up to 70.8 % and then dropped by 20.7 % with a further increase in PD = 0.9 mm. The lower LSS can be attributed to inadequate material mixing between the top and bottom sheets, see Figure 8. Although the material from the bottom sheet mixed with the material of the top sheet near the shoulder region, the majority of the material from the bottom sheet is not involved in stirring and mixing, which is consistent with the earlier studies [6,8,12,13]. For model M2 and model M3, the shoulder penetrated the bottom sheet, and hence more material from the bottom sheet is mixed with the top sheet [6,8,12,13], see Figure 9 and Figure 10. Moreover, the softening of material with the increase in temperatures in SZ further contributes to the material flow. From the fracture analysis of the joint, it is observed that the joint with 0.5 mm PD had a shear fracture through the weld, and the joints with 0.7 mm and 0.9 mm PD had plug pullout fractures [15]. The crack in the plug pullout fracture mode was initiated in the TMAZ because TMAZ is a weaker bonding zone with moderate plastic strains and temperatures [8,10,11]. The geometrical feature of the weld, such as the hook, is one of the important factors affecting the weld strength [6,7,14,15]. The formation of the hook is attributed to the upward bending/flow of material at the interface [6,7,15]. From the material flow discussion earlier section, at the end of the plunging stage, it can be seen that with the increase in PD, the bending of the interface is increased, see Figure 8b, Figure 9a and Figure 10a. The increase in height of the hook is due to the increase in PD and the upward flow of material at the interface [6,7,15]. The reduction in LSS when the PD is increased from 0.7 mm to 0.9 mm can be attributed to an increase in hook height [15]. In the fracture analysis from the experimental study [15], it is observed that the crack which started in TMAZ propagated towards the hook. The bonding width is another geometrical feature that affects weld strength. The bonding width increases with an increase in PD, which, in turn, increases weld strength [7,9,15]. The increase in width of the plastic strain region and material flow outside the shoulder periphery can be correlated to this scenario of an increase in bonding width with the increase in PD. However, the hook height is the dominant factor, and it dominated the effect of bonding width in this case [15]. The joint with 0.9 mm PD had wider bonding width but also a higher hook height which is prone to assist crack propagation compared to the shorter hook height in a joint with 0.7 mm PD, which decelerates the crack propagation [15]. Furthermore, the decrease in LSS in the case of 0.9 mm PD is due to the weakening of the bottom sheet due to shoulder penetration during the plunging stage [12,13]. The damage contour results of the numerical models at the end of the plunging stage are shown in Figure 12. The damage contour shows the measure of the damage factor (degree of damage), which predicts the fracture. The damage factor (Df) is defined by equation (2) below. The damage factor increased with an increase in PD.
where is maximum principal tensile stress, is effective-stress, and is the increment of effective strain. The results of maximum temperatures, maximum effective strains, and maximum damage factors during the refill FSSW process by varying the PDs are summarized in Table 3.
4. Conclusions
The influence of PD during refill FSSW is studied using a three-dimensional thermo-mechanical model aiming to achieve a deeper understanding of thermal cycles and material flow. The numerical model is developed using Lagrangian incremental in DEFORM-3D and validated by comparing temperatures from the model with the temperatures measured in the earlier experimental study. The variations in thermal cycles, effective strains, material flow, and material flow velocities by varying the PD are presented. The SZ, TMAZ, and HAZ are differentiated by temperatures, strain, and material flow results. The temperatures and effective strains are symmetrical about the tool central axis and increased with the increase in PD. The maximum temperatures are 0.77 Tm, 0.81 Tm, and 0.88 Tm for models M1, M2, and M3, respectively. The amount of material from the bottom sheet material in the joint mixing and the material flow velocities in the SZ increased with the increase in PD. The averaged velocities of the bottom sheet in the SZ increased by 23.9% from model M1 to M2 and 47.5% from M1 to M3. The range of material movement outside the shoulder periphery is also enhanced with the increase in PD, which indicates an increase in the width of TMAZ. The bending of the interface due to the shoulder penetration during the plunging stage is increased with PD, which increases the hook height. The material movement and temperatures from the simulations are correlated to the LSS of the joint. Although the LSS and SZ volume increased with the increase in PD, the increased bending of the interface and weakening of the bottom sheet reduces the LSS.
Author Contributions
The idea of this research was perceived by V.S.R.J. and M.A.; V.S.R.J. performed numerical simulations and developed an outline of the paper under the supervision of M.A. The manuscript is reviewed and edited by M.A. All authors have read and agreed to the published version of the manuscript.
Funding
The APC charges were covered by the Graduate Studies funding by Centre of Graduate Studies-Cost Centre 015BD1-001 and Institute of Transport Infrastructure–Cost Center 015NBO-001, Universiti Teknologi PETRONAS.
Data Availability Statement
Not applicable.
Acknowledgments
The authors offer their profound thanks to Universiti Teknologi PETRONAS for financial aid through the Graduate Assistant Scheme.
Conflicts of Interest
The authors declare no conflict of interest.
References
- Nandan, R.; DebRoy, T.; Bhadeshia, H.K.D.H. Recent Advances in Friction-Stir Welding—Process, Weldment Structure and Properties. Prog. Mater. Sci. 2008, 53, 980–1023. [Google Scholar] [CrossRef] [Green Version]
- Schilling, C.; dos Santos, J. Method and Device for Joining at Least Two Adjoining Work Pieces by Friction Welding. U.S. Patent US6722556B2, 20 April 2004. [Google Scholar]
- Shen, Z.; Ding, Y.; Gerlich, A.P. Advances in Friction Stir Spot Welding. Crit. Rev. Solid State Mater. Sci. 2020, 45, 457–534. [Google Scholar] [CrossRef]
- Mazzaferro, J.A.E.; de Souza Rosendo, T.; Mazzaferro, C.C.P.; Ramos, F.D.; Tier, M.A.D.; Strohaecker, T.R.; dos Santos, J.F. Preliminary Study on the Mechanical Behavior of Friction Spot Welds. Soldag. Inspeção 2009, 14, 238–247. [Google Scholar] [CrossRef] [Green Version]
- Yang, H.G.; Yang, H.J. Experimental Investigation on Refill Friction Stir Spot Welding Process of Aluminum Alloys. Appl. Mech. Mater. 2013, 345, 243–246. [Google Scholar] [CrossRef]
- Shen, Z.; Chen, Y.; Hou, J.S.C.; Yang, X.; Gerlich, A.P. Influence of Processing Parameters on Microstructure and Mechanical Performance of Refill Friction Stir Spot Welded 7075-T6 Aluminium Alloy. Sci. Technol. Weld. Join. 2015, 20, 48–57. [Google Scholar] [CrossRef]
- Yue, Y.; Shi, Y.; Ji, S.; Wang, Y.; Li, Z. Effect of Sleeve Plunge Depth on Microstructure and Mechanical Properties of Refill Friction Stir Spot Welding of 2198 Aluminum Alloy. J. Mater. Eng. Perform. 2017, 26, 5064–5071. [Google Scholar] [CrossRef]
- Kubit, A.; Kluz, R.; Trzepieciński, T.; Wydrzyński, D.; Bochnowski, W. Analysis of the Mechanical Properties and of Micrographs of Refill Friction Stir Spot Welded 7075-T6 Aluminium Sheets. Arch. Civ. Mech. Eng. 2018, 18, 235–244. [Google Scholar] [CrossRef]
- Luty, G.; Andres, J.; Wrońska, A.; Burek, R.; Gałaszczyński, T. Effect of process parameters on microstructure and mechanical properties of rfssw lap joints of thin AL7075-T6 sheets. Arch. Metall. Mater. 2018, 63, 39–43. [Google Scholar]
- Kubit, A.; Bucior, M.; Wydrzyński, D.; Trzepieciński, T.; Pytel, M. Failure Mechanisms of Refill Friction Stir Spot Welded 7075-T6 Aluminium Alloy Single-Lap Joints. Int. J. Adv. Manuf. Technol. 2018, 94, 4479–4491. [Google Scholar] [CrossRef]
- Zhou, L.; Luo, L.Y.; Wang, R.; Zhang, J.B.; Huang, Y.X.; Song, X.G. Process Parameter Optimization in Refill Friction Spot Welding of 6061 Aluminum Alloys Using Response Surface Methodology. J. Mater. Eng. Perform. 2018, 27, 4050–4058. [Google Scholar] [CrossRef]
- Kluz, R.; Kubit, A.; Trzepiecinski, T.; Faes, K. Polyoptimisation of the Refill Friction Stir Spot Welding Parameters Applied in Joining 7075-T6 Alclad Aluminium Alloy Sheets Used in Aircraft Components. Int. J. Adv. Manuf. Technol. 2019, 103, 3443–3457. [Google Scholar] [CrossRef] [Green Version]
- Kluz, R.; Kubit, A.; Trzepiecinski, T.; Faes, K.; Bochnowski, W. A Weighting Grade-Based Optimization Method for Determining Refill Friction Stir Spot Welding Process Parameters. J. Mater. Eng. Perform. 2019, 28, 6471–6482. [Google Scholar] [CrossRef] [Green Version]
- Sun, G.-D.; Zhou, L.; Zhang, R.-X.; Luo, L.-Y.; Xu, H.; Zhao, H.-Y.; Guo, N.; Zhang, D. Effect of Sleeve Plunge Depth on Interface/Mechanical Characteristics in Refill Friction Stir Spot Welded Joint. Acta Metall. Sin. 2020, 33, 551. [Google Scholar] [CrossRef]
- Yamin, M.F. Mechanical and Microstructure Properties Evaluation of Similar Thin AA7075-T6 Welds by Refill Friction Stir Spot Welding. Master’s Thesis, Universiti Teknologi Petronas, Perak, Malaysia, 2021. [Google Scholar]
- Pashazadeh, H.; Masoumi, A.; Teimournezhad, J. A Study on Material Flow Pattern in Friction Stir Welding Using Finite Element Method. Proc. Inst. Mech. Eng. Part B J. Eng. Manuf. 2013, 227, 1453–1466. [Google Scholar] [CrossRef]
- D’Urso, G.; Longo, M.; Giardini, C. Friction Stir Spot Welding (FSSW) of Aluminum Sheets: Experimental and Simulative Analysis. Key Eng. Mater. 2013, 549, 477–483. [Google Scholar] [CrossRef]
- Asadi, P.; Mahdavinejad, R.A.; Tutunchilar, S. Simulation and Experimental Investigation of FSP of AZ91 Magnesium Alloy. Mater. Sci. Eng. A 2011, 21, 6469–6477. [Google Scholar] [CrossRef]
- Muci-Küchler, K.H.; Kalagara, S.; Arbegast, W.J. Simulation of a Refill Friction Stir Spot Welding Process Using a Fully Coupled Thermo-Mechanical FEM Model. J. Manuf. Sci. Eng. 2010, 132, 014503. [Google Scholar] [CrossRef]
- Ji, S.; Li, Z.; Wang, Y.; Ma, L.; Zhang, L. Material Flow Behavior of Refill Friction Stir Spot Welded LY12 Aluminum Alloy. High Temp. Mater. Process. 2017, 36, 495–504. [Google Scholar] [CrossRef]
- Ji, S.; Wang, Y.; Li, Z.; Yue, Y.; Chai, P. Effect of Tool Geometry on Material Flow Behavior of Refill Friction Stir Spot Welding. Trans. Indian Inst. Met. 2017, 70, 1417–1430. [Google Scholar] [CrossRef]
- Malik, V.; Sanjeev, N.K.; Hebbar, H.S.; Kailas, S.V. Finite Element Simulation of Exit Hole Filling for Friction Stir Spot Welding—A Modified Technique to Apply Practically. Procedia Eng. 2014, 97, 1265–1273. [Google Scholar] [CrossRef] [Green Version]
- Kubit, A.; Trzepiecinski, T. A Fully Coupled Thermo-Mechanical Numerical Modelling of the Refill Friction Stir Spot Welding Process in Alclad 7075-T6 Aluminium Alloy Sheets. Arch. Civ. Mech. Eng. 2020, 20, 117. [Google Scholar] [CrossRef]
- Zhang, H.F.; Zhou, L.; Li, G.H.; Tang, Y.T.; Li, W.L.; Wang, R. Prediction and Validation of Temperature Distribution and Material Flow during Refill Friction Stir Spot Welding of AZ91D Magnesium Alloy. Sci. Technol. Weld. Join. 2021, 26, 153–160. [Google Scholar] [CrossRef]
- Janga, V.S.R.; Awang, M.; Yamin, M.F.; Suhuddin, U.F.H.; Klusemann, B.; Santos, J.F. dos Experimental and Numerical Analysis of Refill Friction Stir Spot Welding of Thin AA7075-T6 Sheets. Materials 2021, 14, 7485. [Google Scholar] [CrossRef]
- Mandal, S.; Rice, J.; Elmustafa, A.A. Experimental and Numerical Investigation of the Plunge Stage in Friction Stir Welding. J. Mater. Processing Technol. 2008, 203, 411–419. [Google Scholar] [CrossRef]
- Fang, N. A New Quantitative Sensitivity Analysis of the Flow Stress of 18 Engineering Materials in Machining. J. Eng. Mater. Technol. 2005, 127, 192–196. [Google Scholar] [CrossRef]
- Kluz, R.; Kubit, A.; Wydrzyński, D. The Effect of Plunge Depth on the Strength Properties of Friction Welded Joints Using the RFSSW Method. Adv. Sci. Technol. Res. J. 2018, 12, 41–47. [Google Scholar] [CrossRef] [Green Version]
- Rahmaan, T.; Zhou, P.; Butcher, C.; Worswick, M.J. Strain Rate and Thermal Softening Effects in Shear Testing of AA7075-T6 Sheet. EPJ Web Conf. 2018, 183, 02037. [Google Scholar] [CrossRef]
- Awang, M. Simulation of Friction Stir Spot Welding (FSSW) Process: Study of Friction Phenomena; West Virginia University Libraries: Morgantown, WV, USA, 2007. [Google Scholar]
- Gerlich, A.; Avramovic-Cingara, G.; North, T.H. Stir Zone Microstructure and Strain Rate during Al 7075-T6 Friction Stir Spot Welding. Metall. Mater. Trans. A 2006, 37, 2773–2786. [Google Scholar] [CrossRef]
- Starink, M.J. Effect of Compositional Variations on Characteristics of Coarse Intermetallic Particles in Overaged 7000 Aluminium Alloys. Mater. Sci. Technol. 2001, 17, 1324–1328. [Google Scholar] [CrossRef] [Green Version]
- Shen, Z.; Li, W.Y.; Ding, Y.; Hou, W.; Liu, X.C.; Guo, W.; Chen, H.Y.; Liu, X.; Yang, J.; Gerlich, A.P. Material Flow during Refill Friction Stir Spot Welded Dissimilar Al Alloys Using a Grooved Tool. J. Manuf. Process. 2020, 49, 260–270. [Google Scholar] [CrossRef]
- Shen, J.; Lage, S.B.M.; Suhuddin, U.F.H.; Bolfarini, C.; dos Santos, J.F. Texture Development and Material Flow Behavior During Refill Friction Stir Spot Welding of AlMgSc. Metall. Mater. Trans. A 2018, 49, 241–254. [Google Scholar] [CrossRef]
Figure 1.
Stages in the refill friction stir spot welding (refill FSSW) process: (a) stage 1—initiation by clamping the workpieces firmly; (b) stage 2—shoulder-plunging stage; (c) stage 3—refilling of material back into workpiece; (d) stage 4—finishing stage.
Figure 1.
Stages in the refill friction stir spot welding (refill FSSW) process: (a) stage 1—initiation by clamping the workpieces firmly; (b) stage 2—shoulder-plunging stage; (c) stage 3—refilling of material back into workpiece; (d) stage 4—finishing stage.

Figure 2.
Geometries of modelled parts. (a) shoulder; (b) probe; (c) clamping ring; (d) backing anvil; (e) workpiece.
Figure 2.
Geometries of modelled parts. (a) shoulder; (b) probe; (c) clamping ring; (d) backing anvil; (e) workpiece.

Figure 3.
Meshed model of the refill FSSW process setup. (a) Isometric view; (b) side view.
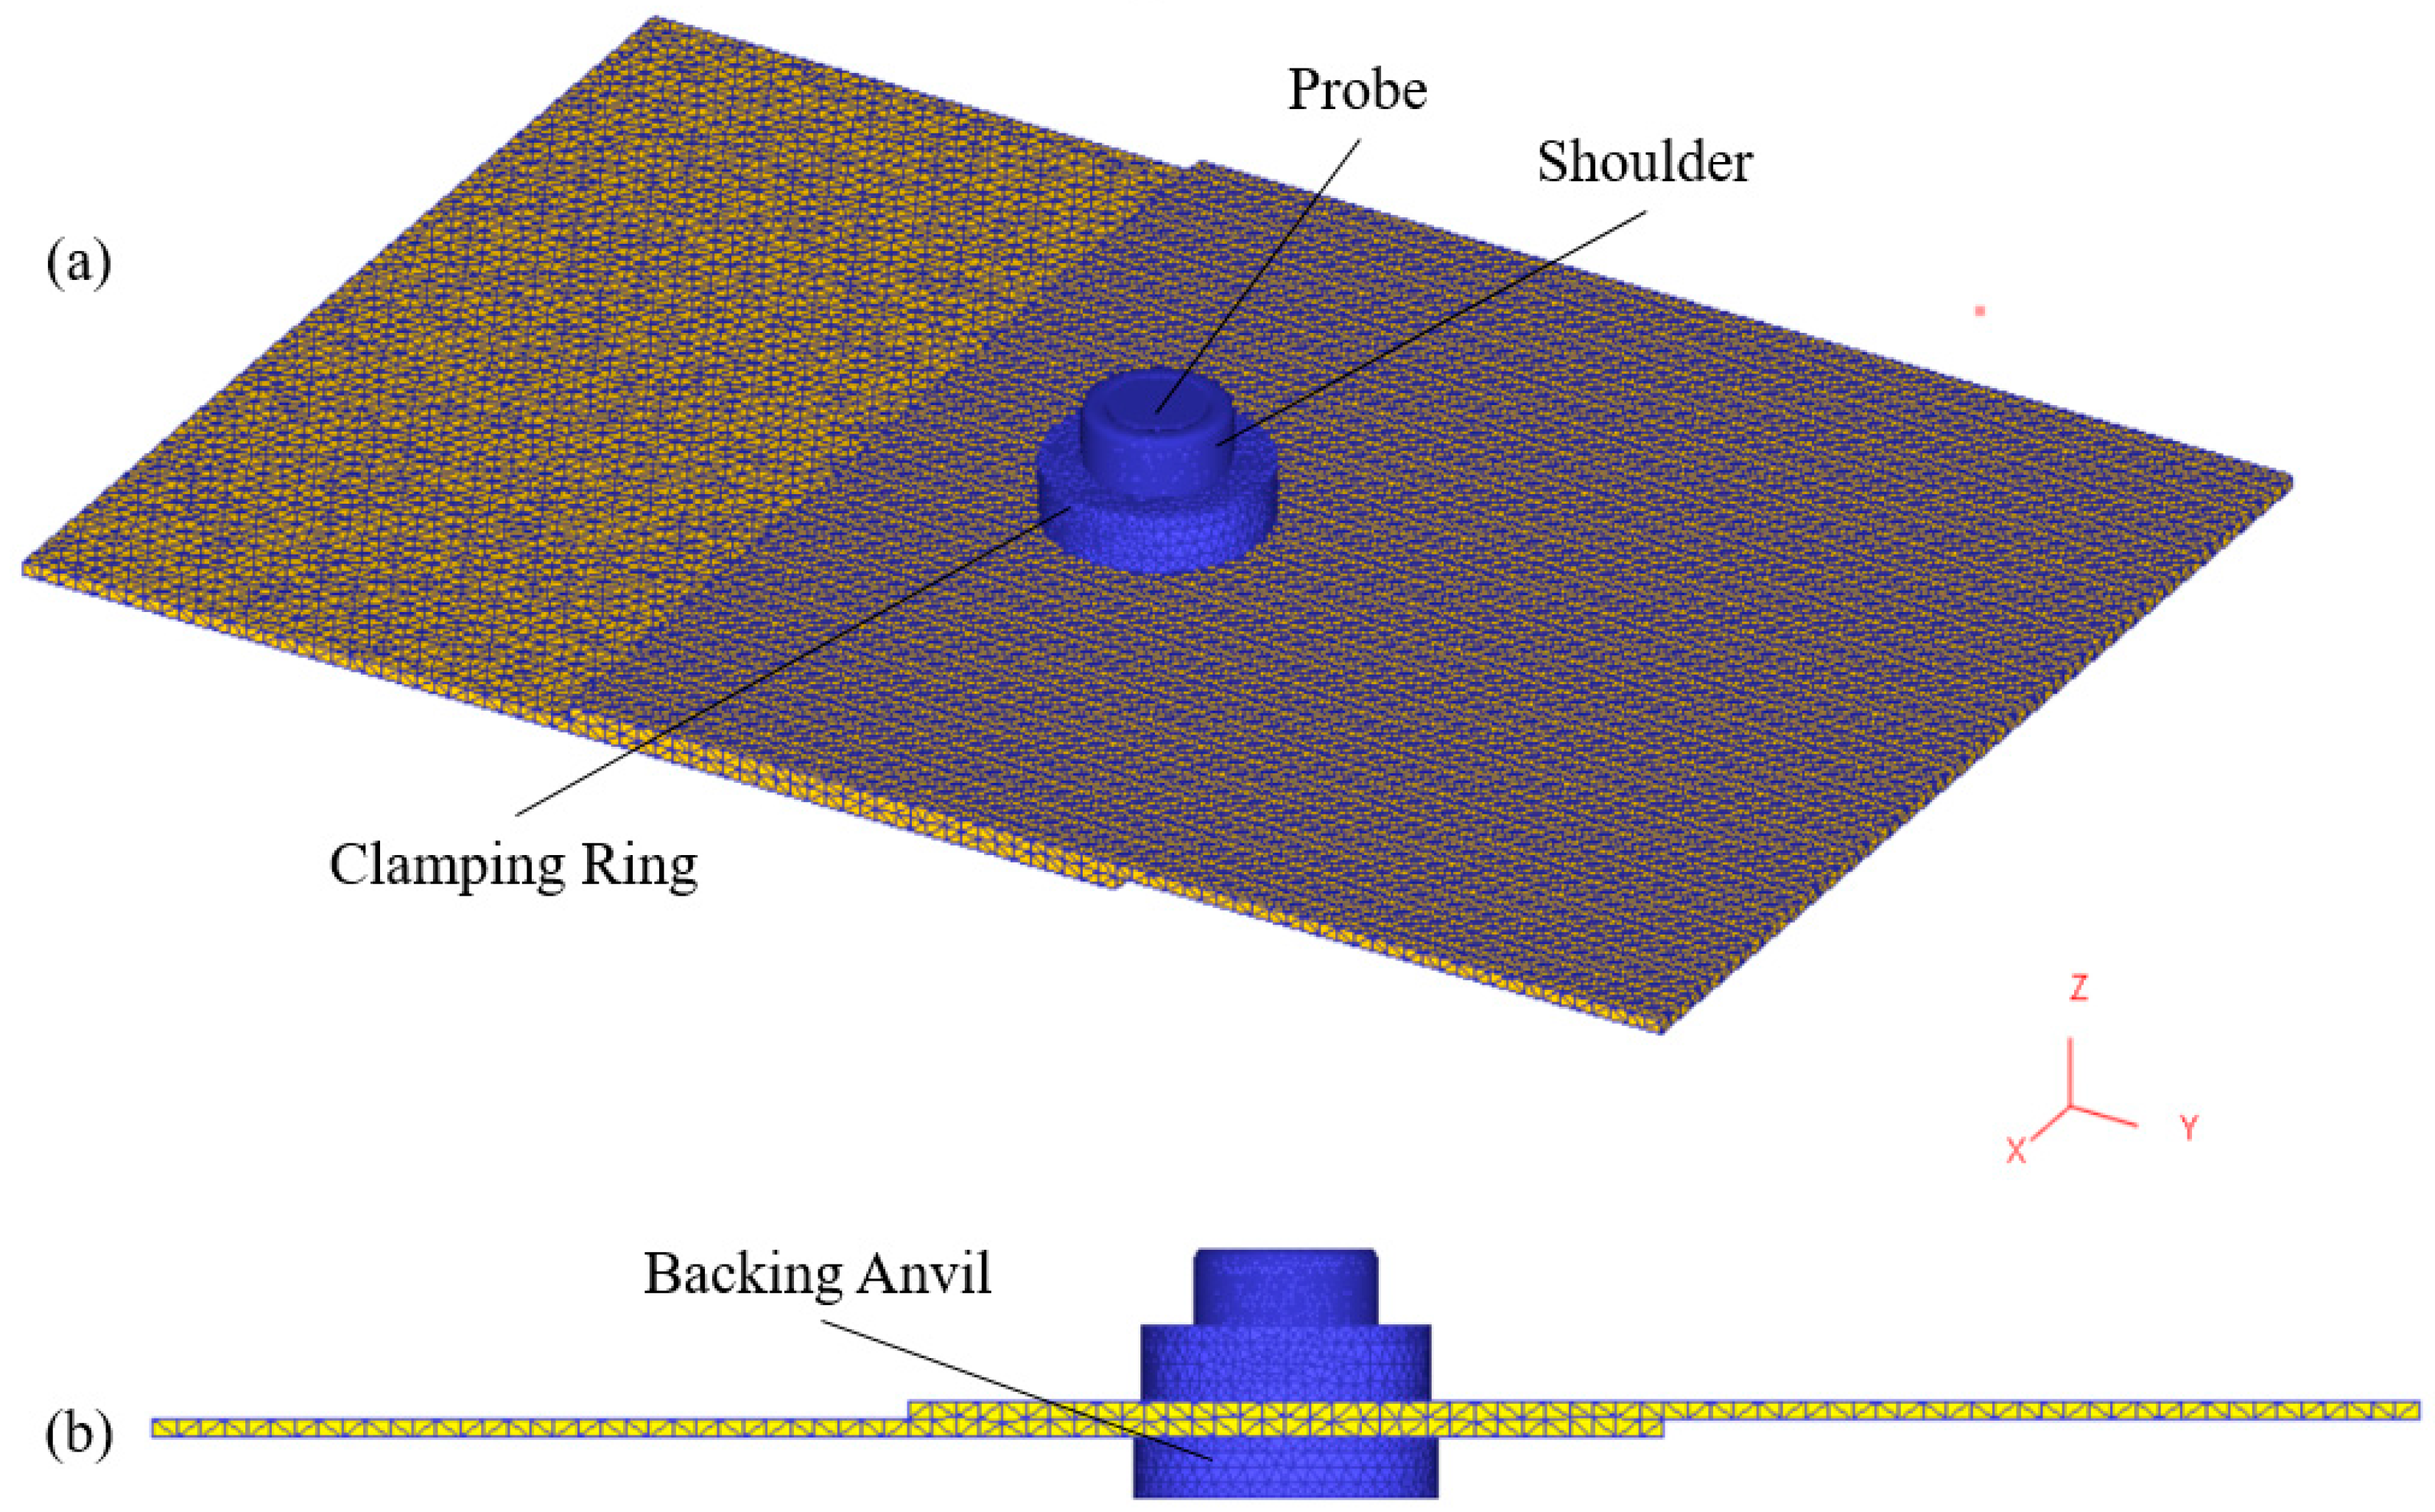
Figure 4.
Temperature results from the numerical model measured at T1, T2, and T3 for the models (a) M1; (b) M2; and (c) M3.
Figure 4.
Temperature results from the numerical model measured at T1, T2, and T3 for the models (a) M1; (b) M2; and (c) M3.


Figure 5.
Temperature distribution during refill FSSW process. (a) model M1; (b) model M2; (c) model M3.
Figure 5.
Temperature distribution during refill FSSW process. (a) model M1; (b) model M2; (c) model M3.

Figure 6.
Strain distribution at the end of the refill FSSW process. (a) model M1; (b) model M2; (c) model M3.
Figure 6.
Strain distribution at the end of the refill FSSW process. (a) model M1; (b) model M2; (c) model M3.

Figure 7.
Representation of flownet along the cross-section and initial position of selected points for material flow analysis.
Figure 7.
Representation of flownet along the cross-section and initial position of selected points for material flow analysis.

Figure 8.
Material flownet and point positions representing material flow in model M1 during the refill FSSW process. (a) Front View and Top View-0.5 s; (b) Front View and Top View-1 s; (c) Front View and Top View-1.5 s; (d) Front View and Top View-2 s.
Figure 8.
Material flownet and point positions representing material flow in model M1 during the refill FSSW process. (a) Front View and Top View-0.5 s; (b) Front View and Top View-1 s; (c) Front View and Top View-1.5 s; (d) Front View and Top View-2 s.


Figure 9.
Material flownet and point positions represent material flow in the model M2 during the refill FSSW process. (a) Front View and Top View–1.4 s; (b) Front View and Top View–2.1 s; (c) Front View and Top View–2.8 s.
Figure 9.
Material flownet and point positions represent material flow in the model M2 during the refill FSSW process. (a) Front View and Top View–1.4 s; (b) Front View and Top View–2.1 s; (c) Front View and Top View–2.8 s.

Figure 10.
Material flownet and point positions represent material flow in model M3 during the refill FSSW process. (a) Front View and Top View–1.8 s; (b) Front View and Top View–2.7 s; (c) Front View and Top View–3.6 s.
Figure 10.
Material flownet and point positions represent material flow in model M3 during the refill FSSW process. (a) Front View and Top View–1.8 s; (b) Front View and Top View–2.7 s; (c) Front View and Top View–3.6 s.

Figure 11.
Average velocities for the points located in Figure 7, during refill FSSW. (a) model M1; (b) model M2; (c) model M3.
Figure 11.
Average velocities for the points located in Figure 7, during refill FSSW. (a) model M1; (b) model M2; (c) model M3.

Figure 12.
Damage factors at the end of the plunging stage during refill FSSW. (a) model M1; (b) model M2; (c) model M3.
Figure 12.
Damage factors at the end of the plunging stage during refill FSSW. (a) model M1; (b) model M2; (c) model M3.


Table 1.
Temperature-dependent friction coefficient between steel and aluminum [30].
Table 1.
Temperature-dependent friction coefficient between steel and aluminum [30].
| Temperature (°C) | 20 | 160 | 200 | 400 | 500 | 580 |
|---|---|---|---|---|---|---|
| Coefficient of Friction (µ) | 0.35 | 0.3 | 0.25 | 0.08 | 0.02 | 0.01 |
Table 2.
Temperature comparison of numerical models M1, M2, and M3 at locations T1, T2, and T3.
| Peak Temperature (°C) at T1 | Peak Temperature (°C) at T2 | Peak Temperature (°C) at T3 | |
|---|---|---|---|
| Model M1 | 475 | 348 | 214 |
| Model M2 | 506 | 377 | 246 |
| Model M3 | 540 | 411 | 274 |
Table 3.
Comparison of temperatures, strains, and damage factors in models M1, M2, and M3.
| Maximum Temperature (°C) | Maximum Effective Strain (mm/mm) | Maximum Damage Factor | |
|---|---|---|---|
| Model M1 | 490 | 41 | 15 |
| Model M2 | 520 | 63 | 18 |
| Model M3 | 560 | 72 | 21 |
Publisher’s Note: MDPI stays neutral with regard to jurisdictional claims in published maps and institutional affiliations. |
© 2022 by the authors. Licensee MDPI, Basel, Switzerland. This article is an open access article distributed under the terms and conditions of the Creative Commons Attribution (CC BY) license (https://creativecommons.org/licenses/by/4.0/).
Share and Cite
MDPI and ACS Style
Janga, V.S.R.; Awang, M. Influence of Plunge Depth on Temperatures and Material Flow Behavior in Refill Friction Stir Spot Welding of Thin AA7075-T6 Sheets: A Numerical Study. Metals 2022, 12, 927. https://doi.org/10.3390/met12060927
AMA Style
Janga VSR, Awang M. Influence of Plunge Depth on Temperatures and Material Flow Behavior in Refill Friction Stir Spot Welding of Thin AA7075-T6 Sheets: A Numerical Study. Metals. 2022; 12(6):927. https://doi.org/10.3390/met12060927
Chicago/Turabian StyleJanga, Venkata Somi Reddy, and Mokhtar Awang. 2022. "Influence of Plunge Depth on Temperatures and Material Flow Behavior in Refill Friction Stir Spot Welding of Thin AA7075-T6 Sheets: A Numerical Study" Metals 12, no. 6: 927. https://doi.org/10.3390/met12060927
Note that from the first issue of 2016, this journal uses article numbers instead of page numbers. See further details here.