
Evaluation of Tannins as Potential Green Corrosion Inhibitors of Aluminium Alloy Used in Aeronautical Industry


1
Centro de Química Estrutural, Institute of Molecular Sciences, Departamento de Química e Bioquímica, Faculdade de Ciências, Universidade de Lisboa, 1749-016 Lisboa, Portugal
2
Instituto de Soldadura e Qualidade (ISQ), Tagus Park, 2740-120 Oeiras, Portugal
3
Força Aérea Portuguesa, Direção de Engenharia e Programas, Av. da Força Aérea Portuguesa, 2614-506 Amadora, Portugal
*
Authors to whom correspondence should be addressed.
Metals 2022, 12(3), 508; https://doi.org/10.3390/met12030508
Submission received: 21 February 2022
/
Revised: 8 March 2022
/
Accepted: 14 March 2022
/
Published: 16 March 2022
(This article belongs to the Topic Green Corrosion Inhibitors for Metallic Materials)
(This article belongs to the Section Corrosion and Protection)
(This article belongs to the Section Corrosion and Protection)
Abstract
:In this work some organic natural products were studied, namely tannic acid, gallic acid, mimosa tannin and chestnut tannin, as potential green corrosion inhibitors of the aluminium alloy AA2024-T3. The anodizing treatment was performed in a solution of the referred organic compounds in diluted sulfuric acid. The electrochemical impedance spectroscopy and the potentiodynamic polarization were performed to assess sealing quality and corrosion protection granted by the anodic films. To understand the green inhibitors; interaction with the metal surface, FTIR spectra of anodizing and anodizing and sealed samples of AA2023-T3 were recorded, and the shifts in the position of the major bands confirmed that the green inhibitor interacts with the metal surface. Images of the morphology of the coatings were provided by Scanning Electron Microscopy. From the results obtained through the various techniques that were used to carry out this study it is possible to conclude that the formed anodic films can be a good contribution for the prevention of corrosion in the aluminium alloy AA2024-T3.
1. Introduction
Aluminium alloy AA2024-T3 is usually used in the aeronautical industry due to its high strength and good mechanical properties. The composition of this alloy shows that Cu (4.4%), Mg (1.5%) and Mn (0.6%) are present, as well as minor amounts of Fe and Si. Due to the presence of these intermetallic particles, the aluminium’s resistance to corrosion is limited and corrosion protection is needed [1,2,3,4,5,6,7,8,9,10,11,12,13,14,15,16,17,18,19,20].
The anodising process in acidic media, mainly in sulfuric, chromic, boric or phosphoric acids, is widely used in the aeronautical industry to protect the aluminium alloys. On the other hand, former conversion treatments based on hexavalent chromium compounds have been restricted because these compounds are carcinogenic and have high environmental toxicity [12,13,20,21].
Anodic films obtained by anodizing in acid media usually consist of two layers, the inner one being a thin compact layer (100–150 Å) located next to the metal (barrier layer) [22], the thickness of which is directly proportional to the applied potential. The porous outer layer material, resulting from the etching of the acid to the oxide formed during anodizing process, consists of hexagonal columnar cells with a cylindrical pore at the center of each cell. These cells may reach up to about 100 μm thick under certain experimental conditions. To increase the corrosion resistance of these films, the pores of the oxide film must be blocked, which is achieved via immersion of the alloy in boiling water (sealing process). A hydrated oxide layer (bohemite, Al2O3·H2O) is thus formed, closing the pores [22].
The pores of the anodic film formed in sulfuric acid solution without any other chemical added are not well defined and the distribution is irregular [19]. In the literature several alternatives are described for better organizing the porous layer thus formed based on the use of anodising baths composed of mixtures of inorganic acids such as boric/sulfuric acid or by mixtures of organic/inorganic acids, such as the tartaric acid-sulfuric acid anodising bath (TSA) used by AIRBUS company [15]. The pores of the anodic films formed in TSA are well distributed and appear to be well organized [19].
The oxide film formed by anodization in the TSA bath does not dissolve in this medium but tartaric acid can combine with aluminium cations to produce aluminium tartrate. If the conversion coating is exposed to a corrosive environment, aluminium tartrate, despite its low solubility in water, may re-dissolve in some extension, producing a local buffer and thereby limiting the susceptibility to localized corrosion [15,22].
The inhibition of metal corrosion using green inhibitors in acidic media is a subject under development and a great number of studies are available. Usually, these inhibitors are organic compounds that contain heteroatoms such as O, N or S and sometimes multiple bonds, which may allow their chemical adsorption on the metal surface [23,24,25,26,27,28,29,30,31,32]. These studies are focused on the use of naturally occurring substances in order to find low-cost and non-hazardous inhibitors [27]. Examples of organic inhibitors include carboxylic acids, alkaloids, polyphenols and various plant extracts [33,34,35].
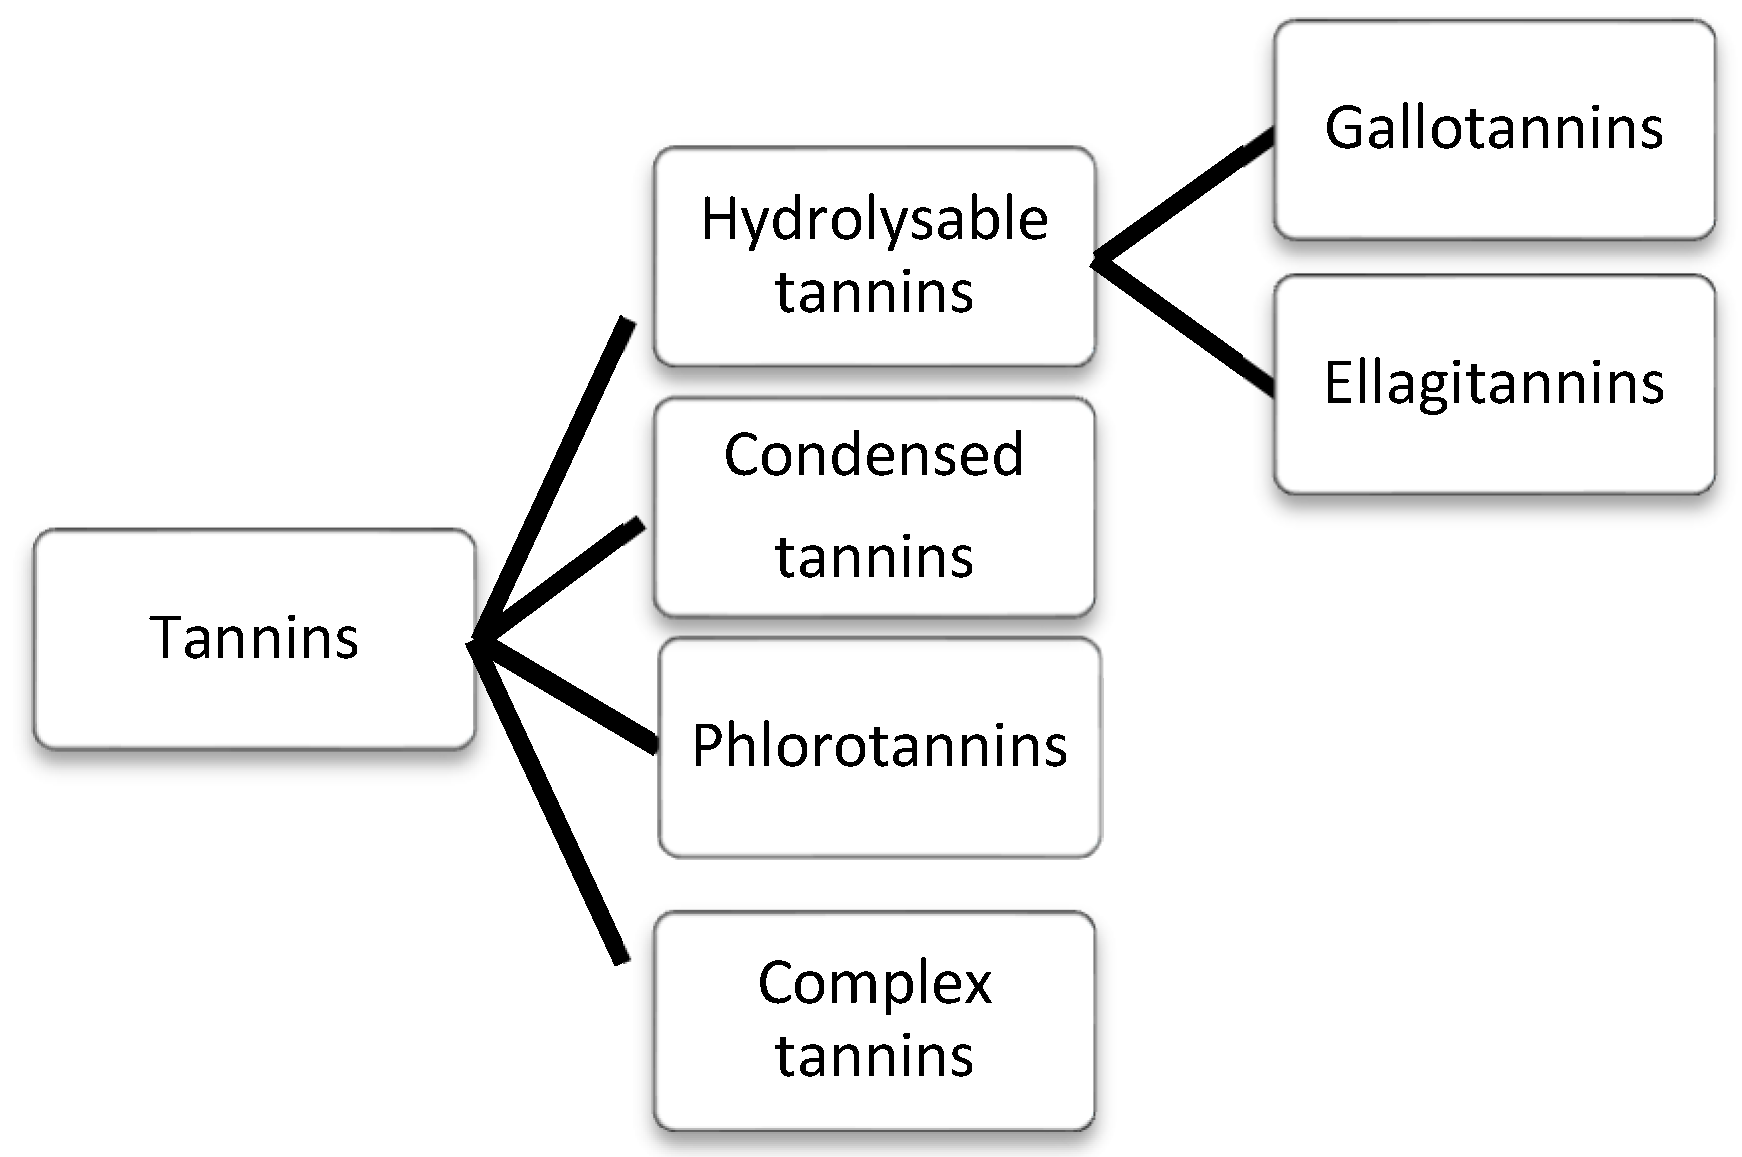
Tannins comprise a wide range of natural biodegradable polyphenols [31,32,33,34,35,36,37,38,39]. They have been used since antiquity to tan animal skins to form leather [29]. They are macromolecules with a molecular weight between 500 and 30,000 Da. Tannins are divided into two major groups, the hydrolysable tannins and the condensed tannins [30,37,40,41], and two less important ones, the phlorotannins and the complex tannins (Figure 1).
The hydrolysable tannins are esters of a monosaccharide, usually glucose, and phenolcarboxylic acids, and can be divided into two sub classes: gallotannins and ellagitannins. The condensed tannins are polymeric derivatives of flavonoids [34]. From acidic hydrolysis, gallotannins produce gallic acid and ellagitannins produce ellagic acid. Hydrolysable tannins such as chestnut bark and sumac leaves, the last one being a source of tannic acid, are used in the tanning industry. In gallotannins, the hydroxyl functions (OH) of the monosaccharide core can be partly or completely esterified with galloyl units. This class of compounds is present in many plants with important biological properties. Tannic acid, the most representative compound of this class, is constituted by a glucose central unit whose hydroxyl groups are esterified with digalloyl units linked by a meta-depside bond [40,41], Figure 2.
Ellagitannins also contain a monosaccharide esterified with gallic acid and at least one hexahydroxydiphenoyl residue formed by oxidative coupling between two galloyl units. Investigation of the constitution of chestnut tannin, an ellagitannin, indicated that the main components are monomeric vescalagin and castalagin, which represent 40–60% of this ellagitannin, Figure 3 [41].
The condensed tannins, also known as proanthocyanidins, are oligomeric or polymeric flavonoids, and are based on flavan 3-ol units linked via a carbon-carbon bond, Figure 4A. These tannins are found in the bark of several trees, such as mimosa and quebracho [40]. Mimosa tannin is mainly a trimer of three flavan-3-ol units with a catechin/gallocatechin (R′ = H/R′ = OH) basic structure, Figure 4B [41].
Complex tannins are formed from an ellagic acid unit and a flavan-3-ol unit linked to a monosaccharide unit and are rare. Phlorotannins are present in brown seaweeds and are polyphenolic compounds formed by polymerization of phloroglucinol units.
The literature describes the corrosion inhibition effect of tannins for steel alloys and carbon steel [30,36,39] resulting from the adsorption of these compounds on a metal surface and the blocking of active surface sites, thus reducing the corrosion rate [27]. The same authors describe the four types of adsorptions that may take place by these organic molecules at the metal/solution interface:
- (a)
- electrostatic attraction between the organic molecules and the metal;
- (b)
- interaction of oxygen lone electron pairs with the metal;
- (c)
- interaction of tannin molecule π-electrons with the metal;
- (d)
- combination of (a) and (c).
The stability of the corrosion inhibitor film on the metal surface depends on some physicochemical characteristics of the organic molecule, such as its functional groups, aromaticity, possible steric effects and electronic density of heteroatoms, which may act as electron donors. The type of corrosive medium, the structure and the charge of the metal surface and the nature of the interaction between the π-orbital of inhibitors with the d-orbital of metal are also very important to the stability of the inhibitor film [27].
The efficiency of corrosion inhibition by organic compounds can be related to the amount of adsorbed organic inhibitor on the metal surface. The adsorption of a corrosion inhibitor is possible due to the residual charge on the surface of the metal and the nature and chemical structure of the organic compound. On a metal surface, the inhibitor is bonded by physical or electrostatic forces and chemisorption [28,30]. When adsorption occurs due to electrostatic forces, since these forces are weak, the reverse process will also occur easily. Indeed, organic charged species do not make direct contact with the metal due to the presence of a layer of water molecules that separates them [30].
Interaction between polar organic species and metal surfaces can occur by another process, chemisorption. This process is slower than electrostatic sorption and is temperature-dependent. It shows higher inhibition efficiencies at higher temperatures. Chemisorption of the organic compounds can be performed through the existence of polar functional groups or groups that can dissociate [30].
Tannins have been used as corrosion inhibitors for iron and steel, as mentioned previously. They can form chelates with metallic cations due to the presence of vicinal hydroxyl groups on aromatic rings. Tannins also have been referred to as rust converters since their presence converts active rust into non-reactive protecting oxides. Protection properties result from the reactions of polyphenolic sub-unit of the tannin molecule with ferric ions, thereby forming highly cross-linked network metallic-tannates [27,28,29,30,31,32,33,34,35,36,37,38,39]. Other studies [42] have elucidated the inhibitory actions of chestnut tannin on metal corrosion by means of the frontier orbital theory. These authors using the results of the molecular modelling and corrosion rate measurements found that tannin constituents probably adsorb as neutral species by means of electrostatic forces that act between the molecular dipoles and the charged metal surface.
Martinez et al. [43,44,45] studied the corrosion of steel in the presence of mimosa tannin or gallic acid and, using molecular modelling, showed that adsorption of tannin molecules could proceed via sharing of the non-bonding electrons of the -OH group of the polyphenol aromatic subunit, with the partially filled d-orbitals of a metal, e.g., iron.
The literature describes how mimosa tannin reacts with Fe3+ produced at anodic sites to form ferric tannate species [46,47]. Ross et al. [48] suggested that the structure of the ferric tannate chelate obtained with mimosa tannin contains three tannate ions, each tannin ion coordinating two vicinal hydroxyl group to the metallic ion, thus forming a stable octahedral coordination compound.
Due to the large number of vicinal phenolic hydroxyls, each molecule could react with a few metallic ions to form a network structure [30,36,46], Figure 5.
Since there are a limited number of papers reporting the prevention of the corrosion of aluminium alloys by natural corrosion inhibitors, the purpose of this study was to clarify the interaction of some commercial tannins with the AA2024-T3 aluminium alloy. Tannic acid, chestnut bark and mimosa tannin were selected. The first two are hydrolysable tannins, the former a gallotannin and the second one an ellagitannin. Mimosa tannin is a condensed one. Gallic acid present in all of those tannins as a galloyl residue was also investigated. To achieve this goal, the surface of the treated alloy was tested by polarization assays and electrochemical impedance spectroscopy, and FTIR spectra of the metallic samples were recorded to investigate the presence of the organic inhibitor at the metal surface. The long-term stability of the baths used in the anodizing of AA2024-T3 was also investigated by UV-Vis spectroscopy.
2. Materials and Methods
2.1. Sample Preparation
The reagents used were gallic acid (p.a.) provided by Alfa Aesar, Thermo Fisher (Kandel) GmbH, Germany, tannic acid, (p.a.) provided by Riedel-de-Haen, Honeywell Research Chemicals (Laborspirit, Loures, Portugal) and the mimosa and chestnut tannins provided by CTIC (Centro Tecnológico das Indústrias do Couro, Alcanena, Portugal). The inhibitor solution (electrolyte solution) was prepared by dissolving the tannin (5 g/L) in H2SO4 (0.46 M).
Corrosion tests have been carried out on AA2024-T3 aluminium alloy samples. The aluminium alloy 2024-T3 has a nominal composition (wt/wt) of 0.05% Si, 0.11% Fe, 4.4% Cu, 0.55% Mn, 1.4% Mg, 0.01% Cr, 0.02% Zn, 0.02% Ti, 0.01% V, 0.04% other elements and the remainder in Al.
AA2024-T3 aluminium alloy was cut into specimens with dimensions of 50 × 15 × 0.6 mm. The samples were degreased by washing first in acetone and then in deionized water, mechanically sanded using successively finer grades of SiC papers (Nº 400, Nº 800, Nº 1200 and Nº 1500) and finally rinsed with deionized water.
Before anodising, the samples were dished in a commercial chromate-free alkaline cleaner (Turco 4215 NCLT-HENKEL) at 65 °C for 15 min. Finally, they were dipped in a chromate-free commercial acid etching bath (SOCOSURF 1858) at room temperature for 5 min. After each step they were rinsed in distilled water. Then, an anodizing area of 6 cm2 was delimited using Teflon tape. The anodization was performed using a Peak Tech DC Dual Power Supply 6010D, using a lead sheet with an area of 32 cm2 as cathode, by applying a potential difference of 14V for 25 min at a temperature of 35 °C. After the anodization procedure, the specimens were washed in distilled water at room temperature and then the specimens were subjected to the sealing process that consisted in immersion in a distilled water bath at 96 °C for 20 min. Next, they were dried and kept in a desiccator.
2.2. UV-Vis Spectra
UV-Vis spectra of anodizing baths were acquired on Shimadzu 1603 double beam spectrophotometer (Izasa Scientific, Lisboa, Portugal) using 1 cm quartz cells. Spectra of the solution containing the organic inhibitor (0.01 g·dm−3) in H2SO4 (0.46 M) was recorded over 12 months after its preparation.
To determine the stability of the anodizing bath over time, the initial UV-VIS spectra of each bath was recorded before any experiment. The samples were diluted with H2SO4 (0.46 M) until the inhibitor reached a concentration of 0.007 g·dm−3.
2.3. Electrochemical Measurements
The EIS measurements were carried out using a CH Instruments electrochemical analyser CHI604D and all the measurements were performed at room temperature in a Faraday cage. A three-electrode arrangement was used in a conventional electrochemical glass cell. A saturated calomel electrode (SCE, 0.241 V vs. NHE) was used as reference and a large area platinum coil employed as counter electrode, the probed area of the working electrode (6 cm2) being restricted using a teflon tape.
The electrolytic medium consisted of a 0.5M NaCl aqueous solution naturally aerated. MILLI-Q water (18.2 MΩ∙cm at 25 °C) was used to prepare the test solutions. Prior to any electrochemical experiment, the open-circuit potential of the specimen was continuously monitored for 50 min. It was found that this period of the time was enough to reach a stable potential plateau with an oscillation of less than 1mV in the last 5 min of OCP monitoring.
The EIS data were obtained over the frequency range 10−1–105 Hz with 12 points per decade, using a 3 mV (rms) sinusoidal potential perturbation [20]. The resulting spectra were fitted using CHI Electrochemical Software version 1.0.0.1.
The potentiodynamic polarization experiments were carried out at a scan rate of 0.2 mV/s, starting from −200 mV below the open circuit potential (OCP) and finished not prior to the pitting potential having been reached, the measurements being repeated in duplicate. The corrosion current (Icorr) was obtained from the intercept of extrapolated cathodic and anodic Tafel lines at the corrosion potential (Ecorr).
2.4. FTIR Spectroscopy
FTIR analyses were carried out using a Nicolet 6700 spectrometer (ThermoUnicam, Miraflores, Portugal) equipped with a Smart SAGA™ (Specular Apertured Grazing Angle) Accessory. Spectra were recorded in the 4000–400 cm−1 range with a resolution of 4 cm−1, averaging 128 scans per sample. The data were collected with Omnic 3.1 software.
2.5. Scanning Electron Microscopy (SEM)
The surface morphology of the samples anodized and anodized and sealed was evaluated by Scanning Electron Microscopy (SEM) using a Hitachi S2400 equipment. The samples were deposited with Au/Pd before the SEM analysis.
3. Results and Discussion
3.1. Morphology Analysis
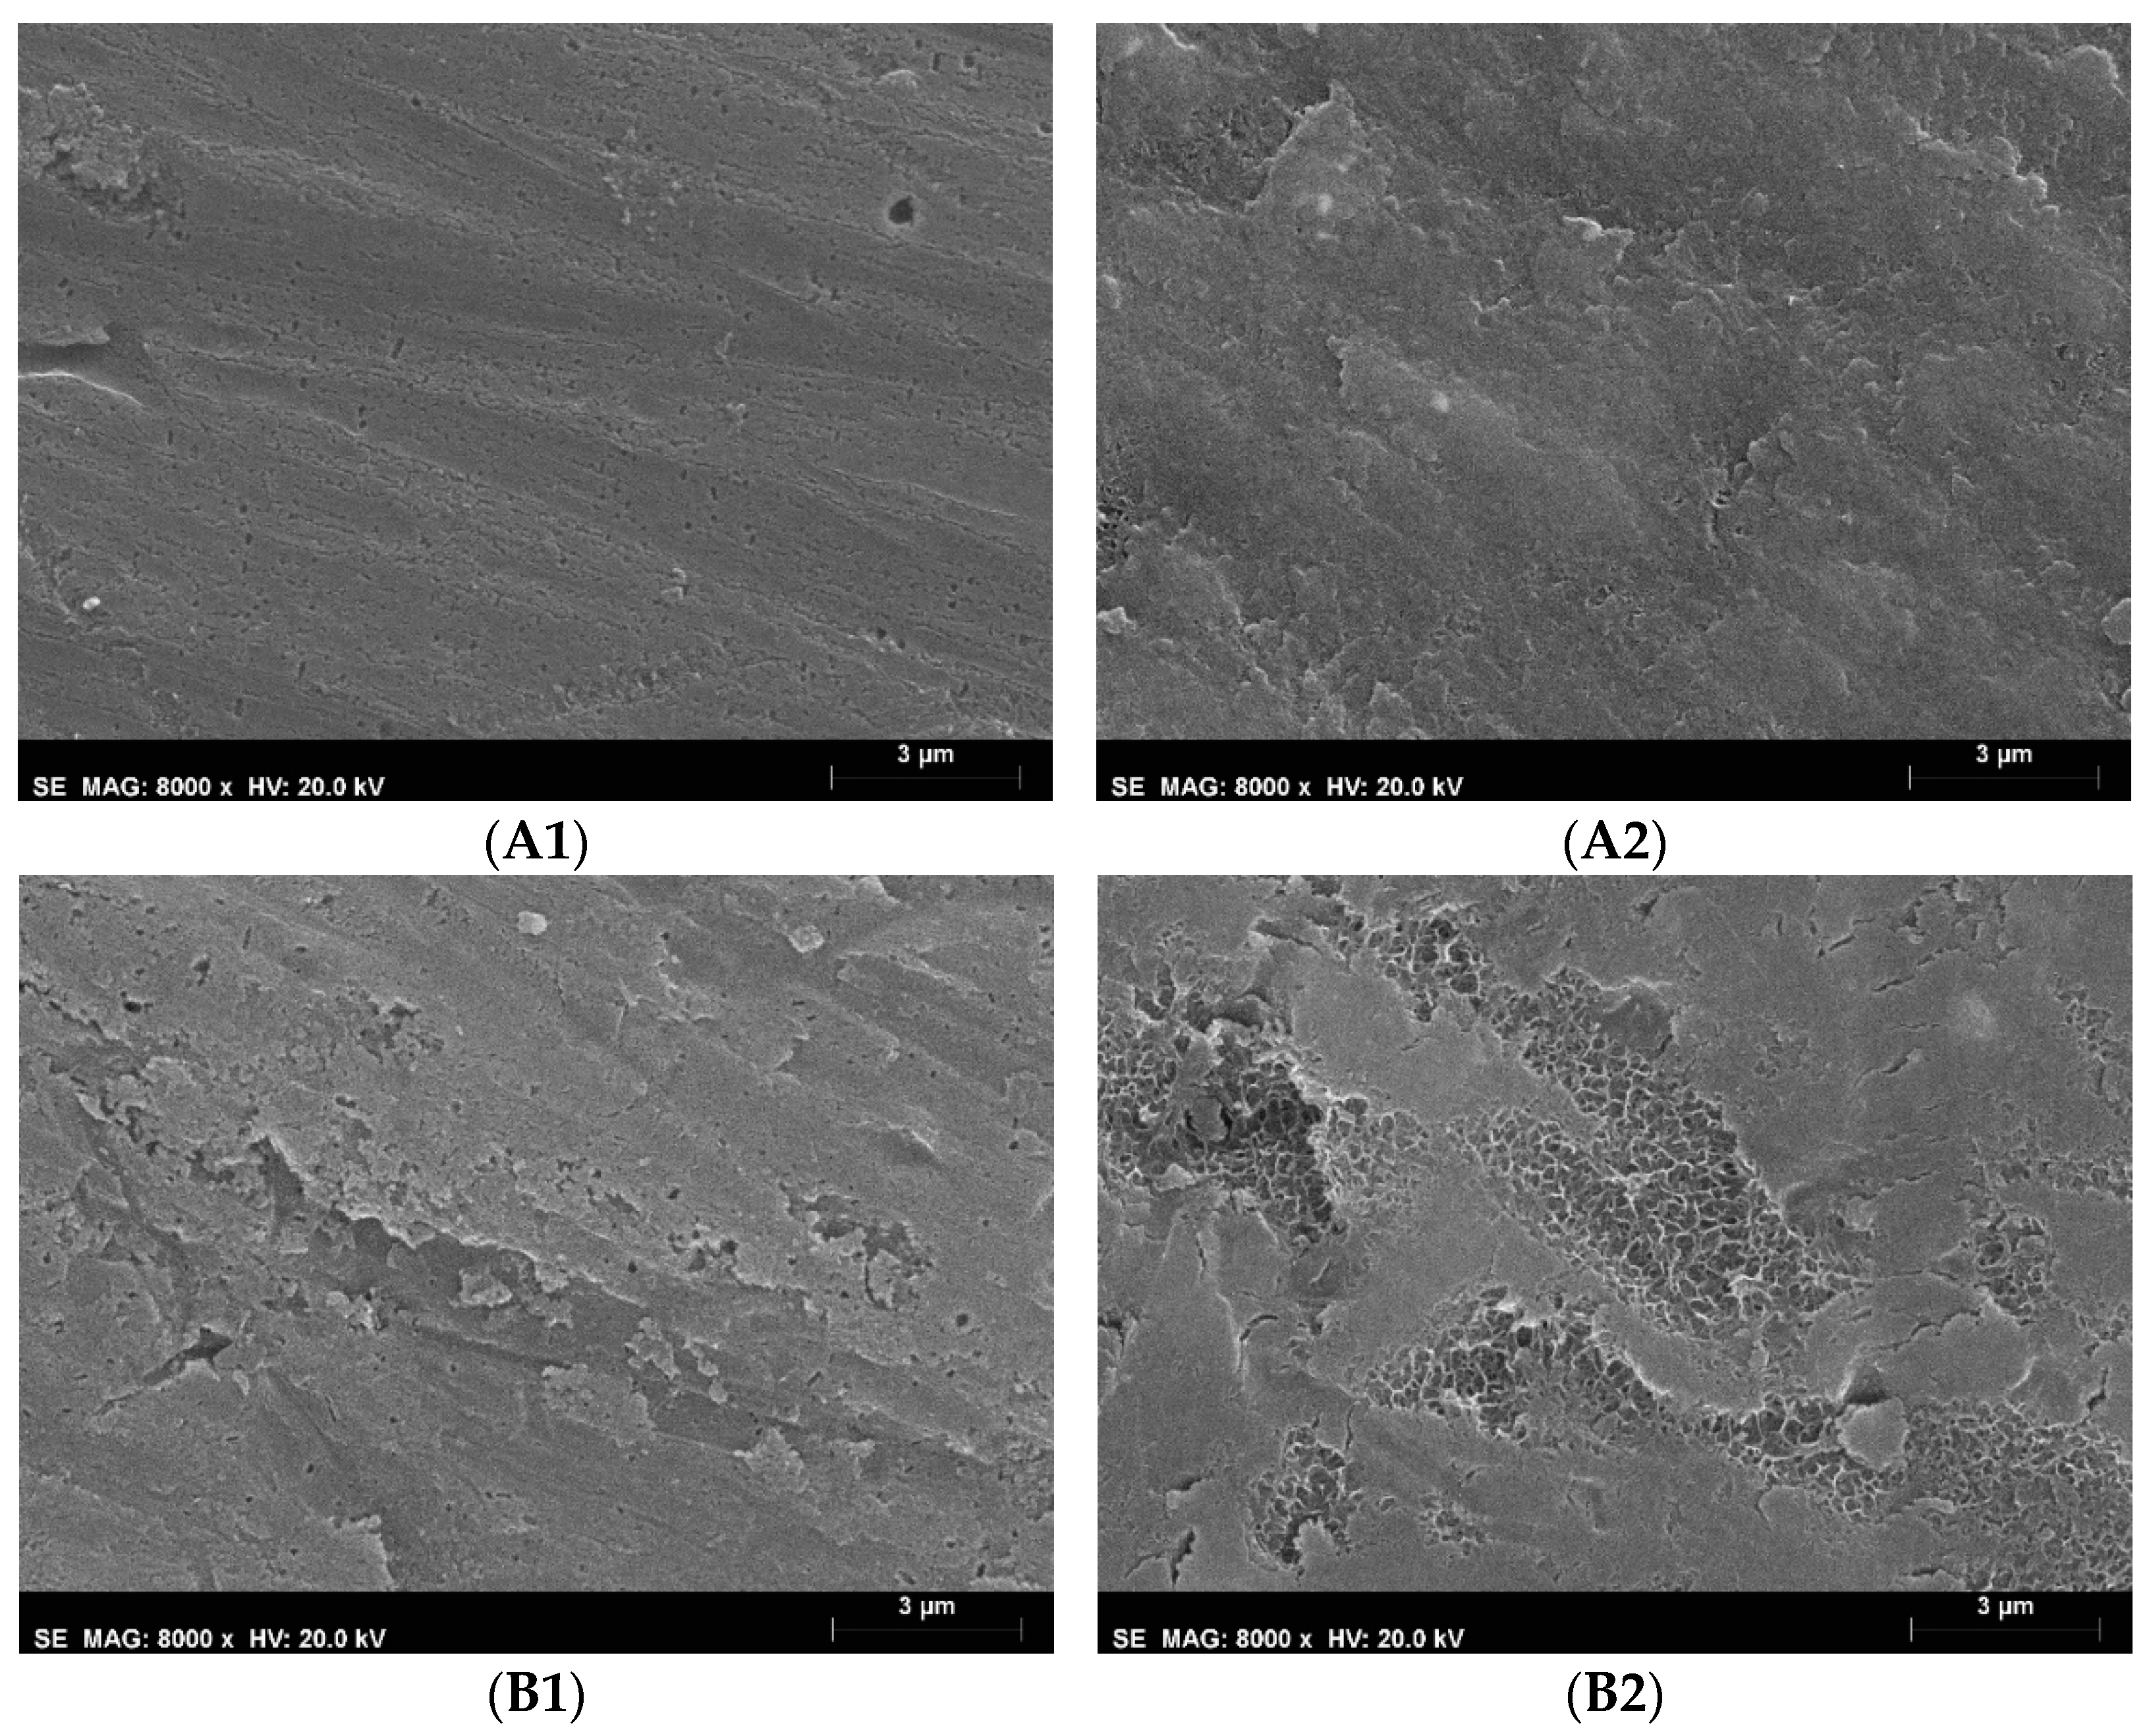
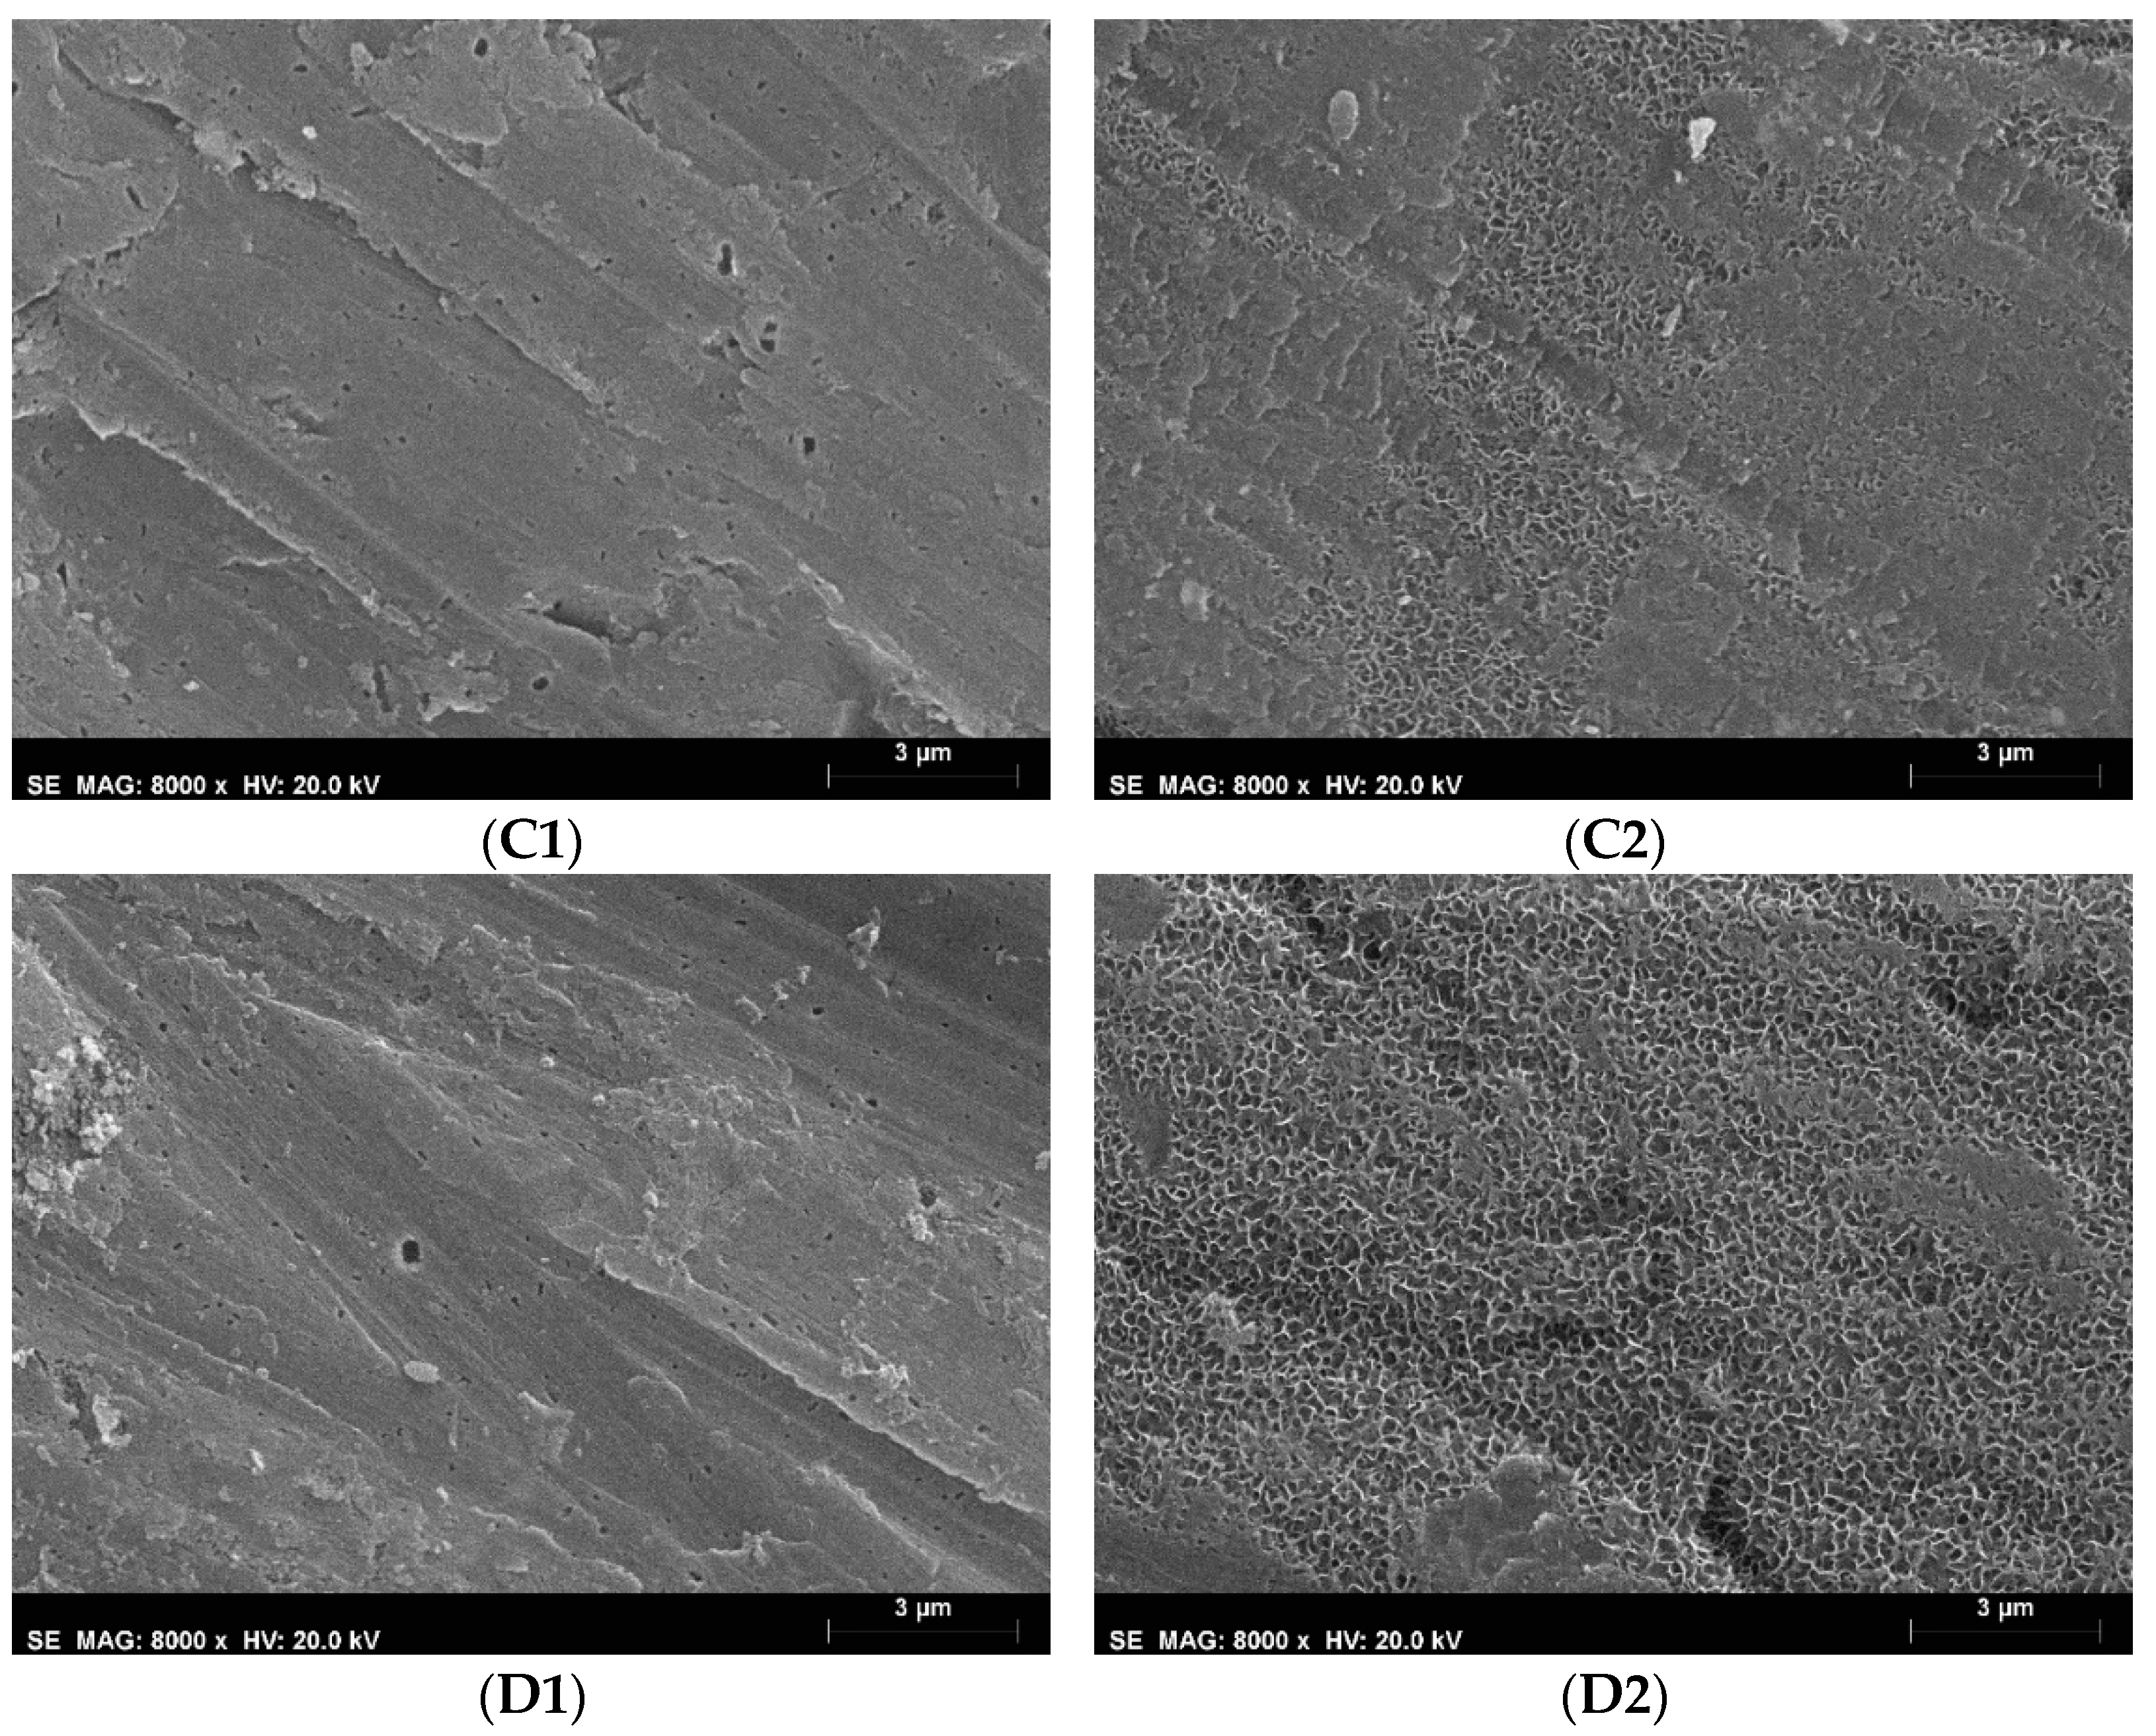
Changes in the surface of aluminium samples anodized in sulfuric acid baths containing the organic compounds under study, namely gallic acid (GSA), chestnut tannin (CSA), mimosa tannin (MSA) and tannic acid (TNSA), and sealed after anodization were investigated by SEM (Figure 6).
The above figures show that the anodized and sealed samples are more homogeneous when compared to the samples only anodized. After sealing, the samples show some areas with a crystalline appearance and the extension of these areas are greater in the sample treated in the TNSA bath. This type of morphology has already been reported by other authors in similar studies [24]. The sample anodized and sealed in the CSA bath is the one that exhibits a compact and homogeneous surface, which results in a better anticorrosive performance, as described below. According to literature [19,24,26,49], when samples are treated in a bath composed only with sulfuric acid (SA bath), they present pores not well defined and with an irregular distribution, which points to the better performance of the CSA bath when comparing it to the SA bath.
3.2. Coating Characterization
FTIR spectra of all samples were recorded and are depicted in Figure 7 and Table 1 and Table 2. The interpretation of these results led to the conclusion that, after the anodizing process, all samples present a similar spectrum in the region of 1400 to 400 cm−1 (Figure 7A), thus leading to the further conclusion that the appearance of bands in this region of the spectrum is due to the anodization process and consequently are not related to the presence of the organic corrosion inhibitors on the surface. A similar record was obtained from samples subjected to anodizing, followed by the sealing processes (Figure 7B). The spectra of anodized samples show different bands in the region 4000–1400 cm−1, which can be explained by the presence of different organic inhibitor molecules inside the pore. After the sealing process, FTIR of samples treated in baths containing the organic corrosion inhibitor present new bands in this range when compared to the FTIR spectra of the sample treated with a bath containing only sulfuric acid (SA). These new bands are probably related to the formation of complexes with the metallic ions Al3+ and Cu2+ formed during the anodization process. After the sealing process it is possible to observe the decrease of the band at 980 cm−1 and the appearance of a new band at approximately 500 cm−1 in all spectra.
From the data presented in the above spectra and tables it is possible to conclude that the anodizing process was effective in all samples, since the band of adsorbed H2O corresponding to the hydrated oxide layer appears at 4000–3000 cm−1 in all spectra [50,51].
In the FTIR spectra of the anodized sample in the SA bath, the two bands at 3419 cm−1 and 3037 cm−1 are attributed to -OH bands and the band at 1635 cm−1 may be attributed to H–O–H bands of hydration water of aluminium oxides. The band at 1151 cm−1 corresponds to the Al–O–H bending, which is evidence of the presence of boehmite. The band at 980 cm−1 is attributed to the stretching vibration of Al = O of alumina and confirms the presence of aluminium oxides and the band at 651 cm−1 is attributed to νasAl–O in the octahedral oxide AlO6. The difference observed in the spectra of anodized and anodized and sealed samples is related to the formation of boehmite in the sealing process, the appearance of a band at 501 cm−1 being assigned in the literature to the Al–O bonds of boehmite [42,51,52,53,54].

Table 1.
FTIR absorption maxima observed in spectra of porous aluminium oxide produced in a 0.46 M H2SO4 solution containing the green inhibitor.
Table 1.
FTIR absorption maxima observed in spectra of porous aluminium oxide produced in a 0.46 M H2SO4 solution containing the green inhibitor.
| SA | GSA | TNSA | CSA | MSA | Assignments | References |
|---|---|---|---|---|---|---|
| 3815 vs | 3990 vs | 3963 vs | νas O-H | [40] | ||
| 3414 vs 3037 vs | 3400 vs 3062 vs | 3531 vs | 3446 vs | 3427 vs | νO-H streching | [40,50,52] |
| 1635 vs | 1637 m | 1624 s | νO-H (H2O) and νsCOO− | [16,40] | ||
| 1552 s 1464 s | 1577 s 1475 s | 1543 s | νasCOO− | [16,40] | ||
| 1132 m | 1132 s | 1134 m | ν C-O-C cyclic ether | [40,42,51,52,53,54] | ||
| 980 s | 980 s | 980 s | 980 s | 980 s | νas AlO4 and δAlO4 | [40,42,51,52,53,54] |
| 629 vw | 633 vw | 638 w | 629 w | 623 w | νas AlO4 | [40,42,51,52,53,54] |
| 561 s | 560 w | 559 w | 561 w | 530 w | νas AlO6 | [40,42,51,52,53,54] |
vs: very strong; s: strong; m: medium; w: weak; vw: very weak.
Table 2.
FTIR absorption maxima observed in spectra of porous aluminium oxide produced in a 0.46 M H2SO4 solution containing the green inhibitor, after the sealing process.
Table 2.
FTIR absorption maxima observed in spectra of porous aluminium oxide produced in a 0.46 M H2SO4 solution containing the green inhibitor, after the sealing process.
| SA | GSA | TNSA | CSA | MSA | Assignments | References |
|---|---|---|---|---|---|---|
| 3984 vs | 3813 vs | 3826 vs | 3840 vs | νas O-H | [40] | |
| 3695 vs | νs O-H | [40,51] | ||||
| 3325 vs | 3495 vs 3174 vs | 3537 vs 3089 vs | 3485 vs | 3477 vs 3190 vs | νO-H streching | [40,51] |
| 1635 w | 1635 m | 1635 s | 1633 w | 1641 m | νO-H (H2O) and νsCOO− | [16,40] |
| 1151 m | 1144 m | 1140 m | 1138 m | ν C-O-C cyclic ether | [40,51,52,53,54,55] | |
| 1051 w | 1059 vw | 1078 vw | 1057 w | β = C-H deformation | [40,51,52,53,54,55] | |
| 947 w | 903 w | 908 w | 918 w | 916 w | νas AlO4 and δAlO4 | [40,51,52,53,54,55] |
| 654 vw | 650 vw | 665 w | νas AlO4 | [40,51,52,53,54,55] | ||
| 501 s | 513 vw | 511 w | 519 w | νas AlO6 | [40,51,52,53,54,55] | |
| 476 s | 476 s | 478 w | 476 s | δAlO4 | [40,51,52,53,54,55] |
vs: very strong; s: strong; m: medium; w: weak; vw: very weak.
In the anodizing baths, tannin molecules can coordinate two or more OH groups with aluminium and/or copper cations. The presence of aluminium and/or copper produces a difference in the νCOO− vibrations of this tannin functional group. For the anodized sample in GSA bath, a band at 1637 cm−1 is attributed to νsCOO−. After the sealing process, a new band appears at 1402 cm−1 and an increase of the band at 1637 cm−1 is observed. This is probable due to the formation of complexes between gallic acid and Al cations. After the sealing process, the spectra present a strong band at 3062 cm−1 corresponding to the νOH. The bands at 3485 cm−1 correspond to the νOH of adsorbed H2O [55].
In the spectra of the sample treated in TNSA it is possible to identify the νCOO− at 1552 and 1464 cm−1. The bands at 2540, 2854, 2924 and 2947 cm−1 correspond to the νC–H vibration and at the band 3500 cm−1 can be attributed to the νO–H. After the sealing process, it is possible to observe the displacement of the bands corresponding to νCOO−. These significant changes in spectra profile of TNSA treated sample at the range 1700–1400 cm−1 are due to the chelation products formed between the tannin and the cations during the electrochemical process [54,55]. In addition, FTIR spectra of samples treated with TNSA inhibitor present distinguished bands in 3089 cm−1 and 3537 cm−1, attributed to νOH of adsorbed H2O and, at 3695 cm−1, to νOH belonging to the Al–OH bond.
The spectrum of the anodized sample in MSA shows a band at 2675 cm−1 due to the νC–H vibrations and two strong bands at 3427 cm−1 and 3963 cm−1, corresponding to the νOH vibration in the Al–OH group. After the sealing process, the band at 1543 cm−1 disappears and the band at 1624 cm−1 decreases. Mimosa tannin is formed by catechin units linked together. Of the various compounds studied, it is the only one that has a 1,2-dihydroxybenzene catechol ring in its constitution, which is easily oxidized to an o-quinone so that it can be hypothesized that the appearance of a new band at 1867cm−1 in the FTIR spectrum may correspond to vibrations νC=O of a complex that will form between the aluminum and/or copper ions and the carbonyl groups of the o-quinone residue.
The spectra of anodized samples in the CSA bath present two strong bands at 1475 cm−1 and 1577 cm−1. These bands correspond to strong and asymmetric vibration of aromatic C=C and a complex carboxylic group, respectively. These bands disappear after the sealing process. In the spectra of anodized and anodized and sealed samples in the CSA bath, the bands corresponding to νOH are present at 3485 cm−1 and 3826 cm−1.
In the spectra of anodized samples prepared with the TNSA, MSA and CSA baths, it is possible to observe a weak band around 2800 cm−1 that, according to the literature [49], can be attributed to strong intramolecular hydrogen bonds in organic compounds.
3.3. Stability of the Bath Solution
The stability of the bath solution to be used in the anodizing process was monitored over 12 months using UV spectroscopy. To study the bath stability over time the UV spectra of the bath solutions were recorded between 200 and 400 nm. Figure 8 shows the overlapped spectra for all studied baths. Regarding the GSA bath, it can be seen that all spectra present two bands with λmax1 = 214 nm and λmax2 = 272 nm and two inflection points at 202 nm and 239 nm. The results obtained led us to affirm that the solution is stable during this period of time. The TNSA bath spectra profile is similar to the GSA bath spectra. These spectra also show two intense bands with λmax1 = 213 nm and λmax2 = 274 nm and two inflection points at 202 nm and 241 nm. The slight increase in the intensity of the bands can be due to a small evaporation of the solvent during a year which resulted in a higher concentration of the tannin. MSA bath spectra show that this tannin solution is also stable over time, with λmax = 280 m and an inflection point at 258 nm. The CSA bath spectra show a flattening in the region 240–260 nm after 2 months, indicating some instability over time probably due to decomposition/hydrolysis of some constituents.
Spectra presented in Figure 9 were obtained with freshly prepared solutions and after these solutions were used in more than twenty anodization experiments. From this figure it is possible to verify that only the MSA solution presents a strong alteration, which may be due to the consumption or, more likely, to the electrochemically oxidation of tannin molecules promoted during the anodizing process. TNSA solution spectra, before and after the twenty anodizing experiments, also present a slight difference, which can be due to the hydrolysis of tannic acid and the formation of free gallic acid in the bath, in accordance with the small wavelength shift observed in bands. Spectra of the other two solutions involved in the study only reveal a minor decrease of the signal amplitude resulting from the consumption of the organic compounds. For the GSA bath the two spectra have λmax at the same value, 214 and 272 nm, and for the CSA bath the wavelength values of maximum absorbance and shoulder have almost the same value, which is an indication that these baths are not degraded by the anodizing process.
3.4. Electrochemical Measurements
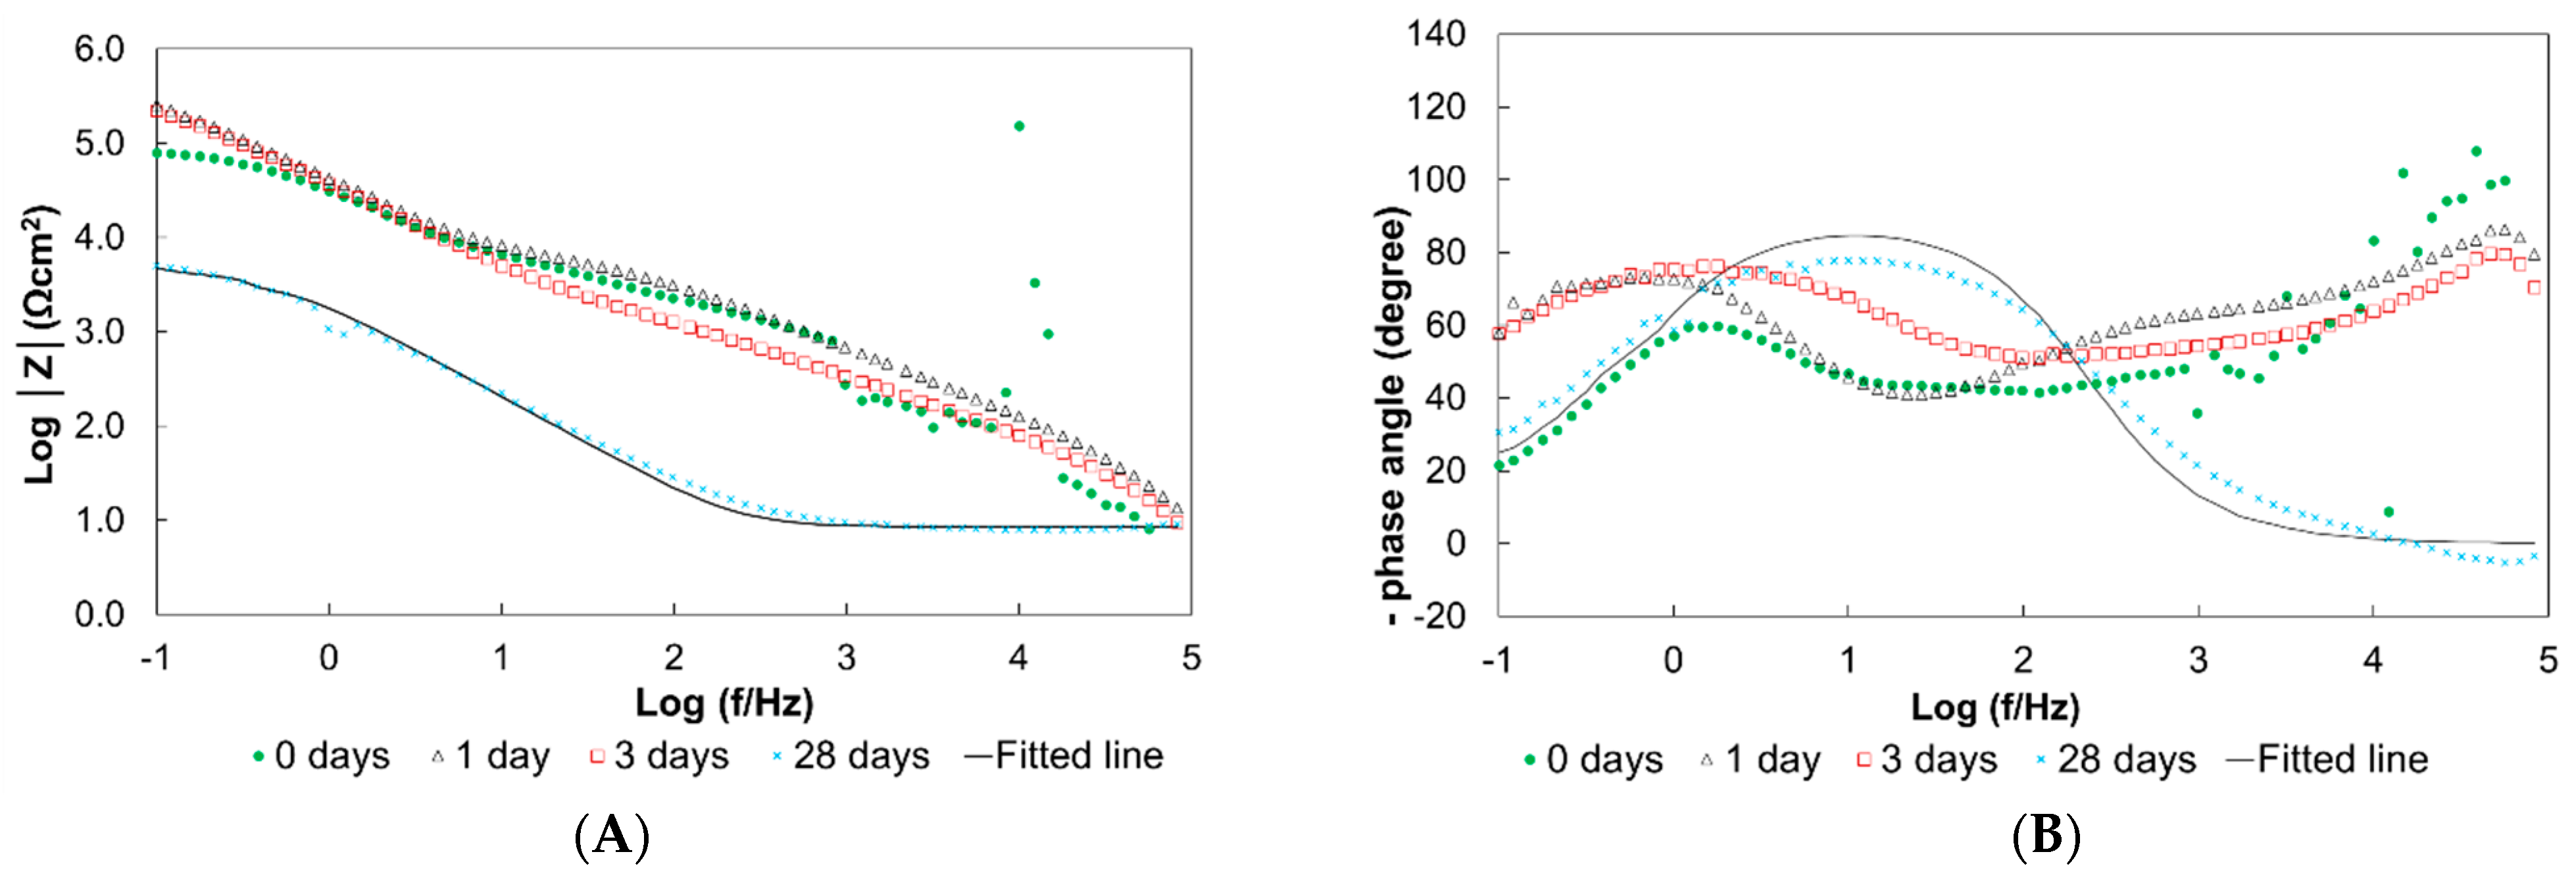
The behavior of the anodizing and sealed samples regarding corrosion was also studied by EIS. The spectra are presented in Figure 10, Figure 11, Figure 12, Figure 13 and Figure 14. The physical transformations that occur in the porous layer formed during the anodizing process on the surface of the samples are reflected in the variations of impedance that occur at high and medium frequencies [15,16,17,18,19]. Analyzing the results, it is possible to conclude that the anodized specimen in TNSA solution presents a smaller variation in impedance value (│Z│) with immersion time, when compared to the samples anodized in other corrosion inhibition media involved in this study. From the analysis of the spectra, it is also possible to conclude that the anodized specimen in the GSA solution presents the more susceptible barrier layer to corrosion when compared to the other samples, which can be confirmed by the decrease of the impedance value (│Z│). At the same time, slight shifts of phase-angle were observed during the immersion time. This behavior may be due to the increase in the corrosion phenomenon promoted by the contact with the corrosive agents. The analysis of these spectra also allows us to conclude that the samples anodized in the TNSA, CSA and MSA baths have better barrier properties than the GSA and SA baths.
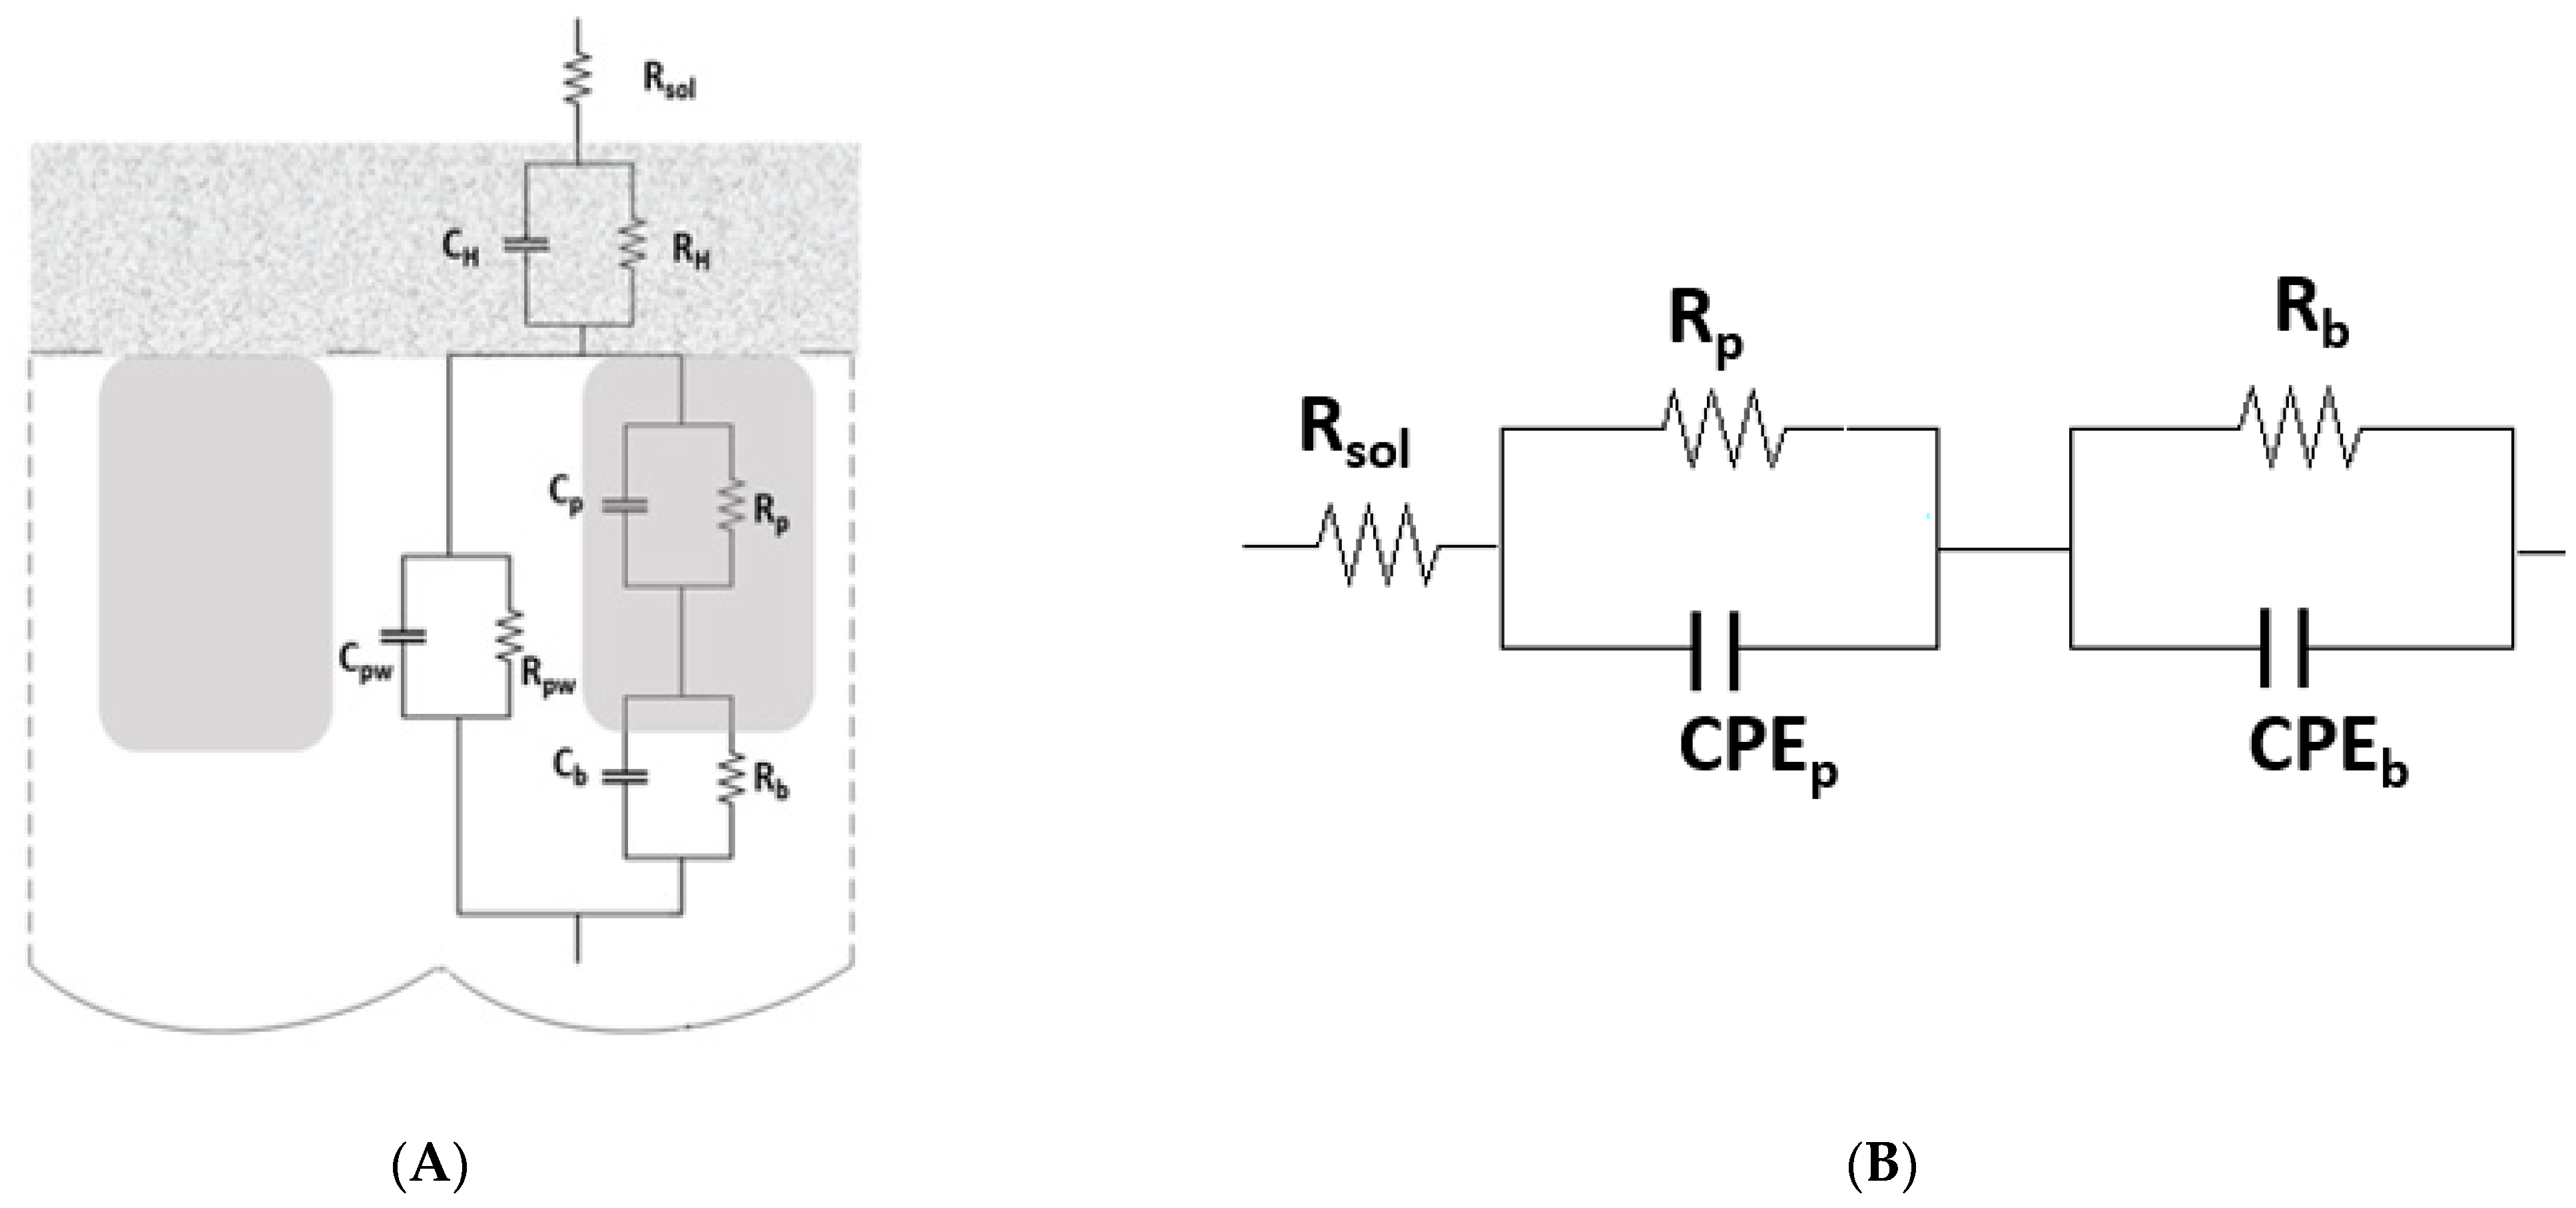
Different equivalent circuits have been proposed to fit the behavior of porous anodic films. Figure 15A illustrate the physical description of the electric circuit used to describe the physical meaning of various electrochemical fit parameters. This model was successfully applied to explain the properties of the barrier and porous layer by Suay et al. [53]. The Rsol represents the resistance of the electrolyte, RH and CH correspond, respectively, to the resistance and capacitance of the surface layer of hydrated oxide, Rp is the pore resistance and explains the limitation of electrolytic charge transfer through pores and coating defects, Cp represents the capacitance of the formed pores and Rb and Cb parameters represent, respectively, the resistance and the capacitance of the barrier layer. The barrier effect of the hydrated oxide layer formed is very important in the corrosion protection of aluminium alloys, since it is the last layer that separates the electrolyte from the alloy. The entrance of the electrolyte into this barrier layer can cause its degradation, thus causing the corrosion of the alloy. The resistance and capacitance of the pore wall are represented by Rpw and Cpw, respectively.
Figure 15B shows the physical model used by several authors [56,57,58,59,60] for fitting sealed anodic film. In this model, the Rpw and Cpw are both generally omitted since they are, respectively, extremely high and extremely low [57,58,59,60]. This model barely permits the conduction of ions through taking into consideration the infinitesimal current across the very large resistance [60,61,62,63]. However, from Bode plots, it can be said that the porous layer and barrier layer have heterogeneities, making their capacitive behavior better simulated by a constant phase element [56,57,58,59,60]. Therefore, the Cp and Cb represent the constant phase elements (CPE) corresponding to the non-ideal capacitance at the porous layer and the barrier layer. CPE is defined: CPE = 1/(j2πfC)n [57,58,59,60].
The parameters np and nb are influenced by CPEp and CPEb, respectively, due to the non-ideal capacitive behaviors. Parameter n is the frequency dispersion factor and varies from 1 to 0. When n = 1, CPE can be considered as real capacitances, whereas n = 0 represents a real resistance [58].
The results obtained from the fitting experiments are present in Figure 16. A representative example of fitting for the equivalent circuit indicated in the Figure 15B is included in Figure 10 and Figure 11.
From the analysis of the results obtained for the Rp parameter presented in Figure 16A it is possible to verify that, at the beginning of immersion, the samples treated with baths containing the organic inhibitors present a higher pore resistance value when compared with samples treated in the SA bath. The sample treated in the TNSA bath is the one that presents a lower value when compared with the samples treated in baths with the other organic inhibitors. After a day of immersion in NaCl 0.5M solution, it was found that virtually all samples treated in CSA and MSA baths have a very sharp decrease, which means that the films begin to degrade. Opposite behavior was showed for samples treated in the TNSA, GSA and SA baths where this parameter increased. This behavior may be due to the fact that the corrosion phenomenon is still very localized, since the corrosive solution can only reach the substrate through some paths that are formed as a consequence of the defects of the anodic film. Precipitation of corrosion products may then occur in these areas blocking the conductive pores [61]. Therefore, these paths are prevented and the resistance of the coating increases. It can also be speculated that, inside the pores, the green corrosion inhibitor can re-dissolve, producing a buffer solution which prevents local change in pH, thus limiting the localized corrosion. Such a phenomenon would be similar to what was reported for tartaric acid in a sulfuric acid bath: the residual tartaric acid can combine with aluminium cations during the conversion process to produce aluminium tartrate due to re-dissolution during the immersion in corrosive media, limiting the susceptibility to localized corrosion [15]. After 28 days, it was found that the samples present a close value for Rp parameter.
Regarding the results obtained for the CPEp parameter, Figure 16B, initially this value was very low for all samples; however, a slight increase was observed over the immersion time for the samples treated in the GSA and SA baths. The samples treated in the MSA, TNSA and CSA baths have a practically constant value over immersion time, which means that these samples are less permeable to an electrolyte rich in chloride.
From the results obtained for the parameters that allow evaluation of the properties of the barrier layer, the parameters Rb and CPEb, we can conclude that the presence of the organic inhibitors in the baths promote better barrier properties.
In relation to the parameter Rb, it was possible to verify that, after 28 days, the sample treated in the GSA bath showed a Rb value close to the one of the sample treated with the SA bath, but lower when compared to the samples treated in baths containing the other organic inhibitors, which means that this sample exhibited a worse barrier resistance when compared to the others samples.
Concerning the CPEb parameter, it was observed that, initially, this parameter presented very low values for all samples. After 28 days, the sample treated in the SA bath showed a higher CPEb in relation to the other samples treated in the other baths. From the results obtained it is possible to conclude that the GSA bath exhibited the worst performance, which probably is related to the fact that gallic acid molecules contain an inferior number of oxygen atoms than others organic inhibitors able to establish the interaction with the metal surface. This explanation also was mentioned in literature studies which evaluated the performance of corrosion inhibition on mild steel in HCl acid solution by tannic acid and gallic acid [62].
The values of np and nb are presented in Table 3. The np behavior indicates that the porous layer is more resistant in the initial stage. In the beginning, the np value is close to 1, indicating that the barrier layer is relatively homogeneous and few defects are present. During the immersion time the number of defects increase and consequently the np and nb decrease [58].
From the EIS results obtained it is possible to conclude that the presence of tannins in baths’ conversion increases corrosion resistance and can therefore be a viable and sustainable alternative
The potentiodynamic polarisation plots for specimens in 0.5 M NaCl are shown in Figure 17 and the corrosion potential (Ecorr) and corrosion current (Icorr) obtained for the bare and treated AA2024-T3 samples are summarized in Table 4. The results allow for the conclusion that the protection is effective for all samples treated, leading to a corrosion current (Icorr) decrease. Anodization followed by sealing in the SA, MSA and CSA baths produce anodic films that present Icorr values of the same order of magnitude. When anodization followed by sealing is performed in the TNSA and GSA baths, the same Icorr value of ≈5.0 × 10⁻⁸ A/cm2 is observed. It is also verified that aluminium samples AA2024-T3 treated in the CSA bath have a more negative corrosion potential (Ecorr ≈ −0.706 V vs. SCE) than the samples treated with the other organic inhibitor solutions.
As is well known, chloride can cause severe pitting in aluminium alloys. The difference between Ecorr and Epit, (ΔE) suggests a susceptibility to localized pitting corrosion. Furthermore, the more positive Epit is relative to Ecorr, the more resilient the sample is to pitting [63]. From the results obtained, it is possible to conclude that the CSA present a higher difference between Ecorr (−0.706 V vs. SCE) and Epit (≈ −0.691 V vs. SCE). For the others samples a significant perturbation was observed in the anodic branch of the log i vs. E plot, and the values of Ecorr and Epit presented the same value.
The TNSA sample showed a pitting potential (Epit), (Epit ≈ −0.552 V vs. SCE), higher when compared with the other samples involved in the study. The CSA sample present a lower Epit.
The results obtained permit us to conclude that the sample treated in the CSA bath show the lowest susceptibility to corrosion.
4. Conclusions
The tannin compounds involved in this study present the general requirements to be employed as inhibitors of aluminium corrosion since they have the capacity to promote a passive/protective layer on its surface. Tannin molecules have several hydroxyl and carbonyl groups that contain oxygen atom with the ability to donate their lone pair of electrons in an interaction with the metal. Tannin molecules also have several aromatic π-bonds that provide the electrons needed to interact with the metal surface. Since they are large molecules, they also have the abilit to cover a large area of the metal surface with a firmly attached compact film, which is nontoxic to humans and the environment.
The use of FTIR spectroscopy showed two new bands at 1543–1577 cm−1 and 1132–1134 cm−1 corresponding to the stretching of carboxilate and cyclic ether bonds, respectively, indicating that tannins were absorbed on the surface of the metal, thereby protecting it from further corrosion attack. The difference in FTIR spectra of aluminium samples treated in baths that contain these tannins when compared to samples treated in only sulfuric acid bath confirms the complexing of tannins with metal ions and allow the conclusion to be reached that the interaction between the metal and the inhibitors occurs by hydroxyl and carboxyl groups present in the organic molecule.
From the above electrochemical results, it is possible to conclude that the CSA bath is a better corrosion inhibitor regarding the aluminium alloy AA2024-T3 compared to the other tannin baths and SA bath. This fact can be confirmed because the sample treated in the CSA bath showed a lower Icorr value (1.3 ± 0.6 × 10⁻⁹ A/cm2). The EIS results suggest that tannin baths, when compared to the SA bath, present the capacity to promote a more compact oxide barrier layer, which is a very important event in corrosion protection of aluminium alloys, since it is this last layer that separates the electrolyte from the metal alloy.
Since tannic acid, chestnut and mimosa tannin are obtained from renewable vegetable sources, these tannins can be considered as green inhibitors of the corrosion of aluminium alloy.
Author Contributions
Conceptualization, J.C. and M.E.M.A.; methodology, J.C. and M.E.M.A.; experimental execution, C.S.P.; writing—original draft preparation, C.S.P.; writing—review and editing, B.S., J.C. and M.E.M.A.; supervision, J.C. and M.E.M.A. All authors have read and agreed to the published version of the manuscript.
Funding
Financed by Fundação para a Ciência e a Tecnologia, I.P./MCTES through national funds (PIDDAC). The authors acknowledge Fundação para a Ciência e a Tecnologia, I.P for funding the project UIDB/00100/2020.
Data Availability Statement
Not applicable.
Conflicts of Interest
The authors declare no conflict of interest. The funders had no role in the design of the study; in the collection, analyses or interpretation of data; in the writing of the manuscript or in the decision to publish the results.
References
- Qi, J.; Hashimoto, T.; Walton, J.; Zhou, X.; Skeldon, P.; Thompson, G.E. Formation of a Trivalent Chromium Conversion Coating on AA2024-T351 Alloy. J. Electrochem. Soc. 2016, 163, C25–C35. [Google Scholar] [CrossRef]
- Qi, J.; Hashimoto, T.; Thompson, G.E.; Carr, J. Influence of Water Immersion Post-Treatment Parameters on Trivalent Chromium Conversion Coatings Formed on AA2024-T351 Alloy. J. Electrochem. Soc. 2016, 163, C131–C138. [Google Scholar] [CrossRef]
- Chidambaram, D.; Clayton, C.R.; Kending, M.W.; Halada, G.P. Surface pretreatments of aluminuim alloy AA2024-T3 and Formation of Chromate Conversion Coatings. J. Electrochem. Soc. 2004, 151, B613–B620. [Google Scholar] [CrossRef]
- Qi, J.; Němcová, A.; Walton, J.; Zhou, X.; Skeldon, P.; Thompson, G. Influence of pre- and post-treatments on formation of a trivalent chromium conversion coating on AA2024 alloy. Thin Solid Film. 2016, 616, 270–278. [Google Scholar] [CrossRef] [Green Version]
- Li, L.; Swain, G.P.; Howell, A.; Woodburry, D.; Swain, G.M. The Formation, Structure, Electrochemical Properties and Stability of Trivalent Chrome Process (TCP) Coatings on AA2024. J. Electrochem. Soc. 2011, 158, C274–C283. [Google Scholar] [CrossRef]
- Li, L.; Whitman, B.W.; Swain, G.M. Characterization and Performance of a Zr/Ti Pretreatment Conversion Coating on AA2024-T3. J. Electrochem. Soc. 2015, 162, C279–C284. [Google Scholar] [CrossRef] [Green Version]
- Guo, Y.; Frankel, G. Characterization of trivalent chromium process coating on AA2024-T3. Surf. Coat. Technol. 2012, 206, 3895–3902. [Google Scholar] [CrossRef]
- Hughes, A.E.; Boaga, A.; Glennb, A.M.; Cullocha, D.M.; Musterc, T.H.; Ryand, C.; Luoe, C.; Zhoue, X.; Thompsone, G.E. Corrosion of AA2024-T3 Part II: Co-Operative Corrosion. Corros. Sci. 2011, 53, 27–39. [Google Scholar] [CrossRef]
- Tiringer, U.; Kovač, J.; Milošev, I. Effects of mechanical and chemical pre-treatments on the morphology and composition of surfaces of aluminium alloys 7075-T6 and 2024-T3. Corros. Sci. 2017, 119, 46–59. [Google Scholar] [CrossRef]
- Verdalet, G.; Pierre Bonino, J.; Duluard, S.; Fori, B. Influence of Alloy Microstructure and Surface State on the Protective Properties of Trivalent Chromium Coating Grow on a 2024 Aluminium Alloy. Surf. Coat. Technol. 2018, 344, 276–287. [Google Scholar] [CrossRef] [Green Version]
- Boag, A.; Taylor, R.; Muster, T.; Goodman, N.; McCulloch, D.; Ryan, C.; Rout, B.; Jamieson, D.; Hughes, A. Stable pit formation on AA2024-T3 in a NaCl environment. Corros. Sci. 2010, 52, 90–103. [Google Scholar] [CrossRef]
- Mrad, M.; Ben Amor, Y.; Dhouibi, L.; Montemor, F. Electrochemical study of polyaniline coating electropolymerized onto AA2024-T3 aluminium alloy: Physical properties and anticorrosion performance. Synth. Met. 2017, 234, 145–153. [Google Scholar] [CrossRef]
- Mrad, M.; Dhouibi, L.; Montemor, M.F. Elaboration of γ-Glycidoxypropyltrimethosysilane Coating on AA2024-T3 Aluminum Alloy: Influence of Synthesis Route on Physicochemical and Anticorrosion Properties. Prog. Org. Coat. 2018, 121, 1–12. [Google Scholar] [CrossRef]
- Zubillaga, O.; Cano, F.; Azkarate, I.; Molchan, I.; Thompson, G.; Skeldon, P. Anodic films containing polyaniline and nanoparticles for corrosion protection of AA2024T3 aluminium alloy. Surf. Coat. Technol. 2009, 203, 1494–1501. [Google Scholar] [CrossRef]
- Arenas, M.; Conde, A.; de Damborenea, J. Effect of acid traces on hydrothermal sealing of anodising layers on 2024 aluminium alloy. Electrochim. Acta 2010, 55, 8704–8708. [Google Scholar] [CrossRef]
- Abdel-Salam, O.E.; Shoeib, M.A.; Elkilany, H.A. Characterization of the Hard Anodizing Layers Formed on 2014-T3 Al Alloy, In Sulfuric Acid Electrolyte Containing Sodium Lignin Sulphonate. Egypt. J. Pet. 2018, 27, 497–504. [Google Scholar] [CrossRef]
- Boisier, G.; Lamure, A.; Pébère, N.; Portail, N.; Villatte, M. Corrosion protection of AA2024 sealed anodic layers using the hydrophobic properties of carboxylic acids. Surf. Coat. Technol. 2009, 203, 3420–3426. [Google Scholar] [CrossRef] [Green Version]
- Curioni, M.; De Miera, M.S.; Skeldon, P.; Thompson, G.E.; Ferguson, J. Macroscopic and Local Filming Behavior of AA2024 T3 Aluminum Alloy during Anodizing in Sulfuric Acid Electrolyte. J. Electrochem. Soc. 2008, 155, C387. [Google Scholar] [CrossRef]
- Boisier, G.; Pébère, N.; Druez, C.; Villatte, M.; Suel, S. FESEM and EIS Study of Sealed AA2024 T3 Anodized in Sulfuric Acid Electrolytes: Influence of Tartaric Acid. J. Electrochem. Soc. 2008, 155, C521–C529. [Google Scholar] [CrossRef] [Green Version]
- García-Rubio, M.; Lara, M.P.; Ocón, P.; Diekhonoff, S.; Beneke, M.; Lavía, A.; García, I. Effect of posttreatment on the corrosion behavior of tartaric-sulfuric. Electrochim. Acta 2009, 54, 4789–4800. [Google Scholar] [CrossRef]
- Balaskas, A.C.; Hashimoto, T.; Curioni, M.; Thompson, G.E. Two-Shell Structured PMAA@CeO2 Nanocontainers Loaded with 2-Mercaptobenzothiazole for Corrosion Protection of Damaged Epoxy Coated AA 2024-T3. Nanoscale 2017, 9, 5499–5508. [Google Scholar] [CrossRef] [PubMed]
- Almeida, M.E.; Ferreira, M.G.S. (Eds.) Corrosão Atmosférica. In Mapas de Portugal; INETI: Lisboa, Portugal, 1997; ISBN 972-676-161-1. [Google Scholar]
- Kendig, M.W.; Bucheit, R.G. Corrosion Inhibition of Aluminum and Aluminum Alloys by Soluble Chromates, Chromate Coatings, and Chromate-Free Coatings. Corrosion 2003, 59, 379–400. [Google Scholar] [CrossRef]
- Abrahami, S.; De Kok, J.M.M.; Terryn, H.; Mol, J.M.C. Towards Cr(VI)-free anodization of aluminum alloys for aerospace adhesive bonding applications: A review. Front. Chem. Sci. Eng. 2017, 11, 465–482. [Google Scholar] [CrossRef]
- Capelossi, V.; Poelman, M.; Recloux, I.; Hernandez, R.; de Melo, H.G.; Olivier, M. Corrosion protection of clad 2024 aluminum alloy anodized in tartaric-sulfuric acid bath and protected with hybrid sol-gel coating. Electrochim. Acta 2014, 124, 69–74. [Google Scholar] [CrossRef]
- Lamaka, S.V.; Zheludkevich, M.L.; Yasakau, K.A.; Montemor, M.F.; Ferreira, M.G.S. High Effective Organic Corrosion Inhib-itors for 2024 Aluminium Alloy. Electrochim. Acta 2007, 52, 7231–7247. [Google Scholar] [CrossRef]
- Ostovari, A.; Hoseinieh, M.; Peikari, M.; Shadizadeh, S.; Hashemi, S. Corrosion inhibition of mild steel in 1M HCl solution by henna extract: A comparative study of the inhibition by henna and its constituents (Lawsone, Gallic acid, α-d-Glucose and Tannic acid). Corros. Sci. 2009, 51, 1935–1949. [Google Scholar] [CrossRef]
- Shah, A.M.; Rahim, A.A.; Hamid, S.A.; Yahya, S. Green Inhibitors for Copper Corrosion by Mangrove Tannin, International. J. Electrochem. Sci. 2013, 8, 2140–2153. [Google Scholar]
- Faustin, M.; Maciuk, A.; Salvin, P.; Roos, C.; Lebrini, M. Corrosion Inhibition of C38 Steel by Alkaloids Extract of Geissospermum leave in 1M hydrochloric acid: Electrochemical and phytochemical studies. Corros. Sci. 2015, 92, 287–300. [Google Scholar] [CrossRef]
- Rahim, A.A.; Kassim, J. Recent Development of Vegetal Tannins in Corrosion Protection of Iron and Steel. Recent Pat. Mater. Sci. 2008, 1, 223–231. [Google Scholar] [CrossRef]
- Uromen, S.A.; Eduok, U.M. Application of Carbohydrate Polymers as Corrosion Inhibitors for Metal Substrates in Different Media: A review. Carbohydr. Polym. 2016, 140, 314–341. [Google Scholar]
- Raja, P.B.; Sethuraman, M.G. Natural products as corrosion inhibitor for metals in corrosive media—A review. Mater. Lett. 2008, 62, 113–116. [Google Scholar] [CrossRef]
- Aourabi, S.; Driouch, M.; Sfaira, M.; Mahjoubi, F.; Hammouti, B.; Verma, C.; Ebenso, E.E.; Guo, L. Phenolic fraction of Ammi visnaga extract as environmentally friendly antioxidant and corrosion inhibitor for mild steel in acidic medium. J. Mol. Liq. 2021, 23, 114950. [Google Scholar] [CrossRef]
- Iroha, K.B.; Maduelosi, N.J. Corrosion Inhibitive Action and Adsorption Behavior of Justicia Secunda Leaves Extract as an Eco-Friendly Inhibitor for Aluminium in Acidic Media. Biointerface Res. Appl. Chem. 2021, 11, 13019–13030. [Google Scholar]
- Tan, B.; Xiang, S.; Zhang, S.; Qiang, Y.; Xu, L.; Chen, S.; He, J. Papaya leaves extract as a novel eco-friendly corrosion inhibitor for Cu in H2SO4 medium. J. Colloid Interface Sci. 2021, 582, 918–931. [Google Scholar] [CrossRef]
- Qian, B.; Hou, B.; Zheng, M. The inhibition effect of tannic acid on mild steel corrosion in seawater wet/dry cyclic conditions. Corros. Sci. 2013, 72, 13019–13030. [Google Scholar] [CrossRef]
- Kusmierek, E.; Chrzescijanska, E. Tannic acid as corrosion inhibitor for metals and alloys. Mater. Corros. 2013, 66, 169–174. [Google Scholar] [CrossRef]
- Rahim, A.A.; Rocca, E.; Steinmetz, J.; Kassim, M.J.; Adnan, R.; Ibrahim, M.S. Mangrove tannins and their flavanoid monomers as alternative steel corrosion inhibitors in acidic medium. Corros. Sci. 2007, 49, 402–417. [Google Scholar] [CrossRef]
- Xu, W.; Han, E.-H.; Wang, Z. Effect of tannic acid on corrosion behavior of carbon steel in NaCl solution. J. Mater. Sci. Technol. 2018, 35, 64–75. [Google Scholar] [CrossRef]
- Falcão, L.; Araújo, M.E.M. Application of ATR–FTIR spectroscopy to the analysis of tannins in historic leathers: The case study of the upholstery from the 19th century Portuguese Royal Train. Vib. Spectrosc. 2014, 74, 98–103. [Google Scholar] [CrossRef]
- Falcão, L.; Araújo, M.E.M. Vegetable Tannins Used in the Manufacture of Historic Leathers. Molecules 2018, 23, 1081. [Google Scholar] [CrossRef] [PubMed] [Green Version]
- Liu, C.; Shih, K.; Gao, Y.; Li, F.; Wei, L. Dechlorinating transformation of propachlor through nucleophilic substitution by dithionite on the surface of alumina. J. Soils Sediments 2012, 12, 724–733. [Google Scholar] [CrossRef] [Green Version]
- Martinez, S.; Stern, I. Inhibitory Mechanism of Low-Carbon Steel Corrosion by Mimosa Tannin in Sulfuric Acid Solutions. J. Appl. Electrochem. 2001, 31, 973–978. [Google Scholar] [CrossRef]
- Martinez, S. Inhibitory mechanism of mimosa tannin using molecular modeling and substitutional adsorption isotherms. Mater. Chem. Phys. 2002, 77, 97–102. [Google Scholar] [CrossRef]
- Martinez, S.; Štagljar, I. Correlation between the molecular structure and the corrosion inhibition efficiency of chestnut tannin in acidic solutions. J. Mol. Struct. THEOCHEM 2003, 640, 167–174. [Google Scholar] [CrossRef]
- Cho, J.; Roy, S.; Sathyapalan, A.; Free, L.; Fang, Z. Tannic Acid Selectively Extracting Titanium from Ilmenite: Experimental and Theoretical Investigation. J. Powder Metall. Min. 2017, 6, 183. [Google Scholar] [CrossRef]
- Fazary, A.E.; Ju, Y. Iron Complexation Studies of Gallic Acid. J. Chem. Eng. Data 2009, 54, 35–42. [Google Scholar] [CrossRef]
- Ross, T.; Francis, R. The treatment of rusted steel with mimosa tannin. Corros. Sci. 1978, 18, 351–361. [Google Scholar] [CrossRef]
- Hansen, P.; Spangent-Larsen, J. NMR and IR Investigations of Strong Intramolecular Hydrogen Bonds. Molecules 2017, 22, 552. [Google Scholar] [CrossRef] [Green Version]
- Li, Y.; Zhang, Y.; Li, S.; Zhao, P. Influence of Adipic Acid on Anodic Film Formation and Corrosion Resistance of 2024 Alu-minum Alloy. Trans. Nonferrous Met. Soc. China 2016, 26, 492–500. [Google Scholar] [CrossRef]
- Kreta, A.; Rodosek, M.; Perse, L.S.; Orel, B.; Gabercek, M.; Vuk, A.S. In situ Electrochemical AFM, ex situ Ir Reflec-tion-Absorption and Confocal Raman Studies of Corrosion Processes of AA2024-T3. Corros. Sci. 2016, 104, 290–309. [Google Scholar] [CrossRef]
- Jerman, I.; Vuk, A.; Koželj, M.; Orel, B.; Kovač, J. A Structural and Corrosion Study of Triethoxysilyl Functionalized POSS Coatings on AA 2024 Alloy. Langmuir 2008, 24, 5029–5037. [Google Scholar] [CrossRef]
- Ram, S. Infrared spectral study of molecular vibrations in amorphous, nanocrystalline and AlO(OH)·αH2O bulk crystals. Infrared Phys. Technol. 2001, 42, 547–560. [Google Scholar] [CrossRef]
- Boumaza, A.; Favaro, L.; Lédion, J.; Sattonnay, G.; Brubach, J.; Berthet, P.; Huntz, A.; Roy, P.; Tétot, R. Transition alumina phases induced by heat treatment of boehmite: An X-ray diffraction and infrared spectroscopy study. J. Solid State Chem. 2009, 182, 1171–1176. [Google Scholar] [CrossRef]
- Chernyakova, K.V.; Vrublevky, I.A.; Ivanovskaya, M.I.; Kotsikau, D.A. Impurity-Defect Structure of Anodic Aluminium Oxide Produced by Two-Sided Anodizing in Tartaric Acid. J. Appl. Spectrosc. 2012, 79, 76–82. [Google Scholar] [CrossRef]
- Suay, J.; Giménez, E.; Rodríguez, T.; Habbib, K.; Saura, J. Characterization of anodized and sealed aluminium by EIS. Corros. Sci. 2003, 45, 611–624. [Google Scholar] [CrossRef]
- Franco, M.; Anoop, S.; Rani, R.U.; Sharma, A.K. Porous Layer Characterization of Anodized and Black-Anodized Al-uminium by Electrochemical Studies. Int. Sch. Res. Netw. Corros. 2012, 2012, 1–12. [Google Scholar]
- Zhao, X.; Zuo, Y.; Zhao, J.; Xiong, J.; Tang, Y. A study on the self-sealing process of anodic films on aluminium by EIS. Surf. Coat. Technol. 2006, 200, 6846–6853. [Google Scholar] [CrossRef]
- García-Rubio, M.; Ocón, P.; Curini, M.; Thompson, G.E.; Skeldon, P.; Lavía, A.; Garcia, I. Degradation of the corrosion resistance of anodic oxide films through immersion in the anodizing electrolyte. Corros. Sci. 2010, 52, 2219–2227. [Google Scholar] [CrossRef]
- Hao, Y.; Sani, L.A.; Ge, T.; Fang, Q. The synergistic inhibition behavior of tannic acid and iodide ions on mild steel in H2SO4 solutions. Corros. Sci. 2017, 123, 158–169. [Google Scholar] [CrossRef]
- Zheludkevich, M.L.; Yasakau, K.A.; Bastos, A.C.; Karavai, O.V.; Ferreira, M.G.S. On the application of electrochemical im-pedance spectroscopy to study the self-healing properties of protective coatings. Electrochem. Commun. 2007, 9, 2622–2628. [Google Scholar] [CrossRef]
- Obot, I.B.; Madhankumar, A. Enhanced corrosion inhibition effect of tannic acid in the presence of gallic acid at mild stee/HCl acid solution interface. J. Ind. Eng. Chem. 2015, 25, 105–111. [Google Scholar] [CrossRef]
- Li, L.; Doran, K.P.; Swain, G.M. Electrochemical Characterization of Trivalent Chromium Process (TCP) Coatings on Aluminium Alloys 6061 and 7075. J. Electrochem. Soc. 2013, 160, C396–C401. [Google Scholar] [CrossRef]
Figure 1.
Tannin classification.

Figure 2.
Chemical structure of tannic acid with the digalloyl ester sub-unit marked.

Figure 3.
Chemical structure of castalagin (R1 = H, R2 = OH) and vescalagin (R1 = OH, R2 = H).

Figure 4.
Chemical structure of the main polyphenol (A) and trimer compound (B) of mimosa tannin.

Figure 5.
Structure for the (A) mono-complex, (B) bis-complex and (C) metallic tannate chelate where R represents the remainder of the tannin molecule.
Figure 5.
Structure for the (A) mono-complex, (B) bis-complex and (C) metallic tannate chelate where R represents the remainder of the tannin molecule.

Figure 6.
Illustrative SEM photomicrographs of the AA2024-T3 (A1) anodized in CSA bath, (A2) anodized in CSA bath and sealed, (B1) anodized in GSA bath, (B2) anodized in GSA bath and sealed, (C1) anodized in MSA bath, (C2) anodized in MSA bath and sealed, (D1) anodized in TNSA bath and (D2) anodized in TNSA bath and sealed.


Figure 7.
FTIR spectra of the samples (A) anodized and (B) anodized and sealed.

Figure 8.
UV spectrum of the (A) GSA, (B) TNSA, (C) CSA and (D) MSA solutions over 12 months.

Figure 9.
UV spectrum of the (A) GSA, (B) TNSA, (C) CSA and (D) MSA solutions before and after anodized process.
Figure 9.
UV spectrum of the (A) GSA, (B) TNSA, (C) CSA and (D) MSA solutions before and after anodized process.

Figure 10.
Bode plots for AA2024-T3 anodized at 35 °C in SA and sealed for prolonged immersion in NaCl 0.5 M. (A) Bode modulus and (B) Bode phase.
Figure 10.
Bode plots for AA2024-T3 anodized at 35 °C in SA and sealed for prolonged immersion in NaCl 0.5 M. (A) Bode modulus and (B) Bode phase.

Figure 11.
Bode plots for AA2024-T3 anodized at 35 ·C in CSA and sealed for prolonged immersion in NaCl 0.5 M. (A) Bode modulus and (B) Bode phase.
Figure 11.
Bode plots for AA2024-T3 anodized at 35 ·C in CSA and sealed for prolonged immersion in NaCl 0.5 M. (A) Bode modulus and (B) Bode phase.

Figure 12.
Bode plots for AA2024-T3 anodized at 35 °C in GSA and sealed for prolong immersion in NaCl 0.5 M. (A) Bode modulus and (B) Bode phase.
Figure 12.
Bode plots for AA2024-T3 anodized at 35 °C in GSA and sealed for prolong immersion in NaCl 0.5 M. (A) Bode modulus and (B) Bode phase.

Figure 13.
Bode plots for AA2024-T3 anodized at 35 °C in TNSA and sealed for prolonged immersion in NaCl 0.5 M. (A) Bode modulus and (B) Bode phase.
Figure 13.
Bode plots for AA2024-T3 anodized at 35 °C in TNSA and sealed for prolonged immersion in NaCl 0.5 M. (A) Bode modulus and (B) Bode phase.

Figure 14.
Bode plots for AA2024-T3 anodized at 35 °C in MSA and sealed for prolonged immersion in NaCl 0.5 M. (A) Bode modulus and (B) Bode phase.
Figure 14.
Bode plots for AA2024-T3 anodized at 35 °C in MSA and sealed for prolonged immersion in NaCl 0.5 M. (A) Bode modulus and (B) Bode phase.

Figure 15.
Physical representation of the equivalent circuit used for interpretation of impedance data: (A) general model; (B) simplified model for sealed anodic used for fitting impedance data.
Figure 15.
Physical representation of the equivalent circuit used for interpretation of impedance data: (A) general model; (B) simplified model for sealed anodic used for fitting impedance data.

Figure 16.
Variation of the values of (A) Rp, (B) CPEp, (C) Rp and (D) CPEb obtained from fitting.

Figure 17.
Polarization curves in 0.5M NaCl recorded at a scanning rate of 0.2 mV/s, starting from −200 mV below the open circuit potential, sweeping in the positive direction and finished not prior to the pitting potential being reached.
Figure 17.
Polarization curves in 0.5M NaCl recorded at a scanning rate of 0.2 mV/s, starting from −200 mV below the open circuit potential, sweeping in the positive direction and finished not prior to the pitting potential being reached.

Table 3.
Fitting results for EIS data for parameter np and nb acquired in 0.5 M NaCl solution on different anodized and sealed samples.
Table 3.
Fitting results for EIS data for parameter np and nb acquired in 0.5 M NaCl solution on different anodized and sealed samples.
| Days | SA | GSA | TNSA | CSA | MSA | |
|---|---|---|---|---|---|---|
| np | 0 | 1.00 | 0.95 | 1.00 | 1.00 | 1.00 |
| 1 | 0.82 | 0.57 | 0.88 | 0.81 | 0.85 | |
| 3 | 0.77 | 0.41 | 0.84 | 0.72 | 0.85 | |
| 8 | 0.83 | 0.72 | 0.80 | 0.88 | 0.85 | |
| 16 | 0.79 | 0.51 | 0.75 | 0.84 | 0.72 | |
| 28 | 1.00 | 0.40 | 0.99 | 0.86 | 0.87 | |
| nb | 0 | 0.86 | 0.87 | 0.91 | 0.91 | 0.91 |
| 1 | 0.86 | 0.92 | 0.83 | 0.87 | 0.86 | |
| 3 | 0.85 | 1.00 | 0.84 | 0.91 | 0.86 | |
| 8 | 0.88 | 0.92 | 0.80 | 1.00 | 0.86 | |
| 16 | 0.77 | 0.88 | 0.74 | 0.97 | 0.88 | |
| 28 | 0.85 | 0.85 | 0.87 | 0.89 | 0.89 |
Table 4.
Summary of the electrochemical parameters measured for different specimens.
| Ecorr (V vs. SCE) | Icorr (A/cm2) | |
|---|---|---|
| SA | −0.556 ± 0.003 | |
| GSA | −0.582 ± 0.002 | |
| TNSA | −0.552 ± 0.004 | |
| CSA | −0.706 ± 0.006 | |
| MSA | −0.594 ± 0.006 |
Publisher’s Note: MDPI stays neutral with regard to jurisdictional claims in published maps and institutional affiliations. |
© 2022 by the authors. Licensee MDPI, Basel, Switzerland. This article is an open access article distributed under the terms and conditions of the Creative Commons Attribution (CC BY) license (https://creativecommons.org/licenses/by/4.0/).
Share and Cite
MDPI and ACS Style
Proença, C.S.; Serrano, B.; Correia, J.; Araújo, M.E.M. Evaluation of Tannins as Potential Green Corrosion Inhibitors of Aluminium Alloy Used in Aeronautical Industry. Metals 2022, 12, 508. https://doi.org/10.3390/met12030508
AMA Style
Proença CS, Serrano B, Correia J, Araújo MEM. Evaluation of Tannins as Potential Green Corrosion Inhibitors of Aluminium Alloy Used in Aeronautical Industry. Metals. 2022; 12(3):508. https://doi.org/10.3390/met12030508
Chicago/Turabian StyleProença, Carla Sofia, Bruno Serrano, Jorge Correia, and Maria Eduarda Machado Araújo. 2022. "Evaluation of Tannins as Potential Green Corrosion Inhibitors of Aluminium Alloy Used in Aeronautical Industry" Metals 12, no. 3: 508. https://doi.org/10.3390/met12030508
Note that from the first issue of 2016, this journal uses article numbers instead of page numbers. See further details here.