Effect of Cooling Rate and Sulfur Content on Sulfide Inclusions in Invar Alloy


1
General Research Institute of Mining and Metallurgy Technology Group, Beijing 100160, China
2
State Key Laboratory of Advanced Special Steel and Shanghai Key Laboratory of Advanced Ferrometallurgy, School of Materials Science and Engineering, Shanghai University, Shanghai 200072, China
3
School of Metallurgical and Ecological Engineering, University of Science and Technology Beijing (USTB), Beijing 100083, China
*
Author to whom correspondence should be addressed.
Metals 2022, 12(12), 2191; https://doi.org/10.3390/met12122191
Submission received: 9 November 2022
/
Revised: 7 December 2022
/
Accepted: 9 December 2022
/
Published: 19 December 2022
(This article belongs to the Section Extractive Metallurgy)
Abstract
:Invar alloy has been widely used in modern industry for its extremely low coefficients of thermal expansion (CTE). Sulfide inclusions have a significant influence on the mechanical performance and corrosion resistance of Invar alloy. To improve the mechanical properties of this alloy, which are significantly influenced by the existing sulfide inclusions, a good understanding of the characteristics, including the morphology, size, distribution, and formation mechanism of sulfide inclusions, is required. This study outlines three different cooling modes, water cooling (43.1 K/s), air cooling (16.8 K/s), and furnace cooling (3.1 K/s), to examine the characteristics of calcium sulfide (CaS) inclusions. In addition, a variety of initial sulfur contents under air cooling conditions were investigated. Both laboratory experiments and thermodynamic calculations support the research foundation. The sulfide inclusion particles were extracted through non-aqueous solution electrolysis for further morphology analysis. From the results, we conclude that the cooling rate affects the sulfide inclusion size through the local solidification time. The faster the cooling rate, the larger the average inclusion size. The cooling rate also indirectly influences the morphology of calcium sulfide inclusions that precipitated during the solidification process. In addition, the precipitation of CaS takes precedence over MnS under any circumstances. MnS can only precipitate when there is excessive S content. The different initial S content derived separate supersaturation during CaS precipitation and growth, further influencing the inclusion morphologies.
1. Introduction
The Fe-Ni binary alloy with 36 wt% Ni shows an anomalous low thermal expansion coefficient (TEC) close to room temperature [1,2]. The Fe-Ni36% alloy and those of similar composition are denoted as Invar alloys. Invar alloys are widely used as highly reliable structural materials in numerous applications due to their excellent dimensional stability and mechanical properties in a large temperature range, e.g., precision instruments, aerospace control devices, laser measuring systems, high-capacity power transmission wires and shadow masks [3,4]. Recently, a series of Invar alloy materials have been investigated and developed for various application areas as new strategic materials. High mechanical strength and high-corrosion-resistance Invar alloy materials are required to meet the rapidly expanding demand for applications in electronics, aerospace, and bioengineering fields [5,6,7,8].
Usually, sulfide inclusions in steel are harmful impurities, which could deteriorate properties such as strength, corrosion resistance, and surface finish [9]. Sulfide inclusions can cause anisotropy of the steel matrix and act as a possible starting point for crack formation or corrosion [10,11]. The TEC difference between sulfide inclusions and steel matrix can significantly accelerate the propagation of crack lines during the heat treatment process, leading to the origins of fatigue fractures [12]. Soft sulfides—for instance, manganese sulfide (MnS)—are elongated along the hot rolling direction and considered to be detrimental to the transverse toughness and resistance of steel, causing stress corrosion cracking [13,14]. Hard sulfides with a high melting point, such as calcium sulfide (CaS), which could grow easily into complex geometric shapes with large sizes through collision and agglomerate in the molten, are very harmful to surface quality and affect the final product quality [15,16]. To avoid steel performance deterioration, the size, morphology, and frequency of detrimental inclusions must be carefully controlled. On the other hand, the tiny and dispersed sulfides can contribute to a favorable microstructure by acting as heterogeneous nucleation inducing the formation of intergranular ferrite [17]. Generally, sulfide inclusions tend to crystallize and precipitate in the residual liquid phase during solidification and mostly remain in the solid steel, due to the microsegregation of solutes [18]. However, sulfide inclusions cannot be controlled through dissolution and precipitation during heat treatment, such as carbides. In addition, the stirring method during the refining process for the removal of oxides does not function in sulfides. As the main contributor to the quality and performance of Invar alloy, sulfide inclusion characteristics, such as the number, size, distribution, and morphology in steel, are significantly altered by the cooling rate and initial sulfur content. Therefore, a thorough discerning of precipitation and the growth mechanism, as well as better control of the cooling and solidification process, is a critical issue.
An accurate three-dimensional (3D) investigation of inclusions in steel would contribute insights into the inclusion characteristics. The non-aqueous solution electrolysis extracting inclusions from steel matrix was found to be the best and most popular method for 3D investigation [19]. Karasev A et al. [20] and Ohta H et al. [21] showed that the 3D analysis of inclusions extracted by electrolytic extraction could give more reliable results than the two-dimensional (2D) analysis, particularly for the small size (<1 μm) inclusions. Hinotani et al. [22] reported how the precipitates, including TiN, MnS, TiS, and Ti4C2S2, were successfully extracted from Ti-bearing ultra-low carbon steel by using electrolysis treatment with 4% MS solution (4% methyl salicylate; 1% salicylic acid; 1% tetramethylammonium chloride-methanol). Liu et al. [23] observed MnS, oxide, and complex inclusions in low-sulfur steels, using the electrolyte, which was composed of 1% 4-methyl ammonium chloride, 5% triethanolamine, 5% glycerin, and 89% methyl alcohol. Zhang et al. [24] chose the same electrolyte to extract inclusions from pipe steels for illustrating the 3D characteristics morphologies of Ca-CaS type inclusions. Wang et al. [25] reported that the solution of 10%AA (10% acetylacetone; 1% tetramethyl ammonium chloride; methanol) can be successfully used to extract inclusions from ferroalloys. Luo et al. [26,27] investigated the morphology of oxides, nitrides, and sulfides in non-oriented silicon steel by using a 5% TEA (2% triethanolamine; 1% tetramethylammonium chloride-methanol) solution as the electrolyte.
The precipitated sulfide inclusions in steel can be classified into three types [28,29,30,31]: globular (Type I), fine rod-like (Type II), and angular (Type III). Numerous studies have been carried out in order to understand the formation mechanism and control the morphology of MnS inclusion during solidification [32,33,34]. The effect of the cooling rate on MnS inclusions during the solidification has been investigated. Mola and Beech [35] reported that the high cooling rate prioritized the formation of Type II sulfides. R.Abushosha et al. [36] reported that the higher the cooling rate, the finer the sulfide distribution in the ferrite surrounding the austenite grains, resulting in ductility deterioration. Li et al. [37] reported that a high cooling rate promotes the formation of Type I and Type II sulfides in medium-carbon non-quenched and tempered steel. Zhang et al. [38] verified that the cooling rate had a significant effect on the sulfides’ morphology, which changed from nearly spherical to rod-like as the cooling rate decreased. However, fewer studies have been reported on the effect of the cooling rate and S content on the sulfide inclusions during the solidification of high alloy steel. The effect of S content on the morphology of calcium sulfide has not been reported yet. In this work, laboratory experiments and thermodynamic calculations were carried out to study the effect of the cooling rate and S content on sulfide inclusions during the solidification of the Invar alloy.
2. Experimental
2.1. Materials and Procedures
Table 1 gives the chemical composition of the master alloy, which was taken from an INVAR alloy casting slab. The master alloy was cut into a 10 mm × 10 mm × 8 mm hexahedron. After grinding and polishing, the hexahedrons were placed into an anhydrous alcohol solution and shaken ultrasonically for 5 min.
Figure 1 illustrates the thermal traces of the samples and the induction furnace used in this study. A highly purified argon gas atmosphere in the reaction chamber was constructed to prevent the melting alloy from reacting with air. About 330 g of INVAR master alloy and FeS powder were melted in a fused silica crucible (34 mm in diameter, 100 mm in depth) with a graphite heater surrounded by a purified Ar gas atmosphere. To completely dissolve the original sulfide inclusion, the master alloy was first melted at 1873 K. We waited until the steel composition was fully mixed. Then, three cooling modes were adopted: (1) water cooling (WC) sample: the crucible was immediately quenched in water after taking out from the furnace, reaching an average cooling rate of 43.1 K/s; (2) air cooling (AC) sample: the crucible was taken out from the furnace and cooled to room temperature in air, with an average cooling rate of 16.8 K/s; (3) furnace cooling (FC) sample: the melt in the crucible was directly cooled to room temperature after turning off the power, occupying an average cooling rate of 3.1 K/s. Table 2 summarizes the cooling conditions and S contents of the prepared samples.
A 17.5 mm × 35 mm × 3 mm sample was cut from the ingots for analyzing the three-dimensional (3D) morphology of inclusions. Figure 2 depicts the sampling method schematically. The inclusions were extracted from samples by the method of non-aqueous solution electrolysis. The electrolyte was composed of 56% Methanol, 40% Maleic anhydride, and 4% tetramethylammonium chloride. The electrolytic extraction was performed under 1.9 V of direct current voltage, 4 °C temperature, and Ar atmosphere; thus, around 0.5 g of sample weight is able to be electrolyzed in 8 h. After electrolysis, the electrolytes were filtrated using a nucleopore membrane of 25 mm in diameter with a pore size of 1.0 μm. Then, the particles separated from steel samples were collected on the membranes. The composition, size, and morphology of the inclusions were examined by scanning electron microscopy equipped with energy-dispersive spectroscopy (SEM-EDS).
2.2. Thermodynamics of Sulfide Precipitation Process
The formation of inclusions of CaS may occur during solidification. The equilibrium reactions are expressed as follows [39,40].
where fiT is defined as:
As the solidification progresses, the solute elements are enriched in interdendritic liquid. Brody and Flemings proposed a general form of this model that assumes complete diffusion in the liquid phase and incomplete back-diffusion in the solid phase; the discretization equation is given as follows [41]:
Sulfide particles begin to precipitate in the residual liquid when the local concentration product reaches the equilibrium solubility product. The concentration product at the solid–liquid interface Ci,S-L equals the equilibrium solubility product during the formation of CaS inclusions. The conservation of mass can be expressed as:
Assuming that the consumption of S is entirely used for sulfide generation, the precipitation amount of sulfide can be calculated by the following equation.
where mCaS is the weight percentage of precipitated CaS inclusions. MCa and MS represent the atomic weight of Ca and S, respectively.
3. Results and Discussion
3.1. Effect of Cooling Rate on the Size of CaS Inclusion
The statistical results of CaS size in Figure 3 reveal that the size of CaS inclusions can be significantly affected by the cooling rate. The solidification rate increases when the cooling condition is altered from FC (3.1 K/s), AC (16.8 K/s), to WC (43.1 K/s), leading to the decrease trends of CaS inclusion size, from 55.3 μm, 26.8 μm to 22.1 μm, respectively. The concentration of S and Ca in residual liquid under various cooling conditions is shown in Figure 4. The CaS precipitation and solubility product during solidification, as presented in Figure 5. No significant difference had been observed in the concentration of Ca and S along with the variation in cooling rates. Thus, the variation in the cooling condition does not affect the precipitation temperature of 1732 K (the corresponding solid fraction is 0.78) for CaS inclusions, in the case of the same initial content. At the initial stage of solidification, the concentration of both S and Ca increase along with the liquid solidification, the Ca is much more enriched than S due to the smaller equilibrium distribution coefficient of Ca at the solid–liquid interface. When the interdendritic solute concentration product (lnQ) exceeds the equilibrium solubility product (lnK), the precipitation of CaS occurs with the consumption of excess solutes, rapidly decreasing the S concentration. The local concentration of Ca rises gradually due to the amount of Ca rejected from the solidifying metal being larger than the amount of Ca consumed for CaS precipitation. The concentration product and the equilibrium solubility product are balanced at the solid–liquid interface during the formation of CaS inclusions. The total precipitation of CaS weighs 0.0021% at the end of solidification.
According to Equation (8), the local growth time increases with the decreasing cooling rate during the precipitation and growth period of CaS particles. Due to the high cooling rate in the WC sample, the local solidification time is short, as well as the diffusion time for the solute element. The growth of CaS particles is limited resulting in the smallest size of CaS inclusion. When the cooling rate diminished, the second dendrite arm spacing was increased, allowing more space for sulfide growth. In the FC sample, the slow cooling rate of the furnace cooling condition prolongs the local growth time and slows down the dendrites’ growth. The precipitated CaS particles can be pushed forward by solidified dendrites and had enough time to grow in the front of solidification, resulting in the constant growth of CaS. Thus, the FC sample achieved the largest size of inclusions of CaS. Since CaS inclusions are relatively harmful to steel, especially large-sized elongated sulfides can cause hydrogen-induced cracking. The experimental results show that increasing the cooling rate could bring benefits to the sizing control of sulfide inclusions in the steel.
3.2. Effect of Cooling Rate on Morphology of CaS Inclusion
The cooling rate affects the sulfide inclusions’ size, as well as the morphology. The typical morphologies of CaS inclusions under three cooling modes are shown in Figure 6, Figure 7 and Figure 8. Figure 9 shows the changes in the morphology of CaS under different cooling rates. In the WC cooling sample, the sulfide morphology is mainly round rod-like with an almost circular cross-section. As the cooling rate decreases, the aspect ratio of the sulfide cross-section increases. In the AC sample, the morphology of CaS inclusion is mainly flat and rod-like. Strip sheet-like CaS inclusions appear in the FC cooling sample.
According to the thermodynamic calculation results, the matrix first solidified and crystallized at the initial stage of solidification, then the residual liquid phase gradually distributed in the dendrite clearance. When the concentration product of Ca and S in the residual liquid exceeds the equilibrium concentration product, CaS particles begin to precipitate. The CaS particles grow cooperatively with the matrix, and the morphology of the inclusions of CaS is affected by the morphology of the matrix. The dendrite arms are rod-shaped at a high cooling rate, and become flat with ordered rows at a low cooling rate, resulting in the morphology of CaS switching from round-rod-like to flat-rod-like and strip sheet-like.
3.3. Effect of S Content on the Type of Sulfide Inclusion
Sulfur is completely soluble in liquid steel and precipitates as sulfides gradually during steel solidification. The generation order of sulfide inclusions is determined by the affinity between alloy elements and sulfur, as well as the contents. The main sulfide inclusions in steel are formed in a certain order, as follows: CaS > MnS > FeS. When the content of alloy elements is constant, the content of S affects the types of sulfides in the steel. Using the air-cooling condition as an example, Figure 10 shows the kinds of sulfide precipitated in the steel with different initial S content, MnS inclusions precipitated when the excessive S is added to the liquid steel. CaS inclusions are the preferentially precipitated inclusions, due to the lower reaction Gibbs free energy of CaS and smaller equilibrium distribution coefficient of Ca. Only in the scenario in which [%S] > [%Ca], the remaining S, which is not consumed by Ca, could react with Mn to form MnS. In this scenario, both CaS and MnS coexist within the steel.
3.4. Effect of S Content on the Morphology of CaS Inclusion
Crystal shape can be affected by many aspects, such as crystal structure, growth conditions, and the presence of impurities. The growth environment conditions vary the growth mechanism, forming assorted crystal morphologies. Once a stable crystal nucleus is formed in the melt, the step at the nucleus boundary is the preferred site for attaching the growth unit, and the new layer will quickly diffuse to the surface. Dekkers et al. [42] reported that the supersaturation of dissolved elements in the liquid phase is one of the major factors affecting the morphology of Al2O3 inclusions. The mechanism of the transformation of morphology inclusions is well explained by this principle. According to Dekkers, the growth rate of the crystal depends on the nucleation rate, which is determined by the levels of supersaturation. The supersaturation (σ) of the formation of CaS during solidification can be defined as:
The different initial S content alters the degree of supersaturation during the formation of CaS in the solidification process. Figure 11 illustrated the relationship between supersaturation and growth rate, providing a visualized explanation for the transformation mechanism of the morphological characteristics of CaS [43,44].
If crystal growth is controlled by the diffusion of growth units across the face towards steps on the surface, the theory of the growth rate of a face is formulated relatively by Burton [45] and Cabrera and Frank [46]. The Burton–Cabrera–Frank model (BCF) for spiral growth suggested that crystal could grow even at very low supersaturation (σ < σ*). The growth mechanism produces continuous steps on the crystal surface, which emerge in the central region of the faces. The crystal takes a polyhedral morphology bound by flat faces, as shown in Figure 11a. The BCF growth takes the dominant when the initial S content is 0.001%, the surface of CaS inclusion is smooth, the continuous steps are formed on the surface, and the polyhedral morphology appears at the end of the inclusions’ growth direction, as shown in Figure 12.
The Volmer-Kossel-Stranski (VKS) model [47] considers the formation of two-dimensional nucleation onto a flat surface. VKS growth holds the commanding edge in the supersaturation range of σ* < σ <σ**. The two-dimensional nucleus is preferentially formed at the surface position with the highest supersaturation step, for example, at the corner and edges of faces, the growth steps will advance from them, resulting in the formation of hopper crystals, as shown in Figure 11b. When the initial S content is promoted to 0.007%, the supersaturation increases during the CaS generation process, replacing the BCF growth with VKS growth. Consequently, the morphology of the inclusions changes to a funnel shape, and the surface of the inclusions transitions from a smooth surface (Figure 13a,b) to a rough surface (Figure 13c,d).
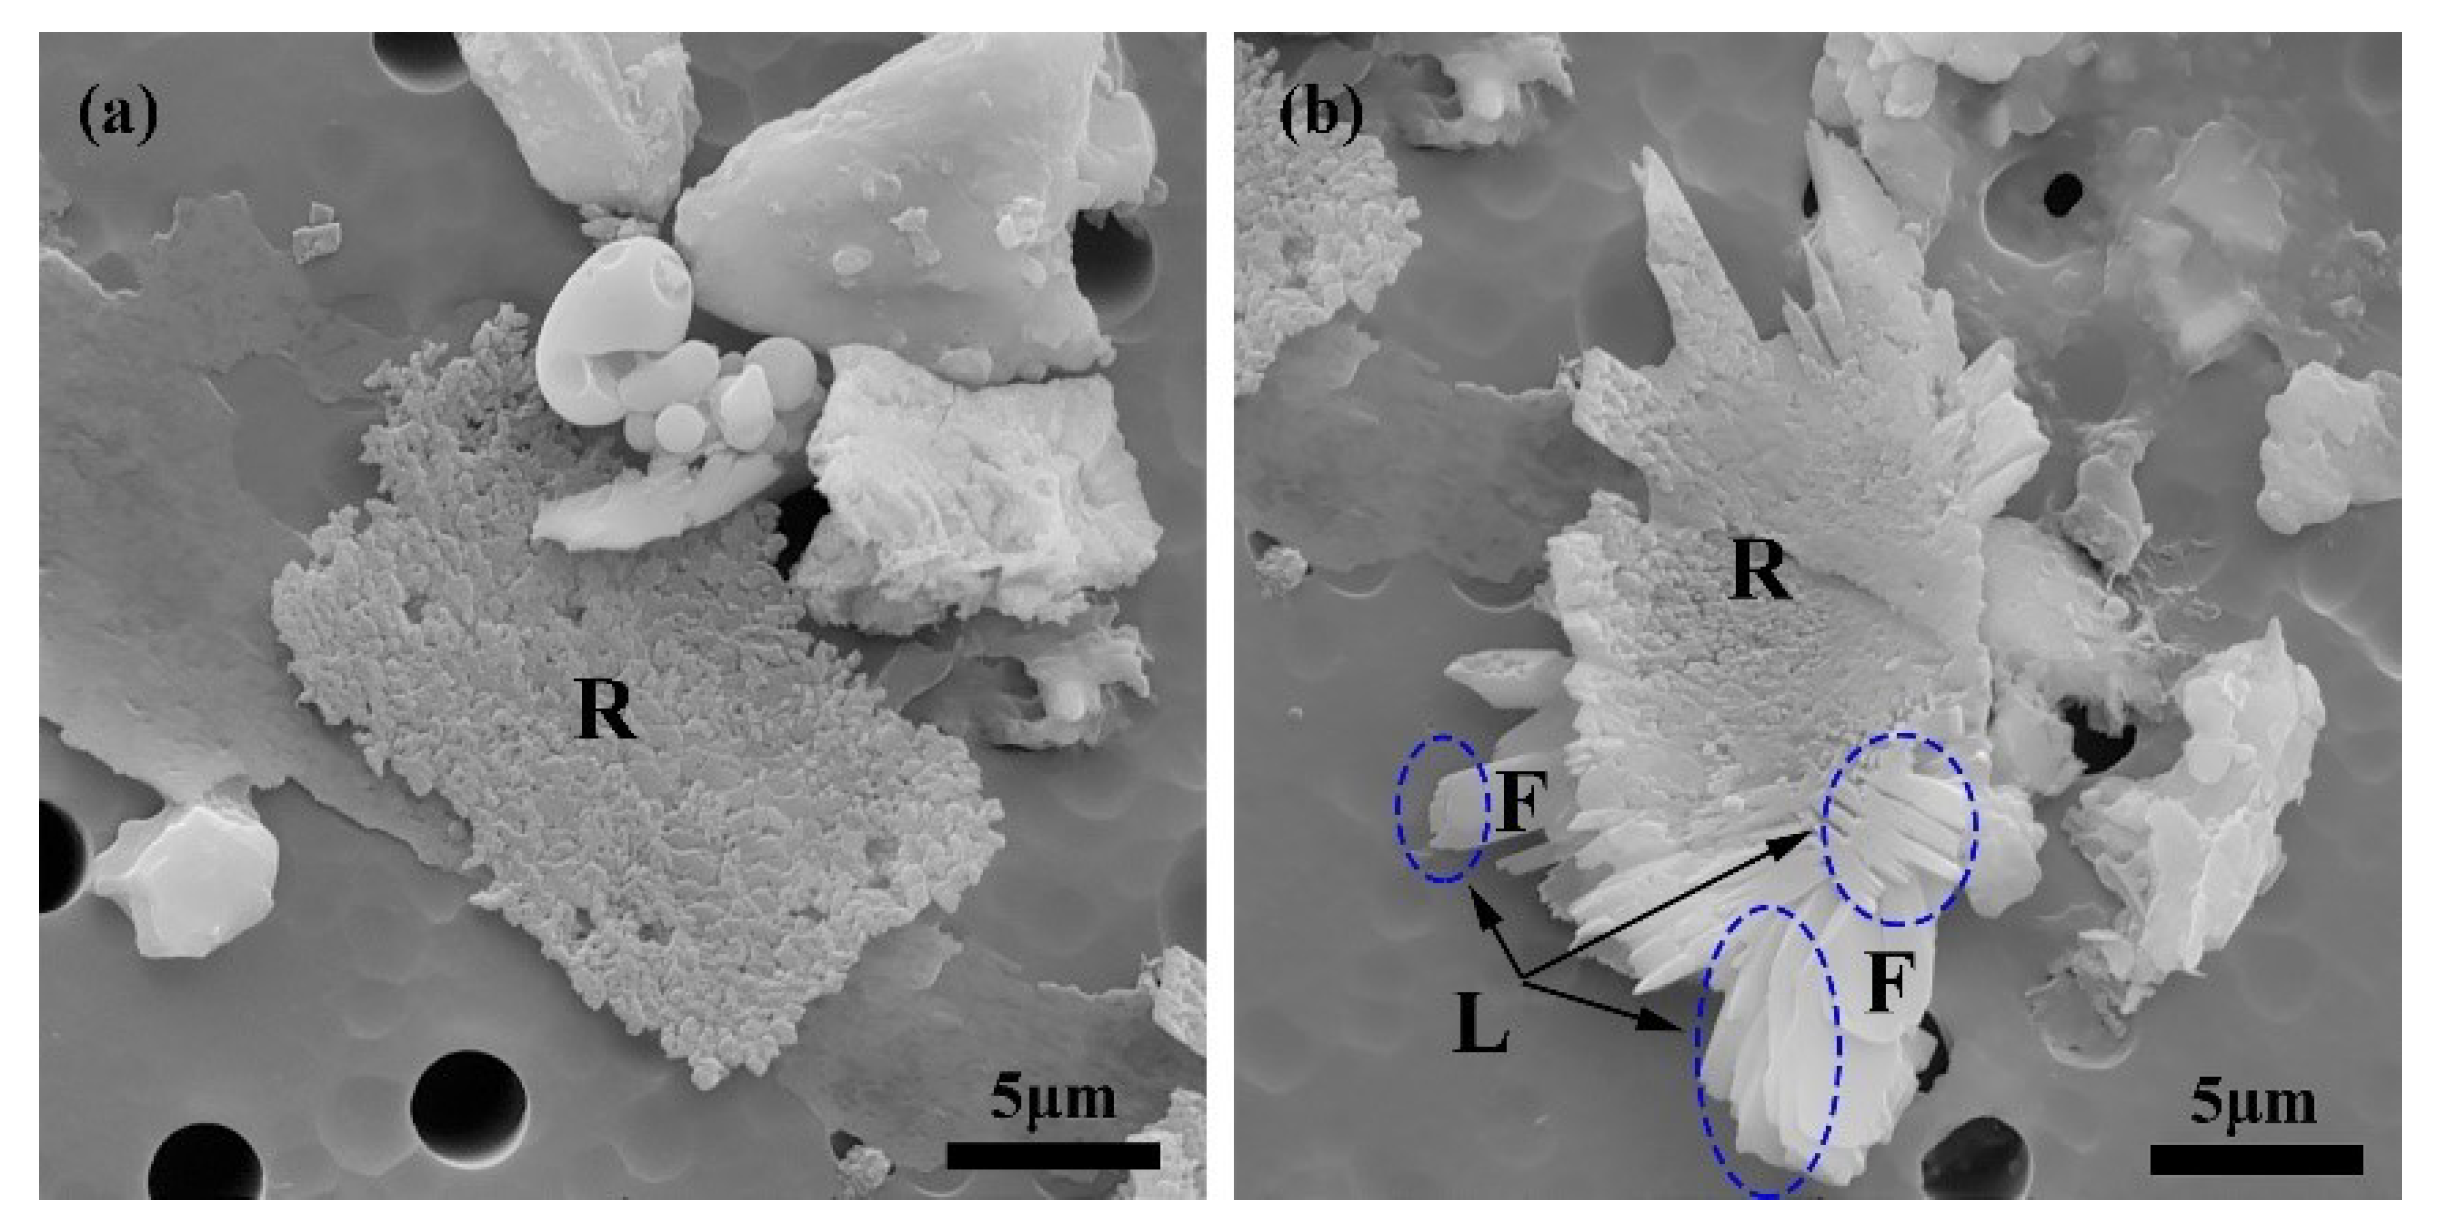
At very high levels of supersaturation (σ > σ**), the crystal growth becomes unstable and the growth unit in the melt will be trapped by the crystal, and continuous or linear growth occurs. Neither the BCF model nor the VKS model is suitable for this growth. The growth of a crystal depends on the aggregation of a single particle, resulting in a rough interface crystal. As the degree of supersaturation increases, the crystal growth kinetics are controlled by body diffusion. The interface loses stability due to the supersaturation gradient along the interface, leading to the curved surface and dendritic growth morphology, as shown in Figure 11c. When the initial S content reaches 0.017%, the degree of supersaturation is very high, and CaS inclusions with a rough surface are generated as shown in Figure 14. The morphology of inclusions observed at room temperature is the cumulative result of the growth (or dissolution) conditions encountered in the process of nucleation to sampling. The supersaturation gradually decreases at the edge of the CaS particle with the growth of CaS, and the growth rate decreases. When the end supersaturation drops below σ**, it grows into a flat interface morphology, as shown in Figure 14b. The transient stage between adhesive growth and layer growth is more likely to generate plate-like inclusions with angles or arms.
4. Conclusions
In the current study, the effects of the cooling rate and S content on the characteristics of sulfide inclusions in Invar alloy were investigated through experiments and theoretical analysis. The main results obtained can be summarized as follows.
- (1)
- In the case of low S content, the cooling rate has no distinct effect on the microsegregation of solutes in the front of the solid–liquid interface, whereas the size and morphology of sulfide inclusions were susceptible to the cooling rate. The smaller the cooling rate, the longer the local solidification time, which allows the precipitated CaS inclusions to grow up, leading to a larger size of CaS inclusions: 22.1 μm with 43.1 K/s and 55.3 μm with 3.1 K/s. The thermodynamic calculations confirmed that CaS is formed during solidification. The later precipitated CaS grows cooperatively with the earlier precipitated Fe matrix, and the morphology of the CaS inclusions is affected by the shape of the matrix. The morphology of CaS inclusion is transformed as well: from round to flat gradually, with the decreasing trends of the cross-section aspect ratio.
- (2)
- In this study, CaS is the preferred precipitated sulfide over MnS. When [S] < [Ca], only CaS precipitates in steel. When [S] > [Ca], where the Ca in the steel cannot completely react off of S, MnS begins to precipitate.
- (3)
- The various initial content of S diversifies the supersaturation during the formation of CaS inclusions. These differences causes a variety of sulfide precipitations, but also affect the morphological characteristics of precipitated CaS. The increase in supersaturation shapes the morphology from a polyhedron and funnel to a dendritic shape, and roughens the CaS inclusion surfaces.
Author Contributions
Conceptualization, J.C. and S.Z.; methodology, J.C. and S.Z.; software, J.C. and Y.F.; validation, J.C.; formal analysis, J.C. and S.Z.; investigation, J.C.; resources, J.C.; data curation, J.C.; writing—original draft preparation, J.C.; writing—review and editing, J.C. and Y.F.; visualization, J.C.; supervision, S.Z.; project administration, J.C.; funding acquisition, Y.F.. All authors have read and agreed to the published version of the manuscript.
Funding
This research was funded by Fundamental Research Funds for the Central Universities grant number [00007461] And The APC was funded by [00007461].
Institutional Review Board Statement
Not applicable.
Informed Consent Statement
Not applicable.
Data Availability Statement
Data available on request.
Conflicts of Interest
The authors declare no conflict of interest.
Nomenclature
| T | Temperature(K) |
| TL | Liquidus temperature |
| TS | Solidus temperature |
| T0 | Melting point of pure iron(1809 K) |
| KCaS | The equilibrium constant of Equation (1) |
| a[CaS] | The activity of pure CaS and considered as 1 |
| [%i] | The concentration of solute element i (wt.%) |
| fiT | The activity coefficient of a given solute element at temperature T |
| fi1873K | Activity coefficient at temperature 1873 K |
| TS-L | The temperature at the solid–liquid interface where the solid and liquid coexist in a dendrite |
| fs | Solid fraction |
| Ci:0 | Initial solute concentration |
| Ci,L | Solute concentration at the solid–liquid interface |
| Ci,S-L | Solute concentration at solid–liquid interface |
| ki | Equilibrium partition coefficient |
| α | Back-diffusion parameter |
| DS,i | Diffusion coefficient of solute in the solid phase |
| tf | Local solidification time in seconds |
| λ | Secondary dendrite arm spacing(cm) |
| △CL,i | Consumption of a given solute element caused by the formation of CaS |
| mCaS | The weight percentage of precipitated CaS inclusions. |
| MCa | The atomic weight of Ca |
| MS | The atomic weight of Ca |
References
- Yokoyama, T.; Eguchi, K. Anharmonicity and quantum effects in thermal expansion of an Invar alloy. Phys. Rev. Lett. 2011, 107, 065901. [Google Scholar] [CrossRef] [PubMed]
- Nagayama, T.; Yamamoto, T.; Nakamura, T. Thermal expansions and mechanical properties of electrodeposited Fe–Ni alloys in the Invar composition range. Electrochim. Acta 2016, 205, 178–187. [Google Scholar] [CrossRef]
- Van Schilfgaarde, M.; Abrikosov, I.; Johansson, B. Origin of the Invar effect in iron-nickel alloys. Nature 1999, 400, 46–49. [Google Scholar] [CrossRef]
- Matsushita, M.; Endo, S.; Miura, K.; Ono, F. Pressure induced magnetic phase transition in Fe-Ni Invar alloy. J. Magn. Magn. Mater. 2003, 265, 352–356. [Google Scholar] [CrossRef]
- Vinogradov, A.; Hashimoto, S.; Kopylov, V. Enhanced strength and fatigue life of ultra-fine grain Fe-36Ni Invar alloy. Mater. Sci. Eng. A 2003, 355, 277–285. [Google Scholar] [CrossRef]
- Chen, L.; Zhang, J.F.; Zhang, L.; Meng, L. Textures of high-strength and low-expansion Fe-Ni alloy wires during cold-drawing processes. Int. J. Miner. Metall. Mater. 2009, 16, 667–671. [Google Scholar]
- Zhao, Y.; Sato, Y.S.; Kokawa, H.; Wu, A. Microstructure and properties of friction stir welded high strength Fe-36 wt% Ni alloy. Mater. Sci. Eng. A 2011, 528, 7768–7773. [Google Scholar] [CrossRef]
- Liu, H.; Sun, Z.; Wang, G.; Sun, X.; Li, J.; Xue, F.; Peng, H.; Zhang, Y. Effect of aging on microstructures and properties of Mo-alloyed Fe-36Ni Invar alloy. Mater. Sci. Eng. A 2016, 654, 107–112. [Google Scholar] [CrossRef]
- Maciejewski, J. The effects of sulfide inclusions on mechanical properties and failures of steel components. J. Fail. Anal. Prev. 2015, 15, 169–178. [Google Scholar] [CrossRef] [Green Version]
- Raghupathy, V.; Srinivasan, V.; Krishnan, H.; Chandrasekharaiah, M.N. The effect of sulphide inclusions on fracture toughness and fatigue crack growth in 12 wt% Cr steels. J. Mater. Sci. 1982, 17, 2112–2126. [Google Scholar] [CrossRef]
- Ray, G.; Jarman, R.; Thomas, J. Some aspects of crack initiation in mild steel under corrosion fatigue condition. J. Mater. Sci. 1994, 29, 47–53. [Google Scholar] [CrossRef]
- Ånmark, N.; Karasev, A.; Jönsson, P.G. The effect of different non-metallic inclusions on the machinability of steels. Materials 2015, 8, 751–783. [Google Scholar] [CrossRef] [PubMed] [Green Version]
- Shao, X.J.; Wang, X.H.; Ji, C.X.; Li, H.B.; Cui, Y.; Zhu, G.S. Morphology, size and distribution of MnS inclusions in non-quenched and tempered steel during heat treatment. Int. J. Miner. Metall. Mater. 2015, 22, 483–491. [Google Scholar] [CrossRef]
- Kuniya, J.; Anzai, H.; Masaoka, I. Effect of MnS inclusions on stress corrosion cracking in low-alloy steels. Corrosion 1992, 48, 419–425. [Google Scholar] [CrossRef]
- Guo, Y.T.; He, S.P.; Chen, G.J.; Wang, Q. Thermodynamics of complex sulfide inclusion formation in Ca-treated Al-killed structural steel. Metall. Mater. Trans. B 2016, 47, 2549–2557. [Google Scholar] [CrossRef]
- Shin, J.H.; Park, J.H. Formation mechanism of oxide-sulfide complex inclusions in high-sulfur-containing steel melts. Metall. Mater. Trans. B 2018, 49, 311–324. [Google Scholar] [CrossRef]
- Loder, D.; Michelic, S.K.; Bernhard, C. Acicular ferrite formation and its influencing factors—A review. J. Mater. Sci. Res. 2017, 6, 24–43. [Google Scholar] [CrossRef] [Green Version]
- Ghosh, A. Mathematical model for prediction of composition of inclusions formed during solidification of liquid steel. ISIJ Int. 2009, 49, 1819–1827. [Google Scholar]
- Watanabe, K.; Narita, K. Report of the Activity of Joint Research Committee on Theory of Models and Scale-up Method/Isolation and Determination of Sulphides in Steel. Tetsu Hagane 1987, 73, 64–83. [Google Scholar] [CrossRef] [Green Version]
- Karasev, A.; Suito, H. Quantitative evaluation of inclusion in deoxidation of Fe-10 mass pct Ni alloy with Si, Ti, Al, Zr, and Ce. Metall. Mater. Trans. B 1999, 30, 249–257. [Google Scholar] [CrossRef]
- Ohta, H.; Suito, H. Characteristics of particle size distribution of deoxidation products with Mg, Zr, Al, Ca, Si/Mn and Mg/Al in Fe–10mass% Ni alloy. ISIJ Int. 2006, 46, 14–21. [Google Scholar] [CrossRef] [Green Version]
- Hinotani, S.; Endo, J.; Takayama, T.; Mizui, N.; Inokuma, Y. Isolation and determination of sulfides in Ti-bearing ultra low carbon steels. ISIJ Int. 1994, 34, 17–23. [Google Scholar] [CrossRef]
- Liu, Y.; Zhang, L.; Duan, H.; Zhang, Y.; Luo, Y.; Conejo, A.N. Extraction, Thermodynamic Analysis, and Precipitation Mechanism of MnS-TiN Complex Inclusions in Low-Sulfur Steels. Met. Mater. Trans. A 2016, 47, 3015–3025. [Google Scholar] [CrossRef]
- Zhang, X.; Zhang, L.; Yang, W.; Wang, Y.; Liu, Y.; Dong, Y. Characterization of the Three-Dimensional Morphology and Formation Mechanism of Inclusions in Linepipe Steels. Metall. Mater. Trans. B Process Metall. Mater. Process. Sci. 2017, 48, 701–712. [Google Scholar] [CrossRef]
- Wang, Y.; Karasev, A.; Jönsson, P.G. An Investigation of Non-Metallic Inclusions in Different Ferroalloys using Electrolytic Extraction. Metals 2019, 9, 687. [Google Scholar] [CrossRef] [Green Version]
- Luo, Y.; Zhang, L.; Yang, W.; Ren, Y.; Conejo, A.N. Precipitation of nitrides in non-oriented silicon steel. Ironmak. Steelmak. Process. Prod. Appl. 2019, 46, 359–367. [Google Scholar] [CrossRef]
- Luo, Y.; Yang, W.; Ren, Q.; Hu, Z.; Li, M.; Zhang, L. Evolution of Non-metallic Inclusions and Precipitates in Oriented Silicon Steel. Metall. Mater. Trans. B Process Metall. Mater. Process. Sci. 2018, 49, 926–932. [Google Scholar] [CrossRef]
- Sims, C.; Dahle, F. Effect of aluminum on the properties of medium carbon cast steel. Trans. Am. Foundrym. Soc. 1938, 46, 65–132. [Google Scholar]
- Sims, C.; Sailer, H.; Boulger, F. Effects of various deoxidizers on the structures of sulphide inclusions. Trans 1949, 1949, 233–248. [Google Scholar]
- Ji, S.; Zhang, L.; Wang, X. Effect of Magnesium on Inclusions in a High Sulfur Steel. Metall. Mater. Trans. B 2022, 53, 848–863. [Google Scholar] [CrossRef]
- Xu, X.; Zeng, Z.; Tian, Q.; Cao, C.W.; Shen, P.; Fu, J.X. Application of fractal theory to study morphology of manganese sulfide inclusion in resulfurized free-cutting steels. J. Iron Steel Res. Int. 2022. [Google Scholar] [CrossRef]
- Valdez, M.E.; Wang, Y.; Sridhar, S. In-Situ Observation of the Formation of MnS during Solidification of High Sulphur Steels. Steel Res. Int. 2004, 75, 247–256. [Google Scholar] [CrossRef]
- Oikawa, K.; Sumi, S.I.; Ishida, K. Morphology control of MnS inclusions in steel during solidification by the addition of Ti and Al. Z. Met. Mater. Res. Adv. Tech. 1999, 90, 13–17. [Google Scholar]
- Ito, Y.; Masumitsu, N.; Matsubara, K. Formation of manganese sulfide in steel. Trans. Iron Steel Inst. Jpn. 1981, 21, 477–484. [Google Scholar] [CrossRef]
- Mohla, P.P.; Beech, J. Effect of cooling rate on morphology of sulfide inclusions. J. Iron Steel Inst. 1969, 207, 177. [Google Scholar]
- Abushosha, R.; Ayyad, S.; Mintz, B. Influence of cooling rate and MnS inclusions on hot ductility of steels. Mater. Sci. Technol. 1998, 14, 227–235. [Google Scholar] [CrossRef]
- Li, M.L.; Wang, F.M.; Li, C.R.; Yang, Z.B.; Meng, Q.Y.; Tao, S.F. Effects of cooling rate and Al on MnS formation in medium-carbon non-quenched and tempered steels. Int. J. Miner. Metall. Mater. 2015, 22, 589–597. [Google Scholar] [CrossRef] [Green Version]
- Zhang, X.; Yang, C.; Zhang, L. Effects of cooling rate and isothermal holding on the characteristics of MnS particles in high-carbon heavy rail steels. Metall. Res. Technol. 2020, 117, 110. [Google Scholar] [CrossRef]
- Sigworth, G.; Elliott, J.F. The thermodynamics of liquid dilute iron alloys. Met. Sci. 1974, 8, 298–310. [Google Scholar] [CrossRef]
- Fahlman, B.D. What is “materials chemistry”. In Materials Chemistry; Springer: New York, NY, USA, 2018; pp. 1–21. [Google Scholar]
- Clyne, T.; Kurz, W. Solute redistribution during solidification with rapid solid state diffusion. Metall. Trans. A 1981, 12, 965–971. [Google Scholar] [CrossRef]
- Dekkers, R.; Blanpain, B.; Wollants, P. Crystal growth in liquid steel during secondary metallurgy. Metall. Mater. Trans. B 2003, 34, 161–171. [Google Scholar] [CrossRef]
- Sunagawa, I. Morphology of minerals, in Morphology of Crystals, part, B. Terra. Sci. Pub. 1988, 1988, 511–587. [Google Scholar]
- Sunagawa, I. Growth and morphology of crystals. Forma 1999, 14, 147–166. [Google Scholar]
- Burton, W.K.; Cabrera, N.; Frank, F.C. The growth of crystals and the equilibrium structure of their surfaces. Philos. Trans. R. Soc. London. Ser. A Math. Phys. Sci. 1951, 243, 299–358. [Google Scholar]
- Ghez, R. Coverage effects on the BCF surface diffusion model. J. Cryst. Growth 1974, 22, 333–334. [Google Scholar] [CrossRef]
- Faure, F.; Schiano, P.; Trolliard, G.; Nicollet, C.; Soulestin, B. Textural evolution of polyhedral olivine experiencing rapid cooling rates. Contrib. Mineral. Petrol. 2007, 153, 405–416. [Google Scholar] [CrossRef]
Figure 1.
Schematic illustrations of (a) the thermal traces of the samples and (b) the high-frequency induction furnace: 1. silica crucible, 2. magnesia lining, 3. induction coil, 4. vacuum meter, 5. thermocouple.
Figure 1.
Schematic illustrations of (a) the thermal traces of the samples and (b) the high-frequency induction furnace: 1. silica crucible, 2. magnesia lining, 3. induction coil, 4. vacuum meter, 5. thermocouple.

Figure 2.
Schematic representation of sampling locations in steel samples.

Figure 3.
Effect of cooling rate on the average size of inclusions of CaS.
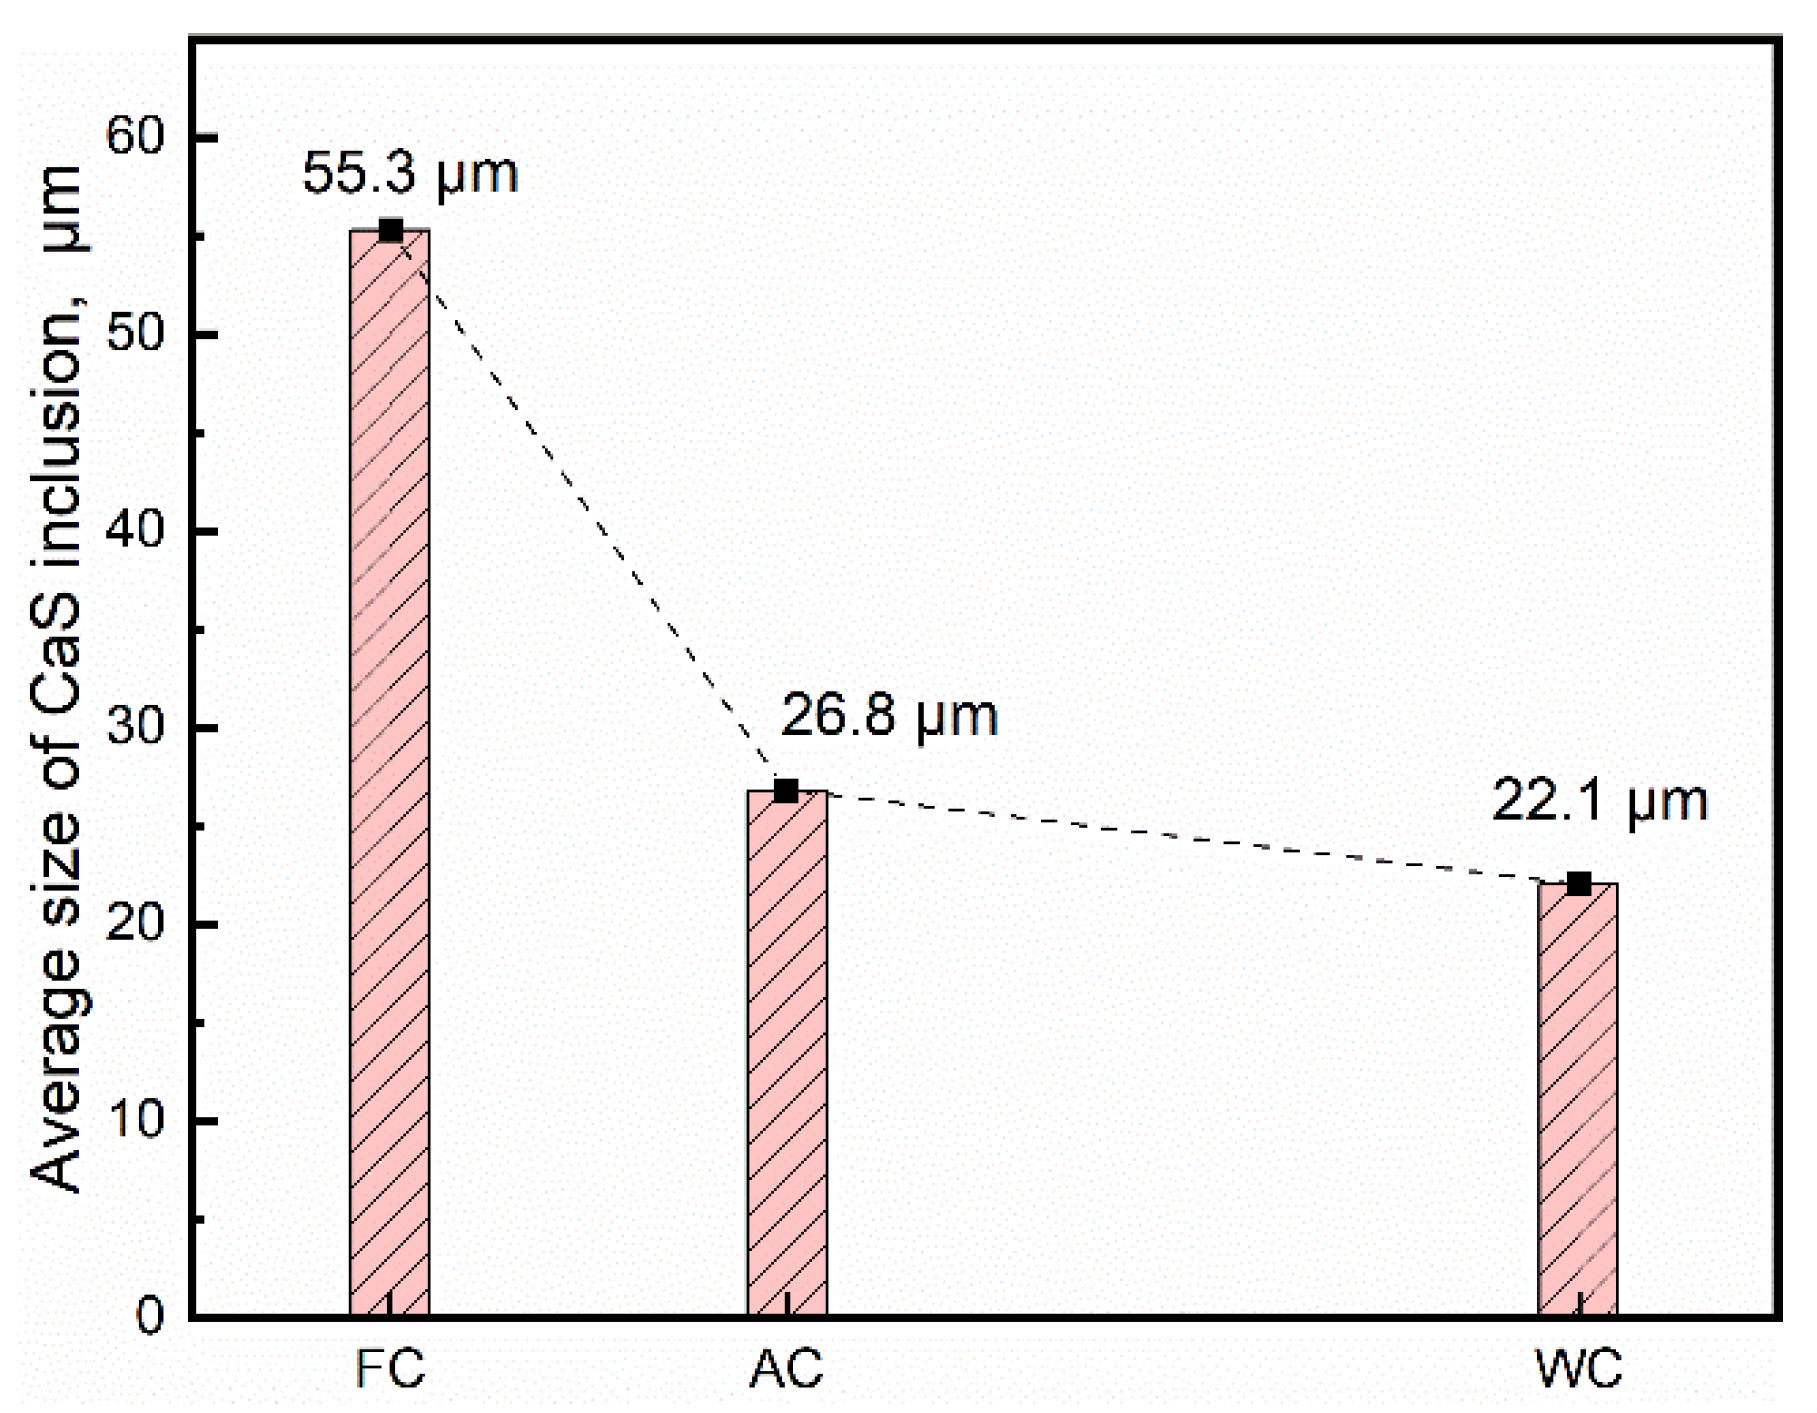
Figure 4.
Effect of cooling rate on (a) S and (b) Ca content in the residual liquid.
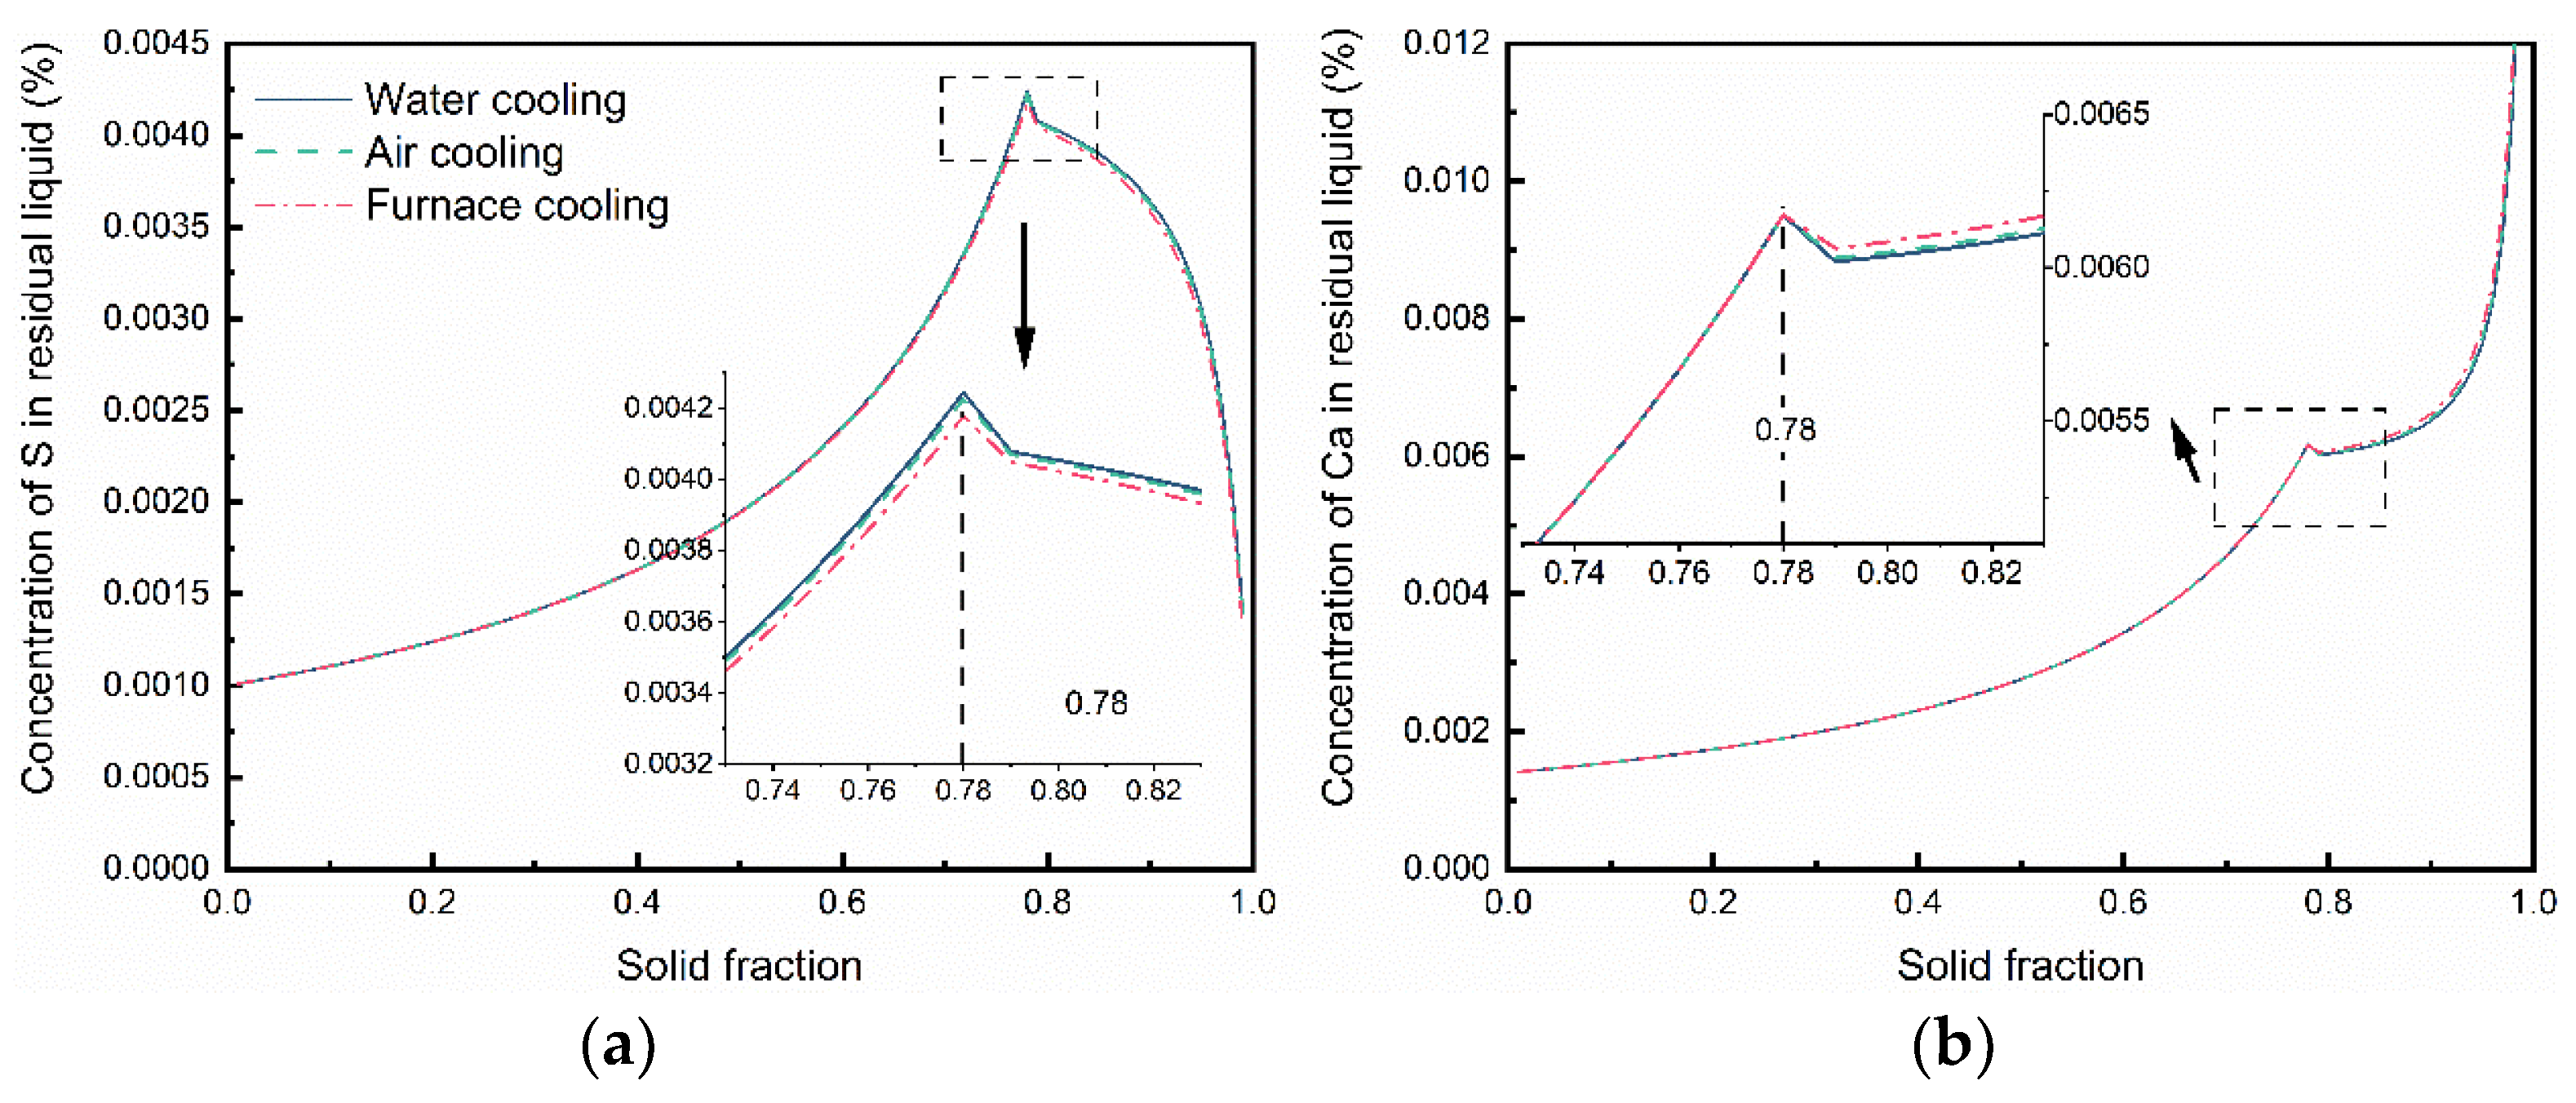
Figure 5.
The solubility product and the weight percentage of CaS precipitation during solidification of Invar alloy.
Figure 5.
The solubility product and the weight percentage of CaS precipitation during solidification of Invar alloy.
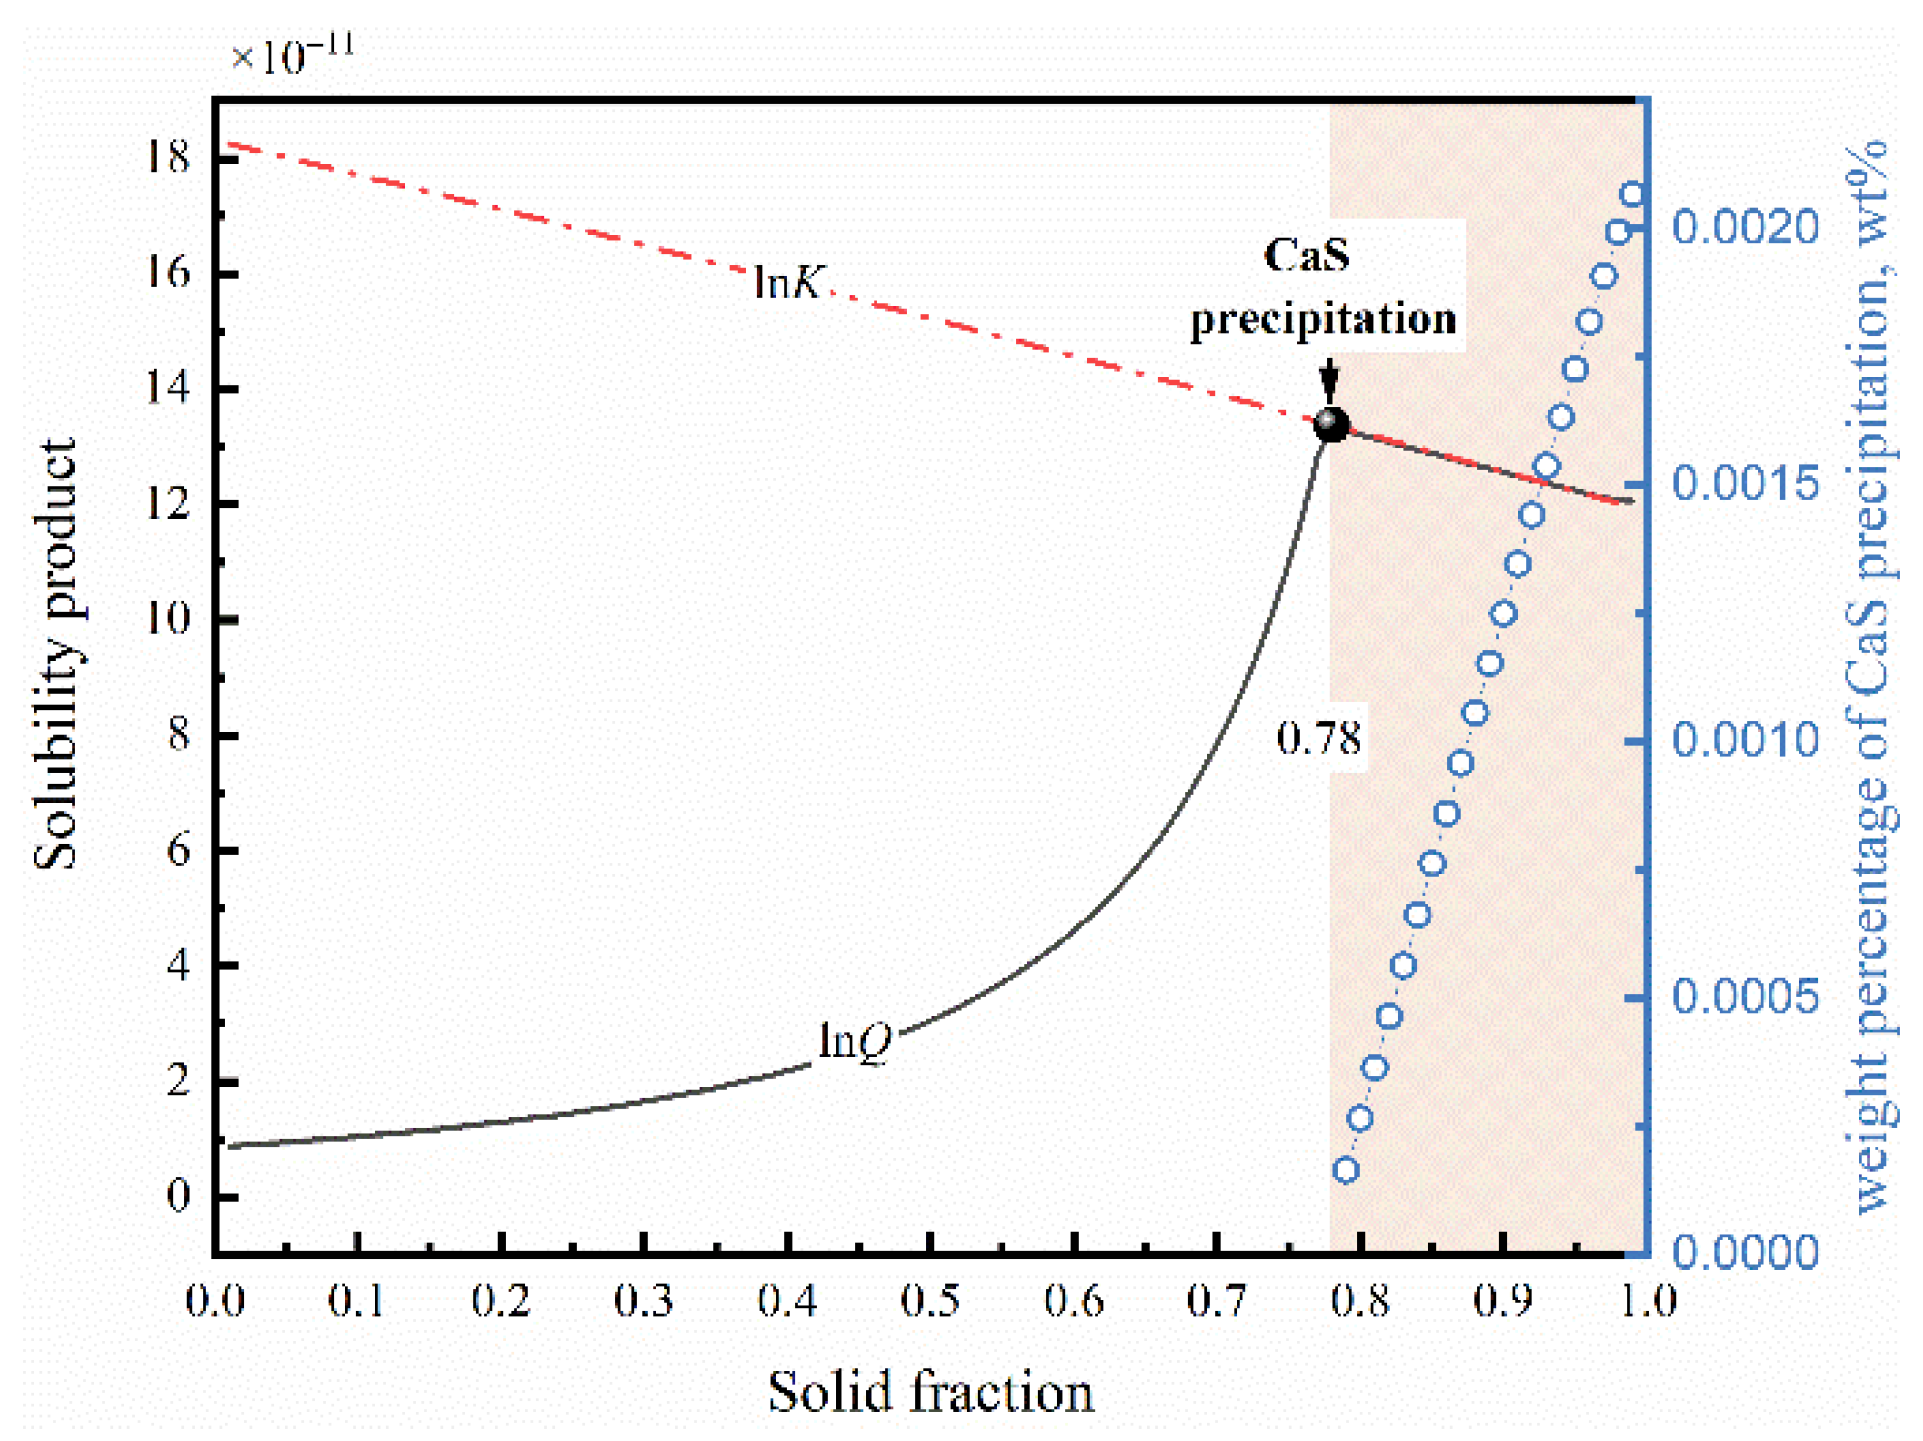
Figure 6.
The characteristics following inclusions of CaS under water-cooling conditions. (a) The three-dimensional morphology following inclusions of CaS. (b) The EDS spectra and mapping of particle B.
Figure 6.
The characteristics following inclusions of CaS under water-cooling conditions. (a) The three-dimensional morphology following inclusions of CaS. (b) The EDS spectra and mapping of particle B.
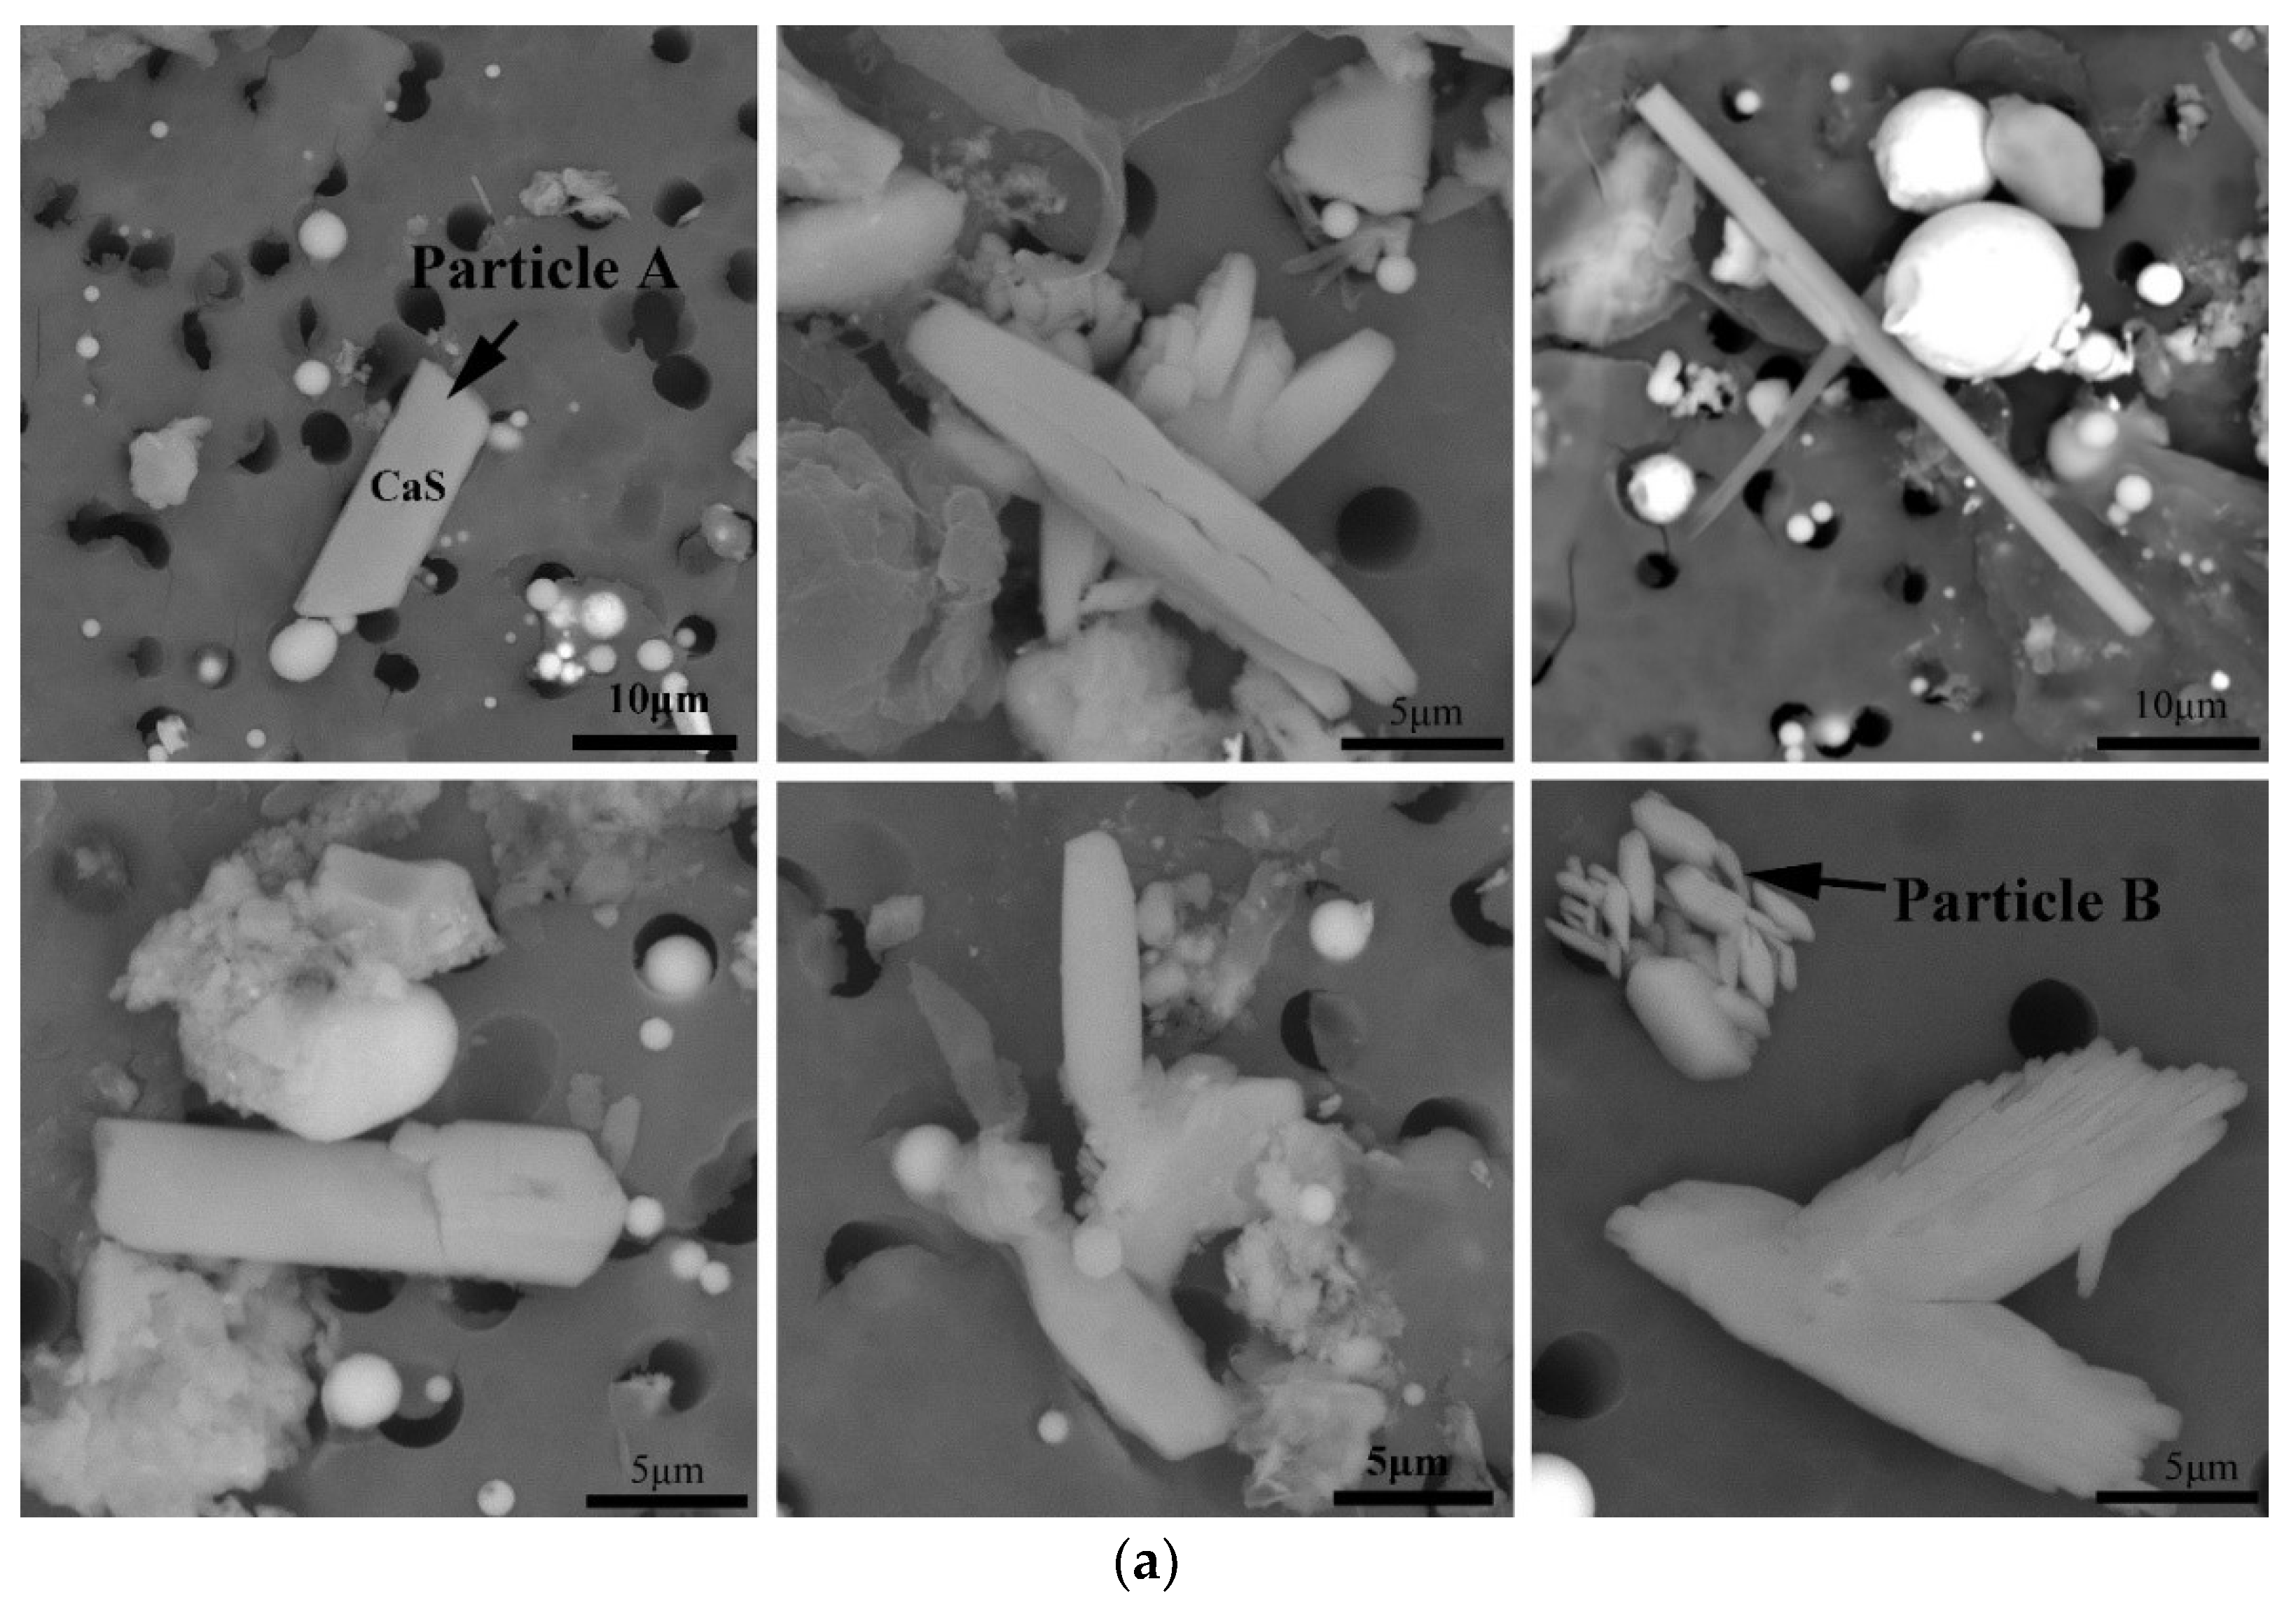
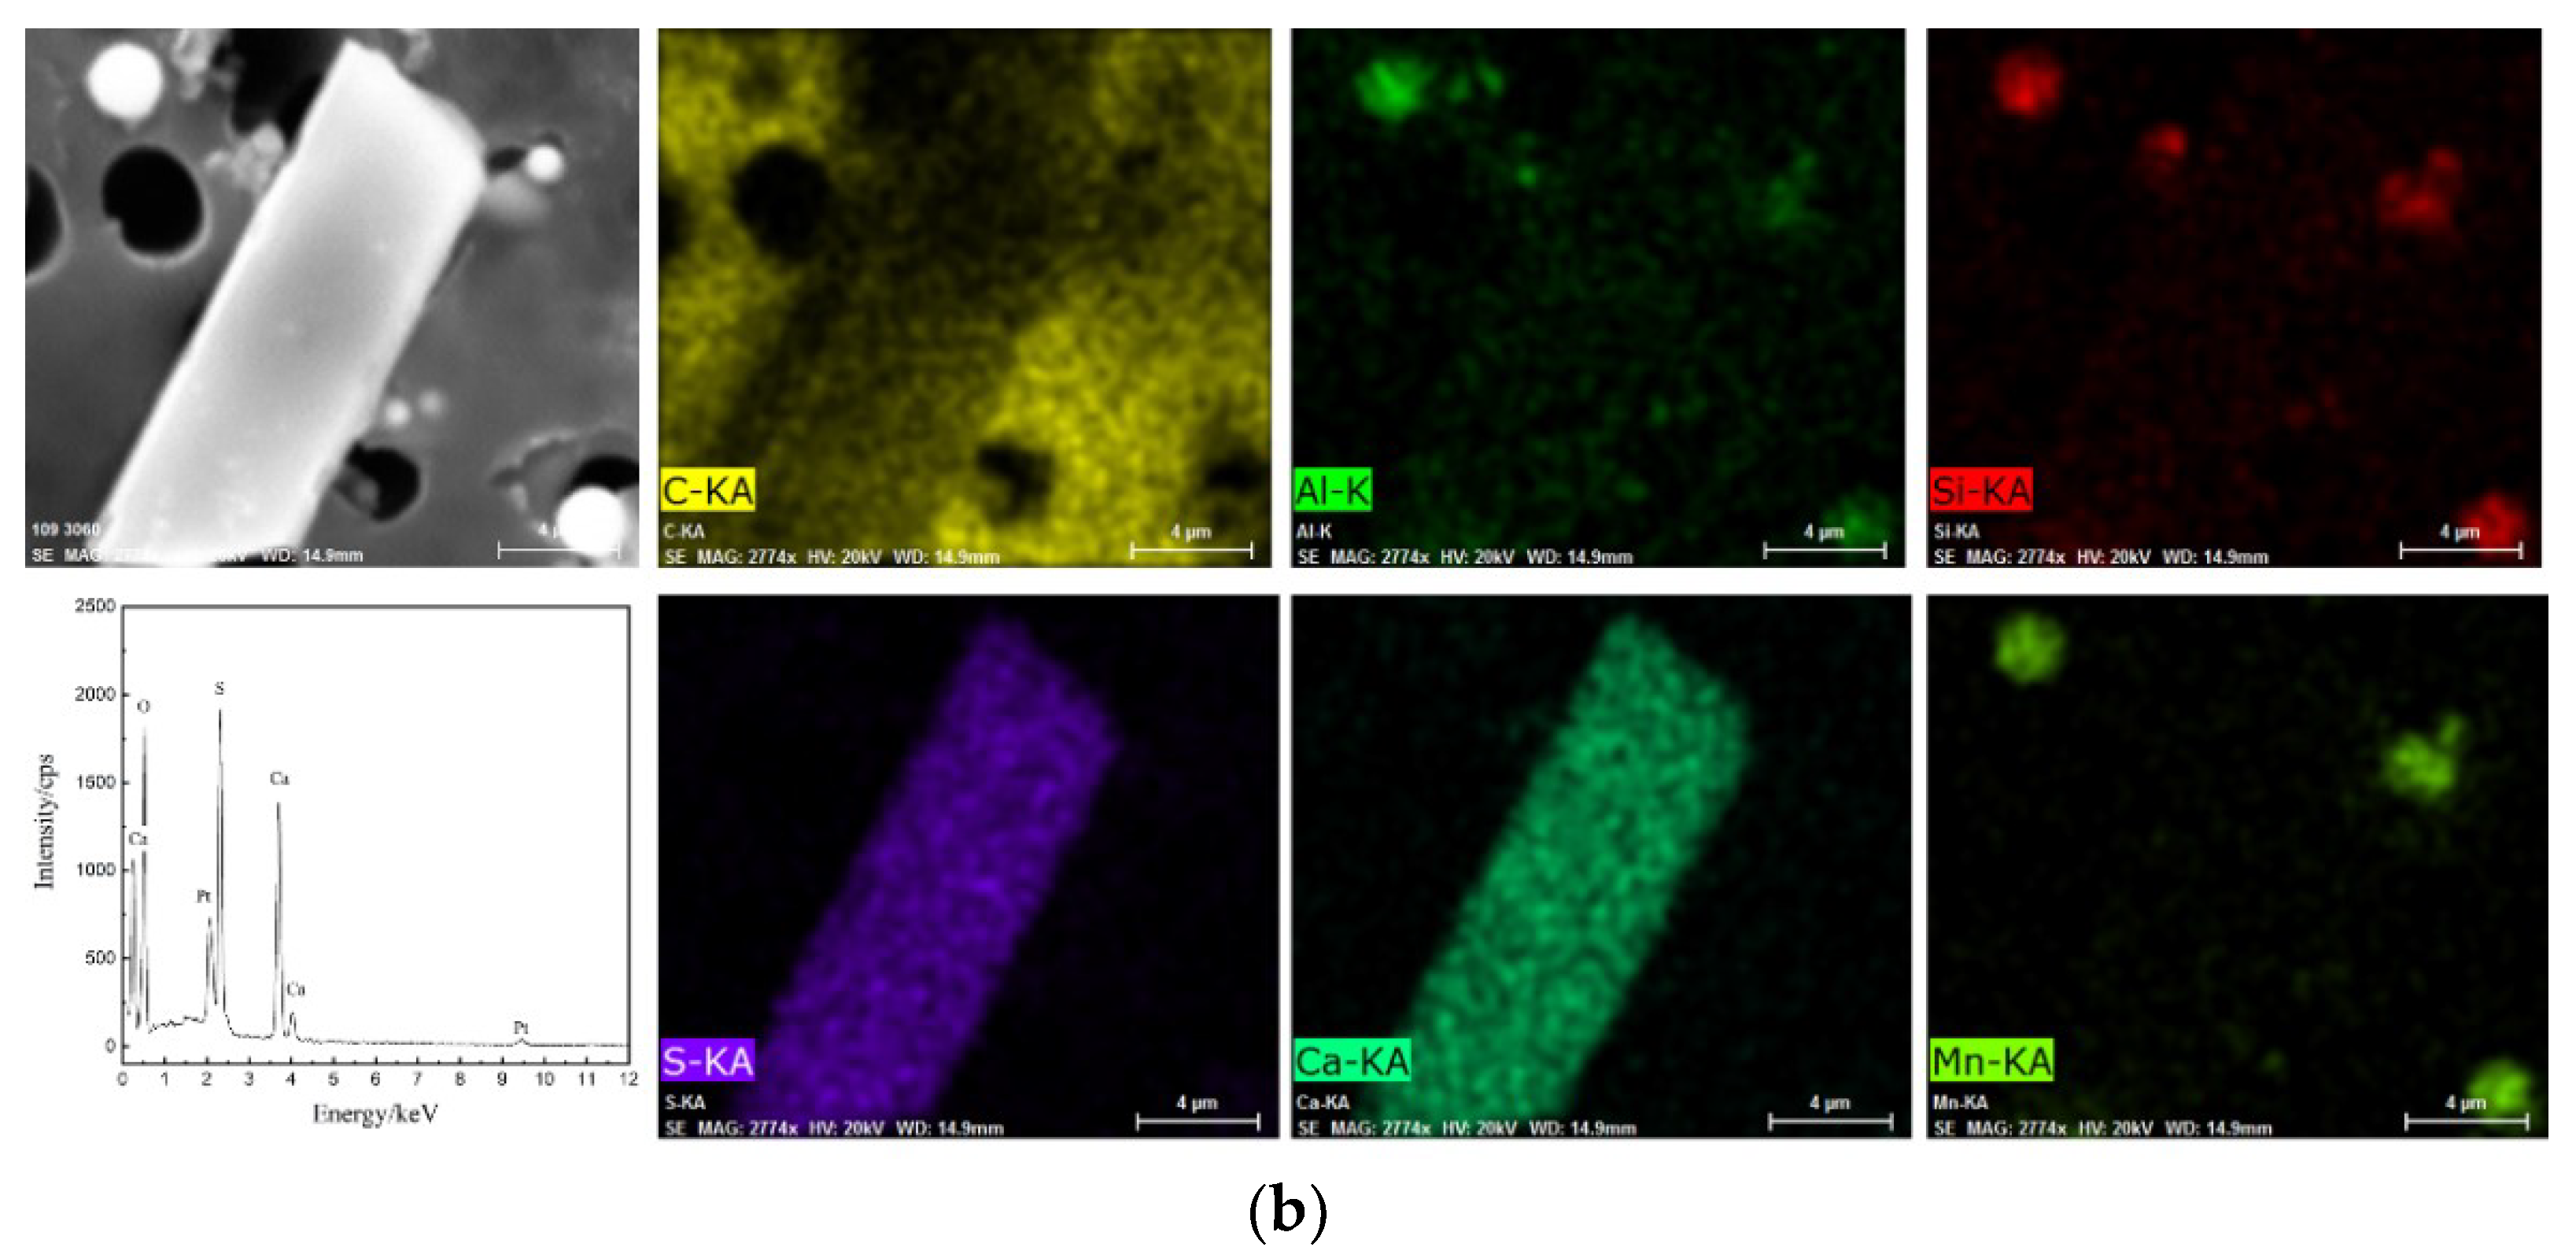
Figure 7.
The three-dimensional morphology following inclusions of CaS under air-cooling conditions.
Figure 7.
The three-dimensional morphology following inclusions of CaS under air-cooling conditions.
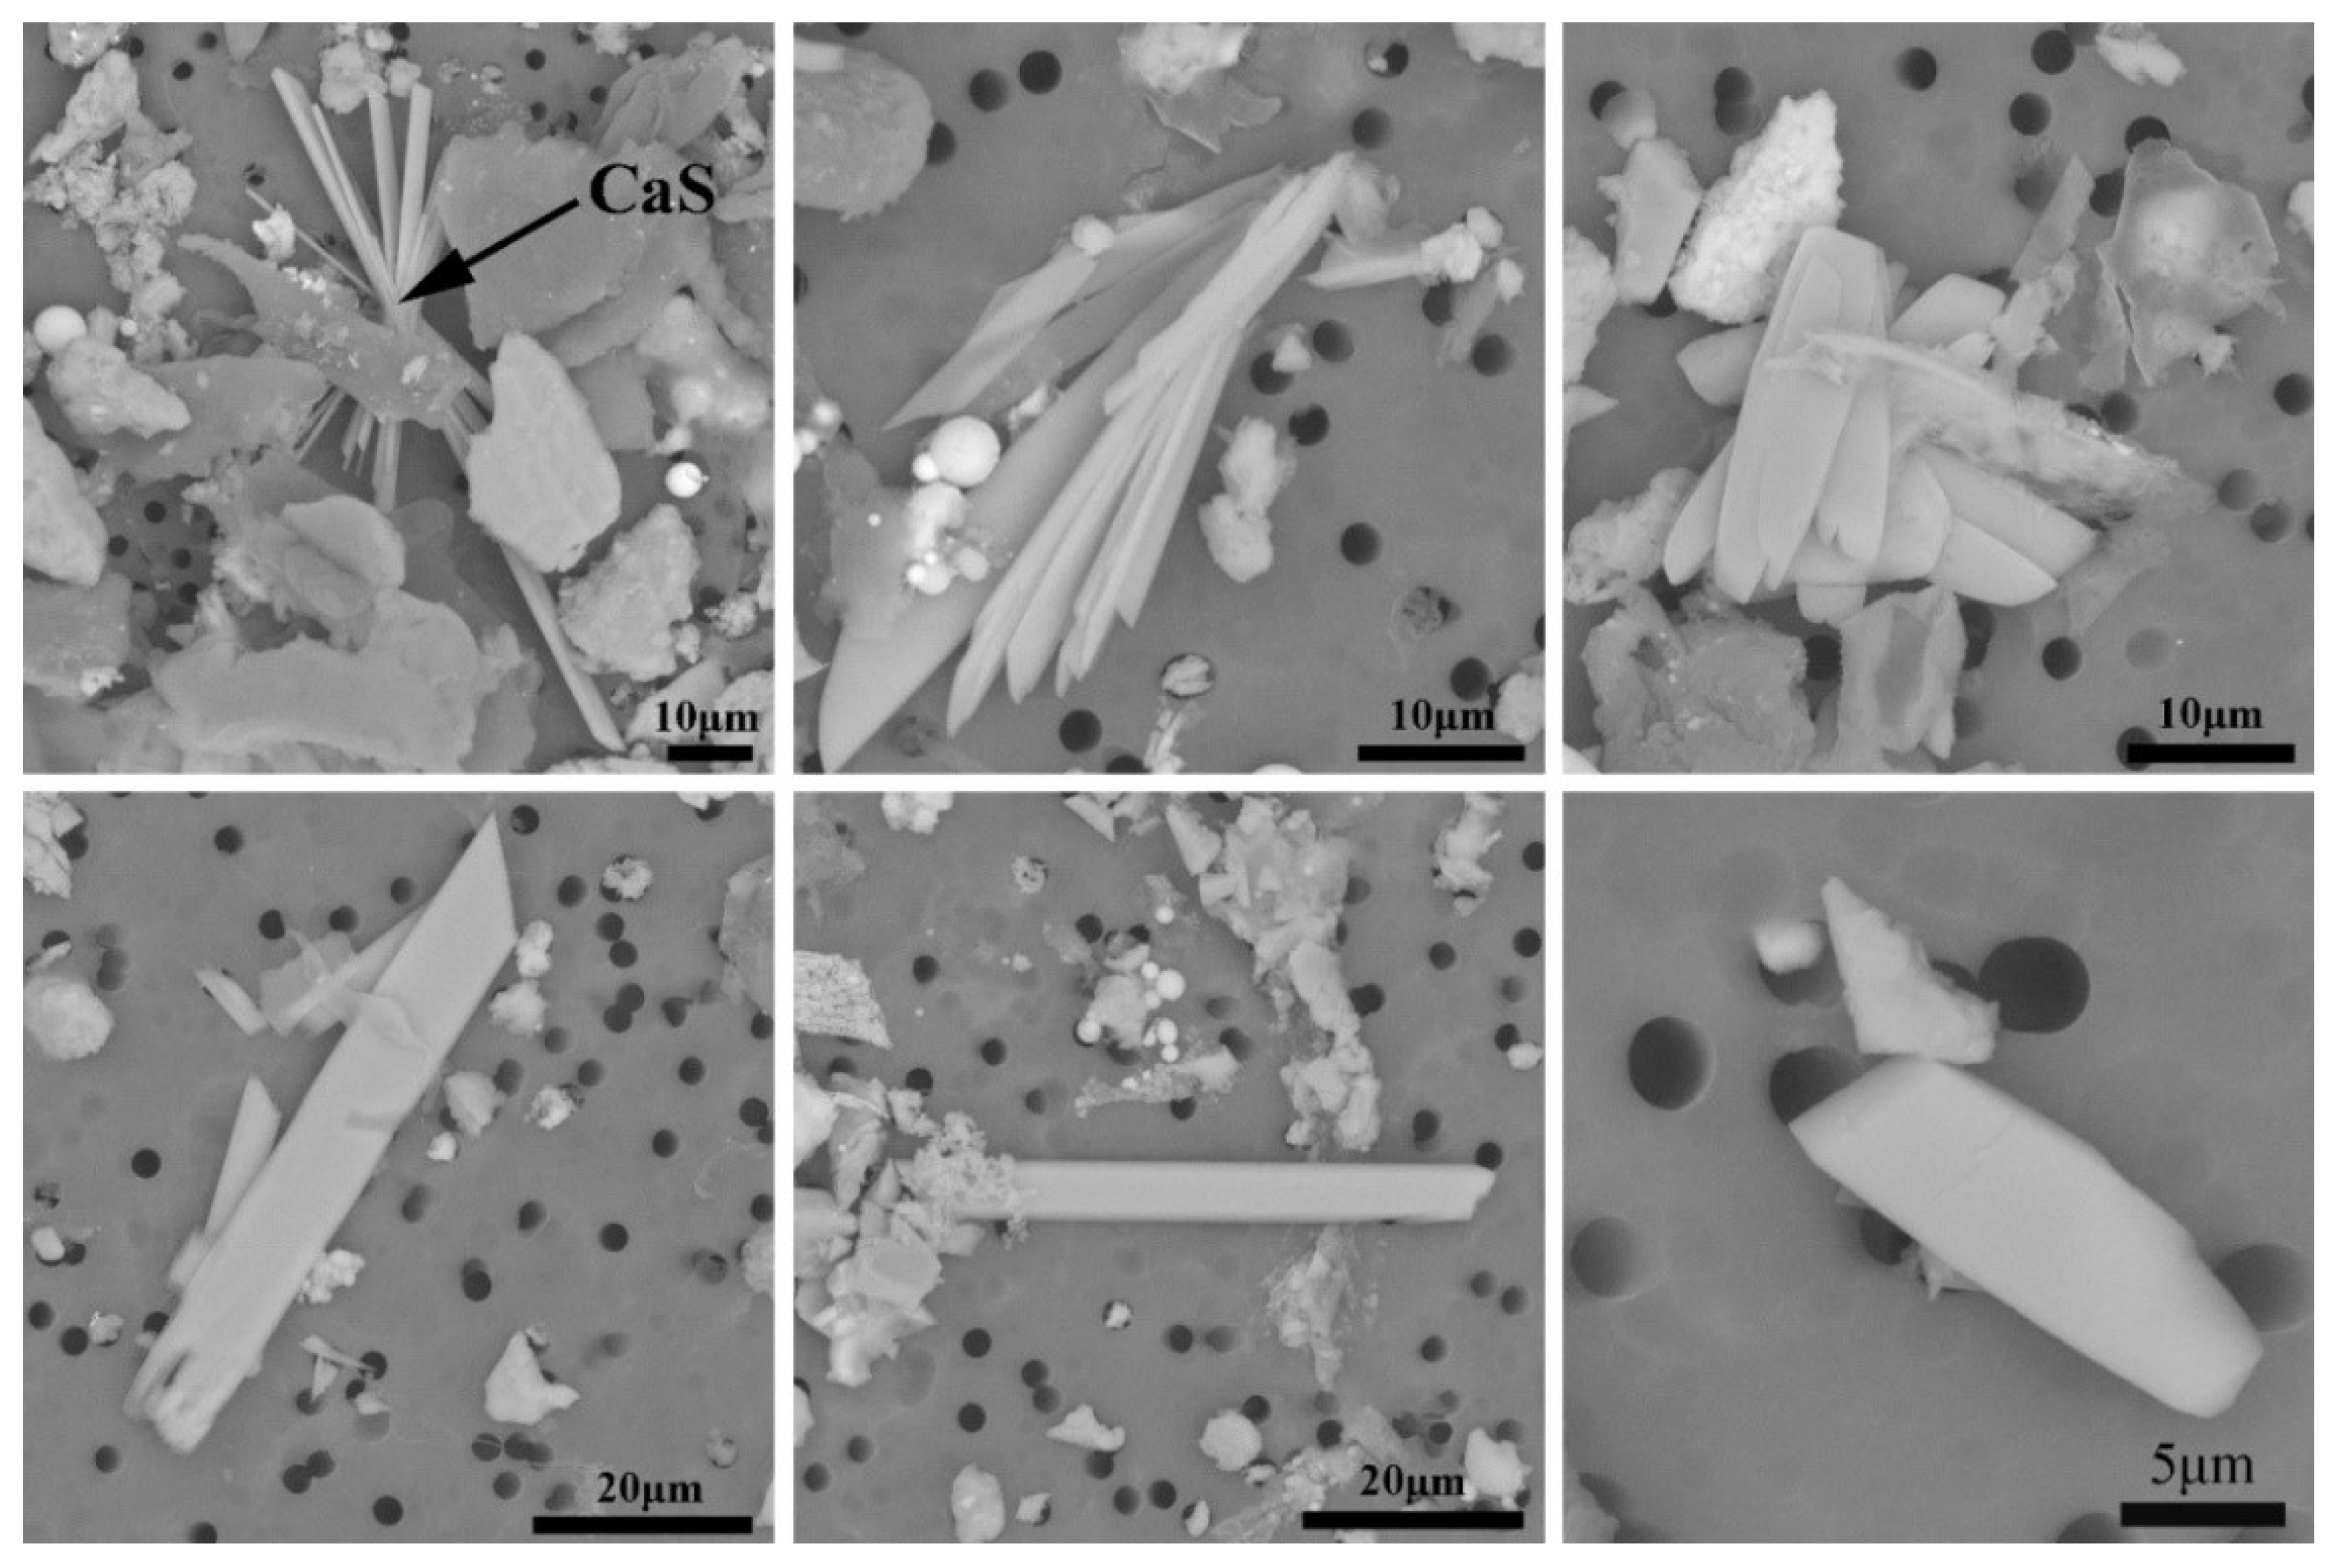
Figure 8.
Three-dimensional morphology following inclusions of CaS under furnace-cooling conditions.
Figure 8.
Three-dimensional morphology following inclusions of CaS under furnace-cooling conditions.
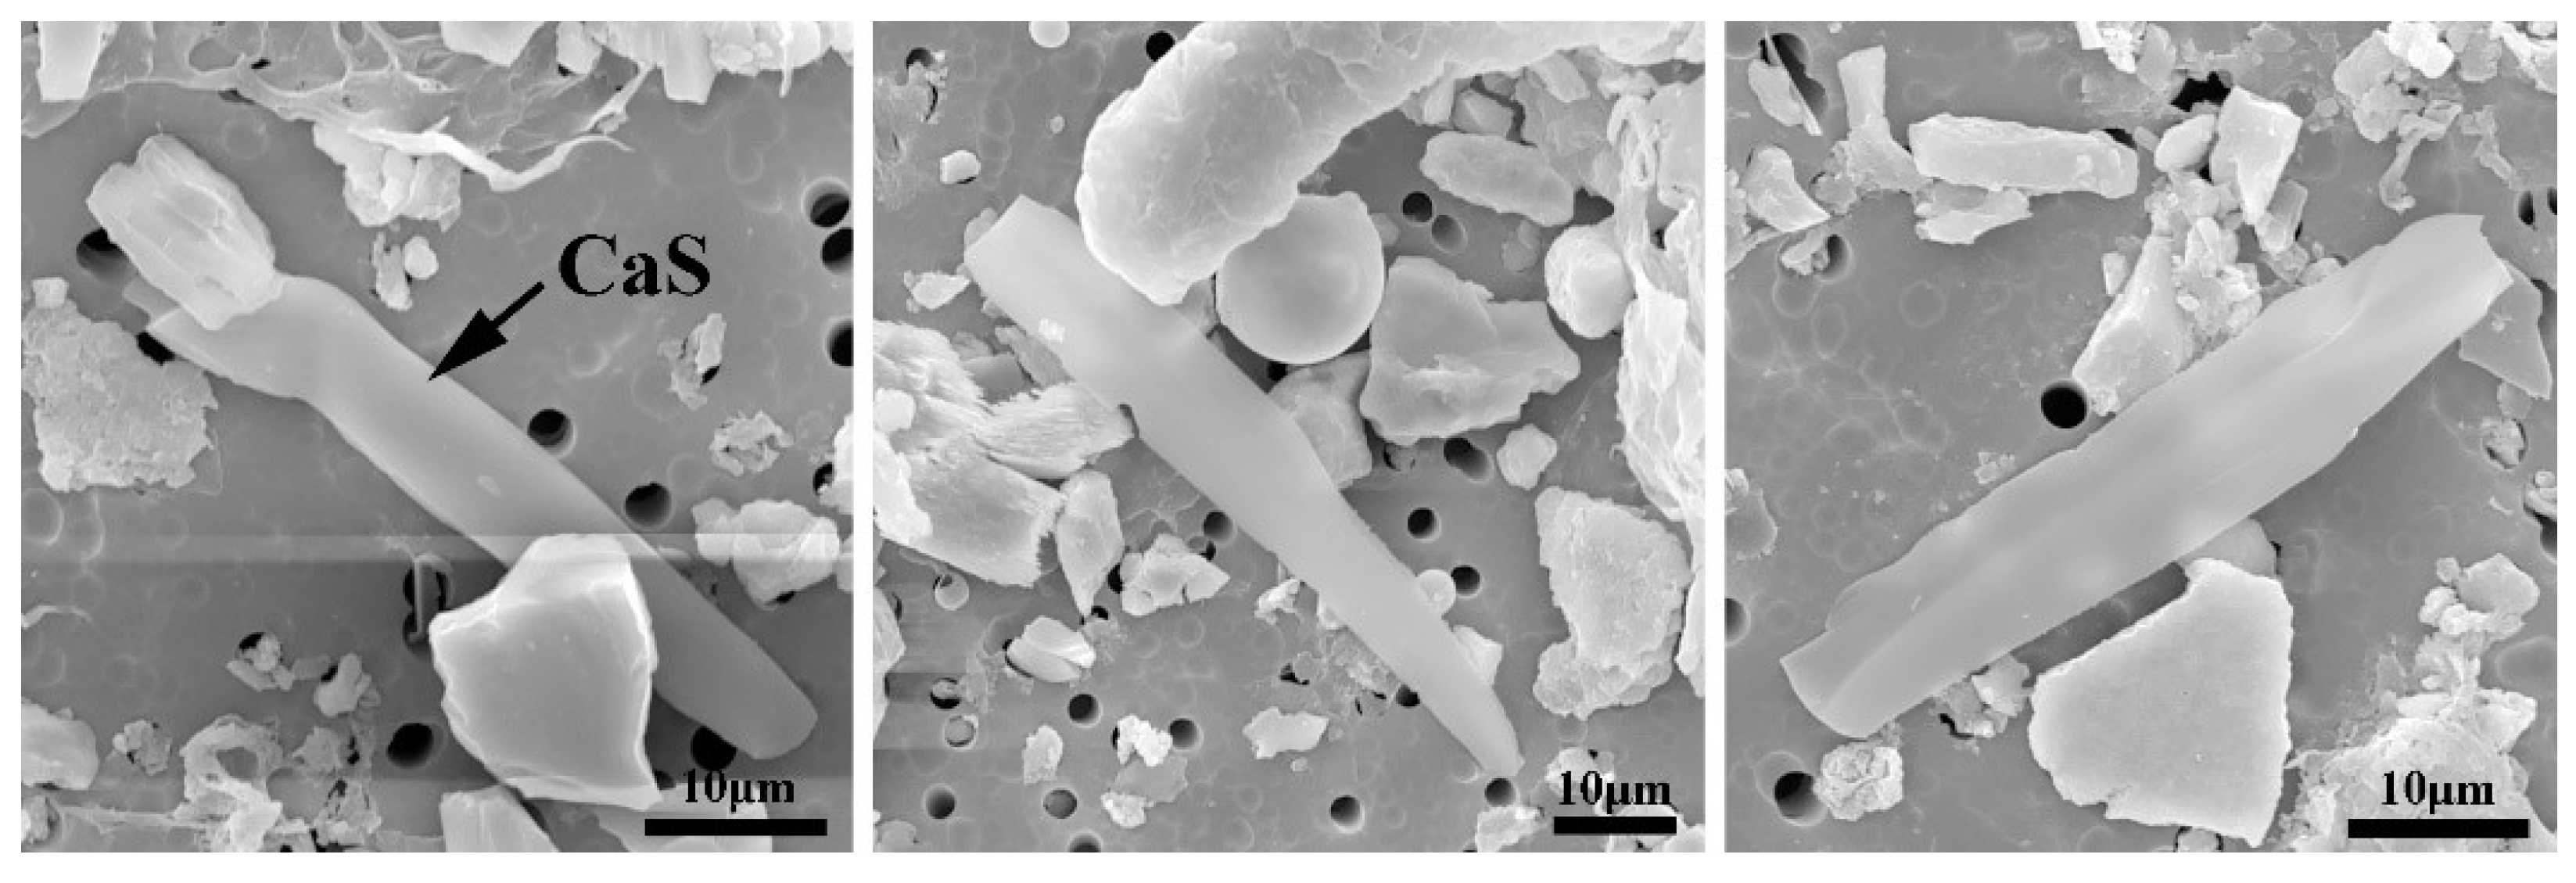
Figure 9.
Schematic diagram of the morphology of CaS inclusion under different cooling rates.
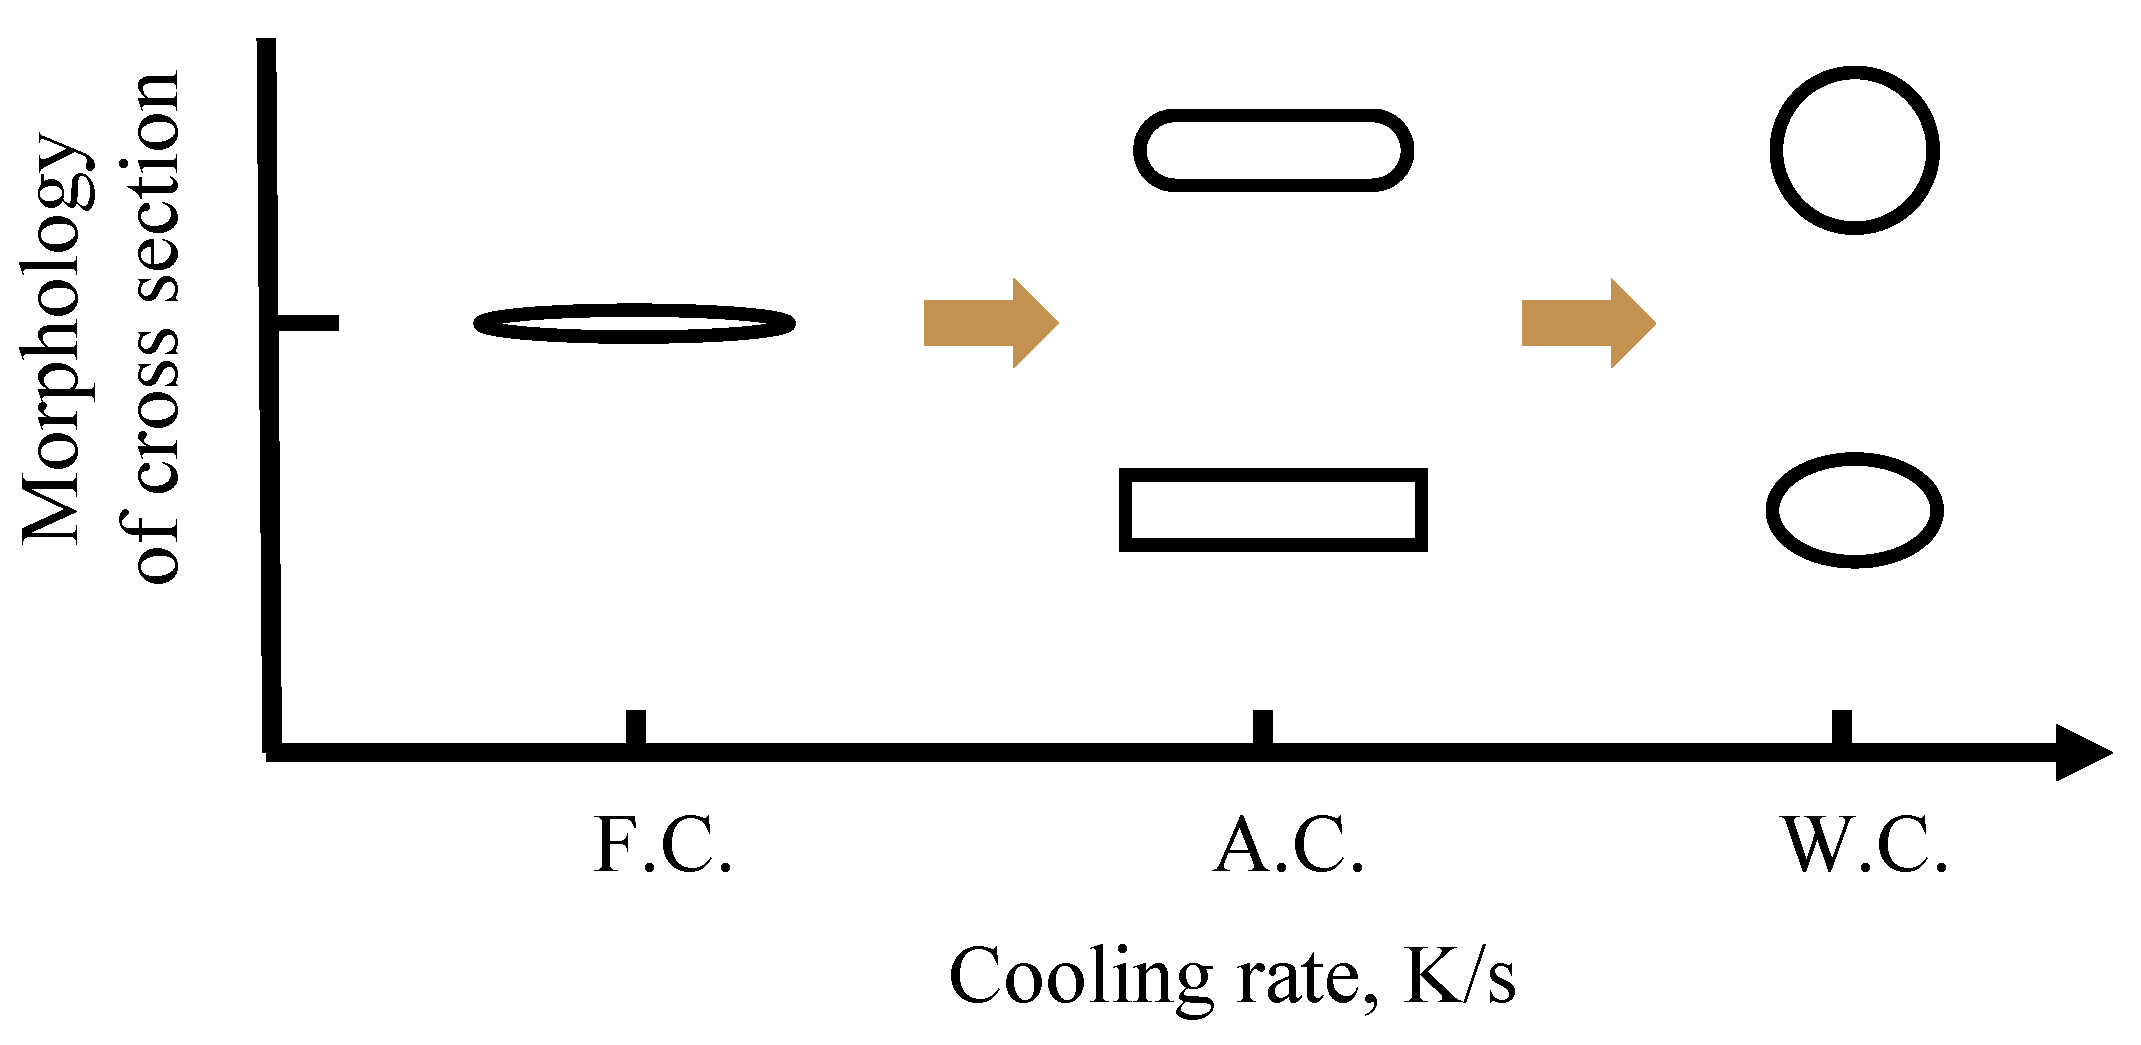
Figure 10.
Sulfide inclusions at high S content. (a) [S%] = 0.007; (b) [S%] = 0.017.
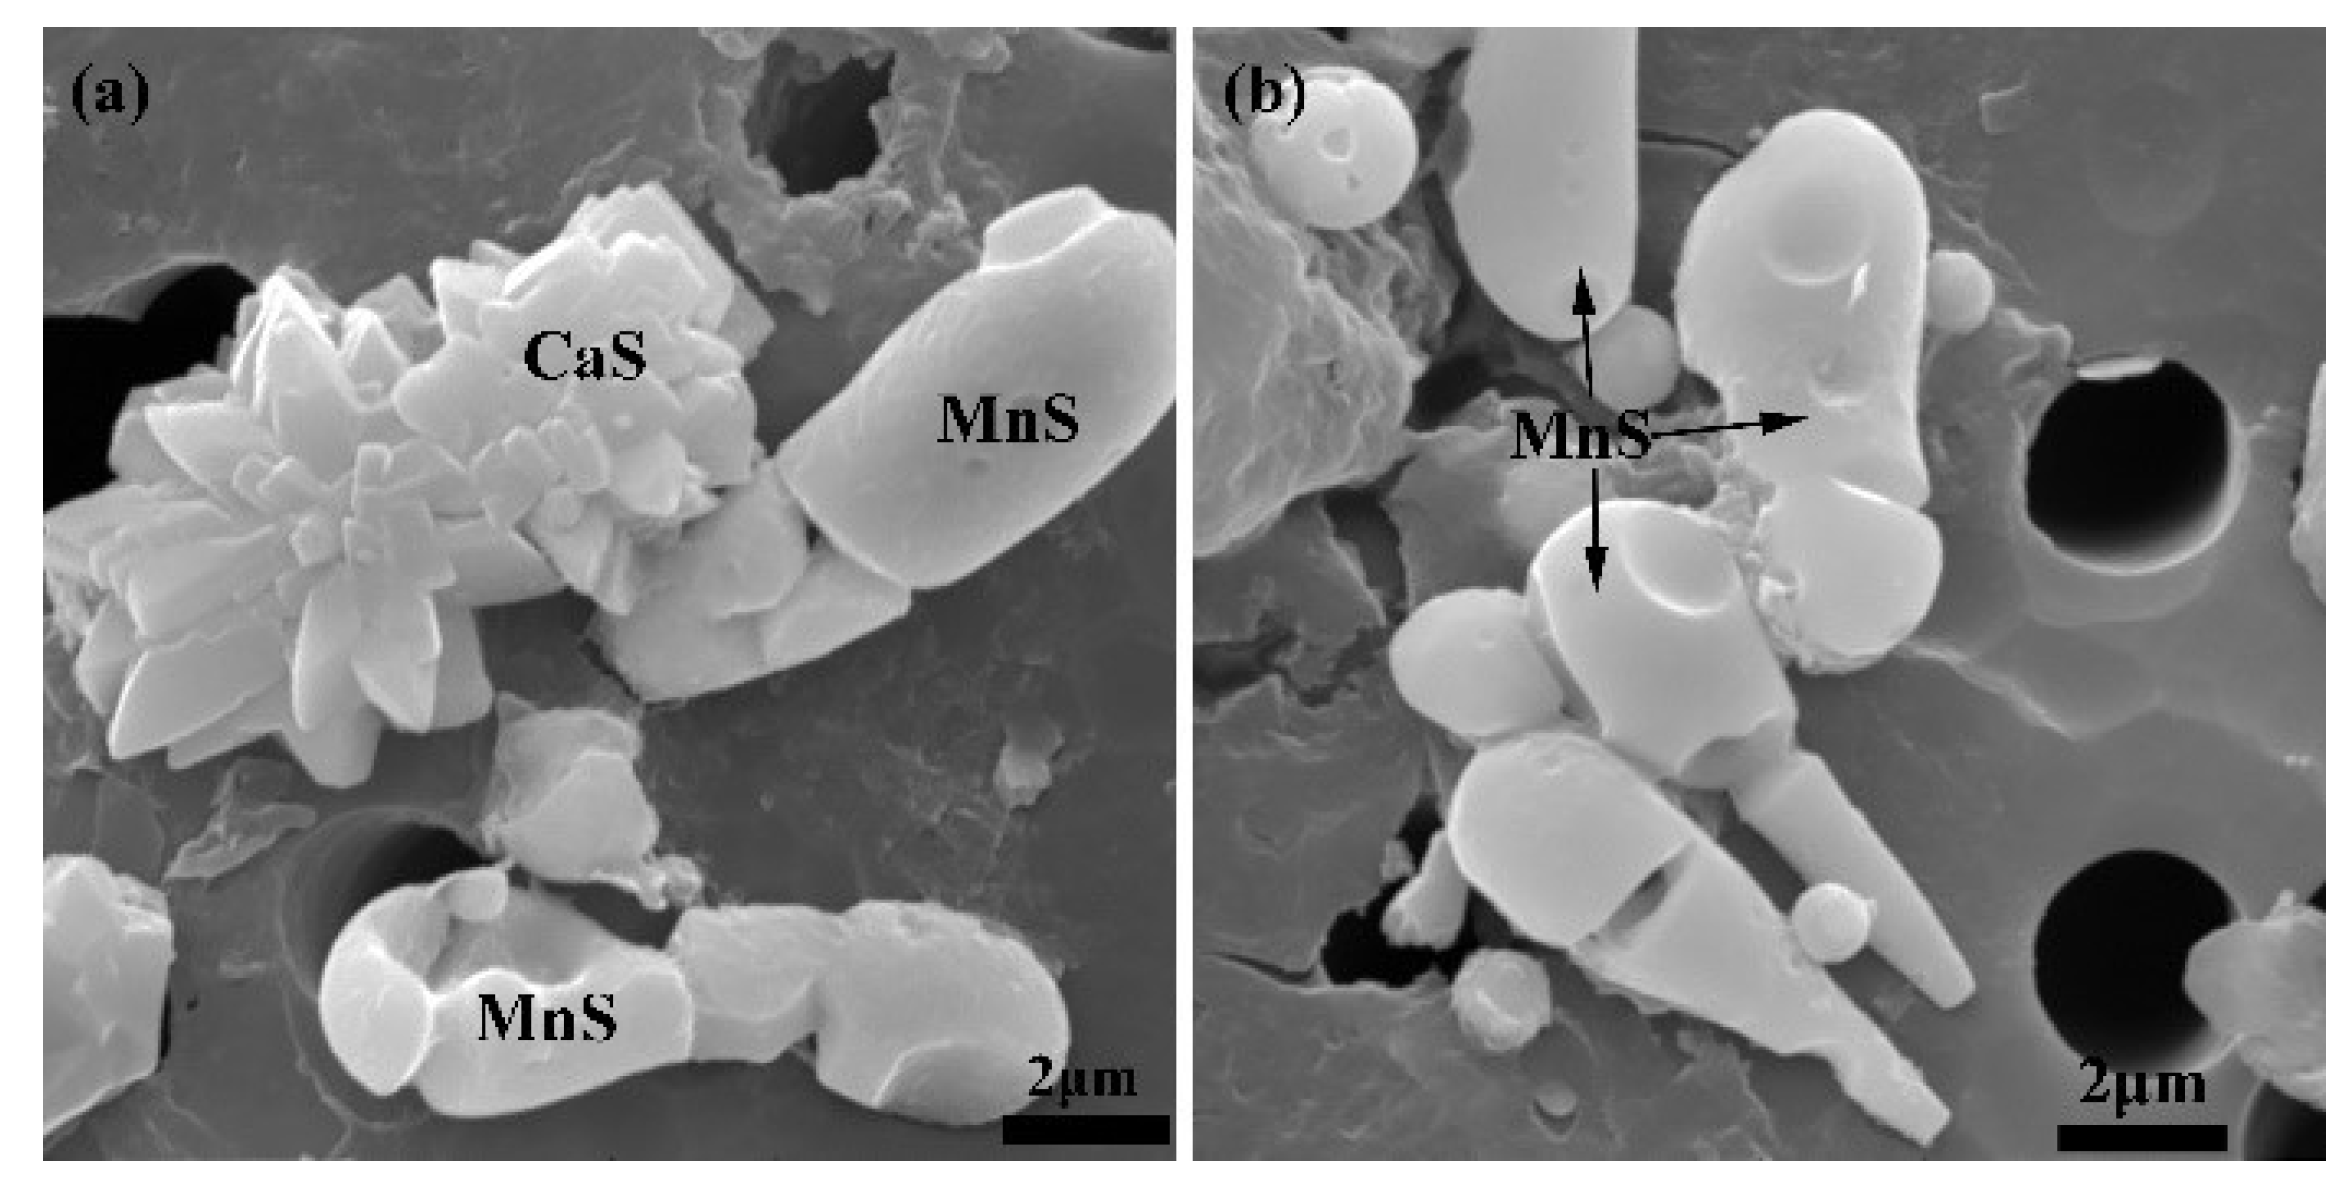
Figure 11.
Schematic diagram of the relationship between supersaturation and growth rate for different growth mechanisms. (a) BCF model. (b) VKS model. (c) Continuous growth model. σ* is the transition point between (a) and (b), σ** is the transition point between (b) and (c).
Figure 11.
Schematic diagram of the relationship between supersaturation and growth rate for different growth mechanisms. (a) BCF model. (b) VKS model. (c) Continuous growth model. σ* is the transition point between (a) and (b), σ** is the transition point between (b) and (c).
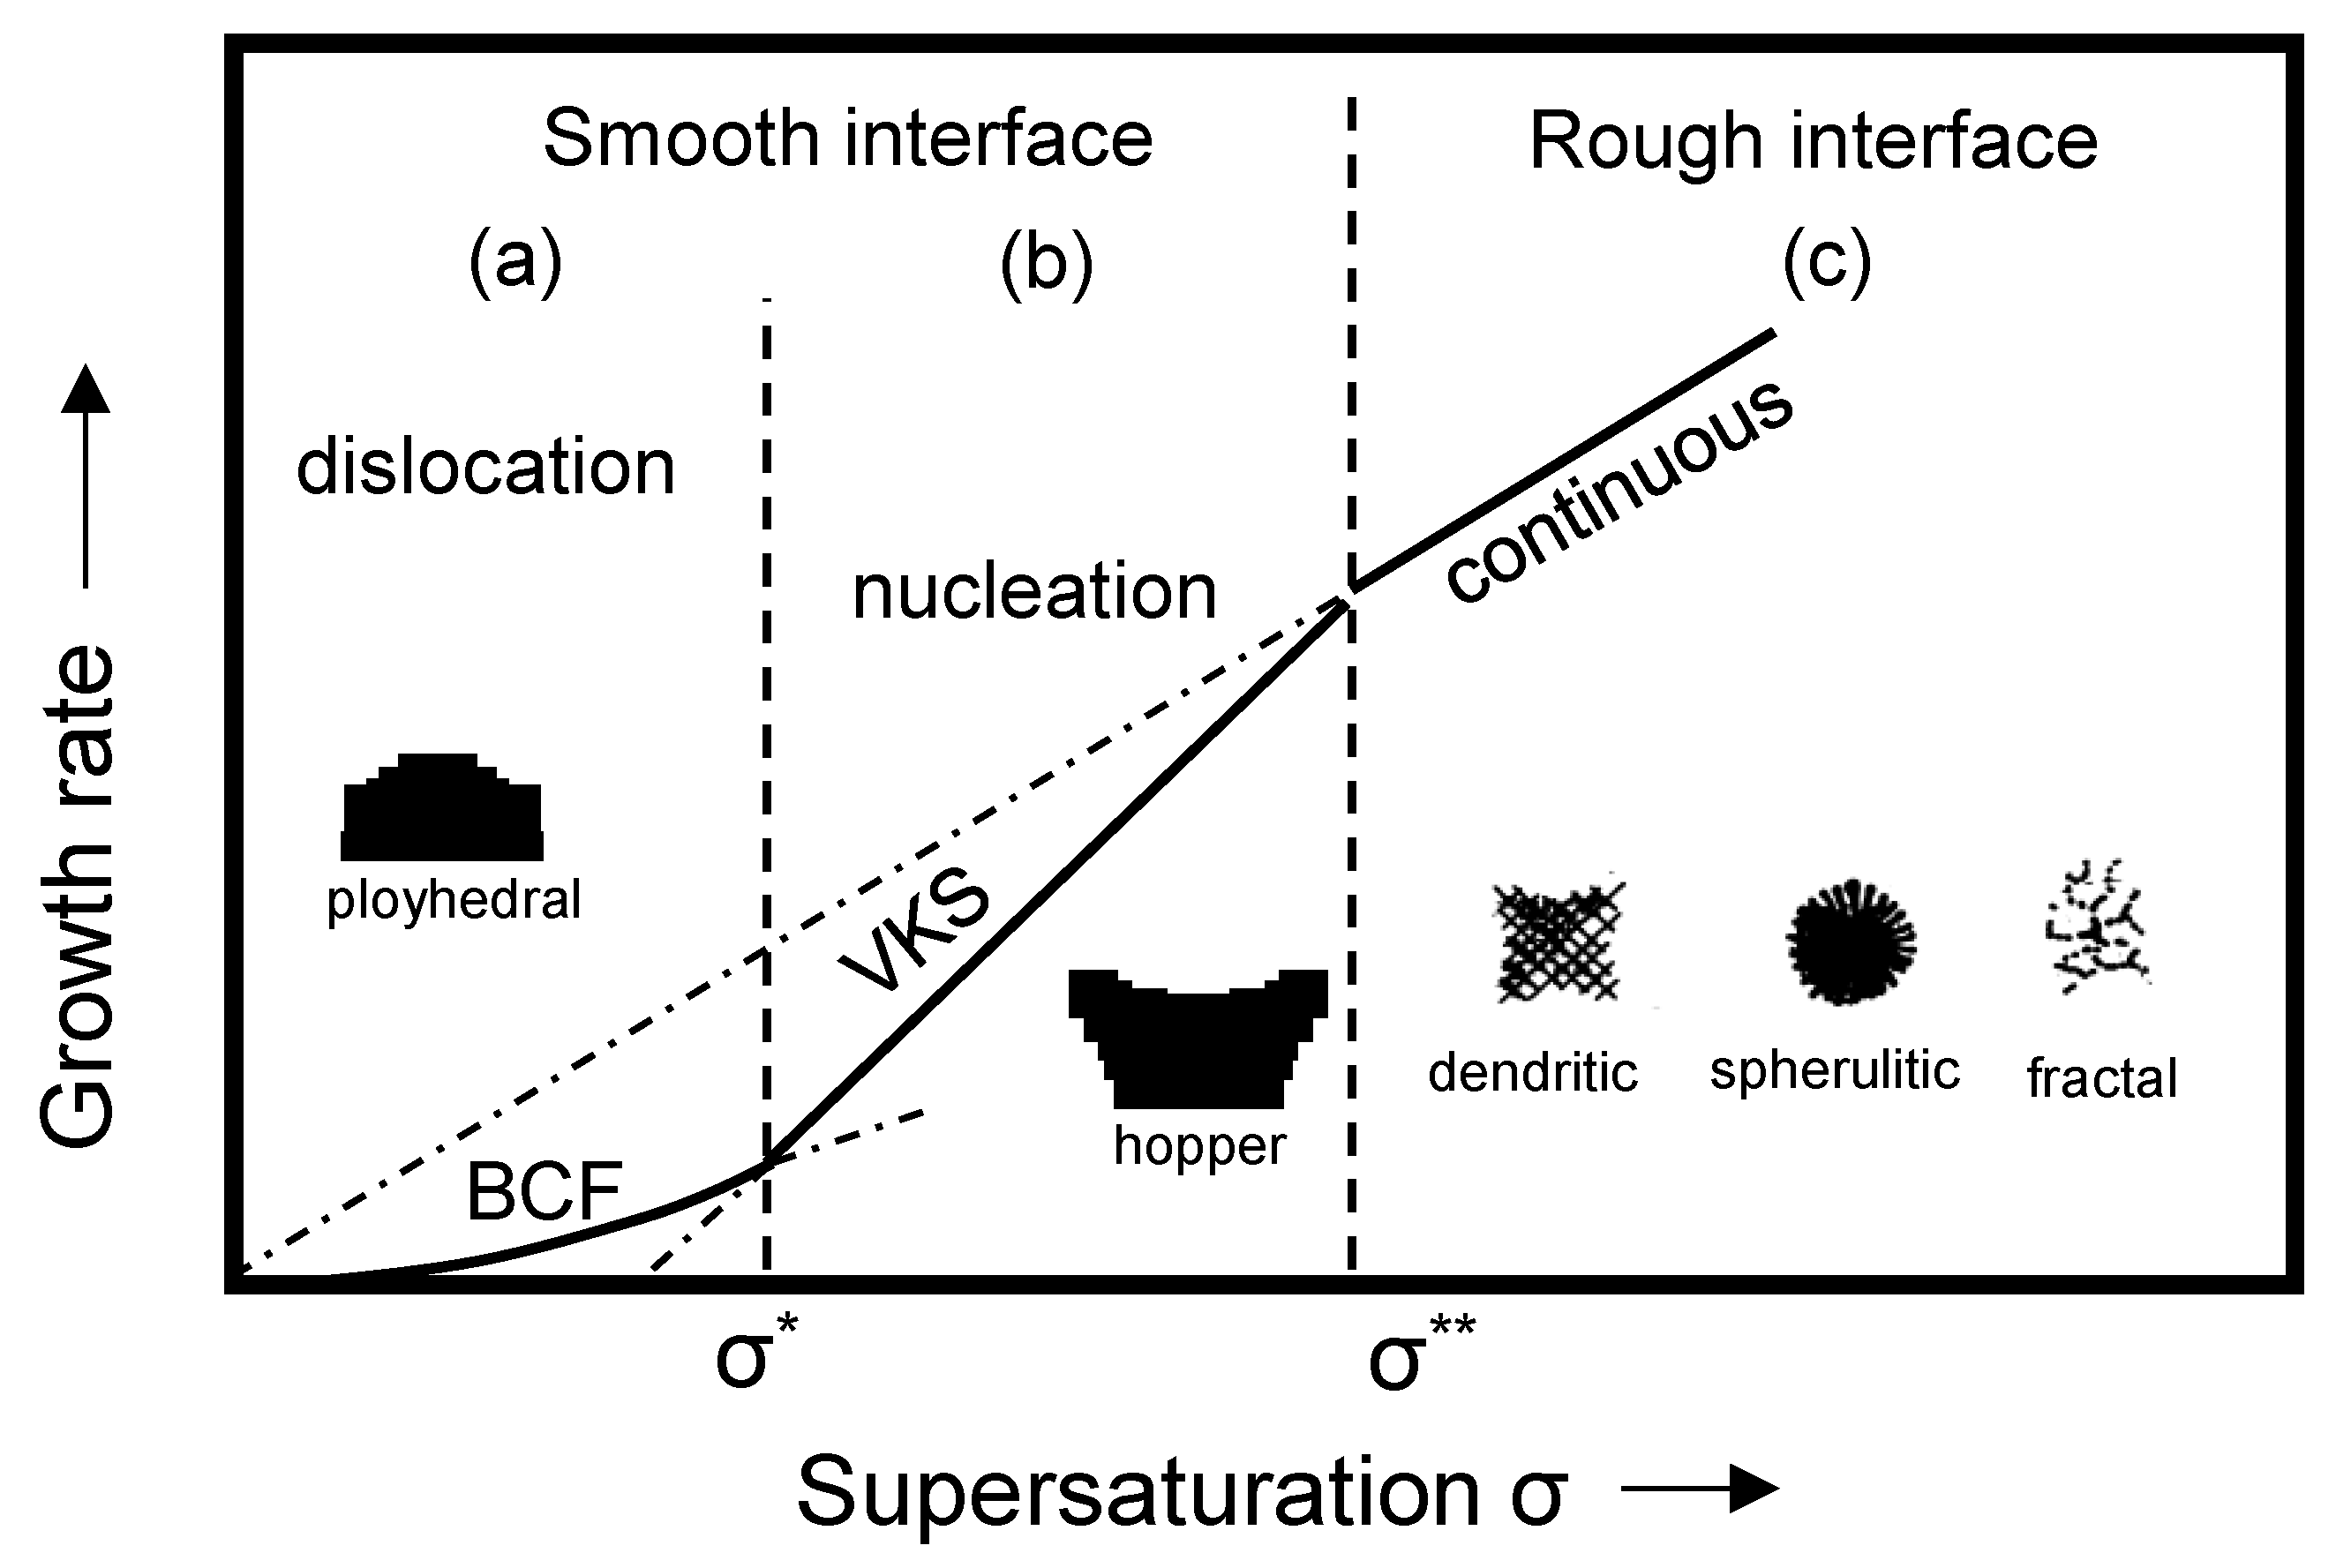
Figure 12.
The morphologies of CaS inclusion at S content of 0.001%. F: flat interface; P: polyhedral morphology; S: spiral growth.
Figure 12.
The morphologies of CaS inclusion at S content of 0.001%. F: flat interface; P: polyhedral morphology; S: spiral growth.

Figure 13.
The morphologies of CaS inclusion at S content of 0.007%. F: flat interface; H: hopper morphology; L: layer growth; R: rough interface. (a,b). Hopper morphology CaS with flat interface. (c,d) layer growth CaS with rough interface.
Figure 13.
The morphologies of CaS inclusion at S content of 0.007%. F: flat interface; H: hopper morphology; L: layer growth; R: rough interface. (a,b). Hopper morphology CaS with flat interface. (c,d) layer growth CaS with rough interface.
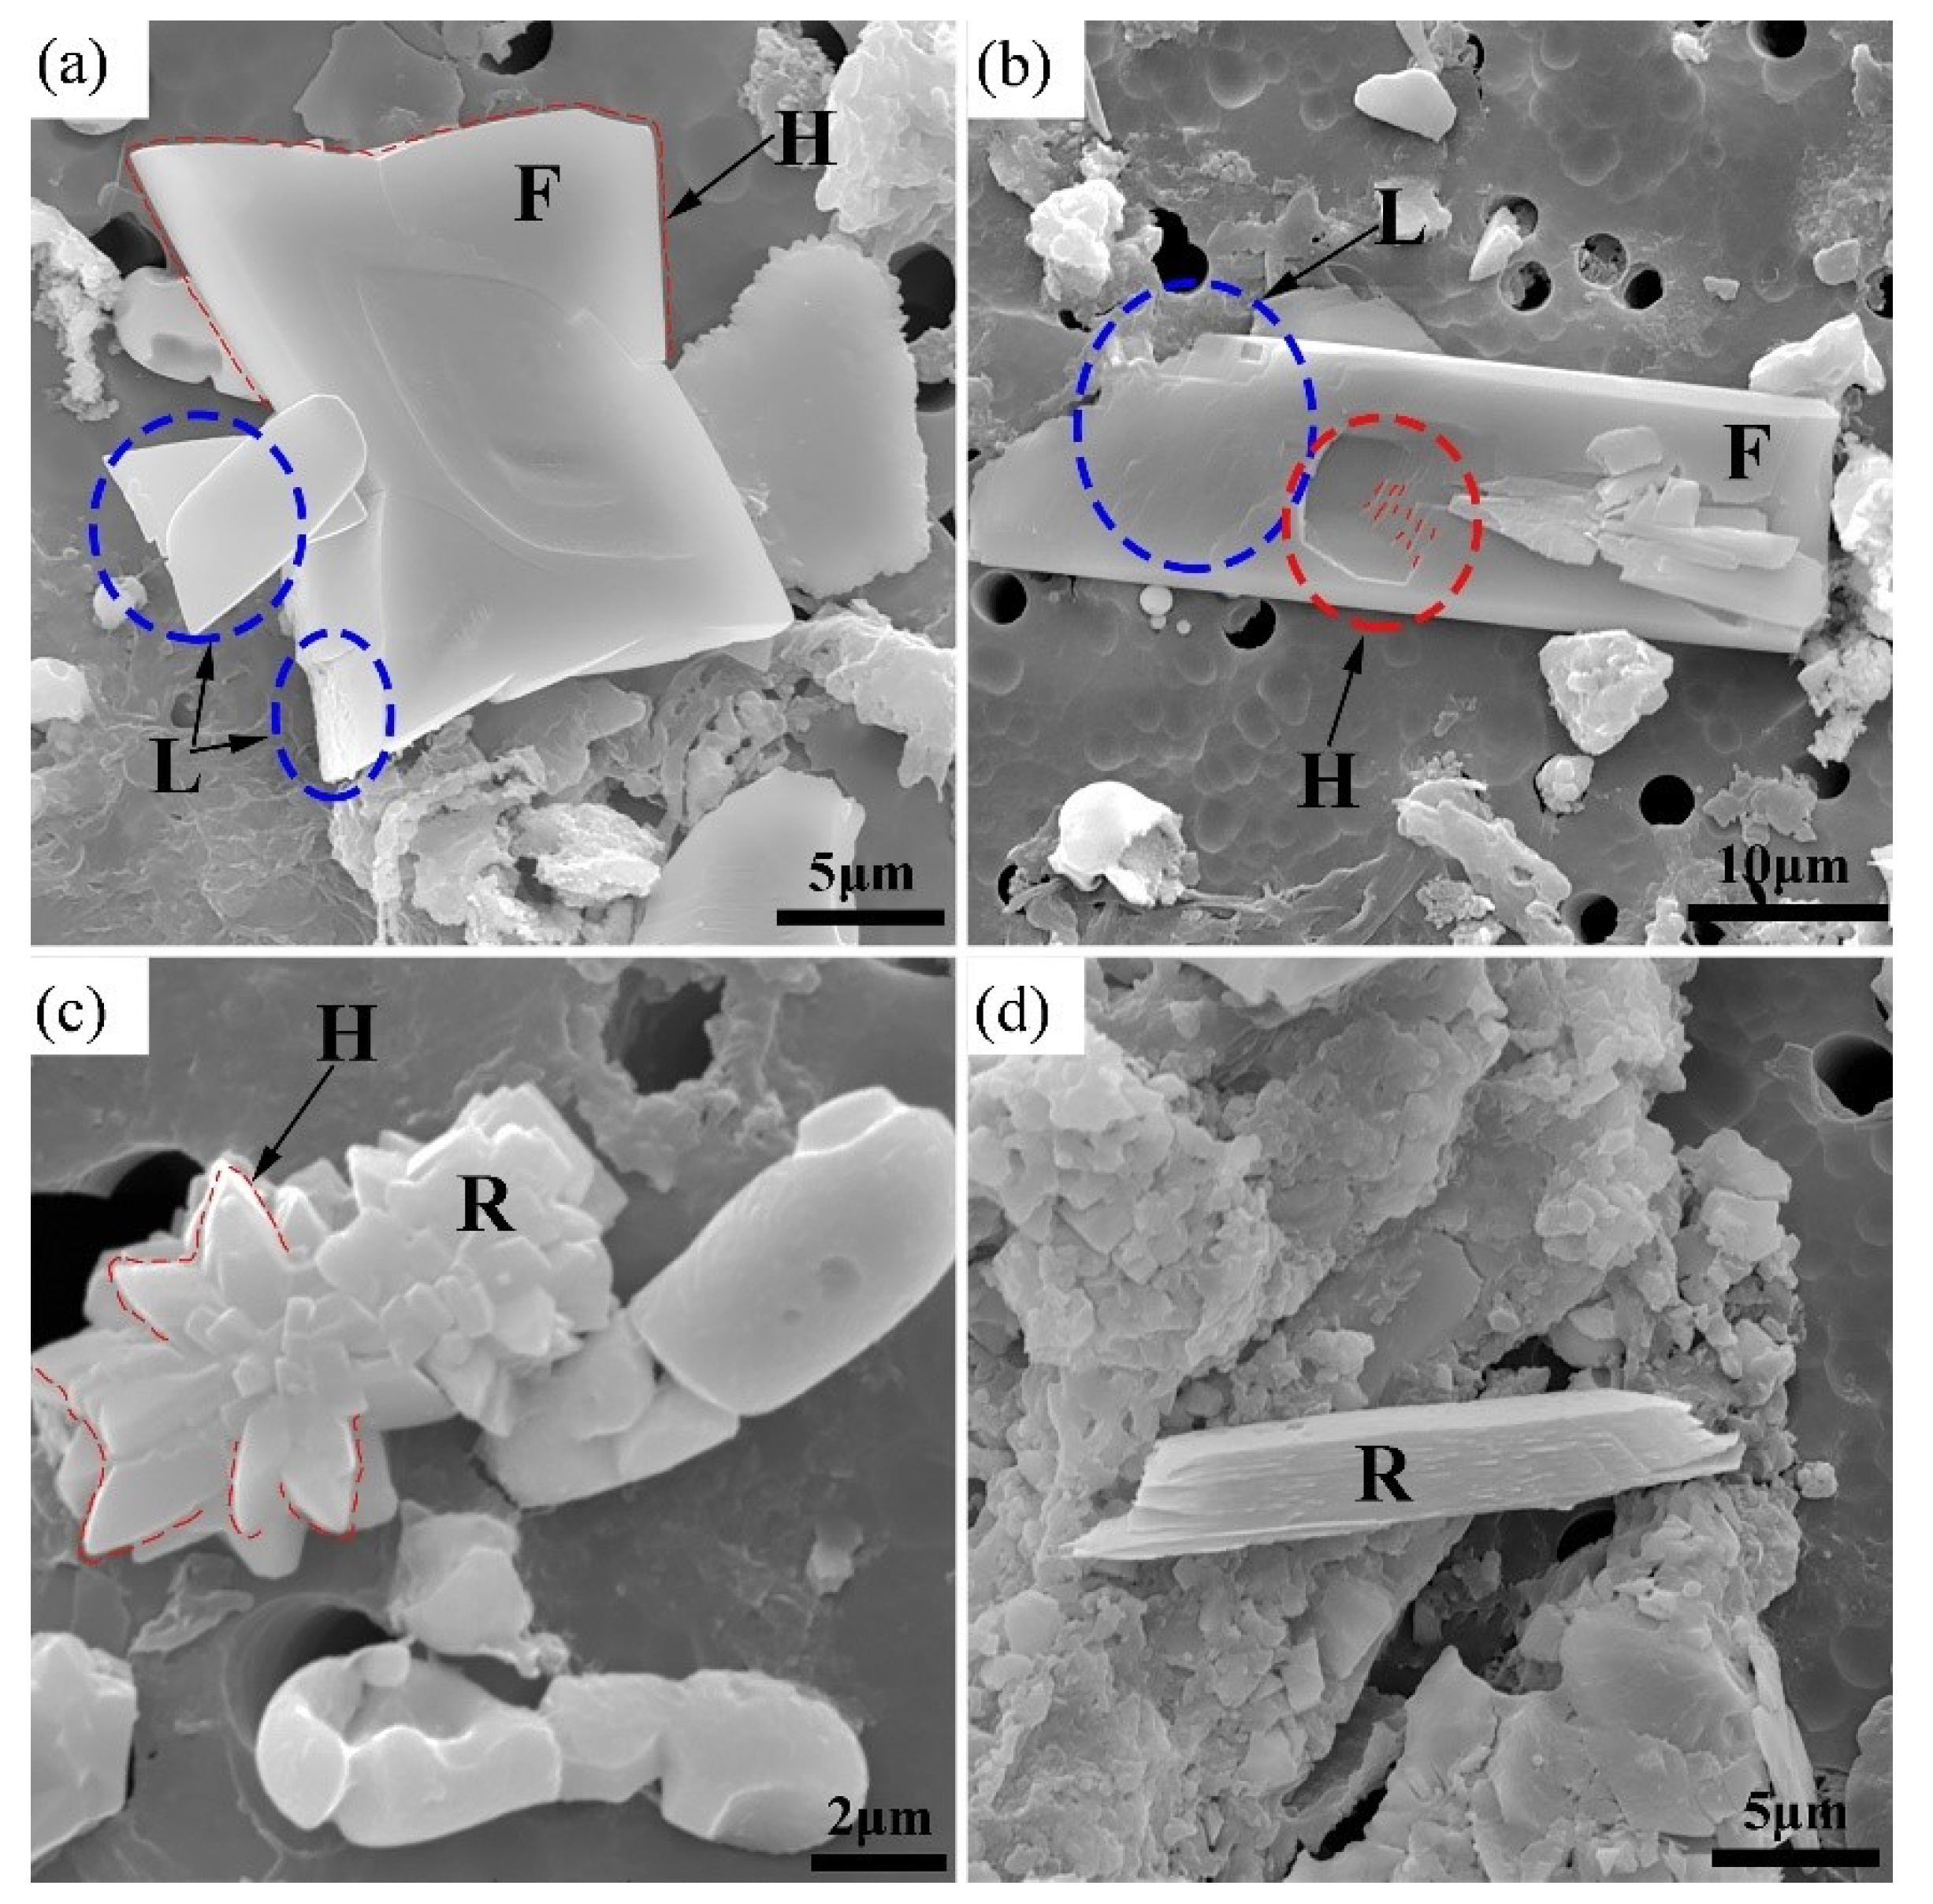
Figure 14.
Rough interface CaS inclusion at S content of 0.017%. F: flat interface; R: rough interface; L: layer growth. (a) CaS inclusion with rough interface. (b) CaS inclusion with flat interface and rough interface.
Figure 14.
Rough interface CaS inclusion at S content of 0.017%. F: flat interface; R: rough interface; L: layer growth. (a) CaS inclusion with rough interface. (b) CaS inclusion with flat interface and rough interface.

Table 1.
Chemical composition of the alloy used in experiments, wt%.
| C | Mg | Al | Si | Ca | Cr | Mn | Ni | T.O | S | Fe |
|---|---|---|---|---|---|---|---|---|---|---|
| 0.019 | 0.0023 | 0.0053 | 0.0939 | 0.0014 | 0.12 | 0.29 | 35.98 | 0.0019 | 0.001 | Bal. |
Table 2.
Cooling conditions and S content of the steel samples.
| Sample Number | A1 | A2 | A3 | A4 | A5 |
|---|---|---|---|---|---|
| Cooling condition | Water cooling | Air cooling | Furnace cooling | Air cooling | Air cooling |
| S/wt% | 0.001 | 0.001 | 0.001 | 0.0070 | 0.0170 |
Publisher’s Note: MDPI stays neutral with regard to jurisdictional claims in published maps and institutional affiliations. |
© 2022 by the authors. Licensee MDPI, Basel, Switzerland. This article is an open access article distributed under the terms and conditions of the Creative Commons Attribution (CC BY) license (https://creativecommons.org/licenses/by/4.0/).
Share and Cite
MDPI and ACS Style
Chen, J.; Feng, Y.; Zheng, S. Effect of Cooling Rate and Sulfur Content on Sulfide Inclusions in Invar Alloy. Metals 2022, 12, 2191. https://doi.org/10.3390/met12122191
AMA Style
Chen J, Feng Y, Zheng S. Effect of Cooling Rate and Sulfur Content on Sulfide Inclusions in Invar Alloy. Metals. 2022; 12(12):2191. https://doi.org/10.3390/met12122191
Chicago/Turabian StyleChen, Jing, Yanbiao Feng, and Shaobo Zheng. 2022. "Effect of Cooling Rate and Sulfur Content on Sulfide Inclusions in Invar Alloy" Metals 12, no. 12: 2191. https://doi.org/10.3390/met12122191
Note that from the first issue of 2016, this journal uses article numbers instead of page numbers. See further details here.