Review

Influence of Heat Treatment and Deformation on the Structure, Phase Transformation, and Mechanical Behavior of Bulk TiNi-Based Alloys

by
Nataliya N. Kuranova
,
Vladimir V. Makarov
,
Vladimir G. Pushin
* and
Yurii M. Ustyugov
Laboratory of Non-Ferrous Alloys, M.N. Mikheev Institute of Metal Physics of Ural Branch of Russian Academy of Sciences, 620108 Ekaterinburg, Russia
*
Author to whom correspondence should be addressed.
Metals 2022, 12(12), 2188; https://doi.org/10.3390/met12122188
Submission received: 23 November 2022 / Revised: 6 December 2022 / Accepted: 15 December 2022 / Published: 19 December 2022
(This article belongs to the Special Issue Microstructure and Mechanical Behaviour of Shape Memory Alloys)

Abstract

:
We present a brief overview of the structural and phase transformations and mechanical properties of bulk binary TiNi shape memory alloys, which demonstrate attractive commercial potential. The main goal of this work was to create a favorable microstructure of bulk alloys using both traditional and new alternative methods of thermal and thermomechanical processing. It was found that the implementation of an ultrafine-grained structure by different methods determined an unusual combination of strength, ductility, reversible deformation, reactive resistance of these alloys to subsequent tensile or torsion tests at room temperature, and, as a consequence, the highly reversible effects of the shape memory and superelasticity. It is shown that the alloys Ti49.8Ni50.2 and Ti49.4Ni50.6 are incapable of aging, and, after being subjected to ECAP, were characterized by their high strength (σu up to 1200 MPa) and ductility (δ up to 60–70%). A combined treatment of multi-pass rolling and HT of the Ti49.5Ni50.5 and Ti49Ni51 alloys prone to aging have provided even greater strength (σu up to 1400–1500 MPa) with slightly lower ductility (25–30%). The microstructure, phase composition, and martensitic transformations in Ti-Ni alloys with varying Ni concentrations ranging from 50 to 51 wt.% were investigated by TEM, SEM, and X-ray methods. The mechanical behavior of the alloys was studied during tensile and torsion tests.

1. Introduction

The high physical, mechanical, and operational characteristics of the structural metal materials most widely used in the world economy are due to diffusion-free phase martensitic transformations (MTs) in combination with their decomposition and atomic ordering of the supersaturated solid solutions [1,2,3,4]. The alloys and steels with highly reversible thermoelastic MTs (TMTs) are of particular interest to the practice due to the diverse and practically important physical phenomena and thermo-, mechanically-, and magnetically-induced shape memory (SME) effects inherent to these materials [3,4,5,6,7,8]. TMT provides for, along with unusual single and multiple reversible SMEs, the gigantic damping effects (GDEs), superelasticity effect (SEE), and a number of special barocaloric, elastocaloric, magnetocaloric, and electrocaloric effects [1,9,10,11,12,13,14,15,16,17,18,19,20]. Thermally and magnetically controlled shape-memory effects (SMEs), as well as those SMEs controlled by application of deformation, are accompanied by force effects of generation and relaxation of stresses in both forward and reverse TMTs [3,4,5,6,7,8,21]. In recent years, phenomena typical of the Invar, Elinvar, and Rinver materials have also been detected in these SM alloys [22]. All the effects revealed are in great demand in modern innovative technologies for the creation of new devices, tools, appliances, and machines, including thermal heaters and refrigeration units [5,6,7,8,21,22,23,24,25].
Today, the main mechanisms of inelastic deformation of metal materials are known to be implemented by means of sliding, twinning, and MTs. It is worth mentioning that a strong softening of elastic moduli precedes highly reversible TMTs [7,26,27,28,29,30,31,32,33,34,35,36,37,38,39,40,41]. It is the low-modulus inelasticity accompanied and conditioned by TMT acting as one (namely the third one after the usual elasticity and plasticity) of the main types of mechanical behavior of crystalline materials (CMs) that is responsible for the unusual SME, GDE, and SEE effects in CMs. To date, practice-important SM materials with TMTs are comprised of several groups: (i) B2-ordered TiNi(Me) (Me: Fe, Co, Cu, Zr, Nb, Hf, etc.) [42], (ii) B2- or D03-ordered Cu-based intermetallides alloyed by Al, Ni, Zn, Mn, B, etc. [42,43,44,45], and (iii) the L21-Heusler alloys NiMn(Me) (Me: Al, Ga, In, Sn, Sb, Pb, etc.) [46]. A number of aging FCC (A1) iron-based alloys (Fe-Ni, Fe-Mn, etc.) also demonstrate SMEs, but they have a very low reversible deformation value (no more than 2%) and an incomplete SME (less than 60%) [47,48,49,50].
The fundamental critical disadvantage of most polycrystalline smart materials (with the exception of a number of steels and a binary titanium nickelide) lies in their low ductility and brittleness [4,5]. As a result, the unique thermomechanical effects inherent to them cannot be realized not only in a cyclic multiple-, but also in a single-mode version. Therefore, it is becoming increasingly important to design and develop fundamental approaches to the optimum alloying and to the thermo-mechanical treatment methods in order to obtain various levels of strength and, at the same time, ensure that plastic polycrystalline smart materials are specialized for various industrial applications [4,5,6].
Among the structural and multifunctional materials experiencing TMT, the TiNi-based alloys are distinguished by the most attractive mechanical behavior, global isotropic softening of moduli, SMEs significant in magnitude and reproducibility, and high reliability and durability (of mechanothermal, mechanocyclic, and thermocyclic characteristics) during exploitation. Depending on the chemical composition and thermomechanical treatments, TiNi-based alloys can have sufficiently high mechanical characteristics (the limits of strength σu and yield strength σy) with favorable values of the onset of the phase fluidity σm and reversible deformation εr (up to 10%). They are capable of developing significant force efforts and performing work when changing shape, as well as do not experience failure under repeated mechanical loading stress action (for example, exceeding 20 million cycles with alternating deformation by 6%). Having good weldability, high corrosion resistance, biological compatibility, and a relatively simple chemical composition, they are also distinguished by the manufacturability of the metallurgical process and subsequent manufacturing refining. So far, in the capacity of SM alloys, they have no analogues and are irreplaceable in critical products and devices of a new generation in engineering and medicine [5,6,7,8,21,22,23,24,25,51,52,53].
As is known, in all metal alloys, depending on the technology of their synthesis, various structural states can be realized: single- or polycrystalline (ordinary coarse-grained, CG; fine-grained, FG; submicro-, SMC; or nanocrystalline, NC), and single- or multiphase. One of the effective ways to obtain high-strength SMC and NC alloys is the method of severe megaplastic deformation (MPD) in combination with heat treatment [38,54,55,56,57]. At the same time, most of these materials with high values of σy and σu have low plasticity. On the contrary, ultrafine-grained (UFG) TiNi-based alloys are distinguished by a noticeable improvement in the complex of the strength and plastic characteristics. In scientific research, the UFG structure in the alloys was obtained by laboratory thermal deformation technologies based on a number of MPD methods, including high-pressure torsion (HPT) or equal-channel angular pressing (ECAP) on samples, usually of small size [54,55,56,57,58,59,60,61,62,63,64,65,66,67,68,69,70,71,72,73,74,75,76,77,78,79,80,81,82,83,84,85,86,87,88]. In real practice for industrial application, bulk large-size high-strength plastic alloys with a complex of various SMEs are needed. Obviously, it is expedient to use traditional thermomechanical treatments of bulk materials, for example, forging, pressing, multi-pass rolling, or drawing into strips, rods, and wire. However, systematic studies on the management controlling of the structure and properties of bulk TiNi-based alloys via such technologies have virtually not been carried out [42,56].
The aim of this work is a comparative analysis of the results of studies of the mechanical behavior and structural-phase transformations in metastable binary TiNi-based alloys, depending on the alloying and deformation-thermal treatments. At the same time, the most attention is paid to establishing the possibility of obtaining bulk large-sized smart semi-finished products (materials) with a complex of simultaneously increased strength and plastic properties.

2. Materials and Methods

Ti-Ni alloys were smelted from high-purity Ti and Ni components (of 99.99 wt.% purity). Table 1 shows the chemical composition of the studied alloys of three manufacturers, according to spectral analysis. The amount of oxygen and carbon did not exceed 0.017 and 0.037 wt.%, respectively, in pure Ti49.4Ni50.6 alloy, and in the rest, 0.07 and 0.1 wt.%, respectively. As a consequence, TiNi-based alloys always contain inclusions of embrittling phases of Ti4Ni2Ox и TiC. Therefore, to compare the effects of the presence of O and C, two alloys (Ti49.5Ni50.5 and Ti49.4Ni50.6) with similar Ms temperatures were selected, which differ by 3–4 times in the content of these low-amount impurities (Table 1). The second important circumstance is that the binary TiNi-based alloys of non-stoichiometric composition enriched in Ni (containing more than 50.6–50.7 wt.%) are capable of aging and, as a consequence, of dispersion hardening. Therefore, the aging-incapable alloys Ti49.8Ni50.2, Ti49.5Ni50.5, and Ti49.4Ni50.6 and the intensively aging alloy Ti49Ni51 were selected for the study.
The alloy ingots were subjected at 1073–1273 K to hot forging into rods up to 20 mm in diameter, homogenized at 1073 K, and then, after additional heating at a quenching temperature for 10 min, cooled in water at room temperature (RT). To size refine the grain structure of alloys, the method of multi-pass rolling or rod drawing (MPR) was applied at RT with a total accumulated degree of deformation by compression to 30%, ECAP, or HPT. Post-quenching heat treatment (HT) and post-deformation heat treatment (PDHT) were carried out for convenience of comparison in the mode of isochronous (for 1 h) isothermal annealing at temperatures in the range of 573–973 K with air cooling.
The critical temperatures of the start (Ms, As) and finish (Mf, Af) of the forward (Ms, Mf) and reverse (As, Af) TMTs were determined by cyclic temperature measurements of electrical resistance ρ (T) at a rate close to 5 K/min (Table 1). The structure and phase composition were studied by X-ray diffractometry (XRD), optical metallography (OM), transmission (TEM) and scanning electron microscopy (SEM), and energy dispersive microanalysis (EDMA). XRD analysis was performed in monochromatized copper radiation Kα. We used the optical microscope Altami MET 2C, the TEM (microscope) Tecnai G2 30 at an accelerating voltage of 300 kV, the SEM Quanta 200 Pegasus and the SEM Tescan Mira at an accelerating voltage of 30 kV, equipped with EDMA and EBSD systems. Mechanical tests were carried out in the Instron 5982 tensile testing machine on standard cylindrical samples (with a diameter of 3 mm) or in a special tensile testing micromachine on flat mini samples (with a cross section of 1 × 0.25 mm). The surface of the samples was polished with diamond paste before testing.

3. Results

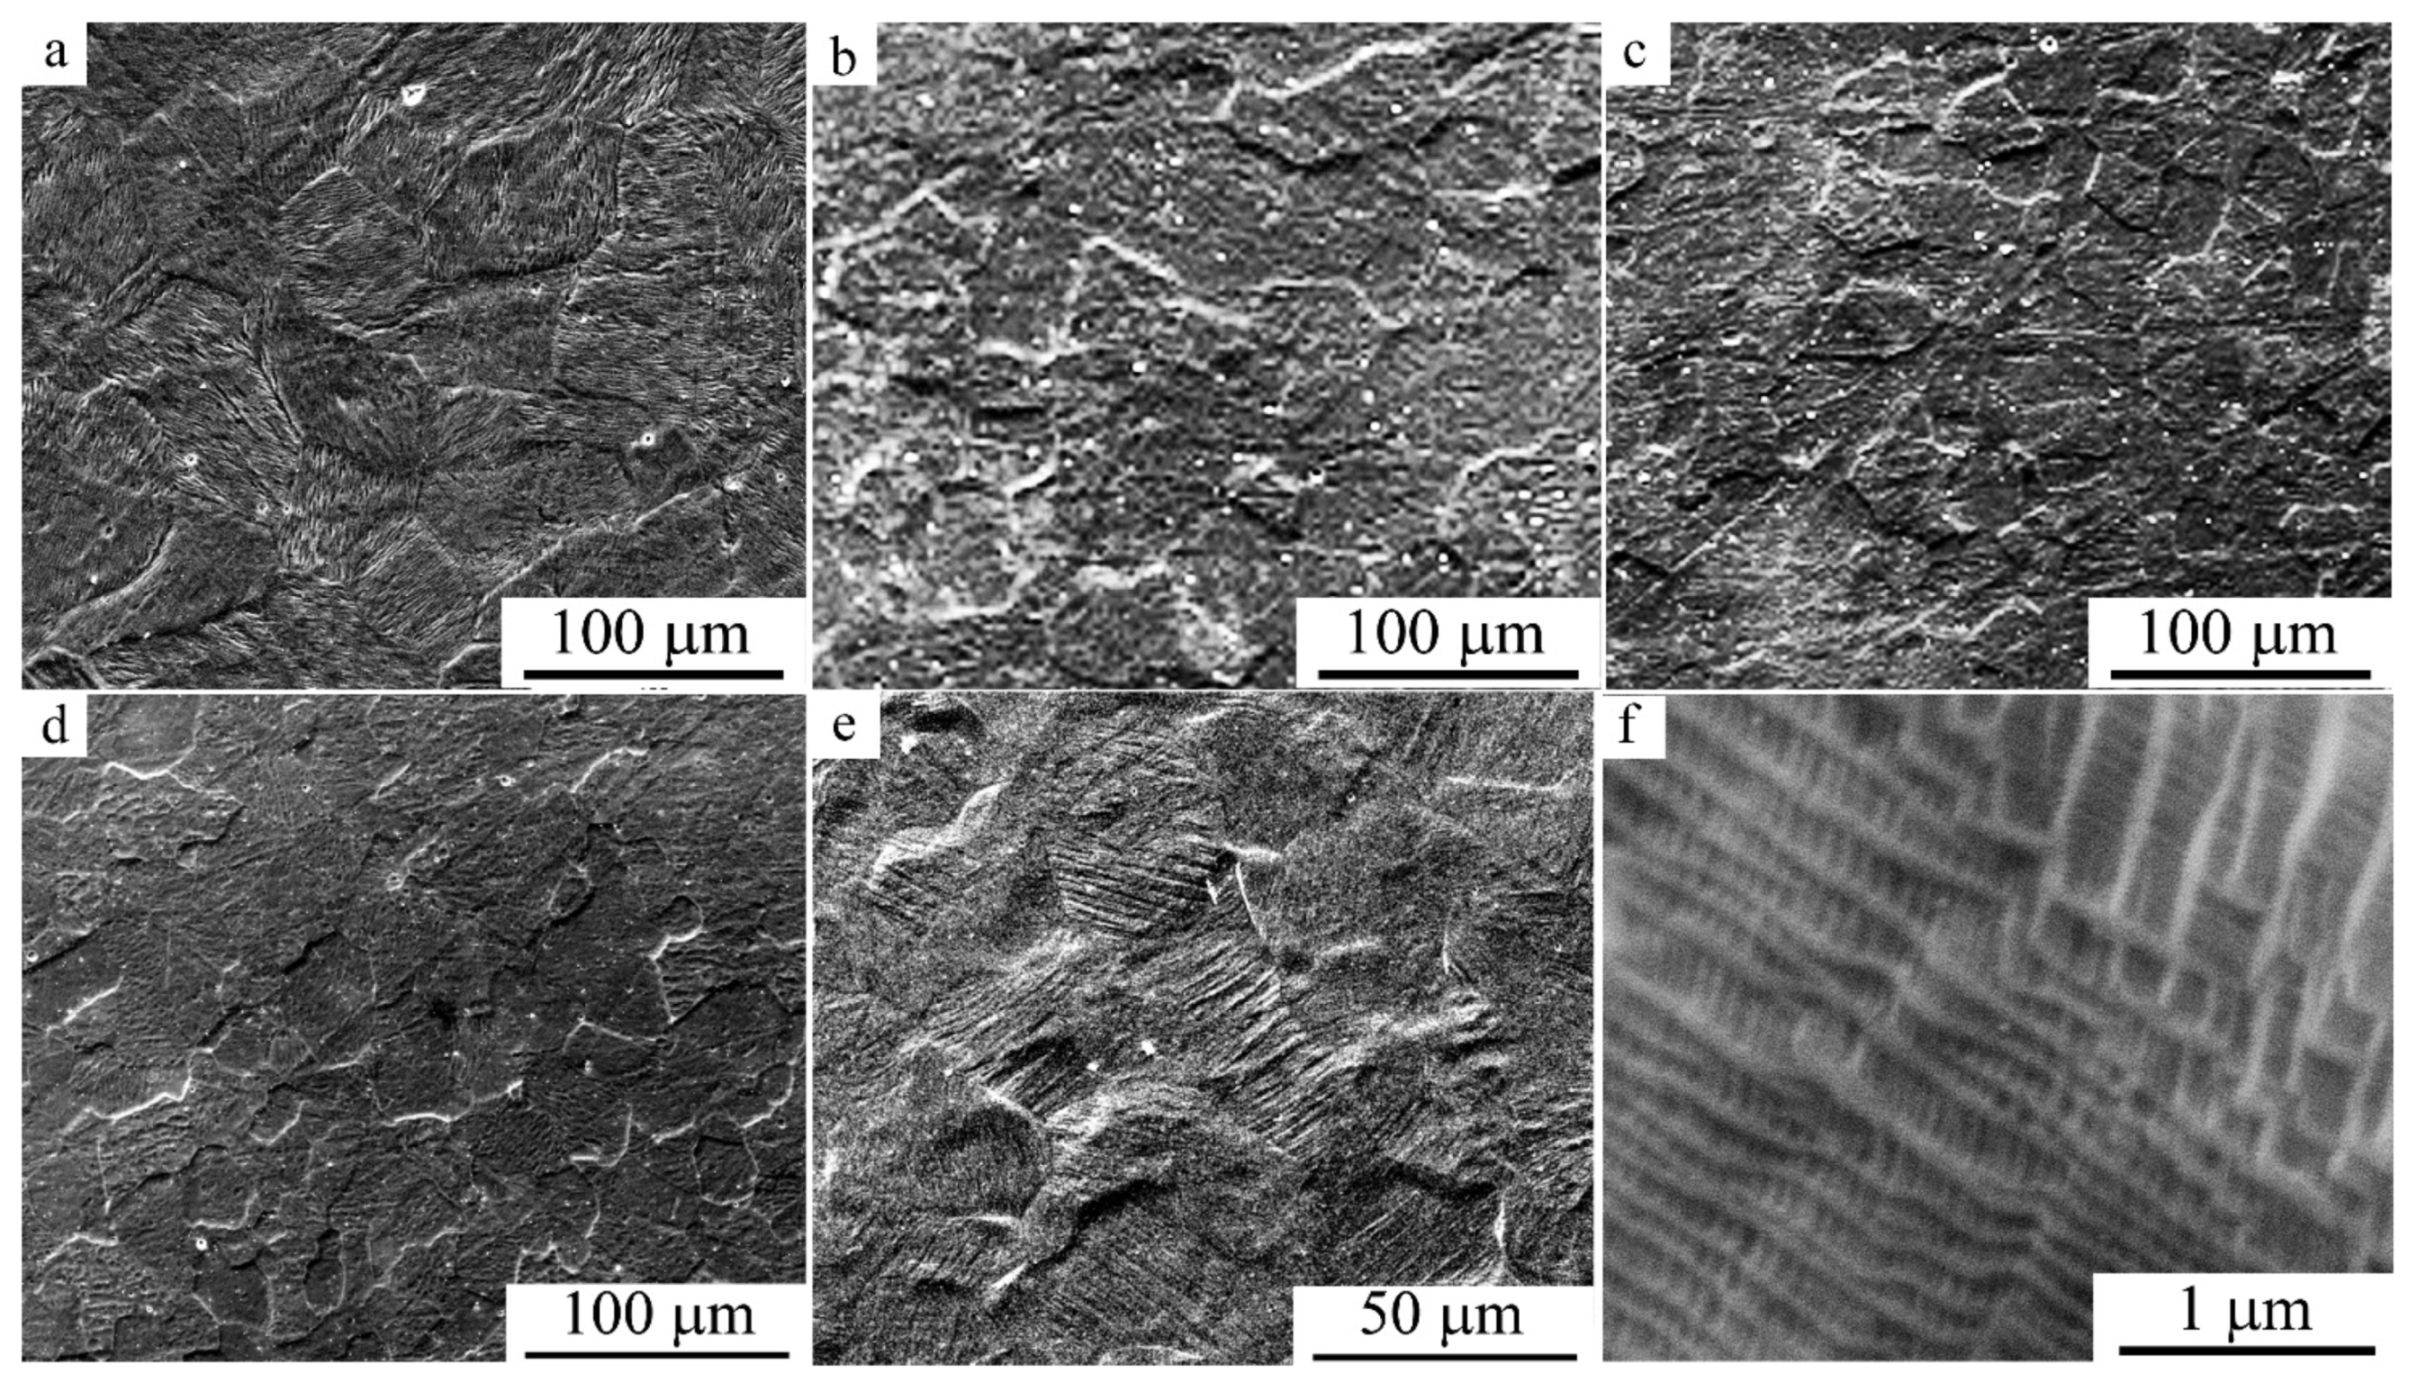
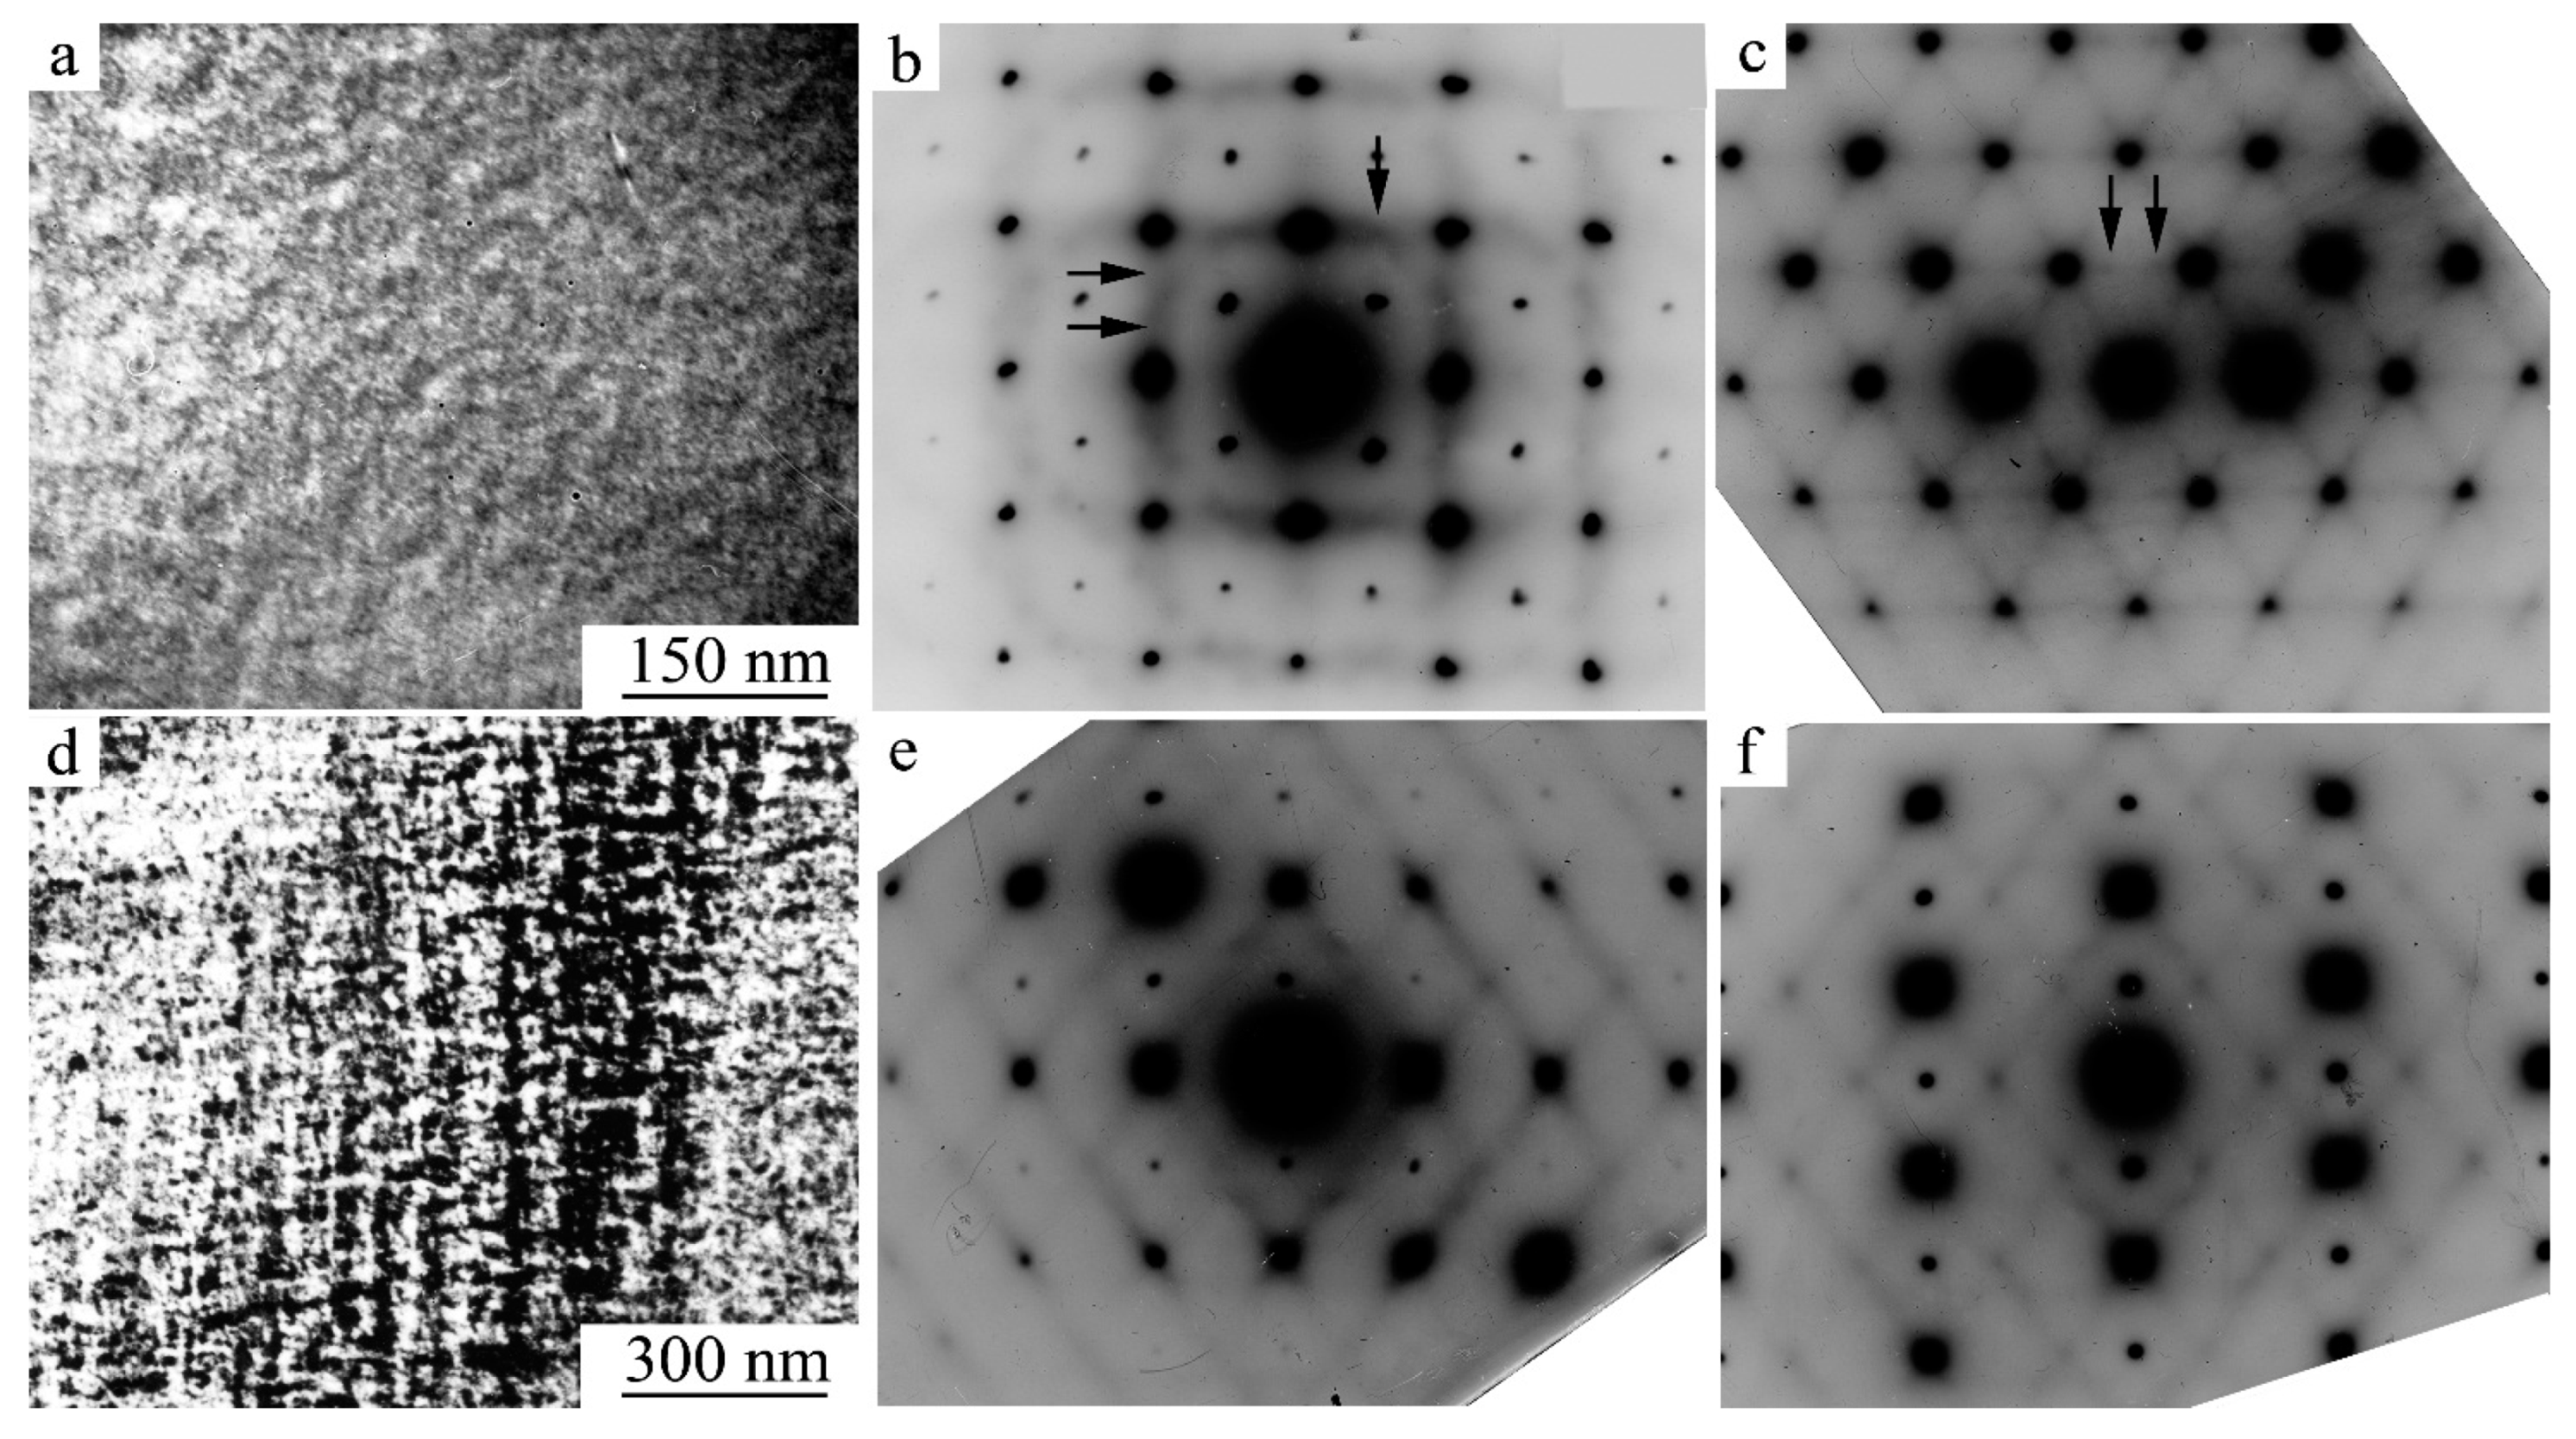
3.1. Initial Microstructure and Phase Transformations in Alloys during Cooling

Alloys based on the intermetallic compound TiNi in the usual polycrystalline state had a grain structure of B2 austenite with an average grain size d of less than 100 µm, which could vary depending on the chemical composition and treatment of the alloy (Table 1, Figure 1). In particular, it was shown that in TiNi, due to a strong dependence on Ni concentration, the critical temperatures of the forward and reverse TMTs linearly decreased by almost more than 100 K with a gradual increase in the Ni amount in Ti50−xNi50+x from 50 to 51 wt.% [42]. It is known that, in anticipation of a TMT, in metastable titanium nickelide alloys, certain special pre-transition (SPT) states are realized that progressively evolve with global isotropic softening of elastic moduli [27,28,35,38,41,42]. The substructure of these SPT states is characterized by the presence of coherent nanodomains, in which the positions of periodically displaced atoms nearly coincide with and approach their positions in the lattice of future martensitic phases. These nanostructural states are manifested themselves, being diffraction-provided, in TEM images in the form of deformation tweed contrast, and in SAED, neutron-, and X–ray diffraction patterns in the form of diffuse effects, namely non-radial streaks and satellite reflections in positions slightly incommensurable with the reflections from the would-be martensitic phases R, B19’ (B19) of types 1/3 <110> *, 1/2 <110> * [27,28,33,34,35,41,42,89,90,91,92,93].
Figure 2 shows high-resolution tweed contrast patterns typical of metastable Ti-Ni austenitic alloys and SAED patterns of four rational cross sections, (100) *, (110) *, (111) *, and (210) *, from B2 (respectively, the axes of the zones of the reflecting planes (z.a.) are [100], [110], [111], and [210] in B2) with diffuse streaks and satellites of the above types (indicated by arrows in Figure 2). Reconstruction in reciprocal lattice (r.l.) showed that the streaks are traces of the intersection of flat diffuse objects (DOs) of {111} *-type passing through r.l. nodes, where DOs are interpreted as a consequence of scattering on linear defects (LD) in the form of displaced densely-packed atomic chains <111>B2. Their (of LD) correlation interactions by the type of short-range displacement order (SOD) in densely packed planes {110}B2 cause the appearance of streaks along <110> * resulting from chaotic locally shifting planes (110)B2. Their spatial 3D correlations near Ms form coherent nanodomains with intermediate shift substructures (ISS-I according to R-type of “tripling” 1/3 <110>k<1 1 ¯ 0>e and ISS-II according to B19-type of “doubling” 1/2 <110>k<1 1 ¯ 0>e, where k and e (in indices) are wave and polarization vectors [41,42,94].
Cooling of quenched alloys below the critical temperature Ms leads to the phase TMT transformation B2 → B19’ (see Figure 3a). According to the results of XRD analysis, the parameters of the unit cell of the B2 austenite lattice of alloys vary from 0.3015 to 0.3010 nm with an increase in the nickel content from 50 to 51 wt.%. The parameters of the unit cell of the monoclinically distorted B19’ phase of the studied Ti-Ni alloys are close to a = 0.289 nm, b = 0.412 nm, c = 0.462 nm, and β = 97°. In XRD experiments in situ, during cooling, it was found that the volume changes during this transformation have a small negative value ΔV/V = −(0.03–0.04) % near Ms, but linear distortions (LDs) are anisotropic (for example, negative along the axes from the orientation relationships (o.r.) [100]B2||[100]B19’ and [01 1 ¯ ]B2||010]B19’, and positive along the axes [011]B2||[001]B19’), and in absolute value they progressively increase with cooling. According to SEM and TEM studies, with a known variety of structural and morphological variants of B19’ martensite placed below the temperature of the finish of direct (i.e., forward) transformation, Mf, the multipack morphology of lamellar microcrystals, twinned in pairs according to the corresponding crystallographic systems of types I {111} and {011} or II <011>, is dominant (Figure 3). The linear dimensions of coherent packets are usually close to 2–3 µm. As a result, thousands of such packets are formed in grains of 30–80 µm in size. The analysis of the TEM and SAED patterns shows that B19’ microcrystals contain secondary planar nanotwins along (11 1 ¯ ) and (001)B19’. On certain SAED patterns, they are identified by sharp streaks along [11 1 ¯ ] * and [001] * (Figure 3c). The TMT B2 → B19’ is carried out completely in a narrow temperature range and the alloy below Mf has virtually no residual austenite. A similar thin-twinned B19’ microstructure also occurs under the influence of compression deformation under high pressure (Figure 1e,f) [80].
When these alloys are subjected either to cooling from 1073–1173 K in air or with a furnace, low-temperature tempering, or to thermal cycling through the interval of the B2 ↔ B19’ TMT, the phase B2 → R transformation precedes the formation of B19’ martensite. Initially, when cooled below the temperature of the start of the B2 → R transformation (Ms), thin crystals of plate-shaped R martensite with the habitus {110}B2 appear; they are formed homogeneously in the grain body and heterogeneously on the structural defects (dislocations, boundaries, subboundaries, and inclusions of the second phases) [89]. The parameters of the R-phase lattice in the rhombohedral set are close to aR = 0.90 nm and αR = 89.5–89.0°, and in the hexagonal (H) set aH = 0.734 nm and cH = 0.528 nm. It is important that the change in the specific volume ΔV/V at the TMT point of the start of the B2 → R transformation is very small and negative, and amounts to −(0.01 ÷ 0.02) %, but changes in the lattice parameters of the R phase and, accordingly, linear distortions along and across the rhombohedral axis <111> B2 occur anisotropically and increase with cooling in magnitude (Δc/c ≈ 1.0%, Δa/a ≈ −1.0%). Therefore, as a result of the B2 → R TMT transformation, the alloys contain accommodational coherently-matched packets of R crystals, twinned in pairs along different planes of habitus and twinning, namely, {110}B2 and {100}B2 (Figure 4). Their linear dimensions, as a rule, do not exceed several micrometers. They can have a flat, tortuous, or wedge-shaped form (Figure 4). Variants of {100}B2-kind twinning, as a rule, are found at packet junctions. Cooling leads to the following RB19’ TMT (Figure 4a shows B19’ martensite on the right), which is totally completed below Mf, and the martensitic structure becomes almost similar to that illustrated in Figure 3 for quenched alloys.
It is obvious that the structure–morphological hierarchy (SMH) that is established by the B2 → B19’, B2 → R, and B2 → RB19’ TMTs in low-modulus alloys of Titanium Nickelide is the result of spatial self-organization of 3D martensitic crystals due to their coherent matching via self-accommodation of anisotropic stresses caused by the TMT. This SMH consists/is characteristic of four spatial levels: nano- (nanotwins), micro- (microcrystals), meso- (packet-pyramidal morphological ensembles inside the grain), and macro-level (all the multipacket polycrystalline macroscopic objects). Changes in external and internal conditions (temperature, pressure, stresses and deformations, chemical composition, grain size, etc.) switch on adaptive processes of coherent reorientation of elastically-stressed crystals in this hierarchical multilevel low-modulus system (MLS), or eliminate the existence of this MLS system altogether. The operational durability of SME alloys is ensured in that case, while implementing multiple SME, SEE, and GDE effects under conditions of external cyclic impacts when high reproducibility of all phase, structural, and textural characteristics is maintained.

3.2. Influence of ECAP and HPT on the Structure and Mechanical Properties of Alloys

3.2.1. ECAP of SM Ti49.4Ni50.6 Alloy

As was already noted, ECAP is an effective method of MPD of metals and alloys. Owing to ECAP technology, they are subjected to MPD without changing the cross section of bulk blanks, which makes it possible to repeatedly deform them and obtain a nanostructured (NS) state in them [54,55,56]. The intermetallic compound of titanium nickelide refers to materials that are hard to deform. Indeed, alloys subjected to ECAP at temperatures below 623 K always exhibit fracturing and, therefore, we have performed ECAP at elevated temperatures from 623 to 773 K. In addition, Ti-Ni alloys with a high Ni content (more than 50.6–50.7 wt.%) are prone to intensive aging, including the deformation-induced type, in the course of ECAP often experience failure due to strong strengthening, and have not been yet well-studied.
For the first time, we obtained bulk UFG alloys based on titanium nickelide with outstanding record values of strength and other mechanical properties; their structure, phase transformations, physico-mechanical properties, and parameters of the process of ECAP were studied. For instance, Figure 5 shows TEM images and the SAED pattern of the Ti49.4Ni50.6 alloy after ECAP at 723 K for eight passes in (a, b) transverse and (c) longitudinal cross sections. It can be seen that, at RT, the sample of this alloy was also in an austenitic B2 state with a UFG structure and a predominance of the proportion of large-angle boundaries, which leads to an annular arrangement of reflections in SAED patterns from this sample. The SEAD pattern in Figure 5 also clearly proves the presence of a crystallographic texture: in particular, reflections of the 200B2-type are observed much less frequently and are significantly less intense. The average grain size is close to 0.25 µm (with a spread of tangible sizes ranging from 0.10 to 0.40 µm). In the transverse cross section, the grain structure has an equilibrium character, and in the longitudinal direction (along the ECAP axis) there is some elongation of individual grains (with a small anisotropy factor up to 1.5). Relating to the structure of the UFG alloy after ECAP, characteristics include a slightly increased intragrain number density of dislocations, relatively uniformly distributed over all grains and subgrains.
The fact that the images of some grains are completely free from dislocation contrast or «depict» a very low number density of dislocations is a semblant effect. Systematic studies using the inclination of samples in the goniometer of the microscope made it possible (i) to visualize—in each of the grains and subgrains available for investigation—the images of a dislocation substructure of the same dislocation number density as in neighboring grains with initially visible dislocations, or, conversely, (ii) to «extinguish» the contrast from these dislocations. It is obvious that such a UFG structure was formed largely due to the dynamic step-by-step recrystallization occurring in the alloy with its multi-pass MPD by ECAP.
It is established that the UFG alloy Ti49.4Ni50.6 after ECAP just under cooling experiences a successive B2 → RB19’ TMT transformation. In this case, the temperatures of the direct B2(R) → B19’ TMT decrease by 20–30 K somewhat due to the partial decomposition and stabilizing effect of grain size refinement. The critical temperatures of B2 ↔ R TMT, on the contrary, as a consequence of the partial homogeneous decomposition of the alloy, increase somewhat and this B2 ↔ R TMT transformation begins to outpace the formation of B19’ martensite [38,54,89]. As was shown by TEM experiments in situ (when cooling in a microscope column), the morphology of the single-packet pairwise-twinned structure of R- and B19’ modes of martensite in UFG grains becomes dominant (Figure 6). Trace analysis has allowed for us to establish that the habitus of lamellar martensitic crystals in neighboring (adjacent) grains is oriented at large angles (30–90°), which indicates the adaptive accommodative origin of this micromorphology in adjacent UFG grains. It has been found that in this case, the secondary internal nanotwins in B19’ martensite are by themselves mainly composite accommodative nanotwins of type (001)B19’ and type I nanotwins of type (11 1 ¯ )B19’, typical of the alloy in the initial CG state. It is important to note here that the subtle (fine) features of the microstructure of R- and B19’ modes of martensite were revealed using selector diaphragms (SD) of various sizes in the objective lens (with their image diameters being 1 and 0.3 µm). This ensured the appearance of both annular (ring-wise) “Debye” pictures of composite SAED patterns (see Figure 6a,c) and point single-crystal ones (Figure 6b,d).
The deformation-assisted behavior of Ti49.4Ni50.6 alloy in CG and UFG states was studied during tensile tests of standard cylindrical samples with a diameter of 3 mm. The value of the true stress, denoted by the symbol «S», was calculated under the assumption that the samples undergo uniform deformation during tensile tests: S = Pε/Fε, where Pε is the force exerted by the tensile-testing machine at the degree of deformation ε, Fε = F0/(1 + ε) is the cross section, F0 is the initial cross section, ε = (ll0)/l0 is the relative deformation (strain), and l0 and l are the initial and the current length of the sample, respectively. Figure 7a shows “true stress S–strain ε” curves typical of tensile tests when samples of Ti49.4Ni50.6 alloy are stretched in the pre-martensitic state (at RT): curve 1 corresponds to the initial CG alloy after its quenching, curve 2 corresponds to the initial UFG alloy after ECAP at 723 K in 8 passes. Table 2 contains the measured strength and ductility characteristics.
As can be seen, regardless of the grain size in the Ti49.4Ni50.6 alloy, almost identical qualitative changes in mechanical properties and the type of tensile «stress–strain» curves S(ε) are observed during the transition from the usual CG to the UFG grain structure. Until stress-induced deformation in the UFG Ti49.4Ni50.6 alloy undergoing work hardening (WH) is a consequence of its phase TMT transformation, the regularities of WH that take place in the UFG alloy before its actual plastic deformation begins are the same as in the initial CG state of the alloy [95]. Before the attainment of the value of the yield stress Sy, evolution of the alloy in both structural states, judging by the curves’ S(ε), has four stress-related stages (I, II, III, and IV; stage I is not shown in Figure 7a), which differ in the magnitude of the strain hardening coefficient K = dσ/dε and the character of its change with increasing degree of deformation. For stage I of elastic deformation of B2 austenite, a high coefficient of strain hardening KI is typical, which decreases sharply with an increase in the degree of deformation during the transition to II stage with the so-called pseudo-fluidity plateau as a result of stress-induced MT (SIMT) with a reversible deformation of εr = 5%. The stress of its onset, by analogy with plastic deformation, is usually defined as the limit of the phase pseudofluidity Sm for soft orientation-dependent SIMT. At the next two stages, III and IV (up to the Sy stress limit), strong strain hardening is observed due to hard orientation-dependent SIMT.
Naturally, grain size refinement at ECAP by more than 150 times affected the levels of mechanical properties of the alloy under study. The stresses at the beginning of all stages, including stage V of plastic deformation, and the hardening coefficients KIII and KIV in the case of a UFG structure, are significantly greater than for an alloy with a CG structure. For instance, Sm and Sy, as well as the hardening coefficients KIII and KIV, of the alloy after ECAP are two times greater than in the initial CG state. We should note some more unusual features of the deformation behavior of the UGF alloy in the course of its plastic deformation during testing (Figure 7a, curve 2). Firstly, on the curve S(ε), after reaching Sy, a linear stage of deformation hardening is visible, with the same ε span as that which is characteristic of the CG alloy. Secondly, while the Sy of the UFG alloy is 2 times larger, its work-hardening coefficient KV, on the contrary, is 2 times smaller. Thirdly, if at the stage of uniform deformation (δu) the linear dependence of the S(ε) of the CG alloy is replaced by a parabolic dependence, then the linear dependence of the S(ε) of the UFG alloy remains almost the same up to Su. Fourth, the ECAP mode used with the same Su value simultaneously significantly increases the initial resistance to plastic deformation, Sy, and maintained the same unusually high values of the elongation δ and the narrowing ψ of the alloy (Table 2).
At the final stage of mechanical testing, when the alloy in both structural states reaches the value of Su, the macrolocalization of plastic deformation commences (stage VI in Figure 7a), observed in the form of a neck. In this case, there is a “decline” in the value of the conditional flow stress up to the rupture of the samples according to the engineering tension curves, which persists on the recalculated curves. We have calculated the true stresses only up to the value of Su, within the framework of the chosen calculation method, since the transition to the localized deformation concentrated in the neck cannot be strictly accounted for by only using the value of relative elongation. The duration of stage VI, judged by the «stress–strain» curves, characterizes the localized elongation δl = δ − δu ≈ 7–9%.

3.2.2. ECAP of SM Ti49.8Ni50.2 Alloy

Figure 7b and Figure 7c show engineering «stress–strain» curves in the coordinates “resolved stress σ“ and “strain ε“, which are typical of the UFG alloy Ti49.8Ni50.2 after ECAP in the course of being subjected to tensile tests. Mechanical properties of the Ti49.8Ni50.2 alloy in the state of B19’ martensite after various ECAP modes are given in Table 3. Compared to the initial CG state, ECAP causes a significant change in the shape of the “σ–ε“ curves (Figure 7), leading to an increase in σy, σu, and K.
σu increases with the number of ECAP passes at 723 K with a maximum of 1410 MPa after 12 passes, which is 50% higher than that in the initial state. The increase in σy is twice as much as for σu. δ of the alloy increases slightly after the first pass, and then gradually decreases to 41% after 12 passes. The value of σm of this alloy depends to a lesser extent on the number of ECAP passes, although it also shows an increase of 50%. Table 2 and Table 3, for comparison, give values of the reactive stress σr close to the differences (σy–σm) of the alloys after different ECAP regimes. It is important to note that with the same number of passes, the ECAP temperature in the selected temperature range (673–773 K) did not significantly affect the mechanical properties of the Ti49.8Ni50.2 alloy. For instance, the values of σu and δ at 8 passes for the alloy after ECAP are close at temperatures of 673, 723, and 773 K. Compared to the plasticity characteristics of the high-purity Ti49.4Ni50.6 alloy, the alloy Ti49.8Ni50.2 with a 3–4 times higher content of O and C had slightly lower values. Thus, these impurities, being in large inclusions such as Ti4Ni2Ox and TiC, did not have the expected negative solid-solution effect on the mechanical behavior of SME alloys.
Engineering “σ–ε“ curves during tensile tests of ECAP samples of the UFG alloy Ti49.8Ni50.2 after the various PDHT regimes are separately presented in Figure 7c. Table 3 gives the mechanical properties of the alloy after ECAP and additional PDHTs. The PDHT after the ECAP at temperatures of 723 and 773 K causes an increase in δ while maintaining strength properties. With an increase in the temperature of PDHT to 873 K, the strength characteristics decrease and a further increase in δ after ECAP is even higher than in the quenched CG alloy, which is obviously due primarily to the acceleration of the static recrystallization process (resulting in an increase by an order of magnitude of the size, d, 3.4 µm).
The best combination of strength (σu = 1250 MPa) and ductility (δ = 65%) properties of the alloy was found in the state after the combined treatment: ECAP (723 K, 8 passes) + PDHT 773 K, 1 h. It can also be noted that PDHT at temperatures below 873 K also leads to some slight increase in σm. From the “σ–ε“ curves (Figure 7c) and the data from Table 3, it can be seen that, after PDHTs at 723 and 773 K, their appearance is close to the corresponding curves after ECAP. These curves are characterized by high values of σy and a small difference (about 5–8%) between σy and σu. An increase in the PDHT temperature to 873 K increases this difference and brings the shape of the “σ–ε“ curve closer to that which corresponds to the initial data for a quenched CG alloy. It is important that PDHT significantly increases δu. The analysis shows that the change in the mechanical properties of ECAP-treated alloys mainly correlates with the value of the average grain size d.

3.2.3. Microstructural Changes of the SME Ti49.4Ni50.6 Alloy upon Tensile Tests

To identify structural changes and the mechanism of plastic deformation during tensile testing of the SME alloy Ti49.4Ni50.6 after quenching or ECAP, thin foils made from tensile (ruptured) samples were studied by TEM. The geometric dimensions of these samples made it possible to study their microstructure after different degrees of deformation in longitudinal and transverse cross sections relative to the axis of tension [72,73].
Figure 8 represents the TEM microstructure of CG alloy samples after tensile testing in the region of moderate uniform plastic deformation (ε ≈ 20%). Both in the longitudinal and in the transverse cross section of the tensile samples, a strip (bandlike) deformation substructure of B19’ martensite is mainly observed, mainly directed along one or more sliding and twinning systems (Figure 8a,b). In wide bands, flat pileups of dislocations and thin (fine) nanotwins are visible, as a rule, oriented at an angle to the direction of the trace of the main deformation bands. The density of the uniformly-distributed dislocations and twins in thin (darker by contrast) deformation bands is high, and the individual twins and dislocations in them are virtually not resolved. At the same time, the SAED pattern shown in Figure 8c demonstrates reflections, mainly forming textural groups in certain r.l. positions, but reflections located along the circumferences of the rings are also visible, indicating the appearance of NC fragments of the structure with large-angle misorientations along and across the deformation bands (in this case, within an area of SD of 1.0 µm). Grids of the reflections of types 001, 1 1 ¯ 0 and 010, and 101 on SAED patterns indicate the presence of crystals of equivalent variants of B19’ martensite in twin-manner oriented relative to each other along the bands. It also follows from the trace analysis that the planar elements of the structure present inside the wide bands are oriented along planes close to (110)B19’ for possible twinning of class I of type (110).
An increase in the degree of uniform plastic deformation to a doubled value (ε ≈ 40%) does not lead to qualitative changes in the deformation substructure: in tensile samples, a predominant band morphology formed by B19’ martensite crystals and oriented in different grains along one or more sliding and twinning systems is still observed (Figure 9). The unidirectional spatial orientation of the deformation bands at the grain boundary is disturbed because of the incompatibility of plastic deformation (Figure 9a). Inside the bands, judging by the deformation contrast, the number density of the nanotwins and dislocations is so great that it is often impossible to visualize not only individual dislocations, but also numerous nanotwins. They are visible only at a certain inclination of the samples in the goniometer on the bright-field images (Figure 9a) and—in the corresponding diffraction conditions—on the dark-field images (for example, Figure 9b). The thickness of the crystals within the deformation bands becomes significantly (15–20 times) smaller. In addition, SAED patterns typical of those taken from an area selected by SD of 1.0 µm, for example, presented in Figure 9c, now clearly demonstrate the uniform distribution of most B19’ martensite reflections along the circumferences of the rings, with such a uniformity due to an increase in the number of grain–subgrain components with large-angle misorientations in these ultrafine deformation bands and between them. The use of SD of 0.3 µm shows that thin nanotwins in B19’ martensite are deformation-induced twins of type (001)B19’ (which causes the appearance of both the corresponding reflections in SAED patterns and sharp streaks passing through them along <001> *). The main larger dark and light deformation bands alternating in their contrast are also found in this twin orientation (see Figure 9d). Internal secondary planar defects in wider bands are oriented differently and closer, as is already noted, to disposition along the planes of type (110).
Finally, Figure 10 shows bright- and dark-field images and the corresponding SAED pattern of the Ti49.4Ni50.6 martensitic CG-alloy structure formed in the neck of the tensile sample (ε ≈ 70%). As a result of significant plastic deformation of the alloy, in it there occurs, firstly, a significant size refinement of the initial grains (by 150–200 times). Secondly, the internally fine-twinned and highly defect-containing subgrain structure of B19’ martensite in the neck region, even at a minimum SD of 0.3 µm, is characterized by an annular distribution of reflections in the SAED pattern as a consequence of the deformation-induced dispersity of nanograins and their containing of crystal-lattice defects (Figure 10c). However, at the same time, the nanotwins in neighboring UFG grains are distinguished mainly by the unidirectionality of (i) the morphology and, accordingly, (ii) the crystallographic system of the twinning shear with respect to the axis of tensile deforming of a sample. Therefore, a SAED pattern with the zone axis close to the original z.a. [111]B2 contains texture groups of identical or similar (strictly speaking, close in their positions) reflections of types 110 and 111 on the rings.
Similar research investigations were performed on the ruptured tensile samples of UFG alloy subjected to ECAP. Figure 11 shows microstructures typical of the sample in the transverse and longitudinal cross sections after tensile tension to a strain of ε ≈ 40%. It should be noted that in comparison to the initial UFG state (at a grain size of 0.2–0.3 µm), in the alloy after its deformation to ε ≈ 40%, some size refinement of the elements of the grain–subgrain structure of B19’ martensite with a pronounced texture also occurred, and a dislocation substructure of higher density was formed in it. Dislocations uniformly fill all grains. In some cases, thin nanotwins are also observed.
Figure 12 presents TEM images typical of a tensile ruptured UFG alloy sample in the neck area. Judging by Figure 12, the structure of the mentioned sample was characterized by the nanostructural state of B19’ martensite and a high number density of the deformation twins oriented mainly in the direction of the axis of tension. It should be noted that the microstructure after such a significant plastic deformation of the alloy in the initial CG and UFG states turned out to be qualitatively similar. The strong size refinement of the structure, especially of the CG alloy, most noticeable in the neck region, explains the equality of the strength limits of the alloys in such different states (namely, of the CG and the UFG character) that preceded the tests.
Briefly discussing the results here, it is necessary to pay attention to the following. The process of the plastic deformation itself of the alloy occurs at stage V of uniform deformation (Figure 7a). TiNi-based alloys have extremely low elastic moduli in both austenitic and martensitic phases; therefore, in martensite there takes place a predominant planar sliding of dislocations and mechanical twinning, with the former and the latter passing into the development of a band substructure with a high number density of the uniformly distributed dislocations and mechanical twins. In both CG and UFG alloys, this mechanism of plastic deformation provides for high strain hardening on one hand, and effectively prevents macrolocalization of deformation with the formation of a neck on the other hand. At the same time, up to the formation of the neck, in the alloy, a strong size refinement of grains with their significant misorientation relative to each other takes place. It is obvious that the mechanical twinning and fragmentation of grains are mechanisms of the relaxation-adaptation type necessary to compensate for the progressive incompatibility between plastic deformation and growing local stress concentrators.
It is precisely the low moduli and their proximity to one another for various shear systems due to elastic isotropy that determine, firstly, the possible accumulation of a higher number density of defects, and, secondly, the relaxation mechanism by the nanotwinning and nanostructuring. This mechanism can be interpreted as a strain-assisted MT (hereinafter, SAMT effect), similar to the TWIN and TRIP effects in the steels with sufficiently plastic austenite and martensite, which are capable of mechanical twinning and deformation hardening.

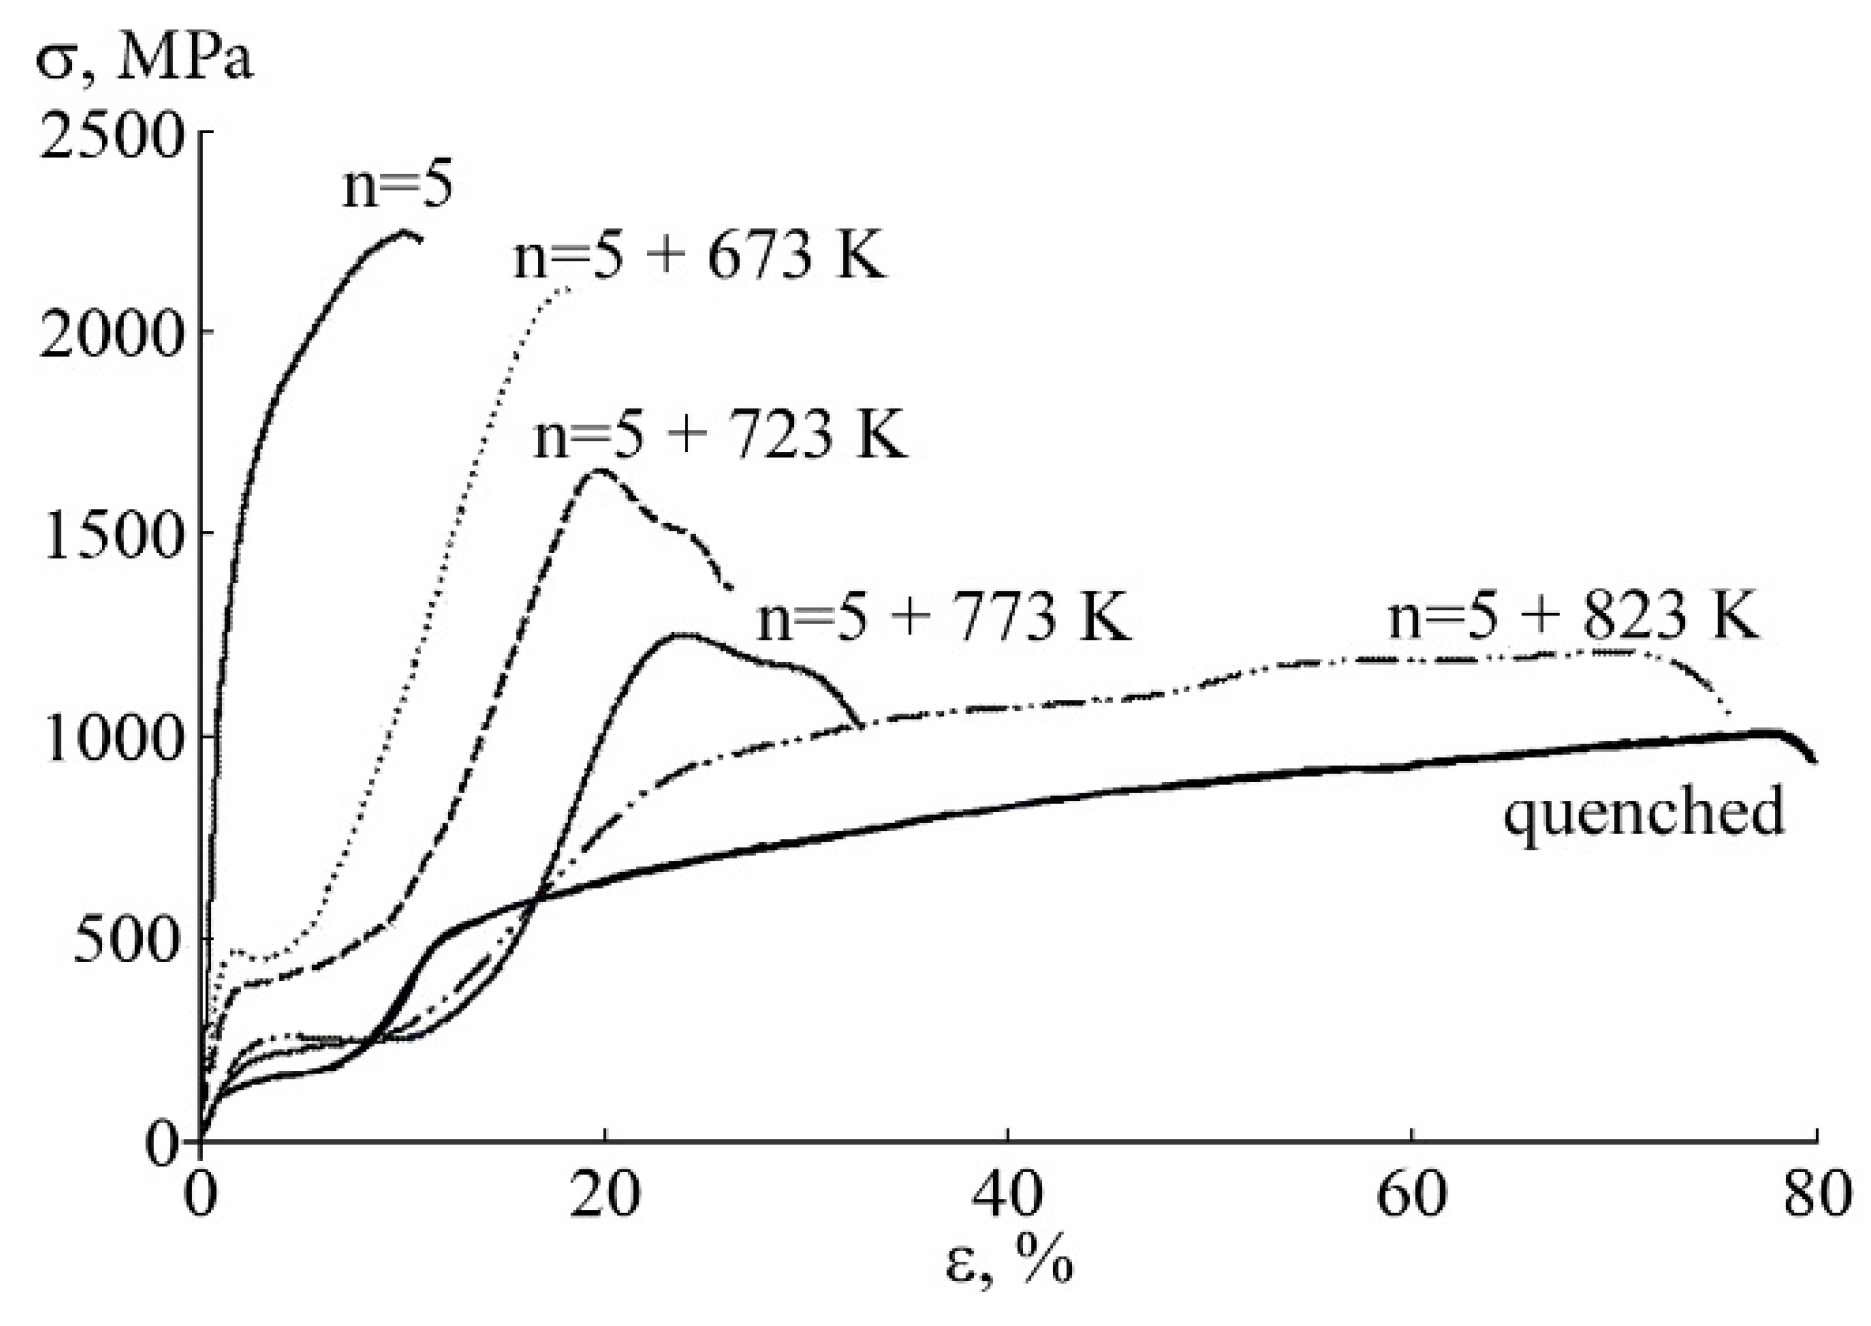
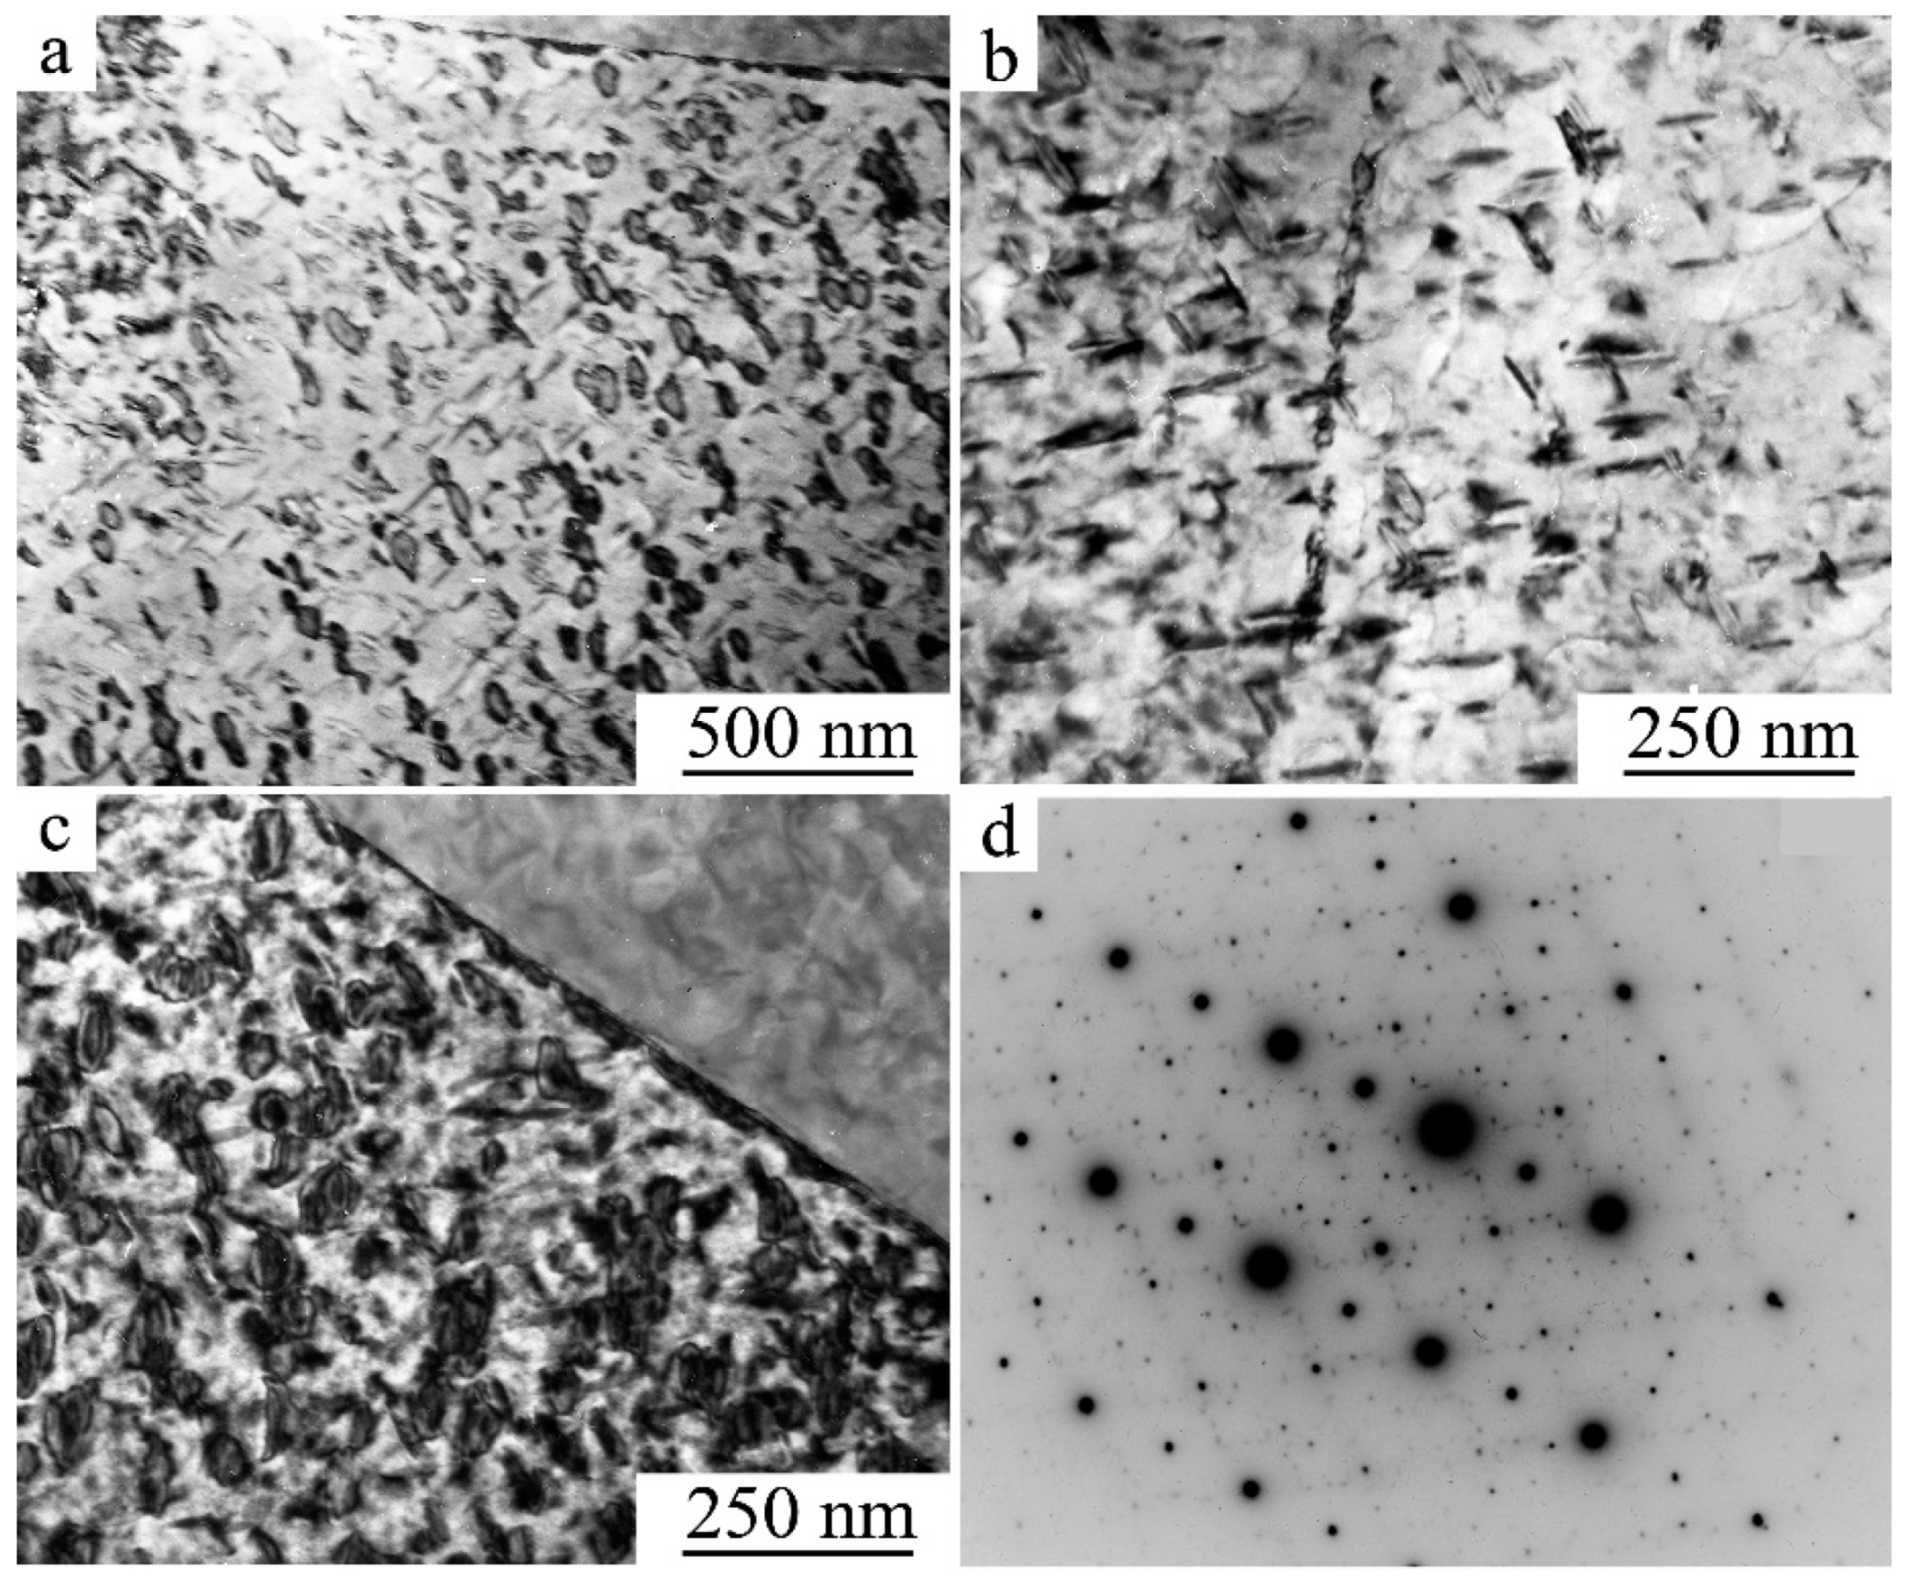
3.2.4. The Effect of HPT on the Structure and Mechanical Properties of the SME Alloy Ti49.4Ni50.6

As was already noted, HPT is one of the most powerful MPD methods, which allows—in laboratory conditions—to size refine the grain structure as much as possible (up to NC states) and ensure amorphization even in large-dimensioned samples of titanium nickelide (for example, with a diameter of 20 mm and a thickness of more than 1 mm [74,75]). For the first time, not only the hardening according to microhardness data was established for the HPT samples of Ti49.4Ni50.6 alloy, but also their mechanical tensile tests were performed on special flat mini samples. The results of measurements of the mechanical properties are shown in Figure 13 and in Table 4. The engineering “σ–ε“ curves of tensile tests illustrate the mechanical behavior of the alloy in the following states: AmNC amorphous-nanocrystalline (n = 5), NC (n = 5 + 673 K, n = 5 + 723 K, n = 5 + 773 K), UFG (n = 5 + 823 K), and CG (after quenching). The “σ–ε“ curve of the initial amorphous-nanocrystalline (AmNC) alloy demonstrates its high-strength state with a maximum σu = 2250 MPa, high σy = 1150 MPa, and δ = 8%. It should be noted that, with increasing the temperature of PDHT, there is a gradual decrease in the strength characteristics of the alloy, σm, σy, σu, and σr, and growth in the pseudoelastic (εr up to 15%) and plastic (δ to 75%) characteristics, which remains attractive for practical applications. Record-high values of strength were attained for σy, σu, and σr (Table 4, Figure 13).
Figure 14 shows the TEM and SEM images typical of the HPT-preliminarily treated alloy subsequently subjected to the specified PDHTs for 1 h. It can be seen that, after all the treatments, excluding PDHT at 823 K, the amorphous alloy undergoes devitrification to form an NC structure, whereas after annealing at 823 K, the observed structure being by an order of magnitude larger in grain size can be characterized as an SMC (or UFG) one (cf. Figure 14a–f).
It should be noted that a significant role in the formation of a homogeneous NC state in the alloy during its devitrification in the course of a low-temperature PDHT is played by concentrational separation with the enrichment of the boundaries of nanocrystallites with nickel and then the precipitation of highly disperse particles of the phases β’ and X-Ni4Ti3 on them [54,89]. The formation of these particles (PF) was revealed during the decoding of a number of SAED patterns in the TEM study. This mechanism (PF) triggers a barrier effect that inhibits the growth of nanograins in this alloy weakly saturated in nickel. It is obvious that the sharp grain growth is due to the removal of the mentioned barrier effect because of the occurrence of the decomposition at the temperature of 823 K (close to the solubility limit for this alloy). Once again, we emphasize that, along with the ultra-high strength properties, the HPT-treated alloy is distinguished by acceptable plastic characteristics together with the record-high values of the reversible pseudoelastic (with εr up to 16%) and plastic (up to 75%) deformation.

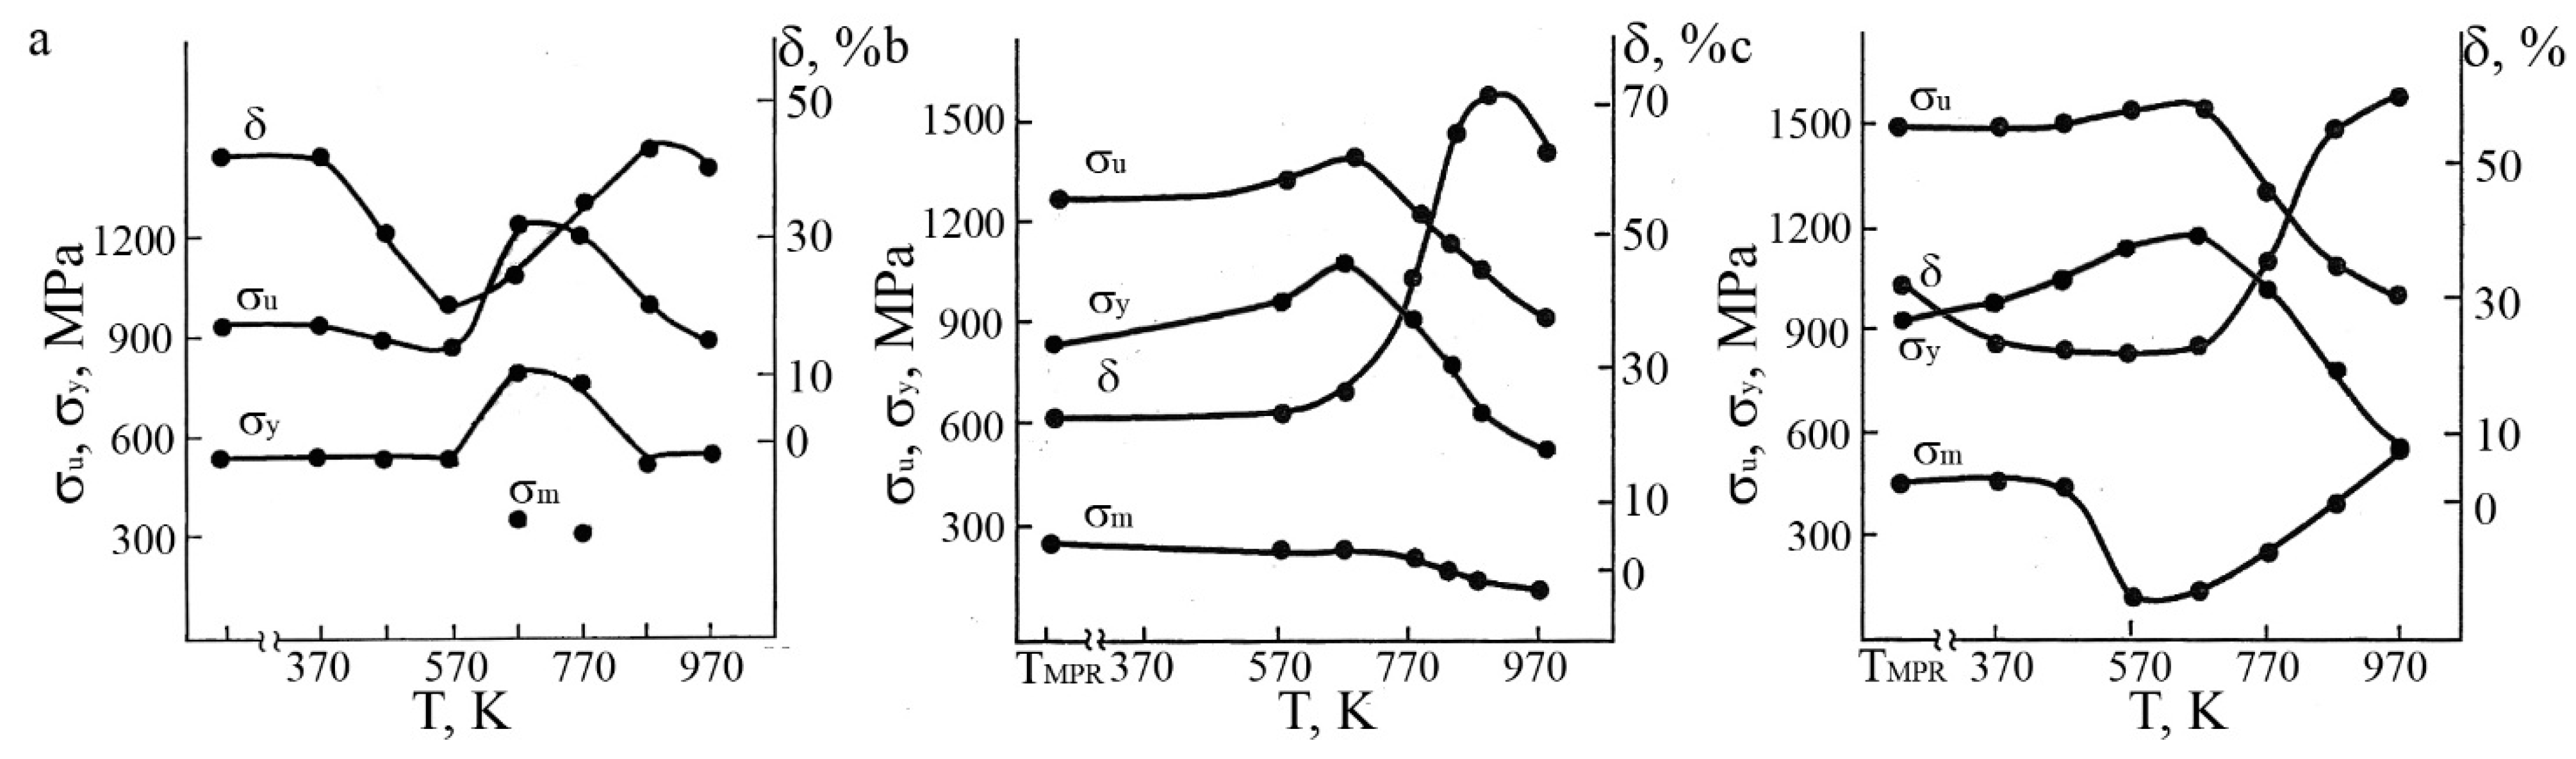
3.3. The Effect of HT, MPR, and PDHT on the Structure and Mechanical Properties of Bulk Alloys

3.3.1. Features of the Decomposition of Supersaturated B2 SME Ti-Ni Alloys at HT

As is already noted, in accordance with the phase equilibrium diagram, B2 nickel-enriched alloys of TiNi become supersaturated at temperatures below the solubility limit for the B2 phase and experience homogeneous decomposition with an excess Ni content (relative to stoichiometry) of more than 50.6–50.7 wt.% [54,89]. As is known, under the process of HT, these alloys undergo decomposition with the precipitation of a number of excess phases, namely metastable phases of β’, X-Ni4Ti3, and Ni3Ti2, and the equilibrium phase of Ni3Ti [54,89]. Figure 15, Figure 16 and Figure 17 show TEM images typical of the investigated Ti49Ni51 alloy subjected to isochronous (for 1 h), isothermal HT at temperatures of 573 K (Figure 15), 673 (Figure 16), and 773 K (Figure 17). It was found that, at lowered HT temperatures, the quenched alloy undergoes decomposition, in which the precipitation of excess phases occurs in two stages. Already, at 473–523 K, homogeneous precipitation of equiaxial coherent β’ nanoparticles structurally isomorphic to the B2 matrix and enriched in Ni is noted. Homogeneous precipitation of X-Ni4Ti3 lamellar nanoparticles, mainly responsible for the hardening of the alloy, begins after 1.5–2 h at 523 K, 0.5 h at 573 K, 0.2 h at 623 K, and 0.1 h at 673 K [54,89]. At higher HT temperatures, homogeneous aging occurs immediately starting with the precipitation of the X-Ni4Ti3 phase. On the SAED patterns, the Bragg reflections proper, from β’-phase particles, are not observed, as they coincide with matrix B2 reflections, and only specific diffuse effects are visible, for example, in Figure 15b. On the contrary, the X-Ni4Ti3 phase particles with a rhombohedral set of crystal-lattice parameters (aR−X = 0.672 nm, αR−X = 114°) are identified by the appearance in SAED patterns of their own reflections (see Figure 16d and Figure 17d).
It is important to note that as the temperature and duration of aging increase, the kinetics of precipitation of the X-Ni4Ti3 particles accelerate, their sizes grow, and their number density per unit volume decreases. The habitus of X-Ni4Ti3 particles is close to {111}B2. The orientation relationships are close: {111}B2||(111)R−X||(001)H−X; {321}B2||(101)R−X||(010)H−X (H denotes a hexagonal set of lattice parameters). Finally, a heterogeneous decomposition mechanism competes with the homogeneous one; in the former case there are precipitations at the grain boundaries (see Figure 15a,c and Figure 17a,c), sub-boundaries, and dislocations (Figure 17b). It is obvious that the heterogeneous mechanism of decomposition, including the formation of the zones free of precipitates near the boundaries, plays a negative role, mainly leading to a decrease in the ductility of aging alloys.
The dependence of the mechanical properties of the SME Ti49Ni51 alloy on the HT temperature is given in Figure 18a and Table 5. The analysis shows that HT at 373, 473, and 573 K of the quenched alloy slightly reduces σy and σu, leading to a decrease in δ due to the grain boundary precipitation of the excess β’ and X-Ni4Ti3 phases. Aging at 673 and 773 K for 1 h with the precipitation of the strengthening X-Ni4Ti3 phase is accompanied by an increase in the Ms of the B2 matrix due to its depletion of Ni and correlates with a simultaneous increase in σy, σu, and δ due to a deformation-induced TMT. At the same time, on the engineering “σ–ε“ curves, the values of the phase pseudofluidity σm are close to 310–350 MPa (Table 5). HT at both 873 K 1 h and 973 K 1 h does not change mechanical properties compared to the quenched alloy (Table 5, Figure 18a).

3.3.2. The Effect of the MPR and PDHT on the Structure and Mechanical Properties of the SME Ti49.5Ni50.5 Alloy

After their quenching, the bulk aging-incapable alloys Ti49.8Ni50.2 and Ti49.5Ni50.5 were subjected to multi-pass rolling of rods (MPR) at RT with a total accumulated degree of deformation by overall compression of 30%. Cold MPR to 30% of the Ti49.5Ni50.5 martensitic alloy leads to deformation-induced shear reorientation of the B19’ crystals with an arbitrarily-oriented packet structure into a band substructure of highly defective B19’ martensite. Figure 19a,b shows that the alloy acquires a high number density of the dislocations and thin nanotwins, the latter oriented in each grain mainly in the acting direction of shear deformation during rolling. The example typical of an annular (ring-wise) SAED pattern shows the presence in a deformed alloy of a dominant band structure with predominant large-angle misorientations (Figure 19c).
PDHT leads to the reverse TMT of B19’ → B2, and subsequent cooling to RT again leads to the direct TMT in the alloy. Figure 20 illustrates the microstructure typical of the alloy after its MPR and PDHT at 673 K. It can be seen that, in comparison to the deformed state of the alloy, the substructure of martensite has changed slightly, retaining as before the high number density of dislocations and nanotwins, as well as the characteristic annular (ring-wise) distribution of reflections on the SAED pattern. At the same time, dark-field images show highly disperse “shining” nanoparticles, which by themselves are the nickel-enriched nanoparticles based on the metastable phase X-Ni4Ti3, including those decorating the boundaries of deformation bands.
Figure 21a–c shows TEM images of the alloy microstructure after MPR and PDHT at 773 K. It is obvious that a radical change in the phase composition of the martensitic substructure has occurred in the alloy, as is evidenced by the appearance, along with the annular distribution of reflections in the SAED pattern (Figure 21a, insert, SD of 1.0 µm) of the networks of single crystals (Figure 21d using a smaller SD of 0.3 µm), which proves the presence of the R and B19’ martensitic phases. In particular, Figure 21c shows an SAED pattern with z.a. [110]R taken from a single-crystal network. Analysis of bright- and dark-field images shows that the alloy has a UFG structure with an interval of prevailing grain sizes of 100–150 nm.
Figure 21d–f represents the UFG structure of the alloy subjected to MPR and PDHT at 873 K. In this case, the grains become somewhat larger than in the previous case (the predominant sizes vary within the limits from 150 to 200 nm). On the whole, it can be seen that the alloy still contains fine-twinned crystals of the R and the B19’ martensite along with a smaller (judging by the contrast) number of highly disperse particles of X-Ni4Ti3 in accordance with the data of the analysis of SAED patterns (including Figure 20c and Figure 21d,f).
Figure 18b and Table 6 show the mechanical properties of the alloys Ti49.8Ni50.2 and Ti49.5Ni50.5 after quenching, MPR by 30%, and PDHT (1 h). It can be seen that MPR by 30% leads to an increase in σu to 1260–1270 MPa, a certain increase in σm to 240–250 MPa, and a corresponding decrease in δ from 55–60 to 22–25%. The use of PDHT causes a gradual decrease in σm and σu, but a radical increase in δ (up to 70%). The mechanical properties of the alloy after PDHT at 973 K virtually coincide with the properties of the quenched alloy.
In the Ti49.5Ni50.5 alloy, with an increase in the PDHT temperature, the softening stage was preceded by an intermediate stage of simultaneous growth of the values of σu (up to 1390 MPa) and δ (up to 30%), with the constant value of σm in the temperature range of 573–673 K. Taking into account the phase composition and microstructure, it can be concluded that the hardening effect given, unlike the case of Ti49.8Ni50.2 alloy, is associated with the development of a complex reaction of deformation-induced decomposition processes and primary recrystallization with the formation of a UFG structure under the barrier action of heterogeneously precipitating highly disperse nickel-enriched particles on the structural defects (primarily dislocations and sub-boundaries). Whereas the second stage of general softening from 773 K is mainly due to the coarsening of the UFG structure at elevated temperatures of PDHT, which continues during recrystallization, including due to acceleration of the kinetics of recrystallization and a decrease in the role of the barrier effect of precipitates, the volume fraction of which decreases significantly at higher temperatures and the size increases. PDHT at 973 K under conditions of complete absence of decomposition leads to the restoration of the initial grain structure of the alloy (grain size in the range of 45–50 µm) due to the completion of the primary recrystallization process and, as a consequence, to the return of mechanical properties to the initial values of the quenched alloy. In conclusion, it should be noted that Ti-Ni alloys of similar composition were subjected to cold multistage drawing and subsequent PDHT using similar technology, and a high-strength of-good-plasticity wire with highly reversible memory effects was obtained, used for medical use in endoscopic litho extractors and electroresectors [51,53].

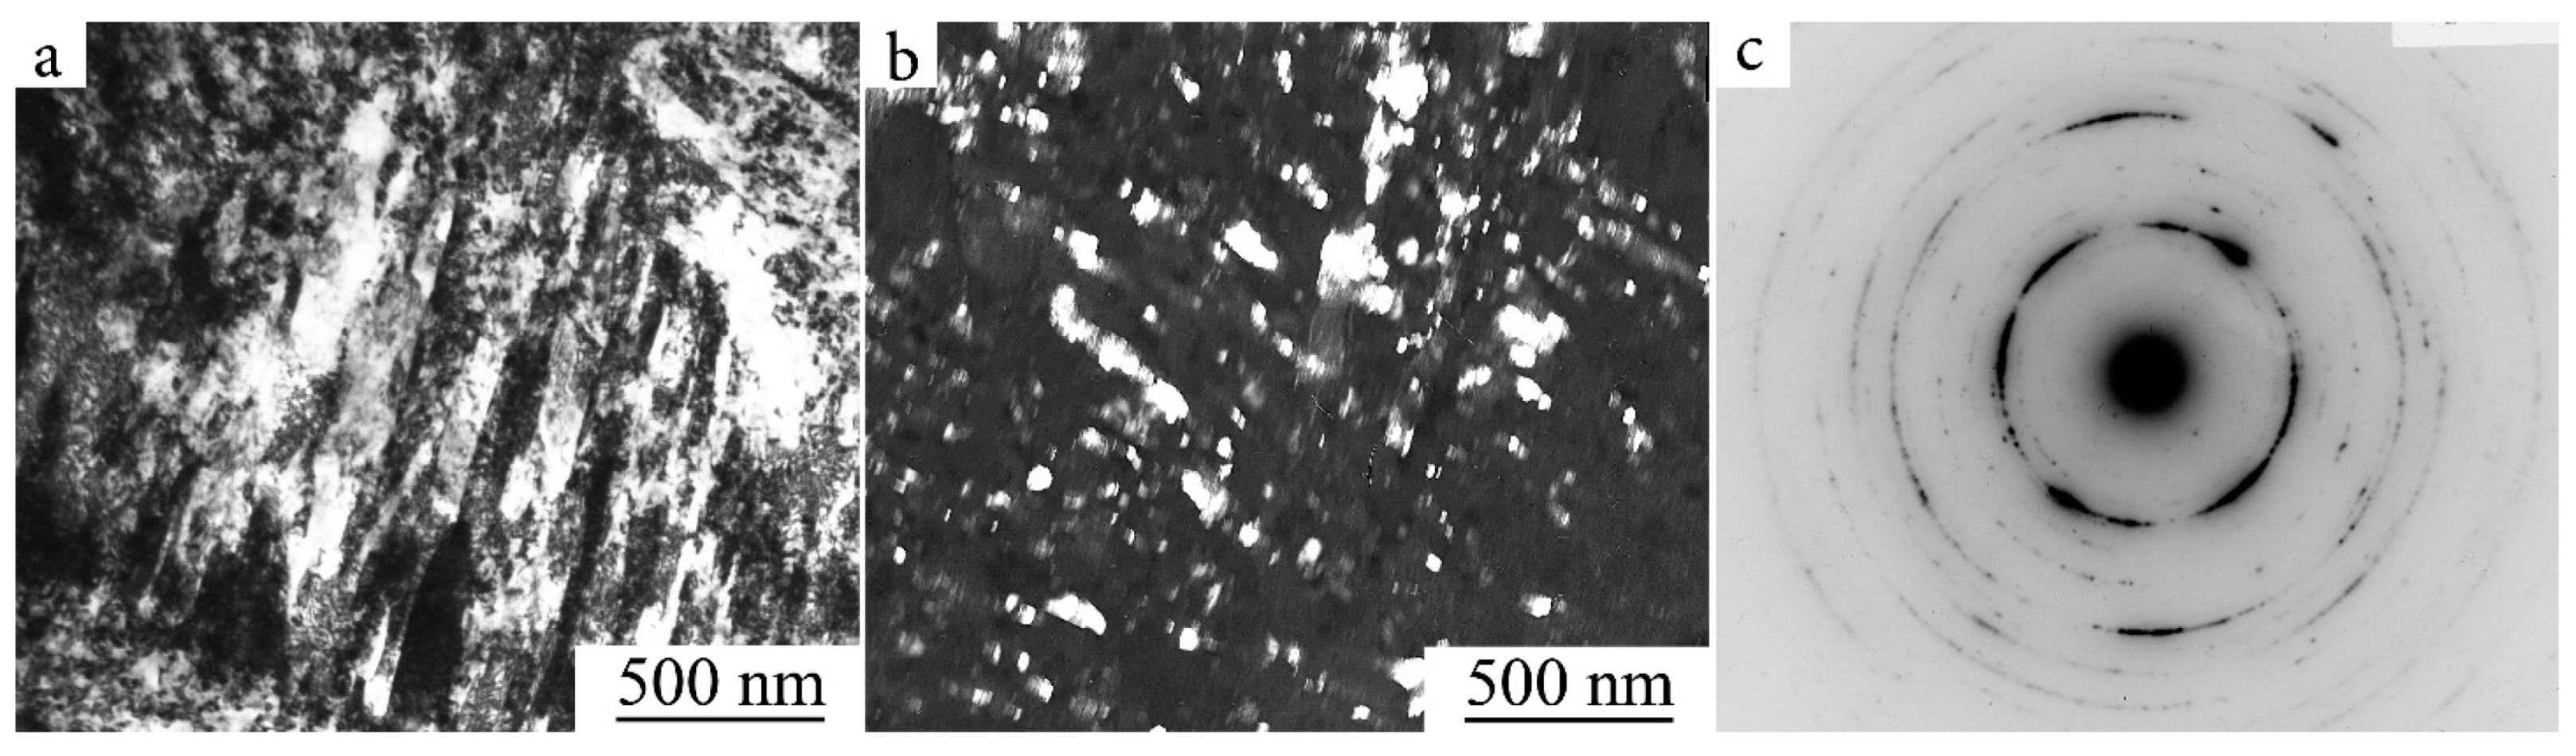
3.3.3. The Effect of Cold MPR and PDHT on the Structure and Mechanical Properties of the SME Ti49Ni51 Alloy

Cold MPR by 30% of the SME Ti49Ni51 alloy did not lead to a deformation-induced TMT, namely, B2 → B19’. TEM studies have shown that the deformed state of B2 austenite is characterized by a high number density of the uniformly distributed mainly-mixed super dislocations of a<100> type, with a dislocation line along the closely packed directions <111>B2, localized in the sliding planes {110}B2. According to [54], the high number dislocation density is estimated as ~1010 cm−2. Figure 22 shows that within the individual grains, dislocation sliding took place along several closely packed crystallographic planes of {110} type. These sliding dislocations were detected in the form of a band substructure at certain orientations of crystallite grains (for example, with z.a. <111>). As the trace analysis showed, the bands are oriented according to the systems {110}<1 1 ¯ 0>B2 (Figure 22a,b). On the TEM image, at a higher magnification, one can feel a tendency to some cellular dislocation substructure being observed between thickenings of the contrast from inclined deformation microbands (Figure 22b). The average distance between each of the neighboring microbands was 0.2–0.3 µm. According to the SAED-pattern data, the total crystallographic azimuthal misorientation within the limits of SD of 1 µm reaches 25–30° (Figure 22c).
PDHT at 373 or 473 K also did not lead to the TMT B2 → B19’ (Figure 23). The high number density and uniformity of the dislocation distribution, as well as the band micromorphology of their localization, are still preserved. Since the predominant systems of sliding of superdislocations are the planes {110}, and the unit vector e of the line of superdislocation, which (e) is directed along <111>, and the Burgers vector b = a<001> both belong to a specific given plane {110}B2, the possibilities of thermally activated processes of transverse sliding of such dislocations, their crawling, and their annihilation are extremely limited with increasing temperature. However, from the analysis of the SAED patterns shown in Figure 22c and Figure 23d, it follows that the total misorientation of cellular fragments of the band dislocation microstructure after PDHT at 473 K showed an increase and the distribution of B2 reflections acquired a continuous ring shape (cf. SAED patterns in Figure 22c and Figure 23c obtained at application in both cases of the same SD of 1.0 µm). In these cases, it should be noted that the increase in large-angle misorientation and the appearance of flat nanofragments with a size of ~50 nm, free from dislocations and oriented at an angle to the traces of the band microstructure (in Figure 23a shown by arrows), both are indicative of the beginning of the recrystallization process. At the same time, highly disperse “shining” nanoparticles, which by themselves are nickel-enriched nanoprecipitates based on the metastable phase X-Ni4Ti3, were also observed in dark-field images (see Figure 23b).
PDHT at 573 K changed the phase composition and microstructure of the alloy (Figure 24). Crystals of B19’ and R martensite appeared. Figure 24 also shows that martensitic crystals have a high number density of thin nanotwins. A typical example of an annular SAED pattern, i.e., Figure 24c, shows the presence—in the alloy after MPR by 30% and PDHT at 573 K—of elements of the substructure of martensite and, possibly, of B2 austenite, with large-angle misorientations. In addition, particles of the X-Ni4Ti3 and Ti4Ni2Ox phases are observed. Thus, the depletion of Ni of the alloy at PDHT leads, upon its subsequent cooling to RT, to the direct TMT in the alloy, i.e., to an increase in Ms above RT (and, accordingly, to an increase in the temperature Md of the start of the TMT during deformation or mechanical tests). Separately, Figure 24d shows the SAED pattern obtained from R martensite, and the neighboring SAED pattern exhibits reflections of all the phases, B19’, R, X-Ni4Ti3, and Ti4Ni2Ox (Figure 24c).
Figure 25 illustrates the microstructure typical of the alloy after MPR and PDHT at 673 K. It can be seen that the substructure of the alloy has changed significantly, retaining the characteristic annular distribution of phase reflections in SAED. The TEM images of the alloy microstructure presented in Figure 25 after the alloy’s MPR, PDHT at 673 K, and cooling to RT demonstrate, firstly, radical (scale) refinement of the martensitic substructure, as is evidenced by the appearance, along with the annular distribution of reflections in the SAED pattern (Figure 25c, SD 1.0 µm) of their single-crystal networks, proving the presence of the R and B19’ martensitic phases (Figure 25d corresponds to using a smaller SD of 0.3 µm). In this case, Figure 25d shows a combined single-crystal SAED pattern, with the zone axis of the reflecting planes of the [110] type for twinned B19’ martensite. Secondly, the UFG alloy structure obtained in result mainly contained B19’ martensite.
Analysis of bright- and dark-field images showed that the alloy has a UFG structure with an interval of predominant grain sizes of 100–200 nm. The distribution of reflections is indicative of the presence in the alloy of various crystallographically equivalent martensite variants corresponding to orientation relationships (o.r.) close to Bain o.r.: {100}B2||(100)B19’; <011>B2||[010]B19’; <01 1 ¯ >B2||[001]B19’. Finally, according to TEM data, a large number of X-Ni4Ti3 precipitates are present in the alloy.
Figure 26 represents the UFG structure of the alloy subjected to MPR and PDHT at 773 K. In this case, it is possible that grains became slightly larger (the prevailing sizes vary within 150–200 nm). On the whole, it can be seen that the alloy still contains thinly-twinned crystals of the R and the B19’ martensite along with highly disperse Ni4Ti3 particles in accordance with the data of the analysis of the SAED patterns (including Figure 26c,d). The combined SAED pattern in Figure 26d has been obtained using SD 0.3 µm and contains networks of reflections from the phases R, B19’, and Ni4Ti3.
Figure 27 shows TEM images typical of the UFG alloy subjected to MPR and PDHT at 873 K. In this case, due to the absence of decomposition, the austenitic structure of the alloy after primary recrystallization is virtually preserved when cooled to RT (Figure 27a,c). However, a certain amount of B19’ martensite at the UFG boundaries and in individual grains are visible on the dark-field image in martensitic reflections (Figure 27b) and visible in the SAED pattern (insert in Figure 27c). At the same time, neither reflections nor diffraction contrast from Ni4Ti3 particles were virtually observed.
Figure 18c and Table 6 display the mechanical properties of the Ti49Ni51 alloy after quenching, MPR by 30%, and PDHT. It can be seen that MPR by 30% leads to an increase in σu from 940 MPa to 1490 MPa and σy from 550 MPa to 920 MPa, and a decrease in δ from 42 to 30%. The use of PDHT caused, starting from 673 K up to 973 K, a gradual decrease in σu and an increase in σm (and then in σy) and δ (up to 60%). The mechanical properties of the alloy after PDHT at 973 K virtually coincided with the properties of the quenched alloy.
With an increase in the PDHT temperature in the temperature range of 373–673 K of tested Ti49Ni51 alloy, an increase in σu and σy was revealed with a decrease in the value of σm from 450 MPa to 150 MPa and the persistency in the value of δ. Taking into account the phase composition and microstructure, it can be concluded that such a hardening effect is associated with the development of the thermodeformationally-induced decomposition processes and primary recrystallization, with the formation of a UFG structure under the barrier action of precipitation of the highly disperse nickel-enriched particles of X-Ni4Ti3 phase homogeneously and heterogeneously found to localize on the structural defects (primarily dislocations and sub-boundaries). Whereas the next stage of softening is mainly due to the coarsening of the UFG structure and particles during recrystallization at elevated PDHT temperatures, including those effects to which this stage is also due, namely the acceleration of the kinetics of recrystallization and the reduction or termination of the barrier effect of precipitates, the volume fraction of which decreases significantly at higher temperatures with an increase in their sizes. PDHT at 973 K in the absence of decomposition during the same exposure interval led to the restoration of the original grain structure of the alloy (grain size in the range of 45–50 µm) due to the completion of the primary recrystallization process and, as a consequence, to the recovery, or the return of mechanical properties, to the initial values of the quenched alloy (Table 6).
Analysis of the fracture surface after mechanical tensile tests of the Ti49.5Ni50.5,Ti49.4Ni50.6, and Ti49Ni51 alloys at RT to their failure showed that the character of the fracture by the deformation-induced and microstructural features is tough, with high dispersity of dimples (or cups) of separation (Figure 28).
Fractographic patterns of the alloys after quenching, MPR with over-all compression by 30%, ECAP, HPT, and also after PDHT virtually do not differ in all the regimes of mode. The dimensions of the dimples (or cups) are on average several micrometers (Figure 28). However, if, for the alloys after quenching or MPR by 30%, these sizes are an order of magnitude smaller than the grain sizes, then, in the case of the UFG alloys after MPR, ECAP, HPT, and PDHT, on the contrary, they are more than an order of magnitude larger than the average sizes of ultrafine grains. In this case, this circumstance indicates a special intercrystalline, rather than a transcrystalline type of tough fracture occurring, obviously, along the large-angle boundaries of the UFG structure of alloys. It should also be noted that, as a rule, globular primary carbonitrides and titanium oxides of the order of one or two micrometers in size were often visible at the bottom of the fracture cups of separation.

3.4. The Effect of SIMT on the Phenomena of the Thermomechanical Shape Memory and Super-Elasticity of Bulk Alloys

As is already noted, TMT in low-moduli metastable alloys, especially in Ti-Ni ones, when deformed due to martensitic inelasticity caused by SIMT, provides for special and practically important thermomechanical effects: SME—the ability of the alloy to restore its original shape when heated to an austenitic state; SEE—the ability of the alloy to experience a large (up to 10–15%) deformation after mechanical loading, which is completely or partially recovered when the load is removed. Figure 29 demonstrates these effects in the form of curves of the accumulation and recovery of deformation in isothermal cycles during torsion tests. Mechanical tests were performed on the quenched CG Ti49.4Ni50.6 (Figure 29a) and Ti49.8Ni50.2 (Figure 29c) and UFG alloys of the same compositions were obtained by ECAP (Figure 29b,d). It can be seen that the quenched CG alloys show SEE with incomplete recovery of deformation, whereas the UFG alloys differ in the value of complete recovery of deformation when the load is removed.
Figure 30 shows the typical loading and unloading diagram SEE (Figure 30a) and SME (Figure 30b,c) of the quenched CG Ti49Ni51 alloy at temperatures (a,b) above and close to Ms, and (c) below Ms, with inserts of fragments of XRD diffractograms. Figure 30 clearly shows the evolution of the phase state during loading and unloading when a complete SEE (Figure 30a) or partial SEE (Figure 30b,c) is realized. In the latter case, the PDHT of alloys will provide for the SME with a complete restoration of the original shape and dimensions of the alloy samples.

4. Summary and Conclusions

Thus, in this paper, monolithic bulk high-strength and ductile UFG TiNi-based alloys were produced using the following methods of severe megaplastic deformation: extremely high pressure torsion, multiple equal channel angular pressing, deformation by multiple rolling or drawing, and combination of these methods and annealing. It has been established that the processes of recrystallization in the annealing-assisted, dynamic, or post-dynamic modes in the alloys subjected to ECAP or rolling, as well as to devitrification from the amorphous state obtained by HPT, represent unique technologies for the synthesis of UFG bulk states in metastable low-moduli titanium nickelide alloys. These technologies make it possible to significantly reduce and control the optimal grain size within narrow limits under all these external influences for both 3D bulk and long-dimensional small-sized semi-finished alloys based on Ti–Ni. These high-strength and ductile alloys are distinguished by high reversible deformations and reactive stresses necessary to create thermo-forceful SME actuators and sensors with thermomechanical, thermocyclic, and mechanocyclic reliability and durability, and with high corrosion resistance. Detailed studies of the fine structure of morphological and phase features and the mechanical behavior of alloys in the initial CG and UFG states were carried out. From the analysis of the results obtained, taking into account the literature data, the following main conclusions can be drawn.
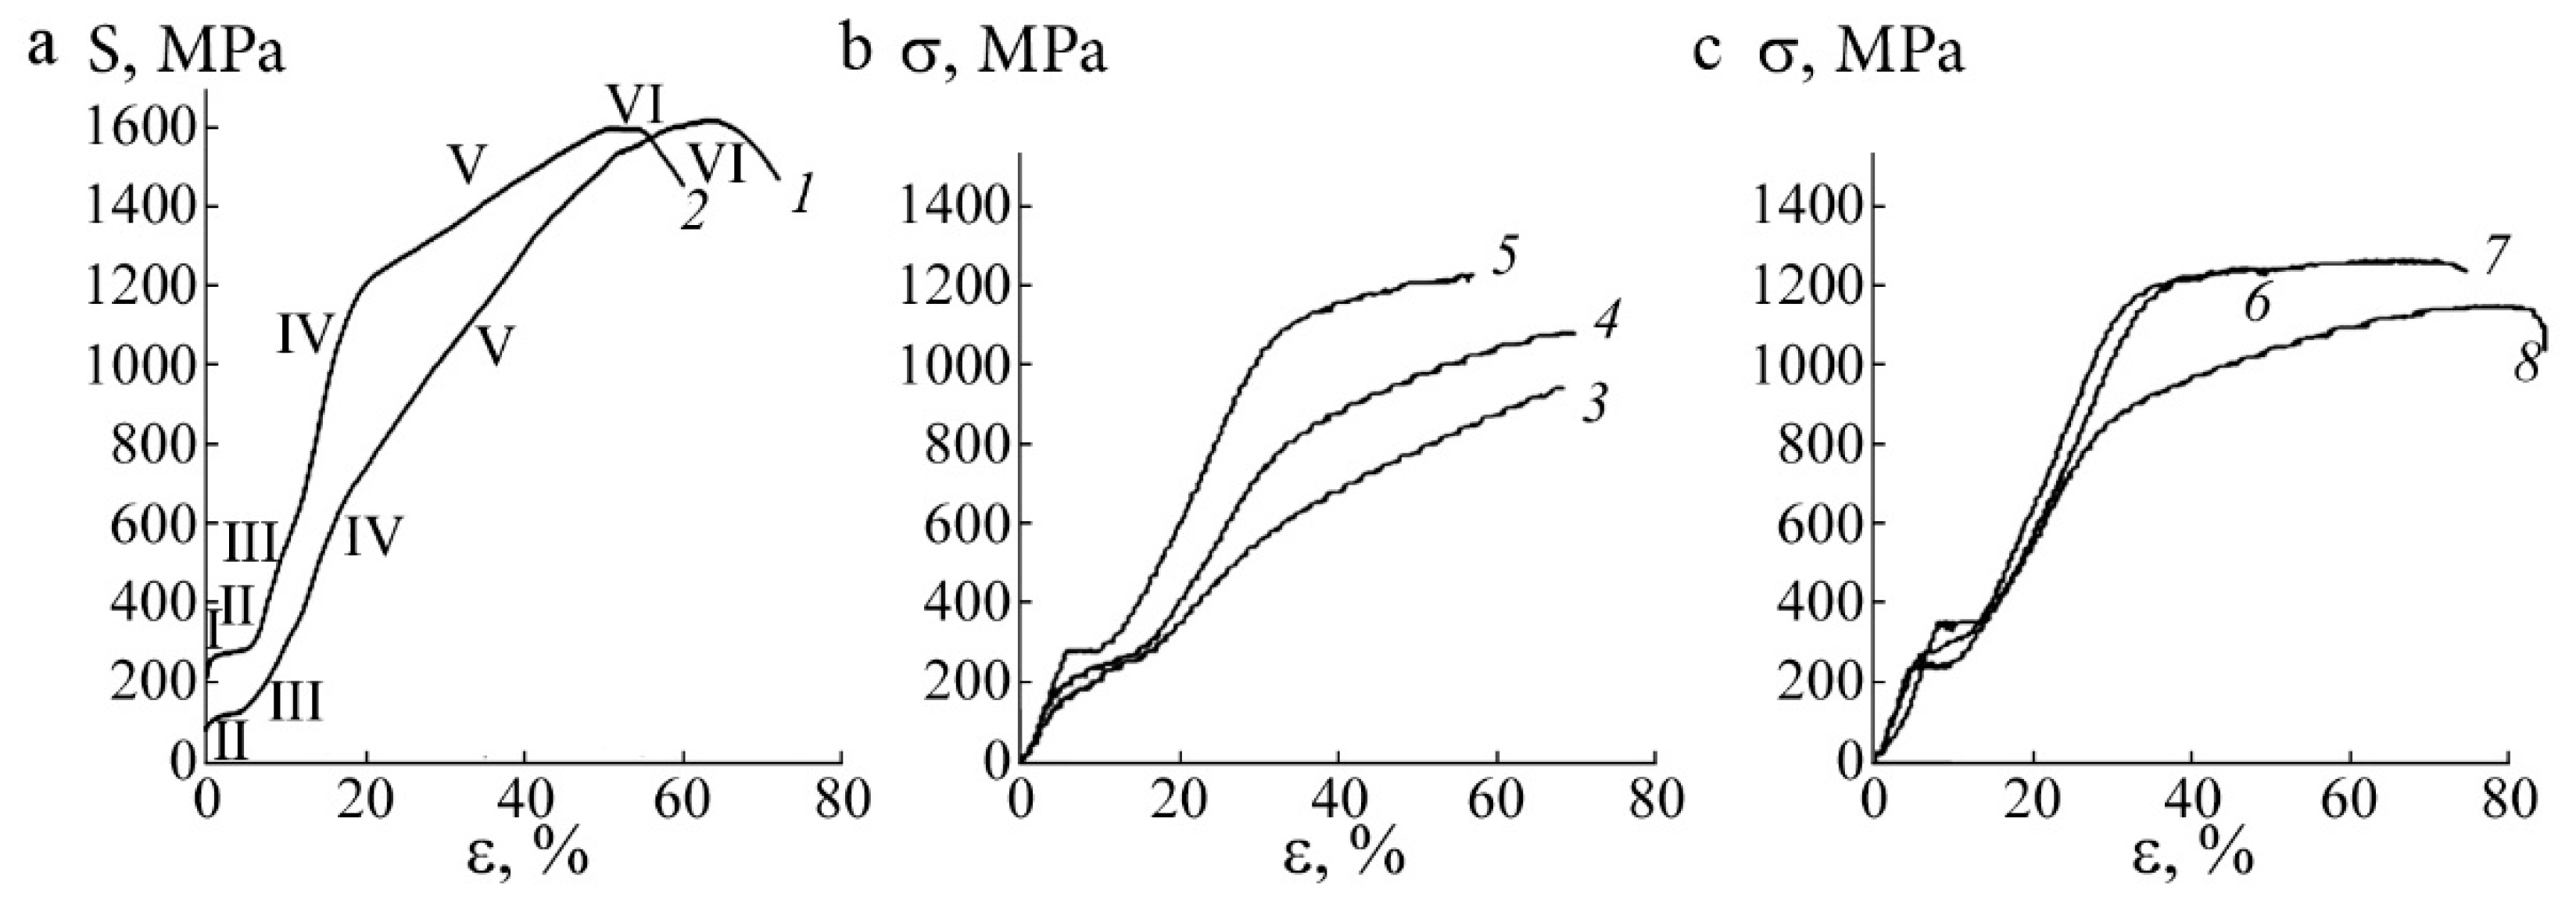
  • The special mechanical behavior of the studied alloys, which is responsible for the complex of their abnormally high effects of shape memory and superelasticity, strength, plasticity, and deformation hardening, is physically caused by their low elasticity moduli and their isotropy not only in the pre-martensitic state of B2 austenite, but also in the state of B19′ martensite.
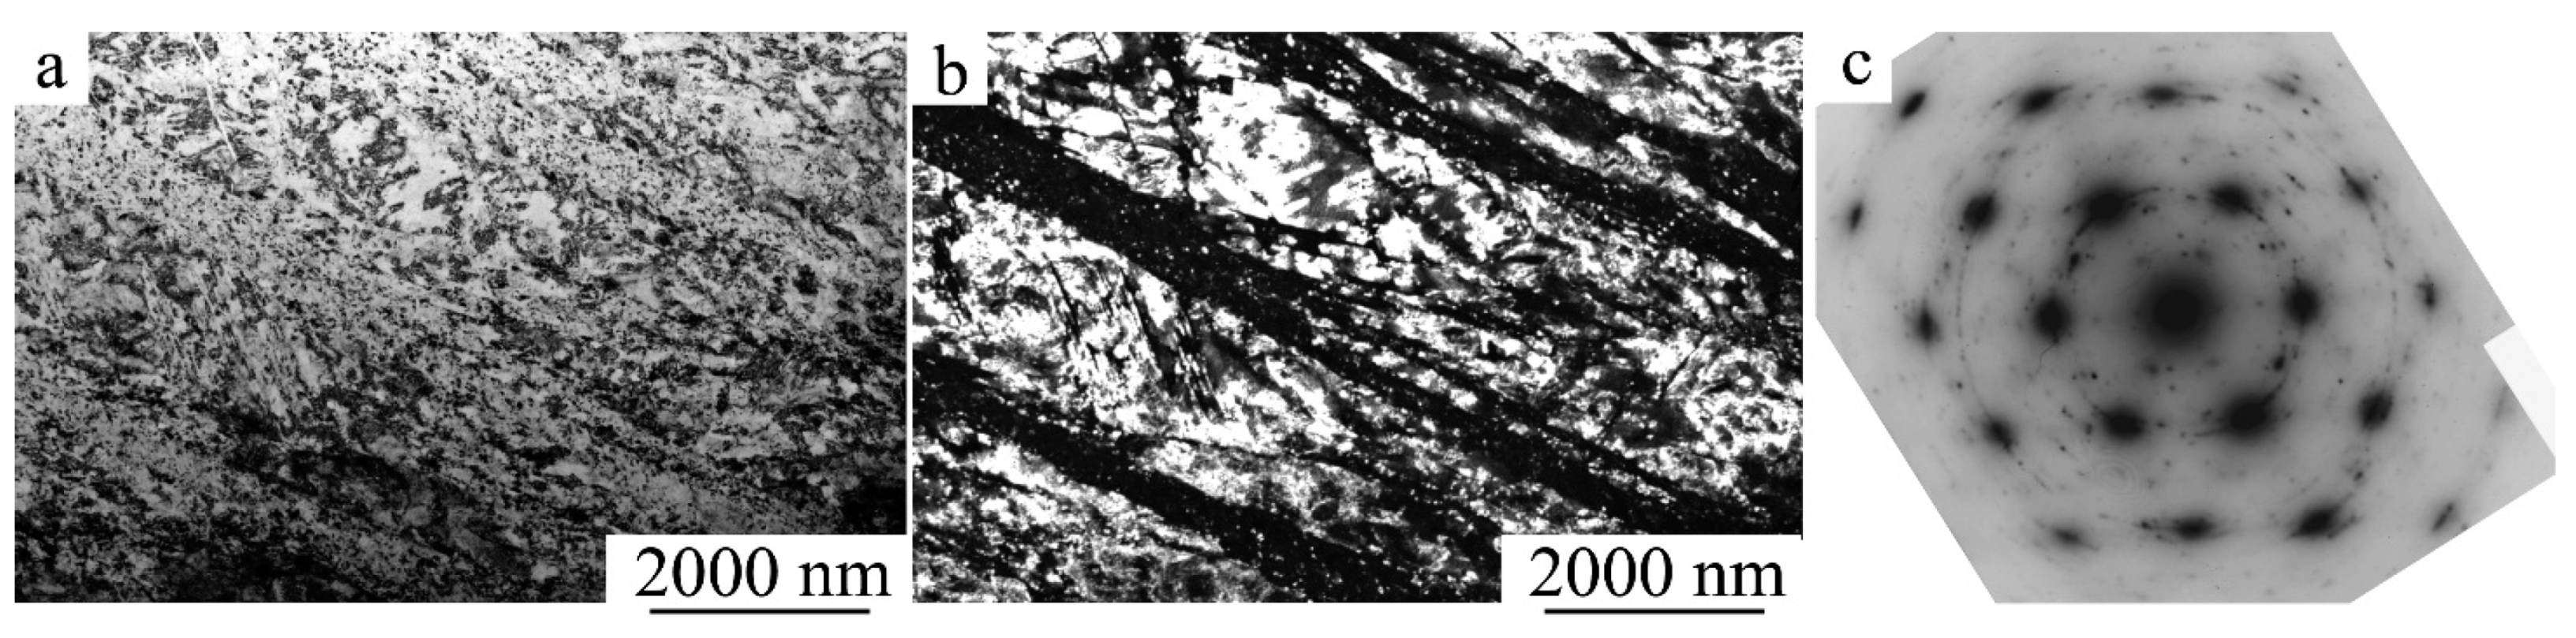
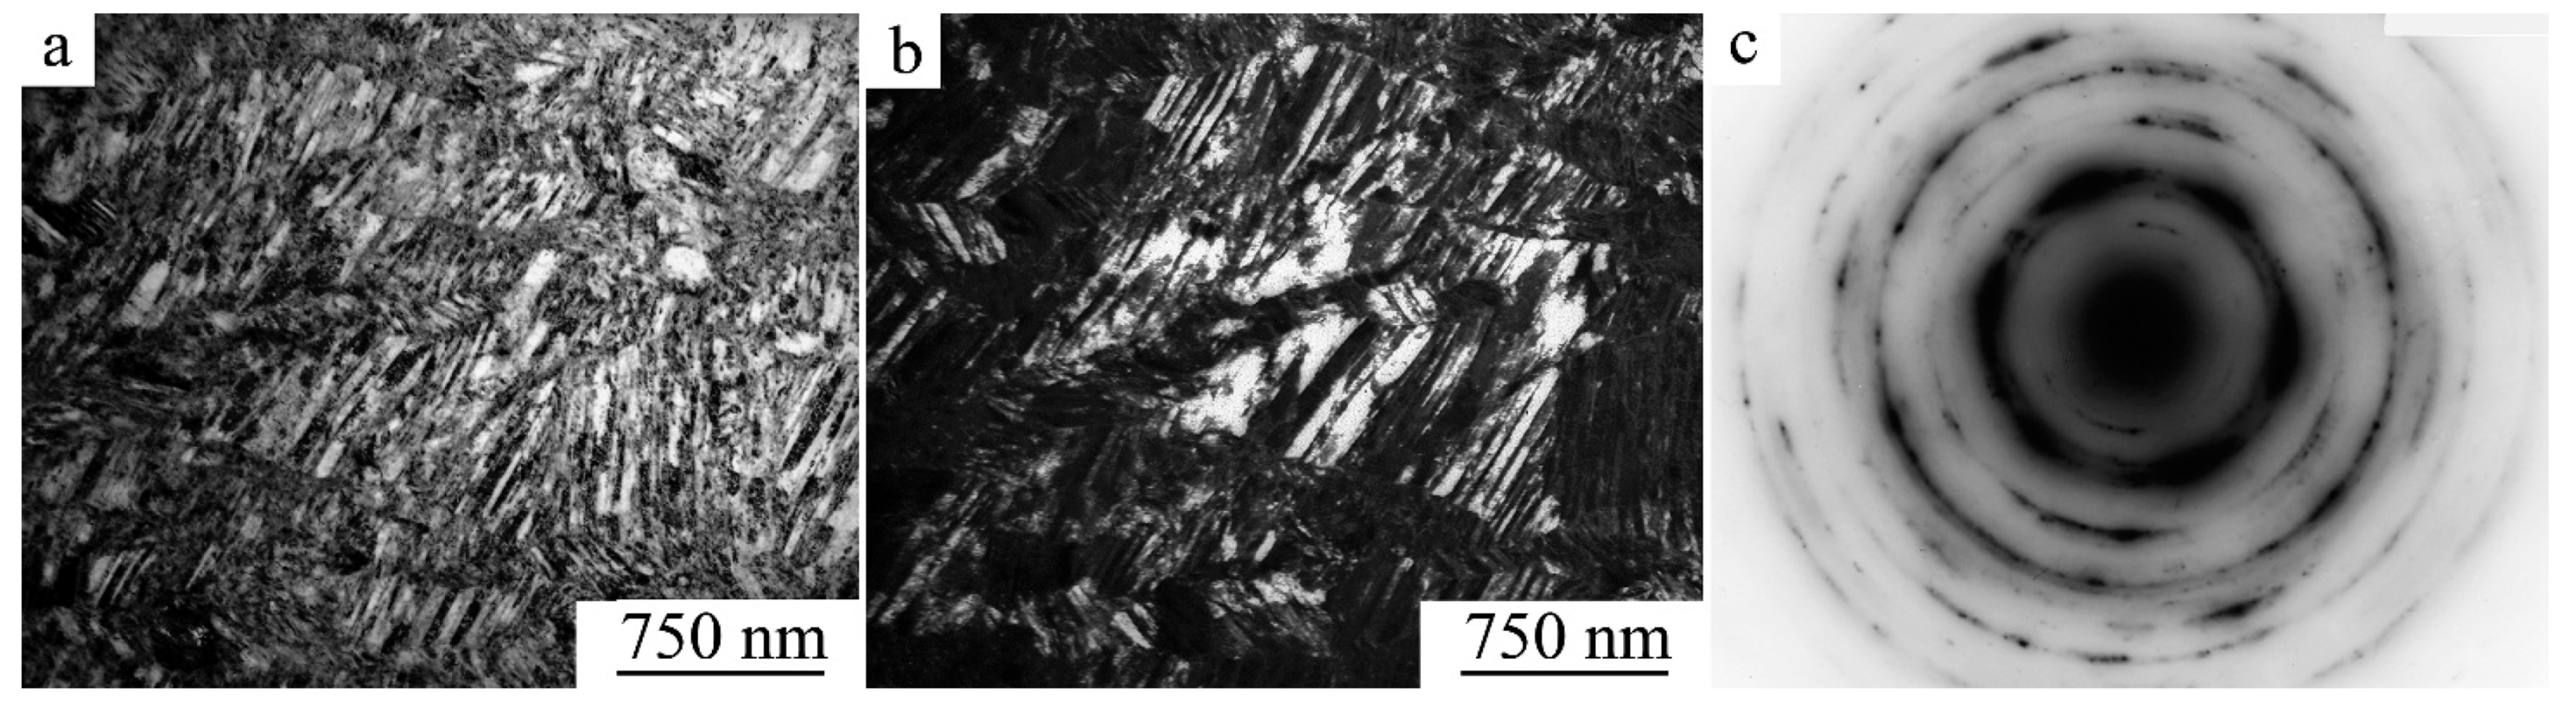
  • As a consequence, during mechanical tests (or during practical use in actuators in superelasticity modes), a specific mechanism of superelastic stress-induced martensitic transformation (SIMT effect) is first implemented. At stresses above the dislocation-assisted fluidity limit (i.e., yield stress), the homogeneous planar dislocation sliding and mechanical twinning are effectively realized with the progressive formation of a developed band substructure with a high number density of the dislocations and mechanical nanotwins uniformly distributed in nanograins, where all the latter ultimately determine the effect of superplasticity by strain-assisted martensitic transformation (SAMT).
  • This combined mechanism of the deforming and strengthening simultaneously provides both the high deformation hardening homogeneous alloy volume and the effective relaxation of peak stresses, preventing by itself (i) the transition to premature localization of deformation in the alloy and (ii) its destruction during a long period of accumulation of the degree of deformation.
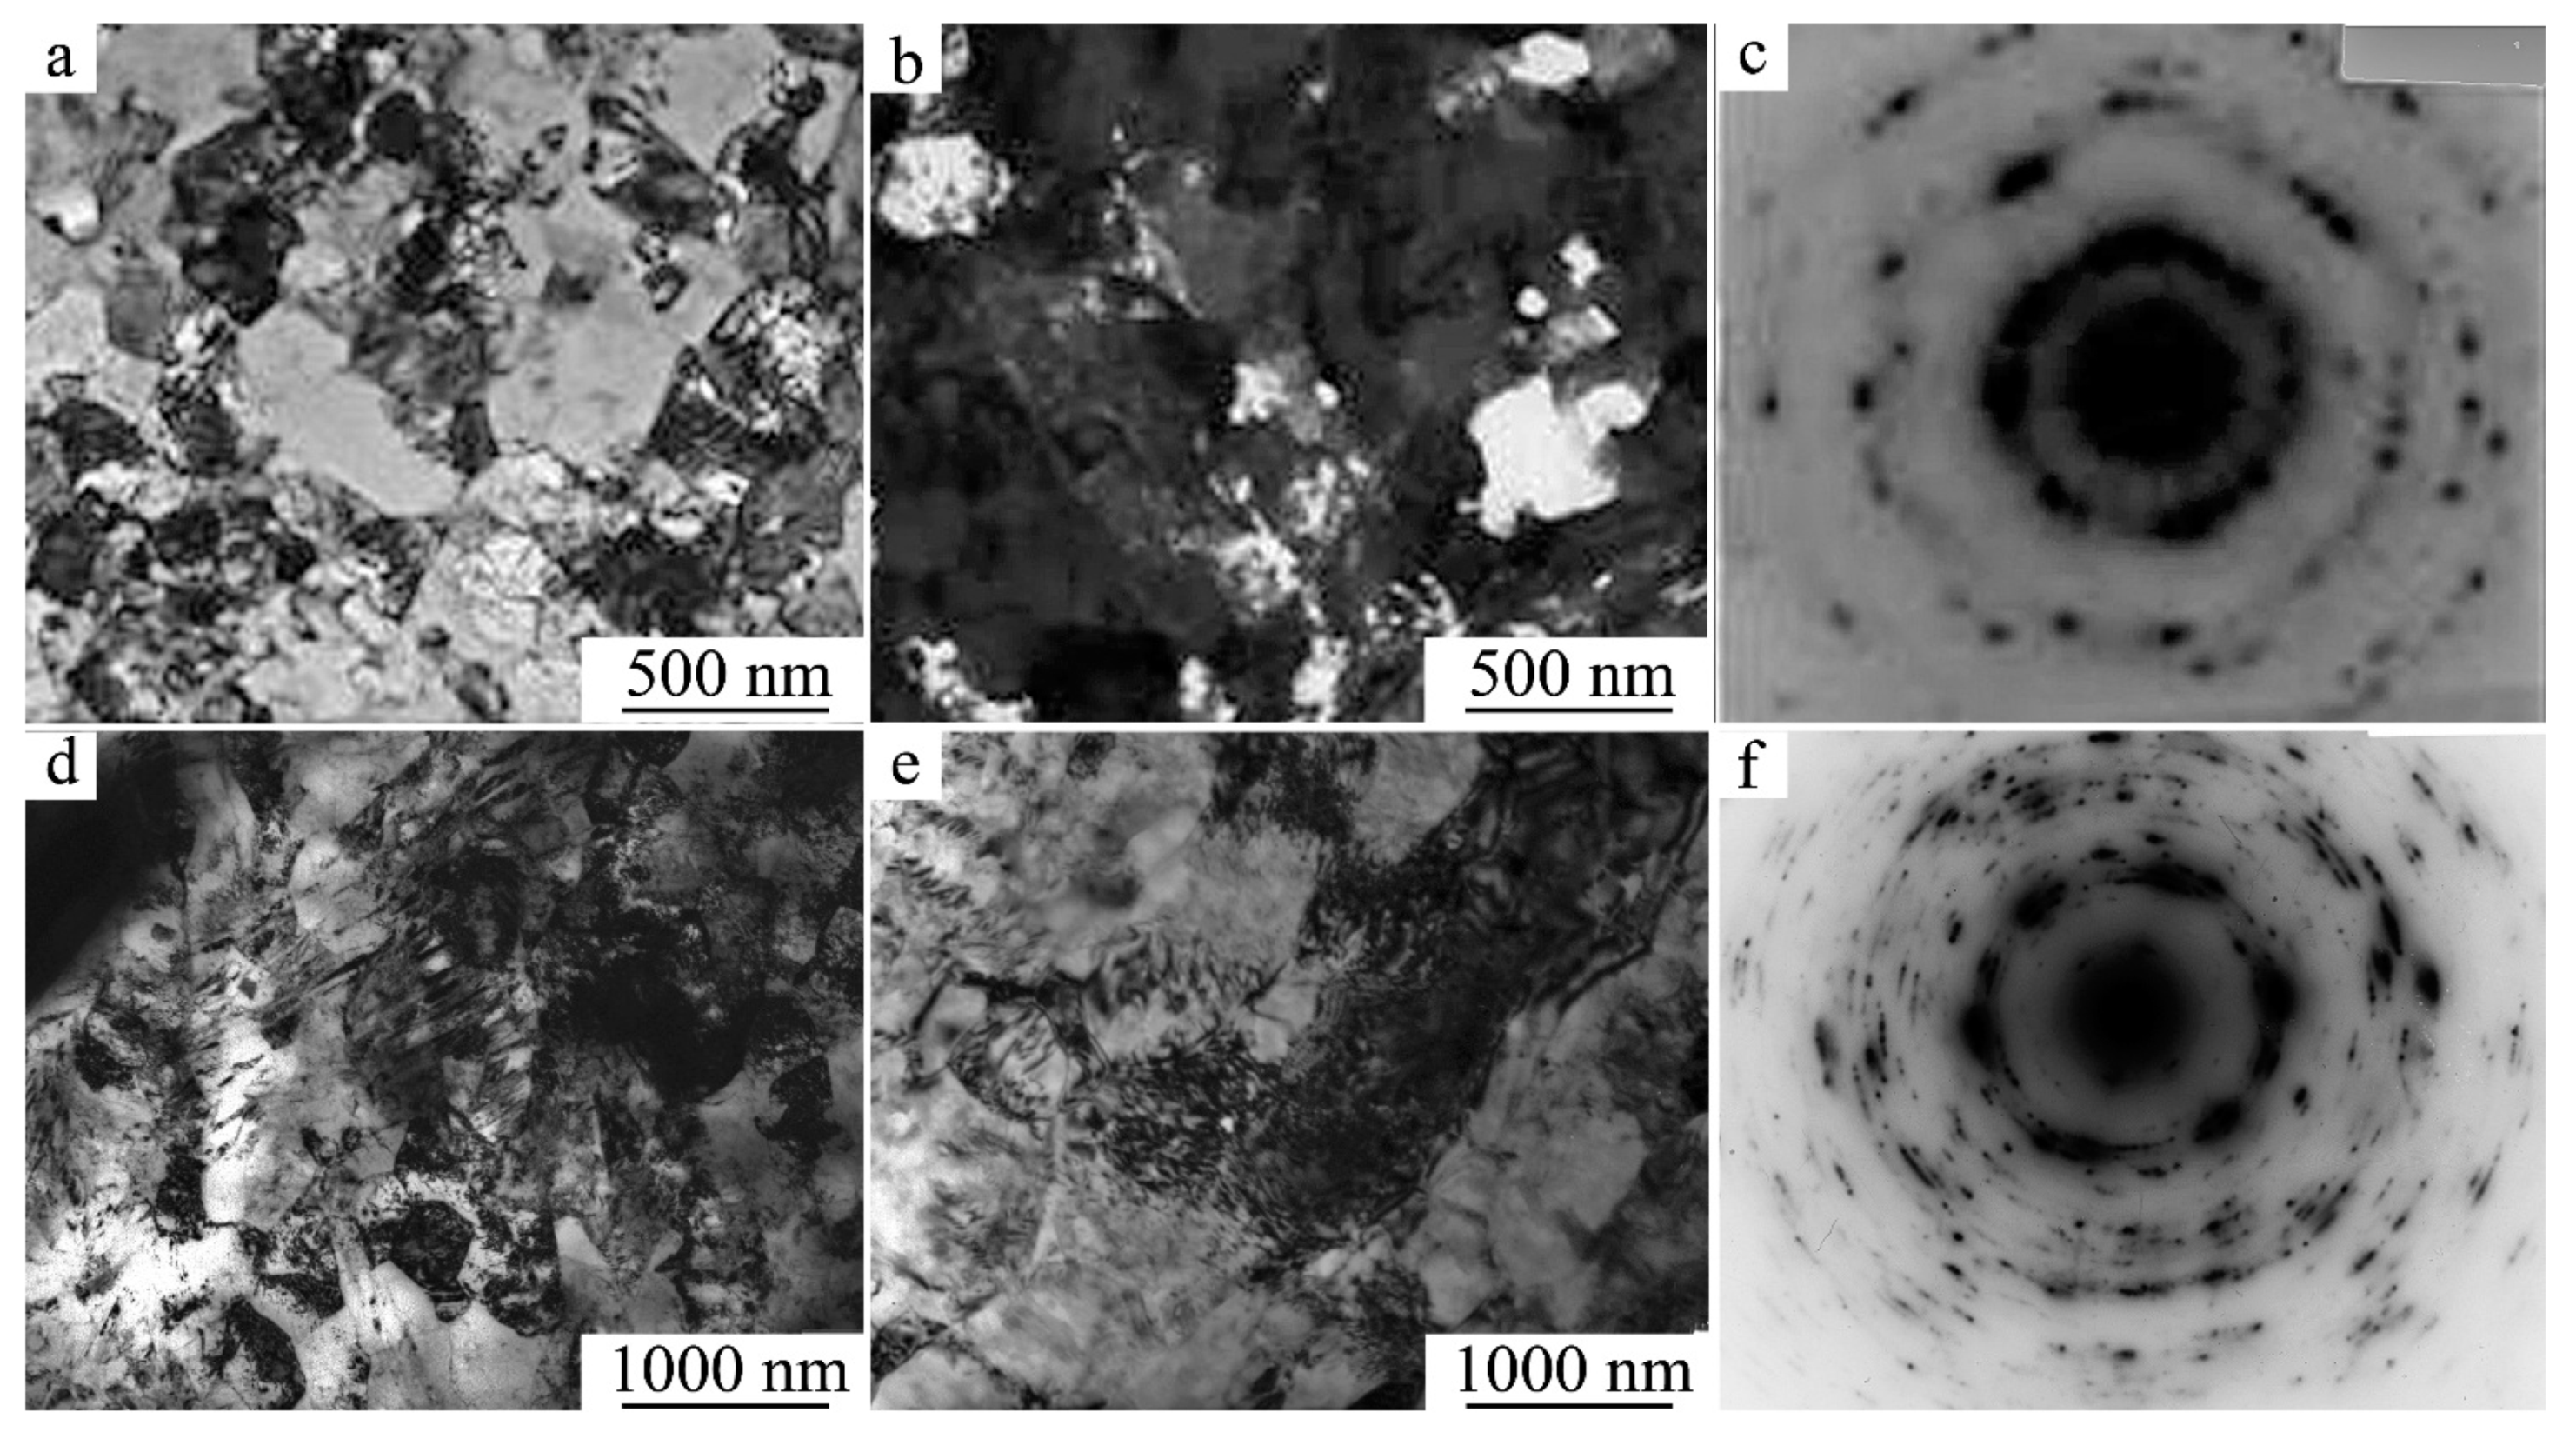
  • In alloys that are metastable with respect to martensitic transformations, an important independent process of the hardening and concurrent relaxation of excess stresses is the deformation-induced size refinement of the grain and subgrain structure—under various mechanically activated external effects—in both B2 austenite and B19′ martensite at the stage of developed plastic deformation, up to the formation of UFG, nanostructured, or even amorphous states in them (for example, during mechanical tests).
  • The studied UFG titanium nickelide alloys, obtained by various technological schemes and depending on the chemical composition, demonstrate an attractive set of mechanical properties, including strength, plasticity, shape memory effects, superelasticity, high damping, and other characteristics.
  • It is shown that in Ti49.8Ni50.2 and Ti49.4Ni50.6 UFG alloys, which are not subject to homogeneous aging, the use of multi-pass ECAP (including that with PDHT in combination) leads to a high-strength (σu up to 1200 MPa) and ductile (δ up to 60–70%) condition of the materials.
  • It was found that in the aging-prone UFG alloys (namely, the alloy Ti49.5Ni50.5 is prone to heterogeneous decomposition and the alloy Ti49Ni51 is prone to the homogeneous type), the use of multi-pass rolling in combination with PDHT provides for high strength (σu up to 1400–1500 MPa) and increased plasticity (δ 25–30%) due to operation of the combined mechanism of recrystallization and decomposition, with the precipitation of disperse X-Ni4Ti3 nanoparticles.

Author Contributions

Conceptualization, V.G.P.; methodology, N.N.K. and V.V.M.; investigation, V.G.P., N.N.K., V.V.M. and Y.M.U.; writing—review and editing, V.G.P., N.N.K., V.V.M. and Y.M.U. All authors have read and agreed to the published version of the manuscript.

Funding

This work was performed within the framework of state task “Structure”, grant No. 122021000033-2.

Institutional Review Board Statement

Not applicable.

Informed Consent Statement

Not applicable.

Data Availability Statement

Not applicable.

Conflicts of Interest

The authors declare no conflict of interest. The funders had no role in the design of the study; in the collection, analyses, or interpretation of data; in the writing of the manuscript, or in the decision to publish the results.

References

  1. Kaufman, L.; Kohen, M. Thermodynamics and Kinetics of Martensite Transformations. In Progress Metal Physics. V. 7; Pergamon Press: London, UK; New York, NY, USA; Paris, France; Los Angeles, CA, USA, 1958. [Google Scholar]
  2. Kurdyumov, G.V.; Utevsky, L.M.; Entin, R.I. Transformations in Iron and Steel; Nauka: Moscow, Russia, 1977. (In Russian) [Google Scholar]
  3. Perkins, J. (Ed.) Shape Memory Effects in Alloys; Plenum: London, UK, 1975. [Google Scholar]
  4. Otsuka, K.; Shimizu, K.; Suzuki, Y.; Sekiguchi, Y.; Tadaki, C.; Honma, T.; Miyazaki, S. Shape Memory Alloys; Funakubo, H., Ed.; Funakubo: Kyoto, Japan, 1984. [Google Scholar]
  5. Duering, T.W.; Melton, K.L.; Stockel, D.; Wayman, C.M. (Eds.) Engineering Aspects of Shape Memory Alloys; Butterworth-Heineman: London, UK, 1990. [Google Scholar]
  6. Khachin, V.N.; Pushin, V.G.; Kondratyev, V.V. Titanium Nickelide: Structure and Properties; Nauka: Moscow, Russia, 1992. (In Russian) [Google Scholar]
  7. Pushin, V.G.; Kondratyev, V.V.; Khachin, V.N. Pretransition Phenomena and Martensitic Transformations; UrO RAN: Yekaterinburg, Russia, 1998. (In Russian) [Google Scholar]
  8. Otsuka, K.; Wayman, C.M. Shape Memory Materials; Cambridge University Press: Cambridge, UK, 1999. [Google Scholar]
  9. Rodriguez, C.; Brown, L.C. The thermal effect due to stress-induced martensite formation in β-CuAlNi single crystals. Metall. Mater. Trans. 1980, 11, 147–150. [Google Scholar]
  10. Qian, S.; Geng, Y.; Wang, Y.; Pillsbury, T.E.; Hada, Y.; Yamaguchi, Y.; Fujimoto, K.; Hwang, Y.; Radermacher, R.; Cui, J.; et al. Elastocaloric effect in CuAlZn and CuAlMn shape memory alloys under compression. Phil. Trans. R. Soc. 2016, 374, 20150309. [Google Scholar] [CrossRef] [Green Version]
  11. Mañosa, L.; González-Alonso, D.; Planes, A.; Bonnot, E.; Barrio, M.; Tamarit, J.-L.; Aksoy, S.; Acet, M. Giant solid-state barocaloric effect in the Ni-Mn-In magnetic shape-memory alloy. Nat. Mater. 2010, 9, 478–481. [Google Scholar] [CrossRef] [PubMed] [Green Version]
  12. Bonnot, E.; Romero, R.; Mañosa, L.; Vives, E.; Planes, A. Elastocaloric effect associated with the martensitic transition in shape-memory alloys. Phys. Rev. Lett. 2008, 100, 125901. [Google Scholar] [CrossRef] [PubMed] [Green Version]
  13. Bechtold, C.; Chluba, C.; De Miranda, R.L.; Quandt, E. High cyclic stability of the elastocaloric effect in sputtered TiNiCu shape memory films. Appl. Phys. Lett. 2012, 101, 091903. [Google Scholar] [CrossRef]
  14. Cui, J.; Wu, Y.; Muehlbauer, J.; Hwang, Y.; Radermacher, R.; Fackler, S.; Wuttig, M.; Takeuchi, I. Demonstration of high efficiency elastocaloric cooling with large δT using NiTi wires. Appl. Phys. Lett. 2012, 101, 073904. [Google Scholar] [CrossRef] [Green Version]
  15. Mañosa, L.; Jarque-Farnos, S.; Vives, E.; Planes, A. Large temperature span and giant refrigerant capacity in elastocaloric Cu-Zn-Al shape memory alloys. Appl. Phys. Lett. 2013, 103, 211904. [Google Scholar] [CrossRef]
  16. Gschneidner, K.A., Jr.; Pecharsky, V.; Tsokol, A. Recent developments in magnetocaloric materials. Rep. Prog. Phys. 2005, 68, 1479–1539. [Google Scholar] [CrossRef]
  17. Planes, A.; Mañosa, L.; Acet, M. Magnetocaloric effect and its relation to shape memory properties in ferromagnetic Heusler alloys. J. Phys. Condens. Matter. 2009, 21, 233201. [Google Scholar] [CrossRef] [Green Version]
  18. Moya, X.; Stern-Taulats, E.; Crossley, S.; González-Alonso, D.; Kar-Narayan, S.; Planes, A.; Mañosa, L.; Mathur, N.D. Giant electrocaloric strength in single-crystal BaTiO3. Adv. Mater. 2013, 25, 1360–1365. [Google Scholar] [CrossRef]
  19. Smith, A.; Bahl, C.R.; Bjørk, R.; Engelbrecht, K.; Nielsen, K.K.; Pryds, N. Materials challenges for high performance magnetocaloric refrigeration devices. Adv. Energy Mater. 2012, 2, 1288–1318. [Google Scholar] [CrossRef]
  20. Mischenko, A.; Zhang, Q.; Scott, J.; Whatmore, R.; Mathur, N. Giant electrocaloric effect in thin-film PbZr0.95Ti0.05O3. Science 2006, 311, 1270–1271. [Google Scholar] [CrossRef] [PubMed] [Green Version]
  21. Razov, A.I. Application of titanium nickelide-based alloys in engineering. Phys. Met. Metallogr. 2004, 97, S97–S126. [Google Scholar]
  22. Deng, Z.; Lee, Q.; Onuki, Y.; Sun, Q. Multifunctional nanostructured NiTi alloys with Invar, Evinvar and Rinvar properties. J. Alloys Comp. 2022, 909, 164682. [Google Scholar] [CrossRef]
  23. Wilson, J.; Weselowsky, M. Shape Memory Alloys for Seismic Response Modification: A State-of-the-Art Review. Earth. Spectra 2005, 21, 569–601. [Google Scholar] [CrossRef]
  24. Dong, J.; Cai, C.; O’Keil, A. Overview of Potential and Existing Applications of Shape Memory Alloys in Bridges. J. Bridg. Eng. 2011, 16, 305–315. [Google Scholar] [CrossRef]
  25. Cui, J. Shape memory alloys and their applications in power generation and refrigeration. In Mesoscopic Phenomena in Multifunctional Materials; Saxena, A., Planes, A., Eds.; Springer: Berlin/Heidelberg, Germany, 2014; pp. 289–307. [Google Scholar]
  26. Nakanishi, N. Elastic Constants as They Relate to Lattice Properties and Martensitic Formation. Prog. Mater. Sci. 1980, 24, 143–265. [Google Scholar] [CrossRef]
  27. Pushin, V.G.; Kondratyev, V.V.; Khachin, V.N. Pretransition Phenomena and Martensitic Transformations in Alloys Based on Titanium Nickel. Izvestiya VUZov. Phys. 1985, 27, 5–8. (In Russian) [Google Scholar]
  28. Kondratyev, V.V.; Pushin, V.G. Pretransitional state in Metals, Their Alloys and Compounds: Experimental Results, Structure Models, Classification. Phys. Met. Metallogr. 1985, 60, 629–650. (In Russian) [Google Scholar]
  29. Khachin, V.N.; Muslov, S.A.; Pushin, V.G.; Chumlyakov, Y.I. Anomalies of the Elastic Properties of Single Crystals of TiNi-TiFe. DAN SSSR 1987, 295, 606–609. (In Russian) [Google Scholar]
  30. Kuznetsov, A.V.; Muslov, S.A.; Lotkov, A.I.; Pushin, V.G.; Khachin, V.N.; Grishkov, V.N. Elastic Constants Near the TiNi Martensitic Transformations. Izvestia VUZov. Phys. 1987, 30, 98–99. (In Russian) [Google Scholar]
  31. Muslov, S.A.; Kuznetsov, A.V.; Khachin, V.N.; Lotkov, A.I.; Grishkov, V.N.; Pushin, V.G. Anomalies of the Elastic Constants of Single Crystals Ti50Ni48Fe2 Near Martensitic Transformations. Izvestiya VUZov. Phys. 1987, 30, 104–105. (In Russian) [Google Scholar]
  32. Khachin, V.N.; Muslov, S.A.; Pushin, V.G.; Kondratyev, V.V. Special elastic properties of B2-compounds of titanium with unstable lattice. Metallophysics 1988, 10, 102–104. (In Russian) [Google Scholar]
  33. Pushin, V.G.; Khachin, V.N.; Kondratyev, V.V.; Muslov, S.A.; Pavlova, S.P.; Yurchenko, L.I. Structure and Properties of B2 Compounds of Titanium. I. Pre-Martensitic Phenomena. Phys. Met. Metallogr. 1988, 66, 350–358. (In Russian) [Google Scholar]
  34. Kondratyev, V.V.; Muslov, S.A.; Pushin, V.G.; Khachin, V.N. Structure and Properties of Titanium B2 Compounds. II. Premartensitic Instability of the BCC (B2) Lattice. Phys. Met. Metallogr. 1988, 66, 359–369. (In Russian) [Google Scholar]
  35. Pushin, V.G.; Kondratyev, V.V. Pretransition Phenomena and Martensitic Transformations. Phys. Met. Metallogr. 1994, 78, 40–61. (In Russian) [Google Scholar]
  36. Pushin, V.G.; Khachin, V.N.; Yurchenko, L.I.; Muslov, S.A.; Ivanova, L.Y.; Sokolova, A.Y. Microstructure and Physical Properties of Ti50Ni50-xFex Alloys with Memory Effects. II. Elastic Properties. Phys. Met. Metallogr. 1995, 79, 70–76. (In Russian) [Google Scholar]
  37. Worgull, J.; Petti, E.; Trivisonno, J. Behavior of the elastic properties near an intermediate phase transition in Ni2MnGa. Phys. Rev. B 1996, 54, 15695–15699. [Google Scholar] [CrossRef]
  38. Pushin, V.G. Alloys with a Thermo-Mechanical Memory: Structure, Properties, and Application. Phys. Met. Metallogr. 2000, 90, S68–S95. [Google Scholar]
  39. Ren, X.; Miura, N.; Zhang, J.; Otsuka, K.; Tanake, K.; Koiwa, M.; Suzuki, N.; Chumlykov, Y.I. A Comparative Study of Elastic Constants of Ti-Ni-based Alloys Prior to Martensitic Transformation. Mater. Sci. Eng. A 2001, 312, 196–206. [Google Scholar] [CrossRef]
  40. Sedlak, P.; Seiner, H.; Landa, M.; Novák, V.; Šittner, P.; Manosa, L.I. Elastic Constants of bcc Austenite and 2H Orthorhombic Martensite in CuAlNi Shape Memory Alloy. Acta Mater. 2005, 53, 3643–3661. [Google Scholar] [CrossRef]
  41. Lobodyuk, V.A.; Koval’, Y.N.; Pushin, V.G. Crystal-Structural Features of Pretransition Phenomena and Thermoelastic Martensitic Transformations in Alloys of Nonferrous Metals. Phys. Met. Metallogr. 2011, 111, 165–189. [Google Scholar] [CrossRef]
  42. Pushin, V.; Kuranova, N.; Marchenkova, E.; Pushin, A. Design and Development of Ti–Ni, Ni–Mn–Ga and Cu–Al–Ni-based Alloys with High and Low Temperature Shape Memory Effects. Materials 2019, 12, 2616. [Google Scholar] [CrossRef] [PubMed]
  43. Svirid, A.E.; Pushin, V.G.; Kuranova, N.N.; Makarov, V.V.; Ustyugov, Y.M. Structural and Phase Transformations and Physical and Mechanical Properties of Cu-Al-Ni Shape Memory Alloys Subjected to Severe Plastic Deformation and Annealing. Materials 2021, 14, 4394. [Google Scholar] [CrossRef]
  44. Pushin, V.; Kuranova, N.; Svirid, A.; Ustyugov, Y. Mechanical behavior and structure characterization of a Cu-Al-Ni-based shape memory alloys subjected to isothermal uniaxial mega-plastic compression. Materials 2022, 15, 3713. [Google Scholar] [CrossRef]
  45. Pushin, V.G.; Kuranova, N.N.; Svirid, A.E.; Uksusnikov, A.N.; Ustyugov, Y.M. Design and development of high-strength and ductile ternary and multicomponent eutectoid Cu-based shape memory alloys: Problems and perspectives. Metals 2022, 12, 1289. [Google Scholar] [CrossRef]
  46. Cesare, R.; Pons, J.; Santamarta, R.; Segui, C.; Chernenko, V.A. Ferromagnetic Shape Memory Alloys: An Overview. Arch. Metall. Mater. 2004, 49, 779–789. [Google Scholar]
  47. Otsuka, K.; Yamada, H.; Maruyama, T.; Tanahashi, H.; Matsuda, S.; Murakami, M. Effect of alloying additions on Fe-Mn-Si shape memory alloys. ISIJ. Int. 1990, 30, 674–679. [Google Scholar] [CrossRef] [Green Version]
  48. Dong, Z.Z.; Kajiwara, S.; Kikuchi, T.; Sawaguchi, T. Effect of pre-deformation at room temperature on shape memory properties of stainless type Fe-15Mn-9Cr-5Ni-(0.5-1.0)NbC alloys. Acta Mater. 2005, 3, 4009–4018. [Google Scholar] [CrossRef]
  49. Sagaradze, V.V.; Belozerov, Y.V.; Pecherkina, N.L.; Mukhin, M.L.; Zaynutdinov, Y.R. The shape memory effect in high-strength precipitation-hardening austenitic steels. Mater. Sci. Eng. 2006, 438, 812–815. [Google Scholar] [CrossRef]
  50. Sagaradze, V.V.; Afanas’ev, S.V.; Kataeva, N.V. Shape Memory Effect in Corrosion-Resistant Steels Hardened by Various Carbides. Phys. Met. Metallogr. 2018, 119, 764–769. [Google Scholar] [CrossRef]
  51. Zhuravlev, V.N.; Pushin, V.G. Alloys with Thermomechanical Shape Memory and Their Application in Medicine; UrO RAN: Yekaterinburg, Russia, 2000. (In Russian) [Google Scholar]
  52. Yoneyama, T.; Miyazaki, S. Shape Memory Alloys for Medical Applications; Wordhead Publishing: Cambridge, UK, 2009. [Google Scholar]
  53. Prokoshkin, S.D.; Pushin, V.G.; Ryklina, E.P.; Khmelevskaya, I.Y. Application of Titanium Nickelide–based Alloys in Medicine. Phys. Met. Metallogr. 2004, 97, 56–96. [Google Scholar]
  54. Brailovski, V.; Khmelevskaya, I.Y.; Prokoshkin, S.D.; Pushin, V.G.; Ryklina, E.P.; Valiev, R.Z. Foundation of Heat and Thermomechanical Treatments and Their on the Structure and Properties of Titanium Nickelide-Based Alloys. Phys. Met. Metallogr. 2004, 97, S3–S55. [Google Scholar]
  55. Valiev, R.Z.; Alexandrov, I.V. Nanostructured Materials Produced by Severe Plastic Deformation; Logos: Moscow, Russia, 2000. (In Russian) [Google Scholar]
  56. Valiev, R.Z.; Aleksandrov, I.V. Bulk Nanostructured Metallic Materials; Academkniga: Moscow, Russia, 2007. (In Russian) [Google Scholar]
  57. Valiev, R.Z.; Pushin, V.G. Bulk Nanostructured Metallic Materials: Production, Structure, Properties and Functioning. Phys. Met. Metallogr. 2002, 94, S1–S4. [Google Scholar]
  58. Pushin, V.G.; Stolyarov, V.V.; Valiev, R.Z.; Kourov, N.I.; Kuranova, N.N.; Prokofiev, E.A.; Yurchenko, L.I. Features of Structure and Phase Transformations in Shape Memory TiNi-Based Alloys after Severe Plastic Deformation. Ann. Chim. Sci. Mat. 2002, 27, 77–88. [Google Scholar] [CrossRef]
  59. Pushin, V.G.; Stolyarov, V.V.; Valiev, R.Z.; Kourov, N.I.; Kuranova, N.N.; Prokofiev, E.A.; Yurchenko, L.I. Development of Methods of Severe Plastic Deformation for the Production of High-Strength Alloys Based on Titanium Nickelide with a Shape Memory Effect. Phys. Met. Metallogr. 2002, 94, S54–S68. [Google Scholar]
  60. Pushin, V.G.; Valiev, R.Z. The Nanostructured TiNi Shape-Memory Alloys: New Properties and Applications. Solid State Phenom. 2003, 94, 13–24. [Google Scholar] [CrossRef]
  61. Sergueeva, A.V.; Song, C.; Valiev, R.Z.; Mukherjee, A.K. Structure and properties of amorphous and nanocrystalline NiTi prepared by severe plastic deformation and annealing. Mater. Sci. Eng. 2003, 339, 159–165. [Google Scholar] [CrossRef]
  62. Pushin, V.G. Structure, properties and application of nanostructured shape memory TiNi-based alloys. In Nanomaterials by Severe Plastic Deformation; Zehetbauer, M., Valiev, R., Eds.; Willey-VCH Verlag GmbH and Co, KgaA: Weinheim, Germany, 2004; pp. 822–828. [Google Scholar]
  63. Valiev, R.Z.; Pushin, V.G.; Gunderov, D.V.; Popov, A.G. The use of severe deformations for preparing bulk nanocrystalline materials from amorphous alloys. Dokl. Phys. 2004, 49, 519–521. [Google Scholar] [CrossRef]
  64. Valiev, R.Z.; Gunderov, D.V.; Pushin, V.G. Metastable nanostructured SPD Ti-Ni alloys with unique properties. J. Met. Nanocryst. Mater. 2005, 24, 7–12. [Google Scholar] [CrossRef]
  65. Stolyarov, V.V.; Prokof’ev, E.A.; Prokoshkin, S.D.; Dobatkin, S.B.; Trubitsyna, I.B.; Khmelevskaya, I.Y.; Pushin, V.G.; Valiev, R.Z. Structural features, mechanical properties, and the shape memory effect in TiNi alloys subjected to equal-channel angular pressing. Phys. Met. Metallogr. 2005, 100, 608–618. [Google Scholar]
  66. Pushin, V.G.; Valiev, R.Z.; Zhu, Y.T.; Gunderov, D.V.; Korolev, A.V.; Kourov, N.I.; Kuntsevich, T.E.; Valiev, E.Z.; Yurchenko, L.I. Severe Plastic Deformation of Melt-Spun Shape Memory Ti2NiCu and Ni2MnGa Alloys. Mater. Trans. 2006, 47, 546–549. [Google Scholar] [CrossRef] [Green Version]
  67. Pushin, V.G.; Korolev, A.V.; Kourov, N.I.; Gunderov, D.V.; Valiev, R.Z.; Koledov, V.V.; Shavrov, V.G. SPD-Induced Nanocrystallization of Shape Memory Ni2MnGa-Based and NiTi-Based Alloys Quenched from Liquid State. Mater. Sci. Forum 2006, 503–504, 545–550. [Google Scholar] [CrossRef]
  68. Valiev, R.Z.; Gunderov, D.V.; Pushin, V.G. The New SPD Processing Routes to Fabricate Bulk Nanostructured Materials. Ultrafine Grained Materials IV; Zhu, Y.T., Langdon, T.G., Horita, Z., Zehetbauer, M.J., Semiatin, S.L., Lowe, T.C., Eds.; TMS (The Minerals, Metals and Materials Society): Warrendale, PA, USA, 2006; pp. 105–112. [Google Scholar]
  69. Pushin, V.G.; Valiev, R.Z.; Zhu, Y.T.; Prockoshkin, S.; Gunderov, D.V.; Yurchenko, L.I. Effect of Equal Channel Angular Pressing and Repeated Rolling on Structure, Phase Transformation and Properties of TiNi Shape Memory Alloys. Mater. Sci. Forum 2006, 503–504, 539–544. [Google Scholar] [CrossRef]
  70. Valiev, R.; Gunderov, D.; Prokofiev, E.; Pushin, V.; Zhu, Y. Nanostructuring of TiNi alloy by SPD processing for advanced properties. Mater. Trans. 2008, 49, 97–101. [Google Scholar] [CrossRef] [Green Version]
  71. Tsuchiya, K.; Hada, Y.; Koyano, T.; Nakajima, K.; Ohnuma, M.; Koike, T.; Todaka, Y.; Umimota, M. Production of TiNi Amorphous/Nanocrystalline Wires with High-Strength and Elastic Modulus by Severe Cold Drawing. Scr. Mater. 2009, 60, 749–752. [Google Scholar] [CrossRef]
  72. Pushin, V.G.; Lotkov, A.I.; Kolobov, Y.R.; Valiev, R.Z.; Dudarev, E.F.; Kuranova, N.N.; Dyupin, A.P.; Gunderov, D.V.; Bakach, G.P. On the nature of anomalously high plasticity of high-strength titanium nickelide alloys with shape memory effects: I. Initial structure and mechanical properties. Phys. Met. Metallogr. 2008, 106, 520–530. [Google Scholar] [CrossRef]
  73. Dudarev, E.F.; Valiev, R.Z.; Kolobov, Y.R.; Lotkov, A.I.; Pushin, V.G.; Bakach, G.P.; Gunderov, D.V.; Dyupin, A.P.; Kuranova, N.N. On the nature of anomalously high plasticity of high-strength titanium nickelide alloys with shape memory effects: II. Phys. Met. Metallogr. 2009, 107, 298–311. [Google Scholar] [CrossRef]
  74. Gunderov, D.V.; Kuranova, N.N.; Luk’yanov, A.V.; Uksusnikov, A.N.; Prokof’ev, E.A.; Yurchenko, L.I.; Valiev, R.Z.; Pushin, V.G. Application of Severe Plastic Deformation by Torsion to form amorphous and nanocrystalline states in large-size TiNi alloy sample. Phys. Met. Metallogr. 2009, 108, 131–138. [Google Scholar] [CrossRef]
  75. Kuranova, N.N.; Gunderov, D.V.; Uksusnikov, A.N.; Luk’yanov, A.V.; Yurchenko, L.I.; Prokof’ev, E.A.; Pushin, V.G.; Valiev, R.Z. Effect of heat treatment on the structural and phase transformations and mechanical properties of TiNi alloy subjected to severe plastic deformation by Torsion. Phys. Met. Metallogr. 2009, 108, 556–568. [Google Scholar] [CrossRef]
  76. Kuranova, N.N.; Makarov, V.V.; Pushin, V.G.; Uksusnikov, A.N.; Valiev, R.Z.; Gunderov, D.V.; Lukyanov, A.V.; Prokofiev, E.A. Amorphization of bulk TiNi-based alloys by severe plastic deformation under high pressure torsion. Bull. Russ. Acad. Sci. Physics 2009, 73, 1117–1119. [Google Scholar] [CrossRef]
  77. Kuranova, N.N.; Pushin, V.G.; Uksusnikov, A.N.; Yurchenko, L.I.; Gunderov, D.V.; Valiev, R.Z. Effect of severe plastic deformation on the phase and structural transformations and mechanical properties of metastable austenitic Ti-Ni alloys. Russ. Metall. 2010, 2010, 296–300. [Google Scholar] [CrossRef]
  78. Gunderov, D.; Kuranova, N.; Lukyanov, A.; Makarov, V.; Prokofiev, E.; Pushin, A. Structure and Properties of Ageing and Nonageing Alloys Ti49.4Ni50.6 and Ti50.2Ni49.8 Subjected to High Pressure Torsion. Rev. Adv. Mater. Sci. 2010, 25, 58–66. [Google Scholar]
  79. Prokoshkin, S.; Brailivski, V.; Korotitskiy, A.; Inaekyan, K.; Dubinsky, S.; Filonov, M.; Petrzhic, M. Formation of Nanostructures in Thermo-Mechanically-Treated Ti-Ni and Ti-Nb-(Zr, Ta) SMAs and Their Roles in Martensite Crystal Lattice Changes and Mechanical Behavior. Alloy. Comp. 2011, 509, 2066–2075. [Google Scholar]
  80. Pushin, V.G.; Kuranova, N.N.; Kourov, N.I.; Valiev, R.Z.; Valiev, E.Z.; Makarov, V.V.; Pushin, A.V.; Uksusnikov, A.N. Baroelastic shape memory effects in titanium nickelide alloys subjected to plastic deformation under high pressure. Tech. Phys. 2012, 57, 1106–1114. [Google Scholar] [CrossRef]
  81. Zhang, Y.; Jiang, S.; Hu, L.; Liang, Y. Deformation Mechanism of NiTi Shape Memory Alloy Subjected to Severe Plastic Deformation at Low Temperature. Mater. Sci. Eng. A 2013, 559, 606–614. [Google Scholar] [CrossRef]
  82. Pushin, V.G.; Valiev, R.Z.; Valiev, E.Z.; Kourov, N.I.; Kuranova, N.N.; Makarov, V.V.; Pushin, A.V.; Uksusnikov, A.N. Phase and structural transformations in the Ti49.5Ni50.5 alloy with a shape memory effect during torsion under high pressure. Phys. Met. Metallogr. 2012, 113, 256–270. [Google Scholar] [CrossRef]
  83. Pushin, V.G.; Kuranova, N.N.; Kourov, N.I.; Valiev, R.Z.; Korolev, A.V.; Makarov, V.V.; Pushin, A.V.; Uksusnikov, A.N. Effect of Heat Treatment on Structural and Phase Transformations in the Ti49.5Ni50.5 Alloy Amorphized by High-Pressure Torsion. Phys. Met. Metallogr. 2013, 114, 488–502. [Google Scholar] [CrossRef] [Green Version]
  84. Dye, D.; Azeem, M.A. In Situ Evaluation of the Transformation Behaviour of NiTi-based High Temperature Shape Memory Alloys. Intermetallics 2014, 46, 222–230. [Google Scholar]
  85. Shahmir, H.; Nili-Ahmadabadi, M.; Huang, Y.; Jung, J.M.; Kim, H.S.; Langdon, T.G. Shape Memory Effect in Nanocrystalline NiTi Alloy Processed by High Pressure Torsion. Mater. Sci. Eng. A 2015, 626, 203–206. [Google Scholar] [CrossRef]
  86. Prokoshkin, S.; Dubinsky, S.; Brailivski, V.; Korotitskiy, A.; Konopatsky, A.; Sheremetyev, V.; Blinova, E. Nanostructures and Stress-Induced Phase Transformation Mechanism in Titanium Nickelide annealed after Moderate Cold Deformation. Mater. Lett. 2017, 192, 111–114. [Google Scholar] [CrossRef]
  87. Tulic, S.; Kerber, M.; Matsuda, M.; Waitz, T. Phase Transformations of Severely Plastically Deformed Ti-Ni-Pd High-Temperature Shape Memory Alloys. Funct. Mater. Lett. 2017, 10, 1740012. [Google Scholar] [CrossRef]
  88. Prokoshkin, S.; Dubinsky, S.; Korotitskiy, A.; Konopatsky, A.; Sheremetyev, V.; Schetitin, I.; Gleser, A.; Brailivski, V. Nanostructure Features and Stress-Induced Transformation Mechanisms in Extremely Fine-Grained Titanium Nickelide. J. Alloy. Comp. 2019, 770, 667–686. [Google Scholar] [CrossRef]
  89. Pushin, V.G. (Ed.) Shape Memory Alloys of Titanium Nickelide: Structure, Phase Transformations and Properties; UrO RAN: Yekatirinburg, Russia, 2006. (In Russian) [Google Scholar]
  90. Satija, S.K.; Shapiro, S.M.; Salamon, M.B.; Wayman, C.M. Phonon Softening in Ni46.8Ti50Fe3.2. Phys. Rev. B 1984, 29, 6031–6035. [Google Scholar] [CrossRef]
  91. Moine, P.; Allain, J.; Renker, B. Observation of a soft-phonon mode and a premartensitic phase in the intermetallic compound Ti50Ni47Fe3 studied by inelastic neutron scattering. J. Phys. F Met. Phys. 1984, 14, 2517–2529. [Google Scholar] [CrossRef]
  92. Tietzet, H.; Miillner, M.; Renker, B. Dynamical properties of premartensitic NiTi. J. Phys. C Solid State Phys. 1984, 17, L520–L532. [Google Scholar]
  93. Salamon, M.B.; Meichle, M.E.; Wayman, C.M. Premartensitic Phases of Ti50Ni47Fe3. Phys. Rev. B 1985, 31, 7306–7315. [Google Scholar] [CrossRef]
  94. Jin, Y.M.; Wang, Y.U.; Ren, Y. Theory and experimental evidence of phonon domains and their roles in pre-martensitic phenomena. Comput. Mater. 2015, 1, 15002. [Google Scholar] [CrossRef] [Green Version]
  95. Xu, K.; Luo, J.; Lee, C.; Shen, Y.; Li, C.; Ma, X.; Lee, M. Mechanisms of stress-induces martensitic transformation and transformation-induced plasticity in NiTi shape memory alloy related to superelastic stability. Scripta Met. 2022, 217, 114775. [Google Scholar] [CrossRef]
Figure 1. SEM images of the B19’ martensite in (a) Ti49.8Ni50.2 and B2-austenite in (b) Ti49.5Ni50.5, (c) Ti49Ni51, and (d) Ti49.4Ni50.6 quenched alloys, and also baro-induced B19’-martensite in (e,f) Ti49.4Ni50.6 after treatment with a pressure of 6 GPa at RT [80].
Metals 12 02188 g001
Figure 2. Images typical of (a,d) tweed TEM contrast and (bd,f) diffuse scattering in SAED patterns ((b)—z.a. [100], (c)—z.a. [111], (e)—z.a. [110], and (f)—z.a. [210]) of (ac) Ti49.4Ni50.6 and (df) Ti49Ni51 quenched alloys).
Metals 12 02188 g002
Figure 3. (a) Bright- and (b) dark-field TEM images of the B19’ martensite microstructure and (c) the corresponding SAED pattern (z.a. [110]B19’) of the Ti49.4Ni50.6 quenched alloy [72].
Metals 12 02188 g003
Figure 4. (a) Bright-field TEM image of the R martensite microstructure and (b,c) the corresponding SAED patterns with image size of selected diaphragm (SD) being 0.3 μm (z.a. [010]R and [001]R) of Ti49.4Ni50.6 quenched alloy [72].
Metals 12 02188 g004
Figure 5. (a,c) Bright- and (b) dark-field TEM images of the B2 austenite microstructure of UFG Ti49.4Ni50.6 alloy obtained by ECAP at 723 K, 8 passes and (a) the corresponding ring-wise SAED pattern (SD 1.0 μm). (a,b) are transverse cross sections and (c) is a longitudinal cross section.
Metals 12 02188 g005
Figure 6. (a,c) Bright- and (b,d) dark-field TEM images of the (a,b) R- and (c,d) B19’ modes of martensite microstructure of the UFG Ti49.4Ni50.6 alloy obtained by ECAP at 723 K, 8 passes and (ad) the corresponding SAED patterns obtained by (a,c) SD 1 μm and (b,d) SD 0.3 μm [54].
Metals 12 02188 g006
Figure 7. (a) “True stress–strain” and (b,c) “resolved stress–strain” curves after tensile tests at RT of (a) the (1) CG and the (2) UFG ECAP-treated Ti49.4Ni50.6 alloy, (b) (3) the CG Ti49.5Ni50.5 alloy and the (4, 5) UFG Ti49.5Ni50.5 alloys preliminary subjected to ECAP at 723 K, for (curve 4) 1 pass and (curve 5) 4 passes, and (c) the UFG Ti49.5Ni50.5 alloy after (6) ECAP at 723 K, 8 passes and +(7) the subsequent PDHT at 773 K, 1 h, or +(8) the subsequent PDHT at 873 K, 1 h [65,73].
Metals 12 02188 g007
Figure 8. (a) Bright- and (b) dark-field TEM images of the microstructure, and (c) the corresponding SAED pattern (z.a. of type <110>B19’, SD 0.3 μm), of the CG Ti49.4Ni50.6 alloy after straining (to 20%) [73].
Metals 12 02188 g008
Figure 9. (a) Bright- and (b) dark-field TEM images of the microstructure, and (c,d) the corresponding SAED patterns (z.a. типa <110>B19’, (c) SD 1.0 μm, (d) SD 0.3 μm), of the CG Ti49.4Ni50.6 alloy after straining (to ~40%) [73].
Metals 12 02188 g009
Figure 10. (a) Bright- and (b) dark-field TEM images of the microstructure, and (c) the corresponding ring SAED pattern (SD 0.3 μm), from the CG Ti49.4Ni50.6 alloy in the neck region (cross section) [73].
Metals 12 02188 g010
Figure 11. (a,d,e) Bright- and (b) dark-field TEM images of the microstructure, and (c,f) the corresponding SAED patterns, of the UFG Ti49.4Ni50.6 alloy after ECAP and straining to 40%. (a,b) TEM and (c–f) SAED patterns (SD 0.3 μm) for (ac) the transverse and (df) the longitudinal cross sections [73].
Metals 12 02188 g011
Figure 12. (a) The bright- and (b) dark-field TEM images of the microstructure (in transverse cross section), and (c) the corresponding SAED pattern (SD 0.3 μm), taken from the ECAP-treated UFG Ti49.4Ni50.6 alloy in the neck region [73].
Metals 12 02188 g012
Figure 13. Mechanical σ–ε properties of the Ti49.4Ni50.6 alloy in the quenched state, after HPT with n = 5 revolutions and PDHT at 673, 723, 773, or 823 K for 1 h [75].
Metals 12 02188 g013
Figure 14. (ac) Bright-field TEM images of the microstructure, and (d,e) the corresponding SAED patterns (SD 0.3 μm), of the HPT-preliminarily treated Ti49.4Ni50.6 alloy after PDHT at (a,d) 673, (b,e) 773, and (c) 823K for 1 h; (f) SEM image of the microstructure after HPT and PDHT at 823 K for 1 h [75].
Metals 12 02188 g014
Figure 15. (a,c) Bright- and (d) dark-field TEM images of the microstructure, and (b) the corresponding SAED pattern (z.a. [100]B2, SD 1.0 μm), from the Ti49Ni51 alloy after HT at 573 K for 1 h.
Metals 12 02188 g015
Figure 16. (a) Bright- and (b,c) dark-field TEM images of the microstructure, and (d) the corresponding SAED pattern (z.a. [110]B2, SD 1.0 μm), of the Ti49Ni51 alloy after HT at 673 K for 1 h.
Metals 12 02188 g016
Figure 17. (ac) Bright-field TEM images of the microstructure, and (d) the corresponding SAED pattern (z.a. [210]B2, SD 1.0 μm), of the Ti49Ni51 alloy after HT at 773 K for 1 h.
Metals 12 02188 g017
Figure 18. Mechanical properties of the (a) quenched Ti49Ni51 alloy, (b) PDHT-treated Ti49.5Ni50.5 alloy, and (c) PDHT-treated Ti49Ni51 alloy depending on the temperature treatment.
Metals 12 02188 g018
Figure 19. (a) Bright- and (b) dark-field TEM images of the microstructure, and (c) the corresponding SAED pattern (SD 1 μm), taken from the Ti49.5Ni50.5 alloy after its MPR by 30%.
Metals 12 02188 g019
Figure 20. (a) Bright- and (b) dark-field TEM images of the microstructure, and (c) the corresponding SAED pattern (SD 1 μm), taken from the Ti49.5Ni50.5 alloy after its MPR by 30% and PDHT at 673 K for 1 h.
Metals 12 02188 g020
Figure 21. (a,d) Bright- and (b,e) dark-field TEM images of the microstructure, and ((c)—z.a. [110]R, (f)—z.a. [110]B19′ and z.a. [111]R) the corresponding SAED patterns (SD 0.3 μm), from the Ti49.5Ni50.5 alloy after (ac) MPR, 30% + 773 K, 1 h and (df) MPR, 30% + 873 K, 1 h. SAED patterns in inserts (a) and (d) were obtained by SD 1.0 μm.
Metals 12 02188 g021
Figure 22. (a,b) Bright-field TEM images and (c) SAED pattern (with z.a. near [111]B2, SD 1.0 μm) taken from the Ti49Ni51 alloy after MPR to 30%.
Metals 12 02188 g022
Figure 23. (a) Bright- and (b) dark-field TEM images, and (c,d) SAED patterns ((c)—SD 1.0 μm, (d)—z.a. close to [111]B2, SD 0.3 μm), taken from the Ti49Ni51 alloy after MPR by 30% and PDHT at 473 K for 1 h. Arrows point to «bright shining» areas.
Metals 12 02188 g023
Figure 24. (a) Bright- and (b) dark-field TEM images, and (c,d) SAED patterns ((c)—SD 1.0 μm, (d)—z.a. close to [111]B2||[110]B19’||[111]R, SD 0.3 μm), taken from the Ti49Ni51 alloy after MPR by 30% and PDHT at 573 K for 1 h. Arrows show the particles of Ti4Ni2Ox.
Metals 12 02188 g024
Figure 25. (a) Bright- and (b) dark-field TEM images, and (c,d) SAED patterns ((c)—SD 1.0 μm, (d)—z.a. close to [111]B2||[110]B19’, SD 0.3 μm), taken from the Ti49Ni51 alloy after MPR by 30% and PDHT at 673 K 1 for h. Arrows show particles of Ti4Ni2Ox.
Metals 12 02188 g025
Figure 26. (a) Bright- and (b) dark-field TEM images, and (c,d) SAED patterns ((c)—SD 1.0 μm, (d)—z.a. close to [111]B2||[111]R||[110]B19’, SD 0.3 μm), taken from the Ti49Ni51 alloy after MPR to 30% and PDHT at 773 K for 1 h.
Metals 12 02188 g026
Figure 27. (a) Bright- and (b,c) dark-field TEM images, and the SAED pattern ((c), insert—SD 1.0 μm), of the microstructure of the Ti49Ni51 alloy after MPR by 30% and PDHT at 873 K for 1 h.
Metals 12 02188 g027
Figure 28. Fractography of the (a,d) Ti49.5Ni50.5 alloy after (a) MPR by 30% and (d) MPR by 30% and PDHT at 773 K for 1 h; (b,e) Ti49Ni51 alloy after (b) quenching at 1173 K for 1 h, and (e) MPR by 30% and PDHT at 773 K for 1 h; (c,f) Ti49.4Ni50.6 alloy after (c) ECAP 8 passes + 723 K for 1 h, and (f) HPT 5 rev + 823 K for 1 h.
Metals 12 02188 g028
Figure 29. Accumulation and recovery of deformation in isothermal loading-unloading cycles during torsion tests of (a,b) CG Ti49.4Ni50.6 alloy (a) quenched at 1073 K, and (b) after ECAP at 673 K, 8 passes; (c,d) Ti49.8Ni50.2 (c) quenched at 1070 K, and (d) after ECAP at 673, 8 passes. The test temperatures are given at the curves.
Metals 12 02188 g029
Figure 30. (ac) Accumulation and recovery of deformation in isothermal «loading-unloading» cycles at tensile tests of CG Ti49Ni51 alloy (a) with complete SEE at near Ms, (b) with incomplete SEE at near Ms, and (c) below Ms [89].
Metals 12 02188 g030
Table 1. Chemical composition, average grain size (d), and temperatures of forward (Ms, Mf) and reverse (As, Af) TMTs, and hysteresis (ΔT) of TMT of the studied hardened alloys.
Nominal CompositionTi49.8Ni50.2Ti49.5Ni50.5Ti49.4Ni50.6Ti49Ni51
Chemical Composition Ti49.76Ni50.24Ti49.48Ni50.52Ti49.39Ni50.61Ti49.08Ni50.92
O, wt.%0.0700.0700.0170.070
C, wt.%0.1000.1000.0370.100
d, μm80504040
Ms, K320290290220
Mf, K290260270180
As, K330305300240
Af, K350325310270
ΔT *, K30352535
ProductionIMP, Ekaterinburg or Mateks, Moscow, RussiaIMP, RussiaIntrinsic Devices Inc., San Francisco, CA, USAIMP, Russia
* temperature hysteresis ΔT = 1/2{(As + Af) − (Ms + Mf)}.
Table 2. Mechanical characteristics of Ti49.4Ni50.6 alloy in the CG and UFG states after tensile tests at RT.
StateSm, MPaSy, MPaSu, MPaSr, MPaεr, %ψ, %δu, %δ, %KIII, MPaKIV,
MPa
KV,
MPa
d, μm
CG 1306301630500562637232006600300040
UFG 260118016009208685360600011,50015000.25
Table 3. Mechanical characteristics of Ti49.8Ni50.2 alloy at RT before and after ECAP.
Treatmentσm, MPaσy, MPaσu, MPaσr, MPaεr, %δ, %d, μm
Quenching150560950310116080
723 K, 1 pass200750110055011630.47
723 K, 4 passes280100012207205500.45
723 K, 8 passes250112012508707430.24
723 K, 12 passes3001350141010509410.23
723 K, 8 passes + PDHT 773 K, 1 h350112012608105650.28
723 K, 8 passes + PDHT 873 K, 1 h25082011506206783.40
Table 4. Mechanical characteristics of HPT (preliminarily treated) Ti49.4Ni50.6 alloy.
Treatmentσm, MPaσy, MPaσu, MPaσr, MPaεr, %δ,%d, μm
Quenching160500104034087840
n = 5 rev-15002250 -8A + NC
n = 5 rev + PDHT 673 K, 1 h4601800210013405150.03
n = 5 rev + PDHT 723 K, 1 h37015001670113010250.04
n = 5 rev + PDHT 773 K, 1 h2001120125092015300.06
n = 5 rev + PDHT 823 K, 1 h250900121065012750.6
Table 5. Mechanical characteristics of the Ti49Ni51 aging alloy.
Treatmentσm, MPaσy, MPaσu, MPaσr, MPaδ, %
quenching-550940-42
HT 373 K, 1 h-530920-43
HT 473 K, 1 h-520870-31
HT 573 K, 1 h-530850-21
HT 673 K, 1 h350800121045025
HT 773 K, 1 h310770118046036
HT 873 K, 1 h-510970-44
HT 973 K, 1 h-530870-41
Table 6. Mechanical properties of the SME Ti49.8Ni50.2, Ti49.5Ni50.5, and Ti49Ni51 alloys after MPR and PDHT (1 h).
Treatmentσm, MPaσy, MPaσu, MPa σr, MPaδ, %
Ti49.8Ni50.2
quenching15060097045055
MPR 30%240830126059025
MPR + PDHT 573 K200900122070030
MPR + PDHT 773 K180790114061045
MPR + PDHT 973 K14061098047050
Ti49.5Ni50.5
quenching18059093041060
MPR 30%250840127059022
MPR 30% + PDHT 573 K230960132073025
MPR 30% + PDHT 673 K2351070139083530
MPR 30% + PDHT 773 K210900121069045
MPR 30% + PDHT 823 K170780113061065
MPR 30% + PDHT 873 K140620104048070
MPR 30% + PDHT 973 K12053091041062
Ti49Ni51
quenching-550940-42
MPR 30%450920149047030
MPR + PDHT 373 K460980150052025
MPR + PDHT 473 K4501050151060025
MPR + PDHT 573 K13011501550102025
MPR + PDHT 673 K15011801550103025
MPR + PDHT 773 K2601020132076035
MPR + PDHT 873 K400780110038055
MPR + PDHT 973 K-5601010-60
Publisher’s Note: MDPI stays neutral with regard to jurisdictional claims in published maps and institutional affiliations.

