
Improving Fatigue Limit and Rendering Defects Harmless through Laser Peening in Additive-Manufactured Maraging Steel


1
Graduate School of Engineering, Yokohama National University, Yokohama 240-8501, Japan
2
Faculty of Engineering, Yokohama National University, Yokohama 240-8501, Japan
*
Author to whom correspondence should be addressed.
Metals 2022, 12(1), 49; https://doi.org/10.3390/met12010049
Submission received: 6 December 2021
/
Revised: 22 December 2021
/
Accepted: 23 December 2021
/
Published: 27 December 2021
(This article belongs to the Special Issue Fatigue Behavior and Crack Mechanism of Metals and Alloys)
Abstract
:Additive-manufactured metals have a low fatigue limit due to the defects formed during the manufacturing process. Surface defects, in particular, considerably degrade the fatigue limit. In order to expand the application range of additive-manufactured metals, it is necessary to improve the fatigue limit and render the surface defects harmless. This study aims to investigate the effect of laser peening (LP) on the fatigue strength of additive-manufactured maraging steel with crack-like surface defects. Semicircular surface slits with depths of 0.2 and 0.6 mm are introduced on the specimen surface, and plane bending-fatigue tests are performed. On LP application, compressive residual stress is introduced from the specimen surface to a depth of 0.7 mm and the fatigue limit increases by 114%. In a specimen with a 0.2 mm deep slit, LP results in a high-fatigue-limit equivalent to that of a smooth specimen. Therefore, a semicircular slit with a depth of 0.2 mm can be rendered harmless by LP in terms of the fatigue limit. The defect size of a 0.2 mm deep semicircular slit is greater than that of the largest defect induced by additive manufacturing (AM). Thus, the LP process can contribute to improving the reliability of additive-manufactured metals. Compressive residual stress is the dominant factor in improving fatigue strength and rendering surface defects harmless. Moreover, the trend of the defect size that can be rendered harmless, estimated based on fracture mechanics, is consistent with the experimental results.
1. Introduction
As additive manufacturing (AM) technology can produce parts with complex shapes that cannot be realized through conventional machining, it is expected to play an active role in production, from various perspectives. For example, it can simplify the manufacturing process, and reduce product weight, lead time, and cost. The two main metal AM technologies are powder bed fusion (PBF) and directed energy deposition (DED). In PBF, a heat source is irradiated on the required part of a powder bed filled with raw powder. The powder is melted and fused with the underlying layer by repeating the process to form the desired product [1,2,3]. PBF has two classifications according to the type of heat source: selective laser melting (SLM) using lasers, and electron beam melting (EBM) using electron beams. In DED, an energy beam, such as a laser or electron beam, irradiates and melts the base material, or both the base material and the supplied material, to build a modeling object. Although the surface roughness is inferior to that of PBF, DED has advantages over PBF: the material only needs to be supplied to the required area, the build speed is high owing to the large layer thickness, and it is suitable for building large components [4]. Due to the SLM method being used extensively, owing to its high accuracy, we focused on SLM in this study as well. However, because of gas contamination in the equipment and poor melting of the material powder, the AM process creates easily formed defects on the surface and within the material. Furthermore, fatigue cracks are generated from the defects due to cyclic loading, degrading the fatigue strength [5,6,7,8,9,10]. In maraging steel, the fatigue strength of AM specimens is reported to be approximately one-third that of forged specimens [11]. As fatigue strength immensely influences equipment durability, it is necessary to improve fatigue strength to increase the reliability of manufactured products, and further expand the range of application.
Various methods have been proposed to improve the fatigue strength of additive-manufactured materials; typical examples include hot isostatic pressing (HIP) and shot peening (SP). HIP improves fatigue strength by reducing the internal defect size in additive-manufactured components, by applying high pressure in a high-temperature environment. It has been confirmed that the fatigue strength of additive-manufactured Ti-6Al-4V is improved by HIP [12,13]. On the other hand, when HIP treatment is applied to additive-manufactured 316 L stainless steel, the fatigue strength decreases because of the grain growth caused by heating during HIP [14]. In SP, the surface is deformed plastically by striking the material with small steel balls to increase the hardness and introduce compressive residual stress, which enhances the fatigue strength. This method is effective in improving the fatigue strength of several AM materials, such as aluminum alloys [15,16] and maraging steel [17,18]. However, as the layer of compressive residual stress due to SP is shallow, the fatigue limit may not be improved in additive-manufactured metals that include defects within as well as on the surface.
Recently, it has been demonstrated that the fatigue strength of conventional metals can be improved by laser peening (LP); this is a surface modification method that introduces compressive residual stress on the surface layer through the local impact effect of high-pressure ablation plasma, generated by irradiating a material immersed in water with short laser pulses [19,20,21]. As LP induces a considerably deeper layer of compressive residual stress compared to SP, it is more effective in improving fatigue strength [16]. Furthermore, LP has high reproducibility because of the stringent control of laser pulses, and can be applied to components with complex shapes manufactured by the AM process.
Surface defects significantly reduce the fatigue strength of metals. In the case of additive-manufactured metals, the surface is very rough; if the surface roughness is removed by machining, the internal defects may be exposed on the surface. Therefore, if the surface defects can be rendered harmless in terms of the fatigue limit through peening, the reliability of additive-manufactured metals can be improved, which can contribute to the increased industrial usage of additive-manufactured parts. Surface defects can be rendered harmless through various types of peening on conventionally manufactured metals [22,23,24,25]. Takahashi et al. reported that a semicircular surface defect with a less than 0.2 mm depth could be rendered harmless by applying SP to spring steel [22]. Fueki et al. clarified that a semicircular surface defect with a depth of less than 1 mm could be rendered harmless by applying needle peening to high-tensile steel-welded joints [23]. Takahashi et al. compared the maximum defect size that can be rendered harmless by SP and cavitation peening (CP) in 7075 aluminum alloy. The results indicated that semicircular defects with depths below 0.1 mm and 0.2 mm could be rendered harmless by SP and CP, respectively [24]. In addition, Takahashi et al. investigated the maximum defect size that could be rendered harmless by the peening of 7075 aluminum alloys through SP and LP, and determined that semicircular surface defects with depths below 0.4 mm could be rendered harmless by LP, which was higher than the depth of 0.1 mm by SP [25]. However, as the effect of LP on the fatigue strength of additive-manufactured maraging steel has not been studied, the defect size that can be rendered harmless by LP remains unknown.
To clarify the effect of LP on the fatigue strength and the surface defect size that can be rendered harmless by LP, bending-fatigue tests are conducted on AM maraging steel, in this study. The fatigue strength of metals primarily depends on the surface residual stress, hardness, and surface roughness. Therefore, the changes in these factors after LP treatment are investigated to elucidate the results of fatigue testing. The defect size that can be rendered harmless by LP is estimated based on fracture mechanics.
2. Experiments
2.1. Material and Specimens
Additive-manufactured maraging steel was used as the specimen. Using a 3D printer (ProX300, 3D Systems), 90 mm (length) × 20 mm (width) × 6 mm (thickness) plates were first fabricated in the width direction. Table 1 lists the chemical compositions of the raw-material powders. Solution heat treatment was performed in a salt bath at 820 °C for 1 h, followed by water cooling; the plates were then machined into 4.5 mm thick bending-fatigue test specimens as shown in Figure 1a. After solution heat treatment, the mechanical properties included a tensile strength of 1135 MPa, 0.2% proof stress of 920 MPa, and a Vickers hardness of 364 HV. Figure 1b shows the shape and dimensions of the semicircular slit introduced in the minimum cross-section of the specimen through electric discharge machining, to simulate crack-like surface defects. The direction of the semicircular slit is perpendicular to the longitudinal direction, and the width is 0.04 mm.
Figure 2 depicts the flowchart of the machining process of the bending-fatigue test specimens and the types of specimens used in the fatigue tests. The specimens were categorized into four groups: untreated smooth specimens (Smooth), LP-treated smooth specimens (Smooth + LP), specimens with a semicircular slit (Slit), and specimens with a semicircular slit after LP treatment (LP + Slit).
Specimens with semicircular slit depths a = 0.2 and 0.6 mm are referred to as the 0.2 Slit and 0.6 Slit specimens, respectively. In the LP + Slit specimen, the semicircular slit was introduced after LP to avoid peening within the slit.
2.2. LP Conditions
Figure 3a shows the setup of the LP device. LP was performed on specimens immersed in water. Coating was not applied on the specimen surface. The second harmonic of the Q-switched Nd: YAG laser was used for LP on both sides of the specimen. Figure 3b shows the laser tracking during LP. The laser beam was irradiated on the specimen in the y-direction (width), followed by the x-direction (longitudinal), in a layer. Table 2 lists the applied LP conditions. The main parameters of LP include the laser pulse energy (Ep), laser spot diameter (D), and laser pulse density (Np). The power density (G) and coverage (Cv) were calculated using these values and the pulse duration (t) [26].
2.3. Measurement of the Surface Roughness, Residual Stress, and Vickers Hardness
The arithmetic mean of roughness Ra was measured in the longitudinal direction of the specimen using a stylus-type roughness measuring machine (SE1200, Kosaka Laboratory Ltd., Tokyo, Japan ). The measured length was 4 mm, and the average value of three measurements was compared.
The cosα method was employed to measure the residual stress using an X-ray residual stress analyzer (μ-X360, Pulstec Industrial Co. Ltd., Shizuoka, Japan). Table 3 details the residual stress measurement conditions. The residual-stress distribution in the depth direction was obtained by alternately measuring the surface residual stress and removing the surface layer by electropolishing. As stress redistribution occurred after the removal of the surface layer, a stress correction calculation [27] was performed for each measured result.
The Vickers hardness was measured using a micro Vickers hardness tester (HMV-G, Shimadzu Co., Kyoto, Japan) under a holding time of 15 s and a load of 9.8 N. The average value of three measurements was used.
2.4. Fatigue Testing
Fatigue testing was performed using a plane bending-fatigue test machine (PBF-60Xa, Tokyo Koki Co. Ltd., Tokyo, Japan) under a stress ratio of R = 0 and a frequency of 20 Hz. The fatigue limit was defined as the maximum stress range at which the specimen could withstand 107 cycles of cyclic loading. The fatigue strengths of most steels are determined at 107 cycles. Therefore, the maximum number of loading cycles was set to 107 cycles in this study. After fatigue testing, the fracture surfaces of the specimens were observed through scanning electron microscopy (SEM; VE-8800, Keyence Ltd., Osaka, Japan).
3. Results
3.1. Surface Roughness, Residual Stress, and Vickers Hardness
The measured values of Ra were 0.30 µm and 1.41 µm for the non-LP and LP specimens, respectively. The increase in the surface roughness after LP may be attributed to the formation of ablation marks, due to the application of LP without coating.
Figure 4 displays the residual stress distribution for each specimen. Compressive residual stress of 350 MPa is introduced on the surfaces of the non-LP specimens through machining, as depicted by the solid circles in the figure. As the residual stress approaches zero at a very shallow point for the non-LP specimen, its influence on the fatigue strength is considered to be less. For the LP-treated specimen, the surface compressive residual stress is 1060 MPa, as indicated by the solid squares. The maximum compressive residual stress is 1150 MPa, measured at a depth of 0.02 mm. The point where the residual stress changes from compression to tension, referred to as the crossing point, is 0.7 mm from the surface.
Figure 5 shows the Vickers hardness distribution measured at the cross-section of each specimen. The hardness of the LP-treated specimens increases from the surface to a depth of 1 mm, compared to that of the non-LP specimens. The maximum Vickers hardness was observed at a depth of 0.3 mm; this is due to the work hardening caused by LP.
3.2. Fatigue Test Results
The S–N diagrams of the fatigue tests are displayed in Figure 6; the asterisks indicate the specimens in which the fatigue crack initiation point is within the specimen, and the arrows indicate the specimens that endured cyclic stress of 107 cycles. The fatigue limit in this study is defined as the maximum stress range that can withstand 107 cycles of cyclic loading, as stated in Section 2.4. The increase in the fatigue life due to LP is confirmed regardless of the size of the slit. Figure 7 shows the relationship between the fatigue limit and slit depth; the fatigue limit of the 0.2 Slit and 0.6 Slit specimens are 39% and 48% less, respectively, than that of the smooth specimen. The fatigue limits tend to decrease with an increase in the slit size. The fatigue limit of the Smooth + LP specimen is 43% more than that of the smooth specimen. In addition, the fatigue limit of the LP + 0.2 Slit specimen is improved by 114%, whereas there is no increase in the fatigue limit of the LP + 0.6 Slit specimen. Only 100 MPa of compressive residual stress was introduced at a depth of 0.6 mm, as shown in Figure 4. Thus, the value of compressive residual stress was insufficient for the size of the slit in the the LP + 0.6 Slit specimen.
3.3. Fracture Surface Observation Results
Figure 8 shows the fracture surfaces of the Smooth and Smooth + LP specimens. Fatigue crack initiation sites are observed on the surface of the Smooth specimen and subsurface of the Smooth + LP specimen. In eight of the nine Smooth and Smooth + LP specimens, fatigue cracks initiate from the defects that occur during the AM process. The parameter , defined as the square root of the area of the defect projected onto a plane perpendicular to the maximum principal stress, ranges from 37 µm to 170 µm. This parameter can be used to evaluate the effect of various defects, such as notches, cracks, and nonmetallic inclusions, on the fatigue limit [28].
Figure 9 and Figure 10 depict the fracture surfaces of the 0.2 Slit, LP + 0.2 Slit, 0.6 Slit, and LP + 0.6 Slit specimens, respectively. For the slit specimens, the fatigue crack initiation sites are identified at the slits (Figure 9a and Figure 10a). The fatigue cracks initiate uniformly at the front of the semicircular slit and propagate along a semicircular trajectory. The fatigue cracks initiate at the slits for the LP + 0.6 Slit specimens as well; however, the fatigue cracks initiate from the deepest point of the slit and propagate along a complicated path (Figure 10b). A similar crack path was observed when an aluminum alloy with a surface slit was subjected to LP [25]. The increased fatigue life of the LP + 0.6 Slit specimen can be attributed to this crack propagation path, owing to compressive residual stress. In contrast, two among the three LP + 0.2 Slit specimens are fractured outside the slit (Figure 9b). These fatigue cracks initiate from the defects caused by AM, similar to those identified in the Smooth and Smooth + LP specimens.
To investigate the influence of cyclic loading on the stability of the compressive residual stress, the residual stress distribution in the Smooth + LP specimen was measured after fatigue testing at the fatigue limit (depicted by the open squares in Figure 4). The compressive residual stress is redistributed by cyclic loading and decreases to 990 MPa on the surface after the test. Furthermore, the maximum compressive residual stress decreases to 1000 MPa and the crossing point shifts from 0.70 mm to 0.45 mm. As shown in Figure 8, Figure 9 and Figure 10, the fatigue crack initiation point is located deeper than the crossing point in most of the specimens. This behavior is due to compressive residual stress.
3.4. Defect Size That Can Be Rendered Harmless by LP in Terms of the Fatigue Limit
In this study, it was determined that the slit was rendered harmless if the fatigue test results satisfied either of the following two conditions based on a previous study [29]:
- (a)
- The fatigue limit of the LP + Slit specimen increases to more than 90% of that of the Smooth + LP specimen.
- (b)
- In more than half the LP + Slit specimens, fracture occurs outside the slit.
As shown in Figure 7, the fatigue limit of the LP + 0.2 Slit specimen increases to 91% of that of the Smooth + LP specimen, and two among the three specimens are fractured outside the slit. Thus, both conditions (a) and (b) are satisfied for the LP + 0.2 Slit. However, neither condition is satisfied for the LP + 0.6 Slit specimen. These results indicate that less than 0.2 mm deep semicircular slits can be rendered harmless by LP.
The value (251 µm) of the semicircular slit with a = 0.2 mm, rendered harmless by LP, is greater than that of the maximum subsurface defect observed at the initiation point of the fatigue crack ( = 170 µm). Therefore, it can be postulated that large defects generated near the surface during the AM process can be rendered harmless by LP.
4. Discussion
4.1. Main Factors Contributing to Fatigue Strength Improvement by LP
As shown in Figure 8b and Figure 9b, for the LP specimen, fatigue crack initiation near the surface is suppressed by compressive residual stress, improving the fatigue limit, and rendering the defect harmless. In addition, the increase in surface hardness shown in Figure 5 contributes to fatigue strength improvement. The increase in surface roughness shown in Section 3.1 can generally be a factor in lowering the fatigue limit. However, surface roughness does not affect the fatigue strength of LP specimens because crack initiation from the surface is suppressed.
Masaki et al. reported that when AM maraging steel was subjected to the SP, compressive residual stress was introduced up to a depth of 0.4 mm and the fatigue life was increased, but the fatigue limit was not enhanced [17]. Croccolo et al. reported that the fatigue limit was improved by 19% after SP [18]. The fatigue limit improvement of 43% by LP in this study is considerably higher than both these results. This difference in the improvement of the fatigue limit through LP may be due to the difference in the amount and depth of the compressive residual stress introduced by LP, which is larger and deeper in this study compared to those introduced by SP [17]. This compressive residual stress suppresses crack growth, improving the fatigue limit significantly.
4.2. Evaluation of the Defect Size Rendered Harmless by LP Based on Fracture Mechanics
The defect size that can be rendered harmless by LP was evaluated based on the fracture mechanics, assuming that the semicircular slit was equivalent to a semicircular crack. It was assumed that the positive value of the stress intensity factor contributed to fatigue crack propagation. can be calculated using the following equation [22,24]:
where is the stress intensity factor at maximum loading and is the stress intensity factor due to residual stress. When evaluating using the Newman—Raju equation [30], the fatigue limit of the Smooth + LP specimen ( = 660 MPa) was considered as the maximum applied stress. For caluculating the value of , API RP579 [31] equations were used. To calculate , the residual stress distribution after the fatigue test of the Smooth + LP specimen (Figure 4) was fitted using the fourth-order equation.
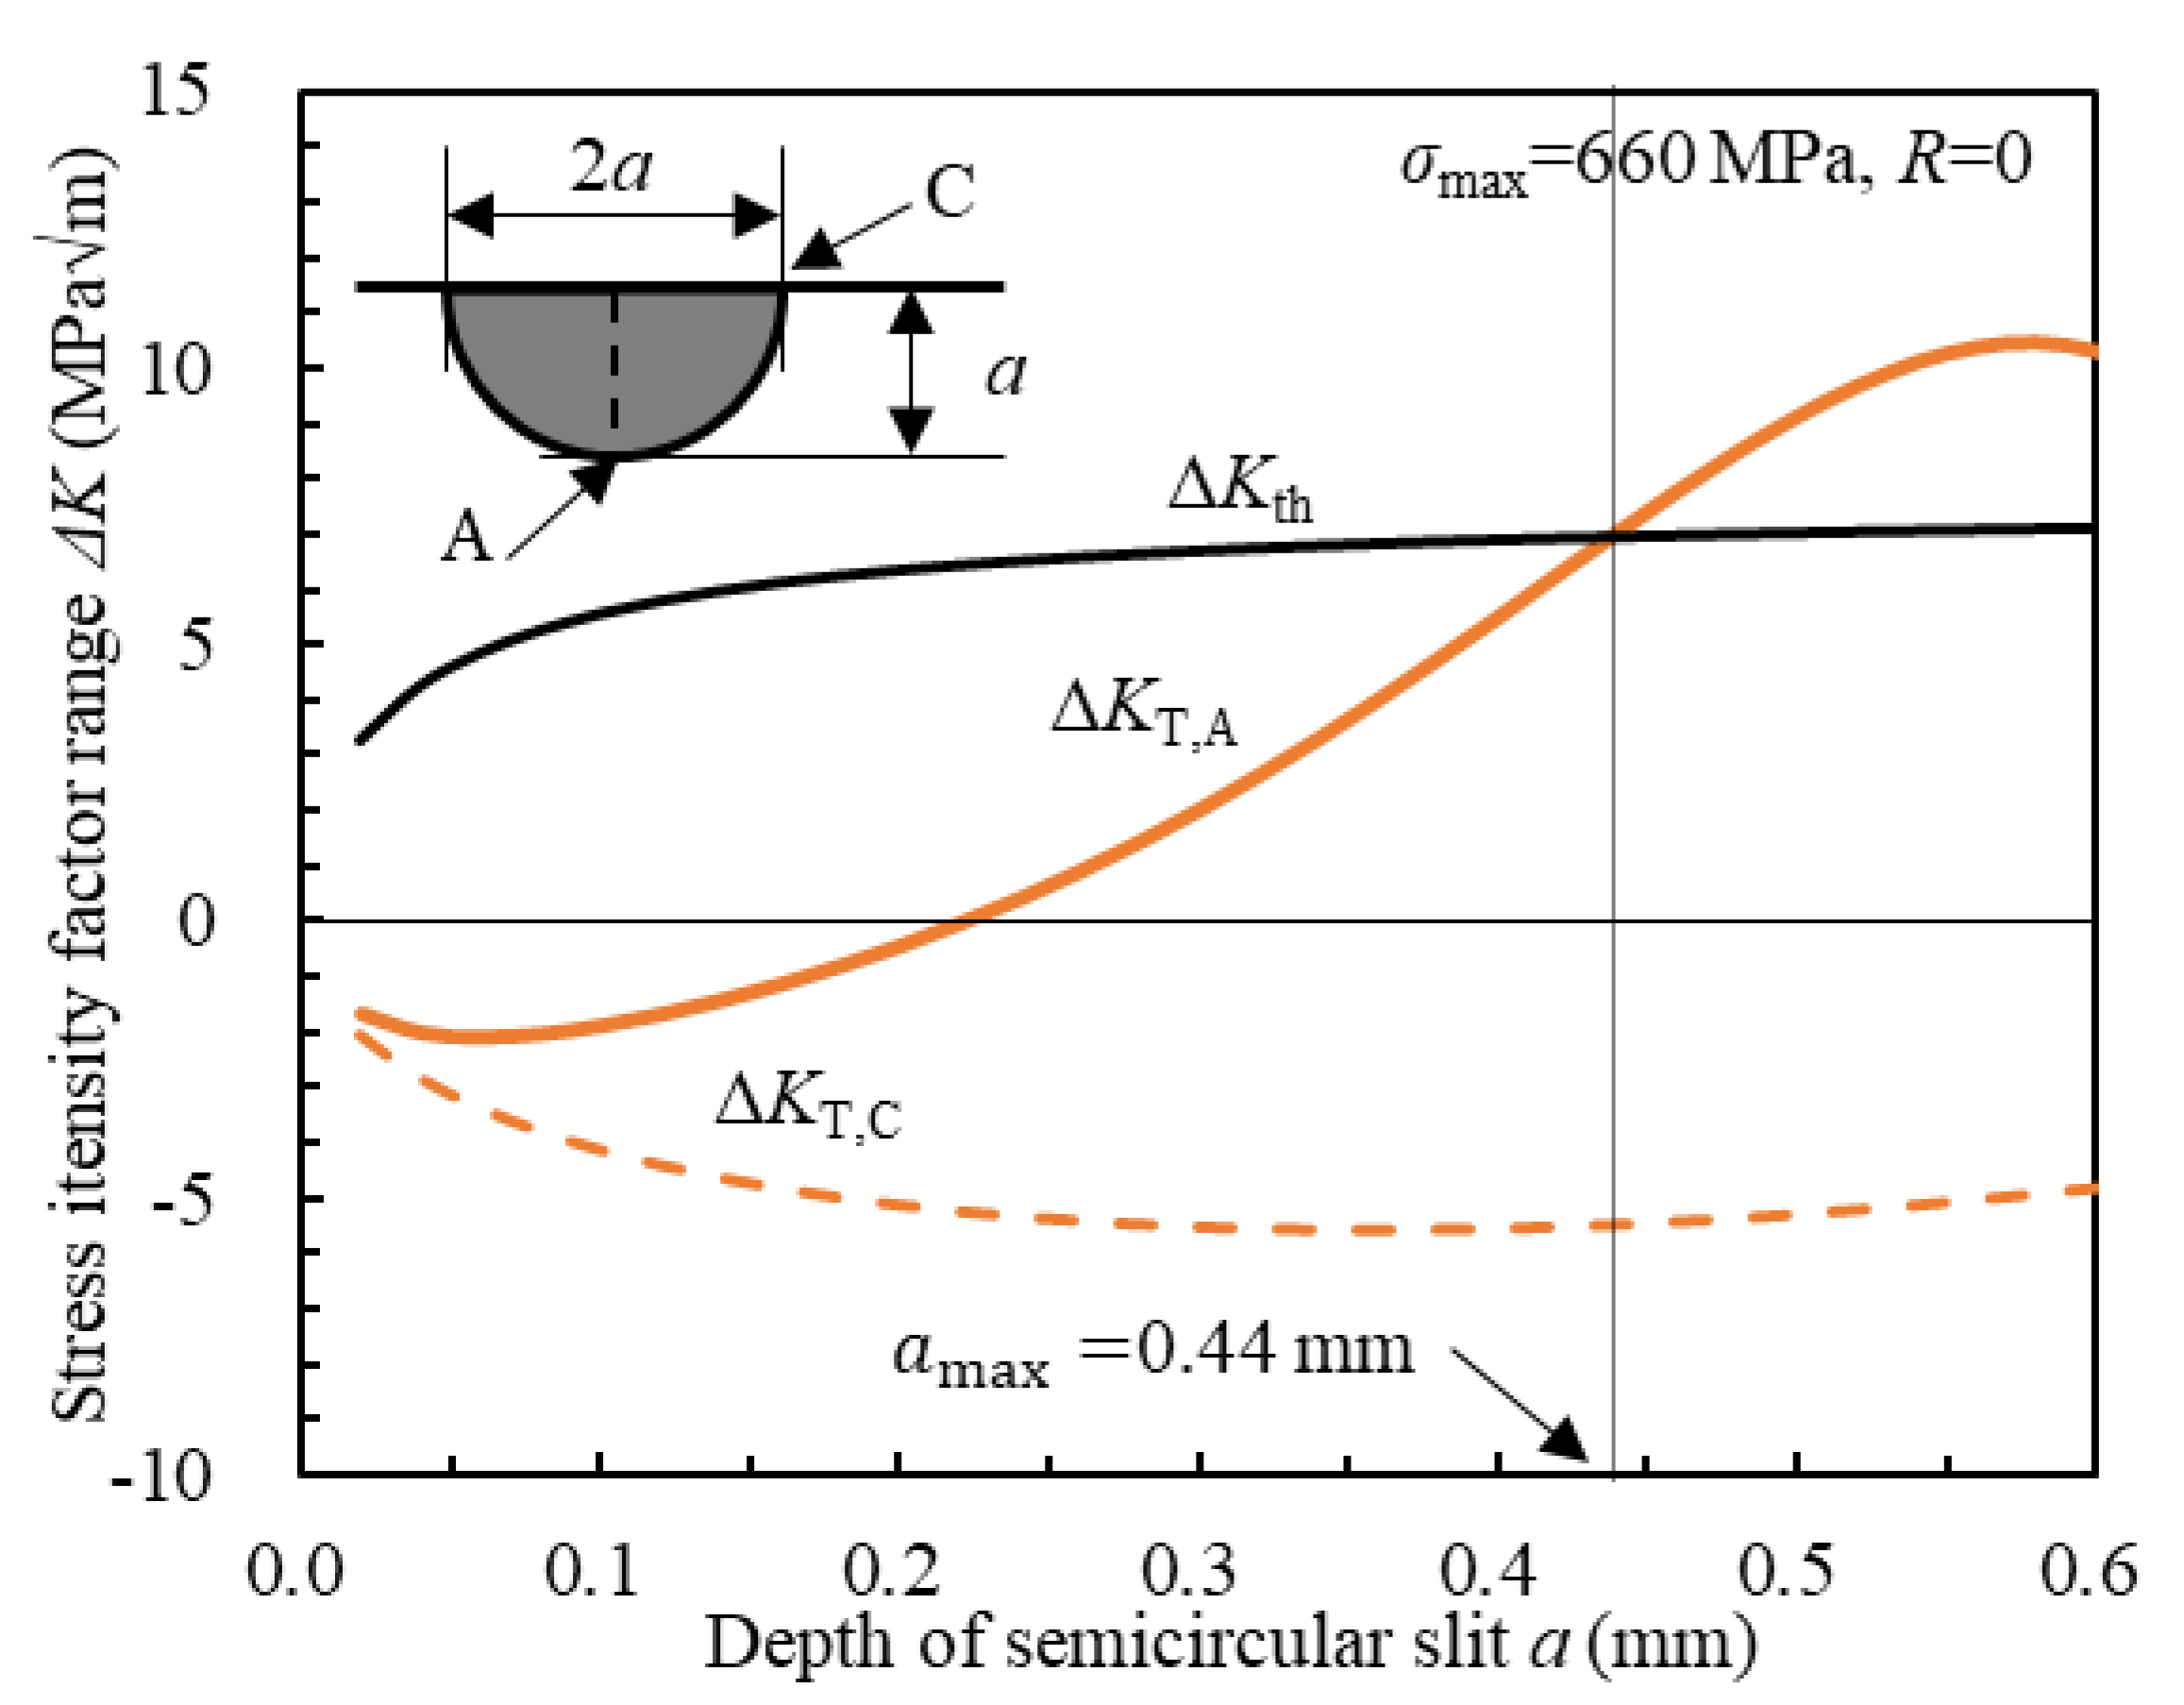
Figure 11 displays the relationship between and the crack depth for a semicircular crack. and correspond to at the deepest and surface points of the semicircular crack, respectively. As the sizes of the cracks in this study were small, the threshold stress intensity factor range was dependent on the crack size.
Various equations have been proposed for the dependence of on the crack size. In this study, we used the equation proposed by El Haddad et al. to calculate [32,33]:
where is the stress range at the fatigue limit of the Smooth specimen (= 460 MPa). is the threshold stress intensity factor range for a large crack, and is obtained based on the relationship between the tensile stress σ, , and the maximum stress intensity factor for a surface crack, presented by Murakami [34]:
For evaluating , in Equation (4) becomes and σ is equal to . Thereby, Equation (4) is transformed to Equation (5) [35]:
In Equation (5), we applied the fatigue limit = 240 MPa for slit depth a = 0.6 mm, and calculated as 7.58 .
Assuming that the semicircular slit is equivalent to a semicircular crack, it is possible to evaluate whether the semicircular slit can be rendered harmless based on the relationship between and . If is less than , the slit is considered harmless. Therefore, the maximum defect size that can be rendered harmless is estimated from the intersection of and . Figure 11 shows that the value of is 0.44 mm. This result is consistent with the experimental result that a semicircular slit with a = 0.2 mm can be rendered harmless by LP, whereas a surface defect with a = 0.6 mm cannot. This suggests that even if a surface defect of the same size as exists, the defect can be rendered harmless in terms of the fatigue limit.
5. Conclusions
In this study, the effects of LP on the fatigue strength and the surface defect size that can be rendered harmless by LP in additive-manufactured maraging steel were investigated. The obtained results are as follows:
- 1.
- The maximum compressive residual stress of 1150 MPa is introduced by LP. The crossing point is at a 0.7 mm depth from the surface.
- 2.
- The fatigue limit of a smooth specimen without a slit was increased by 43% through LP.
- 3.
- The fatigue limit of a specimen with a 0.2 mm deep semicircular slit was improved by 114% through LP. Most of the specimens fractured outside the slit. Therefore, semicircular surface slits with a less than 0.2 mm depth can be rendered harmless in terms of the fatigue limit.
- 4.
- The corresponding size of for a 0.2 mm deep semicircular slit was 251 µm, which was greater than the maximum value of the defect ( = 170 µm) caused by AM, observed at the crack initiation point.
- 5.
- For the semicircular slit with a depth of 0.6 mm, LP did not improve the fatigue limit nor render the defect harmless, but increased the fatigue life.
- 6.
- The main factor that contributes to improving the fatigue strength and rendering surface defects harmless is the compressive residual stress induced by the application of LP. Thus, LP is effective in improving the reliability of additive-manufactured metals.
Author Contributions
Investigation, data curation, writing-original draft, S.T.; conceptualization, methodology, supervision, writing-review and editing, K.T. All authors have read and agreed to the published version of the manuscript.
Funding
This study was financially supported by the Japan Society for the Promotion of Science (JSPS) KAKENHI, Japan (19H02022).
Institutional Review Board Statement
Not applicable.
Informed Consent Statement
Not applicable.
Data Availability Statement
Not applicable.
Acknowledgments
The authors would like to thank Itaru Chida (Toshiba Energy Systems & Solutions Co., Kanagawa, Japan) for conducting the laser peening treatment and for the helpful discussions.
Conflicts of Interest
The authors declare no conflict of interest.
Nomenclature
| AM | additive manufacturing |
| LP | laser peening |
| depth of the slit | |
| maximum slit size rendered harmless by peening | |
| intrinsic defect size | |
| Cv | coverage of laser peeing |
| stress range (twice the stress amplitude) | |
| fatigue limit | |
| fatigue limit of the smooth specimen | |
| positive value of the stress intensity factor | |
| at the deepest point of the crack | |
| at the surface of the crack | |
| threshold stress intensity factor range | |
| threshold stress intensity factor range for a large crack | |
| D | spot diameter of the laser |
| Ep | pulse energy |
| G | power density |
| HV | Vickers hardness |
| maximum stress intensity factor for a surface crack | |
| minimum stress intensity factor | |
| maximum stress intensity factor | |
| stress intensity factor by the residual stress | |
| Nf | number of cycles to failure |
| Np | irradiation density |
| R | stress ratio |
| Ra | arithmetic mean of the roughness |
| σ | tensile stress |
| σmax | maximum applied stress |
| t | pulse duration |
| square root of the area projected in the direction of the principal stress |
References
- Murr, L.E.; Martinez, E.; Amato, K.N.; Gaytan, S.M.; Hernandez, J.; Ramirez, D.A.; Shindo, P.W.; Medina, F.; Wicker, R.B. Fabrication of Metal and Alloy Components by Additive Manufacturing: Examples of 3D Materials Science. J. Mater. Res. Technol. 2012, 1, 42–54. [Google Scholar] [CrossRef] [Green Version]
- Kumar, S.; Choudhary, A.K.S.; Singh, A.K.; Gupta, A.K. A Comparison of Additive Manufacturing Technologies. Int. J. Innov. Res. Sci. Technol. 2016, 3, 147–152. [Google Scholar]
- Azam, F.I.; Abdul Rani, A.M.; Altaf, K.; Rao, T.V.V.L.N.; Zaharin, H.A. An In-Depth Review on Direct Additive Manufacturing of Metals. IOP Conf. Ser. Mater. Sci. Eng. 2018, 328, 012005. [Google Scholar] [CrossRef]
- Dass, A.; Moridi, A. State of the Art in Directed Energy Deposition: From Additive Manufacturing to Materials Design. Coatings 2019, 9, 418. [Google Scholar] [CrossRef] [Green Version]
- Yadollahi, A.; Shamsaei, N. Additive Manufacturing of Fatigue Resistant Materials: Challenges and Opportunities. Int. J. Fatigue 2017, 98, 14–31. [Google Scholar] [CrossRef] [Green Version]
- Sajadi, F.; Tiemann, J.; Bandari, N.; Cheloee Darabi, A.C.; Mola, J.; Schmauder, S. Fatigue Improvement of AlSi10Mg Fabricated by Laser-Based Powder Bed Fusion through Heat Treatment. Metals 2021, 11, 683. [Google Scholar] [CrossRef]
- Ferro, P.; Fabrizi, A.; Berto, F.; Savio, G.; Meneghello, R.; Rosso, S. Defects as a Root Cause of Fatigue Weakening of Additively Manufactured AlSi10Mg Components. Theor. Appl. Fract. Mech. 2020, 108, 102611. [Google Scholar] [CrossRef]
- Romano, S.; Brückner-Foit, A.; Brandão, A.; Gumpinger, J.; Ghidini, T.; Beretta, S. Fatigue Properties of AlSi10Mg Obtained by Additive Manufacturing: Defect-Based Modelling and Prediction of Fatigue Strength. Eng. Fract. Mech. 2018, 187, 165–189. [Google Scholar] [CrossRef]
- Uematsu, Y.; Kakiuchi, T.; Han, Y.; Nakajima, M. Proposal of Fatigue Limit Design Curves for Additively Manufactured Ti-6Al-4V in a VHCF Regime Using Specimens with Artificial Defects. Metals 2021, 11, 964. [Google Scholar] [CrossRef]
- Liu, S.; Shin, Y.C. Additive Manufacturing of Ti6Al4V Alloy: A Review. Mater. Des. 2019, 164, 107552. [Google Scholar] [CrossRef]
- Meneghetti, G.; Rigon, D.; Gennari, C. An Analysis of Defects Influence on Axial Fatigue Strength of Maraging Steel Specimens Produced by Additive Manufacturing. Int. J. Fatigue 2019, 118, 54–64. [Google Scholar] [CrossRef]
- Kalentics, N.; de Seijas, M.O.V.; Griffiths, S.; Leinenbach, C.; Logé, R.E. 3D Laser Shock Peening—A New Method for Improving Fatigue Properties of Selective Laser Melted Parts. Addit. Manuf. 2020, 33, 101112. [Google Scholar] [CrossRef]
- Kasperovich, G.; Hausmann, J. Improvement of Fatigue Resistance and Ductility of TiAl6V4 Processed by Selective Laser Melting. J. Mater. Process. Technol. 2015, 220, 202–214. [Google Scholar] [CrossRef]
- Leuders, S.; Lieneke, T.; Lammers, S.; Tröster, T.; Niendorf, T. On the Fatigue Properties of Metals Manufactured by Selective Laser Melting—The Role of Ductility. J. Mater. Res. 2014, 29, 1911–1919. [Google Scholar] [CrossRef]
- Uzan, N.E.; Ramati, S.; Shneck, R.; Frage, N.; Yeheskel, O. On the Effect of Shot-Peening on Fatigue Resistance of AlSi10Mg Specimens Fabricated by Additive Manufacturing Using Selective Laser Melting (AM-SLM). Addit. Manuf. 2018, 21, 458–464. [Google Scholar] [CrossRef]
- Peyre, P.; Fabbro, R.; Merrien, P.; Lieurade, H.P. Laser Shock Processing of Aluminium Alloys. Application to High Cycle Fatigue Behaviour. Mater. Sci. Eng. A 1996, 210, 102–113. [Google Scholar] [CrossRef]
- Masaki, K.; Kobayashi, Y.; Mizuno, Y. Influence of Shot Peening Treatment on Roating Bending High-Cycle Fatigue Properties of Additive Manufactured Maraging Steels Material. J. Soc. Mater. Sci. Jpn. 2018, 67, 891–897. [Google Scholar] [CrossRef]
- Croccolo, D.; De Agostinis, M.; Fini, S.; Olmi, G.; Robusto, F.; Ćirić Kostić, S.; Vranić, A.; Bogojević, N. Fatigue Response of as-Built DMLS Maraging Steel and Effects of Aging, Machining, and Peening Treatments. Metals 2018, 8, 505. [Google Scholar] [CrossRef] [Green Version]
- Sano, Y.; Mukai, N.; Okazaki, K.; Obata, M. Residual Stress Improvement in Metal Surface by Underwater Laser Irradiation. Nucl. Instrum. Meth. Phys. Res. B 1997, 121, 432–436. [Google Scholar] [CrossRef]
- Fairand, B.P.; Wilcox, B.A.; Gallagher, W.J.; Williams, D.N. Laser Shock-Induced Microstructural and Mechanical Property Changes in 7075 Aluminum. J. Appl. Phys. 1972, 43, 3893–3895. [Google Scholar] [CrossRef]
- Sano, Y. Quarter Century Development of Laser Peening without Coating. Metals 2020, 10, 152. [Google Scholar] [CrossRef] [Green Version]
- Takahashi, K.; Amano, T.; Ando, K.; Takahashi, F. Improvement of Fatigue Limit by Shot Peening for High-Strength Steel Containing a Crack-Like Surface Defect. Int. J. Struct. Integr. 2011, 2, 281–292. [Google Scholar] [CrossRef] [Green Version]
- Fueki, R.; Takahashi, K.; Handa, M. Fatigue Limit Improvement and Rendering Defects Harmless by Needle Peening for High Tensile Steel Welded Joint. Metals 2019, 9, 143. [Google Scholar] [CrossRef] [Green Version]
- Takahashi, K.; Osedo, H.; Suzuki, T.; Fukuda, S. Fatigue Strength Improvement of an Aluminum Alloy with a Crack-Like Surface Defect Using Shot Peening and Cavitation Peening. Eng. Fract. Mech. 2018, 193, 151–161. [Google Scholar] [CrossRef]
- Takahashi, K.; Kogishi, Y.; Shibuya, N.; Kumeno, F. Effects of Laser Peening on the Fatigue Strength and Defect Tolerance of Aluminum Alloy. Fatigue Fract. Eng. Mater. Struct. 2020, 43, 845–856. [Google Scholar] [CrossRef]
- Sano, Y.; Obata, M.; Kubo, T.; Mukai, N.; Yoda, M.; Masaki, K.; Ochi, Y. Retardation of Crack Initiation and Growth in Austenitic Stainless Steels by Laser Peening without Protective Coating. Mater. Sci. Eng. A 2006, 417, 334–340. [Google Scholar] [CrossRef]
- Society of Automotive Engineers. Residual Stress Measurement by X-ray Diffraction-SAE; Society of Automotive Engineers: Warrendale, PA, USA, 1971; Volume J784a. [Google Scholar]
- Murakami, Y.; Endo, M. Effects of Defects, Inclusions and Inhomogeneities on Fatigue Strength. Int. J. Fatigue 1994, 16, 163–182. [Google Scholar] [CrossRef]
- Fueki, R.; Takahashi, K. Improving the Fatigue Limit and Rendering a Defect Harmless by Laser Peening for a High Strength Steel Welded Joint. Opt. Laser Technol. 2021, 134, 106605. [Google Scholar] [CrossRef]
- Newman, J.C., Jr.; Raju, I.S. An Empirical Stress-Intensity Factor Equation for the Surface Crack. Eng. Fract. Mech. 1981, 15, 185–192. [Google Scholar] [CrossRef]
- American Petroleum Institute. Recommended Practice 579, Fitness for Service; American Petroleum Institute: Washington, DC, USA, 2000; pp. C3–C10. [Google Scholar]
- El Haddad, M.H.; Topper, T.H.; Smith, K.N. Prediction of Non-Propagating Cracks. Eng. Fract. Mech. 1979, 11, 573–584. [Google Scholar] [CrossRef]
- Morris, W.L.; James, M.R.; Buck, O. A Simple Model of Stress Intensity Range Threshold and Crack Closure Stress. Eng. Fract. Mech. 1983, 18, 871–877. [Google Scholar] [CrossRef]
- Murakami, Y. Analysis of Stress Intensity Factors of Modes I, II and III for Inclined Surface Cracks of Arbitrary Shape. Eng. Fract. Mech. 1985, 22, 101–114. [Google Scholar] [CrossRef]
- Ishii, T.; Takahashi, K. Prediction of Fatigue Limit of Spring Steel Considering Surface Defect Size and Stress Ratio. Metals 2021, 11, 483. [Google Scholar] [CrossRef]
Figure 1.
Shapes and dimensions of (a) the bending-fatigue test specimen and (b) the semicircular slit.
Figure 1.
Shapes and dimensions of (a) the bending-fatigue test specimen and (b) the semicircular slit.

Figure 2.
Flowchart of the test specimen machining process.
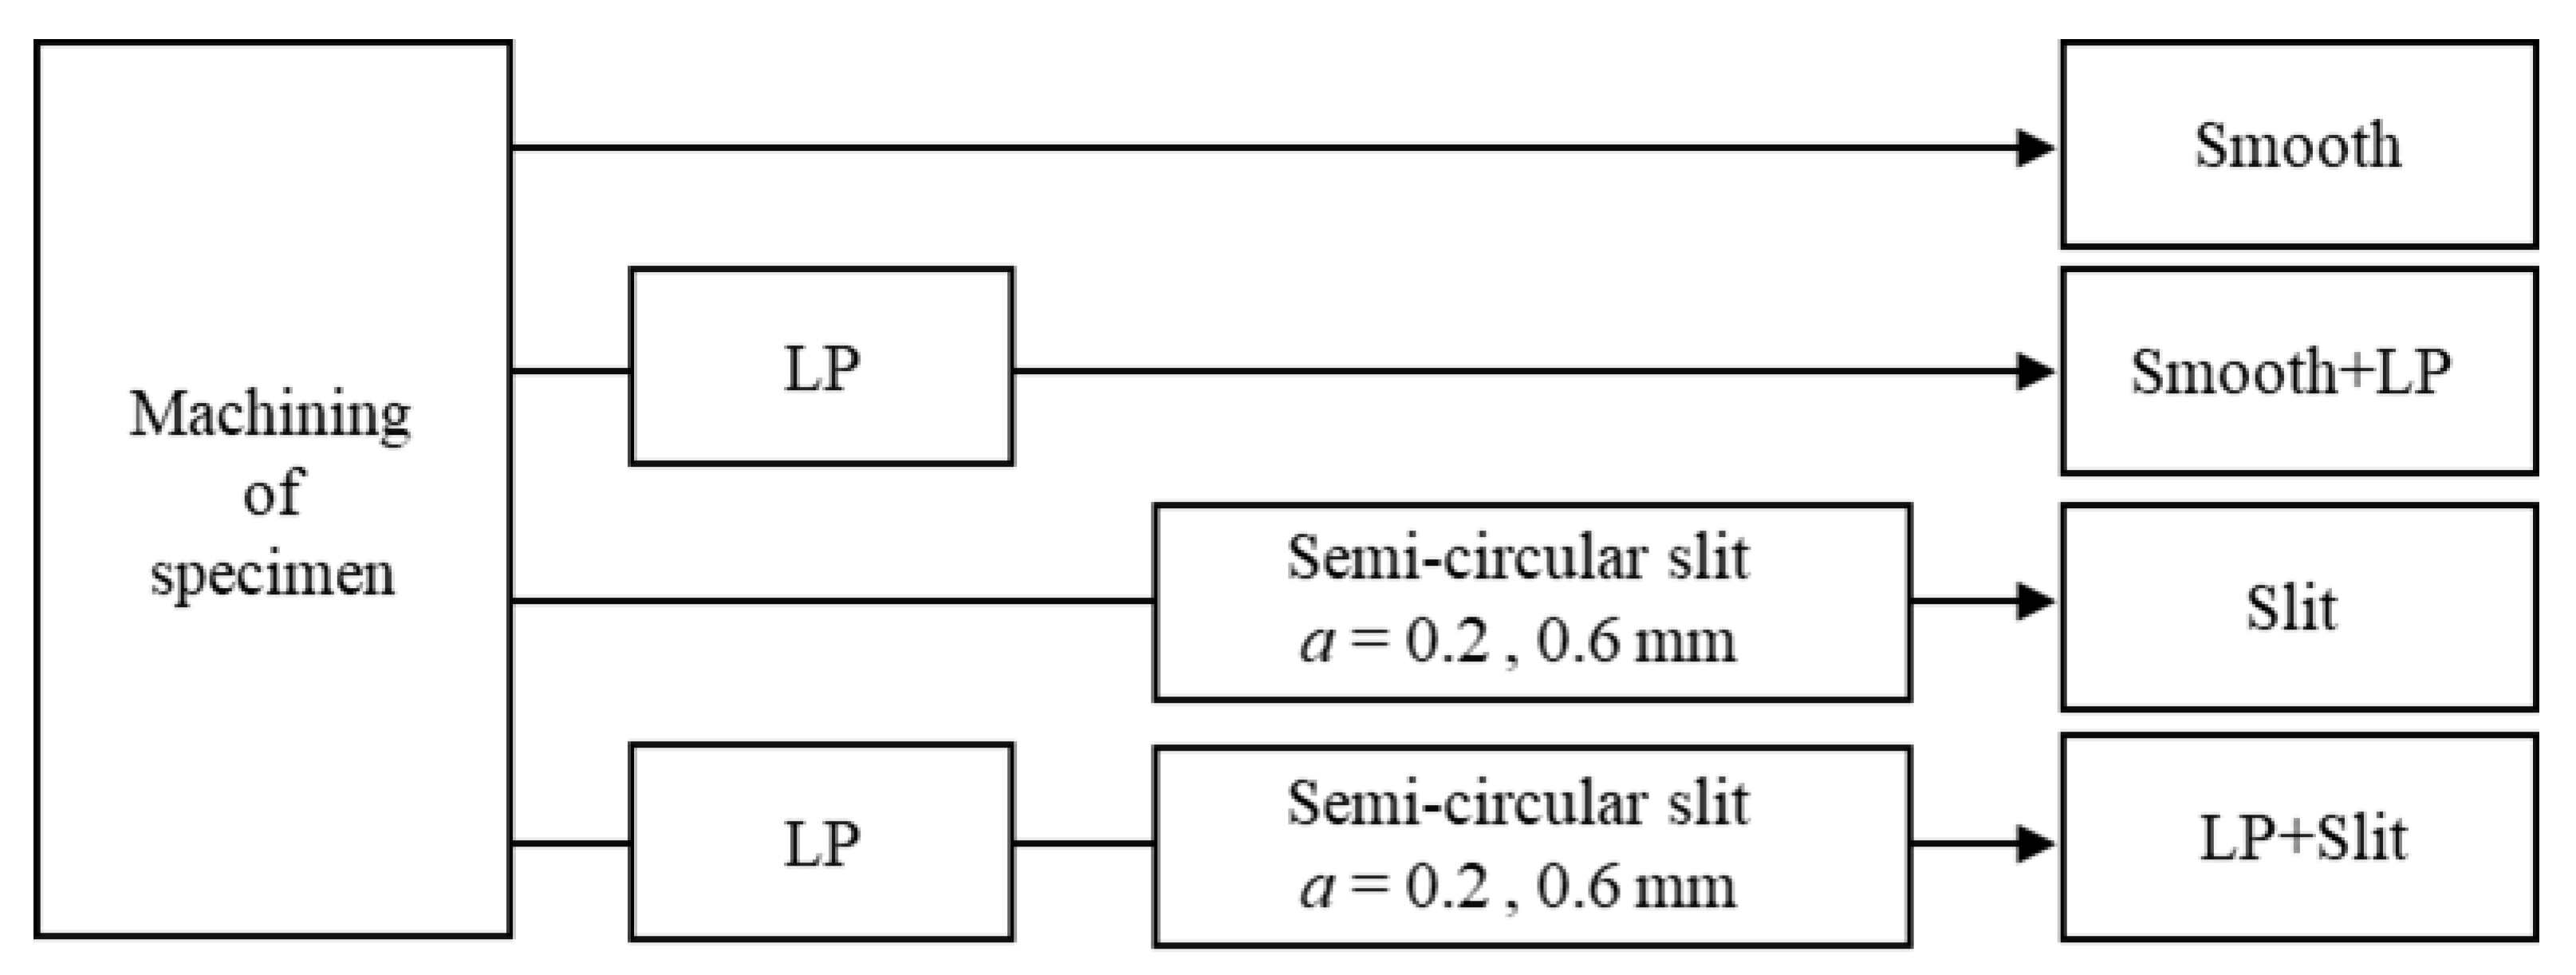
Figure 3.
Schematic of the laser peening (LP) procedure: (a) LP device setup and (b) laser tracking during LP.
Figure 3.
Schematic of the laser peening (LP) procedure: (a) LP device setup and (b) laser tracking during LP.
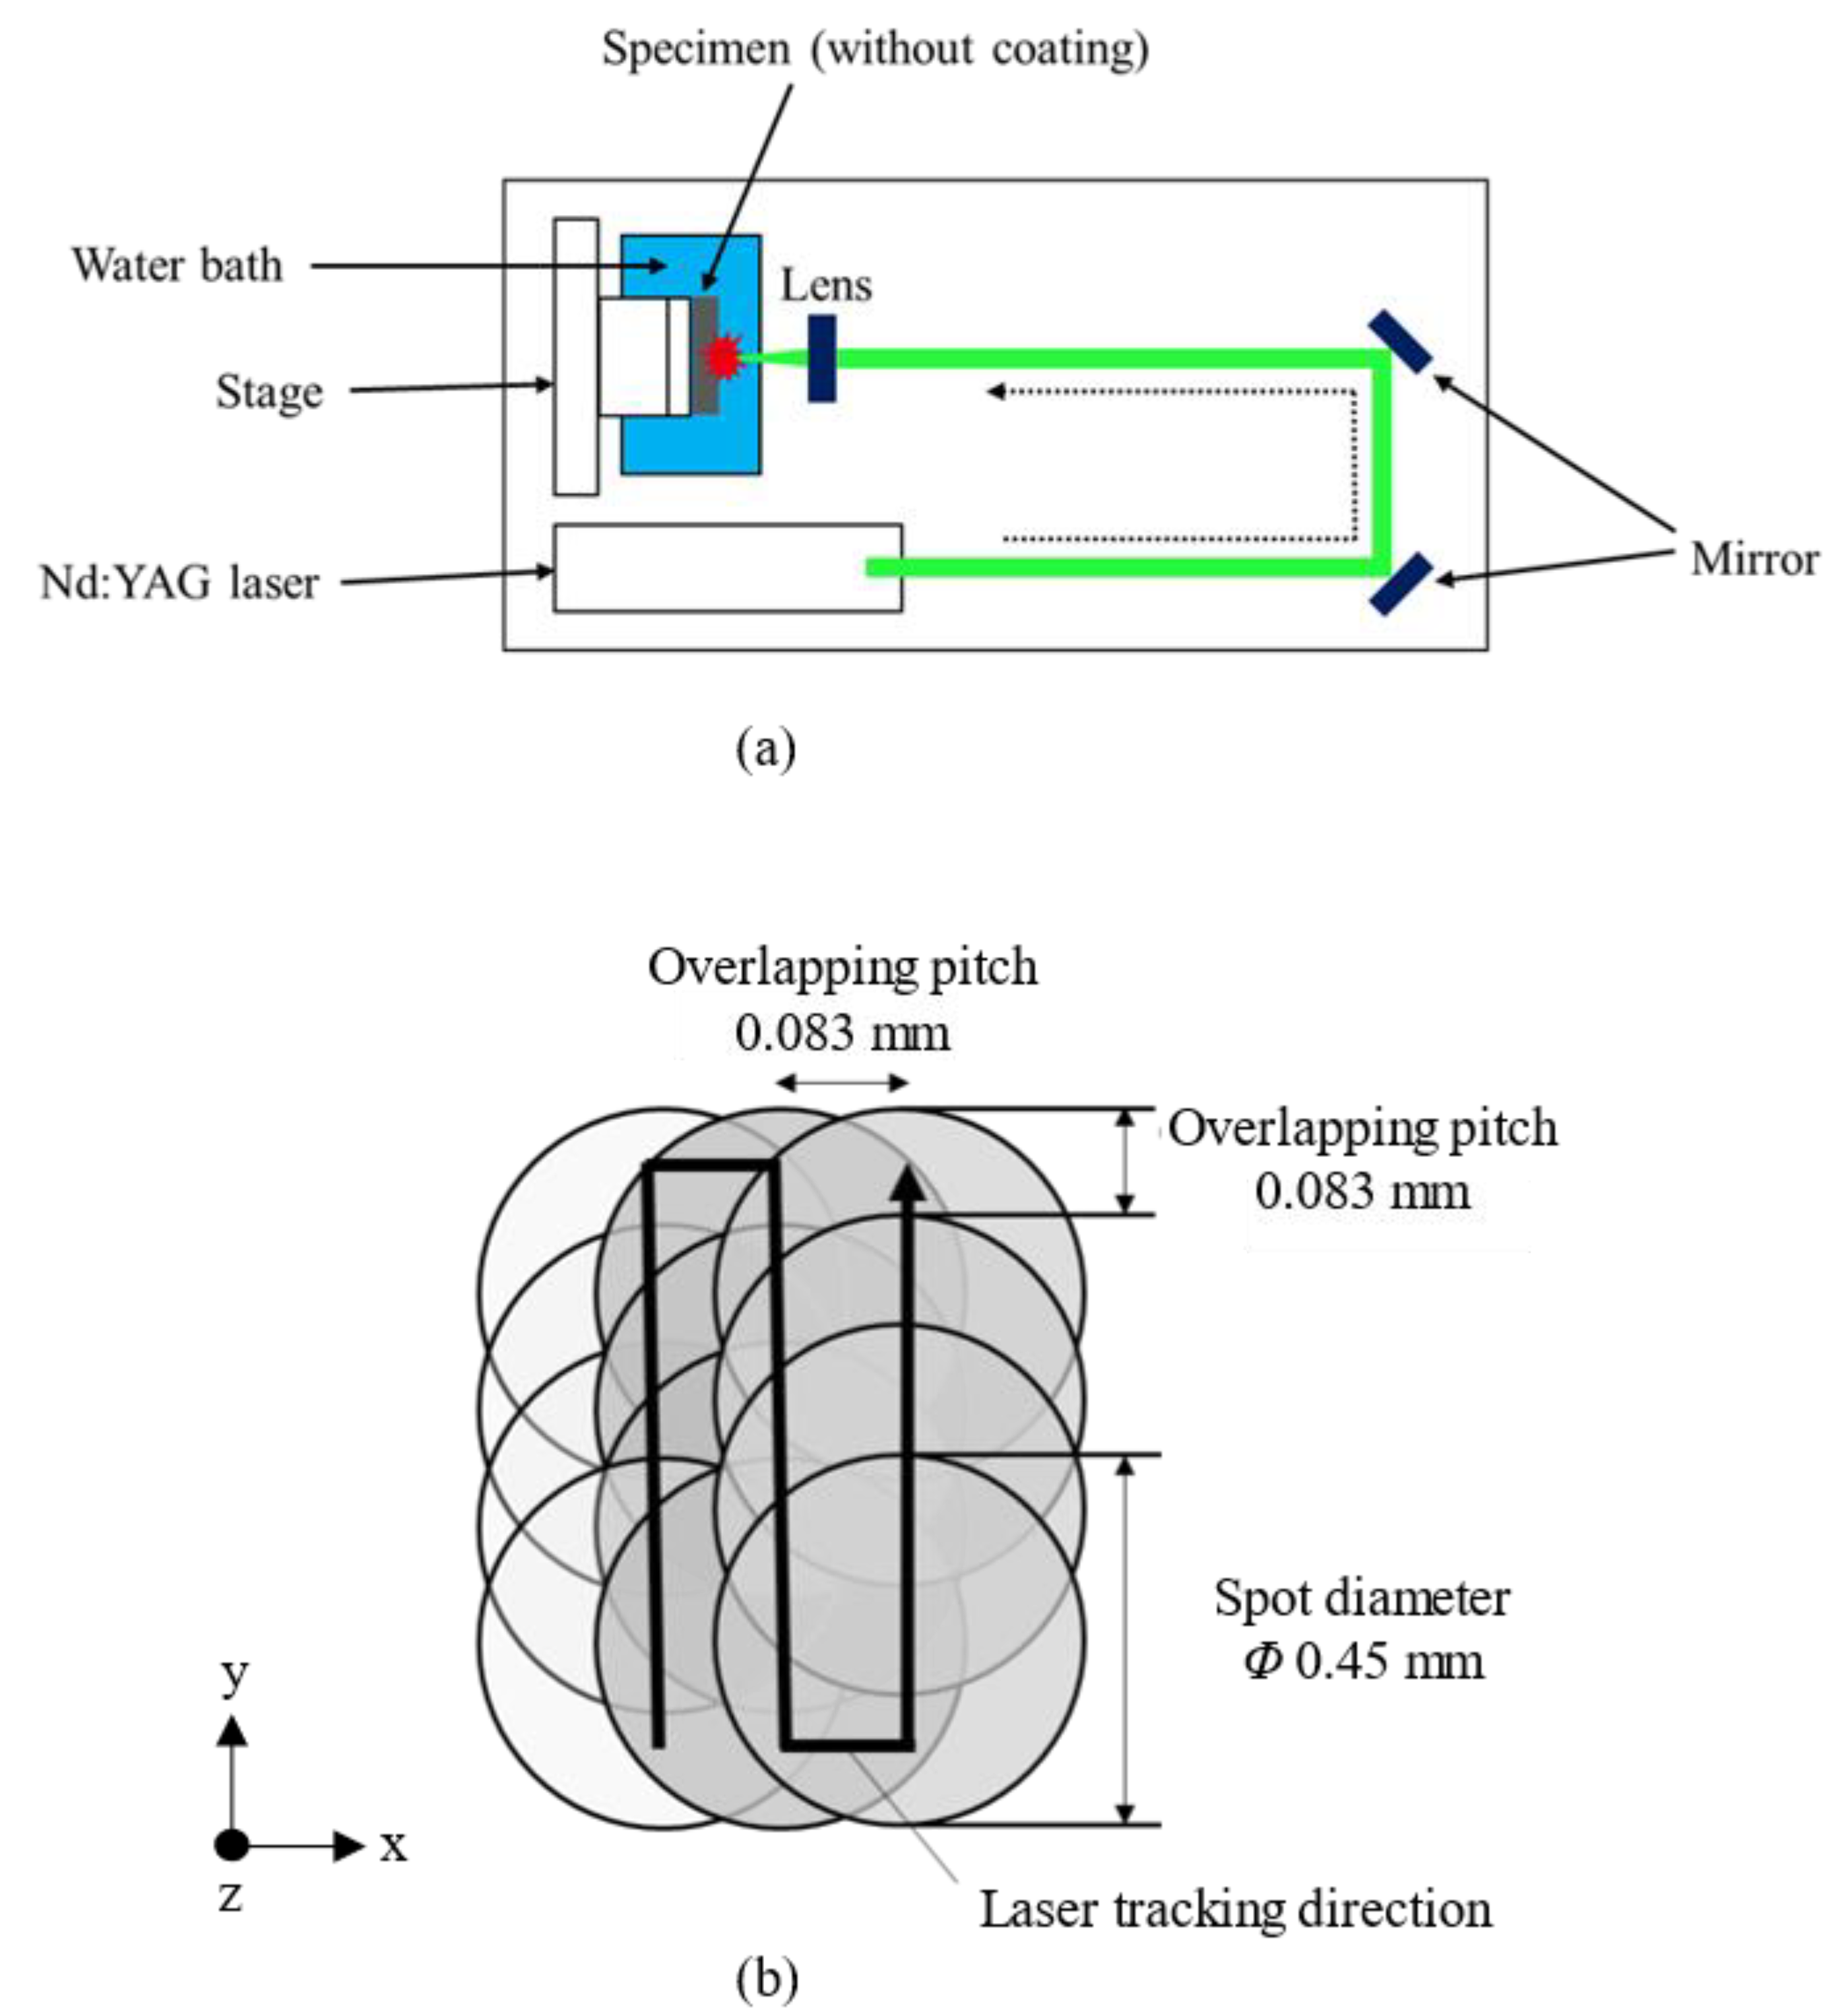
Figure 4.
Distribution of the residual stress in the longitudinal direction.
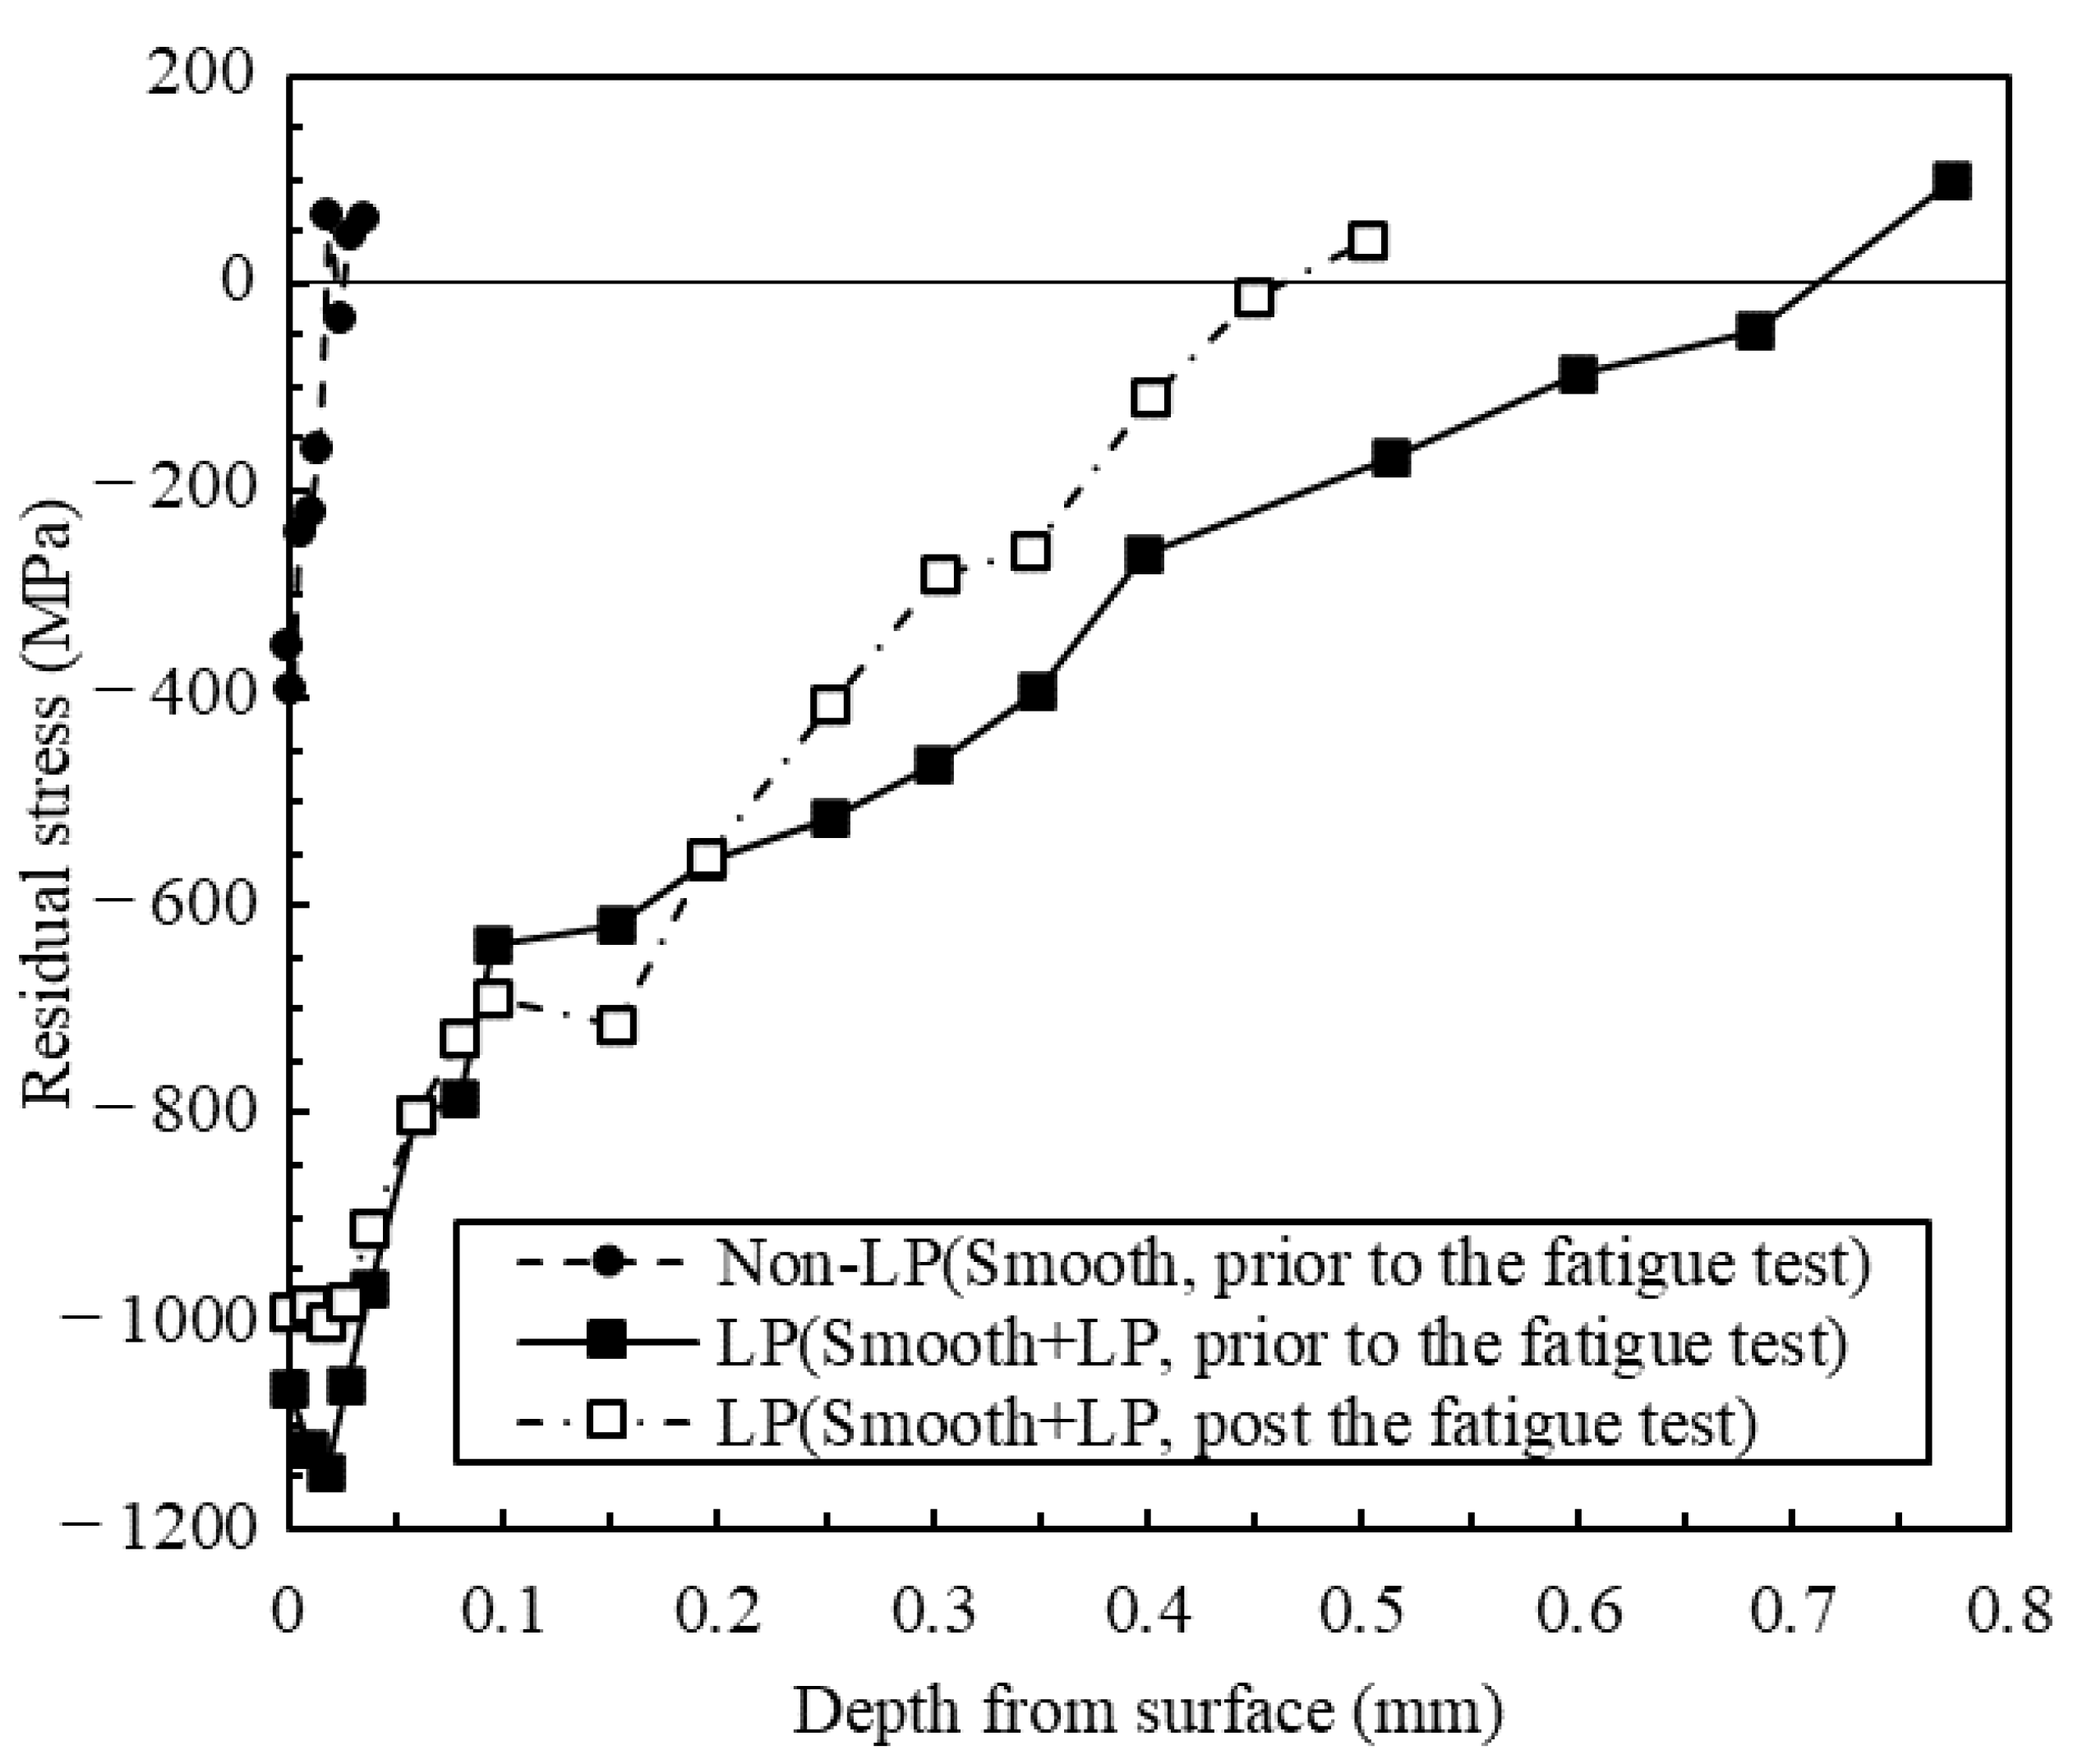
Figure 5.
Distribution of the Vickers hardness at the cross-section of each specimen.

Figure 6.
S–N diagrams of the (a) Smooth and Smooth + LP, (b) 0.2 Slit and LP + 0.2 Slit, and (c) 0.6 Slit and LP + 0.6 Slit specimens.
Figure 6.
S–N diagrams of the (a) Smooth and Smooth + LP, (b) 0.2 Slit and LP + 0.2 Slit, and (c) 0.6 Slit and LP + 0.6 Slit specimens.

Figure 7.
Relationship between the fatigue limit and semicircular slit depth.
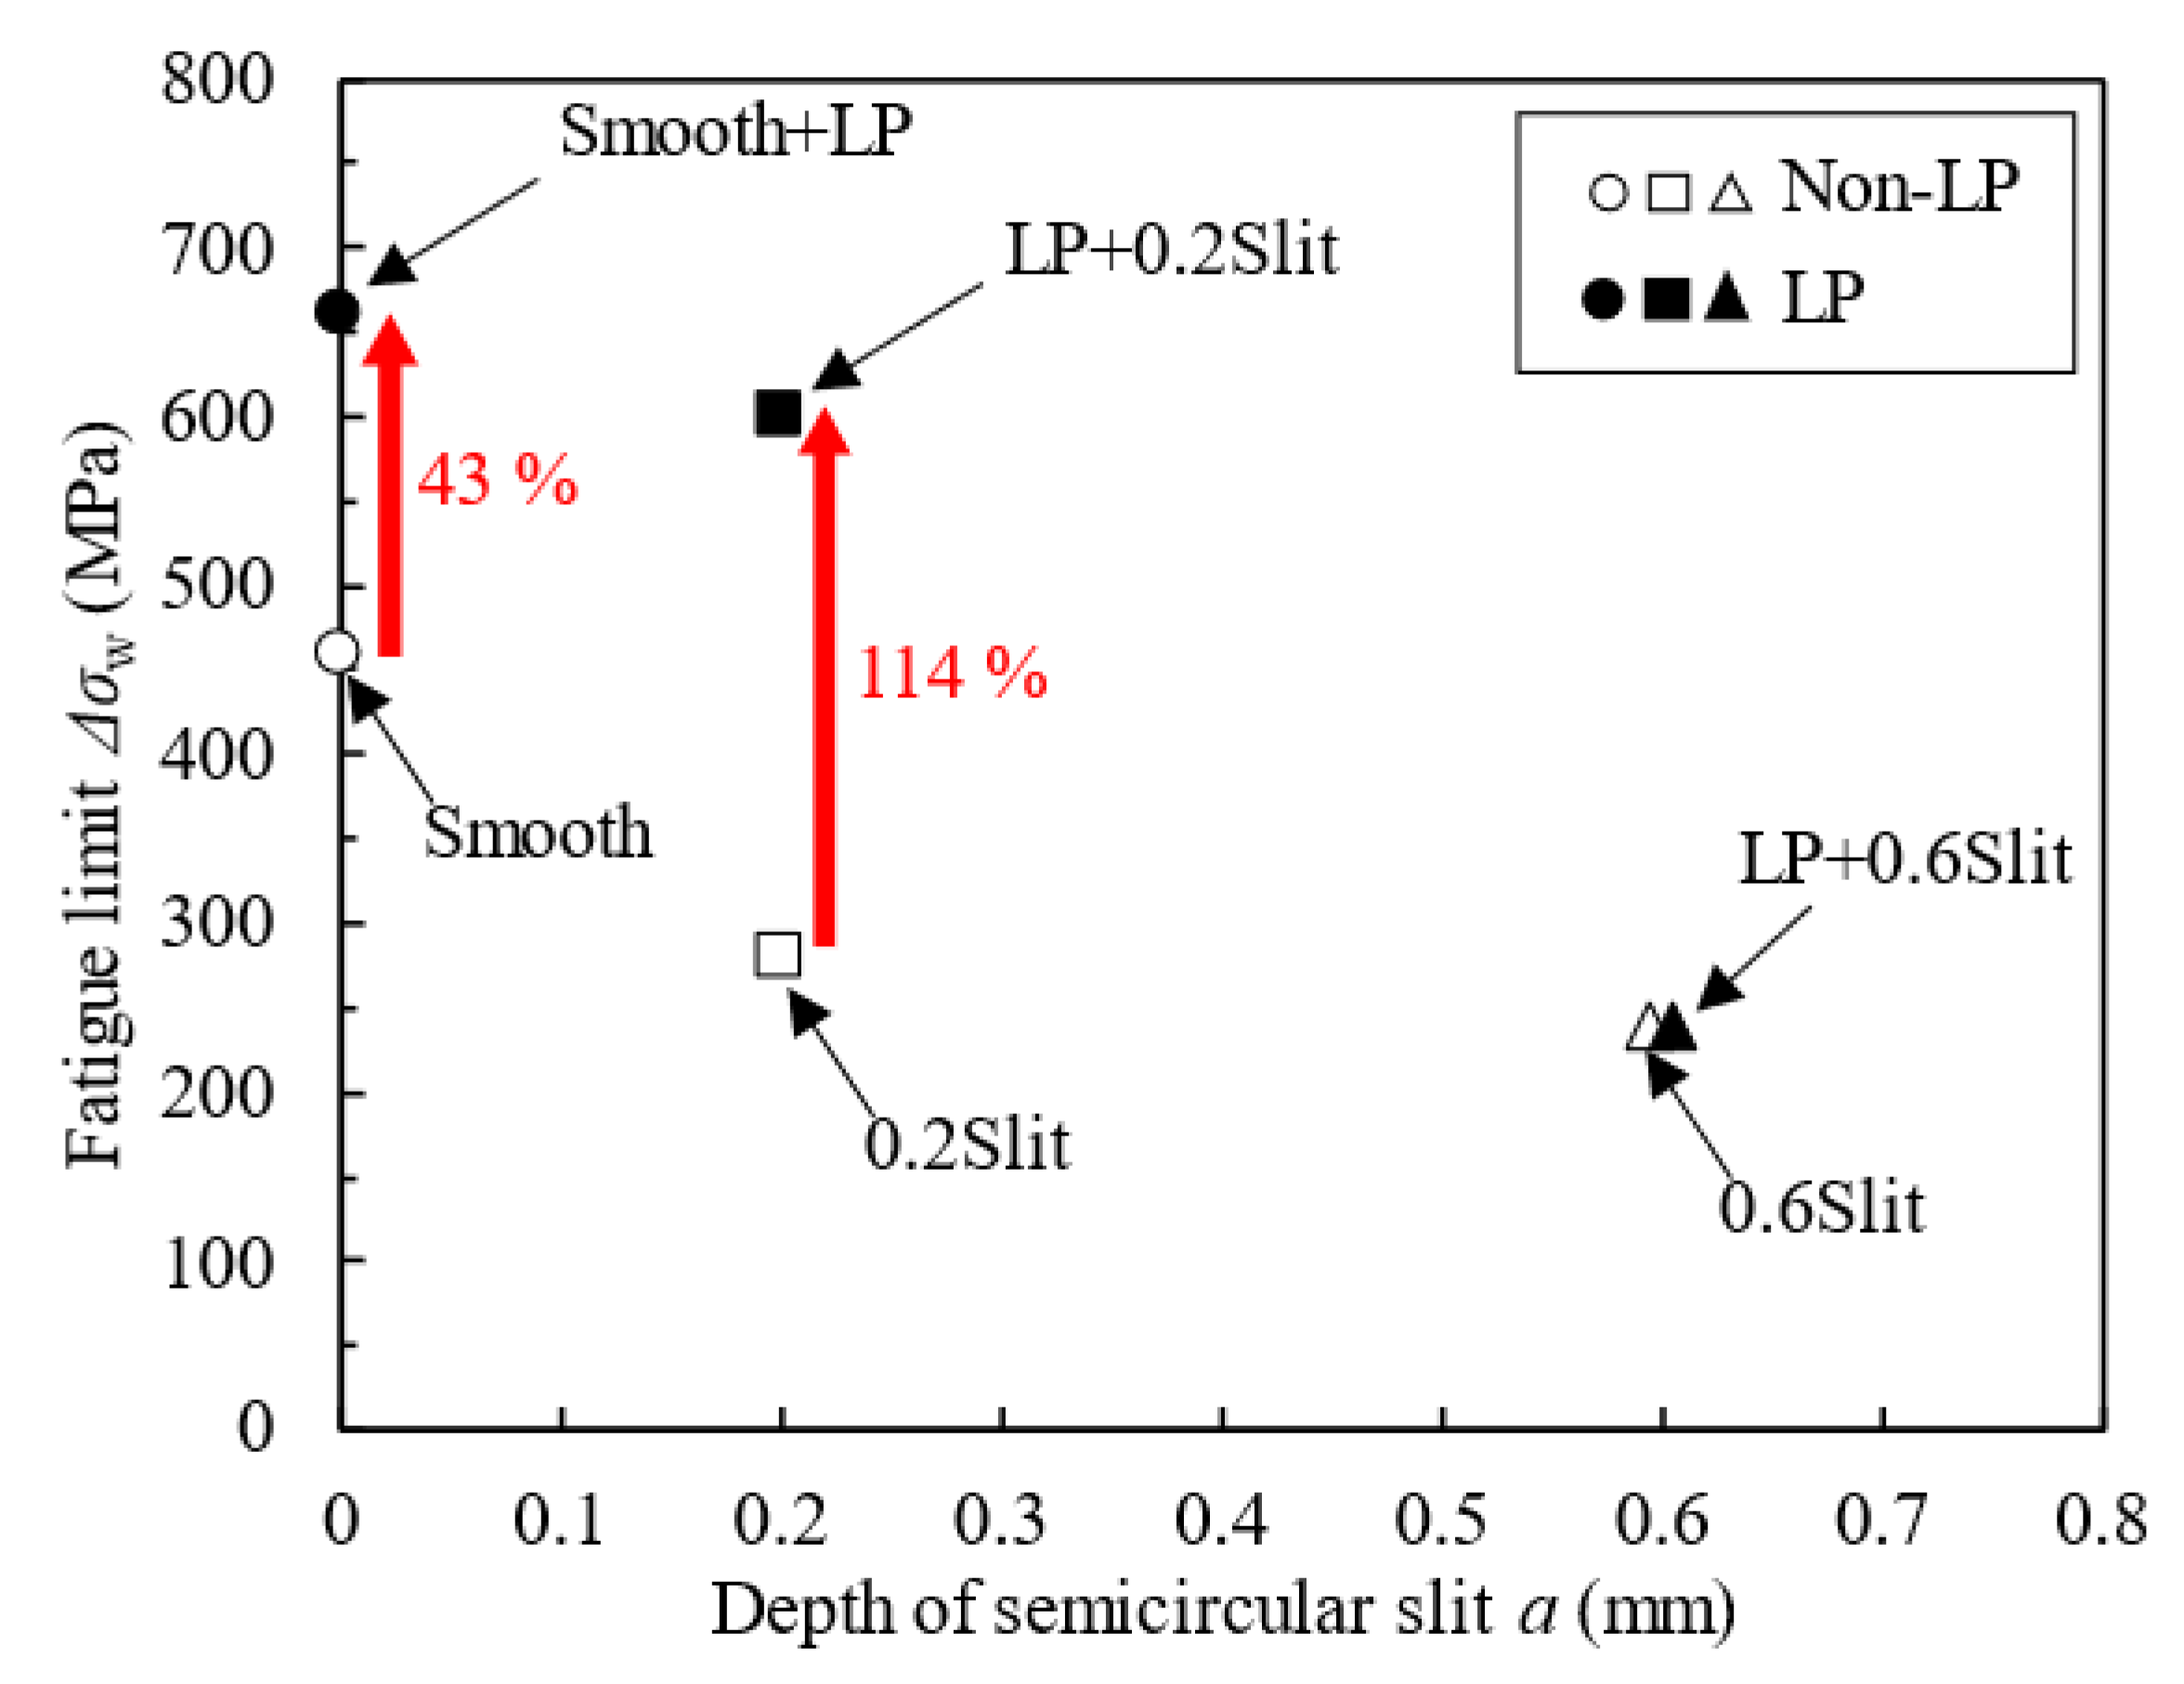
Figure 8.
Fracture surface of the (a) Smooth and (b) Smooth + LP specimen.
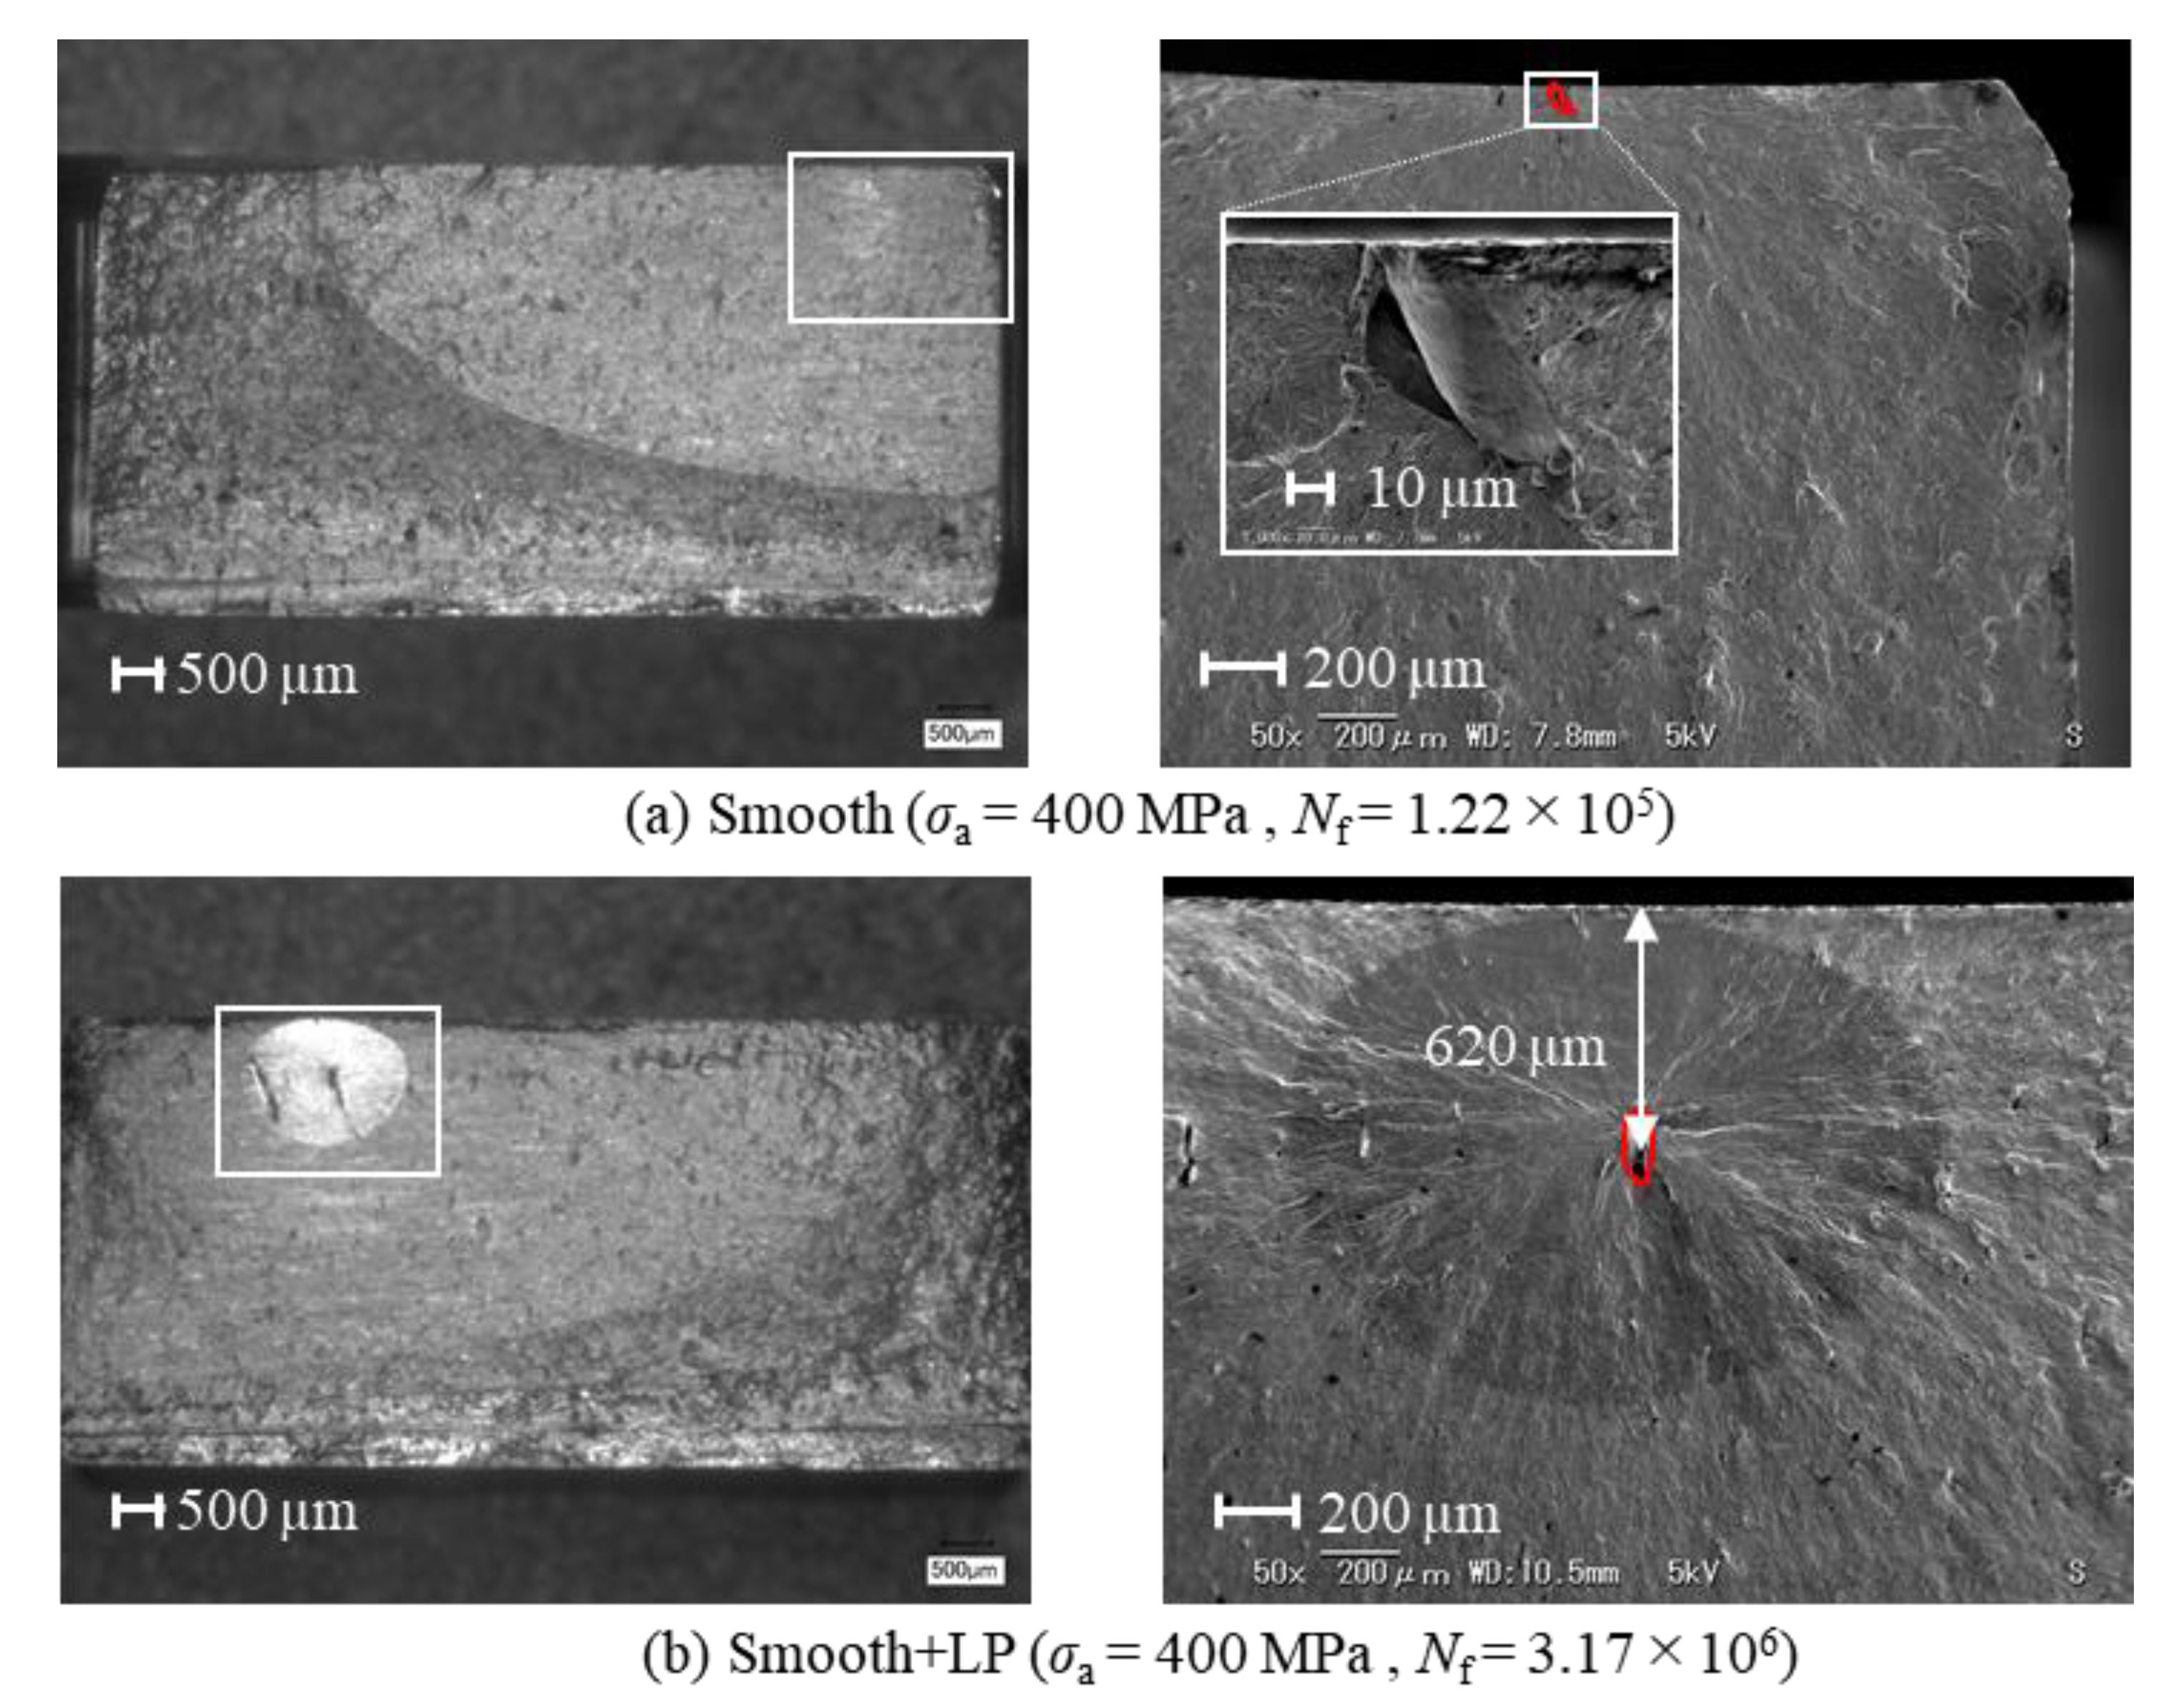
Figure 9.
Fracture surface of the (a) 0.2 Slit and (b) LP + 0.2 Slit specimen.
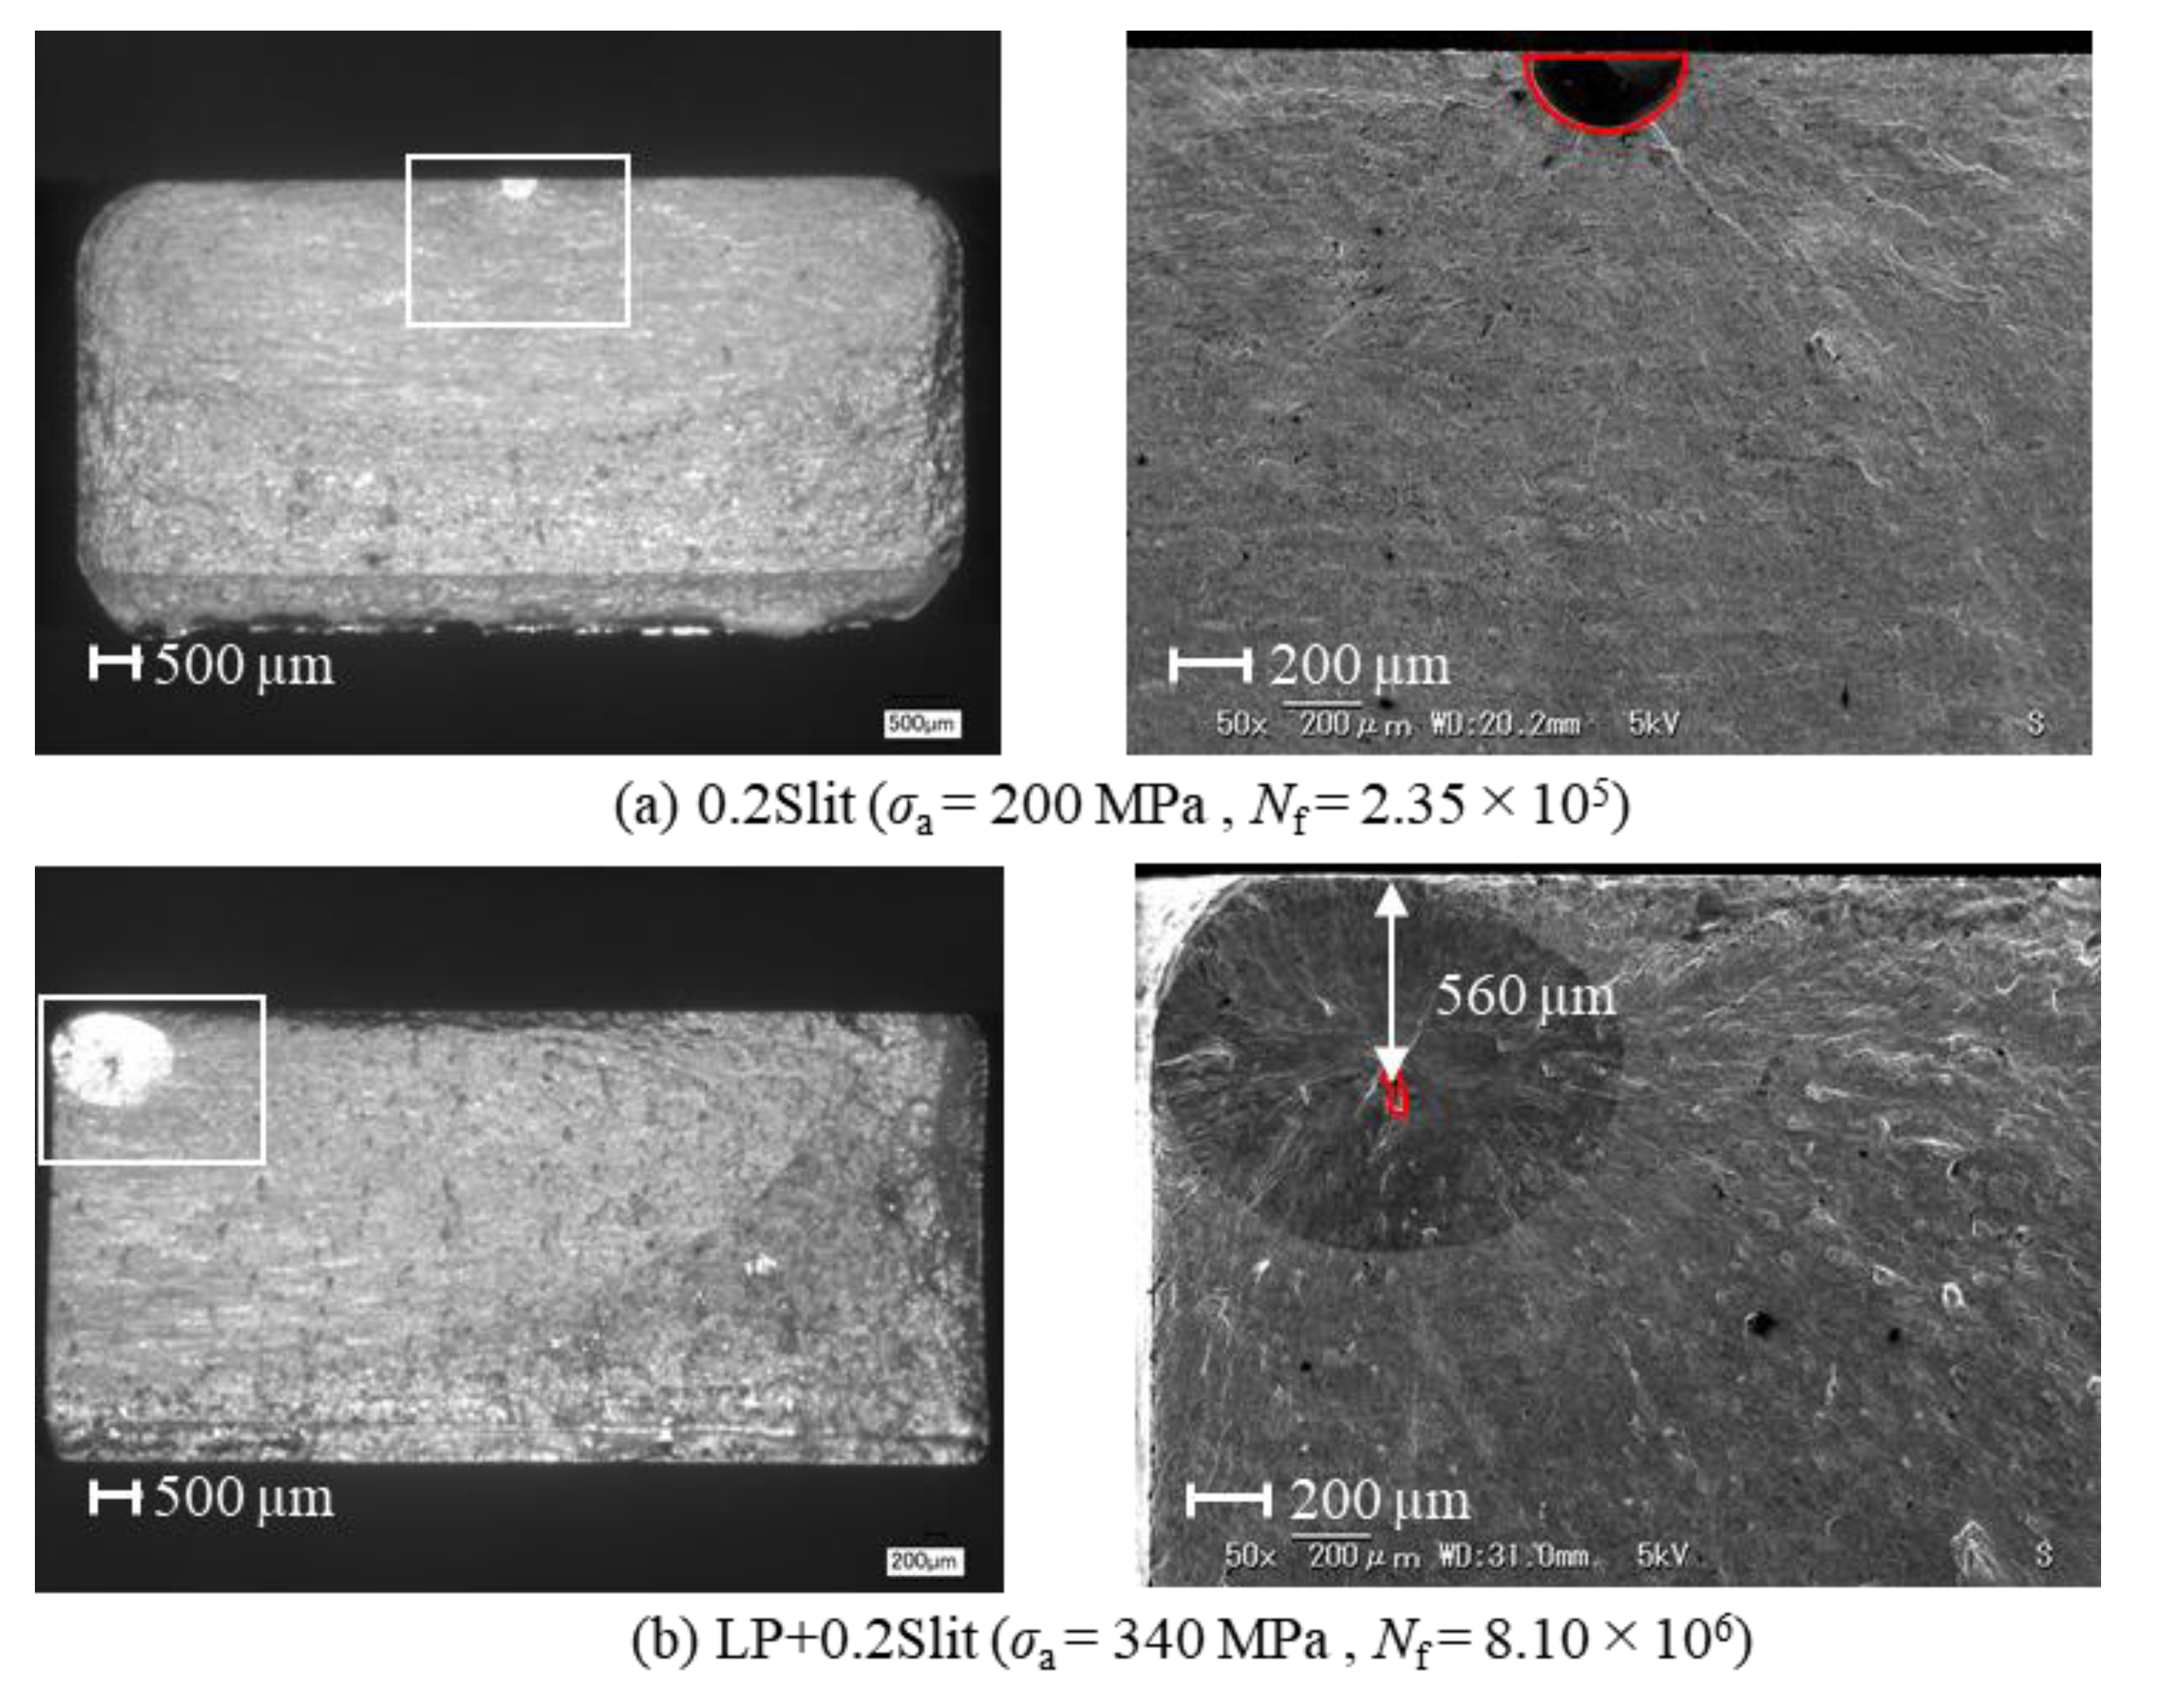
Figure 10.
Fracture surface of the (a) 0.6 Slit and (b) LP + 0.6 Slit specimen.
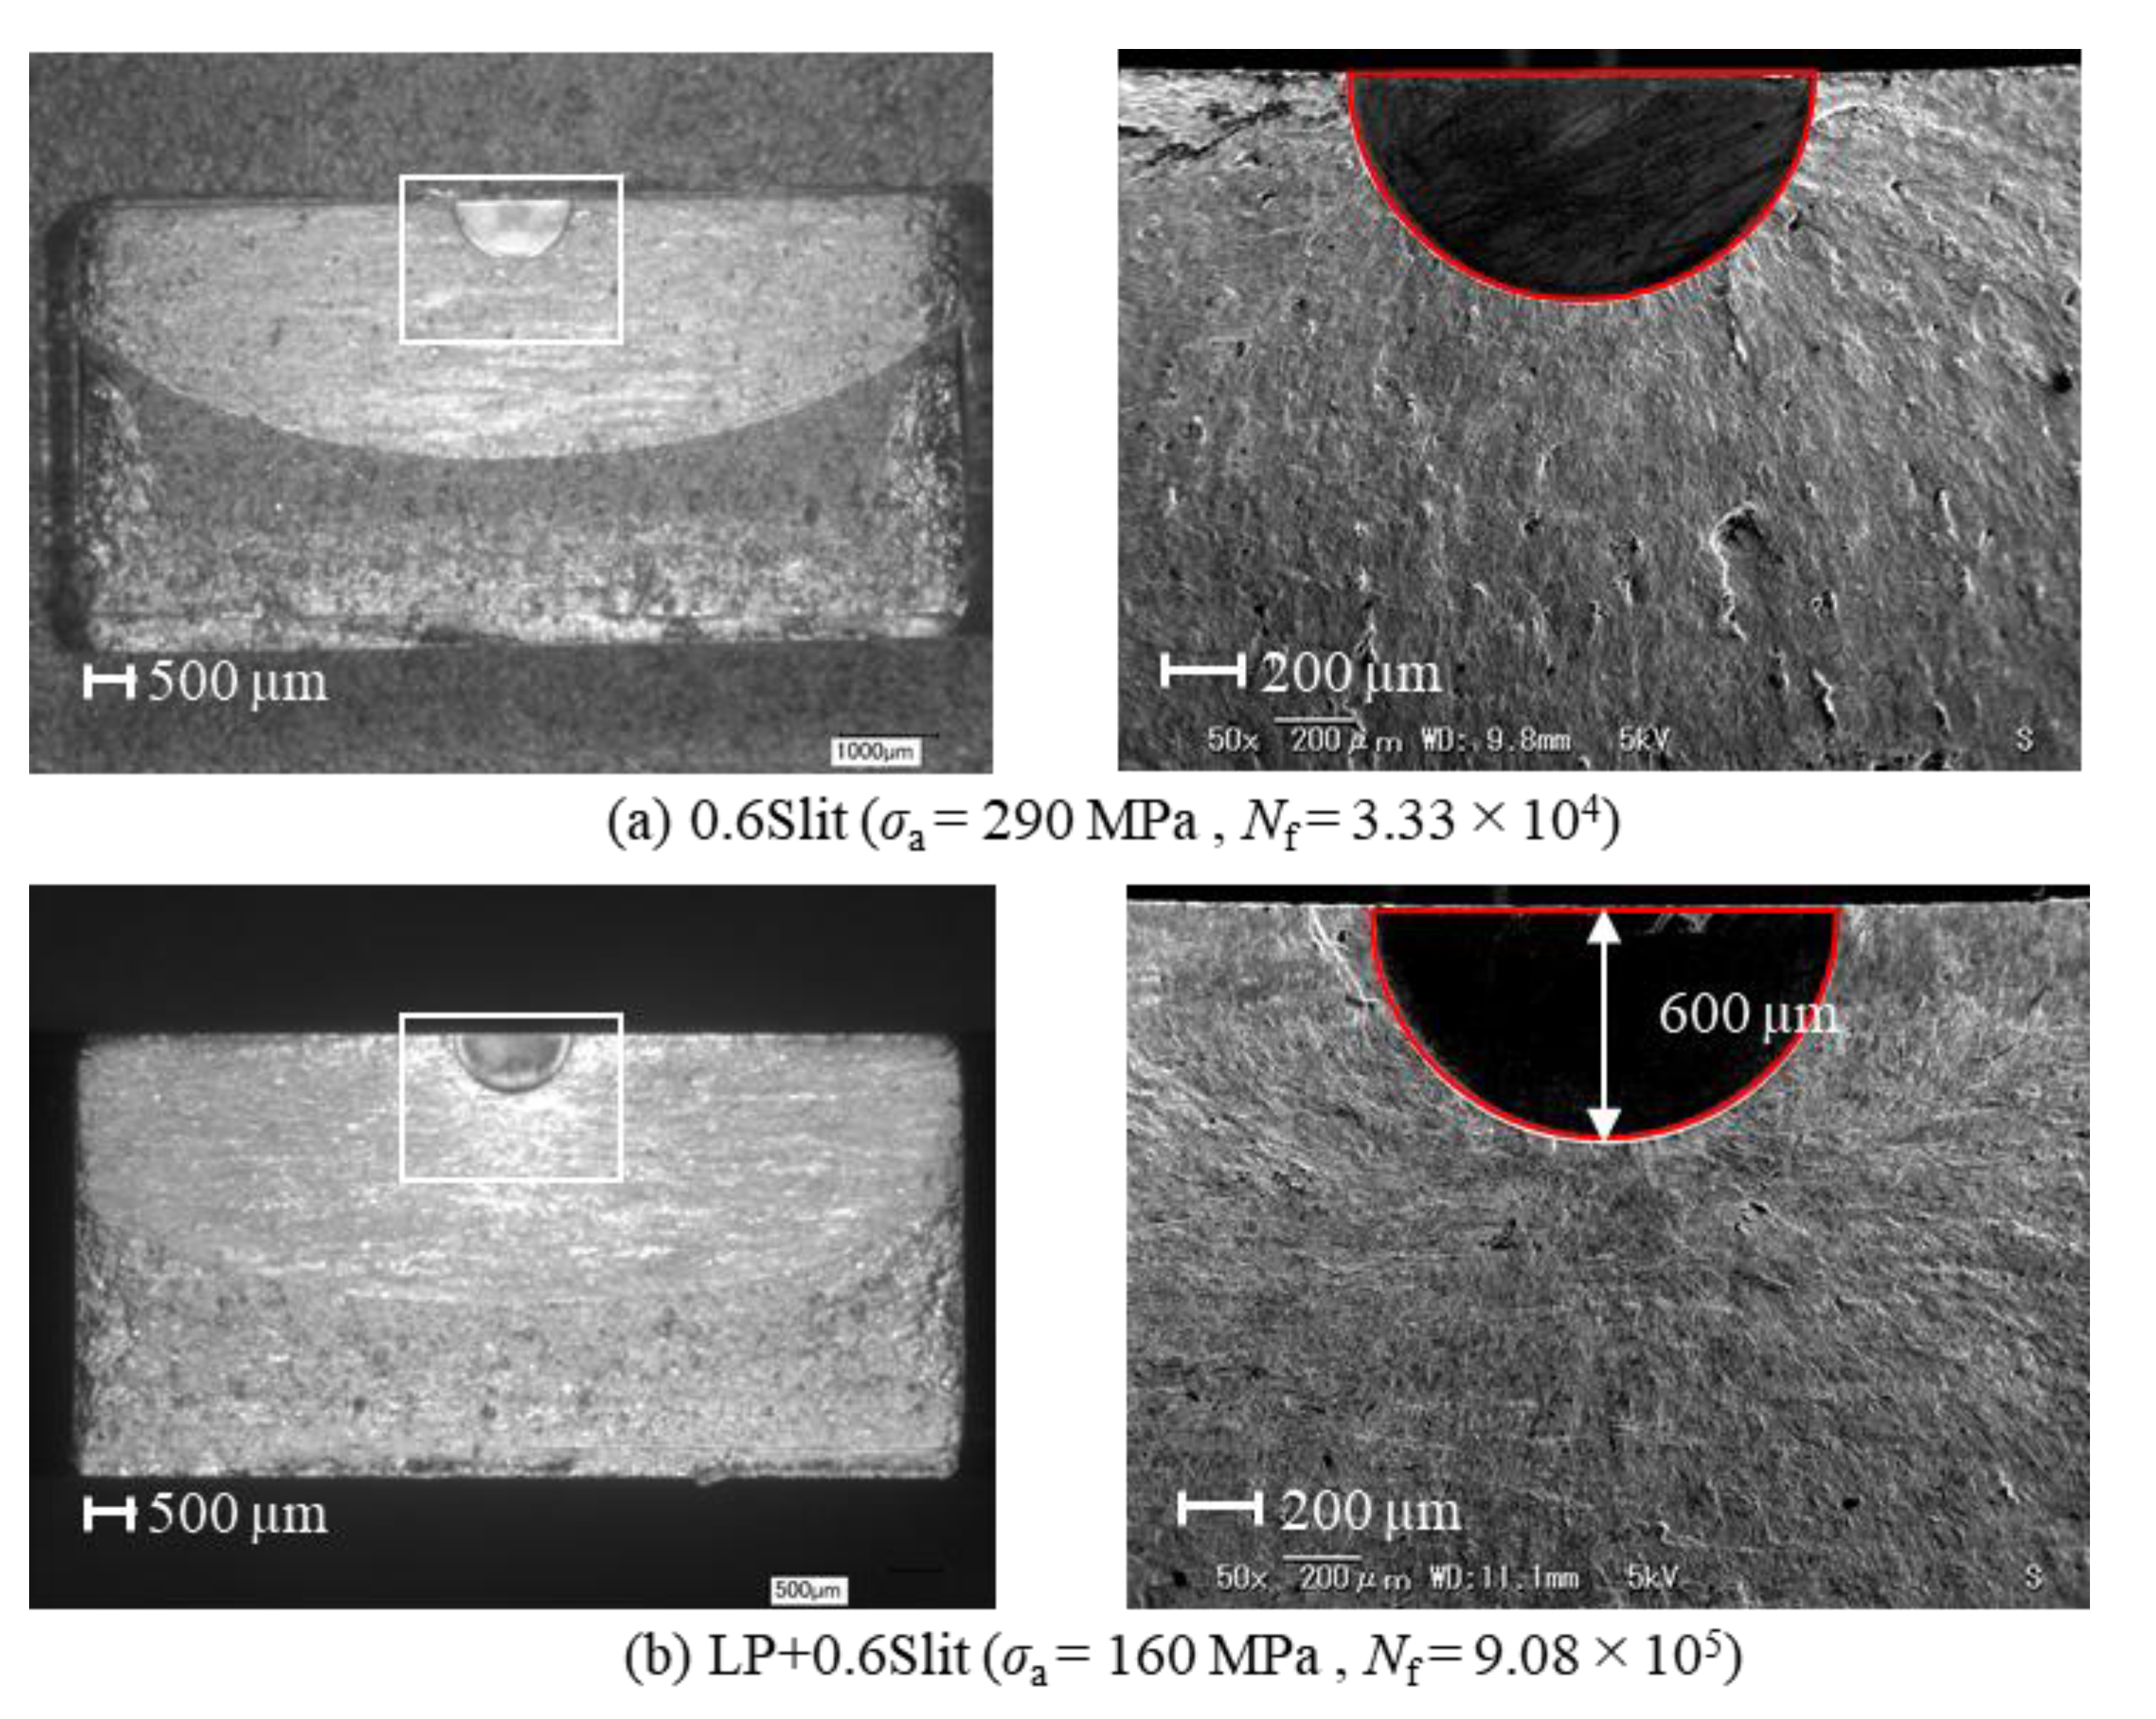
Figure 11.
Estimation of the acceptable crack size.

Table 1.
Chemical composition of maraging steel (wt%).
| Ni | Co | Mo | Ti | Si | Mn | C | Fe |
|---|---|---|---|---|---|---|---|
| 17–19 | 9–11 | 4–6 | 0.9–1.1 | ≤1 | ≤1 | ≤0.03 | Bal. |
Table 2.
Laser peening conditions.
| Spot diameter, D | 0.45 mm |
| Pulse duration, t | 7.3 ns |
| Pulse energy, Ep | 50 mJ |
| Irradiation density, Np | 144 pulse/mm2 |
| Power density, G | |
| Coverage, Cv | 2290% |
Table 3.
Residual-stress measurement conditions.
| Method | cosα |
| Tube bulb | Cr |
| Measurement surface | (2.1.1) plane |
| Collimator diameter | Φ1.0 mm |
| Voltage value | 30 kV |
| Current value | 1.0 mA |
Publisher’s Note: MDPI stays neutral with regard to jurisdictional claims in published maps and institutional affiliations. |
© 2021 by the authors. Licensee MDPI, Basel, Switzerland. This article is an open access article distributed under the terms and conditions of the Creative Commons Attribution (CC BY) license (https://creativecommons.org/licenses/by/4.0/).
Share and Cite
MDPI and ACS Style
Tsuchiya, S.; Takahashi, K. Improving Fatigue Limit and Rendering Defects Harmless through Laser Peening in Additive-Manufactured Maraging Steel. Metals 2022, 12, 49. https://doi.org/10.3390/met12010049
AMA Style
Tsuchiya S, Takahashi K. Improving Fatigue Limit and Rendering Defects Harmless through Laser Peening in Additive-Manufactured Maraging Steel. Metals. 2022; 12(1):49. https://doi.org/10.3390/met12010049
Chicago/Turabian StyleTsuchiya, Shiori, and Koji Takahashi. 2022. "Improving Fatigue Limit and Rendering Defects Harmless through Laser Peening in Additive-Manufactured Maraging Steel" Metals 12, no. 1: 49. https://doi.org/10.3390/met12010049
Note that from the first issue of 2016, this journal uses article numbers instead of page numbers. See further details here.