
First-Principles Calculations of Y-Si-O Nanoclusters and Effect of Si on Microstructure and Mechanical Properties of 12Cr ODS Steel in Vacuum Sintering System

Abstract
:1. Introduction
2. Calculation and Experiment Methods
2.1. Calculation Method
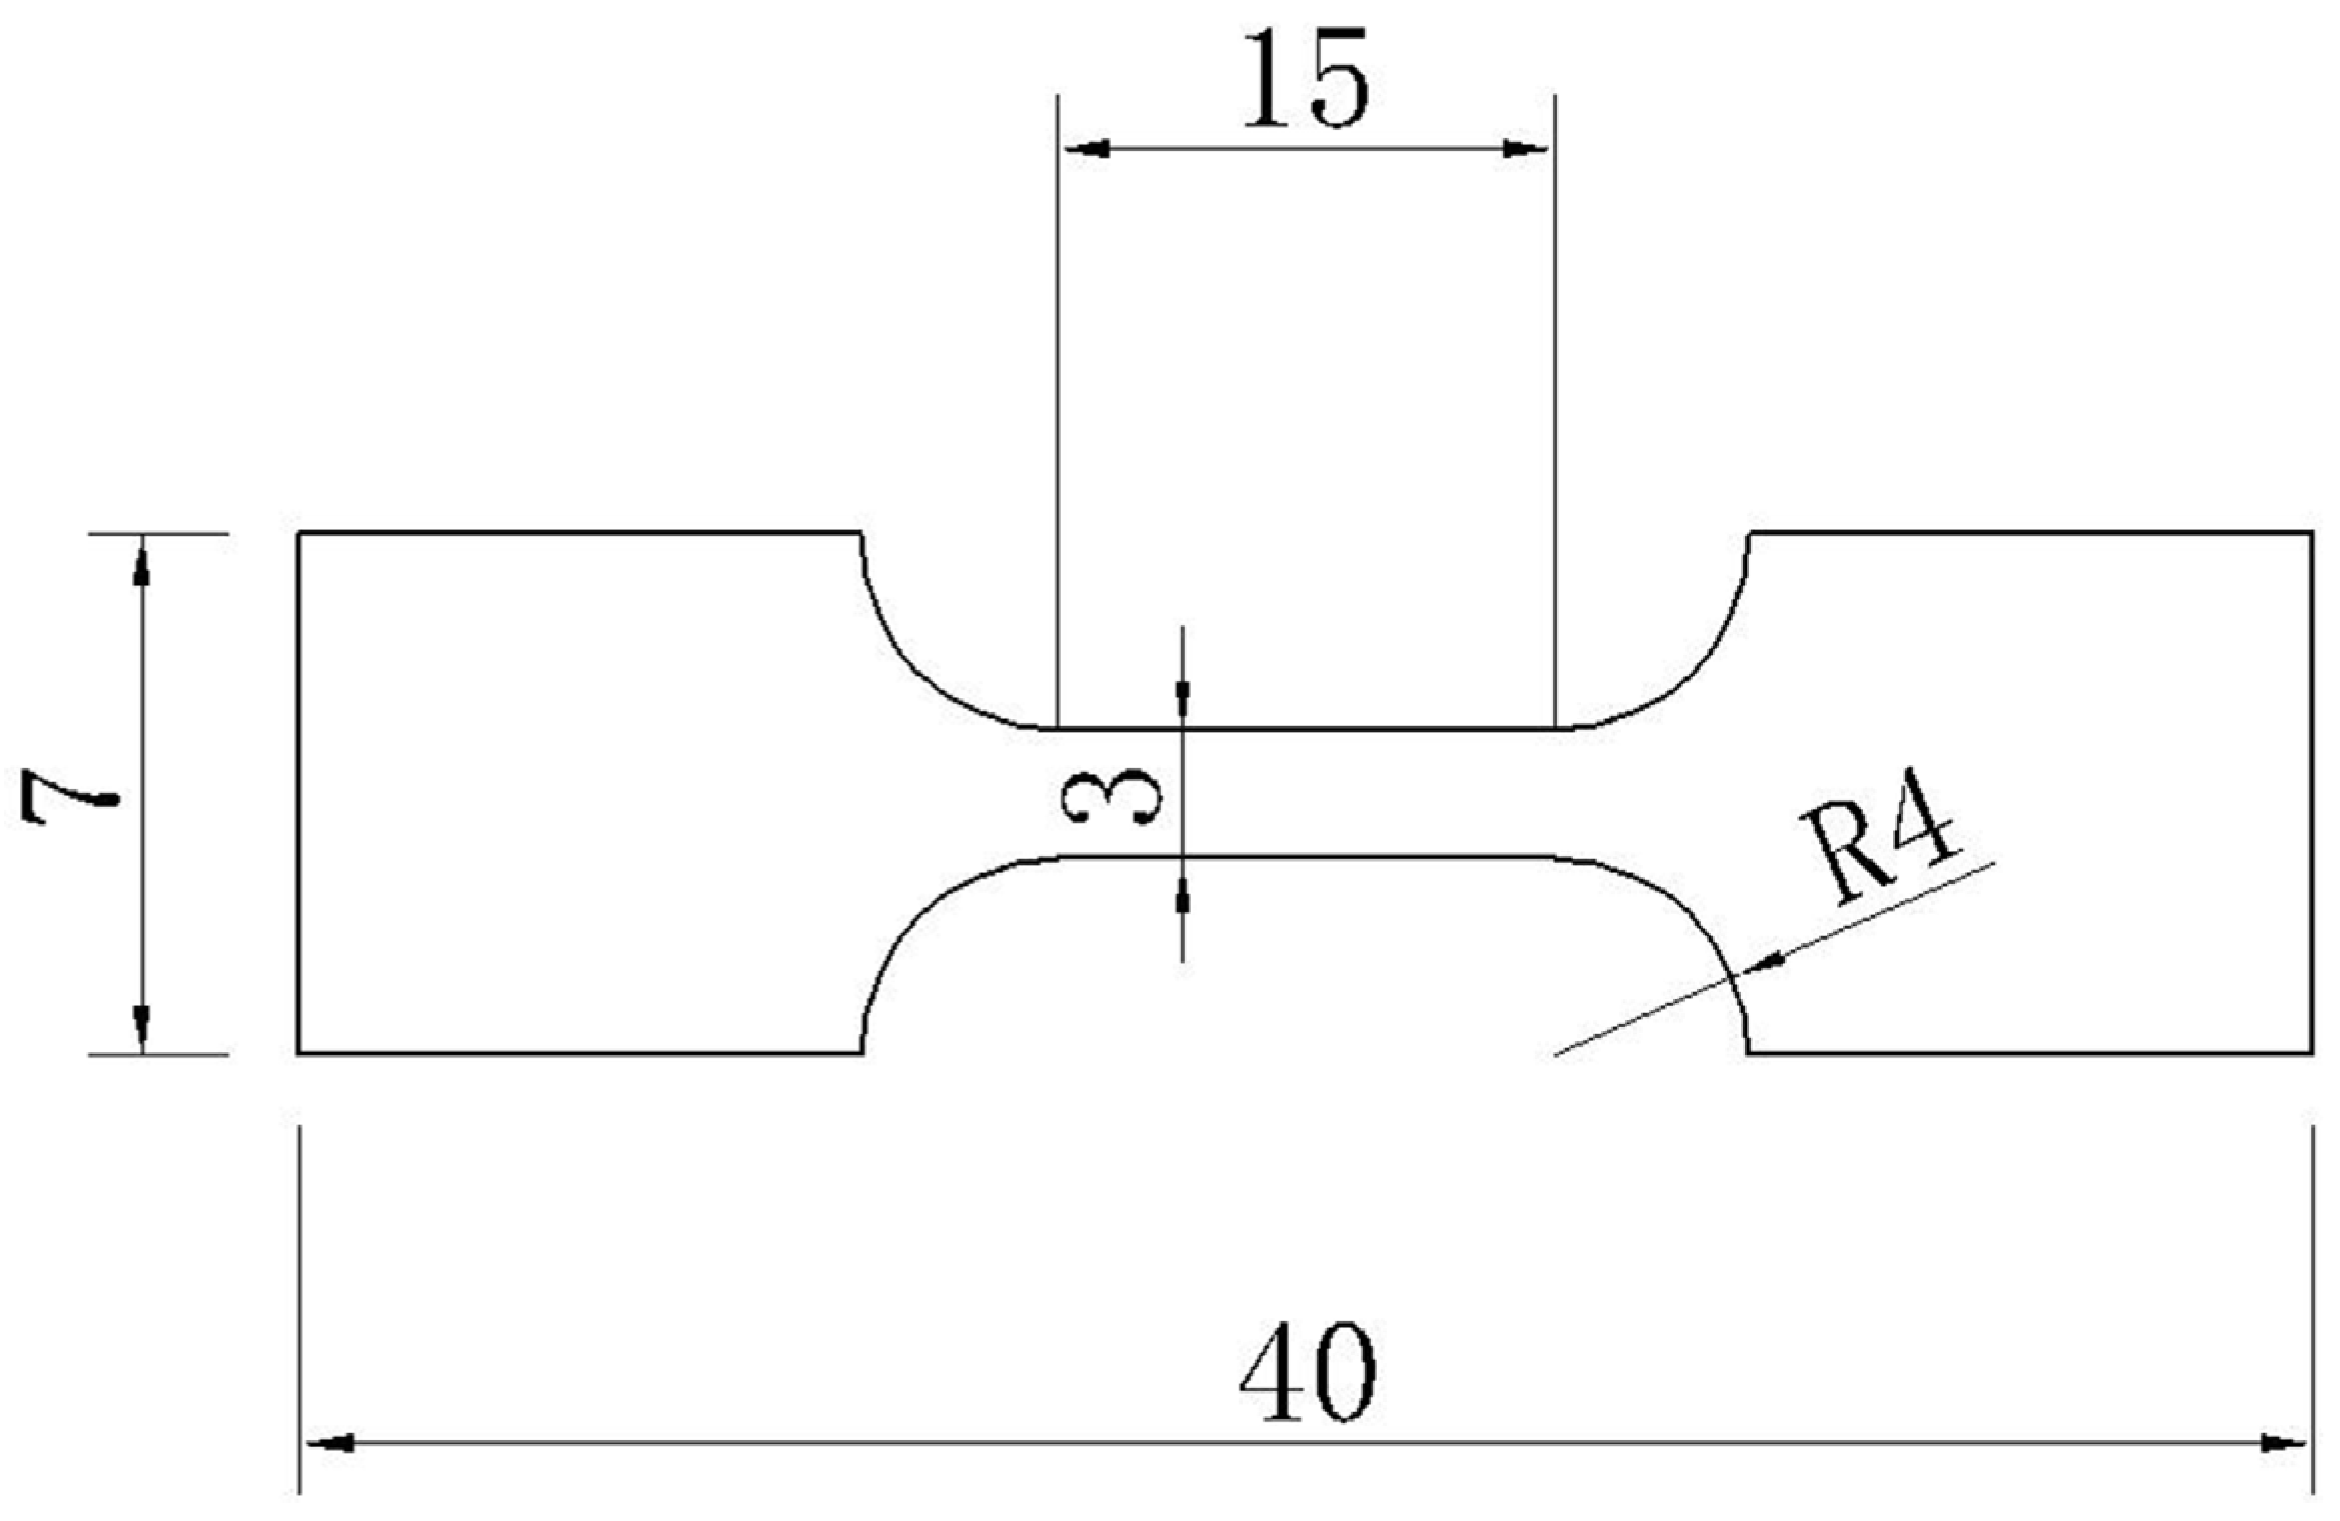
2.2. Experiment Method
3. Results and Discussion
3.1. Calculation Results
3.1.1. Formation Energies of Solute Atoms
3.1.2. Interaction between Solute Atoms and Vacancies
3.1.3. Interactions between Solute Atoms
3.1.4. Binding Energies of Si-Y-O-v Nanoclusters
3.2. Experimental Results
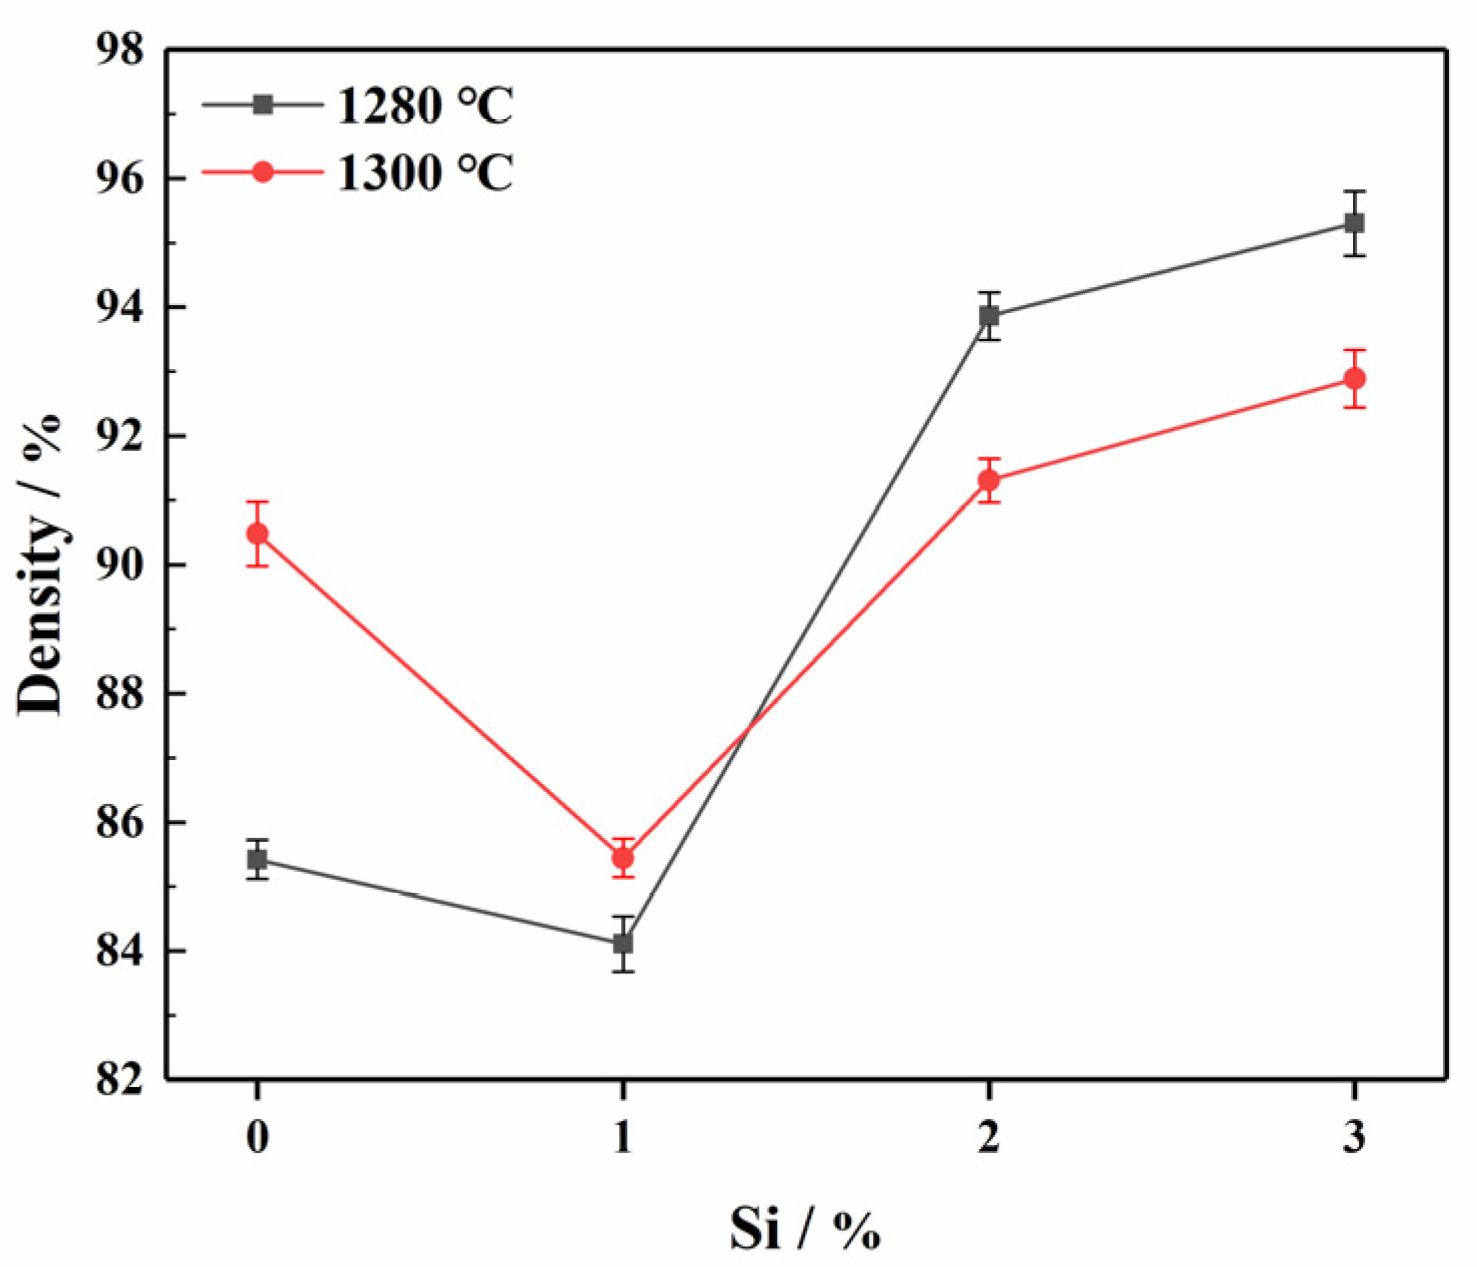
3.2.1. The Influence of Different Si Content on the Density of ODS Steels
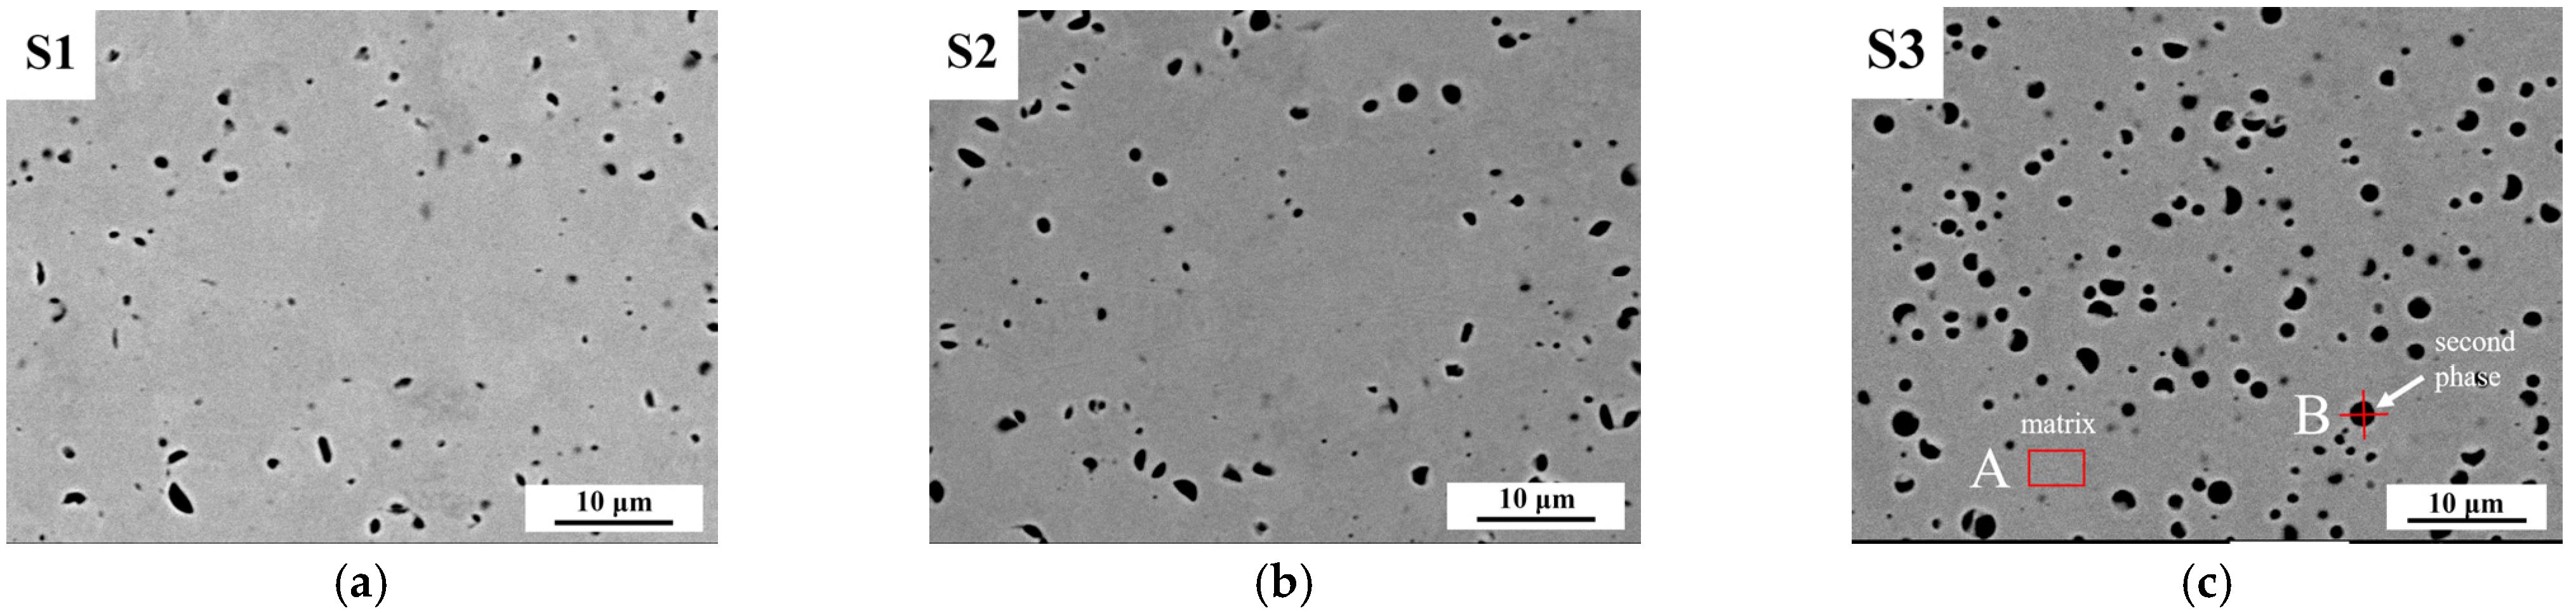
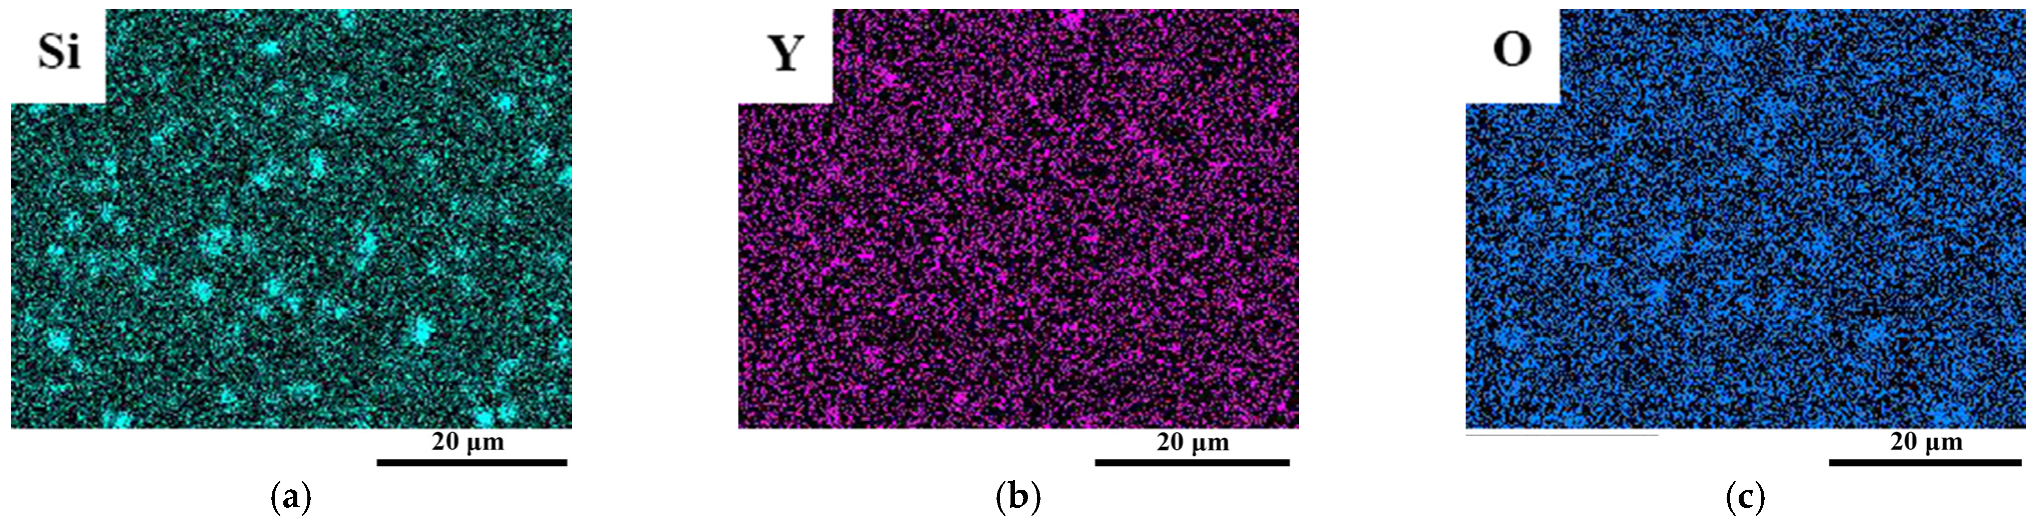
3.2.2. The Influence of Different Si Content on the Second Phases in ODS Steels
3.2.3. The Structure of Microparticles and Stoichiometric Nanoparticles in ODS Steels
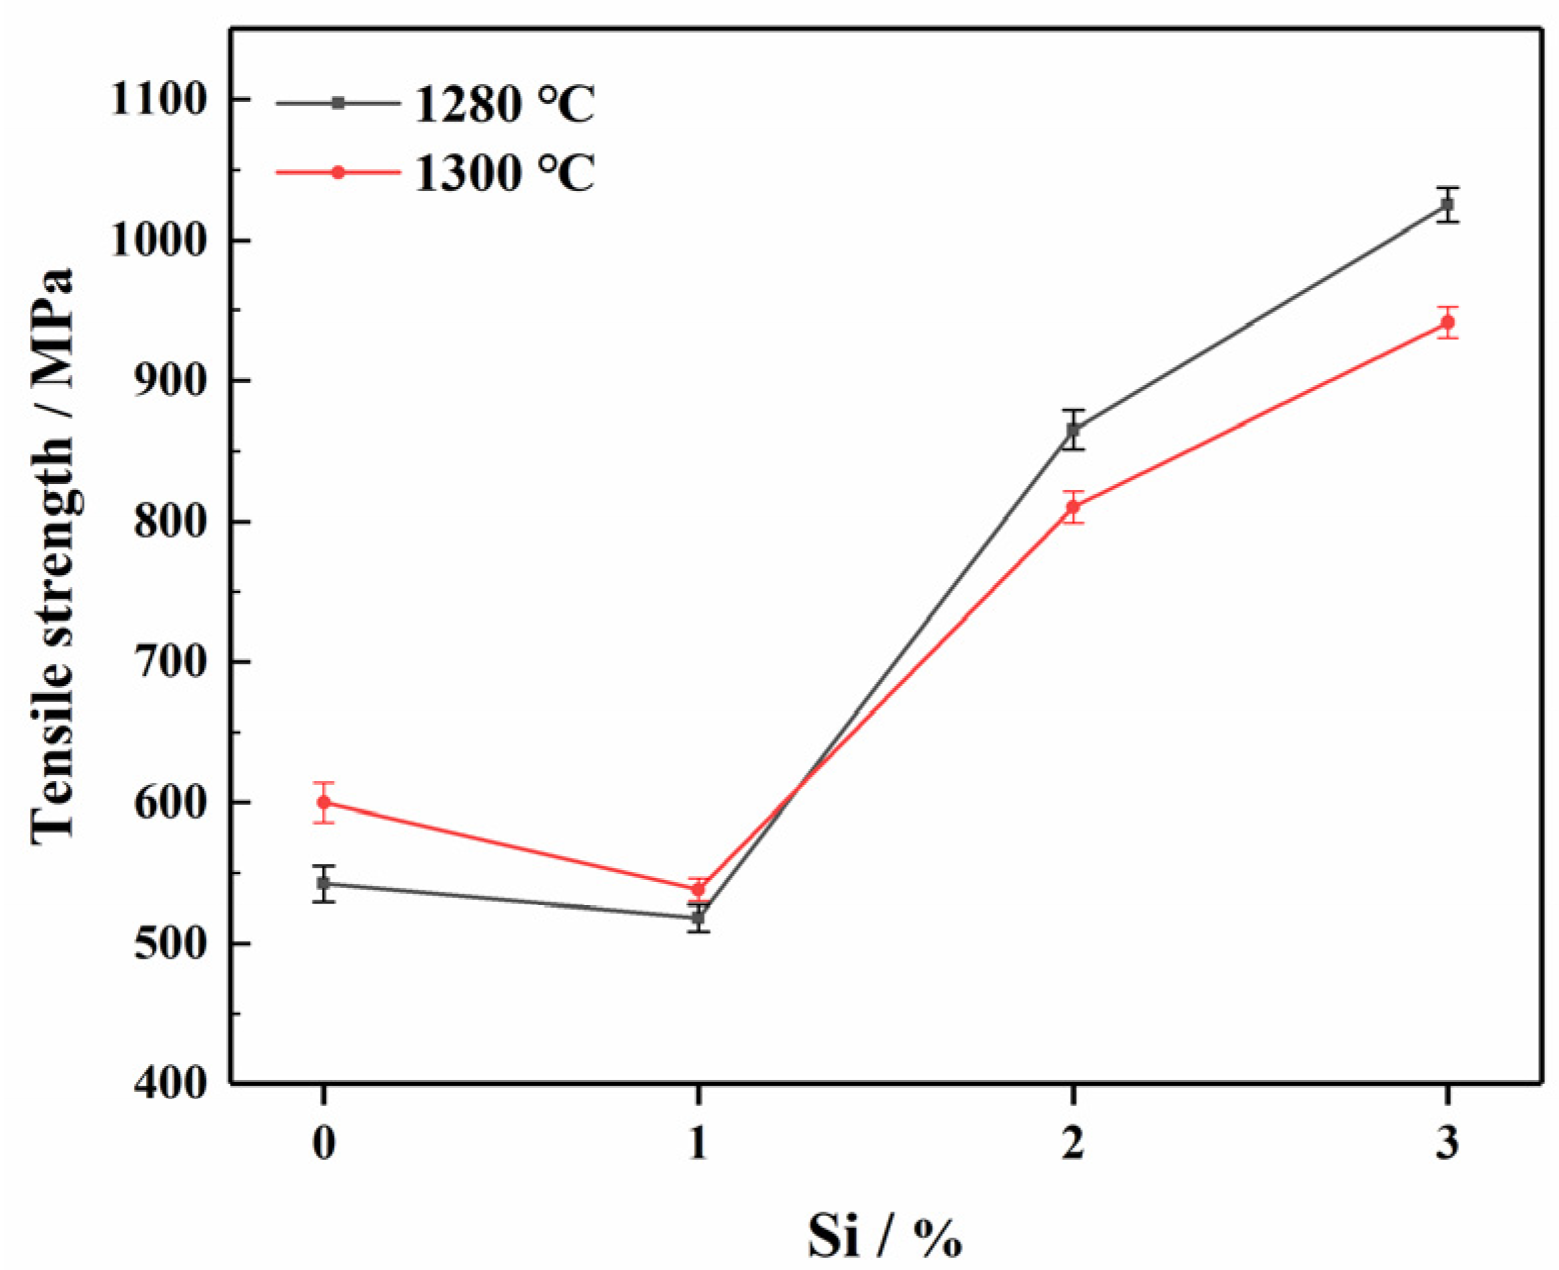
3.2.4. The Influence of Different Si Content on the Mechanical Properties of ODS Steels
4. Conclusions
- The solutes Y and Si preferred substitutional site, while O preferred octahedral interstitial site. The binding sequence of solutes with v followed O-v > Y-v > Si-v, and the affinity of Y, Si and v with O followed O-Y >O-v >O-Si. The most stable Y-O-Si nanocluster (Eb = −2.60 eV) of 10 different structures were generated preferentially. The nucleation mechanism of non-stoichiometric Y-O-Si nanoclusters determined that a large number of vacancies generated during the mechanical alloying process preferentially combined with O(octahedral) atoms to form stable O(octahedral)-v pairs. When O solid solution reached saturation, the surrounding Y and Si solutes would be attracted to form the Y-O-Si nanocluster with the lowest energy and the strongest relative stability;
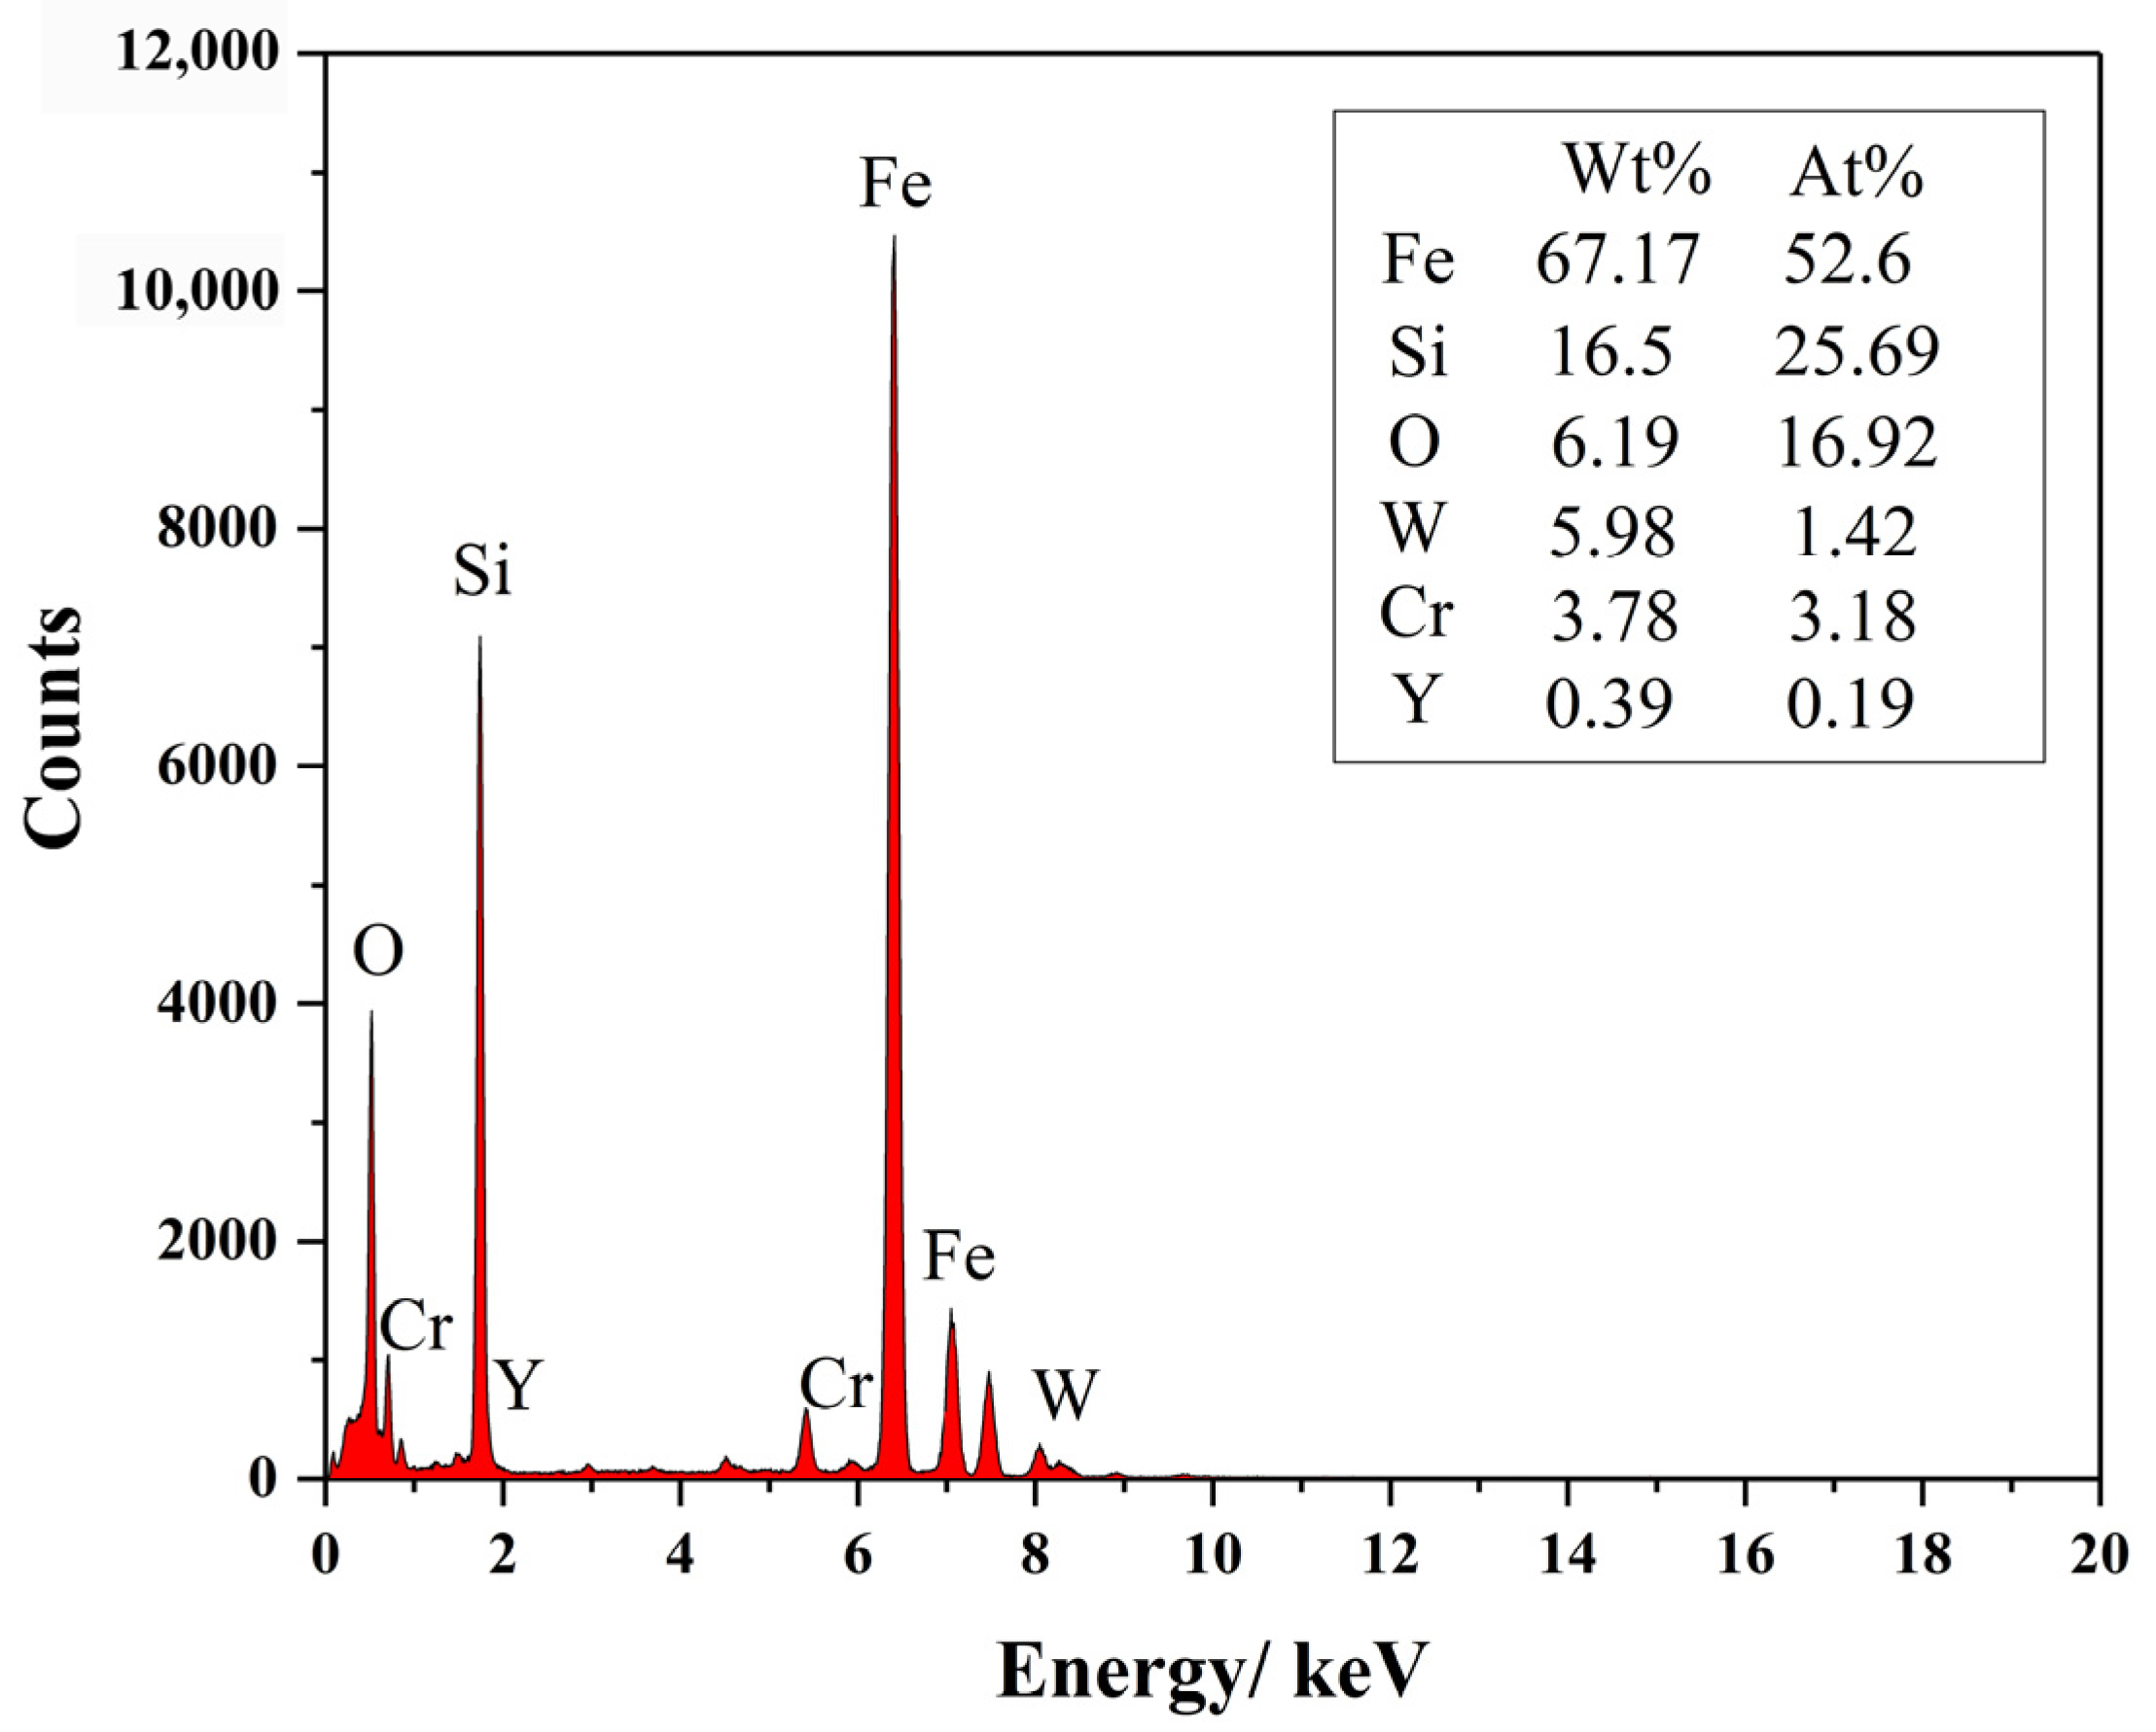
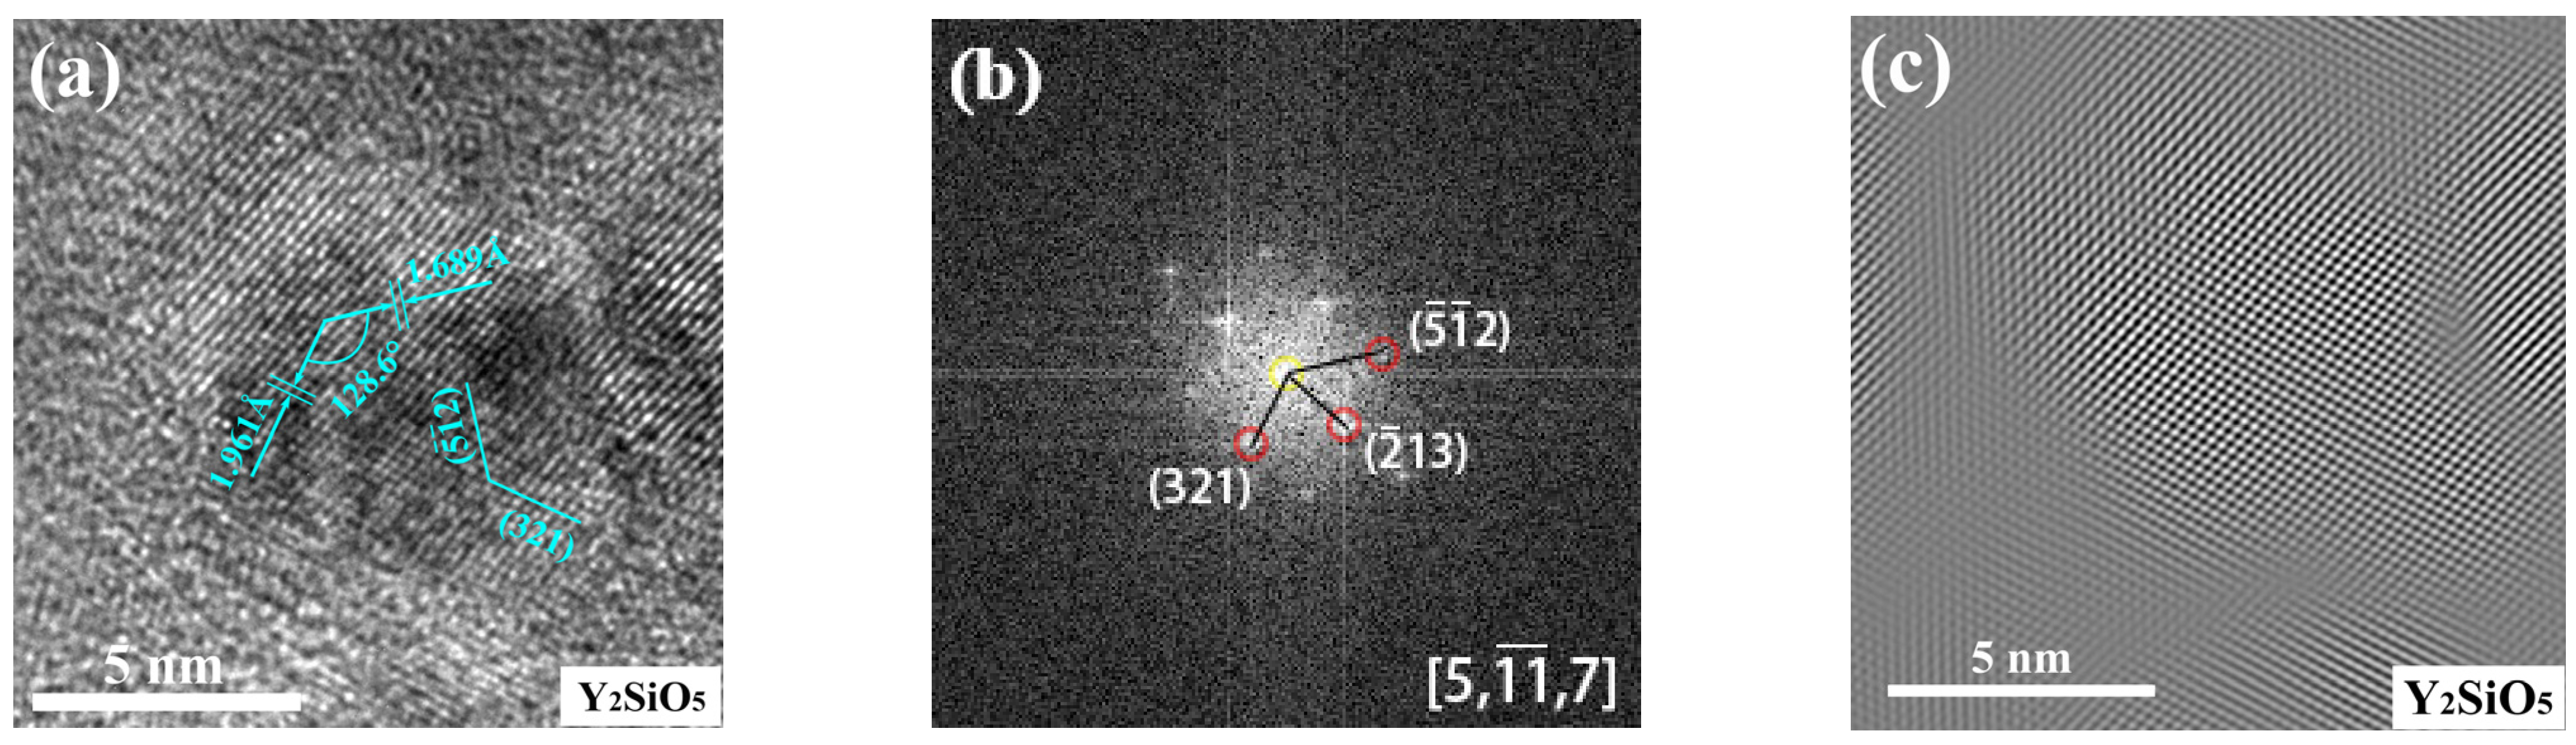
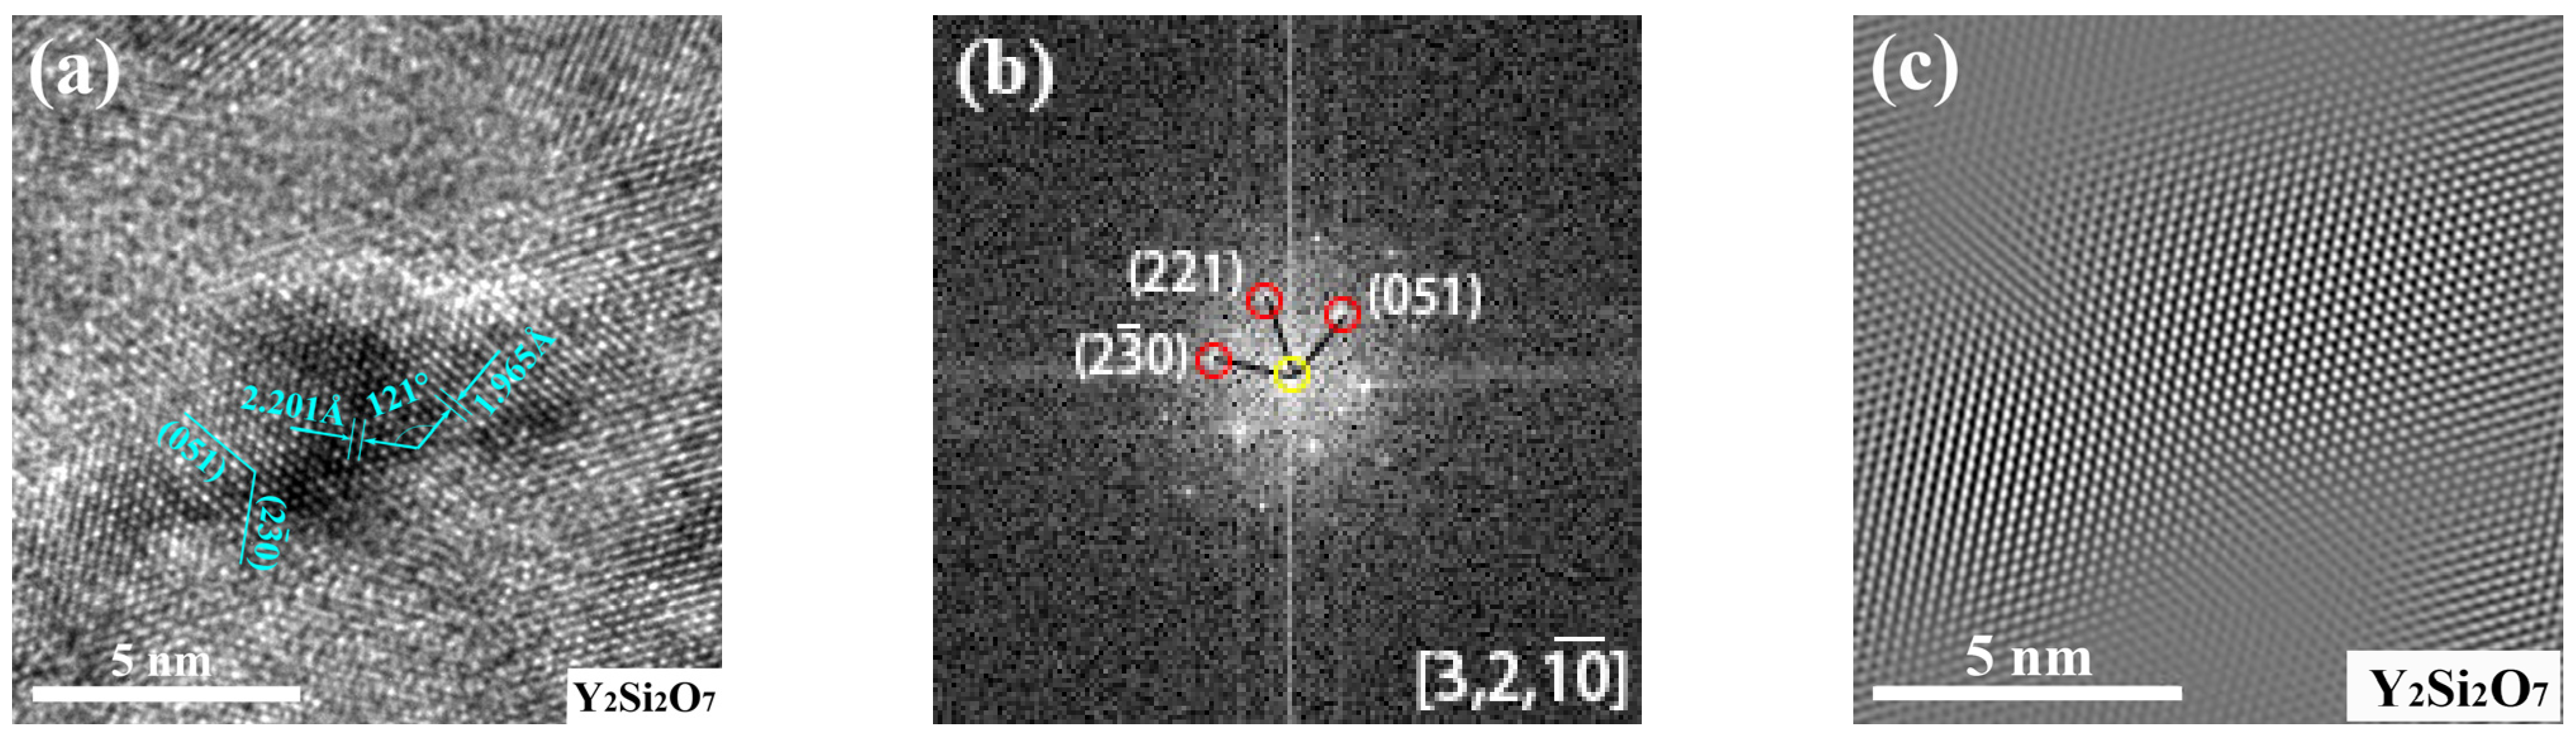
- The core (consisting of Si and O)-shell (enriched Fe and Cr) structure of microparticles was found in ODS steels. Additionally, three nanoparticles of Y2O3, Y2SiO5 and Y2Si2O7 with sizes of 5~12 nm were found in 1280-S3 ODS steels, the crystal structures of which were all monoclinic cubic crystals, indicating the inevitability of two reactions: Y2O3 + 2Si + 4O → Y2Si2O7 and Y2O3 + Si + 2O → Y2SiO5 through MA and vacuum sintering process;
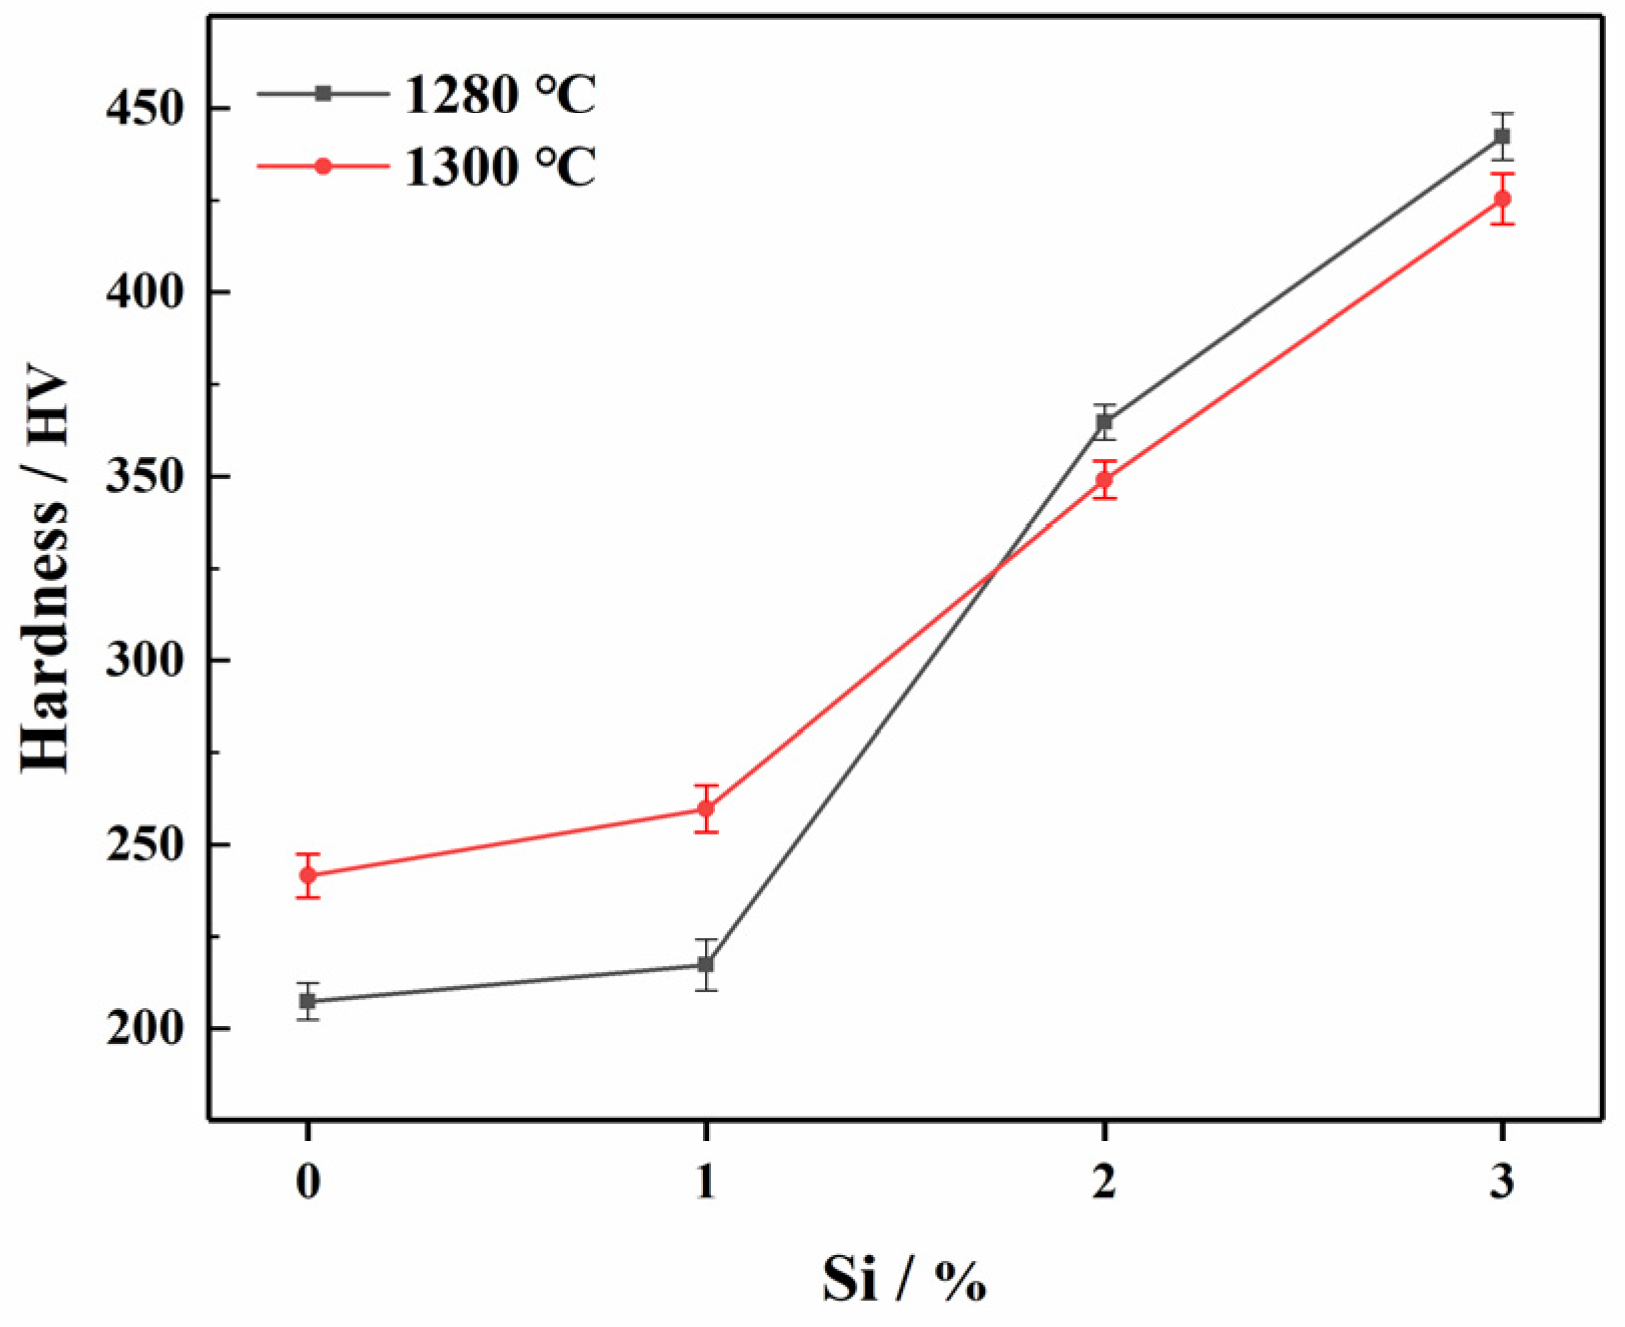
- ODS steels with better mechanical properties at a lower sintering temperature were fabricated when a content of 3%Si was added. In other words, Si were able to reduce the sintering temperature. The 1280-S3 ODS steels exhibited the best comprehensive mechanical properties. The tensile strength, hardness and relative density were 1025 MPa, 442.44 HV and 95.3%, respectively.
Author Contributions
Funding
Data Availability Statement
Acknowledgments
Conflicts of Interest
References
- Ukai, S.; Ohtsuka, S.; Kaito, T.; Sakasegawa, H.; Chikata, N.; Hayashi, S.; Ohnuki, S. High-temperature strength characterization of advanced 9Cr-ODS ferritic steels. Mater. Sci. Eng. A 2009, 510–511, 115–120. [Google Scholar] [CrossRef]
- Rogozhkin, S.; Bogachev, A.; Korchuganova, O.; Nikitin, A.; Orlov, N.; Aleev, A.; Zaluzhnyi, A.; Kozodaev, M.; Kulevoy, T.; Chalykh, B.; et al. Nanostructure evolution in ODS steels under ion irradiation. Nucl. Mater. Energy 2016, 9, 66–74. [Google Scholar] [CrossRef] [Green Version]
- Husák, R.; Hadraba, H.; Chlup, Z.; Heczko, M.; Kruml, T.; Puchý, V. ODS EUROFER Steel Strengthened by Y-(Ce, Hf, La, Sc, and Zr) Complex Oxides. Metals 2019, 9, 1148. [Google Scholar] [CrossRef] [Green Version]
- Dou, P.; Kimura, A.; Kasada, R.; Okuda, T.; Inoue, M.; Ukai, S.; Ohnuki, S.; Fujisawa, T.; Abe, F.; Jiang, S.; et al. TEM and HRTEM study of oxide particles in an Al-alloyed high-Cr oxide dispersion strengthened ferritic steel with Hf addition. J. Nucl. Mater. 2017, 485, 189–201. [Google Scholar] [CrossRef]
- Lin, X.; Li, M.; Zhong, Y.; Zhao, Y.; Sun, Y.; Zhao, S.; He, X. Microstructure and hardness of nanocrystalline ferritic ODS alloy foil with high oxide content fabricated by EBPVD. Appl. Surf. Sci. 2013, 284, 679–682. [Google Scholar] [CrossRef]
- Meza, A.; Macía, E.; García-Junceda, A.; Díaz, L.A.; Chekhonin, P.; Altstadt, E.; Serrano, M.; Rabanal, M.E.; Campos, M. Development of New 14 Cr ODS Steels by Using New Oxides Formers and B as an Inhibitor of the Grain Growth. Metals 2020, 10, 1344. [Google Scholar] [CrossRef]
- Gil, E.; Ordas, N.; García-Rosales, C.; Iturriza, I. Microstructural characterization of ODS ferritic steels at different processing stages. Fusion Eng. Des. 2015, 98-99, 1973–1977. [Google Scholar] [CrossRef]
- Kasada, R.; Lee, S.; Isselin, J.; Lee, J.; Omura, T.; Kimura, A.; Okuda, T.; Inoue, M.; Ukai, S.; Ohnuki, S.; et al. Anisotropy in tensile and ductile–brittle transition behavior of ODS ferritic steels. J. Nucl. Mater. 2011, 417, 180–184. [Google Scholar] [CrossRef]
- Noh, S.; Kimura, A. Transient liquid phase bonding of ODS ferritic steel with a physical vapor deposited boron thin layer. J. Nucl. Mater. 2019, 529, 151888. [Google Scholar] [CrossRef]
- García-Junceda, A.; Macia, E.; Garbiec, D.; Serrano, M.; Torralba, J.M.; Campos, M. Effect of Small Variations in Zr Content on the Microstructure and Properties of Ferritic ODS Steels Consolidated by SPS. Metals 2020, 10, 348. [Google Scholar] [CrossRef] [Green Version]
- Klimiankou, M.; Lindau, R.; Möslang, A. TEM characterization of structure and composition of nanosized ODS particles in reduced activation ferritic–martensitic steels. J. Nucl. Mater. 2004, 329-333, 347–351. [Google Scholar] [CrossRef]
- Alinger, M.; Odette, G.; Hoelzer, D. On the role of alloy composition and processing parameters in nanocluster formation and dispersion strengthening in nanostuctured ferritic alloys. Acta Mater. 2009, 57, 392–406. [Google Scholar] [CrossRef]
- Yao, Z.; Xiong, W.; Zhang, G.; Chen, X.; Huang, B. Effects of Si addition on properties of Fe–Cr–W–Ti–Y2O3 alloy fabricated by mechanical alloying. Mater. Des. 2014, 56, 953–958. [Google Scholar] [CrossRef]
- Youseffi, M.; Chong, K. Enhanced sintering and mechanical properties of 316L stainless steel with silicon additions as sintering aid. Powder Met. 2003, 46, 30–38. [Google Scholar] [CrossRef]
- Song, L.; Yang, X.; Zhao, Y.; Wang, W.; Mao, X. Si-containing 9Cr ODS steel designed for high temperature application in lead-cooled fast reactor. J. Nucl. Mater. 2019, 519, 22–29. [Google Scholar] [CrossRef]
- Ilaham, W.R.; Singh, L.K.; Laha, T. Effect of Si addition on the microstructure and mechanical property of nanostructured oxide dispersion strengthened ferritic steel synthesized via mechanical alloying and spark plasma sintering. Fusion Eng. Des. 2019, 138, 303–312. [Google Scholar] [CrossRef]
- Murali, D.; Panigrahi, B.; Valsakumar, M.; Chandra, S.; Sundar, C.; Raj, B. The role of minor alloying elements on the stability and dispersion of yttria nanoclusters in nanostructured ferritic alloys: An ab initio study. J. Nucl. Mater. 2010, 403, 113–116. [Google Scholar] [CrossRef]
- Murali, D.; Panigrahi, B.; Valsakumar, M.; Sundar, C. Diffusion of Y and Ti/Zr in bcc iron: A first principles study. J. Nucl. Mater. 2011, 419, 208–212. [Google Scholar] [CrossRef]
- Mohan, S.; Kaur, G.; Panigrahi, B.; David, C.; Amarendra, G. Effect of Zr and Al addition on nanocluster formation in oxide dispersion strengthened steel—An ab initio study. J. Alloys Compd. 2018, 767, 122–130. [Google Scholar] [CrossRef]
- Posselt, M.; Murali, D.; Panigrahi, B.K. Energetics, structure and composition of nanoclusters in oxide dispersion strengthened Fe–Cr alloys. Model. Simul. Mater. Sci. Eng. 2014, 22, 85003. [Google Scholar] [CrossRef] [Green Version]
- Qian, Q.; Wang, Y.; Jiang, Y.; He, C.; Hu, T. Nucleation of Y-X-O (X=Al, Ti, or Zr) NCs in nano-structured ferritic alloys: A first principles comparative study. J. Nucl. Mater. 2019, 518, 140–148. [Google Scholar] [CrossRef]
- Jiang, Y.; Smith, J.R.; Odette, G.R. Formation of Y-Ti-O nanoclusters in nanostructured ferritic alloys: A first-principles study. Phys. Rev. B 2009, 79, 064103. [Google Scholar] [CrossRef]
- Fu, C.L.; Krčmar, M.; Painter, G.S.; Chen, X.-Q. Vacancy Mechanism of High Oxygen Solubility and Nucleation of Stable Oxygen-Enriched Clusters in Fe. Phys. Rev. Lett. 2007, 99, 225502. [Google Scholar] [CrossRef] [PubMed]
- Williams, C.A.; Marquis, E.; Cerezo, A.; Smith, G.D. Nanoscale characterisation of ODS–Eurofer 97 steel: An atom-probe tomography study. J. Nucl. Mater. 2010, 400, 37–45. [Google Scholar] [CrossRef]
- Okuda, T.; Fujiwara, M. Dispersion behaviour of oxide particles in mechanically alloyed ODS steel. J. Mater. Sci. Lett. 1995, 14, 1600–1603. [Google Scholar] [CrossRef]


| Components (wt%) | Fe | Cr | W | Si | Y2O3 |
|---|---|---|---|---|---|
| S0 | Bal. | 12 | 3 | 0 | 0.3 |
| S1 | Bal. | 12 | 3 | 1 | 0.3 |
| S2 | Bal. | 12 | 3 | 2 | 0.3 |
| S3 | Bal. | 12 | 3 | 3 | 0.3 |
| Elements | Si | Y | O | Vacancy (v) |
|---|---|---|---|---|
| Substitutional | −1.23 | +1.93(+2.02 a, +1.82 c) | +2.46(+2.99 a, +3.10 b) | +2.09(+2.11 c) |
| Interstitial-Octa | +2.76 | +5.34(+8.99 a, +4.42 c) | +1.57(+1.41 a, +1.46 b) | - |
| Interstitial-Tetra | +1.58 | +8.18(+8.38 a, +7.55 c) | +3.51(+3.26 a, +3.28 b) | - |
| Defect Species | 1NN (Å) | 2NN (Å) |
|---|---|---|
| O-v | 1.43 | 2.03 |
| Y-v | 2.48 | 2.87 |
| Si-v | 2.48 | 2.87 |
| Y-O | 1.43 | 2.03 |
| Si-O | 1.43 | 2.03 |
| Si-Y | 2.48 | 2.87 |
| Defect Species | Binding Energy (eV) | |
|---|---|---|
| 1NN | 2NN | |
| O-v | −1.50 | −0.46 |
| Y-v | −1.39 | +0.12 |
| Si-v | +0.42 | +1.13 |
| Defect Species | Binding Energy/eV | |
|---|---|---|
| 1NN | 2NN | |
| Y-O | −0.72 | −1.55 |
| Si-O | −0.24 | −0.67 |
| Si-Y | −0.62 | −0.81 |
| Nanocluster Configuration | Binding Energy (eV) | Nanocluster Configuration | Binding Energy (eV) |
|---|---|---|---|
(a)  | −2.06 | (b)  | −1.86 |
(c) 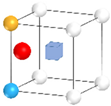 | −2.04 | (d)  | −2.26 |
(e)  | −2.19 | (f) 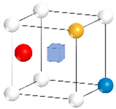 | −2.59 |
(g) 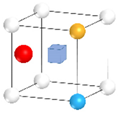 | −2.60 | (h) 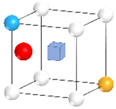 | −2.46 |
(i)  | −2.14 | (j) 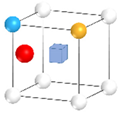 | −2.35 |
Publisher’s Note: MDPI stays neutral with regard to jurisdictional claims in published maps and institutional affiliations. |
© 2022 by the authors. Licensee MDPI, Basel, Switzerland. This article is an open access article distributed under the terms and conditions of the Creative Commons Attribution (CC BY) license (https://creativecommons.org/licenses/by/4.0/).
Share and Cite
Su, F.; Xu, G.; Yao, Z.; Liu, H.; Chen, Y. First-Principles Calculations of Y-Si-O Nanoclusters and Effect of Si on Microstructure and Mechanical Properties of 12Cr ODS Steel in Vacuum Sintering System. Metals 2022, 12, 155. https://doi.org/10.3390/met12010155
Su F, Xu G, Yao Z, Liu H, Chen Y. First-Principles Calculations of Y-Si-O Nanoclusters and Effect of Si on Microstructure and Mechanical Properties of 12Cr ODS Steel in Vacuum Sintering System. Metals. 2022; 12(1):155. https://doi.org/10.3390/met12010155
Chicago/Turabian StyleSu, Feng, Guangtao Xu, Zhenhua Yao, Huachen Liu, and Yikun Chen. 2022. "First-Principles Calculations of Y-Si-O Nanoclusters and Effect of Si on Microstructure and Mechanical Properties of 12Cr ODS Steel in Vacuum Sintering System" Metals 12, no. 1: 155. https://doi.org/10.3390/met12010155