
Excellent Wear Resistance of a High-Speed Train Brake Disc Steel with High Hardening Ratcheting Strain Zone


1
School of Materials Science and Engineering, Anhui University of Technology, Ma’anshan 243002, China
2
Ma’anshan Iron & Steel Co., Ltd., Ma’anshan 243002, China
*
Author to whom correspondence should be addressed.
Metals 2021, 11(9), 1478; https://doi.org/10.3390/met11091478
Submission received: 20 August 2021
/
Revised: 7 September 2021
/
Accepted: 14 September 2021
/
Published: 17 September 2021
Abstract
:Wear resistance of brake discs has a significant effect on the safety of high-speed trains. In this work, the rolling–sliding wear resistance of a low-carbon martensitic brake disc steel was investigated. The microstructure evolution and mechanical properties from the worn surface to the matrix were analyzed to promote parameters for the application of this steel. The results indicated that a ratcheting strain zone was formed at the surface of the brake disc steel under asymmetric cycling load and presented the morphology of the plastic flow line. An equation between the shear strain and the depth from the surface was established, which reflected the gradient distribution of the shear strain. The martensite lath refined into the nano/sub-micron grain and strip on the topmost surface. The micron scratch test results exhibited that the hardening rate and fracture toughness of the ratcheting strain zone varied continually along with depth, and the highest hardening rate occurred on the worn surface due to the increase of dislocation density and grain refinement. Additionally, the brake disc steel obtained better wear resistance than that of other wear-resistant materials used for railways due to steel having the highest hardening rate in the ratcheting strain zone.
1. Introduction
Increased service speed and passenger capacity stand for a fast-growing trend in high-speed rail systems, which creates more significant requirements of the performance of crucial friction pairs [1,2,3]. The braking system is a vital component for high-speed trains. Generally, rolling–sliding wear occurs between the disc and wheel during the braking process, which would increase the risk of disc damage [4,5]. Thus, a more wear-resistant material used for a brake disc will benefit the operation of high-speed trains [6].
Accumulated plastic deformation was formed on the surface of metallic materials during rolling–sliding wear [7,8], which was called ratcheting strain under asymmetrical cyclic loading [9]. In recent years, studies have shown that ratcheting strain induces structural modifications such as forming a nano-structure, resulting in good mechanical properties [10]. The formation and distribution of the ratcheting strain zone were affected by surface defects [11,12] and inclusions [13] such as cracks. However, under some conditions, cracks did not propagate or cause peeling [14]. Wear removed the most strained layers from the surface, making deeper and less strained layers emerge and reduced micro-cracks. The ratcheting strain field under the contact surface was stabilized, as well as the cracks length in the surface. A steady relationship between wear and ratcheting was built [14,15]. Apart from microstructure characterization, mechanical property such as hardness was another key point in the research of ratcheting strain [16,17]. Variations in dislocation density and type in the microstructure were the causes of increased ratcheting strain, leading to higher hardness of the metals [18]. However, most of the investigations were centered on wheel/rail steel, bearing steel, and gear steel [19,20,21,22]. There is no detailed study available in the literature about the ratcheting strain in brake disc for high-speed trains under rolling–sliding wear. In addition, the microhardness of the ratcheting strain zone was analyzed by indentation test in the majority of studies [23,24]. In order to ensure the accuracy of the hardness results, a certain interval between the indentation is required. Thus far, there are few studies that explore the mechanical property of the ratcheting strain zone by micron scratch test, which could be used to characterize the continuous variation of hardening and fracture toughness [25,26].
In this study, the rolling–sliding wear resistance of a low-carbon, martensitic brake disc steel was investigated using a twin-disc wear machine. The microstructure of the ratcheting strain zone was analyzed by means of scanning electron microscopy and X-ray diffraction. The micron scratch test was then carried out to analyze the hardness and fracture toughness of the ratcheting strain zone. Moreover, the relationship between wear resistance and hardening rate was discussed.
2. Materials and Methods
2.1. Test Steel
The brake disc steel was developed independently, and its production process included solid solution treatment, controlled rolling, quenching, and low-temperature tempering, as shown in Figure 1. The chemical composition of the test steel is listed in Table 1. The content of C in the steel was less than 0.25%. In addition, a certain amount of Cr, Ni, Mo, and V could improve the hardening ability. The mechanical properties of the test steel are shown in Table 2.
2.2. Microstructural Characterization
The microstructure of the specimens was characterized by a field-emission scanning electron microscope (FESEM, Tescan MIRA3 XMU, Brno, Czech Republic). Specimens for FESEM were prepared by mechanical polishing and then eroded with 4% nitric acid alcohol. The X-ray diffractometer was used with the Bragg–Brentano geometry under a continuous scanning mode over 2θ = 30~120° (XRD, Japanese physics Ultima IV, Tokyo, Japan). A scanning rate of 5°/min, an accelerating voltage of 40 kV, and a tube current of 40 mA were used with CuKα radiation to analyze the phase structure of the matrix and the area after ratcheting.
2.3. Dry Rolling–Sliding Wear Test
The sample of the rolling–sliding wear test was processed into the required twin disc, which was tested under temperature and dry conditions. The schematic diagram of the tester is shown in Figure 2. The maximum contact stress between the two samples in point contact mode was calculated using Hertz contact theory and simulation criteria. The method is shown in Equation (1):
where ρ is the curvature at the contact point between the twin disc determined by the sample radius size (unit: mm−1). σmax is the maximum contact stress (unit: MPa). α and β are point contact deformation coefficients determined by the auxiliary parameter cosτ, obtained from YB/T 5345-2014 standard [27]. F is the vertical load applied to the sample (unit: N). Test parameters and contact stress calculation results are listed in Table 3.
2.4. Micron Scratch Test
The hardening rate and fracture toughness of the wear sample were measured using a micron scratch tester applying Rockwell C diamond indenter with a cone angle of 120° (scratch tester, Rtec-HS100, San Jose, CA, USA). The indenter with a curvature radius of 200 μm was scratched from the matrix to the surface, applying a constant positive pressure of 5 N at a speed of 0.05 mm/s. The scratch test data were used for subsequent analysis, and the scratch morphology was recorded by three-dimensional topography scanning.
3. Results and Discussion
3.1. Wear Resistance
A specific wear rate is the volume loss per unit load and distance traveled by a point on the perimeter throughout the wear test. The average values of wear loss, obtained by calculating three times to reduce experimental errors, are listed in Table 4.
where V is volume loss, Sd is wearing distance, and FN is load.
Figure 3 represents the worn surface of the test steel. The surface shows debris, peeling pits, and flakes produced by the growth of fatigue cracks. The cracks propagated along the worn surface or inside the matrix. Fatigue damage formed at the contact surface due to asymmetric cyclic loading of surface material is also observed.
3.2. Microstructure Analysis
3.2.1. Matrix Microstructure
3.2.2. Definition of Ratcheting Strain Zone
Plastic deformation occurs only when the maximum load exceeds the elastic shakedown limit (Figure 5a) [9], but the metals enter the steady-state strain after plastic deformation under the plastic shakedown limit. When the load exceeds the limit of plastic shakedown, the unidirectional accumulation of deformation is caused [9], and the ratcheting strain is formed (Figure 5b). In this work, the maximum contact stress of 2414 MPa is much larger than the yield strength of the test steel, which will cause ratcheting strain on the contact surface. The microstructure under the contact surface presented the morphology of the plastic flow line (Figure 5c), which was called the ratcheting strain zone (RS zone), as shown in Figure 5d.
3.2.3. Shear Strain Distribution
The stress of the material under the contact surface can be divided into normal stress and shear stress [9], which will lead to a rheological structure. The shear strain can be calculated by the displacement field of the plastic flow line, which will reflect the degrees of bending of martensite lath, as shown in Figure 6. The calculation equation of equivalent shear strain is as follows [28,29]:
where γ is the shear angle at different depths on the plastic flow line, ε is the equivalent shear strain, and tan(θ) is the slope of the tangent line of the rheological curve.
Figure 7a illustrates the displacement field y(x) of the plastic flow line of lath martensite. The X-axis was the depth direction from the surface, and the Y-axis was parallel to the rolling direction. The y(x) and x(depth) of the plastic flow line displacement field satisfy the following relationship:
Combined with the equation of the rheological curve, the distribution curve equation of the shear strain γ with depth from the surface (DS) could be written as:
The distribution of the equivalent shear strain along depth can be given in Figure 7b. It was estimated that the shear strain decrease ranged from 30 to 190 μm with the increase of DS, and finally stabilized in the matrix.
3.2.4. Martensite Lath Characteristics
The martensite lath morphology of the RS zone at different depths from the contact surface is presented in Figure 8. The characteristics of martensite lath near the surface could be divided into three zones: severely plastic deformation zone (I), slightly plastic deformation zone (II), and matrix material (III). The morphology of the martensite in the topmost surface was unidentifiable (I zone), mainly due to the extreme refinement of martensite. However, the direction of the plastic flow line was almost completely parallel to the surface. There was almost no transition region between the II zone and the I zone, which changed directly. The martensite lath in the II zone was bent parallel to the surface under shear strain, which was in obvious contrast to the martensite morphology in the matrix.
The topmost surface microstructure of the RS zone showed that the martensite lath was crushed into different shapes, which created nano/sub-micron grains and strips (Figure 8b). The martensite lath underwent ratcheting, resulting in a variation of dislocation structure, formation of dislocation cell, and increase of the disorientation of dislocation cell [30]. The transformation from low-angle grain boundary to high-angle grain boundary was then promoted, which finally led to grain fragmentation [18]. The grain boundaries caused by deformation were called geometrically necessary boundaries (GNB), which were composed of dislocation cell blocks (CBs) and dense dislocation walls (DDWs) [31]. The dislocation cells were further refined and eventually formed fine-grained structures on the worn surface [32].
3.2.5. Dislocation Density Analysis
The XRD patterns of the RS zone and matrix microstructure are observed in Figure 9. The position of the XRD diffraction peak remained basically unchanged, which indicated that there were no variations in the phase composition of the RS zone and matrix. The diffraction peaks in the RS zone were significantly broadened compared to the matrix, such as peaks (110)α (Figure 9b) and (200)α (Figure 9c), which suggested that micro-strain and grain refinement occurred in the RS zone of test steel. Compared to the matrix, the diffraction peak of the RS zone shifted to the right, which indicated that the lattice constants of the RS zone decreased under compressive stress, referring to Bragg’s law [33].
The Williamson–Hall method was used to estimate the dislocation density of the RS zone and matrix. In this method, the dislocation density could be conducted by the half-height width of the diffraction peak [34,35]. However, the traditional W-H method did not consider the anisotropy of the material elasticity, and the modified W-H method could be written as [36]:
where ΔK is the diffraction peak width at half the maximum height; k is the shape parameter; D is the size parameter; M is the dislocation distribution parameter; b is the Burgers vector; ρ is the dislocation density; K is the diffraction vector mode, calculated from K = 2sinθ/λ; θ is the Bragg Angle of the corresponding peak; q is the characteristic parameter of dislocation; and λ is the wavelength of X-ray.
is the dislocation contrast factor. Here, α is given as (k/D)2. Equation (6) can be rewritten as:
The dislocation density of the material and RS zone was determined by the slope of the linear relation between ((ΔK)2 − α)/K2 and H2. The values of FWHM and parameter were substituted into Equation (7) to obtain the modified W-H method linear fitting plots, as shown in Table 5 and Table 6. The specific method referred to the reference [37].
The linear relation between ((ΔK)2 − α)/K2 and H2 is observed in Figure 10. The value of slope and dislocation density is listed in Table 7. The value of dislocation density in the matrix and RS zone were determined as 1.42 × 10¹⁵ m−2 and 1.21 × 10¹⁶ m−2, respectively. It indicated that a large number of dislocation proliferation occurred in the RS zone rather than the matrix. Existing studies have shown that the order of magnitude of dislocation density of low carbon martensite steel was 1015 m−2 [38]. The dislocation structure transformed from low-density dislocation lines and dislocation networks to high-density dislocation tangles, dislocation walls, and dislocation cells under asymmetric cyclic loading. Compared with uniaxial ratcheting, the rate of dislocation proliferation of the ratcheting was accelerated due to the multiple slide and cross slide of dislocation under multiaxial stress [39].
3.3. Distribution of Hardness and Fracture Toughness in Ratcheting Strain Zone
Figure 11a shows the scratch morphology, in which different colors present different depths. The width of the scratch decreased from the surface to the depth of about 180 μm. For further observation, scratch cross-sections at positions A and B show that the scratch width (DH) was narrower and the scratch depth (HD) was shallower in the RS zone than in the matrix, as seen in Figure 11b.
Figure 12 shows the distribution curves of DH and HD with the distance from surface depth (DS). It presented a monotonically increasing trend and then became stable from the DH curve in Figure 11a, and the variation of the DS was similar to that of the HD. It indicated that the depth of the RS zone was about 180 μm.
In order to further explore the mechanical properties of the RS zone, the hardening rate of scratch could be obtained by applying the load FN and DH [40]. The hardness at the matrix of position B is defined as 1, called H0. The hardness at different positions is defined as H, and H/H0 reflects the hardening rate. The specific calculation methods of scratch hardness and fracture toughness can be seen in Equations (8) and (9) from the from reference [26,41].
where H is the scratch hardness, FN is the load, DH is the scratch width, KC is the fracture toughness, FT is the tangential force, and 2PA is the shape function of the indenter.
Figure 13a presents the relationship between the hardening rate and DS. The highest hardness appeared at the topmost surface of the RS zone, which was about 1.7 times that of what appeared in the matrix. The hardening rate decreased monotonically with the increase of DS. The hardness of the topmost surface of martensitic steel was obviously higher than that of the matrix, mainly due to the ratcheting strain of the contact surface that occurred under the combined action of shear stress and positive pressure, which led to grain refinement and work hardening. Moreover, the hardness of the surface and matrix materials were measured, respectively, by a microhardness tester. The result shows that the microhardness of the topmost surface (541.2 HV0.2) was about 1.68 times of the matrix (322.1 HV0.2), which was consistent with the result of the micron scratch test. Figure 13b exhibits a curve of the fracture toughness (KC) with the DS, which presented the opposite trend of the hardening rate. The KC of the topmost layer was lowest, reaching 25 MPa·m1/2, which was less than triple that of the undeformed matrix.
In brief, the variation of the hardness and fracture toughness occurred in the DS range of 0~180 μm. It was indicated that the depth of the RS zone was about 180 μm, which was consistent with the results of the FESEM observation. In recent studies, it has been shown that significant hardening and fracture toughness deterioration appeared at the surface of pearlite rail steel under rolling–sliding wear conditions [37].
3.4. Discussion of Wear Resistance under Rolling–Sliding
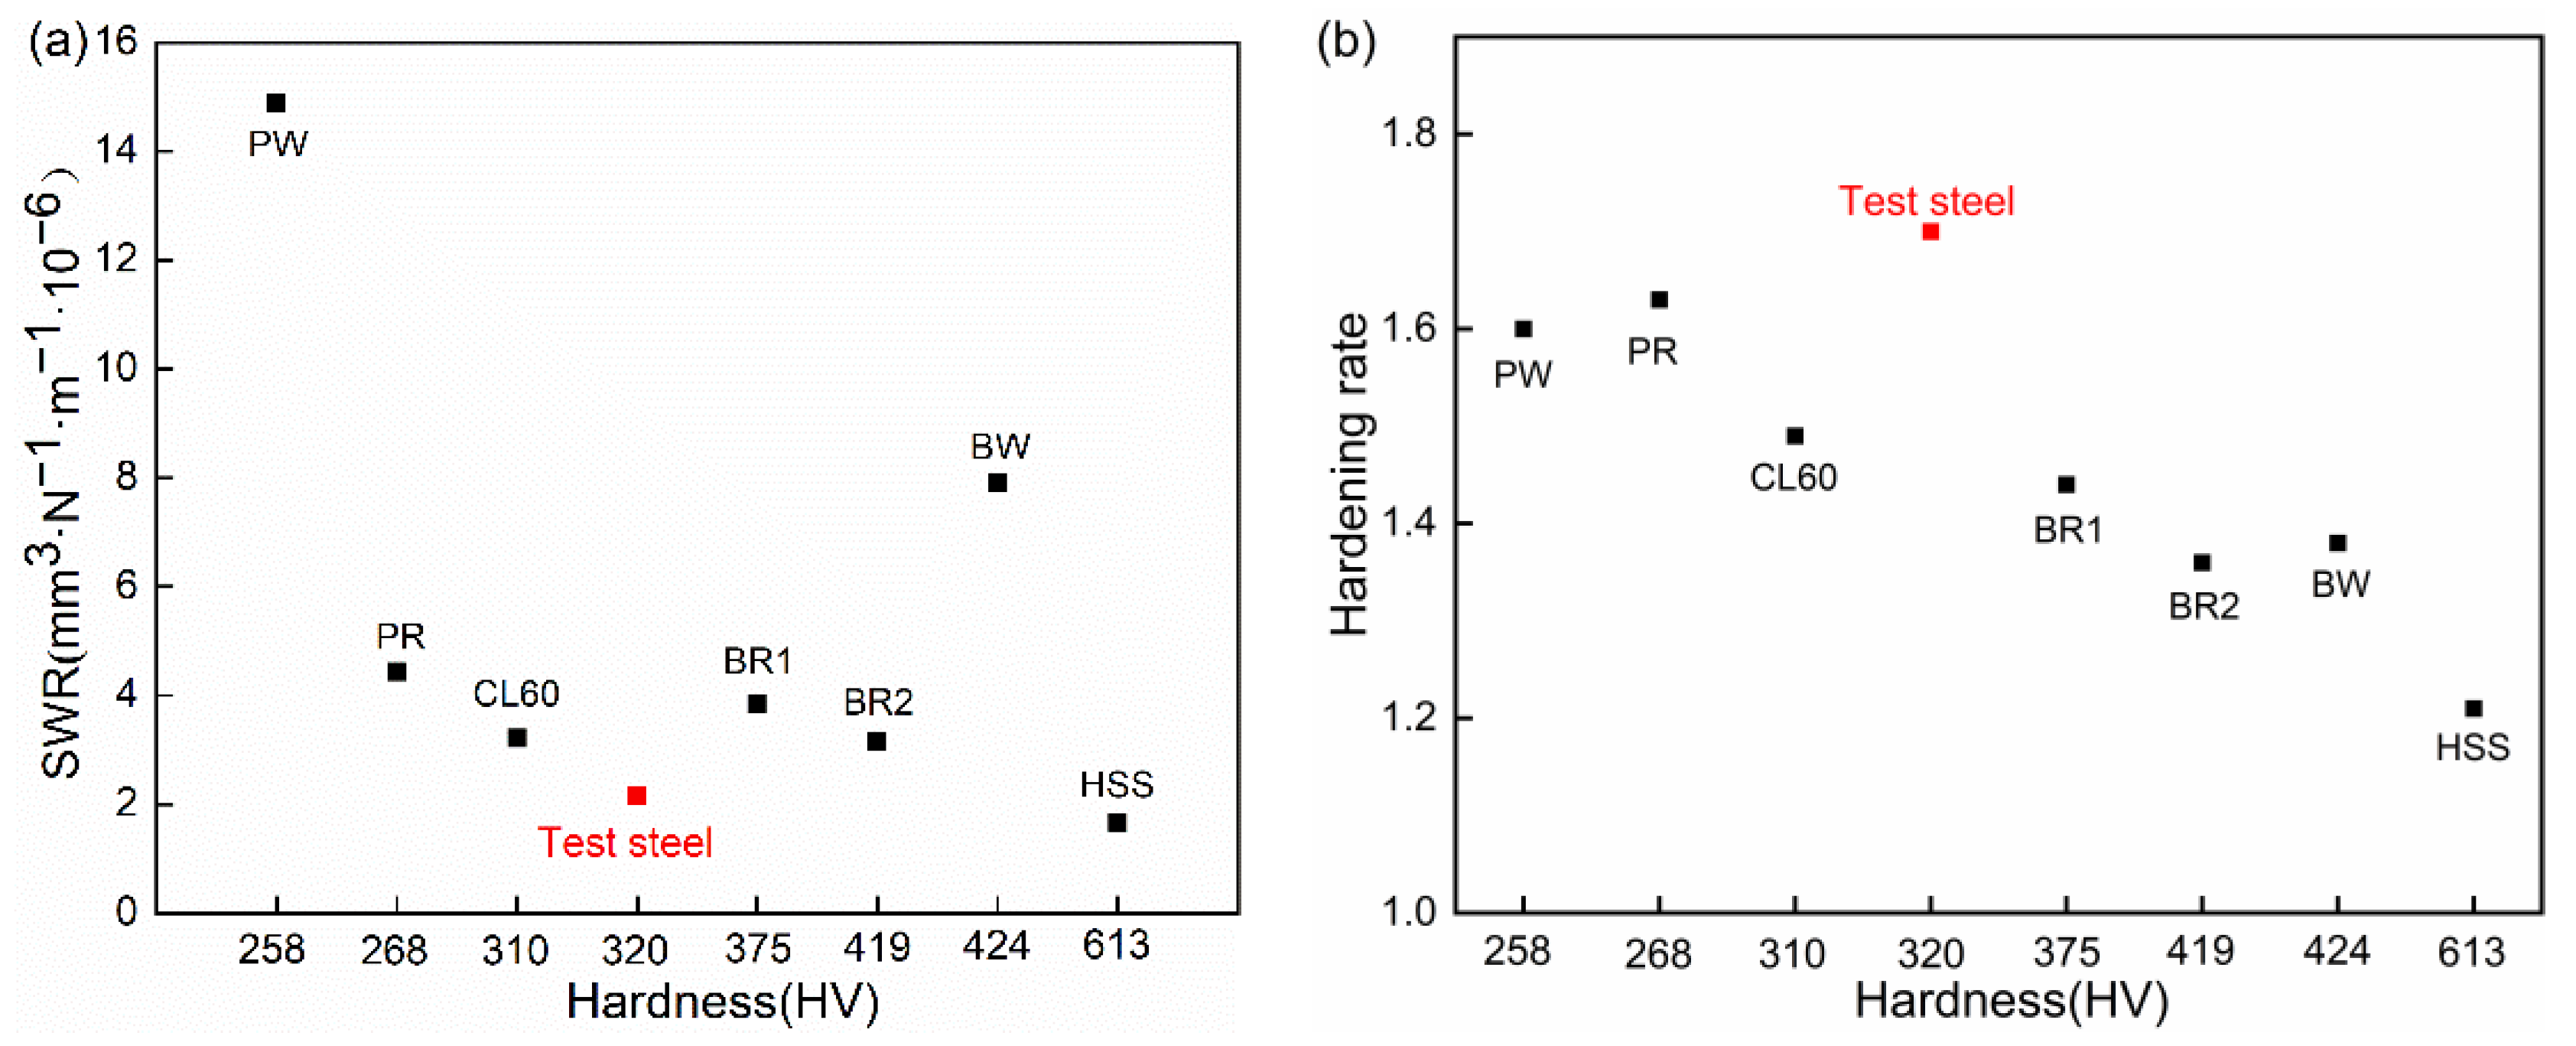
The specific wear rate (SWR) recorded in the current work was compared with published data in Table 8 [42,43,44,45], and the relationship between hardness and wear resistance in Figure 14. The specific wear rate of the test steel was one of the lowest, although it did not have the maximum hardness. The high-speed steel (HSS) had a lower wear rate with the highest hardness. The hardening rate of railway materials decreased with the rise of hardness except for the test steel. The hardening rate of the test steel was significantly higher than that of other railway steel.
Generally, hardness is the most important contribution to wear resistance [1,46]. During cyclic loading, the contact surfaces of materials underwent work hardening affected by ratcheting strain, prompting a significantly higher hardness [47]. The wear resistance of steel was related to the hardening rate [44]. Therefore, the test steel underwent a better wear resistance under rolling–sliding due to the higher hardening rate. The information of specific wear rates could provide a guide in choosing brake disc steel for high-speed trains and in the development of wear-resistant materials used for railway.
4. Conclusions
In this work, the wear resistance and the ratcheting strain zone of a low-carbon martensitic steel used for brake disc have been studied under rolling–sliding wear. The following main conclusions can be drawn:
- (1)
- A ratcheting strain zone with gradient structure and high-density dislocation was formed at the surface of the experimental steel during the rolling–sliding wear process. The equivalent shear strain decreased with the increase of depth until stabilized in the matrix. The microstructure at the topmost surface underwent refinement, and the martensite lath was crushed into nano/sub-micron grain and strip.
- (2)
- The continuous change of the hardness and toughness of the RS zone could be well evaluated by a micron scratch test. The topmost surface layer possessed the highest hardening rate of ~1.7 but lost 67% of fracture toughness compared to the matrix.
- (3)
- Compared to other wear-resistant iron and steel materials used for railway, the test steel exhibited one of the lowest specific wear rates under similar wear test due to the higher hardening rate caused by the high-density dislocation and grain refinement in the ratcheting stain zone.
Author Contributions
Methodology and supervision, Y.H.; project administration, X.H. and Z.X.; writing—original draft, L.Y. and Z.X.; investigation, X.H. and H.Z.; data curation, T.Z. All authors have read and agreed to the published version of the manuscript.
Funding
This research was funded by Major Consulting program of Chinese Academy of Engineering (No. ZGZ201812-03) and Key Project of Science and Technology in Anhui Province (No. 18030901075).
Institutional Review Board Statement
Not applicable.
Informed Consent Statement
Not applicable.
Data Availability Statement
All data that support the findings of this study are included within the article.
Conflicts of Interest
The authors declare no conflict of interest.
References
- Zhai, W.; Bai, L.; Zhou, R.; Fan, X.; Kang, G.; Liu, Y.; Zhou, K. Recent Progress on Wear-Resistant Materials: Designs, Properties, and Applications. Adv. Sci. 2021, 8, 2003739. [Google Scholar] [CrossRef] [PubMed]
- Givoni, M. Development and Impact of the Modern High-speed Train: A Review. Transp. Rev. 2006, 26, 593–611. [Google Scholar] [CrossRef]
- Aulia Putra, M.R.; Pratama, P.S.; Prabowo, A.R. Failure of Friction Brake Components against Rapid Braking Process: A Review on Potential Challenges and Developments. Transp. Res. Procedia 2021, 55, 653–660. [Google Scholar] [CrossRef]
- Mazzù, A.; Provezza, L.; Zani, N.; Petrogalli, C.; Ghidini, A.; Faccoli, M. Effect of shoe braking on wear and fatigue damage of various railway wheel steels for high speed applications. Wear 2019, 434–435, 203005. [Google Scholar] [CrossRef]
- Faccoli, M.; Provezza, L.; Petrogalli, C.; Ghidini, A.; Mazzù, A. Effects of full-stops on shoe-braked railway wheel wear damage. Wear 2019, 428–429, 64–75. [Google Scholar] [CrossRef]
- Xiao, X.; Yin, Y.; Bao, J.; Lu, L.; Feng, X. Review on the friction and wear of brake materials. Adv. Mech. Eng. 2016, 8, 1687814016647300. [Google Scholar] [CrossRef] [Green Version]
- Kumar, A.; Saxena, A.K.; Kirchlechner, C.; Herbig, M.; Brinckmann, S.; Petrov, R.H.; Sietsma, J. In situ study on fracture behaviour of white etching layers formed on rails. Acta Mater. 2019, 180, 60–72. [Google Scholar] [CrossRef]
- Jalalahmadi, B.; Slack, T.; Raje, N.; Arakere, N.; Feng, J.; Wan, Z.; Wang, W.; Ding, X.; Tang, Y. A Review of Rolling Contact Fatigue. J. Tribol. 2009, 131, 308. [Google Scholar] [CrossRef]
- El Laithy, M.; Wang, L.; Harvey, T.J.; Vierneusel, B.; Correns, M.; Blass, T. Further understanding of rolling contact fatigue in rolling element bearings—A review. Tribol. Int. 2019, 140, 105849. [Google Scholar] [CrossRef]
- He, C.G.; Ding, H.H.; Shi, L.B.; Guo, J.; Meli, E.; Liu, Q.Y.; Rindi, A.; Zhou, Z.R.; Wang, W.J. On the microstructure evolution and nanocrystalline formation of pearlitic wheel material in a rolling-sliding contact. Mater. Charact. 2020, 164, 110333. [Google Scholar] [CrossRef]
- Ezzati, M.; Naghipour, M.; Zeinoddini, M.; Zandi, A.P.; Elyasi, M. Strain ratcheting failure of dented steel submarine pipes under combined internal pressure and asymmetric inelastic cycling. Ocean Eng. 2021, 219, 108336. [Google Scholar] [CrossRef]
- Zhao, X.J.; Guo, L.C.; Guo, J.; Liu, Q.Y.; Butini, E.; Marini, L.; Meli, E.; Rindi, A.; Wang, W.J. Effect of spherical and ballast dents on rolling contact fatigue of rail materials. Wear 2020, 450–451, 203254. [Google Scholar] [CrossRef]
- Wang, W.; Liu, H.; Zhu, C.; Wei, P.; Wu, W. Micromechanical analysis of gear fatigue-ratcheting damage considering the phase state and inclusion. Tribol. Int. 2019, 136, 182–195. [Google Scholar] [CrossRef]
- Donzella, G.; Faccoli, M.; Mazzù, A.; Petrogalli, C.; Roberti, R. Progressive damage assessment in the near-surface layer of railway wheel-rail couple under cyclic contact. Wear 2011, 271, 408–416. [Google Scholar] [CrossRef]
- Mazzù, A.; Donzella, G. A model for predicting plastic strain and surface cracks at steady-state wear and ratcheting regime. Wear 2018, 400–401, 127–136. [Google Scholar] [CrossRef]
- Athukorala, A.C.; De Pellegrin, D.V.; Kourousis, K.I. A unified material model to predict ratcheting response in head-hardened rail steel due to non-uniform hardness distributions. Tribol. Int. 2017, 111, 26–38. [Google Scholar] [CrossRef] [Green Version]
- Ohno, N.; Nakamoto, H.; Morimatsu, Y.; Okumura, D. Modeling of cyclic hardening and evaluation of plastic strain range in the presence of pre-loading and ratcheting. Int. J. Plast. 2021, 145, 103074. [Google Scholar] [CrossRef]
- Dutta, K.; Kishor, R.; Sahu, L.; Mondal, A.K. On the role of dislocation characters influencing ratcheting deformation of austenitic stainless steel. Mater. Sci. Eng. A 2016, 660, 47–51. [Google Scholar] [CrossRef]
- Kumar, A.; Agarwal, G.; Petrov, R.; Goto, S.; Sietsma, J.; Herbig, M. Microstructural evolution of white and brown etching layers in pearlitic rail steels. Acta Mater. 2019, 171, 48–64. [Google Scholar] [CrossRef]
- Hajizad, O.; Kumar, A.; Li, Z.; Petrov, R.H.; Sietsma, J.; Dollevoet, R. Influence of Microstructure on Mechanical Properties of Bainitic Steels in Railway Applications. Metals 2019, 9, 778. [Google Scholar] [CrossRef] [Green Version]
- Moslemi, N.; Mozafari, F.; Abdi, B.; Gohari, S.; Redzuan, N.; Burvill, C.; Ayob, A. Uniaxial and biaxial ratcheting behavior of pressurized AISI 316L pipe under cyclic loading: Experiment and simulation. Int. J. Mech. Sci. 2020, 179, 105693. [Google Scholar] [CrossRef]
- Kong, W.; Zhang, D.; Tao, Q.; Chen, K.; Wang, J.; Wang, S. Wear properties of the deep gradient wear-resistant layer applied to 20CrMnTi gear steel. Wear 2019, 424–425, 216–222. [Google Scholar] [CrossRef]
- Zhou, Y.; Peng, J.F.; Luo, Z.P.; Cao, B.B.; Jin, X.S.; Zhu, M.H. Phase and microstructural evolution in white etching layer of a pearlitic steel during rolling–sliding friction. Wear 2016, 362–363, 8–17. [Google Scholar] [CrossRef]
- Zhao, H.; Liu, P.; Ding, Y.; Jiang, B.; Liu, X.; Zhang, M.; Chen, G. An Investigation on Wear Behavior of ER8 and SSW-Q3R Wheel Steel under Pure Rolling Condition. Metals 2020, 10, 513. [Google Scholar] [CrossRef] [Green Version]
- Tsybenko, H.; Farzam, F.; Dehm, G.; Brinckmann, S. Scratch hardness at a small scale: Experimental methods and correlation to nanoindentation hardness. Tribol. Int. 2021, 163, 107168. [Google Scholar] [CrossRef]
- Liu, M.; Li, S.; Gao, C. Fracture Toughness Measurement by Micro-Scratch Tests with Conical Indenter. Mocaxue Xuebao/Tribol. 2019, 39, 556–564. [Google Scholar] [CrossRef]
- YB/T. YB/T5345-2014 Rolling Contact Fatigue Test Method for Metal Materials. Metall. Ind. Press Beijing 2014, 1–23. Available online: http://www.cssn.net.cn/cssn/front/85213526.html (accessed on 20 June 2021).
- Dautzenberg, J.H.; Zaat, J.H. Quantitative determination of deformation by sliding wear. Wear 1973, 23, 9–19. [Google Scholar] [CrossRef] [Green Version]
- Alpas, A.T.; Hu, H.; Zhang, J. Plastic deformation and damage accumulation below the worn surfaces. Wear 1993, 162–164, 188–195. [Google Scholar] [CrossRef]
- Yin, C.-h.; Liang, Y.-l.; Jiang, Y.; Yang, M.; Long, S.-l. Formation of nano-laminated structures in a dry sliding wear-induced layer under different wear mechanisms of 20CrNi2Mo steel. Appl. Surf. Sci. 2017, 423, 305–313. [Google Scholar] [CrossRef]
- Hansen, N.; Mehl, R.; Su, H.; Pun, C.L.; Mutton, P.; Kan, Q.; Kang, G.; Yan, W. New discoveries in deformed metals. Metall. Mater. Trans. A 2001, 32, 2917–2935. [Google Scholar] [CrossRef]
- Yin, C.-H.; Liang, Y.-l.; Liang, Y.; Li, W.; Yang, M. Formation of a self-lubricating layer by oxidation and solid-state amorphization of nano-lamellar microstructures during dry sliding wear tests. Acta Mater. 2019, 166, 208–220. [Google Scholar] [CrossRef]
- Mukhopadhyay, D. Identifying the causes of residual stress in polycrystalline diamond compact (PDC) cutters by X-Ray diffraction technique. Results Mater. 2021, 11, 100216. [Google Scholar] [CrossRef]
- Williamson, G.K.; Hall, W.H. X-ray line broadening from filed aluminium and wolfram. Acta Metall. 1953, 1, 22–31. [Google Scholar] [CrossRef]
- Wilkens, M.; Paul, S.K.; Stanford, N.; Taylor, A.; Hilditch, T. The Determination of Density and Distribution of Dislocations in Deformed Single Crystals from Broadened X-ray Diffraction Profiles. Phys. Status Solidi (A) 1970, 2, 359–370. [Google Scholar] [CrossRef]
- Das Bakshi, S.; Sinha, D.; Ghosh Chowdhury, S. Anisotropic broadening of XRD peaks of α′-Fe: Williamson-Hall and Warren-Averbach analysis using full width at half maximum (FWHM) and integral breadth (IB). Mater. Charact. 2018, 142, 144–153. [Google Scholar] [CrossRef]
- Das Bakshi, S. Wear of Fine Pearlite, Nanostructured Bainite and Martensite; University of Cambridge: Cambridge, UK, 2017. [Google Scholar]
- Das Bakshi, S.; Sinha, D.; Ghosh Chowdhury, S.; Mahashabde, V.V. Surface and sub-surface damage of 0.20 wt% C-martensite during three-body abrasion. Wear 2018, 394–395, 217–227. [Google Scholar] [CrossRef]
- Dong, Y.; Kang, G.; Liu, Y.; Wang, H.; Cheng, X. Dislocation evolution in 316L stainless steel during multiaxial ratchetting deformation. Mater. Charact. 2012, 65, 62–72. [Google Scholar] [CrossRef]
- Zhao, H.; Zhong, Y.; Ma, Z. Effects of indentation depth on micro hardness and scratch behavior of thin composite laminate. J. Alloy. Compd. 2016, 680, 105–108. [Google Scholar] [CrossRef]
- ASTM. ASTM G171 Standard Test Method for Scratch Hardness of Materials Using a Diamond Stylus. ASTM Stand 2009, 3, 1–7. Available online: https://www.astm.org/Standards/G171.html (accessed on 20 June 2021).
- Zhou, T.; Zhao, H.; Zhou, H.; He, Y.; Zhang, M.; Su, S. Influences of microstructure on rolling-slip contact fatigue wear properties of high-speed wheel steel. J. Mater. Heat Treat. 2020, 41, 110–117. [Google Scholar] [CrossRef]
- Hasan, S.M.; Chakrabarti, D.; Singh, S.B. Dry rolling/sliding wear behaviour of pearlitic rail and newly developed carbide-free bainitic rail steels. Wear 2018, 408–409, 151–159. [Google Scholar] [CrossRef]
- Liu, J.P.; Li, Y.Q.; Zhou, Q.Y.; Zhang, Y.H.; Hu, Y.; Shi, L.B.; Wang, W.J.; Liu, F.S.; Zhou, S.B.; Tian, C.H. New insight into the dry rolling-sliding wear mechanism of carbide-free bainitic and pearlitic steel. Wear 2019, 432–433, 202943. [Google Scholar] [CrossRef]
- Xu, L.; Fan, X.; Wei, S.; Liu, D.; Zhou, H.; Zhang, G.; Zhou, Y. Microstructure and wear properties of high-speed steel with high molybdenum content under rolling-sliding wear. Tribol. Int. 2017, 116, 39–46. [Google Scholar] [CrossRef]
- Rigney, D.A. The roles of hardness in the sliding behavior of materials. Wear 1994, 175, 63–69. [Google Scholar] [CrossRef]
- Hu, Y.; Guo, L.C.; Maiorino, M.; Liu, J.P.; Ding, H.H.; Lewis, R.; Meli, E.; Rindi, A.; Liu, Q.Y.; Wang, W.J. Comparison of wear and rolling contact fatigue behaviours of bainitic and pearlitic rails under various rolling-sliding conditions. Wear 2020, 460–461, 203455. [Google Scholar] [CrossRef]
Figure 1.
Schematic diagram of the production process of the test steel.
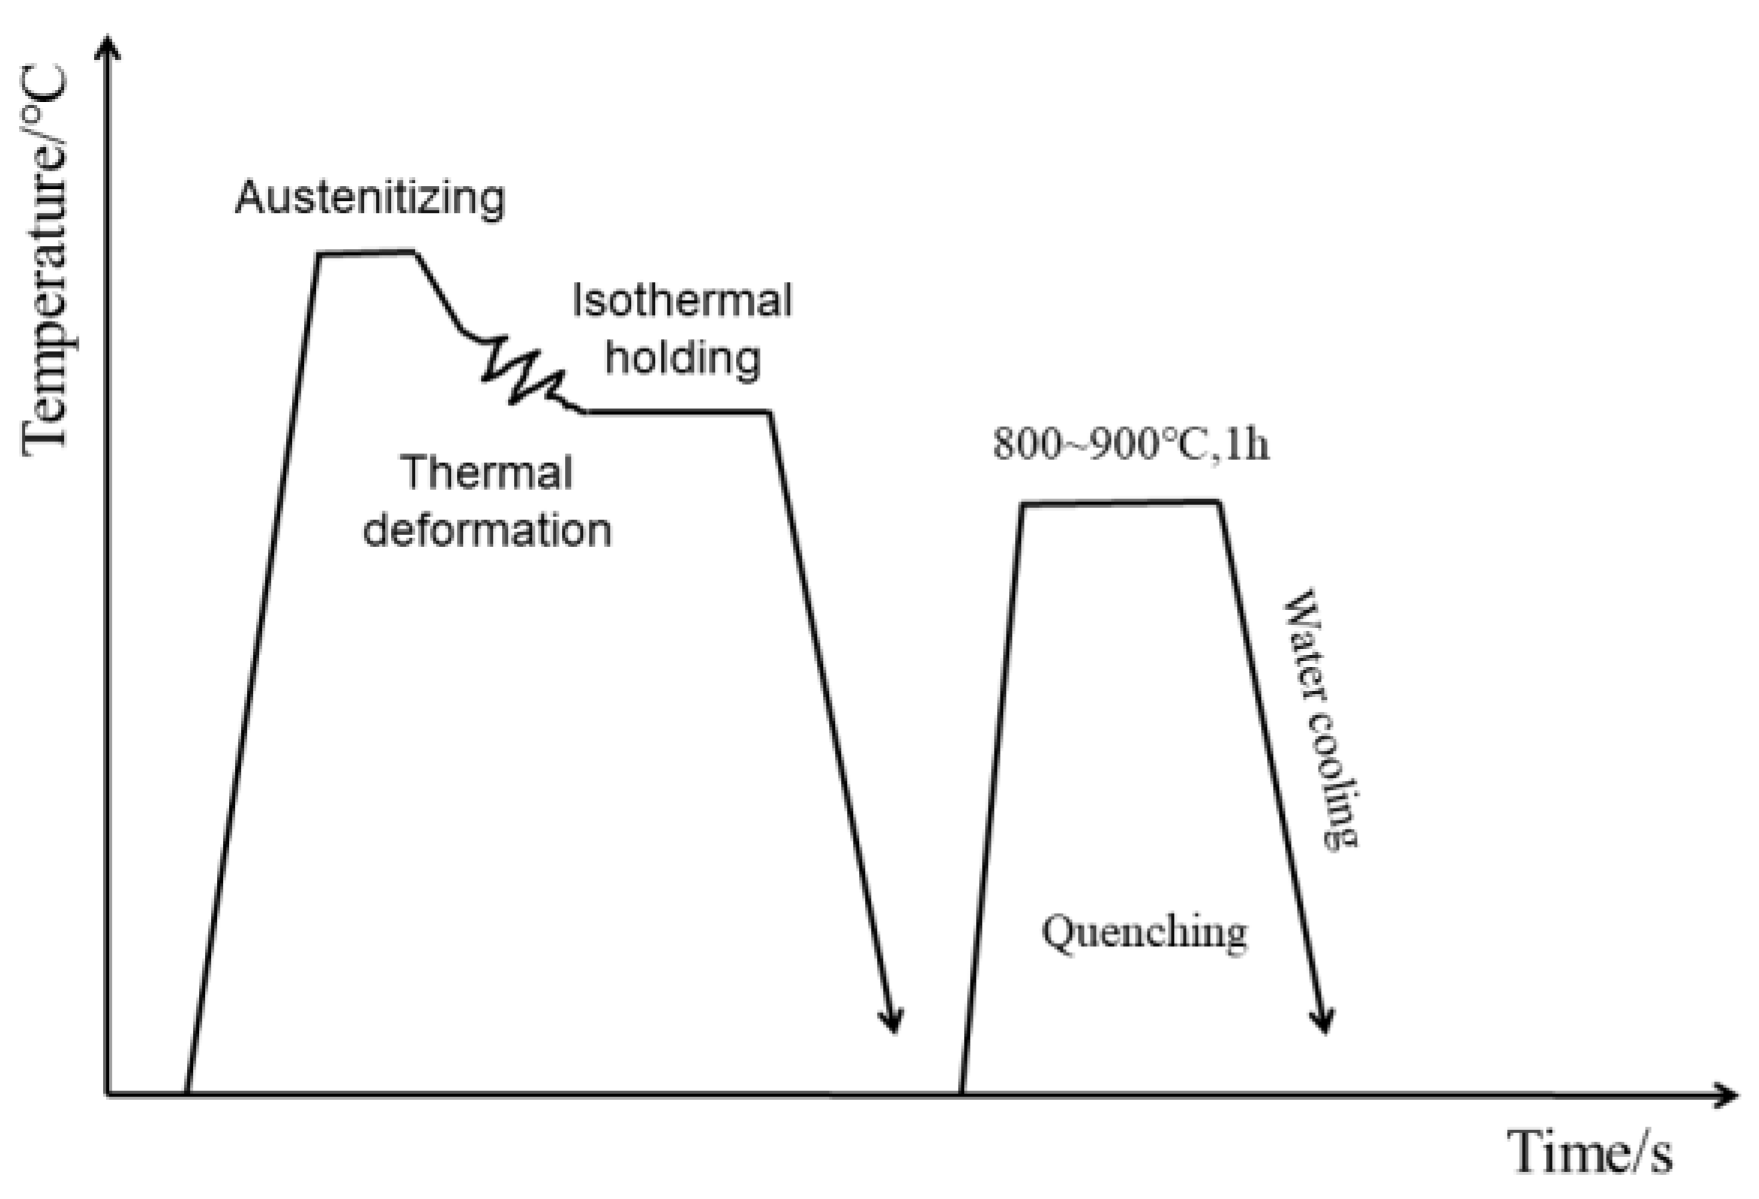
Figure 2.
Schematic diagram of the rolling–sliding wear tester.

Figure 3.
SEM image of the wear surface of test steel: (a) debris and (b) peeling pits and cracks.
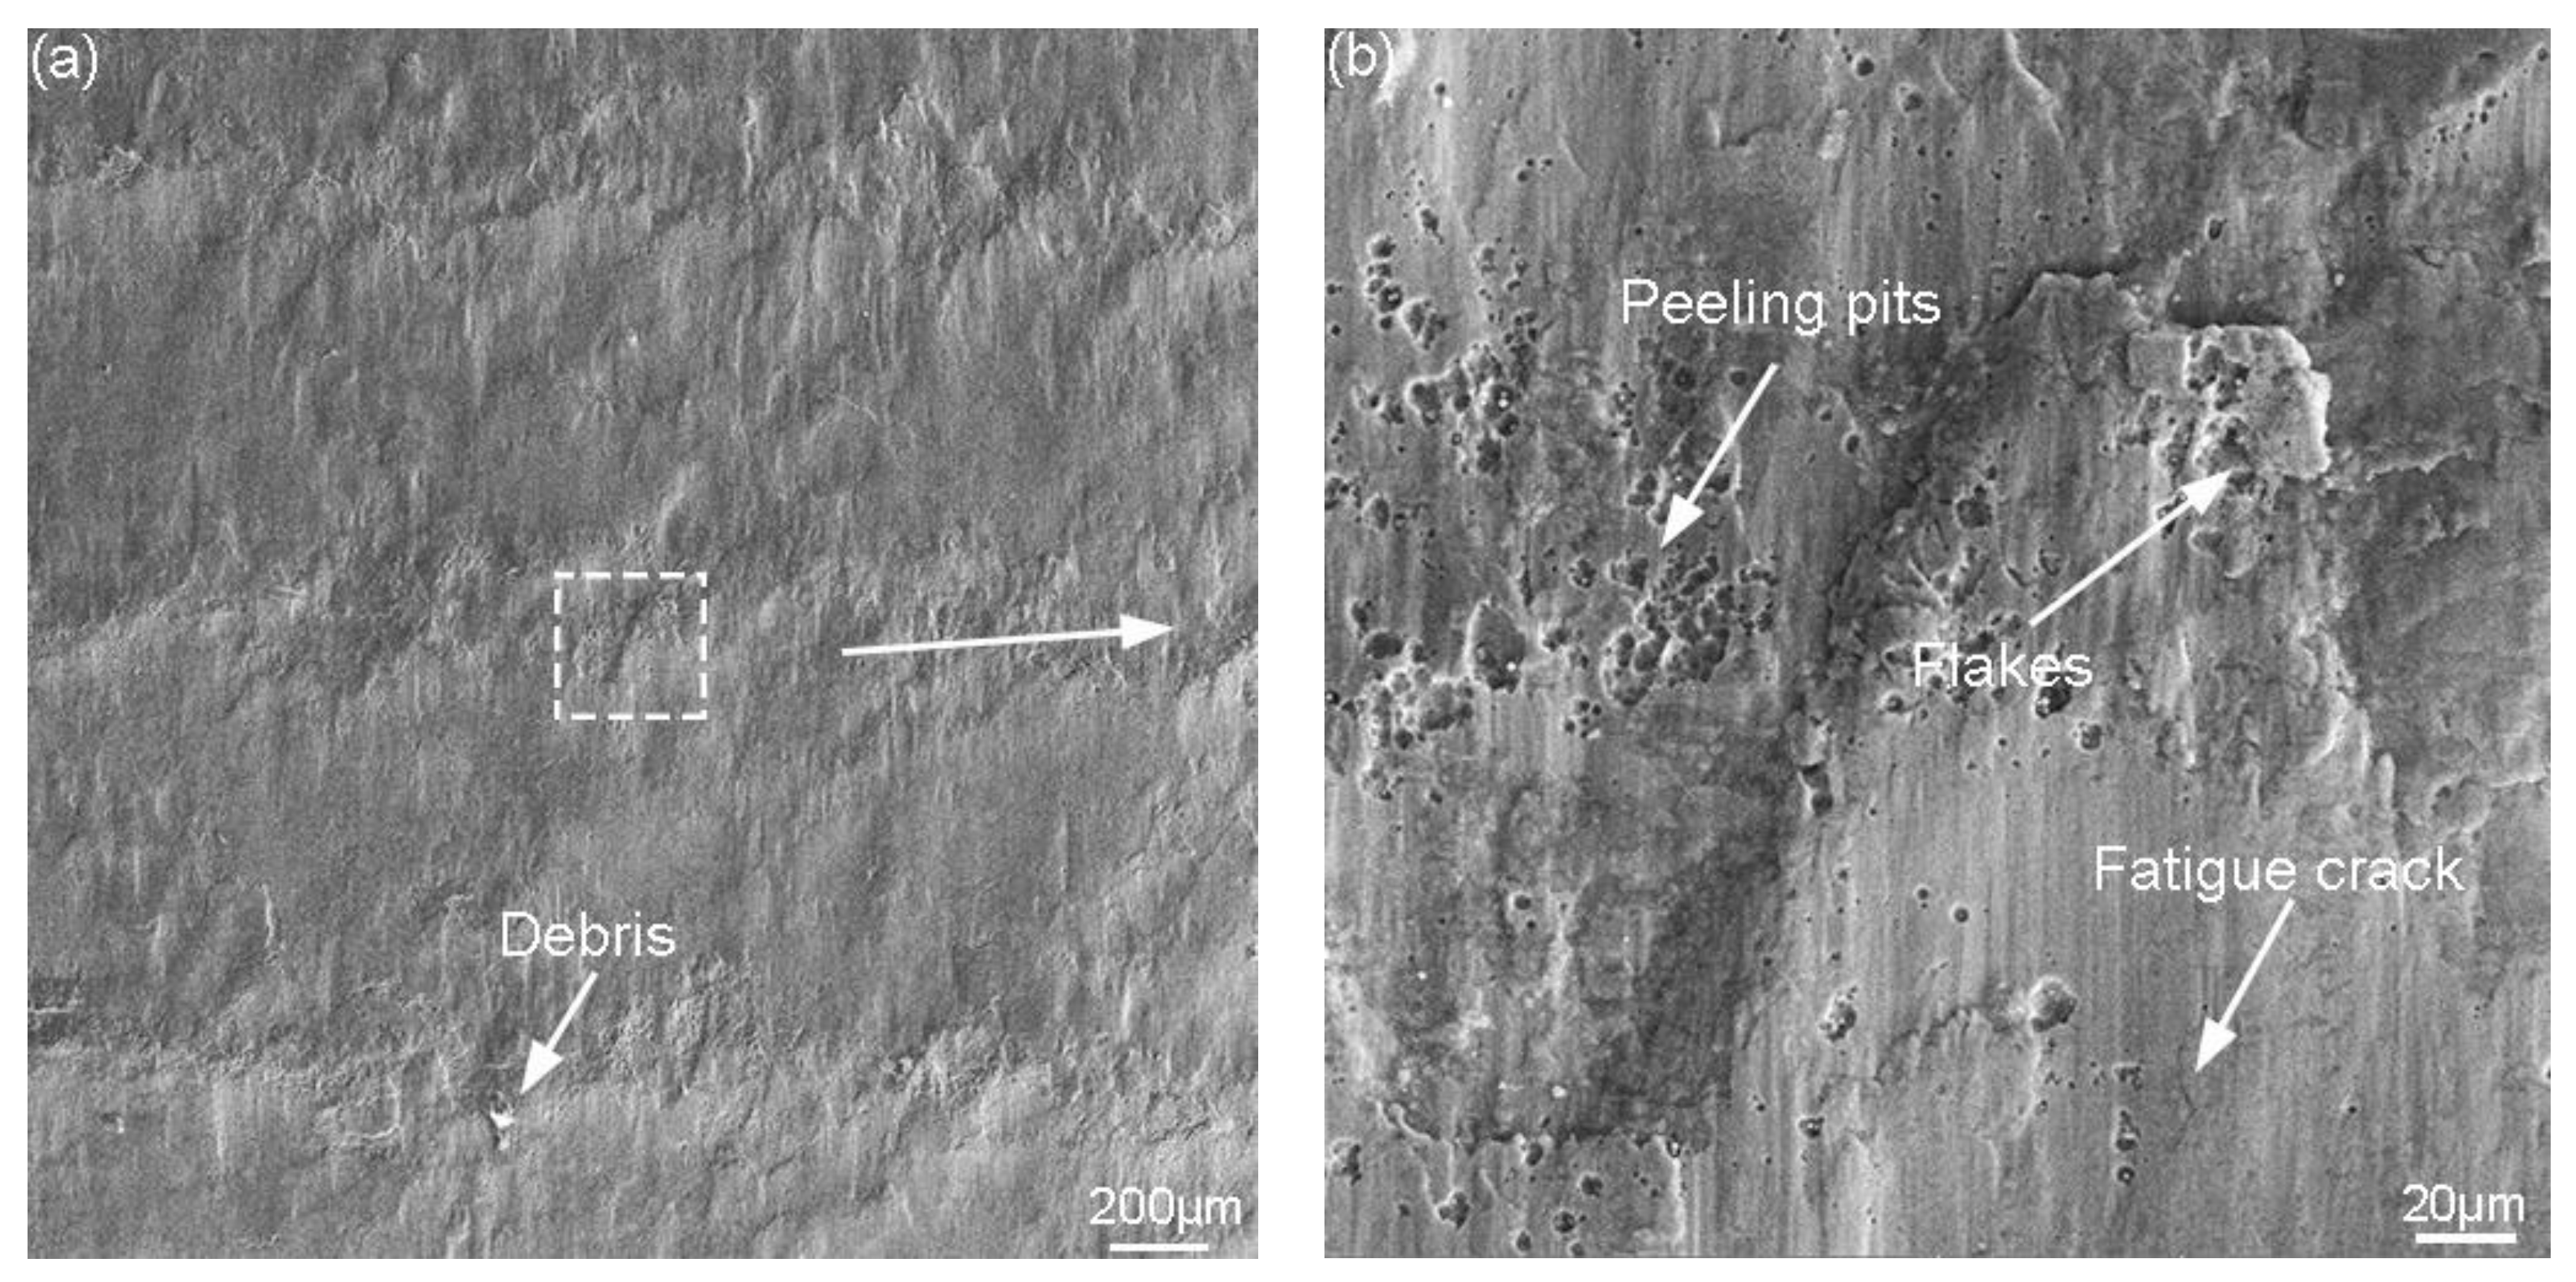
Figure 4.
(a) OM, (b) FESEM and (c) TEM image of the matrix microstructure of the test steel.
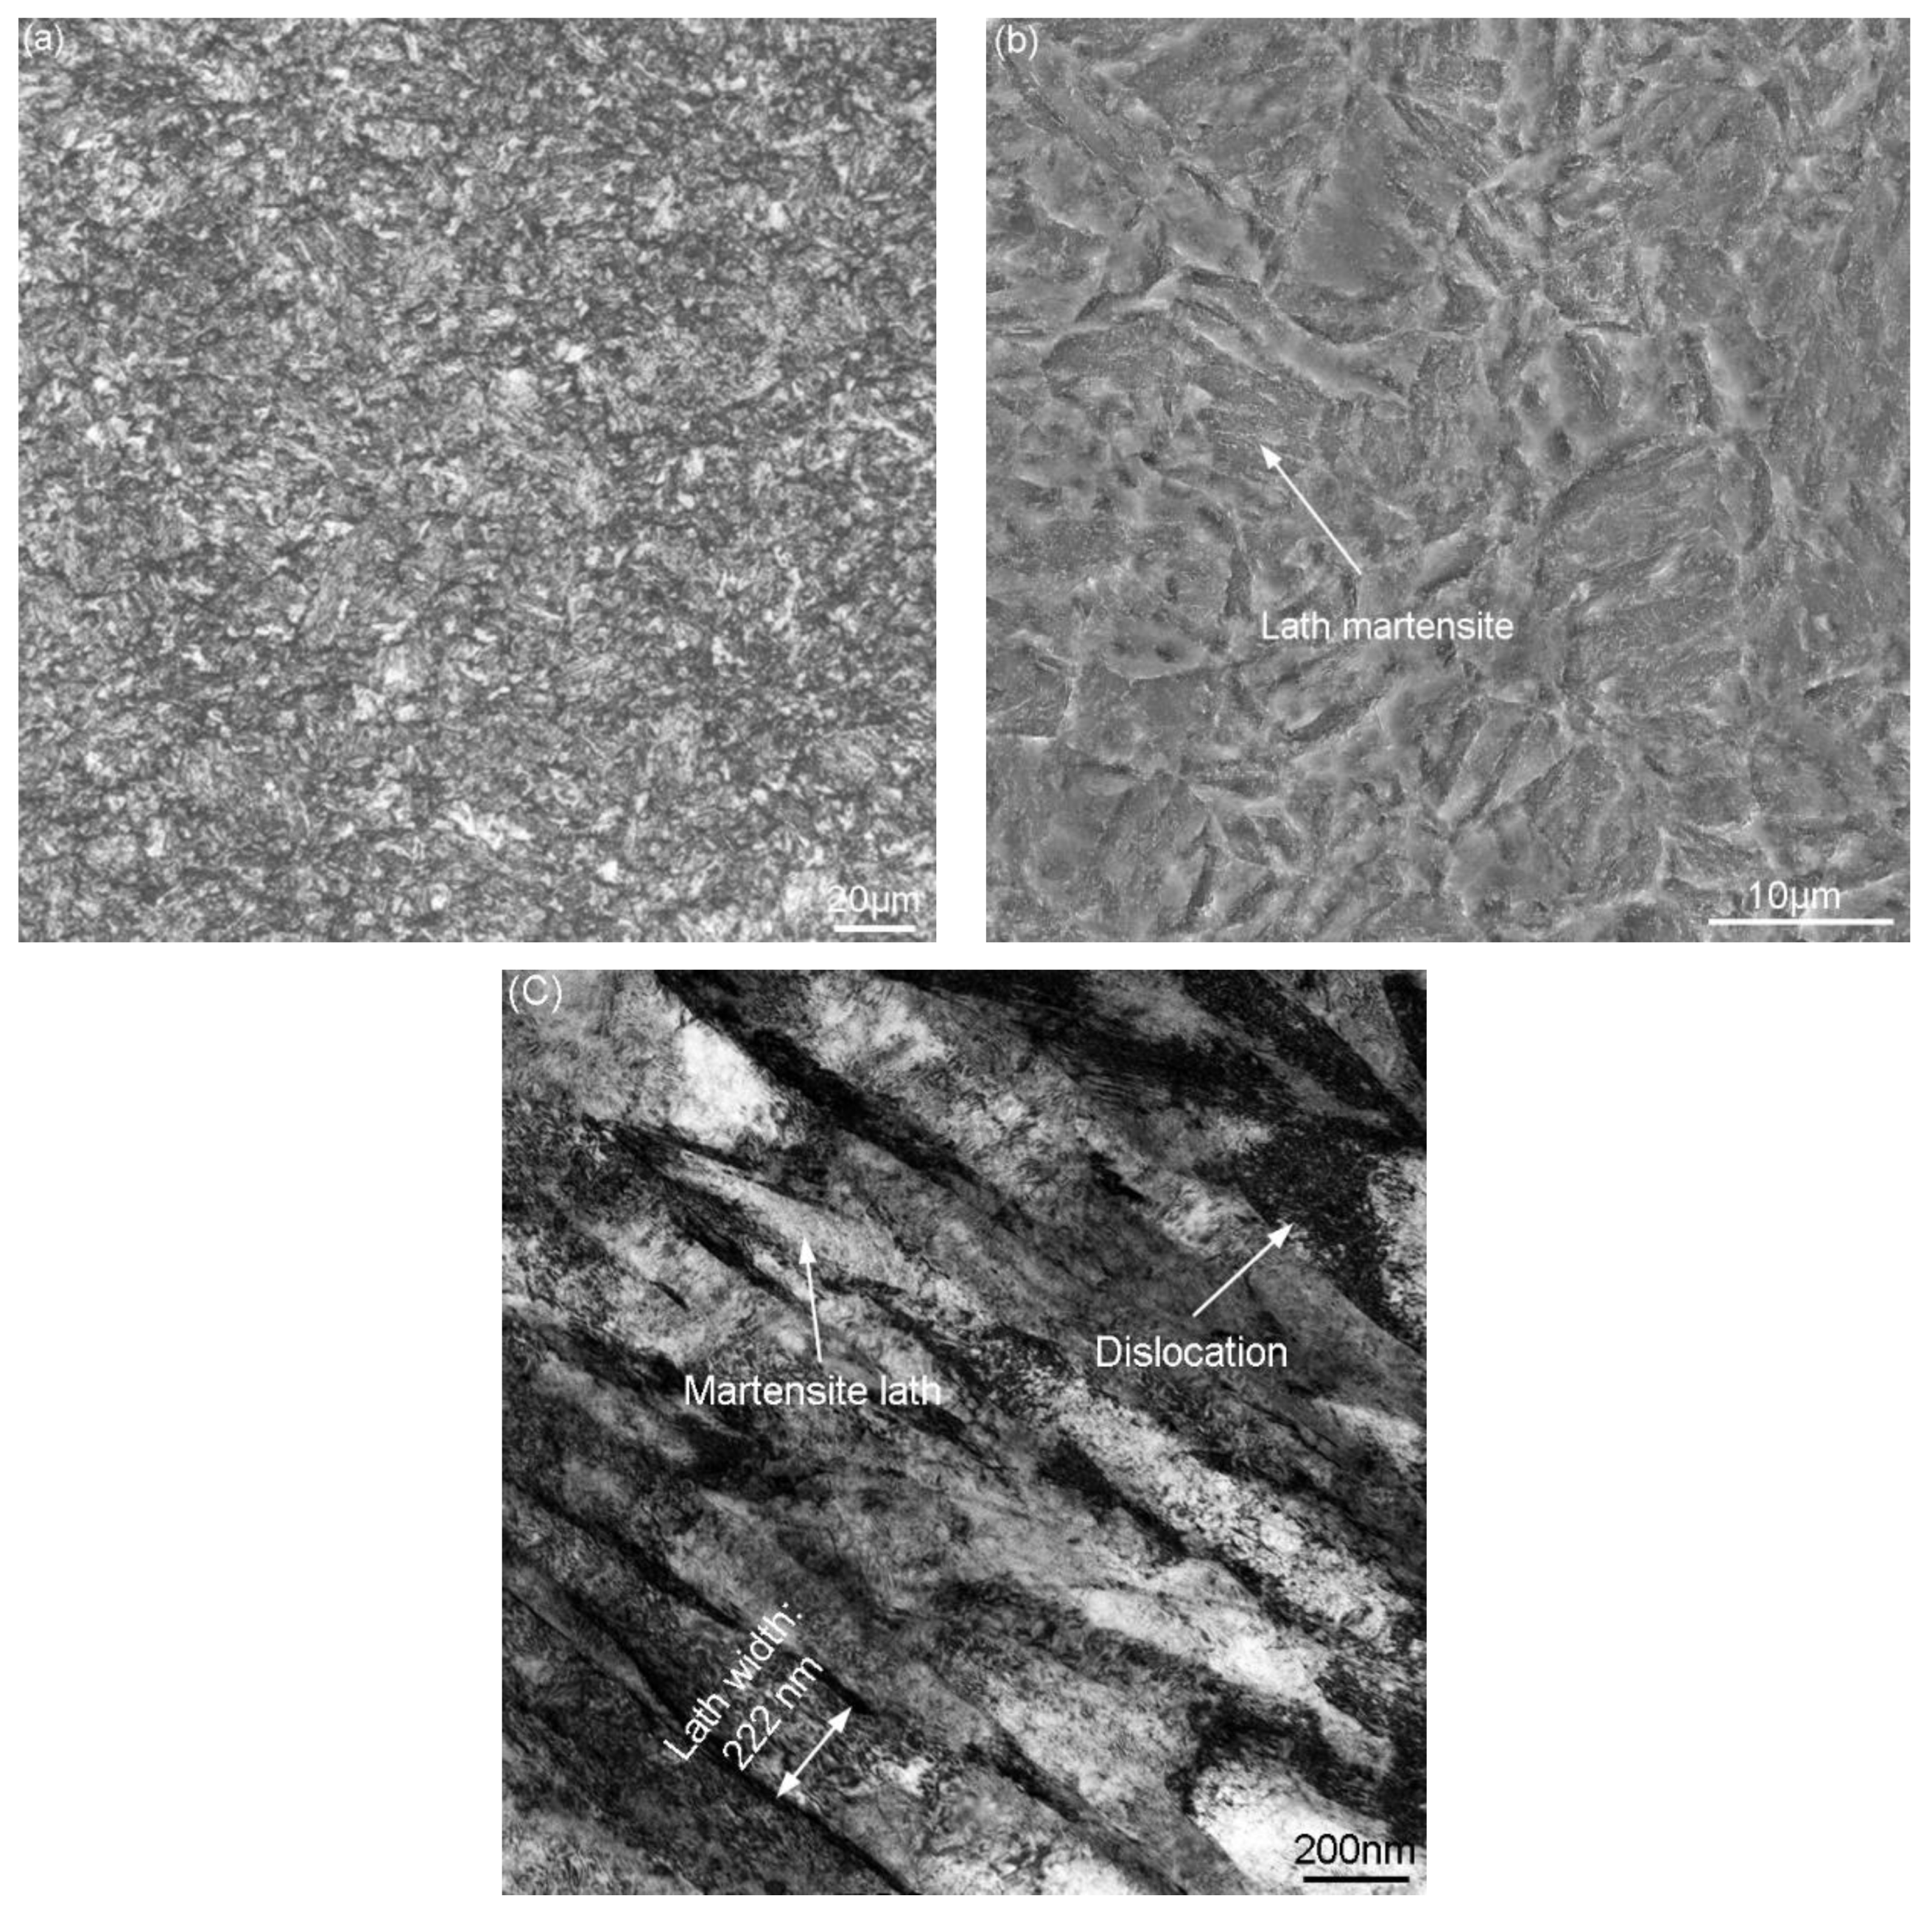
Figure 5.
(a,b) Various forms of structural response to cyclic loading, (c) OM image of the longitudinal section of wear sample, and (d) schematic diagram of specimen cutting and the RS zone.
Figure 5.
(a,b) Various forms of structural response to cyclic loading, (c) OM image of the longitudinal section of wear sample, and (d) schematic diagram of specimen cutting and the RS zone.

Figure 6.
FESEM images of plastic flow lines in the RS zone.

Figure 7.
Curves of (a) plastic flow line displacement field and (b) shear strain along with the depth.
Figure 7.
Curves of (a) plastic flow line displacement field and (b) shear strain along with the depth.

Figure 8.
FESEM image of (a) martensite lath characteristics, and (b) the topmost surface microstructure of the RS zone.
Figure 8.
FESEM image of (a) martensite lath characteristics, and (b) the topmost surface microstructure of the RS zone.

Figure 9.
X-ray diffraction image of test steel: (a) RS zone and matrix; (b) (110) diffraction peak; (c) (200) diffraction peak.
Figure 9.
X-ray diffraction image of test steel: (a) RS zone and matrix; (b) (110) diffraction peak; (c) (200) diffraction peak.
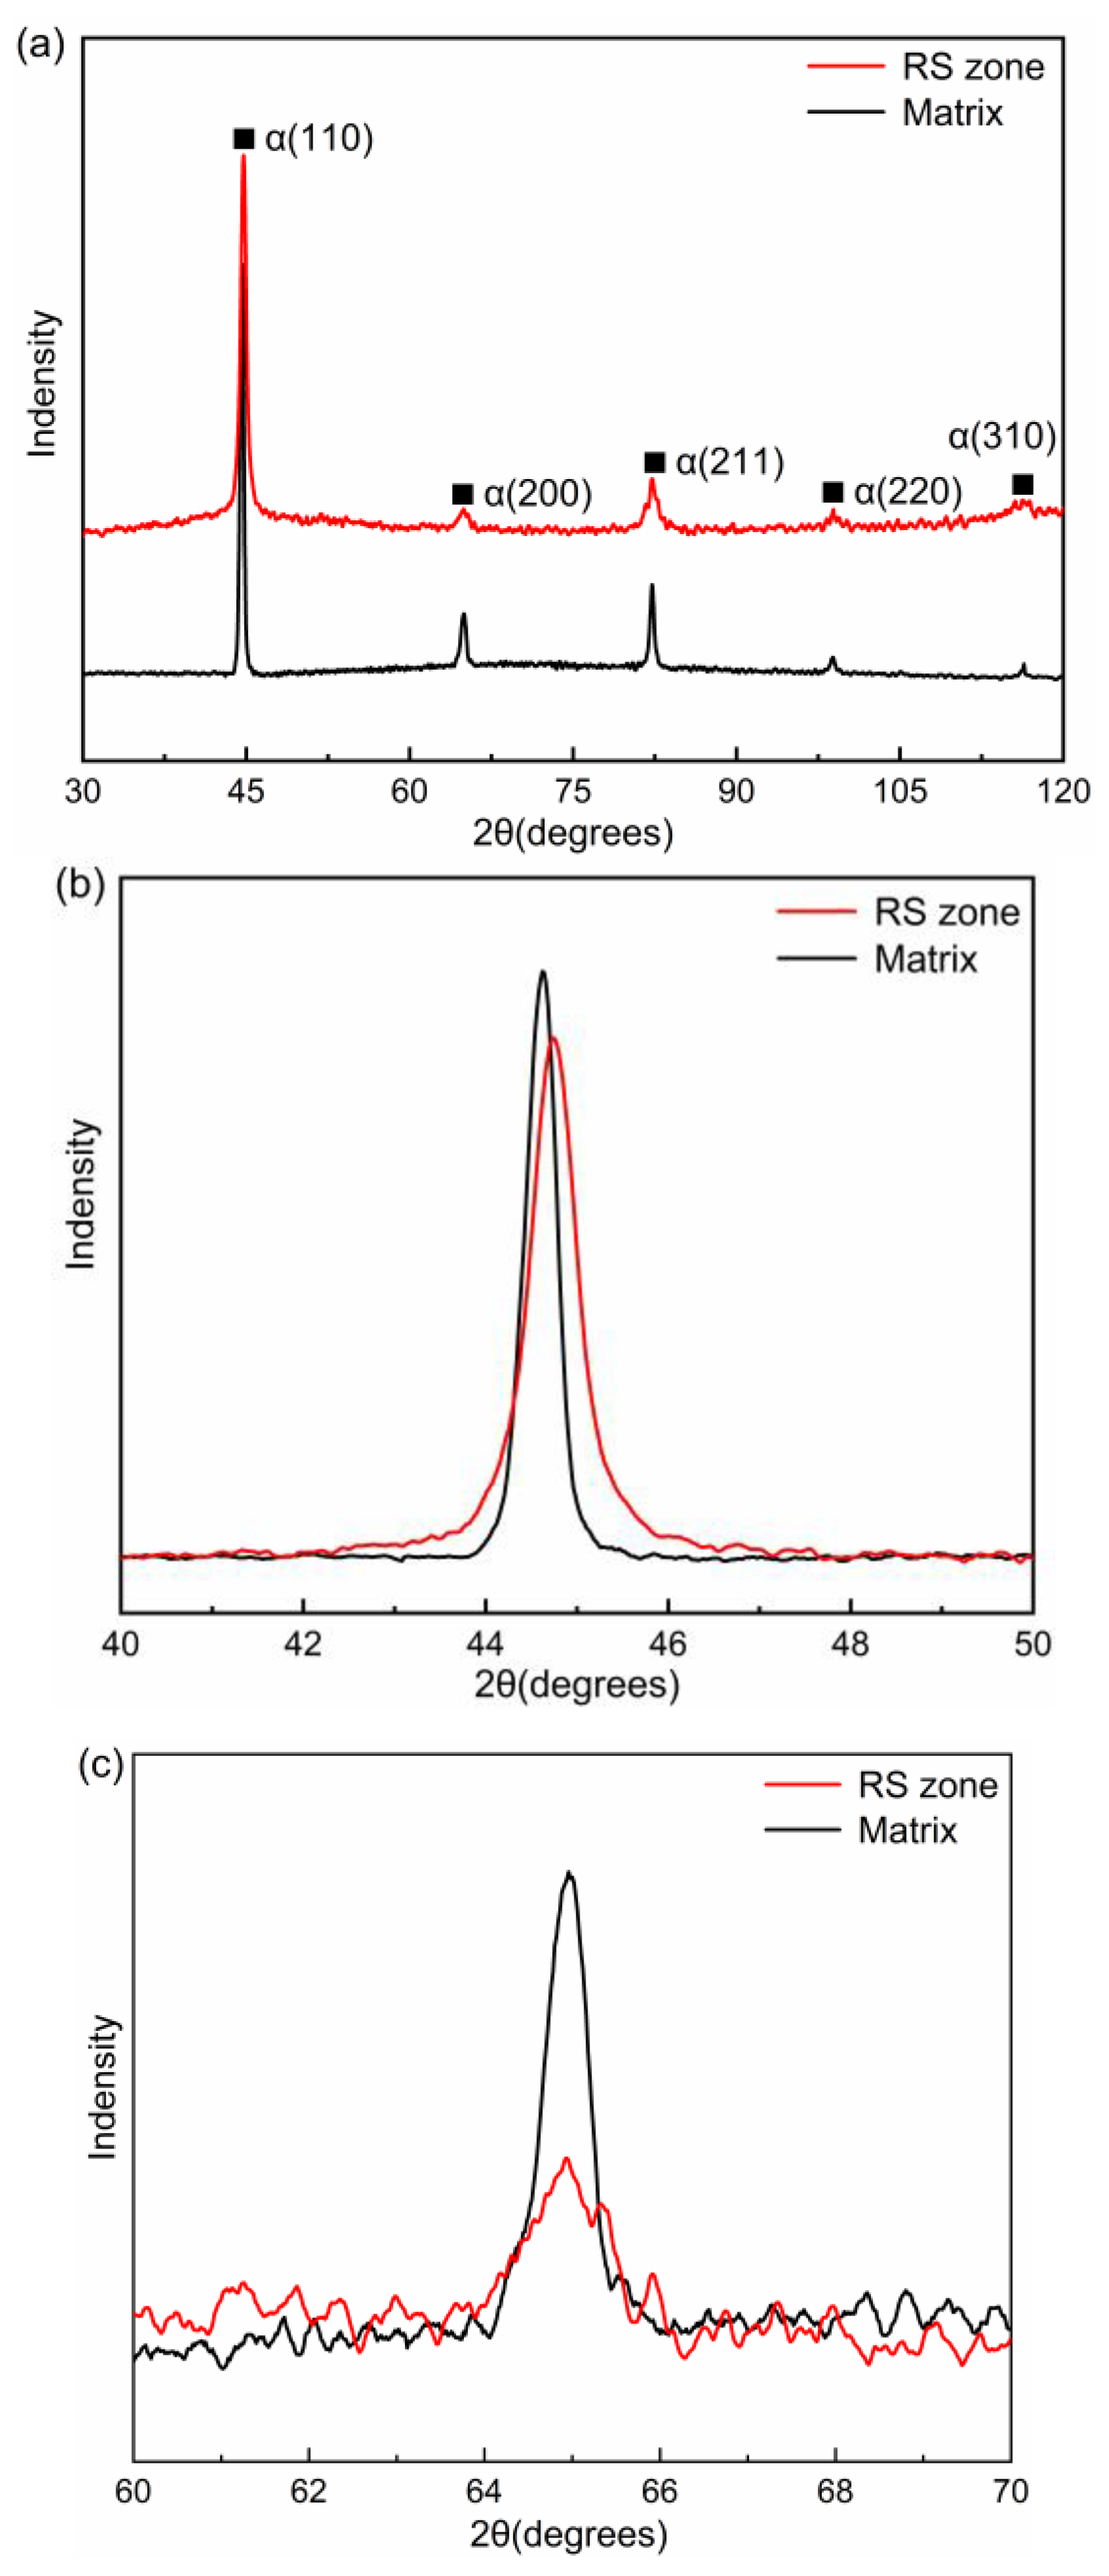
Figure 10.
((ΔK)2 − α)/K2 vs. H2 plot for martensite peaks (a) matrix and (b)RS zone assuming Gaussian and Lorentzian peak broadening, respectively.
Figure 10.
((ΔK)2 − α)/K2 vs. H2 plot for martensite peaks (a) matrix and (b)RS zone assuming Gaussian and Lorentzian peak broadening, respectively.
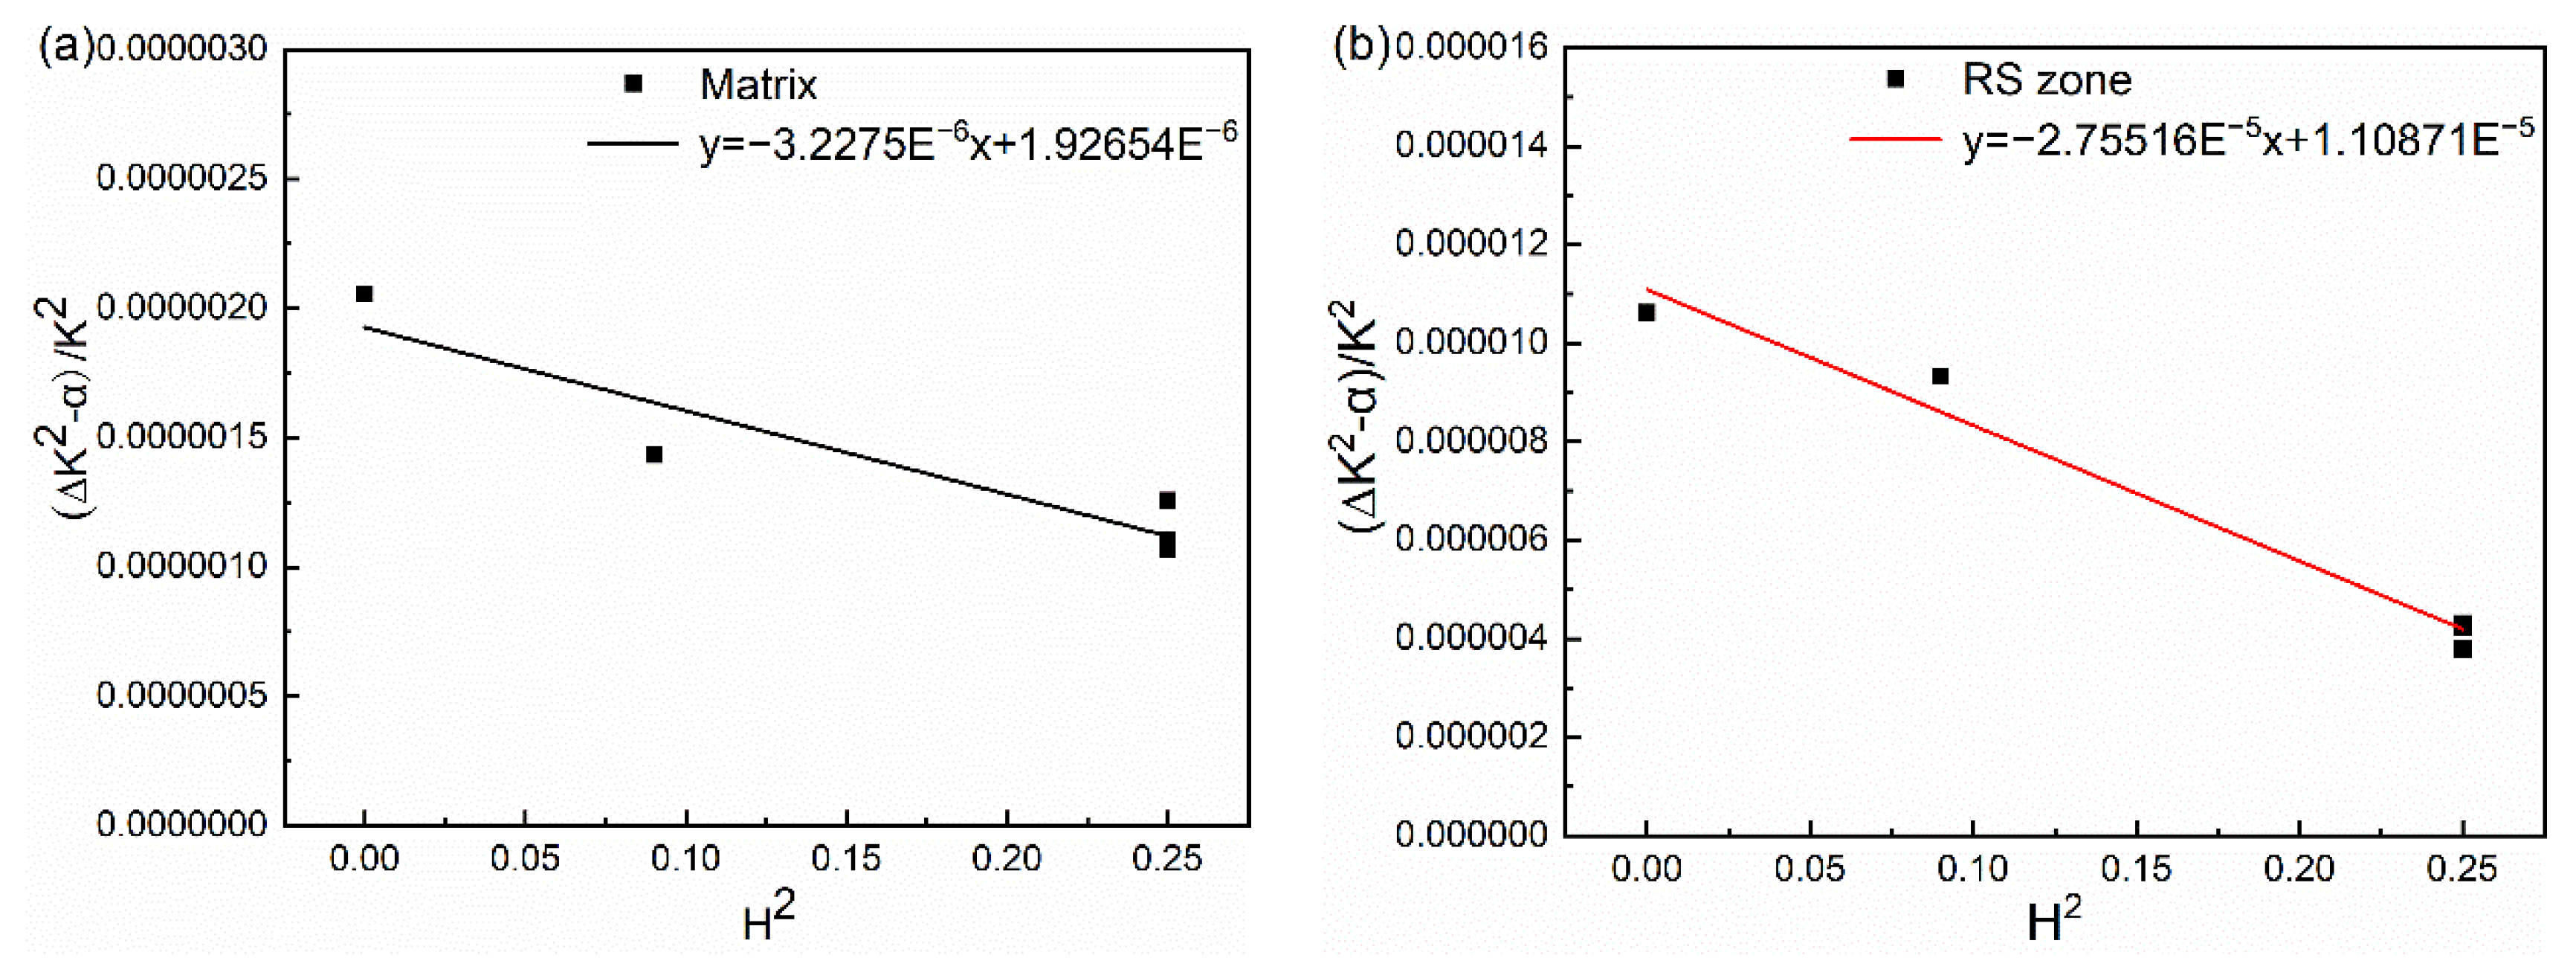
Figure 11.
(a) Scratch morphology and (b) cross-section of positions A and B.

Figure 12.
Curves of (a) scratch width and (b) scratch depth with depth from the surface.
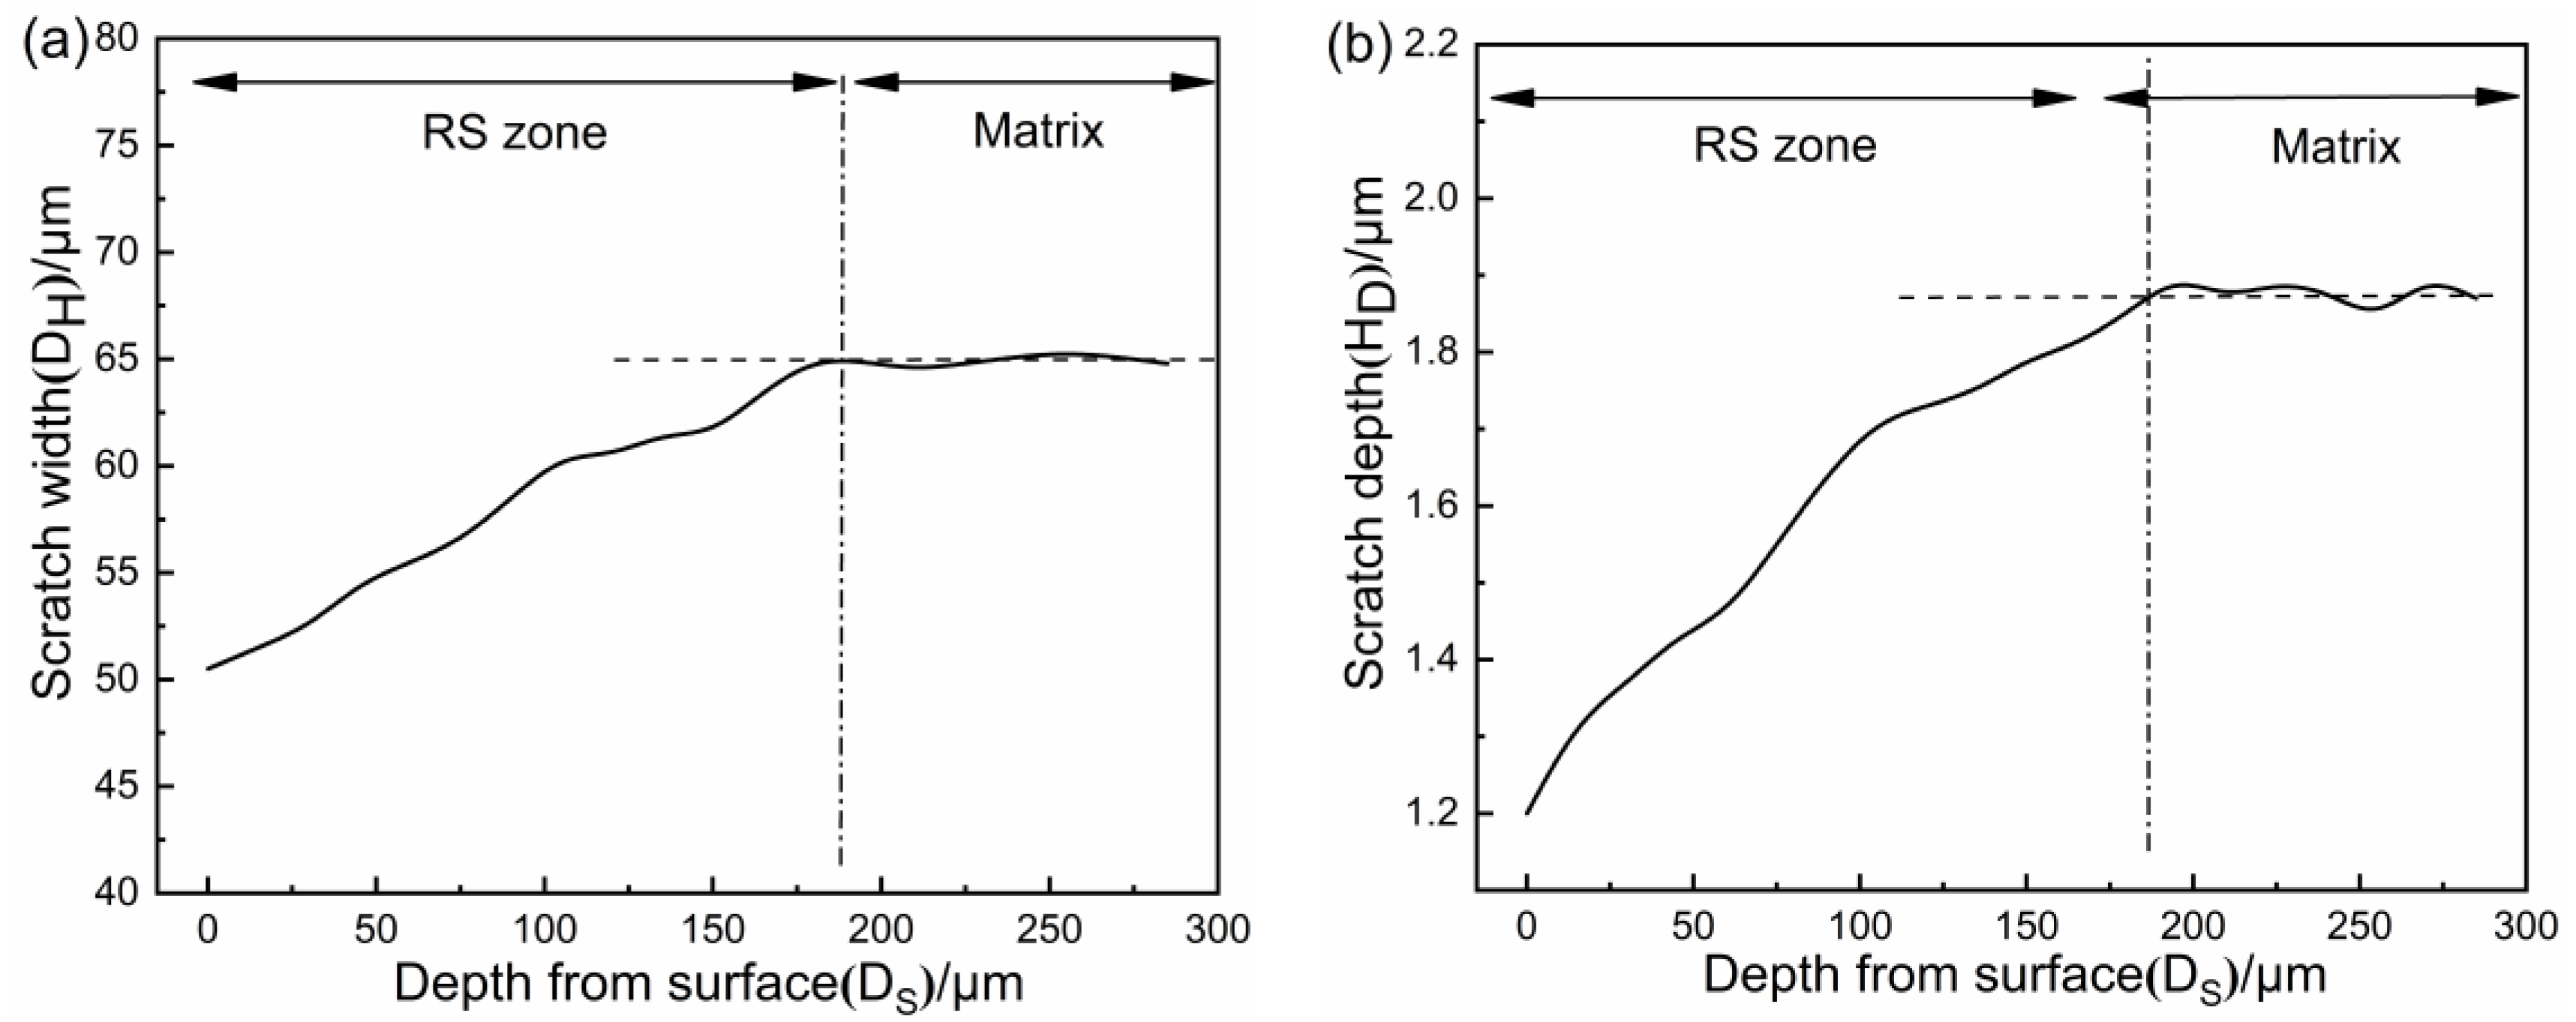
Figure 13.
Hardening rate and fracture toughness along with DS distribution: (a) hardening rate and (b) fracture toughness.
Figure 13.
Hardening rate and fracture toughness along with DS distribution: (a) hardening rate and (b) fracture toughness.

Figure 14.
(a) Wear resistance and (b) hardening rate of materials in railway reported.

Table 1.
Chemical composition of the test steel.
| C | Si | Mn | Cr | Ni | Mo | V |
|---|---|---|---|---|---|---|
| 0.20~0.22 | 0.40~0.42 | 1.10~1.12 | 0.90~0.94 | 0.98~1.00 | 0.64~0.66 | 0.06~0.08 |
Table 2.
Mechanical properties of the test steel.
| Yield Strength/MPa | Tensile Strength/MPa | Elongation/% | Microhardness/HV |
|---|---|---|---|
| 1030 | 1250 | 9 | 320 |
Table 3.
Test parameters and calculation results of contact stress.
| cosτ | αβ | F/N | Slide Ratio/% | RPM/r·min−1 | T/s | ||
|---|---|---|---|---|---|---|---|
| 0.171 | 0.166 | 1.01 | 800 | 10 | 400 | 2414 | 0.15 |
Table 4.
Wear data and the SWR results of the test steel.
| Material | Mass before Wear/g | Mass after Wear/g | Wear Loss/g | SWR/mm3∙m−1∙N−1 |
|---|---|---|---|---|
| Test steel | 77.6341 | 77.6087 | 0.0254 | 2.69 × 10⁻⁶ |
Table 5.
Full-wave at half maximum (FWHM) in the matrix and RS zone of the test steel.
| Sample | FWHM/(°) | ||||
|---|---|---|---|---|---|
| (110) | (200) | (211) | (220) | (311) | |
| Matrix | 0.316 | 0.573 | 0.514 | 0.584 | 0.756 |
| RS zone | 0.593 | 1.322 | 1.040 | 1.183 | 1.944 |
Table 6.
Calculation parameters of the modified W-H method.
| k | M | b | q | |
|---|---|---|---|---|
| 0.9 | 0.263 | 0.248 | 2.165 | 0.15681 |
Table 7.
Calculation results of slope and dislocation density.
| Sample | Slope | Dislocation Density/(m−2) |
|---|---|---|
| Matrix | −3.23 × 10⁻⁶ | 1.42 × 10¹⁵ |
| RS zone | −2.76 × 10⁻⁵ | 1.21 × 10¹⁶ |
Table 8.
SWR data and hardness of wear-resistant materials for railway reported under rolling–sliding wear of 10% slip ratio.
Table 8.
SWR data and hardness of wear-resistant materials for railway reported under rolling–sliding wear of 10% slip ratio.
| Material | C | Si | Mn | Cr | Mo | V | Hardening Rate | Hardness/HV | SWR/mm3∙m−1∙N−1 | Ref. |
|---|---|---|---|---|---|---|---|---|---|---|
| Test steel | 0.20~0.22 | 0.40~0.42 | 1.10~1.12 | 0.90~0.94 | 0.64~0.66 | 0.06~0.08 | 1.7 | 320 | 2.75 × 10⁻⁶ | Present work |
| PW | 0.54 | 0.31 | 0.74 | 0.71 | / | / | 1.6 | 285 | 14.88 × 10⁻⁶ | [42] |
| BW | 0.23 | 1.57 | 2.05 | 0.05 | 0.33 | 0.09 | 1.38 | 424 | 7.89 × 10⁻⁶ | [42] |
| PR | 0.51 | 0.38 | 0.77 | 0.1 | 0.04 | 0.15 | 1.63 | 268 | 4.43 × 10⁻⁶ | [43] |
| BR1 | 0.2 | 1.25 | 1.3 | 1 | 0.3 | 0.75 | 1.44 | 375 | 3.83 × 10⁻⁶ | [43] |
| BR2 | 0.23 | 1.45 | 1.5 | 1.2 | 0.35 | 0.85 | 1.36 | 419 | 3.14 × 10⁻⁶ | [43] |
| CL60 | 0.55~0.65 | 0.17~0.37 | 0.50~0.80 | ≦0.5 | / | / | 1.49 | 310 | 3.21 × 10⁻⁶ | [44] |
| HSS | 2.55~2.58 | 0.8~0.83 | 0.18~0.21 | 4.28 | 3.43 | 9.30 | 1.21 | 610 | 1.65 × 10⁻⁶ | [45] |
Publisher’s Note: MDPI stays neutral with regard to jurisdictional claims in published maps and institutional affiliations. |
© 2021 by the authors. Licensee MDPI, Basel, Switzerland. This article is an open access article distributed under the terms and conditions of the Creative Commons Attribution (CC BY) license (https://creativecommons.org/licenses/by/4.0/).
Share and Cite
MDPI and ACS Style
Yang, L.; Zhou, T.; Xu, Z.; He, Y.; Hu, X.; Zhao, H. Excellent Wear Resistance of a High-Speed Train Brake Disc Steel with High Hardening Ratcheting Strain Zone. Metals 2021, 11, 1478. https://doi.org/10.3390/met11091478
AMA Style
Yang L, Zhou T, Xu Z, He Y, Hu X, Zhao H. Excellent Wear Resistance of a High-Speed Train Brake Disc Steel with High Hardening Ratcheting Strain Zone. Metals. 2021; 11(9):1478. https://doi.org/10.3390/met11091478
Chicago/Turabian StyleYang, Lei, Tingwei Zhou, Zhenlin Xu, Yizhu He, Xuewen Hu, and Hai Zhao. 2021. "Excellent Wear Resistance of a High-Speed Train Brake Disc Steel with High Hardening Ratcheting Strain Zone" Metals 11, no. 9: 1478. https://doi.org/10.3390/met11091478
Note that from the first issue of 2016, this journal uses article numbers instead of page numbers. See further details here.