Correlations between the Surface Topography and Mechanical Properties of Friction Stir Welds


Institute for Machine Tools and Industrial Management (iwb), Technical University of Munich, Boltzmannstr. 15, 85748 Garching, Germany
*
Author to whom correspondence should be addressed.
Metals 2020, 10(7), 890; https://doi.org/10.3390/met10070890
Submission received: 18 June 2020
/
Revised: 1 July 2020
/
Accepted: 3 July 2020
/
Published: 4 July 2020
(This article belongs to the Special Issue Friction Stir Welding Prospective on Light-Alloys Joints)
Abstract
:Friction stir welding is a modern pressure welding process, which is particularly suitable for aluminum alloys. Several studies have been conducted to investigate the interrelations between the process parameters, such as the welding speed and the tool rotational speed, and the resulting mechanical properties of the joint. This study explored the connections between the surface topography of the welds, such as the flash height and the seam underfill, and their mechanical properties (ultimate tensile strength; elongation at break; and Vickers hardness). For this purpose, a total of 54 welding experiments at three different welding speeds were conducted using the aluminum alloy EN AW-6082-T6. The welded specimens were examined using visual inspection, topographic analysis, metallography, hardness measurements, and uniaxial tensile tests. Afterward, a statistical analysis was performed in order to determine the correlation coefficients between the surface topography and the mechanical properties of the welds. The strongest correlations were between the surface topography and the ultimate tensile strength. Thereby, the most pronounced relations were found between the seam underfill as well as the arc texture formation of the weld and its ultimate tensile strength. The interrelations between the surface topography and the elongation at break, as well as the hardness of the welds, were less pronounced. The higher the welding speed became, the less pronounced the interrelations were. The results show the potential of a non-destructive monitoring system based on the topography to support the prediction of the acceptability of welded parts.
1. Introduction
Friction stir welding (FSW) was invented at The Welding Institute (TWI) in the UK in 1991 [1]. It is a joining process that produces a weld using friction heating and material mixing in the plastic state, caused by a rotating tool that traverses along the weld [2]. Since it is a solid-state welding process, and thus there is no solidification-associated porosity or cracking, all of the traditionally un-weldable aluminum alloys become weldable using FSW [3]. The joints are of high quality and reliability. As a result, FSW has rapidly evolved into an important joining process in the aerospace industry [4]. The process is also increasingly being used in the field of electromobility [5]. Both of these industries depend on non-destructive methods with high accuracy to evaluate the welded joints. The non-destructive methods that are currently available, such as ultrasonic testing and X-ray examination, require large investment costs and considerable experience to interpret results [6]. As process irregularities often lead to characteristic surface defects in FSW, a possible option for non-destructive process monitoring during friction stir welding is the analysis of the weld surface [7]. The DIN EN ISO 25239-5 standard [8] provides an overview of the different types of defects that can occur during FSW of aluminum alloys. The standard lists seven surface irregularities and two internal irregularities. The surface irregularities are: incomplete penetration (also called lack of penetration), excessive root elevation, excessive flash formation, edge offset, seam underfill, irregular seam width, and irregular seam surface. According to DIN EN ISO 25239-5 [8], all of the surface defects listed can be detected by visual inspection, with the exception of insufficient penetration welding.
To date, several projects on the automated detection of surface defects and properties in the field of FSW have been conducted. Sinha et al. [9] reported the possibility to automatically detect surface defects of friction stir welds using image data processing. The images of the friction stir welds were captured by a camera, which tracked the weld seam behind the tool. The data were then processed offline, for example by histogram equalization, contrast stretching, and various filtering techniques. For good welds, the processed images showed a low variation in the grayscale intensities along a selected line and in the contouring data. However, the intensities along the evaluated line as well as the contour plot showed larger variations when a probe failure occurred. Zuo et al. [10] studied the influence of the process parameters on the surface topography of friction stir welds. According to the authors, the surface topography plays an important role in the quality of the joint. Another finding was that the distance between the semicircular arc lines on the surface, which are typical for FSW, decreases with increasing tool rotational speed (RPM-rate) or decreasing welding speed.
Hartl et al. [11] derived scalar key indicators from a point cloud, which was created by measurement of the surface topography using a three-dimensional profilometer. The indicators were used to quantify surface characteristics and detect surface defects in friction stir welds. The topography along the centerline of the weld seam in the welding direction was found to be especially suitable for quantifying the surface quality. Using the topography along this line, the regularity of the semicircular arc texture formation could be evaluated. The ratio of the number of measured local valleys and peaks to the number of theoretical local valleys and peaks of the arc texture along the centerline was of particular interest. The theoretical number can be calculated using the process parameters welding speed and tool rotational speed. If this ratio rarc was 1, the weld was visually good. If the ratio was less than 1, the welding temperature was too high. If the ratio was higher than 1, the welding temperature was too low. In addition, further key indicators were defined, for example, to describe the flash formation or the seam underfill. Hartl et al. [12] showed that the ratio rarc and the flash formation can be predicted with high accuracy by evaluating process variables recorded during friction stir welding using artificial neural networks.
Regarding the interrelations between the surface properties and the mechanical properties of friction stir welds, only very general statements can be found in the state of the art. Two examples are Rajashekar et al. [13]: “The surface texture of friction stir welds is related to the internal structure of the weld”, and Sudhagar et al. [14]: “The correlation between tensile strength and surface appearance reveals that weld joint with irregular and defective surface possess lower tensile strength”.
To date, there is only one publication that quantifies the correlation between surface features of friction stir welds and their ultimate tensile strength: Das et al. [6] applied both fractal theory and wavelet transform to images of friction stir weld surfaces. The semicircular arcs on the weld surface varied for different process parameters. This was the central motivation to correlate the image information with the ultimate tensile strength of the welds. Two methods were applied to calculate the fractal dimensions (FDs): a box-counting algorithm [15] and Katz’s method [16]. When determining the FD using the box-counting algorithm, the correlation coefficient between the FD and the ultimate tensile strength was −0.79. The larger the FD, the lower the ultimate tensile strength tended to be. When calculating the FD according to Katz’s method, the correlation coefficient between the fractal dimension and the ultimate tensile strength was −0.91. Additionally, a two-dimensional wavelet transform was applied to extract information from the images. A new indicator, which was called CI, was introduced based on the data generated by the wavelet transform. The correlation coefficient between CI and the ultimate tensile strength was −0.93. The higher the introduced indicator CI, the lower the ultimate tensile strength. In this way, it was shown for the first time that it is possible to describe a relation between surface properties of friction stir welds and their joint strengths. However, using the fractal theory and the wavelet transformation to obtain surface features is complex.
The aim of the present work was to quantify the interrelations between the surface topography of friction stir welds and their mechanical properties. There are numerous systems available to record the surface topography of the welds inline or offline, which are based on the principle of laser triangulation [17]. With the key indicators defined in Hartl et al. [11], a possibility to quantify the surface topography without complex pre-processing of the surface data exists. If pronounced correlations between the topography and the mechanical properties can be found, a non-destructive monitoring system, which predicts the mechanical properties and the quality of the welded parts based on the surface topography, can be developed in future works.
2. Materials and Methods
2.1. Welding Experiments
The welding process was conducted on a four-axis milling machining center adapted for friction stir welding. Each weld was composed of EN AW-6082-T6 in butt-joint configuration with a weld length of 205 mm. Each individual sheet had dimensions of 325 mm × 88.5 mm (see Figure 1). The sheet thickness t was 4.0 mm. A two-piece tool with a concave shoulder measuring 14 mm in diameter and a conical probe with a diameter of 6 mm was utilized. The probe had a thread and three lateral flats. The experiments were performed in position-controlled mode with an immersion depth of 0.1 mm and a 2° tilt angle of the tool. The dwell time at the immersion point was one second. The welding speed vs and the tool rotational speed n (RPM-rate) were varied. The examined welding speeds vs were 500 mm/min, 1000 mm/min, and 1500 mm/min. As high welding speeds vs are becoming increasingly important for industrial applications, especially in the context of electromobility [5], welding speeds of up to 1500 mm/min were tested. For setting the rotational speeds n, special care was applied to ensure that the ratio of the tool rotational speed to the welding speed n/vs was not less than 1 mm−1 and not higher than 7 mm−1, and that the rotational speed n was not higher than 5000 min−1. Any exceeding of these boundaries could have damaged the welding tool or the measuring equipment. Inside these boundaries, the rotational speed was varied in steps of 200 min−1 to obtain a sufficient amount of data. This resulted in an experimental design with a total of 54 experiments. Table A1, Table A2 and Table A3 in the Appendix A list the parameters used in the welding experiments no. 1 to no. 54.
2.2. Weld Seam Testing
Once welded, the seams were inspected visually. Particular attention was paid to surface defects such as flash formation, surface galling, and an irregular formation of the surface texture. Additionally, the exit hole was inspected as tunnel errors can often be detected there visually.
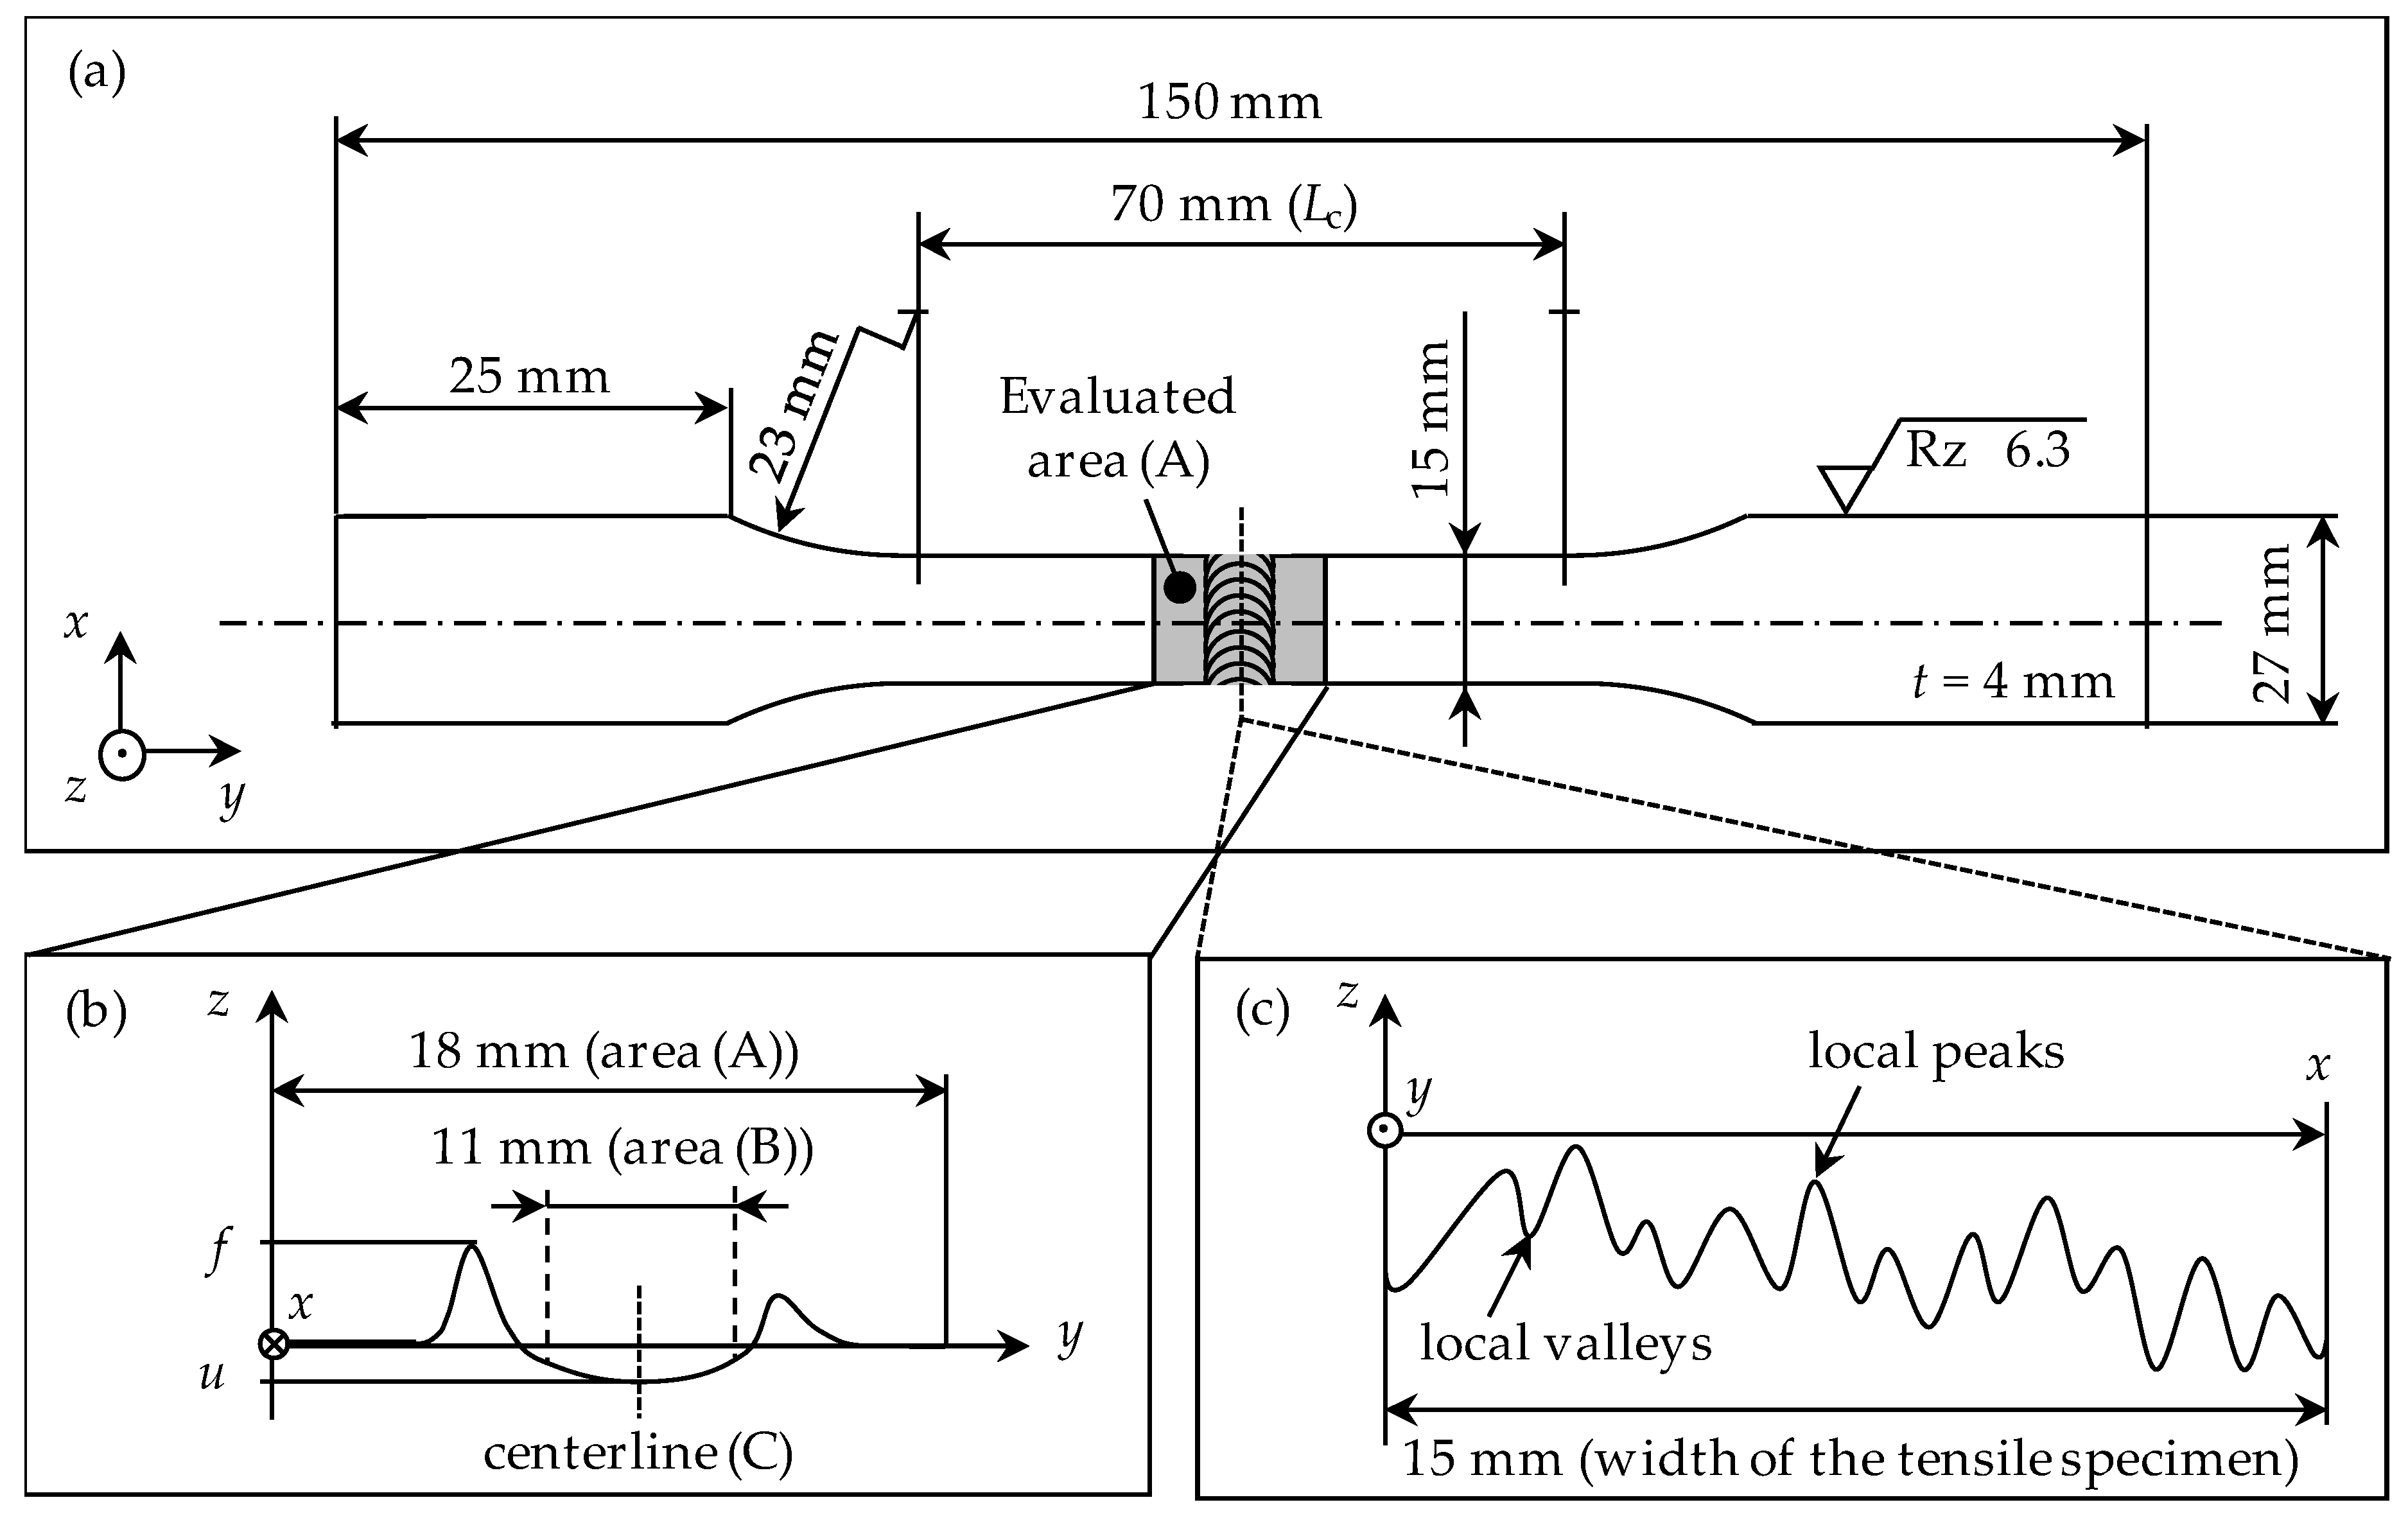
After visual inspection, four slices were removed from each of the 54 welds. The tensile specimens were later prepared from these slices. Figure 1 shows the geometry of the welded sheet metals with the areas of removal of the four slices for the tensile specimens. The dimensions of the tensile specimens are illustrated in Figure 2a. The samples taken for the metallography had a width of 10 mm and a length of 18 mm. To keep the position of the specimens taken from the welded plate as consistent as possible, their positions relative to the exit hole were measured. The distance between the center of the exit hole and the sample for metallography was 28.4 mm.
The topography of the weld segments on the tensile specimens was examined using a three-dimensional profilometer VR-3100 (Keyence Deutschland GmbH, Neu-Isenburg, Germany). Thereby, white LEDs projected light from two places onto the weld and the reflected light was measured by a CMOS sensor. The smallest measurable difference in the z-direction (see Figure 1) was 1 µm. The sheet surface was defined as the zero height. The distance between the individual topography points in the x-y-plane was approximately 24 µm. Consequently, a total of about 470,000 topography points were generated for the area (A) containing the weld seam on the 15 mm wide tensile specimens (see Figure 2b).
The key indicators to quantify the flash formation were calculated by using area (A), the key indicators for the seam underfill were specified by using area (B), and the ratio rarc which quantifies the quality of the arc texture formation was determined along the centerline (C) of the weld (see Figure 2b,c). Figure 2b also schematically shows the flash height f and the seam underfill u for one section of the weld surface. Due to the distance between the topography points of approximately 24 µm, there were 625 such sections of the weld’s topography available for each of the 15 mm wide tensile specimens. From the corresponding 625 values for the flash height f and the seam underfill u for the 625 sections of the weld surface of each tensile specimen, the mean values fm and um, and the standard deviations Sf and Su were calculated. Figure 2c schematically shows the topography along the weld centerline (C). Due to the seam underfill, the topography along the centerline is below the sheet surface. The number of local valleys and peaks along the centerline ncount was determined and compared with the theoretical number ntheoret which leads to the ratio rarc:
The theoretical number ntheoret was calculated using the tool rotational speed n, the welding speed vs, and the width of the tensile specimen, which was 15 mm:
In Table 1, the five key indicators that were determined from the point cloud for each of the 216 tensile specimens using a Matlab [18] script are summarized.
Transverse tensile tests were conducted to determine the ultimate tensile strength and the elongation at break of the welded joint. The aluminum alloy EN AW-6082-T6 is characterized by a change in the mechanical properties during heat treatment [19]. Since FSW introduces heat and mechanical energy to the microstructure, the microstructural and metallurgical properties change over several weeks after welding [20]. For this reason, a period of 7.5 weeks was scheduled between the welding process and the tensile tests. Based on the investigations of Brenner et al. [19], it was assumed that the metallurgical transformations were completed after this period. For the tensile tests, a Z050 AllroundLine material testing machine (ZwickRoell GmbH & Co. KG, Ulm, Germany)was utilized. A Laser XTens 7-220 HP laser extensometer (ZwickRoell GmbH & Co. KG, Ulm, Germany) was used to measure the elongation at break. In addition to the 216 tensile specimens for the welds, ten reference tensile specimens without a weld were prepared. The geometry of the tensile specimens corresponded to the specifications of DIN 50125, Form E [21]. The tensile tests were performed according to the standards DIN EN ISO 4136 [22] and DIN EN ISO 6892-1 [23].
Metallographic specimens were prepared to inspect the welds for internal defects. After taking the samples for metallography from the welded parts (see Figure 1), they were embedded in an epoxy resin, then ground to a fineness of P1200, polished with a 3 µm diamond suspension, and then finely polished with colloidal silica. Finally, the samples were etched with Kroll’s etchant, which is described in Vander Voort [24]. Additionally, hardness tests were conducted on the metallographic samples. In accordance with Suenger et al. [25], the Vickers hardness (HV) measurements were placed along a centerline of the sheet thickness in 1 mm increments. The tests were conducted in compliance with the requirements of the DIN EN ISO 6507-1 standard [26]. All measurements were performed with a test load of 0.49 N and a dwell time of 10 s. To evaluate the interrelations with the surface topography, the mean hardness value in the nugget zone on the advancing side was employed as a scalar response, as described in Suenger et al. [25].
In order to quantify the interrelations between the topography key indicators and the mechanical properties, a statistical analysis was performed to determine the Bravais-Pearson correlation coefficients PCC [27].
3. Results
3.1. Visual Inspection and Metallography
The surface defects identified during the visual inspection were extreme flash formation and pronounced surface galling. Experiments 3, 4, and 5 (cf. Table A1) showed a chip-like flash formation which separated from the sheet during welding. This had to be taken into account in the later analysis of the relations. Looking into the exit hole, the end of a tunnel error could be detected in experiments 1 and 2. The metallographic specimens showed pronounced internal defects for experiments 1 and 2, and smaller defects for experiments 17, 37, and 38. The cross-sections of the remaining 49 experiments showed no internal defects. Figure 3 depicts images of the cross-sections for experiments 1, 2, 17, and 37 with visible internal defects.
3.2. Correlations between the Surface Topography and the Ultimate Tensile Strength
Table A1, Table A2, Table A3 in the Appendix A list the mean values of the ultimate tensile strengths achieved for the four tensile specimens taken from each weld. It becomes clear that the ultimate tensile strength tends to increase with higher welding speed. The mean of the ten reference tensile specimens for the ultimate tensile strength was 333.0 MPa at a standard deviation of 1.2 MPa. The mean elongation at break was 13.9% with a standard deviation of 0.4%.
When exploring the correlations described in this section for the welding speed vs of 500 mm/min, outliers were found for experiments 1 to 5, i.e., with a tool rotational speed n from 500 min−1 to 1300 min−1, due to tunnel errors at experiments 1 and 2 and the chip-shaped separating flash at experiments 3 to 5. These experiments with a very low tool rotational speed were not included in the evaluation. The other eleven experiments with a tool rotational speed from 1500 min−1 to 3500 min−1, each with four tensile specimens, were considered. Thus, the diagrams shown in Section 3.2 for a welding speed vs of 500 mm/min each contain 44 points. At the two higher welding speeds of 1000 mm/min and 1500 mm/min, only the experiments with the two highest rotational speeds (experiments 35, 36, 53, 54) were not taken into account due to outliers.
Figure 4a shows the ultimate tensile strength Rm as a function of the mean flash height fm on the corresponding 15-mm-long weld section for the 44 samples at a welding speed of 500 mm/min. The correlation coefficient according to Pearson PCC was −0.84. The correlation PCC was lower at the higher welding speeds, namely −0.67 at 1000 mm/min and −0.44 at 1500 mm/min. The ultimate tensile strength tends to decrease with the increasing flash height. This was considered reasonable: the stronger the flash formation, the thinner the connecting cross-section must be due to the material being displaced from the weld seam. Furthermore, the correlation tends to be less pronounced at higher welding speeds. This was also regarded as logical because the regularity of the material flow in the process decreases with rising welding speed.
Figure 4b displays that there is also a connection between the standard deviation of the flash height Sf and the ultimate tensile strength. The more irregular the flash height, the lower the ultimate tensile strength. A PCC of −0.78 was obtained for a welding speed of 500 mm/min. The reason for this was assumed to be that a higher standard deviation of the flash height tends to be related to a higher mean flash height, which reduces the connection cross-section. For a welding speed of 1000 mm/min, a PCC of −0.66 was achieved, and for a welding speed of 1500 mm/min, a PCC of −0.27 was found. As expected, the correlation coefficients therefore also decreased with increasing welding speed due to the decreasing process regularity.
A strong correlation was determined between the mean seam underfill um and the ultimate tensile strength for the 44 tensile specimens evaluated at a welding speed of 500 mm/min (see Figure 5). The higher the seam underfill, the lower the ultimate tensile strength of the specimen. A PCC of −0.90 was determined. This appeared to be reasonable: the higher the seam underfill of the friction stir weld, the smaller the joining cross-section, and the weaker the welded joint. At a welding speed of 1000 mm/min, the PCC was −0.43, and at a welding speed of 1500 mm/min, the PCC was −0.31.
The low variations of the ultimate tensile strength between 232 MPa and 240 MPa over a wide range of tool rotational speed from 1500 min−1 to 3500 min−1 demonstrated the high process robustness of FSW (see Figure 4 and Figure 5). The evaluation of the topography revealed the potential to detect even small changes in the ultimate tensile strength through evaluation of the weld surface. This makes topography monitoring particularly interesting for high-tech applications, for example in the aerospace industry.
Another correlation was identified between the ratio of the counted number to the theoretical number of surface arcs rarc and the ultimate tensile strength Rm (see Figure 6). The ideal value of the ratio rarc is 1, which means that the number of local valleys and peaks counted corresponds to the theoretical number according to Equation (2). The further away from the ideal ratio the rarc values are, the lower the ultimate tensile strengths tend to be. This was evident at all three welding speeds (see Figure 6 and Figure 7).
Hartl et al. [11] discovered that the best result in the visual inspection is obtained if the ratio rarc is 1. Overall, this was assessed as consistent: the more suitable the welding parameters are, the more regular the welding process is, and the better the counted number of local valleys and peaks and the theoretical number fit together. This affects both the visual appearance and the ultimate tensile strength of the welds.
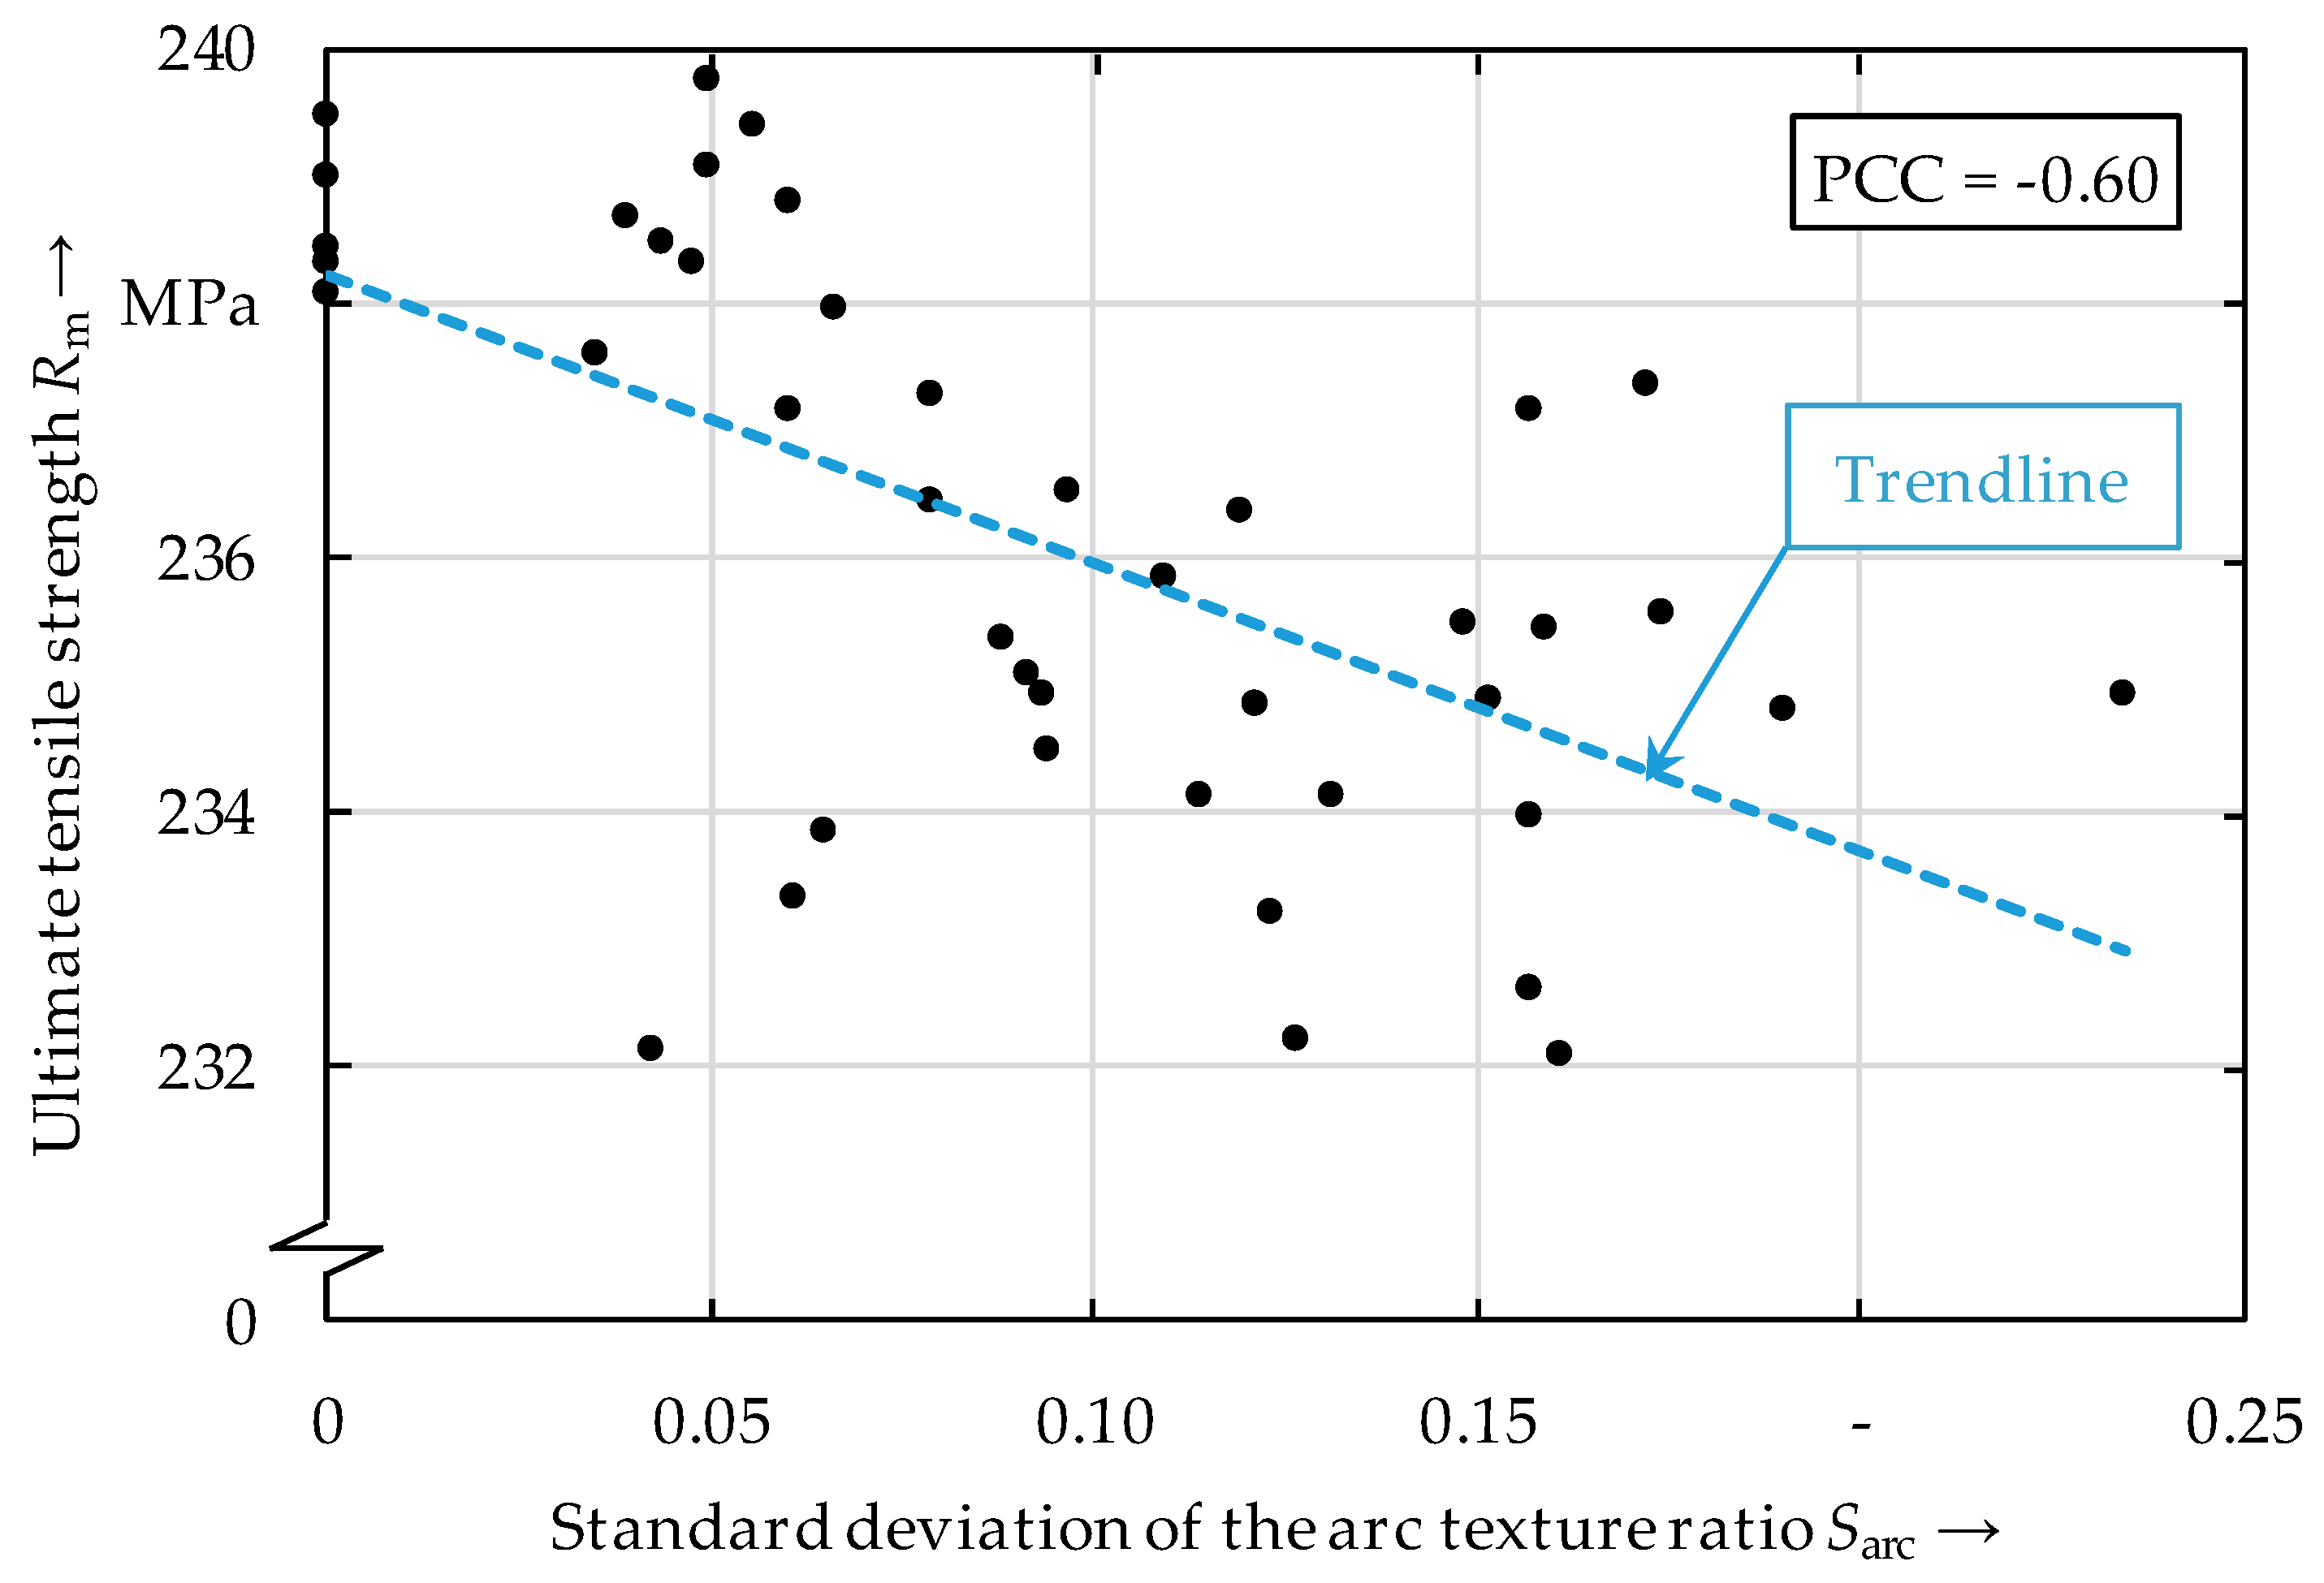
Figure 7 also illustrates that an rarc ratio near 1 not only results in high ultimate tensile strengths, but that an rarc ratio of 1 can also lead to lower ultimate tensile strengths. Therefore, this was not yet a sufficient condition, but merely a necessary one to ensure a high ultimate tensile strength. For this reason, in the next step, the 15-mm-long weld sections on the surface of the tensile specimens (see Figure 2a) were divided into five 3-mm-long segments, and the ratio rarc of each segment was calculated. The standard deviation of the arc texture ratio rarc of the five sections (which was called Sarc) was then determined for all tensile specimens. The variable Sarc was regarded as a measure of the regularity of the arc texture formation.
At a welding speed of 500 mm/min, high ultimate tensile strengths of more than 238 MPa were only achieved when the standard deviation of the arc texture ratio Sarc was small (see Figure 8). Thereby, a PCC of −0.60 was achieved between Sarc and the ultimate tensile strength. At higher welding speeds, however, this correlation was less pronounced: at a welding speed of 1000 mm/min a slight correlation between Sarc and Rm could still be detected and a PCC of −0.30 was achieved. However, at a welding speed of 1500 mm/min, no more correlation was found, and the PCC between Sarc and Rm was −0.02.
At a low welding speed, the welds with the highest tensile strength thus have values of rarc near 1 and Sarc near zero. Thereby, an rarc ratio of 1 in combination with a low standard deviation Sarc, which is related to a very regular arc texture formation, produces the best results both visually and in terms of the ultimate tensile strength.
3.3. Correlations between the Surface Topography, the Elongation at Break, and the Hardness
For the investigation of the interrelations between the surface topography with the elongation at the break, all of the 54 welding experiments performed were taken into account and no outliners were removed. Notable correlations for the mean flash height fm (PCC = 0.57), the mean seam underfill um (PCC = 0.67), and the arc texture ratio rarc (PCC = −0.69) were found only at a welding speed of 500 mm/min. The correlations between the topographical parameters and the elongation at break were thus much less pronounced than for ultimate tensile strength. While the correlations between the topography and ultimate tensile strength in this thesis can be explained plausibly on geometric effects such as the reduction of the joining cross-section, the explanation of the reason for the correlations with the elongation at break is more difficult and is suspected to originate in the microstructure of the welds. For an increasing flash height, a higher seam underfill, and a lower arc texture ratio, a tendency towards a higher elongation at break was observed. These effects on the topography tend to be associated with a higher welding temperature, which in turn affects the microstructure of the welds. At higher welding speeds, there were no notable correlations between the topography and the elongation at the break.
For the investigation of the connections between the surface topography and the Vickers hardness, all 54 welding experiments performed were taken into account. A significant correlation could only be found for the surface texture rarc (PCC = −0.53). Here, at a welding speed of 500 mm/min, an increasing arc texture ratio rarc resulted in a decreasing hardness. At higher welding speeds there were no noteworthy correlations.
The correlations for elongation at break and hardness were therefore not high enough to recommend the surface topography as a monitoring tool for these mechanical properties.
4. Discussion
Since FSW seams usually have a large surface area due to the imprint of the tool shoulder, it is easily possible to describe and quantify the surface properties for this welding process [11]. In the present work, the interrelations between the surface topography and the mechanical properties of friction stir welds were investigated and quantified for the first time. There are indications in the state of the art that there could be correlations [13,14], which were further assessed in this work. Pronounced relations were found between the surface topography and the ultimate tensile strength. For the elongation at break and the Vickers hardness of the welds, the connections are much less distinct. The correlations with regard to the ultimate tensile strength were also limited: firstly, the correlations become lower at higher welding speeds, which is probably due to the increasing irregularity of the material flow around the probe at higher welding speeds; secondly, if the tool rotational speed is too low or too high, internal weld seam defects and irregularities occur, which cannot be detected via the seam surface. However, if the welding speed is sufficiently low, there are pronounced correlations between the surface topography and the ultimate tensile strength over a wide range of tool rotational speeds. There are especially high correlations between the seam underfill and the ultimate tensile strength. In addition, it was shown that a high ultimate tensile strength is only achieved if the arc texture formation is very regular and the number of valleys and peaks along the centerline of the weld coincides with the theoretical number of valleys and peaks. This connection also occurs especially at low welding speeds.
The changes in the topographic properties of the welds at different process parameters are associated with alterations in the physical process variables during the welding process. In friction stir welding, a higher tool rotational speed or a lower welding speed usually leads to a higher welding temperature [28]. The higher welding temperature leads to a stronger local softening of the material, such that it is displaced from the weld, which increases the flash formation and the seam underfill [7]. Furthermore, according to Zuo et al. [10], a higher welding temperature increases the softening of the materials and reduces the resistance of the tool, which makes the joining process smoother and decreases the surface roughness. This also reduces the rarc ratio employed in this work to quantify the surface arc texture. Due to these associations of the surface topography of the weld seam with the welding temperature, there could also be correlations between the topography and the microstructure of the welds, which is highly dependent on the welding temperature [29]. This should be examined in future work.
Based on this work, the development and integration of a topography monitoring system for friction stir welds to support the determination of the acceptance of welded parts can be recommended. Other monitoring systems such as a force or torque monitoring system should be supplemented by this method. However, since internal defects cannot be detected, other monitoring systems cannot be completely replaced by a topography monitoring system. However, especially for high-tech applications, such as in the aerospace industry or electromobility, the additional monitoring of the surface topography seems to be interesting due to its sensitivity to small changes in the ultimate tensile strength.
5. Conclusions
To analyze the correlations between the surface topography and the mechanical properties, 54 FSW experiments were performed. In the position-controlled processes, the welding speed vs and the tool rotational speed n were varied. The main conclusions were:
- At low welding speeds, there are pronounced correlations between the surface topography and the ultimate tensile strength for a wide range of tool rotational speeds. This is especially the case for the seam underfill.
- The ultimate tensile strength will only reach a maximum value if the counted number of valleys and peaks along the centerline of the weld is the same as the theoretical one.
- Particularly for high-tech applications in the aerospace industry and in electromobility, monitoring the surface topography is an additional possibility for the inspection of the weld quality.
In future works, a sophisticated machine-learning-based regression model for the non-destructive prediction of the ultimate tensile strength based on the topography will be developed. Additionally, Widener et al. [30] found that some surface defects have an influence on the fatigue behavior. Therefore, future studies should explore whether there are quantifiable correlations between the surface topography and the fatigue behavior.
Author Contributions
Conceptualization, R.H.; methodology, R.H.; validation, R.H. and F.V.; formal analysis, R.H. and F.V.; investigation, R.H. and F.V.; resources, R.H. and M.F.Z.; data curation, R.H. and F.V.; writing—original draft preparation, R.H.; writing—review and editing, R.H.; visualization, R.H.; supervision, M.F.Z.; project administration, R.H.; funding acquisition, R.H. and M.F.Z. All authors have read and agreed to the published version of the manuscript.
Funding
The IGF-research project no. 21161 N of the “Research Association on Welding and Allied Processes of the DVS” has been funded by the AiF within the framework for the promotion of industrial community research (IGF) of the Federal Ministry for Economic Affairs and Energy on the basis of a decision by the German Bundestag.
Conflicts of Interest
The authors declare that they have no conflict of interest.
Appendix A

Table A1.
Welding experiments performed and mechanical properties achieved for a welding speed vs of 500 mm/min.
Table A1.
Welding experiments performed and mechanical properties achieved for a welding speed vs of 500 mm/min.
| Exp. | n | n/vs | HV | |||
|---|---|---|---|---|---|---|
| no. | min−1 | mm−1 | MPa | - | HV 0.05 | |
| vs = 500 mm/min | 1 | 500 | 1.0 | 127 | 2.4 | 67 |
| 2 | 700 | 1.4 | 170 | 2.3 | 73 | |
| 3 | 900 | 1.8 | 233 | 4.0 | 84 | |
| 4 | 1100 | 2.2 | 238 | 4.1 | 86 | |
| 5 | 1300 | 2.6 | 239 | 4.2 | 85 | |
| 6 | 1500 | 3.0 | 239 | 4.1 | 91 | |
| 7 | 1700 | 3.4 | 239 | 4.4 | 90 | |
| 8 | 1900 | 3.8 | 238 | 4.2 | 91 | |
| 9 | 2100 | 4.2 | 238 | 4.3 | 92 | |
| 10 | 2300 | 4.6 | 236 | 4.5 | 90 | |
| 11 | 2500 | 5.0 | 236 | 4.2 | 86 | |
| 12 | 2700 | 5.4 | 236 | 4.5 | 88 | |
| 13 | 2900 | 5.8 | 234 | 4.4 | 91 | |
| 14 | 3100 | 6.2 | 234 | 4.4 | 90 | |
| 15 | 3300 | 6.6 | 233 | 4.4 | 84 | |
| 16 | 3500 | 7.0 | 234 | 4.4 | 90 | |
| Average: | 225 | 4.1 | 86 | |||
Table A2.
Welding experiments performed and mechanical properties achieved for a welding speed vs of 1000 mm/min.
Table A2.
Welding experiments performed and mechanical properties achieved for a welding speed vs of 1000 mm/min.
| Exp. | n | n/vs | HV | |||
|---|---|---|---|---|---|---|
| no. | min−1 | mm−1 | MPa | - | HV 0.05 | |
| vs = 1000 mm/min | 17 | 1100 | 1.1 | 245 | 4.3 | 74 |
| 18 | 1300 | 1.3 | 247 | 3.7 | 81 | |
| 19 | 1500 | 1.5 | 248 | 3.9 | 87 | |
| 20 | 1700 | 1.7 | 249 | 3.7 | 80 | |
| 21 | 1900 | 1.9 | 250 | 3.6 | 88 | |
| 22 | 2100 | 2.1 | 250 | 3.6 | 88 | |
| 23 | 2300 | 2.3 | 251 | 3.8 | 90 | |
| 24 | 2500 | 2.5 | 250 | 3.7 | 82 | |
| 25 | 2700 | 2.7 | 249 | 3.8 | 95 | |
| 26 | 2900 | 2.9 | 251 | 3.8 | 89 | |
| 27 | 3100 | 3.1 | 249 | 3.7 | 89 | |
| 28 | 3300 | 3.3 | 246 | 3.7 | 85 | |
| 29 | 3500 | 3.5 | 246 | 3.8 | 91 | |
| 30 | 3700 | 3.7 | 245 | 3.8 | 96 | |
| 31 | 3900 | 3.9 | 244 | 4.0 | 82 | |
| 32 | 4100 | 4.1 | 244 | 4.0 | 90 | |
| 33 | 4300 | 4.3 | 247 | 3.8 | 84 | |
| 34 | 4500 | 4.5 | 245 | 3.7 | 88 | |
| 35 | 4700 | 4.7 | 236 | 2.9 | 79 | |
| 36 | 4900 | 4.9 | 225 | 1.9 | 91 | |
| Average: | 246 | 3.6 | 86 | |||
Table A3.
Welding experiments performed and mechanical properties achieved for a welding speed vs of 1500 mm/min.
Table A3.
Welding experiments performed and mechanical properties achieved for a welding speed vs of 1500 mm/min.
| Exp. | n | n/vs | HV | |||
|---|---|---|---|---|---|---|
| no. | min−1 | mm−1 | MPa | - | HV 0.05 | |
| vs = 1500 mm/min | 37 | 1500 | 1.0 | 252 | 3.7 | 80 |
| 38 | 1700 | 1.1 | 255 | 3.4 | 81 | |
| 39 | 1900 | 1.3 | 255 | 3.1 | 85 | |
| 40 | 2100 | 1.4 | 254 | 3.0 | 88 | |
| 41 | 2300 | 1.5 | 255 | 3.0 | 85 | |
| 42 | 2500 | 1.7 | 256 | 3.2 | 84 | |
| 43 | 2700 | 1.8 | 257 | 3.3 | 89 | |
| 44 | 2900 | 1.9 | 257 | 3.5 | 87 | |
| 45 | 3100 | 2.1 | 257 | 3.7 | 88 | |
| 46 | 3300 | 2.2 | 255 | 3.7 | 90 | |
| 47 | 3500 | 2.3 | 253 | 3.7 | 78 | |
| 48 | 3700 | 2.5 | 254 | 3.6 | 83 | |
| 49 | 3900 | 2.6 | 253 | 3.7 | 83 | |
| 50 | 4100 | 2.7 | 250 | 3.7 | 85 | |
| 51 | 4300 | 2.9 | 251 | 3.8 | 93 | |
| 52 | 4500 | 3.0 | 253 | 3.9 | 82 | |
| 53 | 4700 | 3.1 | 253 | 4.0 | 89 | |
| 54 | 4900 | 3.3 | 248 | 4.1 | 92 | |
| Average: | 254 | 3.6 | 86 | |||
References
- Thomas, W.M.; Nicholas, E.D.; Needham, J.C.; Murch, M.G.; Temple-Smith, P. Improvements Relating to Friction Welding. European Patent Specifications 0 615 480 B1, 8 November 1995. [Google Scholar]
- German Institute for Standardization. Friction Stir Welding—Aluminium—Part 1: Vocabulary; Trilingual Version; Beuth Verlag GmbH: Berlin, Germany, 2011; DIN EN ISO 25239-4. [Google Scholar]
- Lohwasser, D.; Chen, Z. Introduction. In Friction Stir Welding—From Basics to Applications; Lohwasser, D., Chen, Z., Eds.; Woodhead Publishing Limited and CRC Press LLC: Cambridge, UK, 2010; pp. 1–12. ISBN 978-1-84569-450-0. [Google Scholar]
- Colligan, K.J. The friction stir welding process: An overview. In Friction Stir Welding—From Basics to Applications; Lohwasser, D., Chen, Z., Eds.; Woodhead Publishing Limited and CRC Press LLC: Cambridge, UK, 2010; pp. 15–41. ISBN 978-1-84569-450-0. [Google Scholar]
- Richter, B. Robot-based Friction Stir Welding for E-mobility and General Applications. Biul. Inst. Spaw. 2017, 103–110. [Google Scholar] [CrossRef] [Green Version]
- Das, B.; Pal, S.; Bag, S. Monitoring of friction stir welding process using weld image information. Sci. Technol. Weld. Join. 2016, 21, 317–324. [Google Scholar] [CrossRef]
- Zettler, R.; Vugrin, T.; Schmuecker, M. Effects and defects of friction stir welds. In Friction Stir Welding—From Basics to Applications; Lohwasser, D., Chen, Z., Eds.; Woodhead Publishing Limited and CRC Press LLC: Cambridge, UK, 2010; pp. 245–276. ISBN 978-1-84569-450-0. [Google Scholar]
- German Institute for Standardization. Friction Stir Welding—Aluminium—Part 5: Quality and Inspection Requirements; German Version; Beuth Verlag GmbH: Berlin, Germany, 2011; DIN EN ISO 25239-5. [Google Scholar]
- Sinha, P.; Muthukumaran, S.; Sivakumar, R.; Mukherjee, S.K. Condition monitoring of first mode of metal transfer in friction stir welding by image processing techniques. Int. J. Adv. Manuf. Technol. 2008, 484–489. [Google Scholar] [CrossRef]
- Zuo, L.; Zuo, D.; Zhu, Y.; Wang, H. Effect of process parameters on surface topography of friction stir welding. Int. J. Adv. Manuf. Technol. 2018, 1807–1816. [Google Scholar] [CrossRef]
- Hartl, R.; Bachmann, A.; Liebl, S.; Zens, A.; Zaeh, M.F. Automated surface inspection of friction stir welds by means of structured light projection. IOP Conf. Ser. Mater. Sci. Eng. 2019, 12035. [Google Scholar] [CrossRef]
- Hartl, R.; Praehofer, B.; Zaeh, M.F. Prediction of the surface quality of friction stir welds by the analysis of process data using Artificial Neural Networks. Proc. Inst. Mech. Eng. Part L J. Mater. Des. Appl. 2020, 234, 732–751. [Google Scholar] [CrossRef]
- Rajashekar, R.; Rajaprakash, B.M. Development of a model for friction stir weld quality assessment using machine vision and acoustic emission techniques. J. Mater. Proc. Technol. 2016, 229, 265–274. [Google Scholar] [CrossRef]
- Sudhagar, S.; Sakthivel, M.; Ganeshkumar, P. Monitoring of friction stir welding based on vision system coupled with Machine learning algorithm. Measurement 2019, 144, 135–143. [Google Scholar] [CrossRef]
- Russell, D.A.; Hanson, J.D.; Ott, E. Dimension of Strange Attractors. Phys. Rev. Lett. 1980, 45, 1175–1178. [Google Scholar] [CrossRef]
- Katz, M.J. Fractals and the analysis of waveforms. Comput. Biol. Med. 1988, 18, 145–156. [Google Scholar] [CrossRef]
- Huang, W.; Kovacevic, R. A laser-based vision system for weld quality inspection. Sensors 2011, 11, 506–521. [Google Scholar] [CrossRef] [PubMed]
- The MathWorks Inc. Matlab; The MathWorks Inc.: Natick, MA, USA, 2019. [Google Scholar]
- Brenner, P.; Kostron, H. Über die Vergütung der Aluminium-Magnesium-Silizium-Legierungen (Translated title: “On the tempering of aluminum-magnesium-silicon alloys”). Z. Metallkde. 1939, 4, 89–97. [Google Scholar]
- Bachmann, A.; Krutzlinger, M.; Zaeh, M.F. Influence of the welding temperature and the welding speed on the mechanical properties of friction stir welds in EN AW-2219-T87. IOP Conf. Ser. Mater. Sci. Eng. 2018, 12016. [Google Scholar] [CrossRef]
- German Institute for Standardization. Testing of Metallic Materials—Tensile Test Pieces; Beuth Verlag GmbH: Berlin, Germany, 2016; DIN 50125:2016-12. [Google Scholar]
- German Institute for Standardization. Destructive Tests on Welds in Metallic Materials—Transverse Tensile Test, German Version; Beuth Verlag GmbH: Berlin, Germany, 2013; DIN EN ISO 4136. [Google Scholar]
- German Institute for Standardization. Metallic Materials—Tensile Testing—Part 1: Method of Test at Room Temperature, German Version; Beuth Verlag GmbH: Berlin, Germany, 2017; DIN EN ISO 6892-1:02. [Google Scholar]
- Vander Voort, G.F. Metallography and Microstructures, 9th ed.; ASM International: Almere, The Netherlands, 2004; ISBN 978-0871707062. [Google Scholar]
- Suenger, S.; Kreissle, M.; Kahnert, M.; Zaeh, M.F. Influence of Process Temperature on Hardness of Friction Stir Welded High Strength Aluminum Alloys for Aerospace Applications. Procedia CIRP 2014, 24, 120–124. [Google Scholar] [CrossRef] [Green Version]
- German Institute for Standardization. Metallic Materials—Vickers Hardness Test—Part 1: Test Method, German Version; Beuth Verlag GmbH: Berlin, Germany, 2018; EN ISO 6507-1:2018. [Google Scholar]
- Pearson, K. Notes on regression and inheritance in the case of two parents. Proc. R. Soc. Lond. 1895, 58, 240–242. [Google Scholar]
- Schneider, J.A. Chapter 3: Temperature Distribution and Resulting Metal Flow. In Friction Stir Welding and Processing; Mahoney, M.W., Mishra, R.S., Eds.; ASM International: Russell, OH, USA, 2007; pp. 37–49. ISBN 978-0-87170-848-9. [Google Scholar]
- Bachmann, A.; Gigl, T.; Hugenschmidt, C.P.; Zaeh, M.F. Characterization of the microstructure in friction stir welds of EN AW-2219 using coincident Doppler-broadening spectroscopy. Mater. Charact. 2019, 149, 143–152. [Google Scholar] [CrossRef]
- Widener, C.A.; Tweedy, B.M.; Burford, D.A. An Investigation of the Effects of Tool Design and Welding Parameters on Fatigue Life in Friction Stir Welded 2024-T3. In Proceedings of the 7th International Symposium on Friction Stir Welding, Awaji, Japan, 20–22 May 2008; TWI Ltd., Ed.; TWI Ltd.: Cambridge, UK, 2008; pp. 1–15, ISBN 978-1903761069. [Google Scholar]
Figure 1.
Sheet metals in the butt-joint configuration with sampling areas for the material tests.

Figure 2.
(a) Geometry and dimensions of the tensile specimens; (b) the evaluated surface topography; (c) the topography along the centerline of the weld.
Figure 2.
(a) Geometry and dimensions of the tensile specimens; (b) the evaluated surface topography; (c) the topography along the centerline of the weld.

Figure 3.
Cross-sections of the experiments 1, 2, 17, and 37 (cf. Appendix A) with visible internal defects.
Figure 3.
Cross-sections of the experiments 1, 2, 17, and 37 (cf. Appendix A) with visible internal defects.

Figure 4.
Ultimate tensile strength Rm (a) as a function of the mean flash height fm and (b) as a function of the standard deviation of the flash height Sf at a welding speed vs of 500 mm/min.
Figure 4.
Ultimate tensile strength Rm (a) as a function of the mean flash height fm and (b) as a function of the standard deviation of the flash height Sf at a welding speed vs of 500 mm/min.

Figure 5.
Ultimate tensile strength Rm as a function of the mean seam underfill um at a welding speed vs of 500 mm/min.
Figure 5.
Ultimate tensile strength Rm as a function of the mean seam underfill um at a welding speed vs of 500 mm/min.

Figure 6.
Ultimate tensile strength Rm as a function of the arc texture ratio rarc at a welding speed vs of 500 mm/min.
Figure 6.
Ultimate tensile strength Rm as a function of the arc texture ratio rarc at a welding speed vs of 500 mm/min.

Figure 7.
Ultimate tensile strength Rm as a function of the arc texture ratio rarc (a) at a welding speed vs of 1000 mm/min and (b) at a welding speed vs of 1500 mm/min.
Figure 7.
Ultimate tensile strength Rm as a function of the arc texture ratio rarc (a) at a welding speed vs of 1000 mm/min and (b) at a welding speed vs of 1500 mm/min.

Figure 8.
Ultimate tensile strength Rm as a function of the standard deviation of the arc texture ratio Sarc at a welding speed vs of 500 mm/min.
Figure 8.
Ultimate tensile strength Rm as a function of the standard deviation of the arc texture ratio Sarc at a welding speed vs of 500 mm/min.

Table 1.
Surface characteristics, which were correlated to the mechanical properties.
| Surface Feature | Key Indicator 1 | Key Indicator 2 |
|---|---|---|
| Flash formation | Mean flash height fm | Standard deviation of the flash height Sf |
| Seam underfill | Mean seam underfill um | Standard deviation of the seam underfill Su |
| Arc texture formation | Ration between the counted number ncount and the theoretical number ntheoret of local valleys and peaks along the weld centerline rarc | - |
© 2020 by the authors. Licensee MDPI, Basel, Switzerland. This article is an open access article distributed under the terms and conditions of the Creative Commons Attribution (CC BY) license (http://creativecommons.org/licenses/by/4.0/).
Share and Cite
MDPI and ACS Style
Hartl, R.; Vieltorf, F.; Zaeh, M.F. Correlations between the Surface Topography and Mechanical Properties of Friction Stir Welds. Metals 2020, 10, 890. https://doi.org/10.3390/met10070890
AMA Style
Hartl R, Vieltorf F, Zaeh MF. Correlations between the Surface Topography and Mechanical Properties of Friction Stir Welds. Metals. 2020; 10(7):890. https://doi.org/10.3390/met10070890
Chicago/Turabian StyleHartl, Roman, Fabian Vieltorf, and Michael F. Zaeh. 2020. "Correlations between the Surface Topography and Mechanical Properties of Friction Stir Welds" Metals 10, no. 7: 890. https://doi.org/10.3390/met10070890
Note that from the first issue of 2016, this journal uses article numbers instead of page numbers. See further details here.