Effect of Trace Elements on the Crystallization Temperature Interval and Properties of 5xxx Series Aluminum Alloys

1
School of Materials Science and Engineering & Henan Key Laboratory of Advanced Magnesium Alloy & Key Laboratory of Materials Processing and Mold Technology (Ministry of Education), Zhengzhou University, 100 Science Road, Zhengzhou 450001, China
2
Center for Advanced Analysis & Computational Science, Zhengzhou University, 100 Science Road, Zhengzhou 450001, China
*
Authors to whom correspondence should be addressed.
Metals 2020, 10(4), 483; https://doi.org/10.3390/met10040483
Submission received: 22 February 2020
/
Revised: 20 March 2020
/
Accepted: 25 March 2020
/
Published: 5 April 2020
Abstract
:The influence of alloying elements Er, Zr, Cu, Si and Zn on the crystallization temperature interval, microstructure, mechanical properties and corrosion behavior of Al-Mg-Mn alloy were studied by differential scanning calorimetry (DSC), electron backscatter diffraction (EBSD), X-ray diffraction (XRD), tensile testing, electrochemical measurements and nitric acid mass loss test (NAMLT). The results show that the crystallization temperature range of Al-Mg-Mn alloy with addition of Zn decreased 4.7 °C. Cold rolled alloys mainly contain S texture, Copper texture, Brass texture, and Goss texture; the content of the S texture is the highest. With the addition of trace elements, the second phase Al3Er, Al3Zr, Al2CuMg, Mg2Si and MgZn2 can be formed, which can improve the tensile strength and yield strength of Al-Mg-Mn alloy. The addition of the alloying element Zn can also improve the intergranular corrosion resistance of the Al-Mg-Mn alloy.
1. Introduction
Al-Mg alloys are widely used in machinery, ship, automobile and other industries, due to its medium strength, high specific strength, good forming property and corrosion resistance [1,2,3]. Al-Mg series alloys are non-heat-treated strengthening alloys. At present, the main strengthening methods are work hardening and microalloying.
At present, the production of high-performance aluminum alloy sheets at home and abroad is mainly based on the traditional open billet hot rolling method. The alloys produced in this way are not limited, and the product range is wide; the internal structural properties, surface quality and processing properties of the products are good. Therefore, it is the most widely used. However, the production process has its own inherent shortcomings: long process flow, long production cycle, high energy consumption, high cost, and easy to appear bubbles on the board.
The continuous casting and rolling process is a new and efficient aluminum alloy sheets strip production process. It directly feeds the aluminum melt into a high-speed continuous casting machine for casting and then directly rolls it to a 2~8 mm sheets strip by hot rolling. Compared with the traditional open billet hot rolling process, it has the advantages of short process, low energy consumption, low cost and high efficiency.
Due to its high magnesium content, the 5xxx aluminum alloy has a large crystallization temperature range and poor fluidity. When the 5xxx aluminum alloys are produced by the continuous casting and rolling process, due to their large flow rate and fast cooling rate, the composition of the cast structure is uneven, the grain size varies greatly from surface to center, and there is looseness or even inclusion between the central regions. This defect is inherited into the subsequent finished board, reducing the formability of the sheet.
In order to solve the above problems, our method is realized by microalloying, that is, by introducing alloying elements to ensure that the mechanical properties and corrosion properties of the alloy are substantially unchanged, or slightly increased, and the magnesium content in the alloy is lowered, so that the crystallization temperature range of 5xxx aluminum alloy is reduced, and it is expected to develop a new type of customized 5xxx alloy, which is suitable for the production needs of continuous casting and rolling processes.
A small amount of Mn is usually added to the Al-Mg alloy, and Mn mainly acts as a solid solution strengthening. At the same time, increasing the Mn content in the alloy can refine the grain size [4,5]. Numerous studies have shown that the most effective alloying element in aluminum alloys is Sc. The addition of Sc in the Al-Mg alloy can refine the crystal grains and improve the strength and hardness of the alloy [3,6,7]. However, due to the high price of Sc, it is not conducive to industrial production, so the search for alternative elements has become the research direction of researchers. Some studies have shown that Er is an effective substitute for Sc [8,9]. Studies have shown that the addition of Er to the Al-Mg alloy can refine the grains [10,11] and increase the strength of the alloy [12]. The Al3Er phase formed by adding a trace amount of Er element to the aluminum alloy can suppress grain growth and increase the hardness and recrystallization temperature of the cold rolled alloy [13]. However, the solubility of Er in α-Al is only about 0.28wt.%, and the strengthening is limited [14]. Therefore, it is hoped that Zr can be added together with Er to enhance the strengthening effect of the alloy. At present, composite microalloying is increasingly being paid attention to in research. The most significant strengthening effect was achieved by combination of Sc and Zr. Combined Sc/Zr-additions lead to the formation of Al3(Sc, Zr) [15], Al3(Sc, Zr) particles can significantly refine grains, inhibit recrystallization, and increase alloy strength [5,16,17,18,19,20,21,22]. Adding Sc and Zr can decrease corrosion current density and improve exfoliation corrosion resistance [5]. When Zn is added to aluminum alone, the strength of the aluminum alloy is very limited under deformation conditions, and there is a tendency of stress corrosion cracking, thus limiting its application. Simultaneous addition of zinc and magnesium to aluminum forms a strengthening phase of MgZn2, which produces a significant strengthening effect on the alloy. The corrosion resistance and strength of Al-Mg alloy can be improved by adding a small amount of Zn [23,24,25,26,27]. Copper is the main alloying element of 2xxx series and 7xxx series aluminum alloy. Copper can be combined with Al and Mg elements to form Al2Cu and Al2CuMg strengthening phases to improve the mechanical properties of the alloy. The addition of Cu to the Al-Mg alloy significantly improves strength, ductility and formability and improves intergranular corrosion behavior of Al-Mg alloys with high Mg [28,29]. The Cu additions refine the grain of the as-extruded Al-Mg alloy [11]. Si is added to form Mg2Si strengthening phase in the Al-Mg alloy and increase the strength of the alloy. However, the particles are anodes relative to the substrate, which accelerate the rate of corrosion of the alloy [26,30,31,32].
The purpose of this work was to investigate the way of existence of microalloying elements in Al-Mg-Mn alloys and their interaction with the main alloying element Mg. The influence mechanism of the second phase on the crystallization temperature range, microstructure, mechanical properties and corrosion behavior of Al-Mg-Mn alloy was investigated.
2. Materials and Methods
The experimental alloys were cast by semi-continuous casting. The experimental Al-Mg-Mn series alloys were prepared with commercial 99.99wt.% high purity aluminum and 99.9wt.% industrial pure magnesium, pure zinc and pure silicon, with Al-10Mn, Al-20Er, Al-4.52Zr and Al-50Cu (wt.%) master alloy. Appropriate amounts of the starting materials were melted in a crucible by heating the surrounding furnace to 760 °C. Subsequently, the liquid metal was poured in a cast iron mold at about 720 °C. The nominal compositions of the alloys are shown in Table 1. The as-cast alloys were homogenized at 460 °C for 24 h to eliminate segregation, then cold rolled to plates with 2 mm thick. The Al-3Mg-0.5Mn-0.2Cu ingot is extremely high in hardness, which leads to a decrease in the plastic deformation ability of the alloy during rolling. In this experiment, the Al-3Mg-0.5Mn-0.2Cu ingot is annealed at 400 °C for 1 h, cold rolling is performed after air cooling to room temperature.
The cold rolled sample was mechanically and electrolytically polished to prepare a sample for EBSD analysis. EBSD analysis was carried by Zeiss Auriga FIB SEM (Zeiss, Jena, Germany). The electrolyte composition is 10% perchloric acid and 90% absolute ethanol. Due to the large deformation of the cold-rolled alloy and the severe stress concentration, it will affect the EBSD signal collection. To this end, we use the Ion Beam Milling System Leica EM RES102 (Leica, Wetzlar, Germany) to surface-treat the polished alloy.
X-ray diffraction (XRD) analysis was carried by Panalytical Empyrean XRD system (Panalytical, Almelo, The Netherlands) using Cu Kα radiation for identifying the phase composition in cold rolled alloys. The scan was made between the angular range of 5°~90°, with the X-ray generator power set at 45 kV and 40 mA.
Thermal analysis was conducted by means of differential scanning calorimetry using a calorimeter STA 449F3 from Netzsch produced by Germany. The range of temperature rise was 25~800 °C, and the heating rate was 10 k/min.
The tensile specimens were machined according to GB/T 16865-2013 size specifications [33]. The alloys were subjected to a tensile test at room temperature using a SHIMADZU AG-IC 50KN tensile testing machine (Shimadzu, Kyoto, Japan) to determine its mechanical properties. The tensile direction was parallel to the rolling direction, tensile specimens with a gauge length of 25 mm and a width of 6 mm, and the strain rate was 2.5 × 10⁻⁴ s−1. Three samples were taken from each alloy, and its average value was taken as the experimental result.
The polarization curve was measured on the RST5200F electrochemical workstation (Shiruisi, Zhengzhou, China), and the samples were polished by sandpaper, mechanical polishing, deionized water cleaning, alcohol ultrasonic cleaning and blow-drying with a blower. The effective working area of the sample was 0.64 cm2. The three-electrode test system was used, the working electrode was the exposed surface of the sample, the counter electrode was a platinum electrode, and the reference electrode was a saturated calomel electrode. The medium solution used in the experiment was 3.5 wt.% NaCl solution, and the scanning rate was 1 mv/s.
Nitric acid mass loss test (NAMLT) was used to evaluate the susceptibility to IGC in terms of the degree of sensitization (DoS) as guided by ASTM G67 standard practice [34].
3. Results and Discussion
3.1. Microstructure Analysis
EBSD technology is mainly to determine the crystal orientation of a certain area of the material and cannot directly obtain the microstructure and structure information of the material. The orientation information of the obtained material can be reconstructed into the orientation imaging image (OIM) by using Channel 5 software (HKL Channel 5, Oxford Instruments, Abingdon, Oxfordshire, UK). Different orientations correspond to the corresponding colors, which can clearly reflect the microstructure and texture of the material. After plastic deformation, as the degree of deformation increases, the original equiaxed grains will gradually elongate in the direction of their deformation. When the amount of deformation is large, the crystal grains become blurred, and the crystal grains are hard to distinguish and present a piece of fiber-like streaks, which is called fiber structure. The direction in which the fibers are distributed is the direction in which the material flows and expands. Figure 1 is the EBSD diagram of the cold-rolled alloy. It can be seen from Figure 1 that after the cold-rolled alloy is deformed by a large deformation (90%), the grains of the alloy are severely elongated, broken and distributed in a fiber-like manner along the RD direction. In Figure 1a–c,f, mesh-shaped shear bands were formed, the shear bands marked by black arrows. It is at an angle of 30°~45° with the rolling direction. Compared with the control Al-3Mg-0.5Mn alloy, the addition of the alloying elements resulted in the refinement of the fiber structure after cold rolling.
The distribution of the misorientation angles for cold rolled alloys are shown in Figure 2. The abscissa indicates the grain orientation difference, and the ordinate indicates the frequency of occurrence. The black and gray lines in Figure 1 represent high angle grain boundaries (HAGBs, misorientation angles greater than 15°) and low angle grain boundaries (LAGBs, misorientation angles between 2° and 15°), respectively. After the 90% deformation of the cold-rolled alloy, the grain orientation difference is mainly concentrated in the range of 2°~10°, and the small-angle grain boundary accounts for a large proportion. This is due to the fact that the rolling deformation causes the grain splitting to result in a small angle grain boundary.
Figure 3 is a recrystallized region distribution map of a cold rolled alloy. The blue region represents recrystallized grains, the red regions represent deformed grains, and the yellow regions represent substructures. The frequency of the three different types of grains is plotted in Figure 4. After the cold-rolled alloy is deformed by 90% deformation, the grain type is mainly the deformation grain (frequency greater than 90%) of the small-angle grain boundary, and there are also some deformation substructures and a small amount of recrystallized grains. The recrystallization of the cold rolled alloy is due to the statistical error of the analytical software and the friction between the rolls and the sheet during rolling, and the heat generated causes partial recrystallization of the alloy.
To study the texture typical of cold rolled alloy, {111}, {110} and {100} pole figures obtained by EBSD are plotted in Figure 5. It can be seen from the level of the polar density distribution in the pole figure that the cold rolled alloys mainly contains S texture {123} <634>, Copper texture {112} <111>, Brass texture {110} <112>, and Goss texture {110} <001>, where the S texture has the strongest density.
The orientation imaging of the cold rolled alloys are shown in Figure 6. Different colors represent different texture types. The content of five typical textures was determined in this paper, and other texture types were classified as random textures. As can be seen from Figure 6, the S texture has the highest content. The S texture content of the Al-3Mg-0.5Mn-0.2Cu alloy is not much changed compared with the Al-3Mg-0.5Mn alloy, and the S texture of other alloys is increased.
Table 2 shows the texture statistics for different cold rolled alloys. This result is consistent with the texture strength in the pole figure of Figure 5.
Figure 7 shows X-ray diffraction (XRD) patterns of cold rolled alloys. As can be seen from Figure 7, in the cold-rolled alloys, in addition to the Al6Mn phase, it is mainly the matrix phase Al. The addition of trace elements forms the second phase Al3Er, Al3Zr, Al2CuMg, Mg2Si, MgZn2, and further contains an AlFeSi impurity phase. These second phases can significantly affect the properties of the cold rolled alloys. Fe and Si are common impurity elements in aluminum and its alloys. Although high-purity aluminum and industrial pure magnesium are used to melt-cast alloys, they may contain trace amounts of Fe, Si elements, and may also be introduced during the smelting process. Since the content of trace elements added in the alloy is only 0.2wt.%, only weak peaks are found in the diffraction pattern of the alloy, which indicates that the content of each phase in the cold rolled alloy is small, and it is difficult to completely determine by XRD.
3.2. As-Cast DSC Analysis
The DSC curve of the as-cast alloys are shown in Figure 8. It can be seen from Figure 8 that with the addition of alloying elements, the DSC curve characteristics of the alloy change, and the peak shape appears to be different. There is a distinct endothermic peak on the heating curve, and there is also a distinct exothermic peak on the cooling curve. These two distinct peaks correspond to the melting and solidification of the alloy.
According to the DSC heating curve, the starting point of the endothermic peak is the solidus temperature, and the starting point of the exothermic peak on the cooling curve is the liquidus temperature [35]. The temperature difference between the two is the crystallization temperature range of the as-cast alloy. The results are shown in Table 3. It can be seen from Table 3 that the Al-3Mg-0.5Mn-0.2Zn alloy with Zn element has the lowest crystallization temperature range. Compared with the Al-3Mg-0.5Mn alloy, the crystallization temperature interval is lowered by 4.7 °C. Thus, the casting properties of the alloy are improved. This is because when Zn is added to the Al-3Mg-0.5Mn alloy, the MgZn2 strengthening phase is formed, and a certain amount of Mg content is consumed, which lowers the crystallization temperature range of the alloy.
3.3. Analysis of Mechanical Properties
Tensile test of the cold-rolled alloy sheet was carried out at room temperature, and the initial strain rate was 2.5 × 10⁻⁴ s−1, the stress-strain curves are shown in Figure 9, and the results are summarized in Figure 10.
As can be observed in Figure 9, the measured stress-strain curve of the sample drifts in the initial stage (elastic deformation stage) since the extensometer is not equipped. However, as all samples are tested with same machine, the influence can be ignored. It can be seen from Figure 10 that the tensile strength and yield strength of the Al-3Mg-0.5Mn alloy are improved after adding a small amount of alloying elements Er, Zr, Cu, Si and Zn. Among them, the strength of Cu-containing alloy is the highest, followed by Zr-containing alloy. The tensile strength are 363 and 359 MPa, which are 31 and 27 MPa higher than the control alloy, respectively.The addition of 0.2wt.% of the Er element cannot refine the crystal grains of the alloy, while the Al3Er second-phase particles formed by it can produce second-phase strengthening. These particles can strongly pin dislocations, increase the tensile strength, and yield strength of the alloy and decrease the elongation. The addition of the Zr element increases its strength and slightly decreases its elongation. When Zr is added to the Al-3Mg-0.5Mn alloy, the grains are refined and the strength is improved. At the same time, due to the refinement of the grains of the alloy, plastic deformation can be carried out in more grains, so that the plasticity of the Al-3Mg-0.5Mn-0.2Zr alloy is improved. In addition, Al3Zr second-phase particles formed in the alloy can cause second-phase strengthening, which can also increase the strength of the alloy and reduce the plasticity of the alloy. The addition of Cu element makes the strength of Al-3Mg-0.5Mn alloy increase most significantly, and its elongation has also improved. This can be explained from the following two aspects: First, add 0.2wt.% Cu element to Al-3Mg-0.5Mn alloy refines the crystal grains of the alloy, which can make the plastic deformation of the cold-rolled alloy more uniform and increase the elongation of the alloy. Besides, Al2CuMg second-phase particles formed in the alloy can strongly pin dislocations, increasing the strength of the alloy and reducing its plasticity. Therefore, the increase of the elongation of Al-3Mg-0.5Mn-0.2Cu alloy is the result of the combined effect of the two. The increase of the strength of the alloy after adding Si element is also due to the fine grain strengthening and the second phase strengthening, with a slight increase in the elongation, but it is not obvious. It is also due to the formation of the second phase particles of Mg2Si, which improves the strength and reduces the plasticity of the alloy at the same time, while the refinement of the grains improves the plasticity of the alloy. The joint action of the two makes the elongation of Al-3Mg-0.5Mn-0.2Si alloy slightly increased, but not significantly. After the addition of Zn, the strength and elongation of the alloy are improved, which is mainly due to the fact that the MgZn2 particles can strongly pin dislocations during the plastic deformation of the alloy, resulting in secondary phase strengthening in Al-3Mg-0.5Mn-0.2Zn alloy.
3.4. Electrochemical Analysis
Figure 11 is the polarization curve of the experimental alloys in a 3.5wt.% NaCl solution. Using the software provided by the electrochemical workstation, the self-corrosion potential and corrosion current density of the experimental alloys were fitted according to the Tafel curve extrapolation method as shown in Table 4. It can be seen from Table 4 that in addition to the Si element, the addition of other alloying elements increases the self-corrosion potential of the Al-Mg-Mn alloy and lowers the corrosion current density, and the corrosion resistance is improved. Among them, the alloy with Cu added has a self-corrosion potential of −0.79 v, which is improved in corrosion resistance compared with the control alloy. Most of the previous studies have shown that the addition of Cu in the Al-Mg alloy leads to a decrease in corrosion resistance, which is inconsistent with the experimental conclusions obtained in this paper. At present, there is still debate about the influence of Cu on the corrosion performance of Al-Mg alloy [36]. The Mg2Si particles formed by adding Si to the Al-3Mg-0.5Mn alloy are anodes with respect to the substrate, which accelerate the corrosion rate of the alloy [31], resulting in reduced corrosion resistance. The addition of Zn element precipitates MgZn2 phase at the grain boundary, and its self-corrosion potential is closer to that of aluminum matrix than that of β (Al3Mg2) phase, so that the potential difference between MgZn2 phase and matrix is smaller, and it is not easy to form a corrosion cell, so that the self-corrosion potential of Al-3Mg-0.5Mn-0.2Zn alloy is 80 mv higher than that of Al-3Mg-0.5Mn alloy, and the corrosion current density is one order lower than that of Al-3Mg-0.5Mn alloy. Thus, the corrosion resistance of the alloy is improved.
3.5. Analysis of Intergranular Corrosion Performance
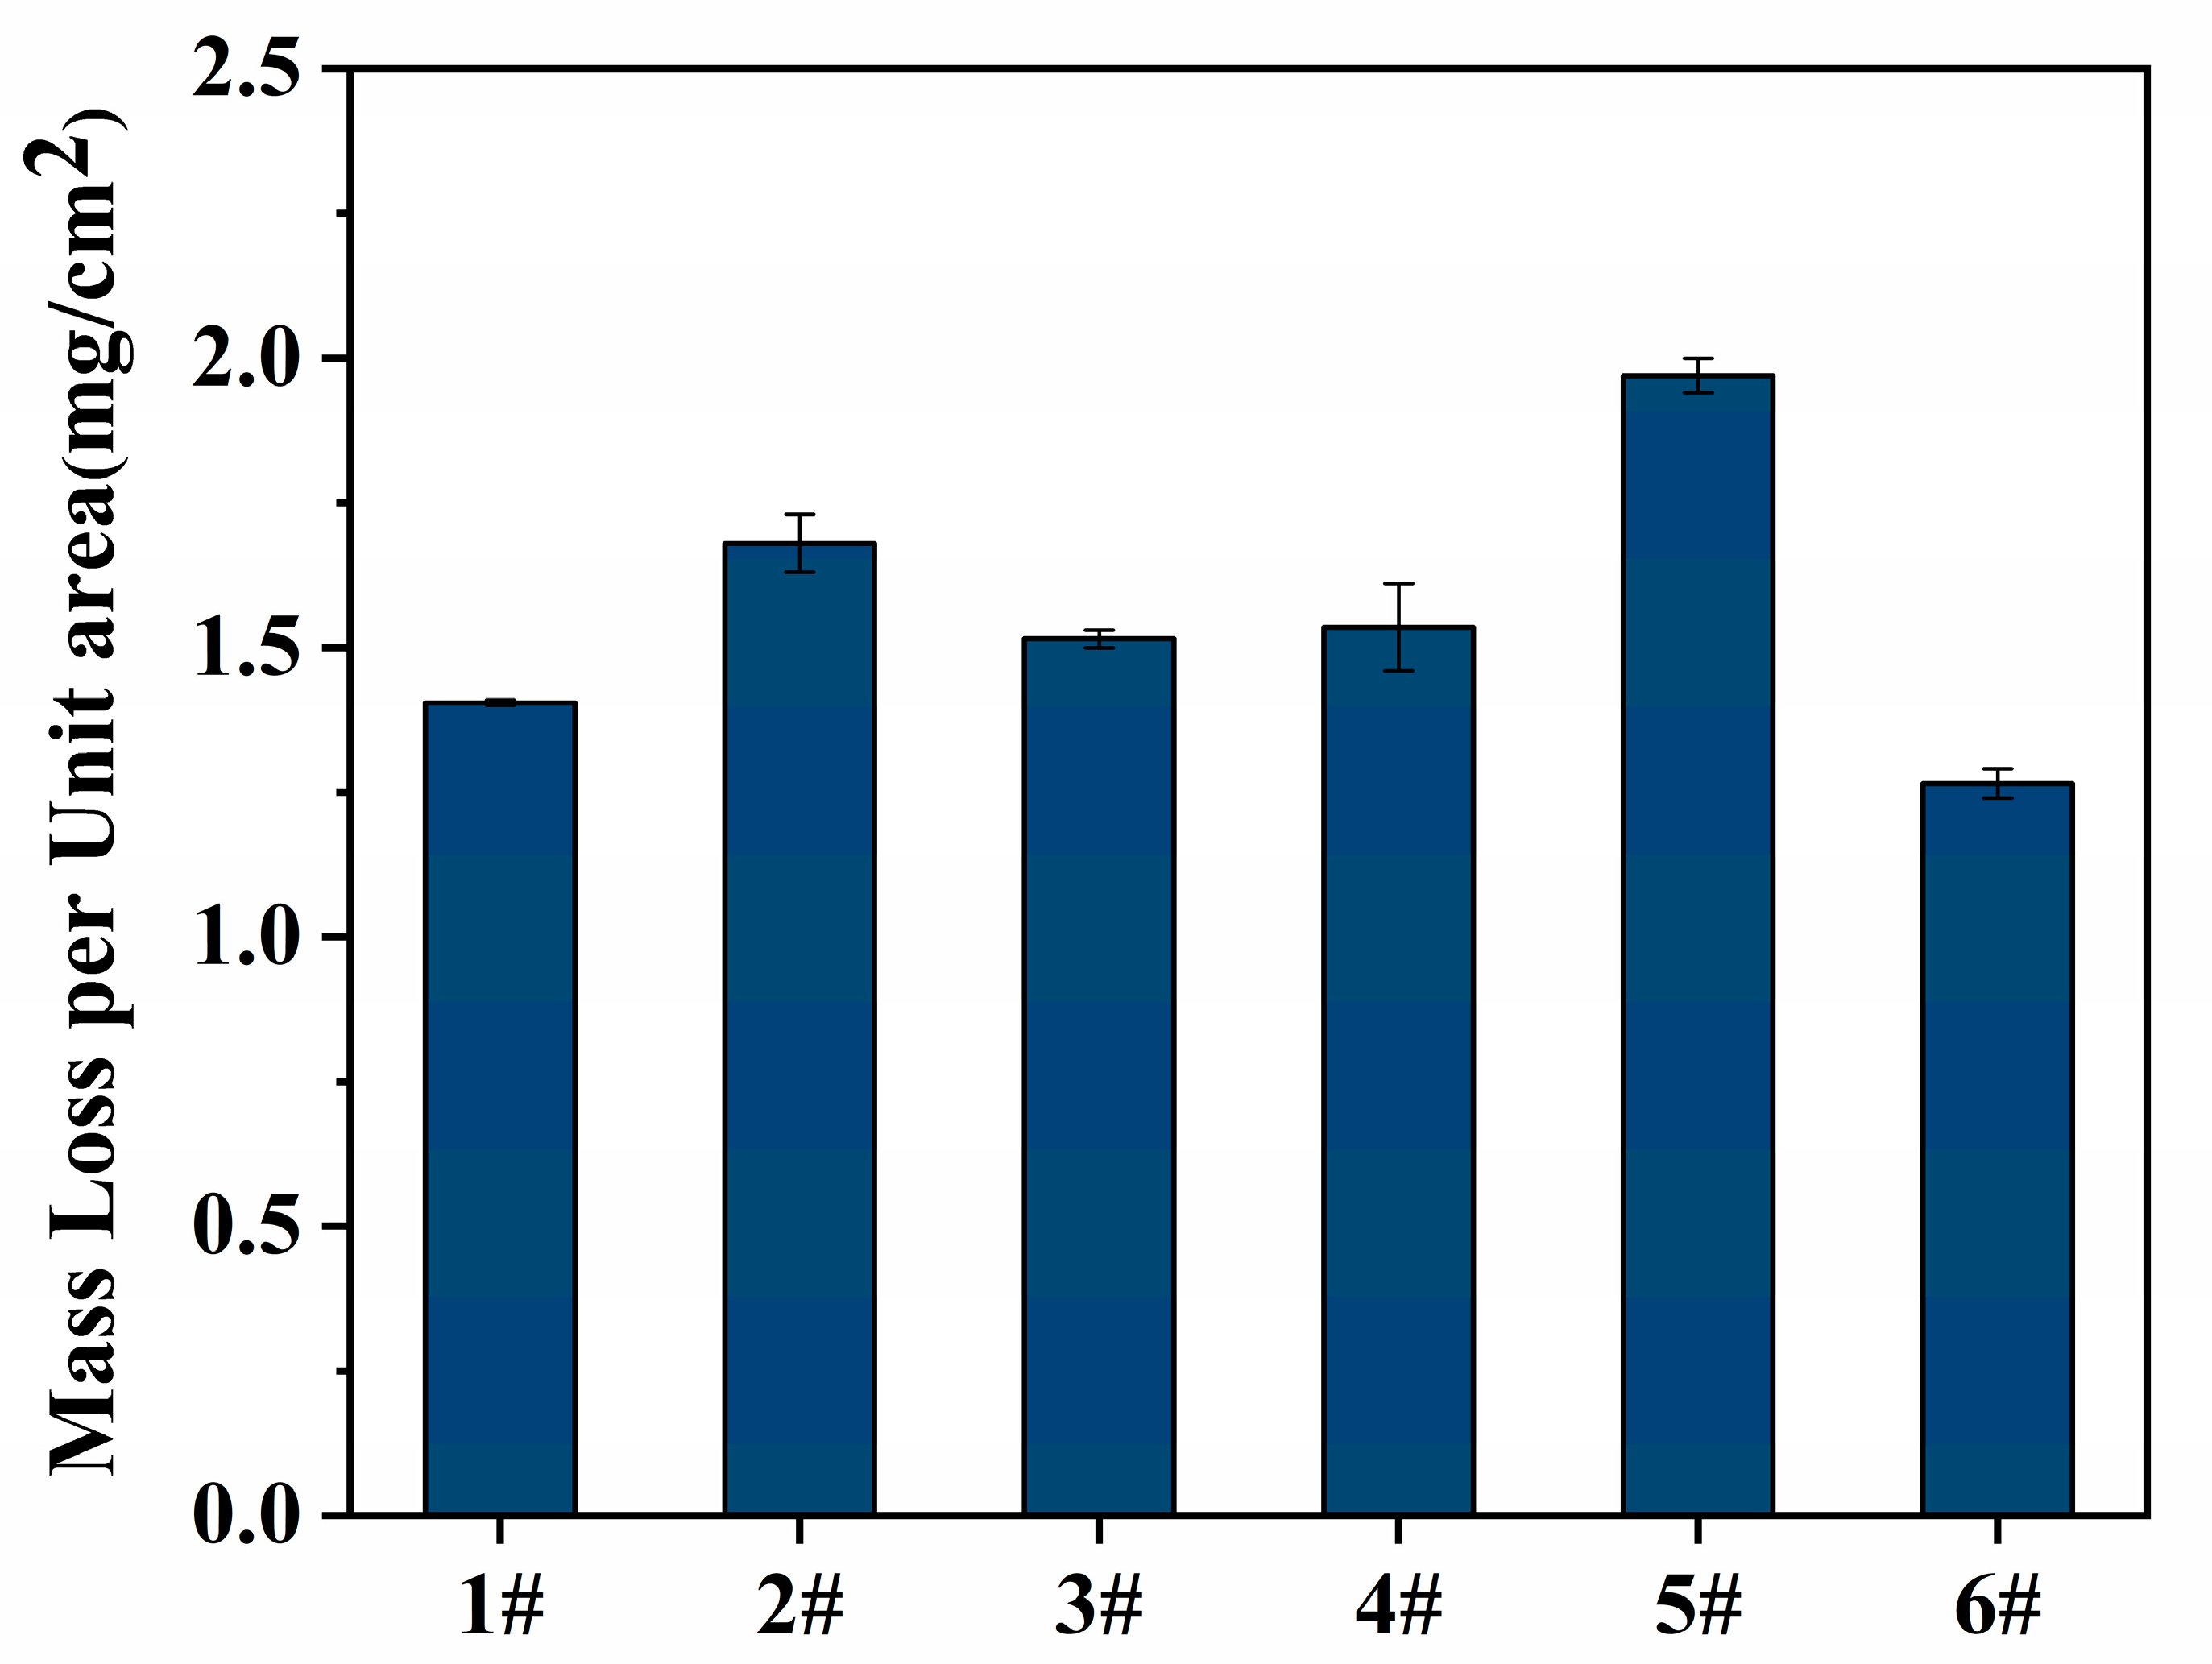
Intergranular corrosion is a locally corroded corrosion phenomenon in which a metal material corrodes along a grain boundary or a grain boundary of a material in a specific corrosive medium, causing a loss of bonding force between the crystal grains. In the homogenization process, the Al3Mg2 phase is precipitated in the alloy. The phase tends to grow on the grain boundary. The electrode potential is lower than that of the matrix, which forms a corrosive galvanic cell with the matrix. The Al3Mg2 phase acts as an anode and preferentially dissolves, causing grain boundaries. corrosion. Alloys resistant to intergranular corrosion have a mass loss of about 1 to 15 mg/cm2 in the NAMLT test. The results of intergranular corrosion of the cold rolled alloys are shown in Figure 12. It can be seen from Figure 12 that after the addition of trace elements, the intergranular corrosion resistance of the alloys does not change much, both being in the range of 1~2 mg/cm2, both less than 15 mg/cm2, belonging to the intergranular corrosion resistant alloy. With the addition of the Er element, the precipitation of Al3Mg2 phase increases accordingly, which increases the grain boundary corrosion current, accelerates the corrosion rate, and deepens the intergranular corrosion depth. The addition of Cu element can significantly change the electrode potential in the solid solution, and the self-corrosion potential of Al2CuMg containing Cu phase is low. The primary cell can be formed between the copper poor area of the grain boundary and the precipitated phase, precipitated phase and matrix of the grain boundary, which reduces the intergranular corrosion resistance of the alloy. The addition of Si can lead to the Mg2Si phase precipitate on the grain boundaries. The self-corrosion potential is lower than that of the β (Al3Mg2) phase. The potential difference between the Mg2Si phase and the matrix becomes larger, and it is easy to form a primary cell. Therefore, the intergranular corrosion resistance of the alloy is reduced. The addition of Zn element precipitated the MgZn2 phase at the grain boundary, and its self-corrosion potential was closer to the self-corrosion potential of the matrix than the β (Al3Mg2) phase. The potential difference between the MgZn2 phase and the matrix is small, and it is not easy to form a galvanic cell. The precipitation of the MgZn2 phase at the grain boundary also suppresses the continuous precipitation of the β (Al3Mg2) phase at the grain boundary, which improves the alloy Intergranular corrosion performance.
4. Conclusions
By studying the influence of Er, Zr, Cu, Si, Zn on the crystallization temperature interval, mechanical properties and corrosion behavior of Al-3Mg-0.5Mn alloy, the following conclusions can be drawn:
1. The grains of the cold rolled alloys are severely stretched, broken and distributed fibers along the RD direction, and a large number of fine grains are sandwiched between the fibrous structures. In the Al-3Mg-0.5Mn alloy, Al-3Mg-0.5Mn-0.2Er alloy, Al-3Mg-0.5Mn-0.2Zr alloy and Al-3Mg-0.5Mn-0.2Zn alloy, a mesh-like shear band is formed. It is distributed at an angle of 30°~45° to the rolling direction. The grain types are mainly deformed grains with a small angle grain boundary (frequency is greater than 90%), and there are some deformed substructures and a small amount of recrystallized grains. The cold rolled alloys mainly contains S texture {123} <634>, Copper texture {112} <111>, Brass texture {110} <112> and Goss texture {110} <001>, of which S texture extreme density is the strongest. The addition of alloying elements increases the content of deformed texture.
2. Al-3Mg-0.5Mn-0.2Zn alloy has the lowest crystallization temperature range. Compared with Al-3Mg-0.5Mn alloy, the crystallization temperature range is reduced by 4.7 °C. The addition of Er, Zr, Cu and Si to Al-3Mg-0.5Mn alloy did not decrease the crystallization temperature range of the alloy but increased it.
3. The addition of trace elements Er, Zr, Cu, Si and Zn all improved the tensile strength and yield strength of Al-3Mg-0.5Mn alloy. Among them, the strength of Cu-containing alloy increased most significantly, followed by Zr-containing alloy. The tensile strength are 363 and 359 MPa, respectively, increased by 31 and 27 MPa. The strengthening mechanism of the alloy containing Er and Zn elements is mainly the second phase strengthening, and the strengthening mechanism of the alloy containing Zr, Cu and Si elements is mainly the fine grain strengthening and the second phase strengthening.
4. In addition to Si, the addition of Er, Zr, Cu, and Zn elements increases the self-corrosion potential of Al-3Mg-0.5Mn alloy, reduces the corrosion current density, and improves the corrosion resistance. After the addition of trace elements, the alloy’s resistance to intergranular corrosion changes little, and the mass loss is in the range of 1~2 mg/cm2, all less than 15 mg/cm2, which belongs to the intergranular corrosion resistant alloy. The addition of the Zn can improve the intergranular corrosion property of the Al-3Mg-0.5Mn alloy.
5. In the experimental range, the Al-3Mg-0.5Mn-0.2Zn alloy has a lower crystallization temperature range and has both good mechanical properties and corrosion resistance, and comprehensive performance is good.
Author Contributions
M.L. and G.L. conceived and designed the experiments; Q.L. and E.Z. performed the experiments; Q.L. and M.L. analyzed the data; Q.L. wrote the paper; S.G. and C.X. reviewed the paper. All authors have read and agreed to the published version of the manuscript.
Funding
This work was supported by National Natural Science Foundation of China (Grant No. 51901207) and China Postdoctoral Science Foundation (Grant No. 2019M662522).
Conflicts of Interest
The authors declare no conflict of interest.
References
- Kramer, L.; Phillippi, M.; Tack, W.T.; Wong, C. Locally Reversing Sensitization in 5xxx Aluminum Plate. J. Mater. Eng. Perform. 2011, 21, 1025–1029. [Google Scholar] [CrossRef]
- Hirsch, J.; Al-Samman, T. Superior light metals by texture engineering: Optimized aluminum and magnesium alloys for automotive applications. Acta Mater. 2013, 61, 818–843. [Google Scholar] [CrossRef]
- Lathabai, S.; Lloyd, P.G. The effect of scandium on the microstructure, mechanical properties and weldability of a cast Al–Mg alloy. Acta Mater. 2002, 50, 4275–4292. [Google Scholar] [CrossRef]
- Court, S.A.; Gatenby, K.M.; Lloyd, D.J. Factors affecting the strength and formability of alloys based on Al–3 wt.% Mg. Mater. Sci. Eng. A 2001, 319, 443–447. [Google Scholar] [CrossRef]
- Peng, Y.Y.; Li, S.; Deng, Y.; Zhou, H.; Xu, G.F.; Yin, Z.M. Synergetic effects of Sc and Zr microalloying and heat treatment on mechanical properties and exfoliation corrosion behavior of Al-Mg-Mn alloys. Mater. Sci. Eng. A 2016, 666, 61–71. [Google Scholar] [CrossRef]
- Zhou, S.A.; Zhang, Z.; Li, M.; Pan, D.J.; Su, H.L.; Du, X.D.; Li, P.; Wu, Y.C. Effect of Sc on microstructure and mechanical properties of as-cast Al–Mg alloys. Mater. Des. 2016, 90, 1077–1084. [Google Scholar] [CrossRef]
- Li, H.; Wang, H.; Liang, X.; Wang, Y.; Liu, H. Effect of Sc and Nd on the Microstructure and Mechanical Properties of Al-Mg-Mn Alloy. J. Mater. Eng. Perform. 2010, 21, 83–88. [Google Scholar] [CrossRef]
- Karnesky, R.A.; Dunand, D.C.; Seidman, D.N. Evolution of nanoscale precipitates in Al microalloyed with Sc and Er. Acta Mater. 2009, 57, 4022–4031. [Google Scholar] [CrossRef]
- Wu, X.L.; Nie, Z.R.; Wen, S.P.; Gao, K.Y.; Huang, H. New Progress on Er-Containing Micro-Alloying Aluminum Alloys. Mater. Sci. Forum 2016, 877, 211–217. [Google Scholar] [CrossRef]
- Pozdniakov, A.V.; Yarasu, V.; Barkov, R.Y.; Yakovtseva, O.A.; Makhov, S.V.; Napalkov, V.I. Microstructure and mechanical properties of novel Al-Mg-Mn-Zr-Sc-Er alloy. Mater. Lett. 2017, 202, 116–119. [Google Scholar] [CrossRef]
- Che, H.; Jiang, X.; Qiao, N.; Liu, X. Effects of Er/Sr/Cu additions on the microstructure and mechanical properties of Al-Mg alloy during hot extrusion. J. Alloys Compd. 2017, 708, 662–670. [Google Scholar] [CrossRef]
- Fu, L.; Peng, Y.Y.; Huang, J.W.; Deng, Y.; Yin, Z.M. Microstructures and mechanical properties of Gas Tungsten Arc Welded joints of new Al–Mg–Sc and Al–Mg–Er alloy plates. Mater. Sci. Eng. A 2015, 620, 149–154. [Google Scholar] [CrossRef]
- Wen, S.P.; Xing, Z.B.; Huang, H.; Li, B.L.; Wang, W.; Nie, Z.R. The effect of erbium on the microstructure and mechanical properties of Al–Mg–Mn–Zr alloy. Mater. Sci. Eng. A 2009, 516, 42–49. [Google Scholar] [CrossRef]
- Xu, G.F.; Mou, S.Z.; Yang, J.J.; Jin, T.N.; Nie, Z.R.; Yin, Z.M. Effect of trace rare earth element Er on Al-Zn-Mg alloy. Trans. Nonferrous Met. Soc. China 2006, 16, 598–603. [Google Scholar] [CrossRef]
- Forbord, B.; Lefebvre, W.; Danoix, F.; Hallem, H.; Marthinsen, K. Three dimensional atom probe investigation on the formation of Al3(Sc,Zr)-dispersoids in aluminium alloys. Scr. Mater. 2004, 51, 333–337. [Google Scholar] [CrossRef] [Green Version]
- Kendig, K.L.; Miracle, D.B. Strengthening mechanisms of an Al-Mg-Sc-Zr alloy. Acta Mater. 2002, 50, 4165–4175. [Google Scholar] [CrossRef]
- Knipling, K.E.; Karnesky, R.A.; Lee, C.P.; Dunand, D.C.; Seidman, D.N. Precipitation evolution in Al–0.1Sc, Al–0.1Zr and Al–0.1Sc–0.1Zr (at.%) alloys during isochronal aging. Acta Mater. 2010, 58, 5184–5195. [Google Scholar] [CrossRef]
- Ikeshita, S.; Strodahs, A.; Saghi, Z.; Yamada, K.; Burdet, P.; Hata, S.; Ikeda, K.I.; Midgley, P.A.; Kaneko, K. Hardness and microstructural variation of Al-Mg-Mn-Sc-Zr alloy. Micron 2016, 82, 1–8. [Google Scholar] [CrossRef]
- Deng, Y.; Xu, G.F.; Yin, Z.M.; Lei, X.F.; Huang, J.W. Effects of Sc and Zr microalloying additions on the recrystallization texture and mechanism of Al–Zn–Mg alloys. J. Alloys Compd. 2013, 580, 412–426. [Google Scholar] [CrossRef]
- Fuller, C.B.; Krause, A.R.; Dunand, D.C.; Seidman, D.N. Microstructure and mechanical properties of a 5754 aluminum alloy modified by Sc and Zr additions. Mater. Sci. Eng. A 2002, 338, 8–16. [Google Scholar] [CrossRef]
- Yang, D.X.; Li, X.Y.; He, D.Y.; Huang, H. Effect of minor Er and Zr on microstructure and mechanical properties of Al–Mg–Mn alloy (5083) welded joints. Mater. Sci. Eng. A 2013, 561, 226–231. [Google Scholar] [CrossRef]
- Wang, Y.; Pan, Q.L.; Song, Y.F.; Li, C.; Li, Z.F.; Chen, Q.; Yin, Z.M. Recrystallization of Al-5.8Mg-Mn-Sc-Zr alloy. Trans. Nonferrous Met. Soc. China 2013, 23, 3235–3241. [Google Scholar] [CrossRef]
- Meng, C.Y.; Zhang, D.; Cui, H.; Zhuang, L.Z.; Zhang, J.S. Mechanical properties, intergranular corrosion behavior and microstructure of Zn modified Al–Mg alloys. J. Alloys Compd. 2014, 617, 925–932. [Google Scholar] [CrossRef]
- Meng, C.Y.; Zhang, D.; Zhuang, L.Z.; Zhang, J.S. Correlations between stress corrosion cracking, grain boundary precipitates and Zn content of Al–Mg–Zn alloys. J. Alloys Compd. 2016, 655, 178–187. [Google Scholar] [CrossRef]
- Meng, C.Y.; Zhang, D.; Liu, P.P.; Zhuang, L.Z.; Zhang, J.S. Microstructure characterization in a sensitized Al-Mg-Mn-Zn alloy. Rare Met. 2018, 37, 129–135. [Google Scholar] [CrossRef]
- Sukiman, N.L.; Gupta, R.K.; Buchheit, R.G.; Birbilis, N. Influence of microalloying additions on Al–Mg alloy. Part 1: Corrosion and electrochemical response. Corros. Eng. Sci. Technol. 2013, 49, 254–262. [Google Scholar] [CrossRef]
- Engler, O.; Brinkman, H.J.; Hentschel, T. Simulation-Based Design of 5xxx Series Alloys with Improved Resistivity against Intergranular Corrosion for Automotive Applications. Mater. Sci. Forum 2014, 794–796, 622–627. [Google Scholar] [CrossRef]
- Medrano, S.; Zhao, H.; De Geuser, F.; Gault, B.; Stephenson, L.T.; Deschamps, A.; Ponge, D.; Raabe, D.; Sinclair, C.W. Cluster hardening in Al-3Mg triggered by small Cu additions. Acta Mater. 2018, 161, 12–20. [Google Scholar] [CrossRef]
- Engler, O.; Marioara, C.D.; Hentschel, T.; Brinkman, H.J. Influence of copper additions on materials properties and corrosion behaviour of Al–Mg alloy sheet. J. Alloys Compd. 2017, 710, 650–662. [Google Scholar] [CrossRef]
- Wu, Y.; Liao, H. Corrosion Behavior of Extruded near Eutectic Al–Si–Mg and 6063 Alloys. J. Mater. Sci. Technol. 2013, 29, 380–386. [Google Scholar] [CrossRef]
- Zeng, F.L.; Wei, Z.L.; Li, J.F.; Li, C.X.; Tan, X.; Zhang, Z.; Zheng, Z.Q. Corrosion mechanism associated with Mg2Si and Si particles in Al–Mg–Si alloys. Trans. Nonferrous Met. Soc. China 2011, 21, 2559–2567. [Google Scholar] [CrossRef]
- Eckermann, F.; Suter, T.; Uggowitzer, P.J.; Afseth, A.; Schmutz, P. The influence of MgSi particle reactivity and dissolution processes on corrosion in Al–Mg–Si alloys. Electrochim. Acta 2008, 54, 844–855. [Google Scholar] [CrossRef]
- AQSIQ, SAC. GB/T 16865-2013. Test Pieces and Method for Tensile Test for Wrought Aluminum and Magnesium Alloys Products; AQSIQ, SAC: Beijing, China, 2013.
- ASTM. G67-13: Standard Test Method for Determining the Susceptibility to Intergranular Corrosion of 5XXX Series Aluminum Alloys by Mass Loss After Exposure to Nitric Acid (NAMLT Test); ASTM: West Conshohocken, PA, USA, 2013. [CrossRef]
- Engler, O.; Kuhnke, K.; Westphal, K.; Hasenclever, J. Impact of chromium on the microchemistry evolution during solidification and homogenization of the Al-Mg alloy AA 5052. J. Alloys Compd. 2018, 744, 561–573. [Google Scholar] [CrossRef]
- Sukiman, N.L.; Zhou, X. Durability and Corrosion of Aluminium and Its Alloys: Overview, Property Space, Techniques and Developments; IntechOpen Limited: London, UK, 2008; pp. 154–196. [Google Scholar]
Figure 1.
Electron backscatter diffraction (EBSD) image of cold rolled alloys: (a) Al-3Mg-0.5Mn; (b) Al-3Mg-0.5Mn-0.2Er; (c) Al-3Mg-0.5Mn-0.2Zr; (d) Al-3Mg-0.5Mn-0.2Cu; (e) Al-3Mg-0.5Mn-0.2Si; (f) Al-3Mg-0.5Mn-0.2Zn.
Figure 1.
Electron backscatter diffraction (EBSD) image of cold rolled alloys: (a) Al-3Mg-0.5Mn; (b) Al-3Mg-0.5Mn-0.2Er; (c) Al-3Mg-0.5Mn-0.2Zr; (d) Al-3Mg-0.5Mn-0.2Cu; (e) Al-3Mg-0.5Mn-0.2Si; (f) Al-3Mg-0.5Mn-0.2Zn.
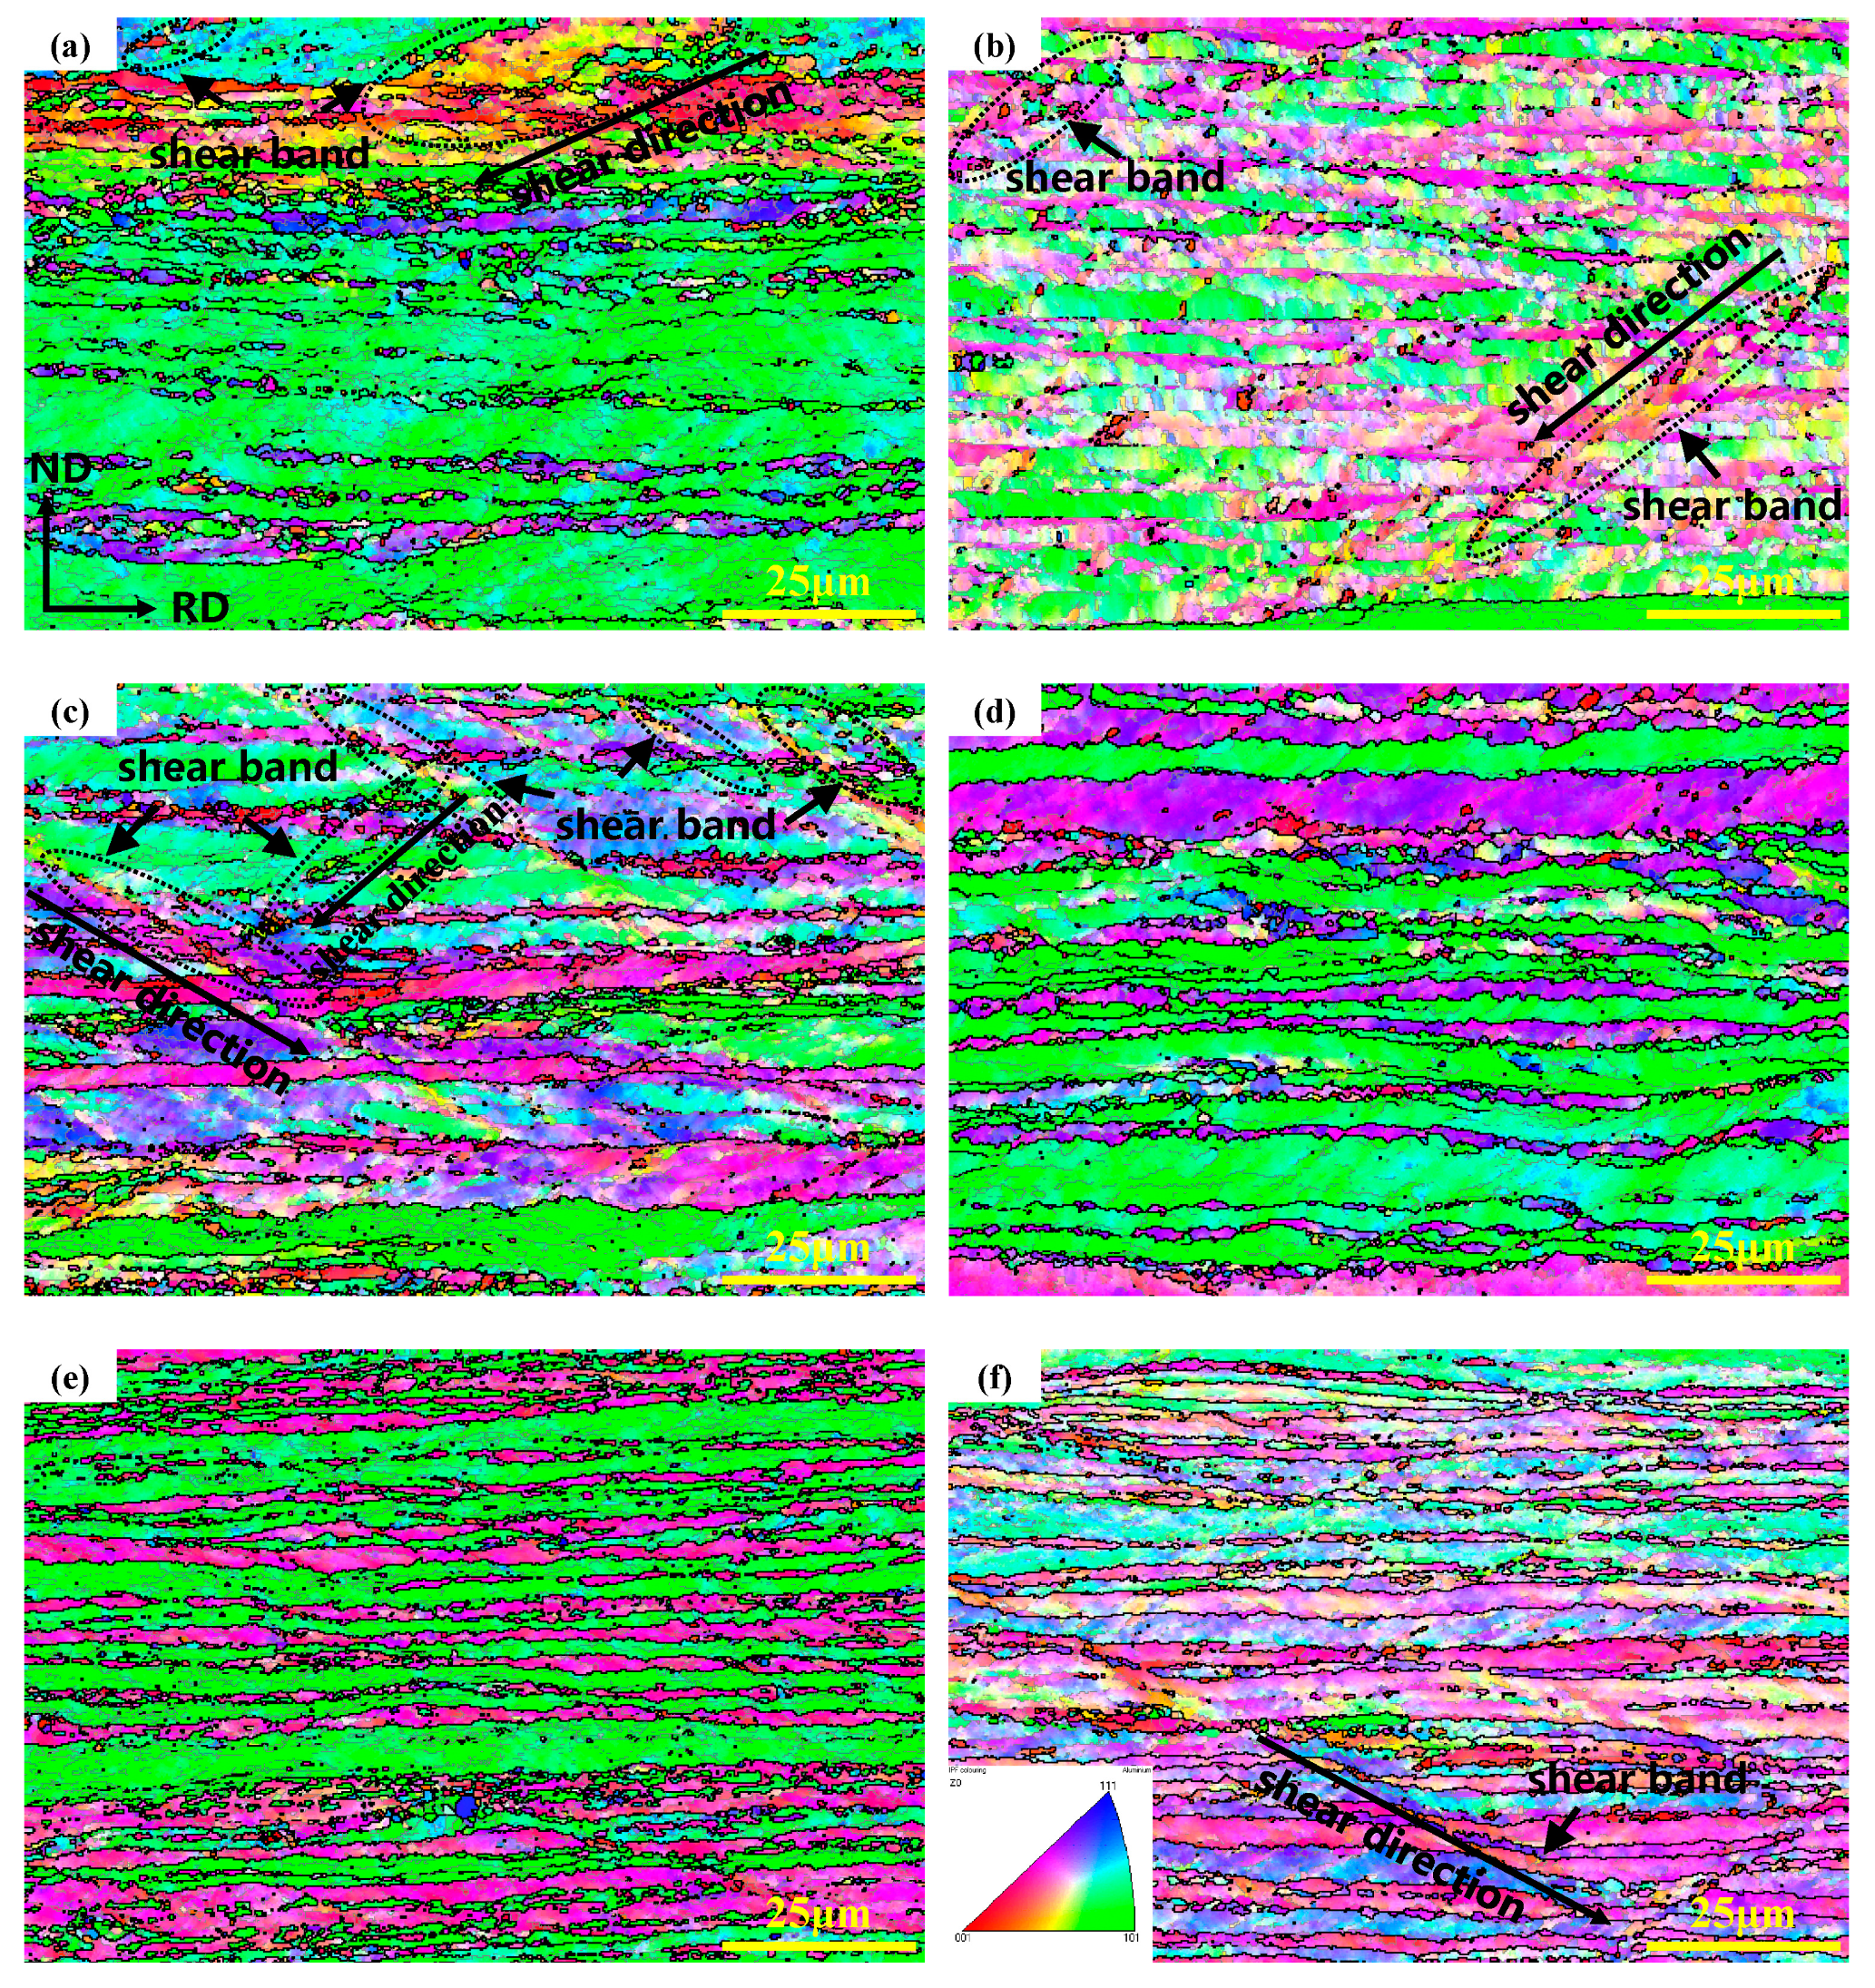
Figure 2.
Misorientation angles distributions for the cold rolled alloys: (a) Al-3Mg-0.5Mn; (b) Al-3Mg-0.5Mn-0.2Er; (c) Al-3Mg-0.5Mn-0.2Zr; (d) Al-3Mg-0.5Mn-0.2Cu; (e) Al-3Mg-0.5Mn-0.2Si; (f) Al-3Mg-0.5Mn-0.2Zn.
Figure 2.
Misorientation angles distributions for the cold rolled alloys: (a) Al-3Mg-0.5Mn; (b) Al-3Mg-0.5Mn-0.2Er; (c) Al-3Mg-0.5Mn-0.2Zr; (d) Al-3Mg-0.5Mn-0.2Cu; (e) Al-3Mg-0.5Mn-0.2Si; (f) Al-3Mg-0.5Mn-0.2Zn.
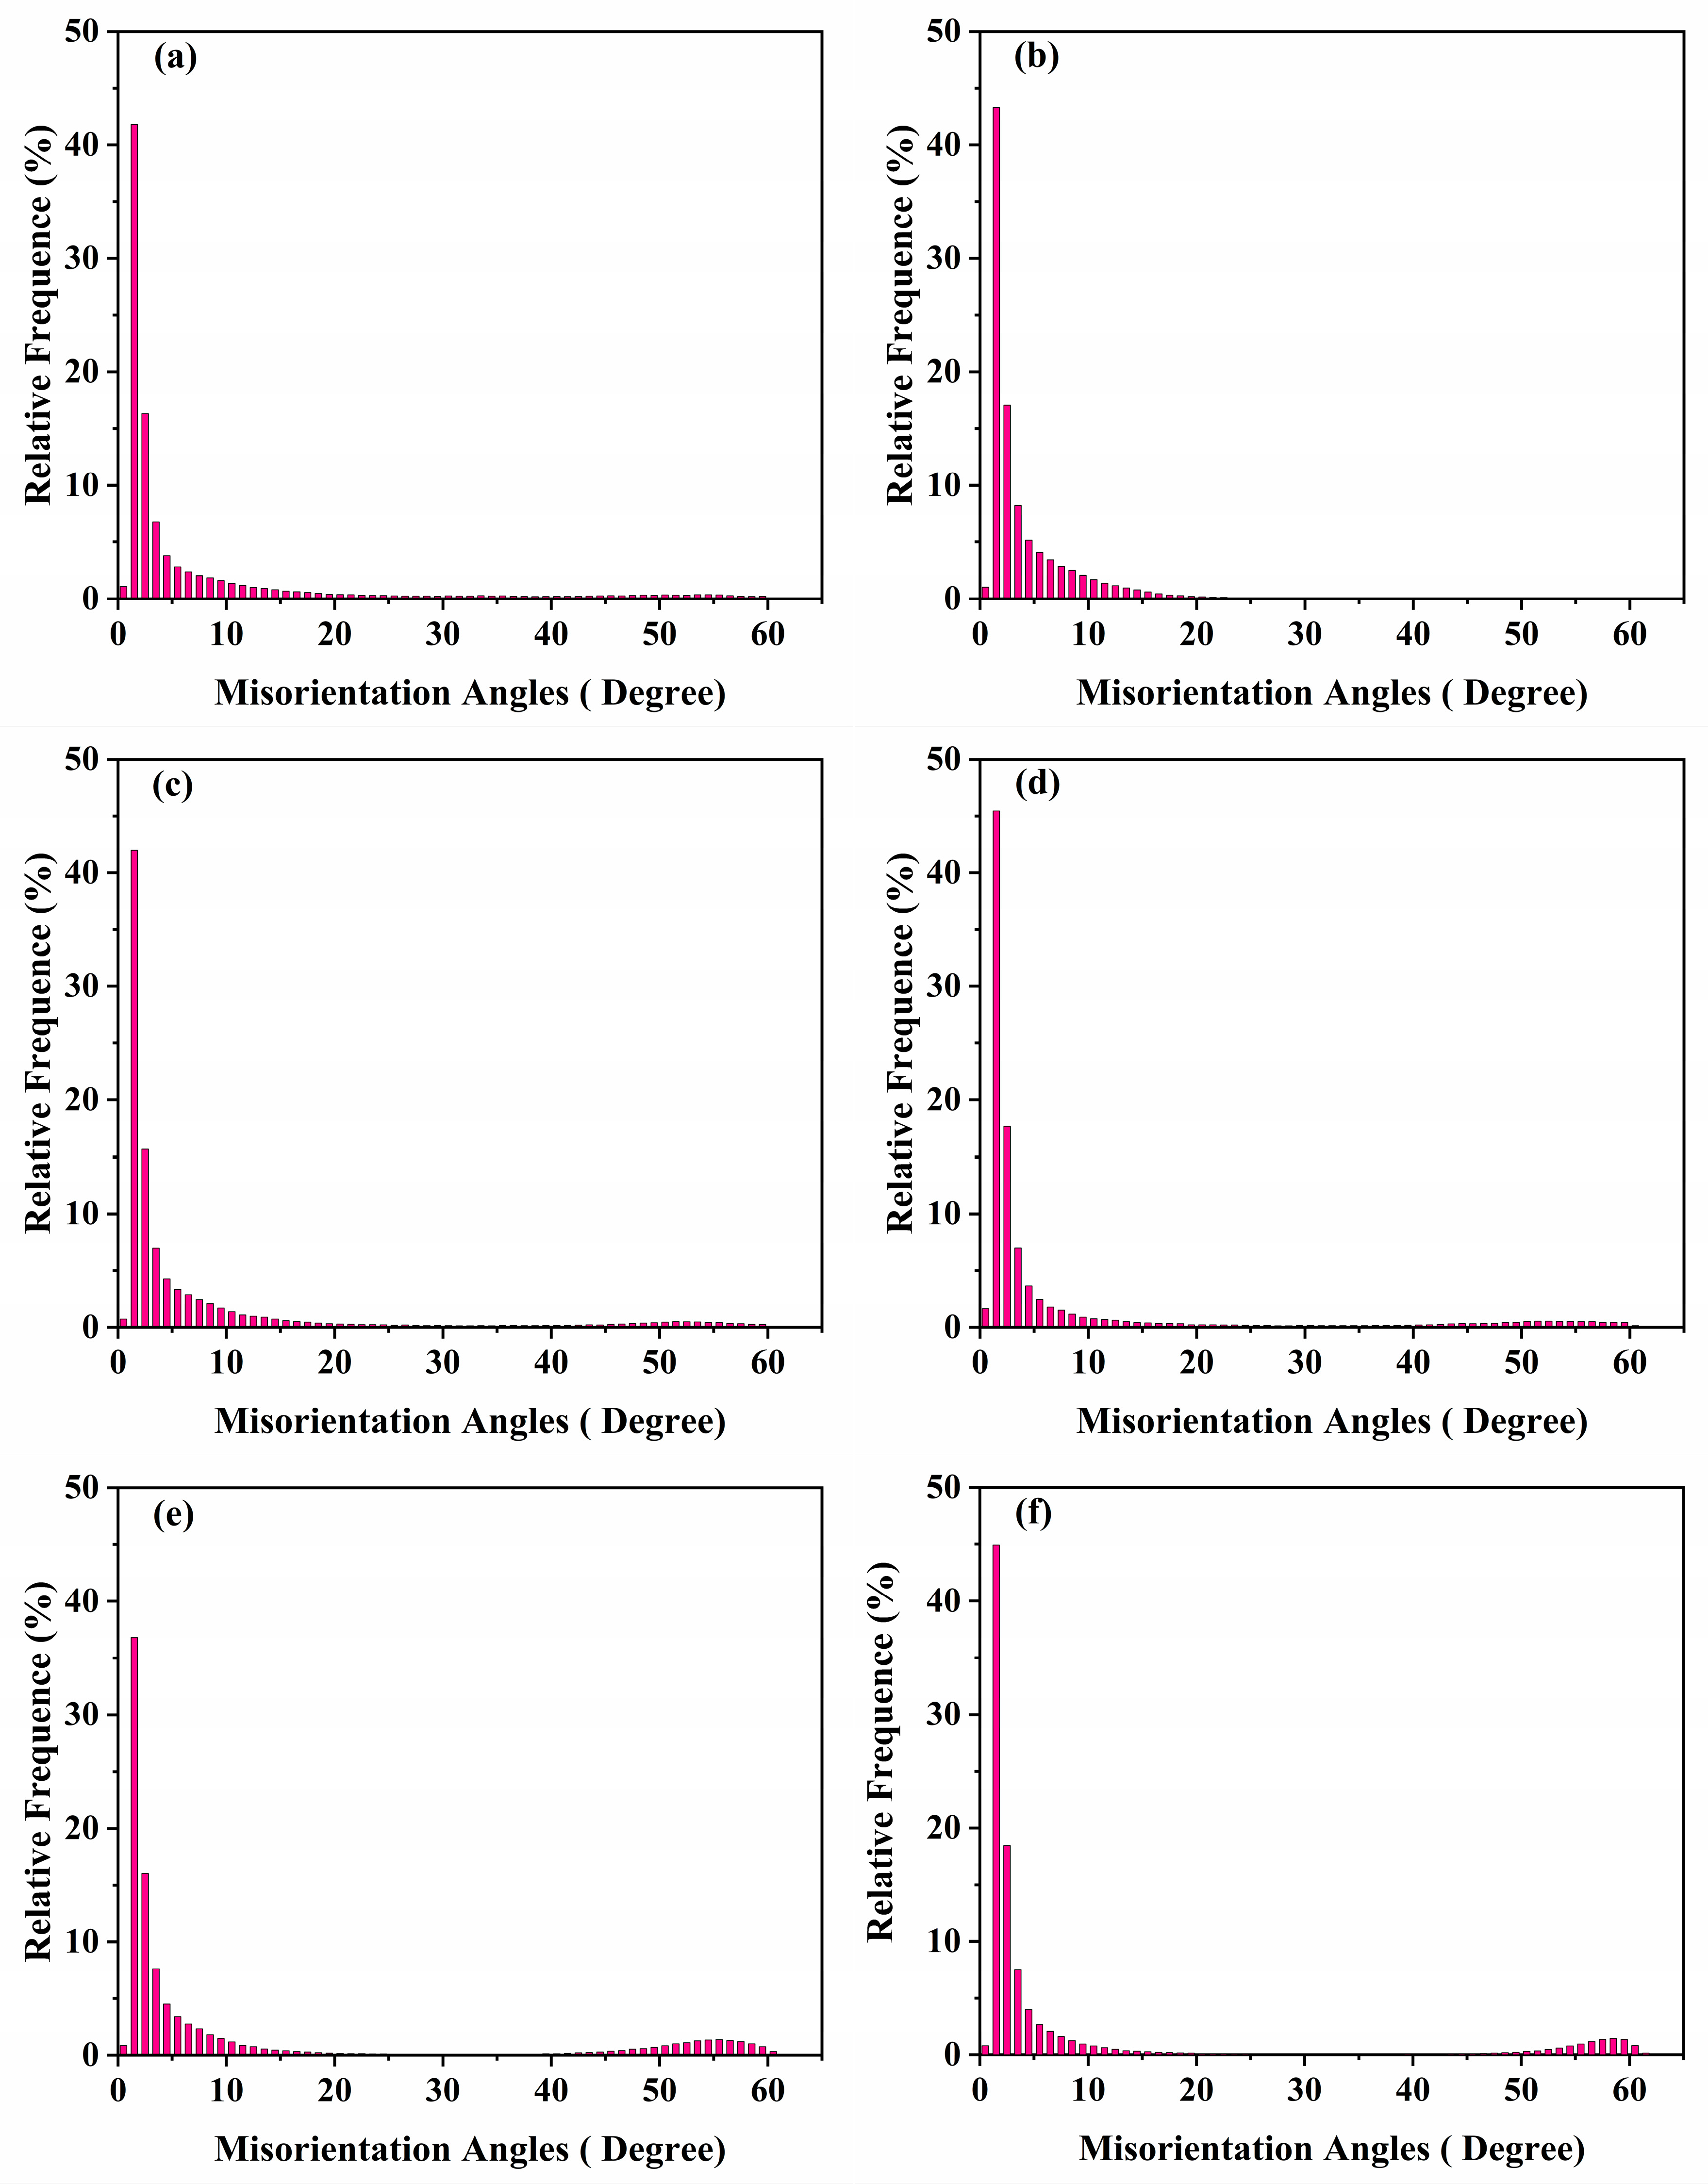
Figure 3.
Mapping of different types of grains: blue-recrystallized, yellow-substructured, and red-deformed. Grain boundaries with misorientations larger than 15° were superimposed as black lines while subgrain boundaries with misorientations smaller than 15° but larger than 5° were superimposed as gray lines: (a) Al-3Mg-0.5Mn; (b) Al-3Mg-0.5Mn-0.2Er; (c) Al-3Mg-0.5Mn-0.2Zr; (d) Al-3Mg-0.5Mn-0.2Cu; (e) Al-3Mg-0.5Mn-0.2Si; (f) Al-3Mg-0.5Mn-0.2Zn.
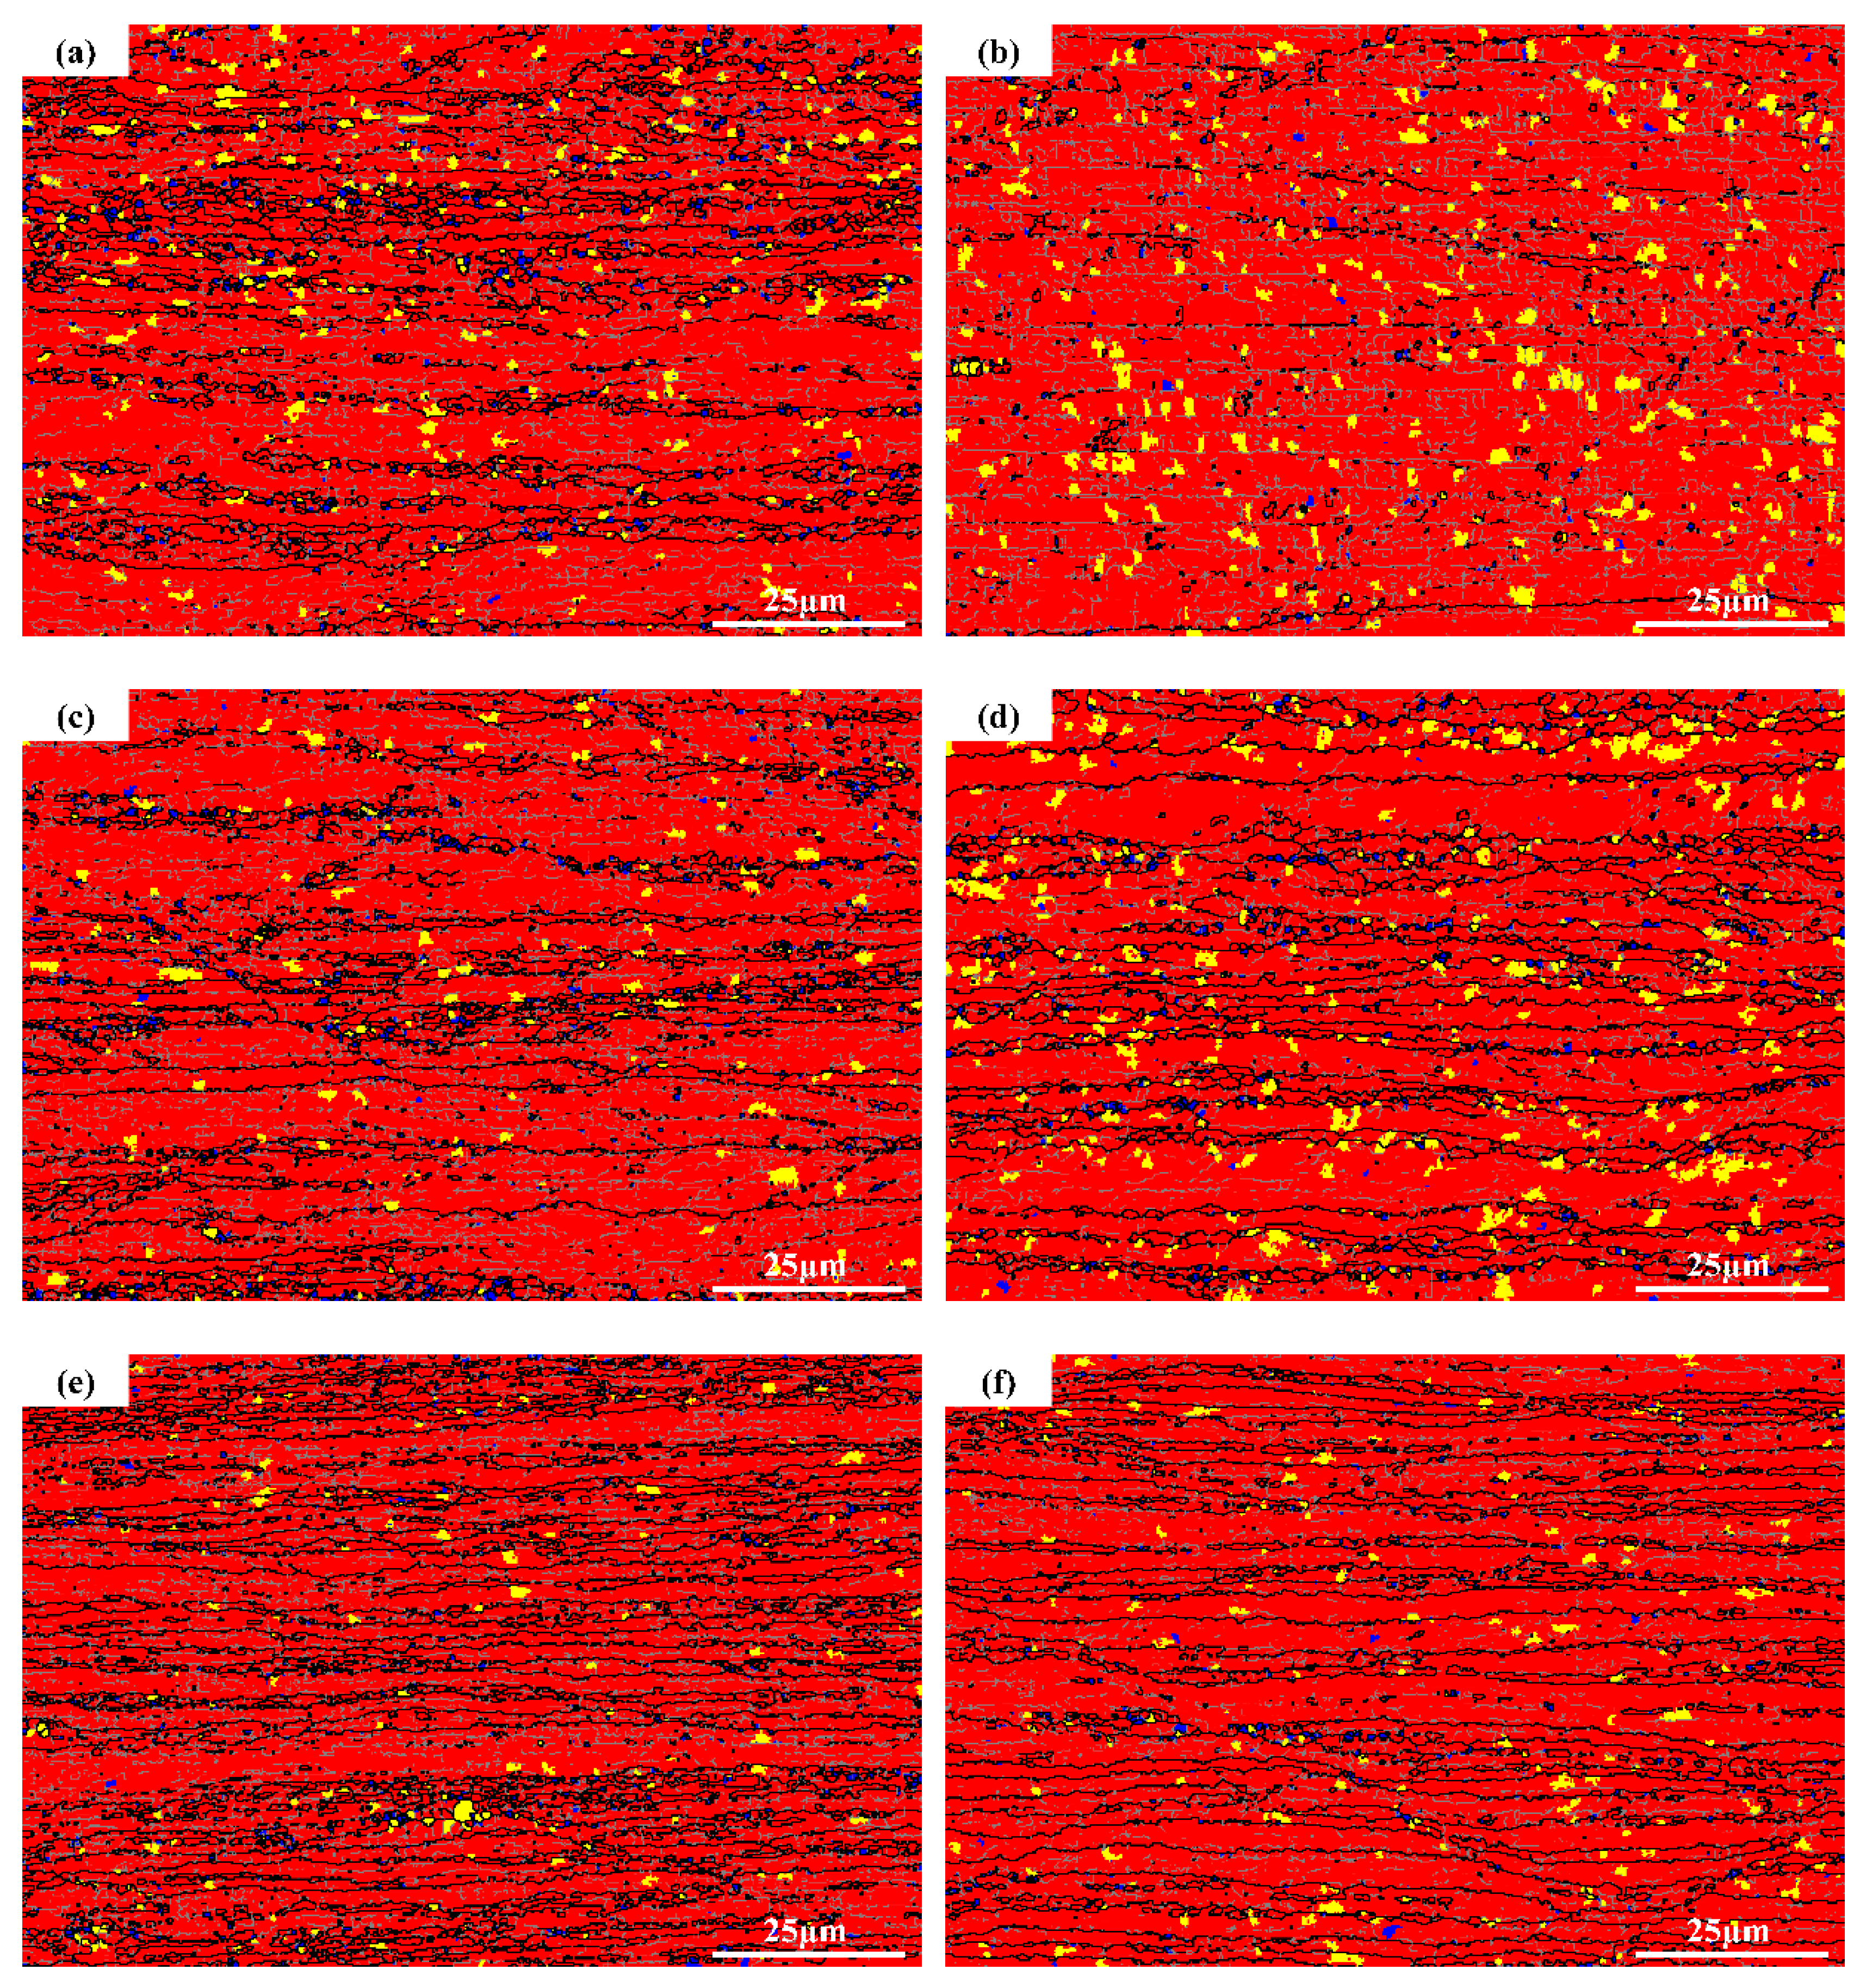
Figure 4.
Percentage of recrystallization of cold rolled alloys.

Figure 5.
Pole diagram of cold rolled alloys: (a) Al-3Mg-0.5Mn; (b) Al-3Mg-0.5Mn-0.2Er; (c) Al-3Mg-0.5Mn-0.2Zr; (d) Al-3Mg-0.5Mn-0.2Cu; (e) Al-3Mg-0.5Mn-0.2Si; (f) Al-3Mg-0.5Mn-0.2Zn.
Figure 5.
Pole diagram of cold rolled alloys: (a) Al-3Mg-0.5Mn; (b) Al-3Mg-0.5Mn-0.2Er; (c) Al-3Mg-0.5Mn-0.2Zr; (d) Al-3Mg-0.5Mn-0.2Cu; (e) Al-3Mg-0.5Mn-0.2Si; (f) Al-3Mg-0.5Mn-0.2Zn.
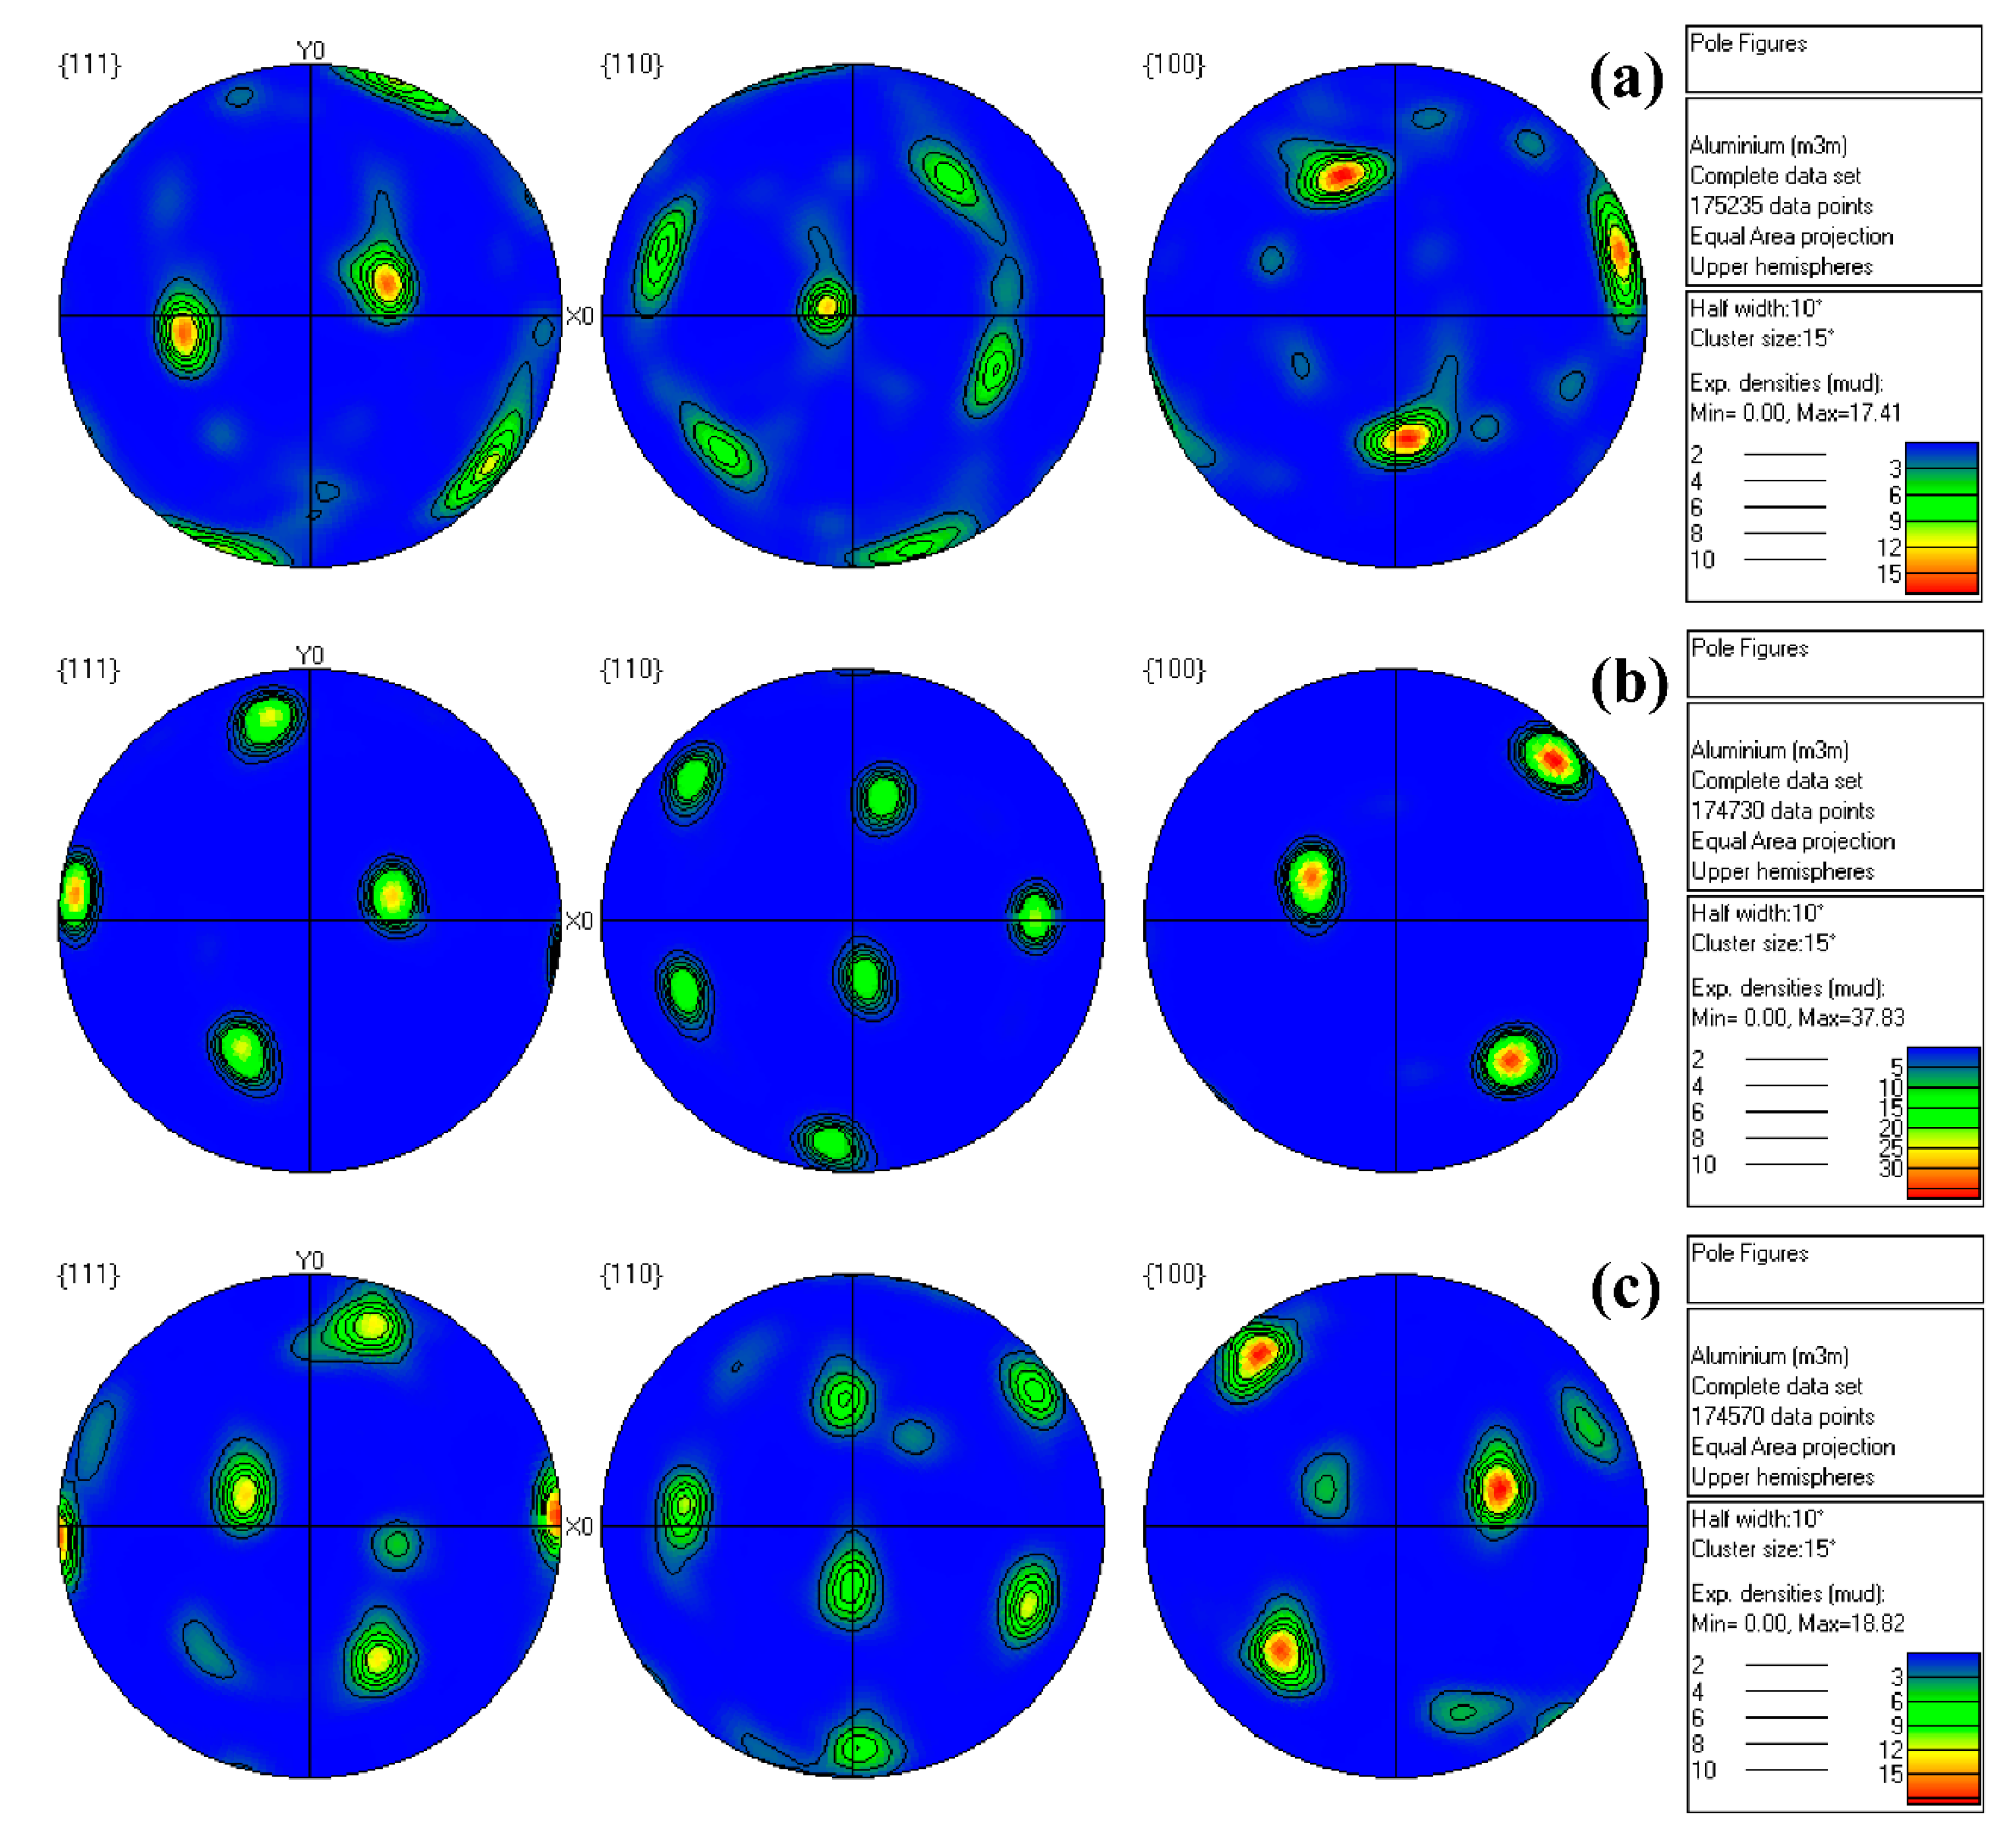
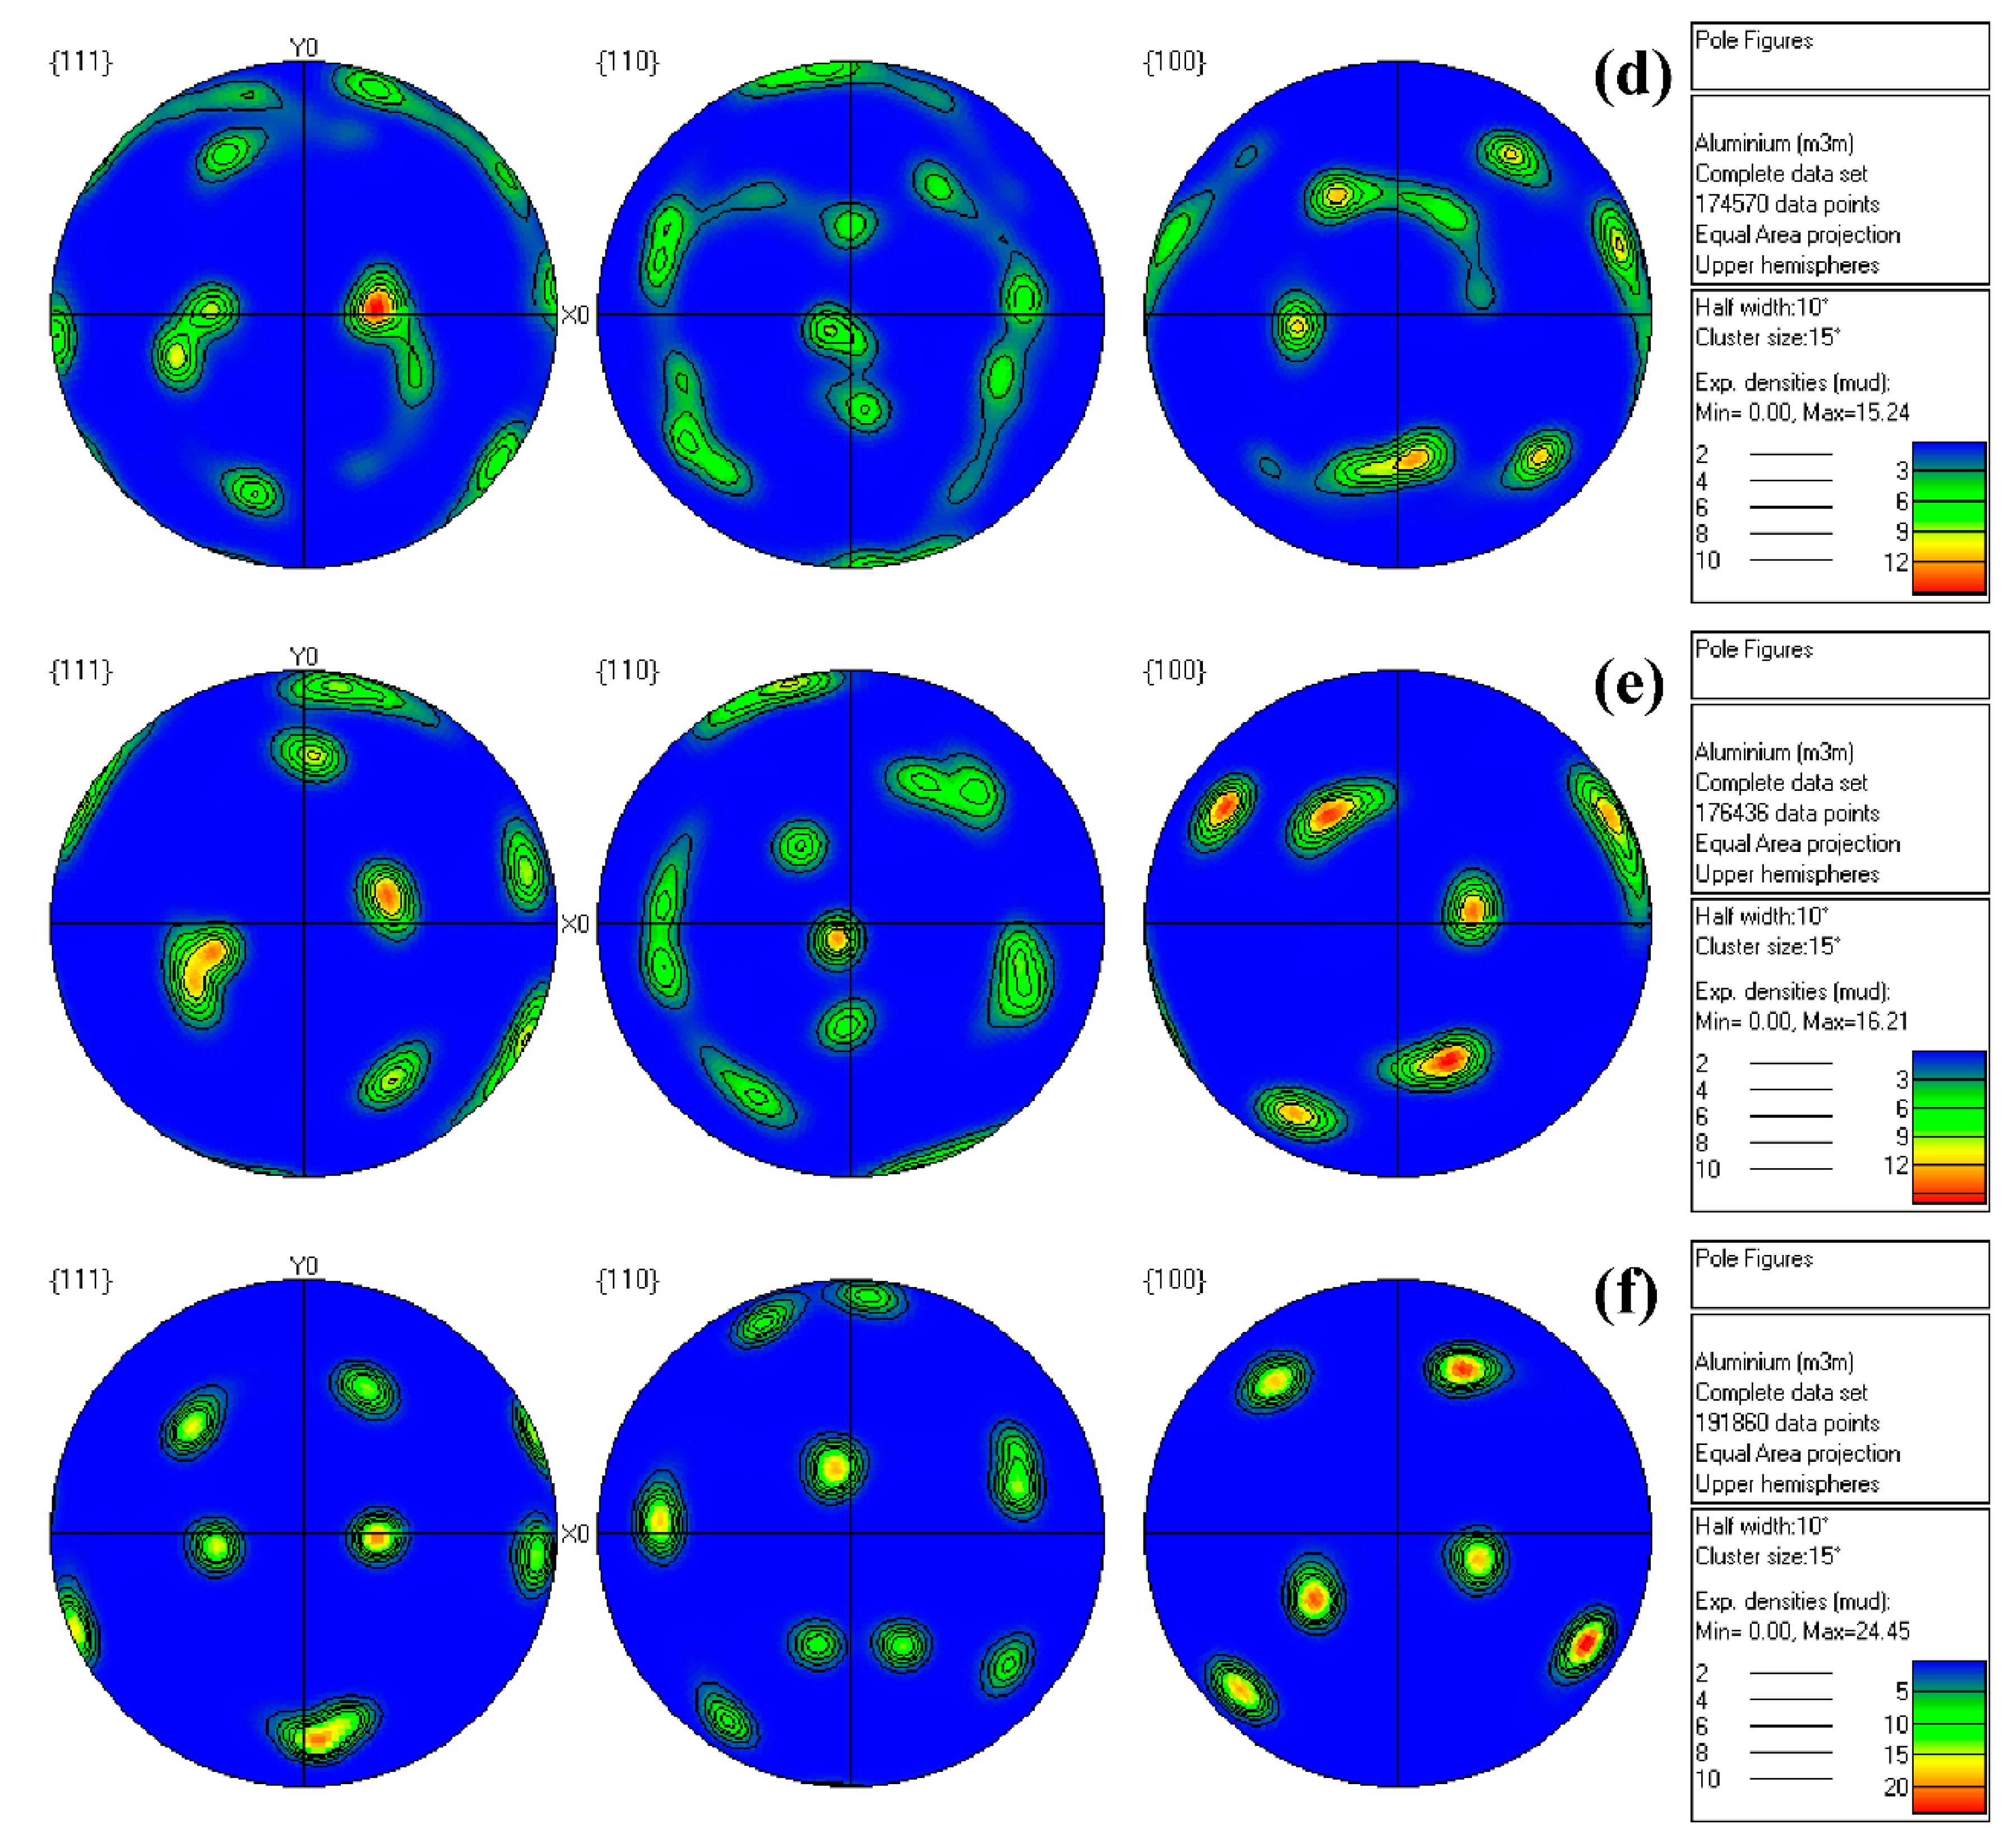
Figure 6.
Orientation imaging of cold rolled alloys: (a) Al-3Mg-0.5Mn; (b) Al-3Mg-0.5Mn-0.2Er; (c) Al-3Mg-0.5Mn-0.2Zr; (d) Al-3Mg-0.5Mn-0.2Cu; (e) Al-3Mg-0.5Mn-0.2Si; (f) Al-3Mg-0.5Mn-0.2Zn.
Figure 6.
Orientation imaging of cold rolled alloys: (a) Al-3Mg-0.5Mn; (b) Al-3Mg-0.5Mn-0.2Er; (c) Al-3Mg-0.5Mn-0.2Zr; (d) Al-3Mg-0.5Mn-0.2Cu; (e) Al-3Mg-0.5Mn-0.2Si; (f) Al-3Mg-0.5Mn-0.2Zn.


Figure 7.
X-ray diffraction patterns of cold rolled alloys: (a) Al-3Mg-0.5Mn; (b) Al-3Mg-0.5Mn-0.2Er; (c) Al-3Mg-0.5Mn-0.2Zr; (d) Al-3Mg-0.5Mn-0.2Cu; (e) Al-3Mg-0.5Mn-0.2Si; (f) Al-3Mg-0.5Mn-0.2Zn.
Figure 7.
X-ray diffraction patterns of cold rolled alloys: (a) Al-3Mg-0.5Mn; (b) Al-3Mg-0.5Mn-0.2Er; (c) Al-3Mg-0.5Mn-0.2Zr; (d) Al-3Mg-0.5Mn-0.2Cu; (e) Al-3Mg-0.5Mn-0.2Si; (f) Al-3Mg-0.5Mn-0.2Zn.
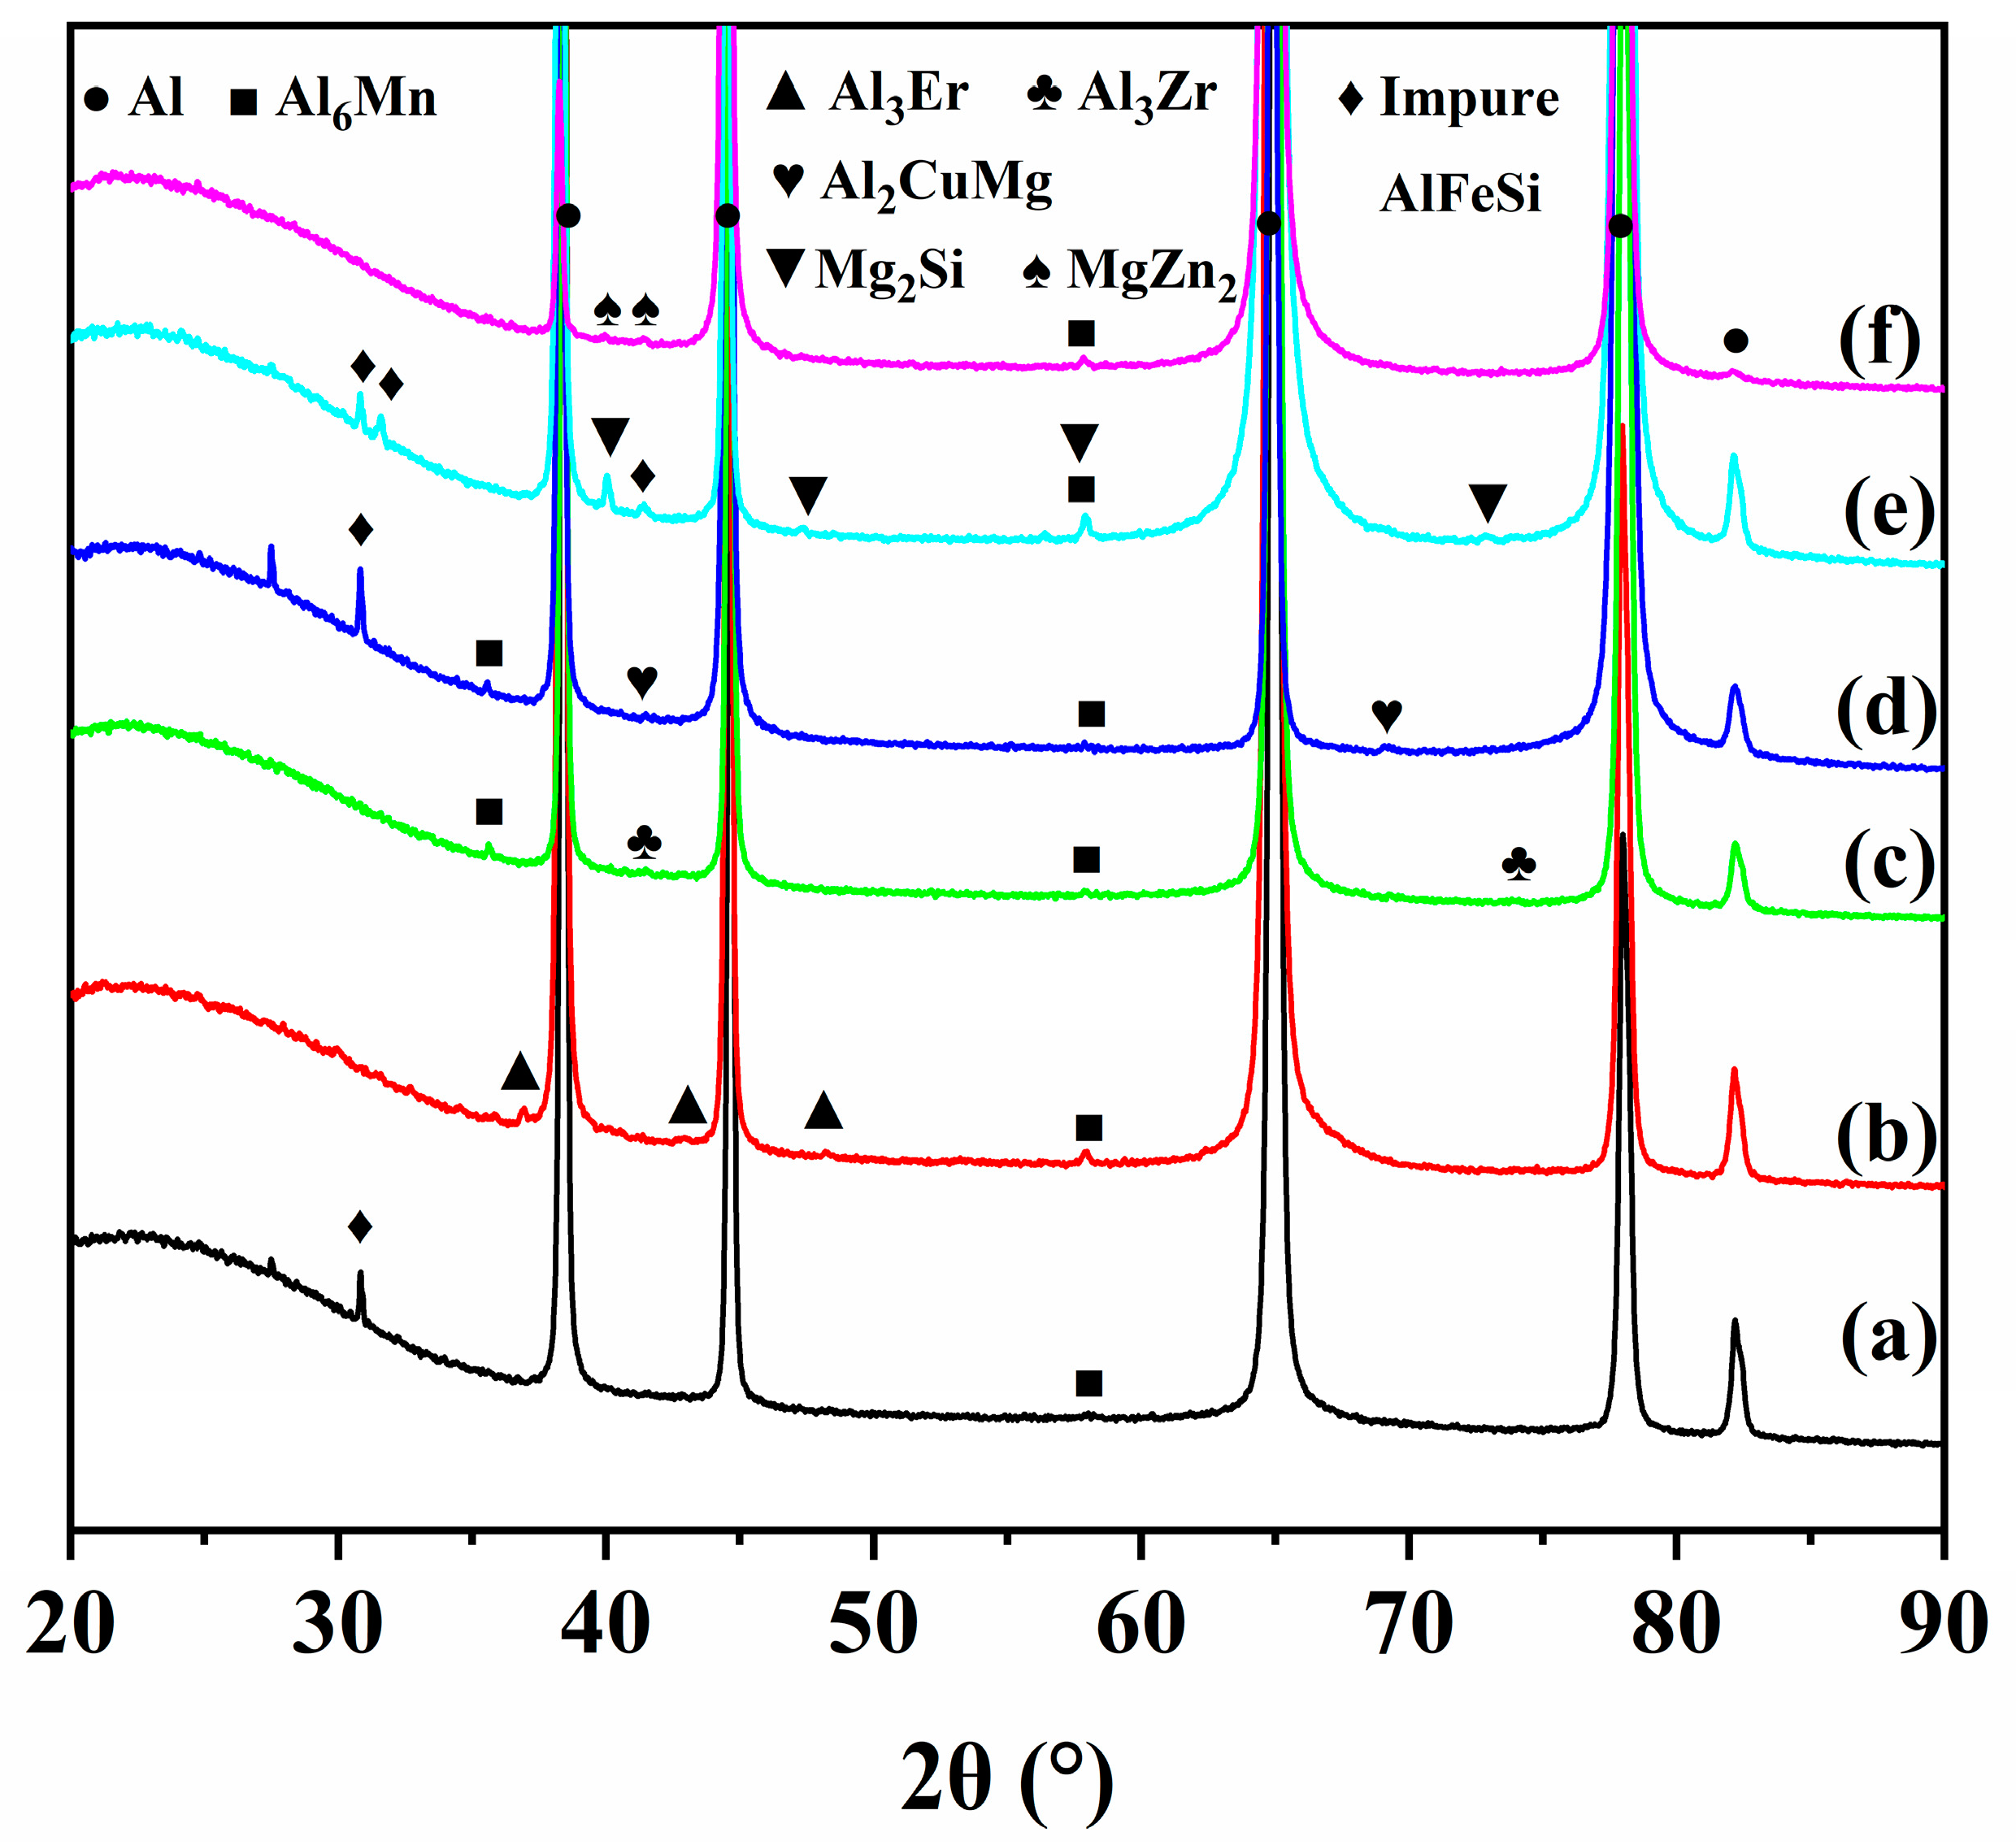
Figure 8.
Differential scanning calorimetry (DSC) curve of as-cast alloys: (a) Al-3Mg-0.5Mn; (b) Al-3Mg-0.5Mn-0.2Er; (c) Al-3Mg-0.5Mn-0.2Zr; (d) Al-3Mg-0.5Mn-0.2Cu; (e) Al-3Mg-0.5Mn-0.2Si; (f) Al-3Mg-0.5Mn-0.2Zn.
Figure 8.
Differential scanning calorimetry (DSC) curve of as-cast alloys: (a) Al-3Mg-0.5Mn; (b) Al-3Mg-0.5Mn-0.2Er; (c) Al-3Mg-0.5Mn-0.2Zr; (d) Al-3Mg-0.5Mn-0.2Cu; (e) Al-3Mg-0.5Mn-0.2Si; (f) Al-3Mg-0.5Mn-0.2Zn.
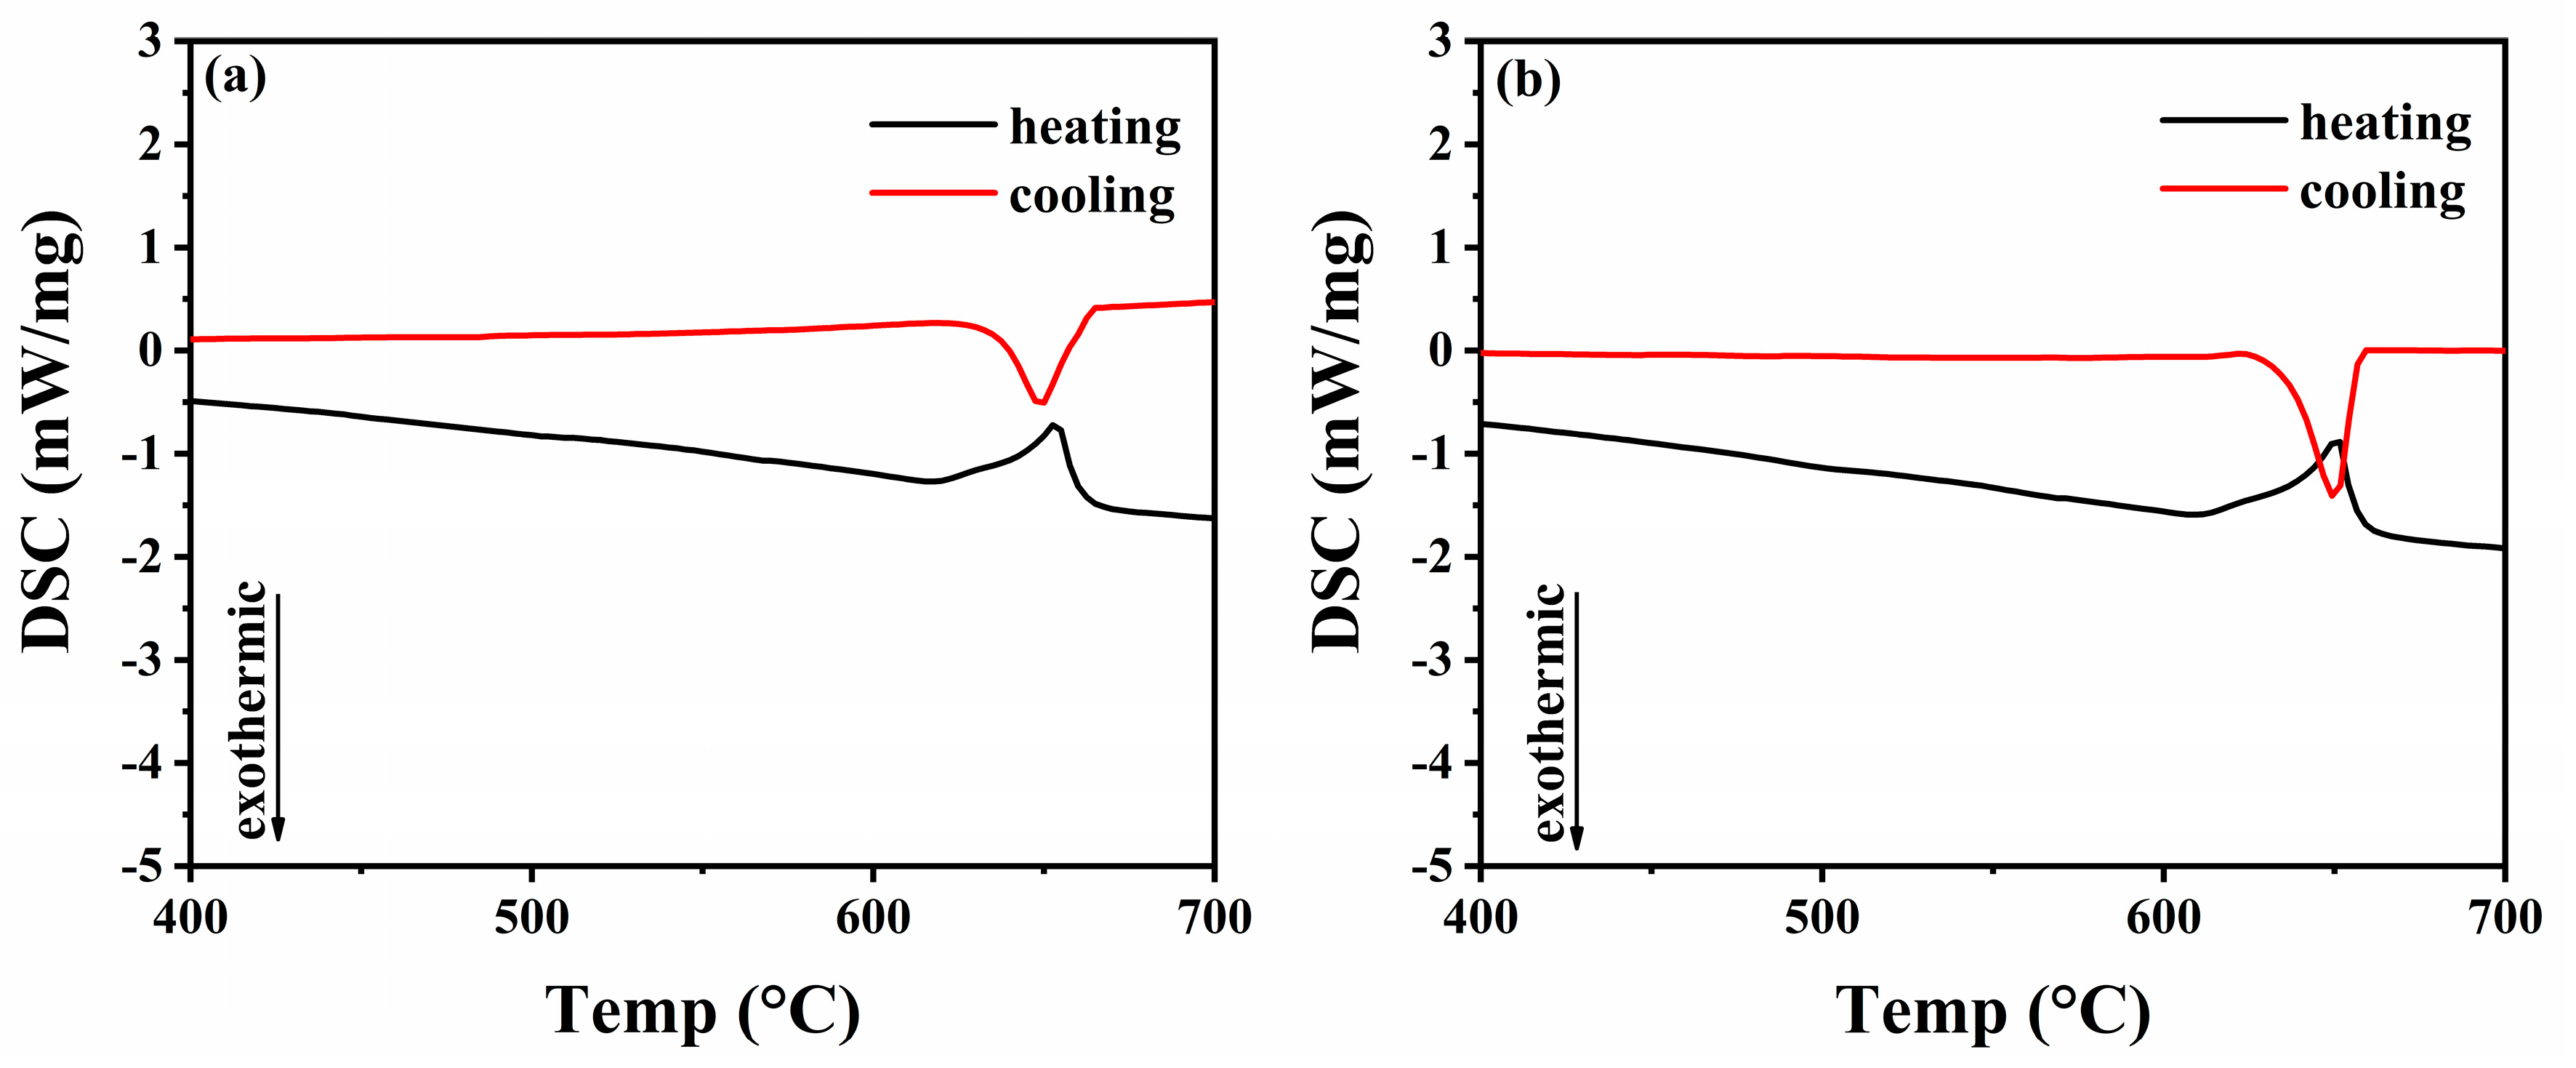

Figure 9.
Stress-strain curves of alloys.

Figure 10.
Mechanical properties of cold rolled alloys.
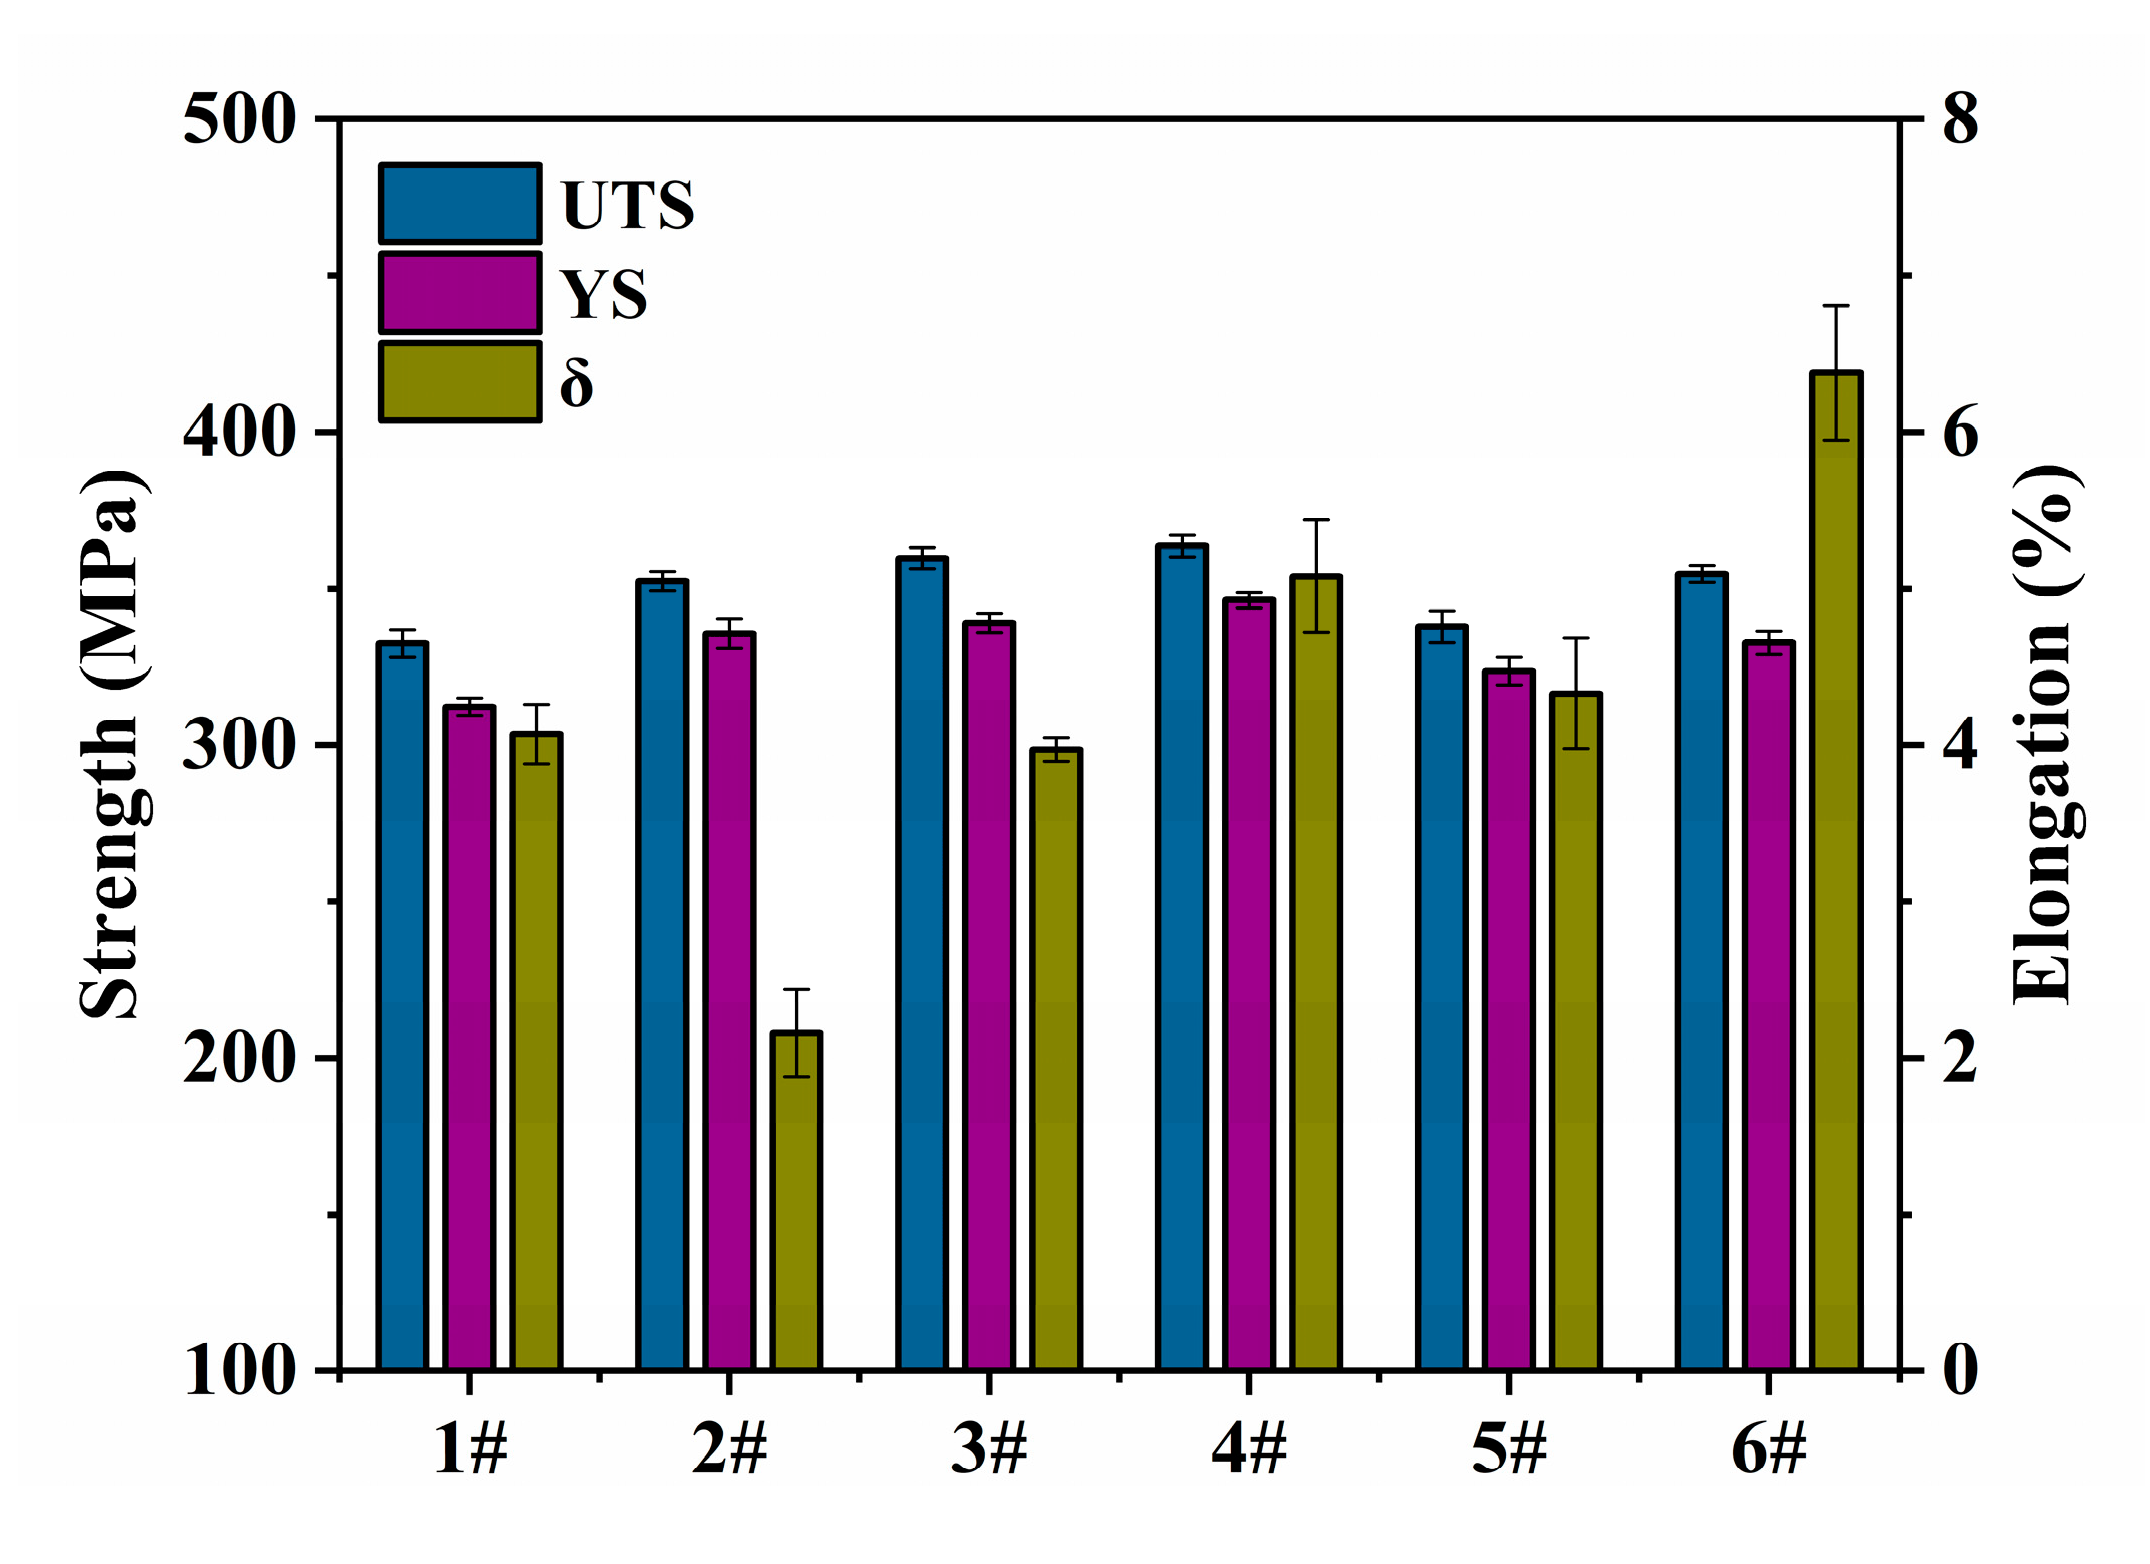
Figure 11.
Polarization curve of cold rolled alloys in 3.5wt.% NaCl solution.
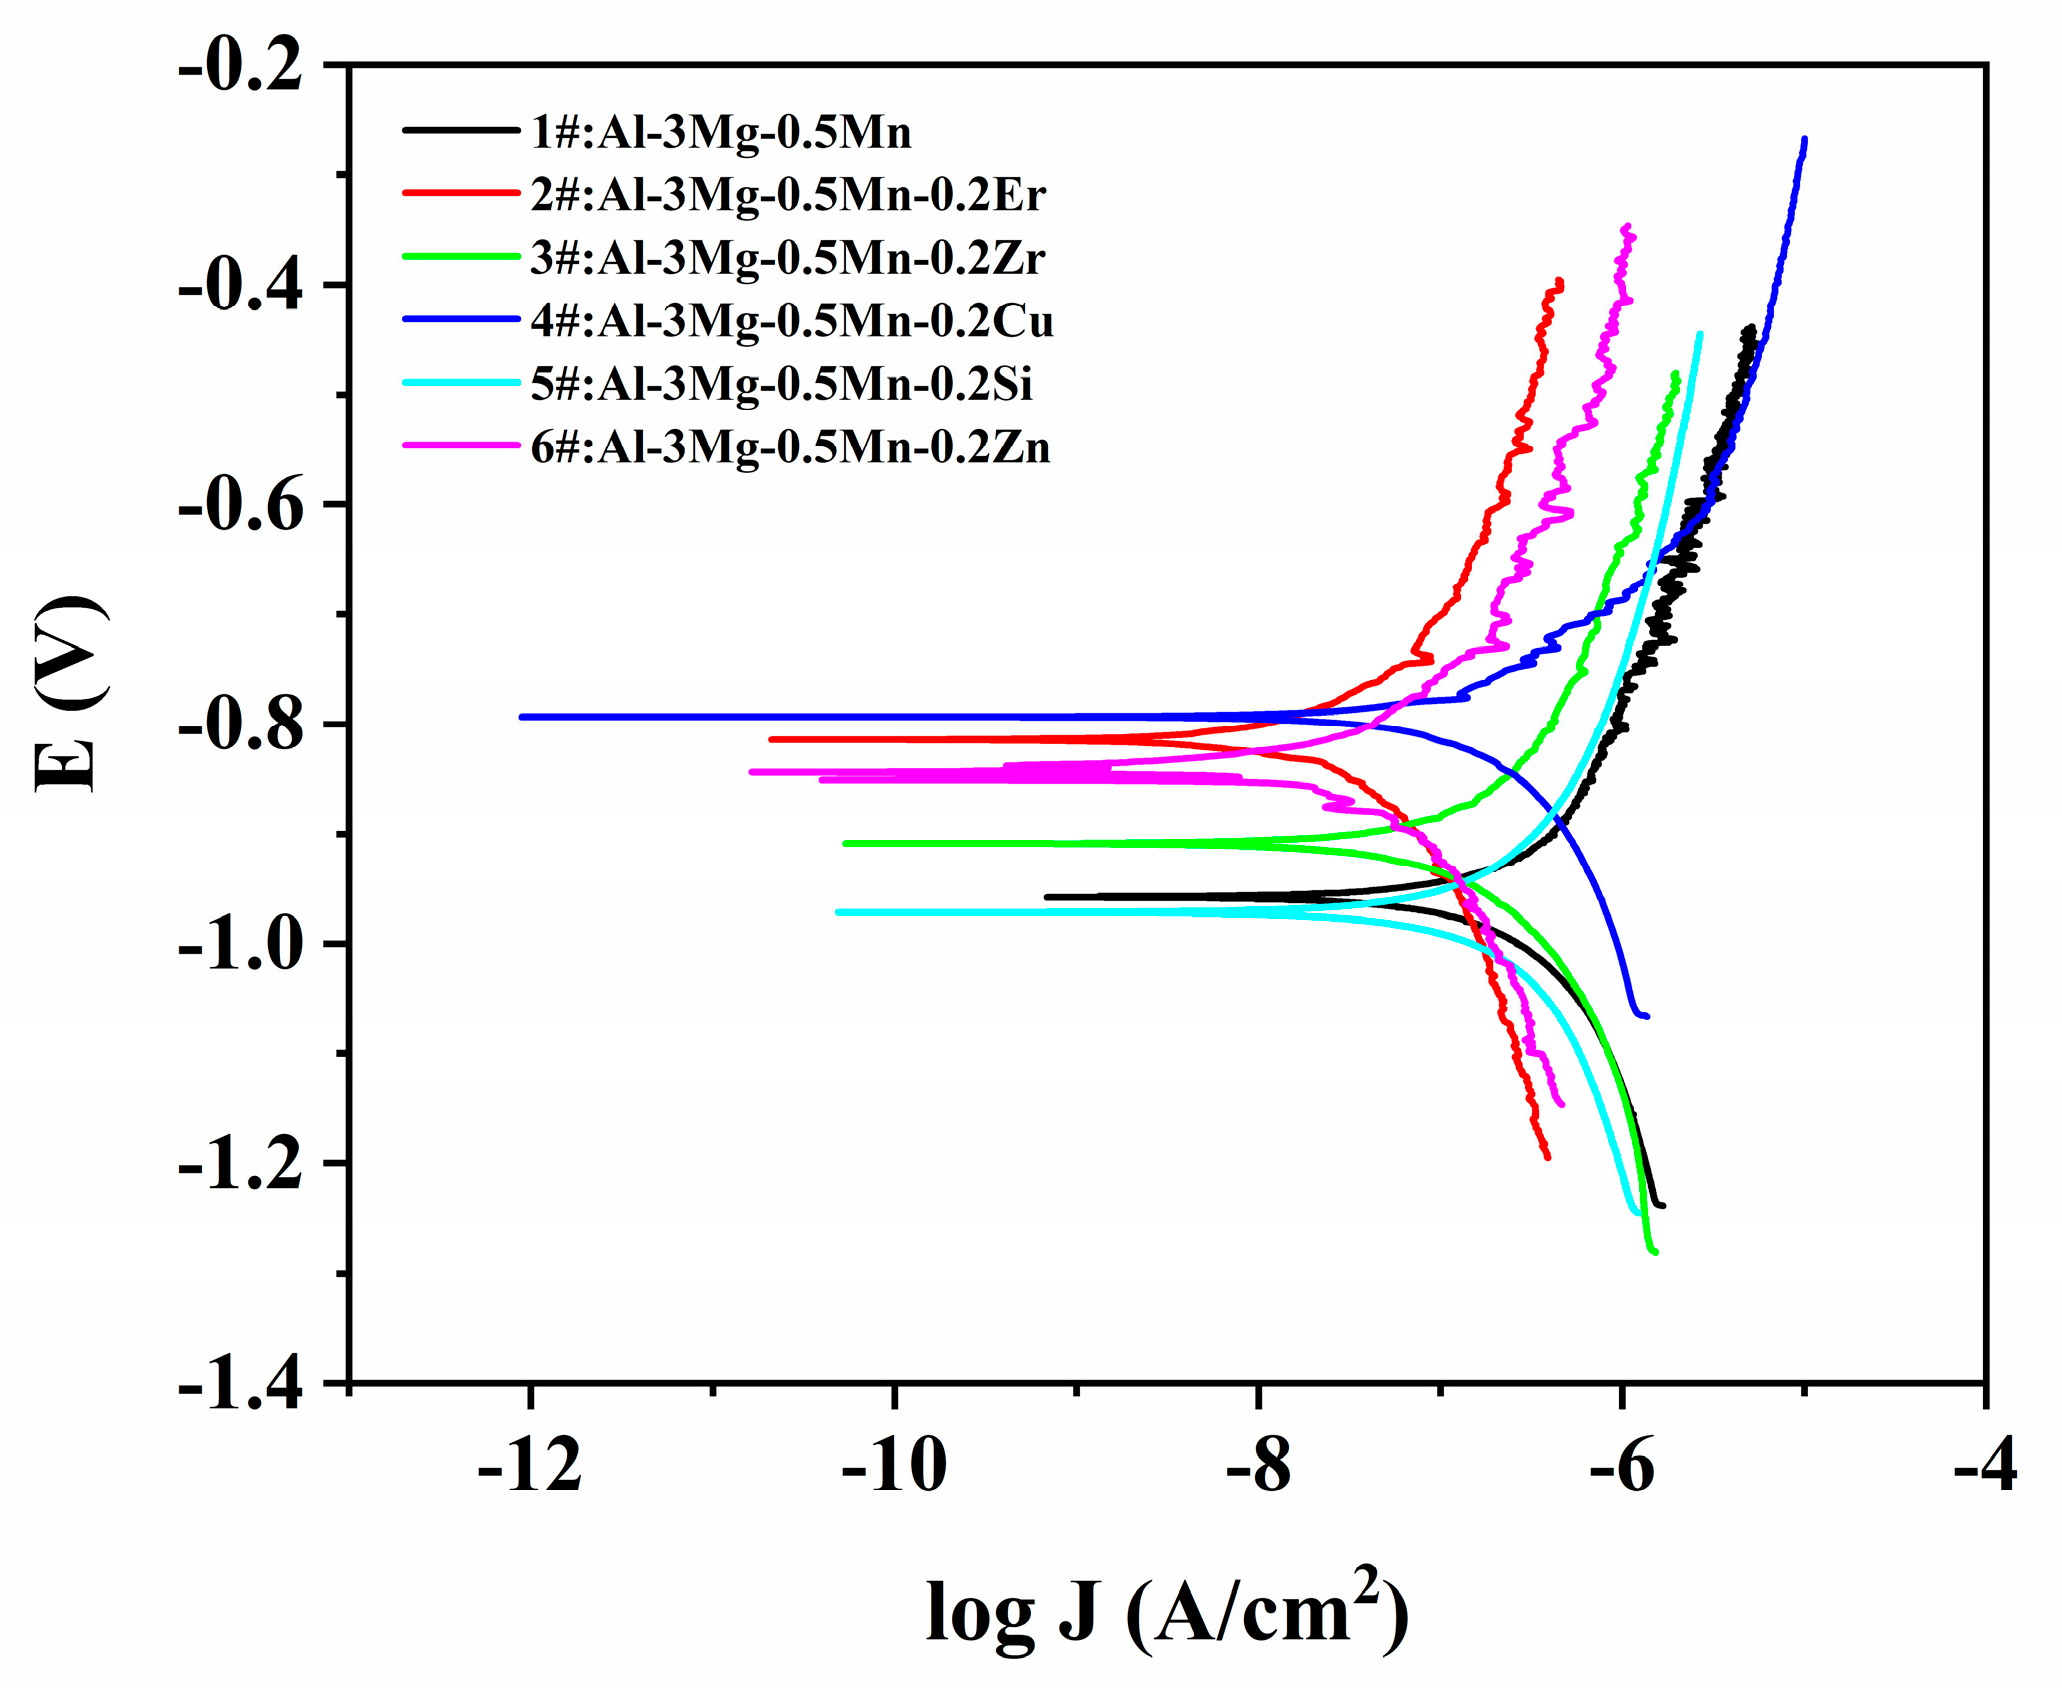
Figure 12.
The nitric acid mass loss test (NAMLT) test results of cold rolled alloys.

Table 1.
Nominal chemical compositions of studied alloys (wt.%).
| Alloys | Mg | Mn | Er | Zr | Cu | Si | Zn | Al |
|---|---|---|---|---|---|---|---|---|
| 1#: Al-3Mg-0.5Mn | 3 | 0.5 | ― | ― | ― | ― | ― | Bal |
| 2#: Al-3Mg-0.5Mn-0.2Er | 3 | 0.5 | 0.2 | ― | ― | ― | ― | Bal |
| 3#: Al-3Mg-0.5Mn-0.2Zr | 3 | 0.5 | ― | 0.2 | ― | ― | ― | Bal |
| 4#: Al-3Mg-0.5Mn-0.2Cu | 3 | 0.5 | ― | ― | 0.2 | ― | ― | Bal |
| 5#: Al-3Mg-0.5Mn-0.2Si | 3 | 0.5 | ― | ― | ― | 0.2 | ― | Bal |
| 6#: Al-3Mg-0.5Mn-0.2Zn | 3 | 0.5 | ― | ― | ― | ― | 0.2 | Bal |
Table 2.
Texture components of cold rolled alloys (%).
| Alloys | Cube Texture | Goss Texture | Brass Texture | Copper Texture | S Texture | Random Texture |
|---|---|---|---|---|---|---|
| 1# | 0.06 | 19.10 | 6.19 | 0.40 | 21.60 | 52.65 |
| 2# | 0 | 2.88 | 0.16 | 21.30 | 72.30 | 3.36 |
| 3# | 0.11 | 0.50 | 0.34 | 19.40 | 68.20 | 11.45 |
| 4# | 0.08 | 16.20 | 4.64 | 22.30 | 20.90 | 35.88 |
| 5# | 0.01 | 10.60 | 16.60 | 0.41 | 54.3 | 18.08 |
| 6# | 0 | 0 | 1.11 | 8.81 | 75.2 | 14.88 |
Table 3.
DSC curve analysis results of as-cast alloys/°C.
| Alloys | Liquidus Temperature | Solidus Temperature | Crystallization Temperature Interval |
|---|---|---|---|
| 1#:Al-3Mg-0.5Mn | 661.5 | 639.0 | 22.5 |
| 2#:Al-3Mg-0.5Mn-0.2Er | 656.5 | 634.3 | 22.2 |
| 3#:Al-3Mg-0.5Mn-0.2Zr | 669.7 | 636.1 | 33.6 |
| 4#:Al-3Mg-0.5Mn-0.2Cu | 667.4 | 641.4 | 26.0 |
| 5#:Al-3Mg-0.5Mn-0.2Si | 664.6 | 639.7 | 24.9 |
| 6#:Al-3Mg-0.5Mn-0.2Zn | 659.5 | 641.7 | 17.8 |
Table 4.
Electrochemical parameters of cold rolled alloys in 3.5wt.% NaCl solution.
| Samples | Icorr (A/cm2) | Ecorr (V) |
|---|---|---|
| 1#:Al-3Mg-0.5Mn | 8.20 × 10⁻⁸ | −0.93 |
| 2#:Al-3Mg-0.5Mn-0.2Er | 8.89 × 10⁻⁹ | −0.81 |
| 3#:Al-3Mg-0.5Mn-0.2Zr | 3.98 × 10⁻⁸ | −0.91 |
| 4#:Al-3Mg-0.5Mn-0.2Cu | 6.97 × 10⁻⁸ | −0.79 |
| 5#:Al-3Mg-0.5Mn-0.2Si | 6.25 × 10⁻⁸ | −0.97 |
| 6#:Al-3Mg-0.5Mn-0.2Zn | 9.34 × 10⁻⁹ | −0.85 |
© 2020 by the authors. Licensee MDPI, Basel, Switzerland. This article is an open access article distributed under the terms and conditions of the Creative Commons Attribution (CC BY) license (http://creativecommons.org/licenses/by/4.0/).
Share and Cite
MDPI and ACS Style
Li, Q.; Li, M.; Lu, G.; Guan, S.; Zhang, E.; Xu, C. Effect of Trace Elements on the Crystallization Temperature Interval and Properties of 5xxx Series Aluminum Alloys. Metals 2020, 10, 483. https://doi.org/10.3390/met10040483
AMA Style
Li Q, Li M, Lu G, Guan S, Zhang E, Xu C. Effect of Trace Elements on the Crystallization Temperature Interval and Properties of 5xxx Series Aluminum Alloys. Metals. 2020; 10(4):483. https://doi.org/10.3390/met10040483
Chicago/Turabian StyleLi, Qianqian, Mengjia Li, Guangxi Lu, Shaokang Guan, Engui Zhang, and Cong Xu. 2020. "Effect of Trace Elements on the Crystallization Temperature Interval and Properties of 5xxx Series Aluminum Alloys" Metals 10, no. 4: 483. https://doi.org/10.3390/met10040483
Note that from the first issue of 2016, this journal uses article numbers instead of page numbers. See further details here.