Article

Refining As-Cast Structures of Novel SixTiVCrZr High-Entropy Alloys Using Estimated Effective Solidification Temperature Obtained Using Chvorinov’s Rule

Dept. Materials Science & Engineering, The University of Sheffield, Sir Robert Hadfield Building, Portobello St, Sheffield S1 3JD, UK
*
Author to whom correspondence should be addressed.
Metals 2020, 10(3), 317; https://doi.org/10.3390/met10030317
Submission received: 29 January 2020 / Revised: 25 February 2020 / Accepted: 26 February 2020 / Published: 28 February 2020
(This article belongs to the Special Issue Alloy Design)

Abstract

:
High-entropy alloys (HEAs), i.e., multicomponent alloys where (typically five or more) elements are combined in equal, or roughly equal, quantities, are of great current interest, due to their formation of single, simple structured phases, and the unusual properties they can potentially exhibit. Phase presence may be predicted using semi-empirical methods, but deviations from predictions may be seen during the course of alloy synthesis, with the formation of unexpected phases. The generation of such phases may be controlled with knowledge of the effective solidification temperature; in this full article, Chvorinov’s rule for solidification time is used to estimate this temperature as part of the design of a new multiphase alloy system, TiVCrZr-Six. Further heat treatment of the TiVCrZr-Si system confirms the applicability of this approach. The new compositions demonstrate mechanical properties that suggest potential for optimization for high-temperature applications.

1. Introduction

High-entropy alloys (HEAs) are alloys with multiple elements and no clear solvent (sometimes the compositional range is taken to be 5–35 at.% of each [1]), where, for certain combinations, the resultant alloy displays few phases (possibly single phase), often of simple structures such as face-centred cubic (FCC) or body-centred cubic (BCC). As a relatively new class of metallic materials, they are the subject of much current interest, understanding their structure, properties, and potential applications [2,3,4]. While there are many definitions, here, we are exploring the wider range of alloy types which are classified by Miracle and Senkov in their review [5] as multi-principal element alloys, without an implication for the phase makeup encountered, and more particularly the class identified by these authors as complex concentrated alloys (CCAs) defined compositionally as above, but allowing multiphase microstructures (which may be desired for the purposes of property refinement, such as improvement of the mechanical properties).
Much work focused on the prediction of HEA formation in new alloys. While there are many approaches, from electronic structure-based [6] to selection-based approaches on thermodynamically derived parameters [7], some of the widest used are empirical limits set on certain atomic and thermodynamic parameters, attempting to predict conditions that will lead to stabilisation of the disordered solid solution phase and suppression of ordered intermetallics. While not absolute, these routes are suggested to offer an easily accessible first indication of the potential for an untested system to produce either an HEA or a multiphase alloy.
It is notable that absolute stability of simple structures in HEAs is uncertain, as it was found that even some “single-phase” alloys can show the formation of precipitates on long-term annealing [8], or, when examined under high-energy X-rays, prove to consist of several phases of similar characteristics [9].
Current research effort is focused on the design of useful HEAs for particular applications, with many strategies proposed [10]. However, the possibility of using HEAs as a base composition to deliberately create potentially desirable (and, strictly speaking, non-HEA) multiphase alloys was not extensively explored. This is now a feasible route as several dozens of HEA compositions were reported in the literature, covering a wide range of elements, including transition metals and refractory elements (see, for example, the online supporting information of Reference [11]), making selection of alloys in a wide range of types possible. In order to properly manipulate the microstructure to the desired form, heat treatment is the usual method in many metallic systems. The response of an alloy is different at different temperatures, with many general similarities when the homologous temperature (the heat treatment temperature normalised by the melting point) is used. For rapid alloy design, arc-melting is typically the favoured method for quick synthesis allowing subsequent characterisation of predicted compositions. However, this synthesis route is susceptible to superheating and, hence, may result in the presence of metastable phases depending on the degree of undercooling generated. Heat treatment is often required to achieve reproducible results. However, one alternative approach to rapidly access such information is the use of Chvorinov’s rule to estimate solidification time. In this work, we carry out an element substitution alloy design process, to evaluate the effectiveness of this approach.

2. Methodology: Alloy Design

2.1. Element Substitution

In this work, our goal is to produce multiphase alloys, rather than single-phase alloys. To do this, the process used begins by taking a reported HEA composition and then strategically substituting one of the elements (for example, with high cost or another characteristic less desirable for the end application) with an alternative element, which moves the alloy away from the typical conditions under which HEAs can form. This would be expected to cause the formation of ordered (intermetallic) phases, with the quantity of the substituted element being a means to control the volume fraction of ordered phases produced, and to optimise properties.
For this example, a known HEA was selected, the equiatomic TiVCrZrNb introduced by Senkov et al. [12,13]. It should be noted at this point that, throughout this work, compositions are referred to by atomic ratios. This alloy is reported to consist of a BCC phase (disordered) and an ordered Laves phase. Of the elements contained within this, niobium possesses the highest cost and greatest density; thus, this was selected for substitution. For simplicity, complete substitution with another element was performed, although it is recognised that partial substitution may be effective. The level of the substituted element was allowed to vary both above and below equiatomic with the other elements, for the purpose of allowing for a greater degree of control over second-phase content.
For this substitution, we elected to use silicon. Silicon has the potential to be a desirable addition, as it is a strong former of silicide intermetallics, which are temperature-stable, has a relatively low density and cost, and can improve oxidation resistance in a variety of alloys by forming a protective oxide layer of SiO2 [14], including in high-entropy compositions [15,16]. Silicon was attempted as an addition to HEAs or similar equiatomic single phase alloys before, although notably in largely unsuccessful attempts to avoid the formation of second phase [17] and not to cause deliberate departure from HEA behaviour. In one example, less than equimolar amounts of Si were added in an attempt to avoid intermetallic formation, but ultimately resulted in the formation of (Nb,Ti)5Si3 [15]. Through thermodynamic analysis, this was attributed to a highly negative enthalpy of mixing between Si and Nb and Ti. In the alloy (FeCoNiCrAl)99Si1 [18], the small addition of Si was found, on heat treatment, to produce additional phases in the alloy. Evidence does, however, exist of successful tailoring of the Si addition to avoid intermetallics; in the system AlCoCrFeNiSix with values of x from 0 to 1, only small amounts of the intermetallic delta phase were observed, even under equiatomic conditions, with the conclusion that the silicon was largely accommodated in solid solution [19].
The approach used here results in initial consideration being given to SixTiVCrZr (x = 0, 0.5, 1, 1.5), to ensure a range of silicon contents are evaluated. Following Yang and Zhang’s approach for HEA prediction, parameters δ and Ω (Ω = Tm/Tc) can be evaluated for these new alloys. The calculation method of Ω and δ is detailed fully in Reference [20]. In this study, ΔHmix is calculated from ΔHABmix values obtained by Takeuchi and Inoue [21]. Both of the parameters Ω and δ are significant in the prediction of solid solution formation, with greater values of Ω and smaller values of δ making solid solution formation more likely. The empirical criteria for obtaining a solid solution in HEAs proposed by Yang and Zhang are Ω ≥ 1.1 and δ ≤ 6.6%; for equiatomic version of the new alloy, the values are calculated to be Ω = 0.65 and δ = 18.6%, clearly predicting that the simple disordered solid solution structure characteristic of HEAs is not expected to occur.
The predicted effect of the level of silicon addition is demonstrated in Figure 1, which shows the values calculated for the critical temperature for the suppression of intermetallics, Tc [22], and the melting point (for this initial view, estimated coarsely through simple rule of mixtures calculation from the elemental melting points). The criterion of Ω ≥ 1.1 essentially captures the concept that the temperature below which the Gibbs free energy of formation of intermetallic phases is negative (Tc) must be below the melting point, leaving a minimum temperature range in which the material can become solid while not forming ordered phases, allowing kinetically stabilised microstructures to form. Applying this shows that, while the four-component alloy has the potential to form a single-phase disordered solid solution, the solid solution phase would be destabilised from x = 0.5 onwards. This range of additions is, therefore, a potentially fruitful one in which to search, as second phases are expected in different amounts.

2.2. CALPHAD Temperature-Volume Fraction Property Diagrams

To obtain more information on the phase formation in TiVCrZr-Six alloys, phase diagram calculations, using Thermo-Calc Software (v12, Råsundavägen, Sweden) on the SSOL4 database [23], were firstly performed. Following this, temperature-volume fraction property diagrams (diagrams generated by Thermocalc, showing the calculated fraction of each phase predicted to be present in the alloy at equilibrium at different temperatures) were generated to determine the phase present on solidification, and to understand how this would change if the system were to be able to adjust itself to remain at equilibrium.
Figure 2 demonstrates the property diagrams for several TiVCrZr-Six compositions (x = 0, 0.5, 1, and 1.5). It can be observed that highly complex mixtures of four or five phases (consisting of combinations of BCC, C15, SiZr2, Si3Ti5, SiV3, and Si2Zr3 phases) can be in equilibrium together at different temperatures. While this does not preclude them from being useful, the complexity of such massively multiphase microstructures would make the development of alloys for applications challenging. However, it was suggested that many HEAs and, by extension, multi-principal component alloys are likely to be in a metastable state at room temperature, representing a structure from higher temperature which did not have sufficient time to undergo transformations.
Effective small-scale, rapid alloy design, therefore, requires an understanding of how processing techniques and metastability can influence the phases present. To understand this, we use two temperatures (the melting temperature, Tm, and the effective solidification temperature, Teff) to determine the temperature at which solidification occurs for an as-cast composition, via the standard synthesis route of water-cooled copper-cast arc-melting in an inert Ar atmosphere. These two temperatures, as determined by the procedures below, are represented by solid red lines and dashed blue lines, respectively, in Figure 2.
The red lines present in Figure 2 indicate an estimate of the melting temperature, Tm, of each composition, determined from the CALPHAD results plotted in the figure, by identifying the point at which the liquid phase is first predicted to appear. This requires the assumption that solidification is happening under equilibrium conditions, which is unlikely to be the case for real processing. For values of x = 0, 0.5, and 1.0, Tm values correspond to 1420 K, 1610 K, and 1800 K respectively. The rule of mixtures Tm previously calculated and used for the analysis shown in Figure 1 appears to be higher (2108 K, 2061 K, 2023 K, and 1993 K for x = 0, 0.5, 1.0, and 1.5, respectively) than those predicted from Figure 2 (1500 K, 1440 K, 1560 K, and 1720 K for x = 0, 0.5, 1.0, and 1.5, respectively); the values predicted from Figure 2 are 71%, 70%, 77%, and 86% for x = 0, 0.5, 1.0, and 1.5, respectively, of the values predicted from the rule of mixtures. One possible explanation for this gradual increase is that the simple rule of mixtures approach ignores any possible interactions between the elements, leading to suppression of the melting point.
The blue lines in Figure 2 indicate an effective solidification temperature estimated using Chvorinov’s rule. This formulation relates solidification time to the volume and surface area of the as-cast composition.
t = ( p m × L T m T 0 ) 2 × ( π 4   k × p × c ) × ( 1 + ( c m × Δ T s L ) 2 ) × ( V A ) n ,
where Tm is the melting temperature of the liquid, T0 is the initial temperature of the mould, ΔTs is the superheating temperature, L is the latent heat of fusion, k is the thermal conductivity of the mould, p is the density of the mould, c is the specific heat of the mould, pm is the density of the melt, and cm is the specific heat of the melt. The exponent n is here taken to be 1.75, following DeGarmo et al. [24]. The mould used during arc-melting is copper, and its thermal conductivity, density, and specific heats are known and are substituted into the equation. The melting temperature of the liquid is obtained from Figure 2 as discussed previously. The initial temperature of the mould and the superheating temperature can be estimated by
Δ T s = T h T m = P × n E m × c m T m ,
where Th is the temperature to which the melt is heated to, which may be estimated by using the principle of conservation of energy, P is the power supplied to the arc (taken from the manufacturer’s data), nE is the efficiency, which we assume here to be 90% as the process is carried out in vacuum, and m is the mass (5 g) of the melt. Using rule of mixtures estimated values for the density, thermal conductivity, and specific heat of the metal, the solidification time can be found. From this, the effective solidification temperature, Teff is determined from Teff = Tmt∙δT/dt. The cooling rate δT/dt for arc-melting is estimated as 1 × 10⁴ K·s−1. Calculated Teff values are determined to be 1064 K, 1069 K, 1377 K, and 1640 K for x = 0, 0.5, 1, and 1.5, with these values corresponding to 0.71 Tm, 0.74 Tm, 0.88 Tm, and 0.95 Tm, respectively. The increased change in these fractions is correlated to the increase in the specific heat of the melt due to increasing Si addition.
Both Tm and calculated Teff values are employed to predict the proportion of phases present at both temperatures for each of the compositions (by referring to Figure 2), with the results plotted as a function of silicon content, x, in Figure 3. All silicides predicted to be present are grouped together, as (1) they are expected to share similar mechanical properties [25] and have a similar effect on the behaviour of the overall alloy, and (2) it is uncertain which silicides would form due to the strong likelihood of local segregation within the system.
Figure 3 shows that, in both figures, none of the modified versions of the alloy examined would be HEAs, due to the presence of multiple phases including significant amounts of ordered phases; this is unsurprising as the original alloy, TiVCrZr-Nb, contained a Laves phase. However, as pointed out by Miracle and Senkov [5], this does not preclude their usefulness. As expected, the calculations indicate that increasing alloying additions of Si to TiVCrZr forms several silicide phases. In comparison, the Laves C15 phase (predicted to be ZrCr2) appears to be diminished by the addition of Si to the composition. This may be attributed to Zr2Si formation, which is a more stable phase (since ΔH = −10.67 and −74.67 for ZrCr2 and Zr2Si, respectively). These results appear to be in relatively close agreement with the predictions of Ω values.
Comparing the two graphs in Figure 3, the stability of the BCC phases appears to be enhanced if it is assumed that solidification takes place at T = Tm (the condition shown on the left in Figure 3). In this case, it is not predicted that the Laves C15 phase will form for the TiVCrZr-Si1 composition, whereas it is predicted to be present if it is assumed solidification takes place at T = Teff. Additionally, although the molar contents of the silicides are also reduced at T = Tm, the reduction is not large, with the change in content primarily due to competition between the BCC and Laves C15 structure. The key difference between the results when using each temperature value is the rapid reduction of the C15 fraction when utilising T = Teff.
The theoretical assessment of the effect of the removal of Nb from the known equiatomic TiVCrZr-Nb and the inclusion of silicon indicates that various silicide phases can be formed (with the amount controlled by the level of Si addition), at the expense of the disordered BCC phase, and, to a high proportion, the C15 Laves phase. It would be expected, therefore, that the strength would be increased at the expense of ductility (with low ductility being expected for the higher levels of addition), although the removal of the low-ductility Laves phase may offset this for additions up to around the equiatomic level. At the same time, the substitution will benefit both the alloy cost and the density. For example, comparing equiatomic TiVCrZr-Nb and equiatomic TiVCrZr-Si, the rule of mixtures estimates for density of each (6.83 g/cm3 vs. 5.77 g/cm3) would suggest a reduction of 16%. Although the multi-phase nature of the alloy will mean this is not fully accurate, it is indicative of a beneficial effect.
In order to confirm the predictions made here and to determine if utilising the effective temperature as determined through Chvorinov’s rule is a useful tool in predicting the phases occurring in experimental processing, the alloys were synthesised and characterised.

3. Methodology: Experimental

3.1. Alloy Production

From the predictions it was decided that additions at the equiatomic level or below were worthy of consideration; thus, these were investigated experimentally. Samples of TiVCrZr-Six (x = 0, 0.5, and 1.0) alloys were produced from elemental material of at least 99.9% purity. Firstly, 5 g of the alloy was melted into a button of ~10 mm diameter in an argon backfilled vacuum arc-melter (MAM1 Buehler, Bodelshausen, Germany); the button was re-melted and flipped to improve homogeneity. The weight of the melted samples was checked against the amounts weighed out before melting to ensure that less than 2% weight loss was observed in each case. The current output of the MAM1 Buehler was kept at maximum for each melt, and each melt was heated for a total of 10 s such that power input was kept constant. Each cast was only performed once the system components (tip, hearth, mould, etc.) were cooled down to room temperature, to avoid changes in resistance that occur with increased temperatures that can affect energy output.
Where mechanical testing was required, a further button was made up and remelted under vacuum and cast into a 3-mm-diameter rod in a water-cooled copper hearth, which was used to cut a cylinder 6 mm long for compression testing. For compression testing, following the ASTM E9-89A standard, a length-to-diameter ratio of slightly more than two is desired. This is achieved by firstly sectioning the rod such that a length of slightly more than 6 mm is obtained. Following this, both rod ends are ground and polished such that they are parallel to one another, and to obtain a final length of 6 ± 0.1 mm.

3.2. Alloy Testing

Alloy density was measured three times using Archimedes’ principle. The sample underwent grinding and polishing to a mirror finish in preparation for microstructural and compositional analysis in addition to hardness testing. The crystal structure of the alloy was characterised using a Bruker D2 Phaser X-ray diffractometer (XRD) (Bruker, Coventry, UK) with Cu Kα radiation, and a software package for measurement and analysis. The microstructure of the sample was examined by a scanning electron microscope (SEM, FEI Inspect F, Mérignac Cedex, France) with 15-keV accelerating voltage, equipped with energy-dispersive X-ray spectrometry (EDS) to identify the chemical composition of phases. The alloy was also subjected to Vickers hardness testing, with indentations in five random locations using a Zwick ZH30 system (Zwick/Roell, Kennesaw, GA, USA) with a load of 10 kg and dwell time of 10 s.
Compression testing was performed on a Zwick Z050 compression testing machine (Zwick/Roell, Kennesaw, GA, USA) on samples with a length-to-diameter ratio of two (sample preparation methods are detailed above) using a strain rate of 4 × 10⁻⁵ s−1. Machine compliance tests were performed prior to the deformation of each individual sample and subtracted from the test results.

4. Results and Discussion

4.1. Structural Characterisation of As-Cast TiVCrZr-Six Compositions

The microstructures of the alloys in the as cast condition, as determined by examination in the scanning electron microscope (backscattered electron imaging mode), are shown in Figure 4. Energy-dispersive X-ray spectrometry (EDS) maps were taken to show the distribution of the elements in each case (Figure 5).
There is a clear evolution in the microstructure with silicon addition. The EDS results help with the interpretation of the phases present in each case, and the observations are summarised in Table 1. For the alloy without silicon (TiVCrZr), there appears to be two visible phases, one rich in Cr, the other rich in Ti, with V and Zr fairly uniformly distributed between them. The lighter-contrast phase (shown by EDS to be Cr-rich compared to the overall composition) seems to have grown dendritically, with the Ti-rich phase forming in the interdendritic region. For the alloy with silicon added at half the level of the other elements (TiVCrZr-Si0.5), the Cr-enriched and Ti-enriched regions still exist, but are joined by a third phase where Zr and Si are concentrated (likely to be a silicide phase; from the CALPHAD predictions, Zr2Si is expected) and a fourth phase, rich in V but depleted in all the other elements, except for Ti. There also appears to be a relationship between the Ti-rich and the Si-rich phase, suggesting that they may be involved in transformation or nucleation together. The final alloy, the equiatomic TiVCrZr-Si, shows, as would be expected, a larger amount of the Si-rich phase, which appears to be more strongly associated with Zr and is, therefore, likely to be Zr2Si. Interestingly, this alloy does not show partitioning of the titanium to as strong an extent as in previous alloys, although there are still at least three clearly discernible phases, two of which appear to have a relationship with each other, and the other is Cr-rich. There is also possibly still the V-rich phase, although this is very fine-scale. Predictions from the property diagram indicate that, at equilibrium under room temperature conditions, the equiatomic alloy should consist of Ti5Si3, a Laves (C15) phase, Zr2Si, V3Si, and a disordered BCC solid solution phase. This could be in agreement with the observed microstructure if the silicides occur together and are hard to resolve in the imaging used.

4.2. XRD of As-Cast TiVCrZr-Six Compositions

The XRD patterns, shown in Figure 6, have peaks corresponding to multiple phases. In the alloy without silicon (equimolar TiVCrZr) indexing the peaks on the XRD pattern shows that two phases are present, a Laves C15 ZrCr2-like structure with a lattice parameter of 7.29 Å (in good agreement with experimental data of this compound, 7.21 Å [26]) and two BCC structures with lattice parameters BCC (1): 3.14 Å and BCC (2): 3.32 Å. According to the predictions from CALPHAD discussed earlier, the expected nominal compositions of both phases are BCC (1): Ti30V23Cr18Zr30 and BCC (2): Ti25V38Cr25Zr13.
These findings are supported by the two major phases observed in the EDS results discussed above, with one Ti-enriched and the other Cr-enriched. On the addition of the smaller amount of silicon (in the alloy Si0.5TiVCrZr), the BCC (2) peaks disappear, and new BCC (3) peaks are observed with a lattice parameter of 3.13 Å (sharing similar values with BCC (2)), while the lower intensity of the C15 Laves phase peaks suggests a reduction in volume of that phase. According to the CALPHAD predictions, the BCC (3) structure has an expected composition of Ti29V39Cr25Zr07. This is again in good agreement with the EDS analysis (where phases which are both V-enriched and Zr-depleted are observed). The predictions also suggest the formation of multiple silicides; the enthalpies of mixing of these are highly negative, with Si-Zr (ΔH = −84 kJ/mol), Si-Ti (ΔH = −66 kJ/mol), Si-V (ΔH = −48 kJ/mol), and Si-Cr (ΔH = −37 kJ/mol) [21], suggesting a depletion of these elements from the C15 and BCC (1) phase present in the alloy without silicon.
The change in the BCC compositions can be explained by removal of Zr and Ti from the solid solution. Based on Si-X enthalpy of mixing values, Zr will first be removed from the solid solution (having the most negative ΔH), followed by Ti (having the second most negative ΔH), as more Si is added. Since Zr would preferentially form SiZr2/Si2Zr3 and C15 Laves phase, the BCC phases are destabilised. Since the two most positive enthalpy of mixing values are Ti-V (ΔH = −2 kJ/mol) and Cr-V (ΔH = −2 kJ/mol), if a new solid solution phase were to form, Cr would find itself in solution with V (having, as it does, the least negative enthalpy of mixing of all the Si-X pairs; thus, combination of the Ti and Si would be preferred). Ti depletion from this solid solution is expected with increasing Si addition, which may lead to further destabilisation of the BCC structure.
Employing the rule of mixtures to estimate the BCC lattice parameters leads to TiVCrZr: 3.12 Å (BCC (1)) and 3.24 Å (BCC (2)), TiVCrZr-Si0.5: 3.09 Å (BCC (3)), and TiVCrZr-Si1: 3.03 Å (BCC (3)). These are in agreement with the experimental results where TiVCrZr: 3.14 Å (BCC (1)) and 3.32 Å (BCC (2)), TiVCrZr-Si0.5: 3.13 Å (BCC (3)), and TiVCrZr-Si1: 3.12 Å (BCC (3)) were found. For the final alloy, equiatomic TiVCrZr-Si, Si appears to further inhibit the formation of the C15 and BCC structure, following the hypothesis presented above. The unidentified peaks in all spectra are not resolved due to the low intensities and signal-to-noise ratios but are believed to correspond to the silicides, as observed in the SEM/EDS output.
Of particular interest is that the C15 phase is present for all TiVCrZr-Six (x: 0, 0.5, and 1.0) compositions. Recalling the predictions from Figure 3, at T = Tm, the C15 phase fraction is expected to reduce to 0 by x: 1.0. Utilising T = Teff predicts that the C15 phase fraction reduces to 0 by x: 1.5, which is in better agreement with the experimental results; this suggests that solidification under these conditions in this system is not taking place at T = Tm, but that there is some undercooling present and, as a result, that Chvorinov’s rule is a good estimate for determining what phases might be expected from CALPHAD methods (although it must be noted that the CALPHAD results may be inaccurate as this is quite a novel system). The large presence of C15 phases implies that the solidification time is larger than anticipated in our calculations, which is attributed to the treatment of the mould as a simple copper mould. Increased model complexity would be required to obtain more accurate results, but the work done here demonstrates how a relatively low-fidelity method can result in guidance for useful predictions that can be refined at a later time on just the compositions of greatest interest. It may, therefore, be concluded that the effective temperature as determined through Chvorinov’s rule is a useful tool in predicting the phases occurring in experimental processing.
From this, it may be also inferred that arc-melting synthesis and the resulting testing of as-cast samples can return unexpected results due to this phenomenon, and care must be taken during alloy design if using arc-melting as a synthesis route.

4.3. Mechanical Properties of TiVCrZr-Six Compositions

The hardness of equiatomic TiVCrZr-Si was 684 HV10 (standard deviation 31), or 6.7 GPa, and the density was measured as 5.41 g/cm3 (standard deviation 0.07), confirming an elevated hardness and a low density (slightly lower than that of the simple rule of mixtures estimate) for the alloy. As the variable level of silicon was expected to have a significant impact on the material properties, all samples (x = 0, 0.5, and 1.0) were cast as cylinders and tested in compression.
Once corrected for machine compliance, the stress-strain curves, shown in Figure 7, gave mechanical property values summarised in Table 2. Where repeat tests were possible, the alloys show good consistency.
The addition of silicon increases the Young’s modulus from that of the alloy without, and there is a further increase with increasing silicon level. Interestingly (although with some caution as it was only possible to test one sample), the alloy with a relative Si content of 0.5 shows evidence of plastic deformation post yield, apparently more than both the other compositions. As the values in Table 2 show, there is a significant increase in the load between yield and failure for the alloy without silicon, indicating some post-yield deformation, while, in the alloy with equiatomic silicon addition, failure occurs at yield, showing brittle behaviour. Visual examination of the fracture surfaces showed faceting typical of brittle failure. From the SEM and EDS results shown in Figure 4 and Figure 5, it appears that, on first incorporating silicon and going from x = 0 to x = 0.5, the vanadium and zirconium are reduced in the Cr-rich main phase (likely to be the disordered BCC phase) as they are incorporated in the silicides formed.
This reduction in solid solution strengthening of the matrix could allow for greater plastic deformation, and the decreased strength and increased ductility observed. With further silicon addition, up to the equiatomic level, this process is not reversed; rather, the fraction of silicide phases (which are expected to be relatively high hardness and low ductility [25]) is increased to the point where the material cannot accommodate any plastic deformation before failure. In comparison, with regard to ductility, the optimum molar amount of Si to obtain a high plastic strain in a AlCoCrFeNiSix HEA was found to be 0.4, with plastic fracture observed at x = 0.2 and x = 0.4 [19], and the indications from this work is that a similar level of addition is the limit here, albeit in a largely different system.
The alloy with silicon at the 0.5 relative level still contains an appreciable quantity of silicides and C15 Laves phase, but is able to display some level of ductility (around 1% plastic deformation). This, coupled with the high yield strength of almost 1 GPa and the reduced density and raw material cost over the parent TiVCrZr-Nb alloy, makes this composition the most interesting of those studied in this system from a structural point of view. It is possible that, with detailed examination of the mechanism of deformation and optimization of the microstructure, these properties could be increased further.

5. Conclusions

This work demonstrated an approach to the design of new multiphase, multicomponent alloys, using a known high-entropy alloy as a base. From this, a strategic substitution of an element, in this case silicon, was made, which should impart favourable properties. At the same time, this also creates an alloy which is incapable of satisfying the common requirements for the effects (such as the formation of a single phase from multiple components) ascribed to HEAs. The multiphase alloys that result, while not HEAs under the strictest definitions, have the potential to be tailored to be suitable for a range of different applications, especially those with mechanical requirements.
Here, the alloys TiVCrZr, TiVCrZr-Si0.5, and TiVCrZr-Si were designed and their phase compositions predicted through CALPHAD, interpreted for realistic processing through use of Chvorinov’s Rule. On experimental processing, these alloys do indeed adopt multiphase structures, consisting of disordered BCC solid solution phases and ordered Laves and silicide intermetallic phases in different quantities. The properties of the alloys show that, along with the expected reduction in density, the strength (as measured in compression) can be very high, while, for an addition of Si at half the atomic fraction of the other elements, a degree of ductility can be preserved. While further investigation of the alloys and the effect of the many potential conditions for processing and service would have to be performed to assess if this formulation can show suitable microstructure and properties to be of use, these experiments serve to show how this simple approach can rapidly find interesting alloys where the behaviour can be tuned to attempt to meet the requirements of an application.

Author Contributions

Conceptualisation, Z.L. and R.G.; investigation, Z.L., Y.H., M.B., B.J., G.K., J.P., M.S., L.S., and S.Z.; supervision, R.G.; writing—original draft, Z.L. and Y.H.; writing—review and editing, Z.L., M.B., B.J., G.K., J.P., M.S., L.S., S.Z., and R.G. All authors have read and agreed to the published version of the manuscript.

Funding

R.G. would like to acknowledge a fellowship supported by the Royal Academy of Engineering under the RAEng/Leverhulme Trust Senior Research Fellowships scheme.

Acknowledgments

The authors would like to acknowledge the participation of Christopher Roger in the experimental work.

Conflicts of Interest

The authors declare no conflicts of interest.

References

  1. Yeh, J.-W.; Chen, S.-K.; Lin, S.-J.; Gan, J.-Y.; Shun, T.-S.; Tsau, C.-H.; Chang, S.-Y. Nanostructured high-entropy alloys with multiple principal elements: Novel alloy design concepts and outcomes. Adv. Eng. Mater. 2004, 6, 299–303. [Google Scholar] [CrossRef]
  2. Zhang, Y.; Zuo, T.T.; Tang, Z.; Gao, M.C.; Dahmen, K.A.; Liaw, P.K.; Lu, Z.P. Microstructures and properties of high-entropy alloys. Prog. Mater. Sci. 2014, 61, 1–93. [Google Scholar] [CrossRef]
  3. Pickering, E.J.; Jones, N.G. High-entropy alloys: A critical assessment of their founding principles and future prospects. Int. Mater. Rev. 2016, 63, 183–202. [Google Scholar] [CrossRef] [Green Version]
  4. Tsai, M.; Yeh, J. High-entropy alloys: A critical review. Mater. Res. Lett. 2014, 2, 107–123. [Google Scholar] [CrossRef]
  5. Miracle, D.B.; Senkov, O.N. A critical review of high entropy alloys and related concepts. Acta Mater. 2017, 122, 448–511. [Google Scholar] [CrossRef] [Green Version]
  6. Leong, Z.; Wróbel, J.S.; Dudarev, S.L.; Goodall, R.; Todd, I.; Nguyen-Manh, D. The effect of electronic structure on the phases present in high entropy alloys. Nat. Sci. Rep. 2017, 7, 39803. [Google Scholar] [CrossRef]
  7. Tancret, F.; Toda-Caraballo, I.; Menou, E.; Díaz-Del-Castillo, P.E.J.R. Designing high entropy alloys employing thermodynamics and Gaussian process statistical analysis. Mater. Des. 2017, 115, 486–497. [Google Scholar] [CrossRef]
  8. Pickering, E.J.; Muñoz-Moreno, R.; Stone, H.J.; Jones, N.G. Precipitation in the equiatomic high-entropy alloy CrMnFeCoNi. Scr. Mater. 2016, 113, 106–109. [Google Scholar] [CrossRef]
  9. Dahlborg, U.; Cornide, J.; Calvo-Dahlborg, M.; Hansen, T.C.; Leong, Z.; Dominguez, L.A.; Chambreland, S.; Cunliffe, A.; Goodall, R.; Todd, I. Crystalline structures of some high entropy alloys obtained by Neutron and X-ray diffraction. Acta Phys. Pol. 2015, 128, 552–556. [Google Scholar] [CrossRef]
  10. Tsai, M.-H. Three strategies for the design of advanced high-entropy alloys. Entropy 2016, 18, 252. [Google Scholar] [CrossRef]
  11. Asensio-Domınguez, L.; Goodall, R.; Todd, I. Prediction and validation of quaternary high entropy alloys using statistical approaches. Mater. Sci. Technol. 2015, 31, 1201–1206. [Google Scholar] [CrossRef]
  12. Senkov, O.N.; Senkova, S.V.; Miracle, D.B.; Woodward, C. Mechanical properties of low-density, refractory multi-principal element alloys of the Cr–Nb–Ti–V–Zr system. Mater. Sci. Eng. A 2013, 565, 51–62. [Google Scholar] [CrossRef]
  13. Senkov, O.N.; Senkova, S.V.; Woodward, C.; Miracle, D.B. Low-density, refractory multi-principal element alloys of the Cr–Nb–Ti–V–Zr system: Microstructure and phase analysis. Acta Mater. 2013, 61, 1545–1557. [Google Scholar] [CrossRef]
  14. Kim, B.G.; Kim, G.M.; Kim, C.J. Oxidation behavior of TiAl-X (X = Cr, V, Si, Mo or Nb) intermetallics at elevated temperature. Scr. Metall. Mater. 1995, 33, 1117–1125. [Google Scholar] [CrossRef]
  15. Liu, C.M.; Wang, H.M.; Zhang, S.Q.; Tang, H.B.; Zhang, A.L. Microstructure and oxidation behavior of new refractory high entropy alloys. J. Alloys Compd. 2014, 583, 162–169. [Google Scholar] [CrossRef]
  16. Gorr, B.; Mueller, F.; Christ, H.-J.; Mueller, T.; Chen, H.; Kauffmann, A.; Heilmaier, M. High temperature oxidation behavior of an equimolar refractory metal-based alloy 20Nbe20Moe20Cre20Tie20Al with and without Si addition. J. Alloys Compd. 2016, 688, 468–477. [Google Scholar] [CrossRef] [Green Version]
  17. Zuo, T.T.; Li, R.B.; Ren, X.J.; Zhang, Y. Effects of Al and Si addition on the structure and properties of CoFeNi equal atomic ratio alloy. J. Magn. Magn. Mater. 2014, 371, 60–68. [Google Scholar] [CrossRef]
  18. Liu, W.H.; Wu, Y.; He, J.Y.; Zhang, Y.; Liu, C.T.; Lu, Z.P. The phase competition and stability of high-entropy alloys. JOM 2014, 66, 1973–1983. [Google Scholar] [CrossRef]
  19. Zhu, J.M.; Fu, H.M.; Zhang, H.F.; Wang, A.M.; Li, H.; Hu, Z.Q. Synthesis and properties of multiprincipal component AlCoCrFeNiSix alloys. Mater. Sci. Eng. A 2010, 527, 7210–7214. [Google Scholar] [CrossRef]
  20. Yang, X.; Zhang, Y. Prediction of high-entropy stabilized solid-solution in multi-component alloys. Mater. Chem. Phys. 2012, 132, 233–238. [Google Scholar] [CrossRef]
  21. Takeuchi, A.; Inoue, A. Metallic glasses by atomic size difference, heat of mixing and period of constituent elements and its application to characterization of the main alloying element. Mater. Trans. 2005, 46, 2817–2829. [Google Scholar] [CrossRef] [Green Version]
  22. Cunliffe, A.; Plummer, J.; Figueroa, I.; Todd, I. Glass formation in a high entropy alloy system by design. Intermetallics 2012, 23, 204–207. [Google Scholar] [CrossRef]
  23. Thermo-Calc Software SSOL4/SGTE Solutions Database Version 4. Available online: https://www.sgte.net/en/sgte-solution-database-sgsol (accessed on 14 April 2016).
  24. DeGarmo, E.P.; Black, J.T.; Kohser, R.A. Materials and Processes in Manufacturing, 9th ed.; Wiley: Hoboken, NJ, USA, 2003. [Google Scholar]
  25. Ostling, M.; Zaring, C. Mechanical properties of TM silicides. In Properties of Metal Silicides; Maex, K., Rossum, M.V., Eds.; INSPEC, The Institution of Electrical Engineers: London, UK, 1995; pp. 15–30. [Google Scholar]
  26. Soubeyroux, J.L.; Bououdina, M.; Fruchart, D.; de Rango, P. Phase stability and neutron diffraction studies of Laves phases Zr(Cr1−xMx)2 with M = (Cu0.5Ni0.5) and 0 < x < 0.2 and their hydrides. J. Alloys Compd. 1995, 231, 760–765. [Google Scholar]
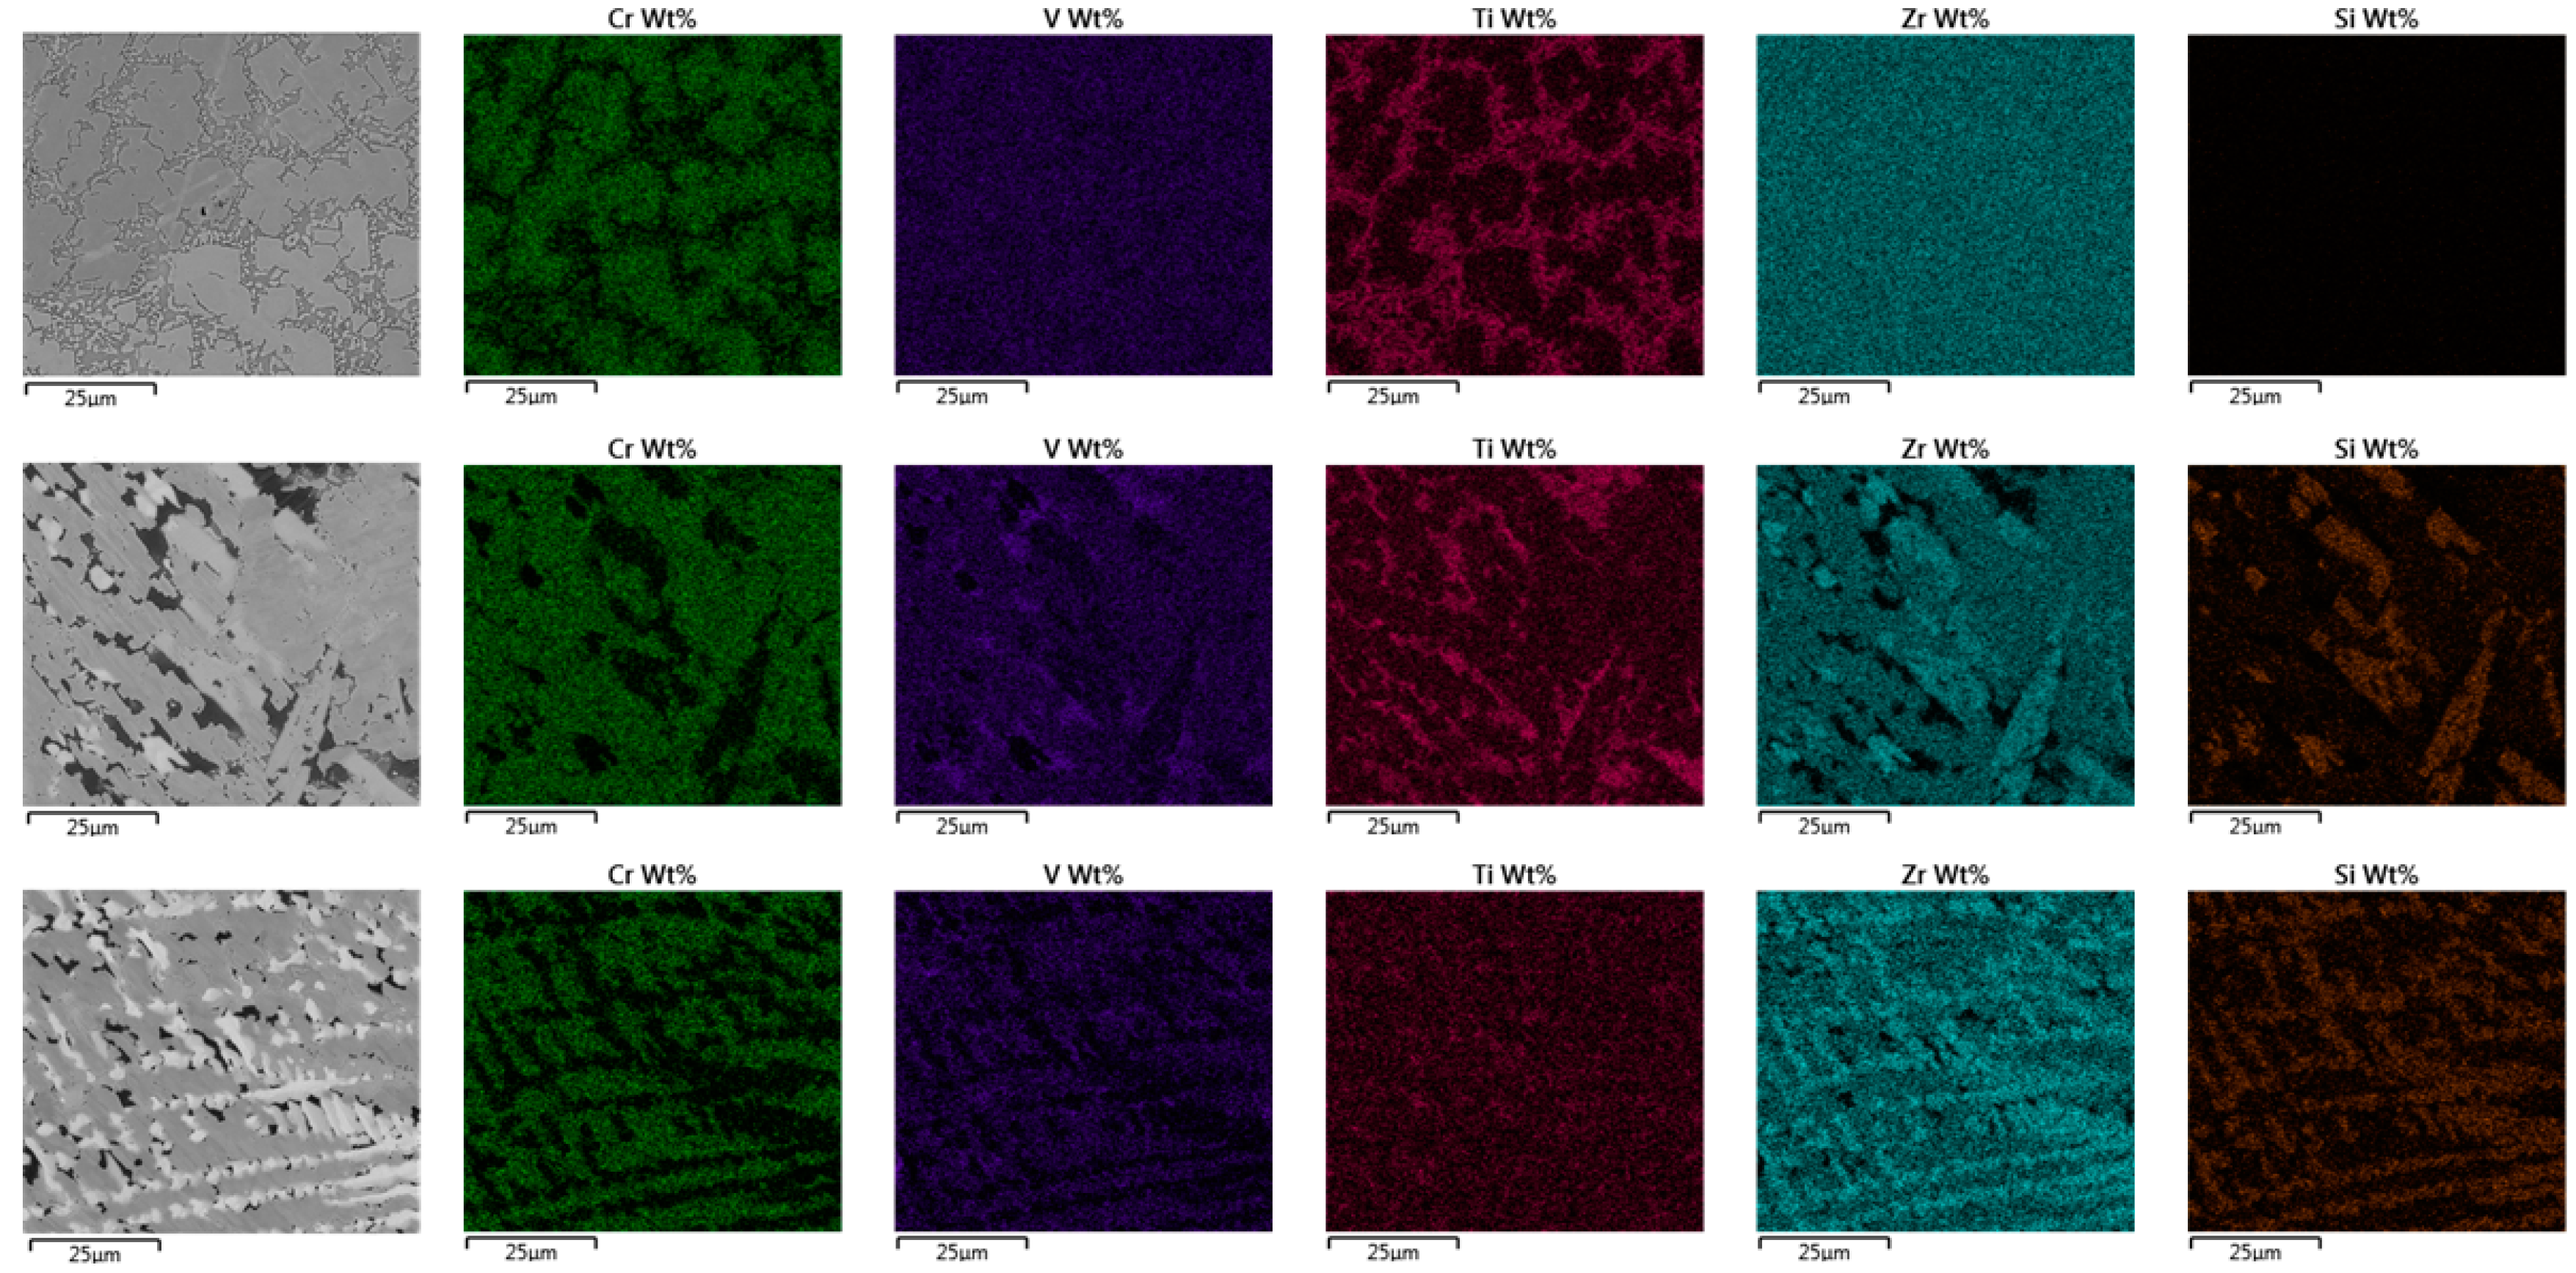
Figure 1. The values of the critical temperature for the suppression of intermetallic formation and the rule of mixtures estimated melting point for the alloys considered here (SixTiVCrZr (x = 0, 0.5, 1, 1.5)).
Metals 10 00317 g001
Figure 2. Property diagrams showing the proportions of phases present (mole fraction) for each of the alloys under consideration (TiVCrZr-Six (x = 0, 0.5, 1, 1.5)), calculated from Thermo-Calc. The solid red line denotes the melting temperature, Tm, while the dashed blue line denotes Teff = 0.85 Tm, giving an example of which present phases may be found using Chvorinov’s rule. Teff values are determined from Equation (2).
Metals 10 00317 g002
Figure 3. Predicted mole fractions of phases present in the alloys with different amounts of Si, determined from the property diagrams shown in Figure 2 at T = Tm. All silicide phases are grouped together for the plot; Predicted mole fractions of phases present in the alloys are shown with different amounts of Si at T = Teff.
Metals 10 00317 g003
Figure 4. Backscattered electron (BE) SEM images of the microstructure of TiVCrZr-Six (where micrographs of x = 0 are shown in the top row, micrographs of x = 0.5 are shown in the middle row, and micrographs of x = 1.0 are shown in the bottom row). From left to right, the images are shown in order of their magnification (276×, 1000×, and 4000×, respectively), with the red boxes indicating zoomed regions of (ac) x = 0, (df) x = 0.5, and (gi) x = 1.0.
Metals 10 00317 g004
Figure 5. Energy-dispersive X-ray spectroscopy (EDS) maps for TiVCrZr-Six alloys showing the distribution of each element (the top row shows maps for x = 0, the middle row shows maps for x = 0.5, and the bottom row shows maps for x = 1.0).
Metals 10 00317 g005
Figure 6. The X-ray diffraction (XRD) patterns recorded for TiVCrZr-Six (x = 0, 0.5, 1.0) in the as-cast state. Triangles indicate peaks corresponding to the C15 Laves phase and circles indicate peaks corresponding to the disordered body-centred cubic (BCC) phase of which two are identified (shaded and non-shaded).
Metals 10 00317 g006
Figure 7. Stress-strain curves from compression testing of the alloys SixTiVCrZr (x = 0, 0.5, 1.0). The colour is used to indicate the alloy for each curve, with a dotted line used to show a repeat measurement (where these were possible).
Metals 10 00317 g007
Table 1. Summary of the phases and the elements concentrated in (+) or depleted from (−) them, or close to the expected level (~) relative to the overall composition for each of the alloys studied, as observed in the EDS results.
AlloyPhaseCrVTiZrSi
TiVCrZrDendritic+~~
Interdendritic~+~
TiVCrZrSi0.5Cr-rich+~
Ti-rich~~+
Silicide++
V-rich++
TiVCrZrSiCr-rich+~~~
Silicide~++
V-rich~++
Table 2. The mechanical properties derived from compression testing of the alloys SixTiVCrZr (x = 0, 0.5, 1.0).
Alloy
TiVCrZr-Six
x =
Individual SamplesAverages
E
(GPa)
σy
(GPa)
Failure Stress (GPa)E
(GPa)
σy
(GPa)
Failure Stress (GPa)
0301.822.15301.762.23
291.702.31
0.5450.971.14450.971.14
1.0551.971.97561.871.87
571.771.77

