Corrosion Behavior and Microstructure of Stir Zone in Fe-30Mn-3Al-3Si Twinning-Induced Plasticity Steel after Friction Stir Welding


1
Steel Application Engineering Team, Technical Research Center, Hyundai-Steel, 1480, Buckbusaneop-ro, Songak-Eup, Dangjin-Si, Chungnam 343-823, Korea
2
Department of Materials Science and Engineering & RIAM, Seoul National University, 1 Gwanak-ro, Seoul 08826, Korea
3
Joining and Welding Research Institute, Osaka University, 11-1, Mihogaoka, Ibaraki, Osaka 567-0047, Japan
4
Department of Advanced Materials Engineering, Korea Polytechnic University, 237, Sangidaehak-ro, Siheung-Si, Gyeonggi-do 15073, Korea
*
Author to whom correspondence should be addressed.
Metals 2020, 10(11), 1557; https://doi.org/10.3390/met10111557
Submission received: 28 October 2020
/
Revised: 18 November 2020
/
Accepted: 19 November 2020
/
Published: 23 November 2020
(This article belongs to the Section Metal Casting, Forming and Heat Treatment)
Abstract
:The effect of friction stir welding on microstructure and corrosion property was studied in Fe-30Mn-3Al-3Si (wt.%) twinning-induced plasticity steel using both an electron backscattered diffractometer and electrochemical testing (i.e., polarization test and electrochemical impedance spectroscope). The stir zone has a relatively higher corrosion resistance with uniform dissolution on the surface despite after welding, whereas the base metal shows localized corrosion attack with deep and long degradation along the grain boundaries. This is due to the corrosion-resistant coincidence site lattice boundaries caused by discontinuous dynamic recrystallization via the grain boundary bulging during the friction stir welding.

1. Introduction
For several decades, modern industries have focused on Fe-high Mn twinning-induced plasticity (TWIP) steels due to their outstanding combination of strength and ductility (>50,000 MPa%). It is reported that the mechanical twinning during the plastic deformation enhances the strain hardening rate of TWIP steels, leading to excellent mechanical properties [1]. When the stacking-fault energy of TWIP steel is between 20 and 50 mJ m−2, TWIP phenomena occur actively, which is attributed to the optimal critical twinning stress [2,3,4]. For extensive industrial applications of TWIP steels, many researchers have given consideration to the formability [5], weldability [6,7,8,9], and corrosion susceptibility [10,11] as well as the optimization of mechanical properties by tuning alloying elements and heat treatment conditions [1]. For the weldability of Fe-18Mn-0.6C-(0, 1.5)Al (wt.%) TWIP steels, friction stir welding (FSW) can suppress the degradation of mechanical properties in weldment, because of both grain refinement by dynamic recrystallization and active twinning by optimal twinning stress [6]. The advantages are attributed to a solid-state process at relatively low temperature, unlike the material re-melting occurring during fusion welding at high temperatures [12], leading to a reduction in mechanical properties due to brittle martensitic formation and elemental segregation [13]. The grain refinement of Fe-13Mn-0.5C-1.6Al (wt.%) TWIP steel after FSW results from two types of discontinuous- and continuous-dynamic recrystallization [9]. Additionally, Fe-18Mn-0.6C-(0, 1.5)Al and Fe-30Mn-3Al-3Si (wt.%) TWIP steels after FSW show an increase in the value of stacking-fault energy. This is because of an increase in non-chemical Gibbs free energies, such as shear strain energy, by accumulated dislocations and excess free energy by grain refinement, leading to a change in the twinning stress [7].
In respect to the corrosion property, the corrosion resistance of Fe-30Mn-3Al-2Si (wt.%) TWIP steel under an acidic environment of 0.1 M H2SO4 is deteriorated due to the localized corrosion attack, regardless of the cold rolling reduction from 0 to 35% [10]. In Fe-(21, 25, 28)Mn-3Al-3Si (wt.%) TWIP steels in a neutral environment (0.1 M NaCl), the corrosion resistance lowers with the addition of Mn, which results from the formation of Mn oxide, instead of the protective Al oxide on the surface [11].
Given that TWIP steel is one of the candidate materials for automotive and structural components [13], the change in corrosion property after FSW should be examined for the safety of final products after their assembling. However, the corrosion property after FSW has yet to be reported in TWIP steels, although the FSW can change the microstructure (e.g., grain size and dislocation density), which is related to the corrosion behaviors [14,15,16,17,18].
In this study, the corrosion behavior was investigated using the electrochemical techniques for comparison with base metal and stir zone in Fe-30Mn-3Al-3Si (wt.%) TWIP steel after FSW. The used methodologies were two types of electrochemical testing (i.e., potentiodynamic polarization and electrochemical impedance spectroscope). To elucidate the relationship between the corrosion behavior and microstructure, the microstructural evolution in the FSW joint was characterized using an electron backscattered diffractometer (EBSD).
2. Materials and Methods
2.1. Material Preparation and FSW Condition
For the FSW, 60% cold-rolled Fe–30Mn–3Al–3Si (wt.%) TWIP steel sheet was annealed at 900 °C for 10 min, and subsequently air-cooled. The actual chemical composition of the sheet was listed in Table 1. Hereafter, the present material is referred to as C-free TWIP steel. The material preparation was discussed in detail in our previous article [7]. The annealed plate with a thickness of 2 mm, as the base metal, was friction-stir welded in a bead-on-plate under the constant FSW condition, which is rotation speed of 120 rpm, traverse speed of 100 mm min−1, and plunging load of 3000 kgf. The dimension of tungsten carbide was a shoulder diameter of 15 mm, pin diameter of 6 mm, and pin length of 1.8 mm. The tool tilt-angle was 3°. Argon shielding gas was utilized at a flow rate of 20 L min−1 to protect the oxidation during the FSW.
2.2. Microstructural Characterization
The microstructure of both base metal and stir zone in Cfree TWIP steel were observed using a field-emission scanning electron microscope (FE–SEM; JEOL, JSM-7001F, Tokyo, Japan) equipped with an Hikari high-speed EBSD detector (EDAX Inc., Mahwah, NJ, USA). The EBSD specimen was mechanically ground, then electro-polished in a mixed solution of 90% glacial acetic acid (CH3COOH) and 10% perchloric acid (HCIO4) at 10 V for 10 s to remove layers damaged by mechanical polishing with a 1 μm diamond suspension. The accelerating voltage, probe current, working distance and minimum confidence index value for the EBSD analysis were 20 kV, 12 nA, 15 mm, and 0.1, respectively. The step size was 0.28 μm for the base metal and 0.08 μm for the stir zone. To examine the deformation-induced local misorientation, the kernel average misorientation value was calculated up to the 2nd neighbor shell with a maximum misorientation angle of 5° a TexSEM Laboratories—Orientation Imaging Microscopy (TSL–OIM) software (version V8.0b, EDAX Inc., Mahwah, NJ, USA). To directly compare the grain boundary characteristics of the base metal and stir zone specimens with different grain diameters, we utilized grain boundary density, i.e., the grain boundary length for a given misorientation angle divided by the observed area.
2.3. Corrosion Tests
The corrosion property of C-free TWIP steel before and after the FSW process was evaluated using both potentiodynamic polarization and electrochemical impedance spectroscopy techniques [19,20,21]. Circular specimens with an area of 1 cm2 were collected from both base metal and stir zone regions (Supplementary Material Figure S1). All corrosion experiments were conducted in a 3.5% NaCl solution with distilled water deaerated N2 gas purging during 10 min. Each circular sample was mounted using an epoxy resin. One side of the sample was ground with the abrasion paper up to 2000 grit, then polished with a 1 μm diamond suspension. Prior to all corrosion tests, the samples were subsequently washed in the distilled water and ultrasonically cleaned in acetone solution. To electrically attach the working electrode in all corrosion tests, the mounted sample was connected with the copper adhesion tape, whose composition was Sn–5Sb (wt.%), and exposed using a flat cell type.
All electrochemical evaluations were carried out by means of the set-up consisting of a Gamry Instruments Interface 600 potentiostat/galvanostat (Reference 600, Gamry, Warminster, PA, USA) driven by software (Gamry Instruments Ver. 7.8, Warminster, PA, USA). To compare the corrosion sensitivity on the specimen, the anodic polarization test was performed for acceleration in corrosive solution. The electrode cell set-up was organized as three parts, such as an electrochemical corrosion cell consisting of studied specimens as a working electrode, a saturated calomel electrode (SCE) as a reference electrode, and graphite as a counter electrode. A scan rate of 0.166 mV s−1 was employed during polarization based on the ASTM standard [22]. Prior to the polarization test, an open circuit potential value was estimated in the electrolyte for 1000 s to establish the stable open circuit potential value. After the test, the samples were rinsed with distilled water and ultrasonically cleaned in acetone. Later, a morphology of corrosion attack was observed using SEM. To elucidate the activation of a double layer on the surface of the studied material in the corrosive solution, an electrochemical impedance spectroscopy test was performed in accordance with both ASTM G 3 and ASTM G 106 [23] and it was similar to the set-up with the abovementioned experimental electrode cell configuration [24,25]. The range of both the amplitude and the frequency of the voltage signal was ±10 mV and 0.1–105 Hz, respectively, under an applied AC amplitude of 10 mV rms. Electrochemical impedance spectroscopy tests were systematically conducted from high to low frequencies [23].
3. Results
3.1. Microstructure before and after the Friction Stir Welding
To examine the change in the microstructure of the C free TWIP steel before and after FSW, the EBSD observation was conducted along a normal direction (Figure 1). In the EBSD maps, the blue lines are low-angle boundary (LAB) with misorientation angles between 2 and 15°, the black lines are high-angle boundary (HAB) with misorientation angles of over 15°, and the red lines represent the Σ3 boundary within the Brandon tolerance [26]. The white colored area means the austenite region, and the black point indicates the non-indexed pixel showing the confidence index value below 0.1. To better understand the microstructural changes, misorientation data were also exported from the maps and summarized in Figure 2.
Figure 1a,b depict the EBSD grain boundary and phase maps of both base metal and stir zone, respectively. As shown in Figure 1a, the base metal shows an equiaxed and homogeneous grain structure, including Σ3 boundaries (i.e., annealing twin boundaries having misorientation of 60°), representing ful recrystallization and austenite single phase [7]. The stir zone still has an austenite single phase without any phase transformation during FSW processing (Figure 1b) and finer grains (1.7 ± 0.9 μm) than those (6.9 ± 3.9 μm) of base metal by means of TSL–OIM software (Figure 2a), meaning grain refinement after FSW. The maximum texture index of the base metal and stir zone specimens by means of TSL–OIM software were 2.886 and 3.221, respectively, indicating the formation of random texture despite its slight increase after FSW (Supplementary Material Figure S2). In the stir zone, the total length of the Σ3 boundaries decreased drastically, whereas the LAB accumulation occurred simultaneously in the vicinity of HAB. The evolved LAB as well as the Σ3 boundaries were relatively short, and it did not clearly form the sub-grain structures (Figure 1b).
To get additional insight into microstructure, the local area within the stir zone marked by the dotted rectangle in Figure 1b is magnified as shown in Figure 1c. The enlarged map of the stir zone can be mainly categorized into two types: (a) coarse grains consisting of serrated grain boundaries and (b) relatively fine grains surrounding the short Σ3 boundaries and/or LAB near the abovementioned coarse serrated grains, as indicated by the black circles in Figure 1c. The LAB and Σ3 twin boundaries gradually transformed into the HAB as indicated by the black and red arrows, respectively. This evolved microstructure is thought to be the trace of discontinuous dynamic recrystallization via grain boundary bulging during the FSW [27]. Namely, the initial grain boundaries can move because of a large strain during FSW at a high temperature. However, the LAB substructure near the initial grain boundaries encourages a pinning effect due to the relatively low mobility of LAB. As a result, the parent grain boundaries can be bulged. This grain boundary serration subsequently transformed into several recrystallization nuclei, resulting from a bulging of parts of the serrated HABs accompanied by the formation of sub-boundaries (=LAB) and/or Σ3 twin boundaries, as represented by the black and red arrows in Figure 1c, respectively. The low mobility of LAB under severe plastic deformation at a high temperature stems from the inactive dislocation mobility caused by the stacking-fault formation in the fcc metals (e.g., Au, Ni, Cu, and austenitic Fe) having low/medium stacking fault energy [9,27,28]. It matches with the present study, given that the stacking-fault energy of C-free TWIP steel is the medium value of 54 mJ m−2 based on the thermodynamic calculation [7].
In the stir zone, both substantial grain boundary bulging and the subsequent nucleation of recrystallized grains enhance a whole range of boundary densities, relative to that of the base metal (Figure 2b). Not only LABs, consisting of the recrystallized grains near the coarse parent grains, but also a few sub boundaries in the interior of those, cause an increase in the range of the low angle misorientation below 15°. Particularly, both the HABs’ density and the developed misorientation angle near 60° in the wide misorientation angle distribution increase, which is caused by both the grain refinement and the twin boundaries accompanying discontinuous dynamic recrystallization after FSW, respectively (Figure 1b and Figure 2a). The introduced LAB in the stir zone drives the higher average kernel misorientation value (0.75 ± 0.43) relative to that (0.43 ± 0.24) in the base metal (Figure 2c), implying an increase in the geometrically necessary dislocation density by the deformation during FSW. Regarding the Σ3 twin boundaries in the stir zone, it was reported that the twin boundaries during FSW caused the crystallographic rotation of twin boundaries by repetitive strain, gradually transforming the random boundaries (=HAB) [9,27], indicated by the red arrows in Figure 1c. In this study, given the much shorter twin boundaries of the stir zone than the lengthy twin boundaries of the base metal, it was concluded that the newly developed twin boundaries were strained during FSW [9,27]. This speculation is supported by the analysis of the misorientation deviations along the Σ3 twin boundaries of the base metal and stir zone specimens, as shown in Figure 2d. In the stir zone, the distribution of deviations along the Σ3 twin boundaries over the angular accuracy of EBSD (i.e., 2°) was wide compared to the base metal, meaning the transformation of the Σ3 boundaries to HAB by the straining during FSW [9,27].
To better understand the recrystallization behavior in the stir zone, we analyzed the grain orientation spread by using the standard option of the TSL–OIM software. Grain orientation spread is evaluated by averaging between the orientation of each pixel of a given grain and the average orientation of the grains in EBSD maps. For example, the grains with low orientation spread within the angular accuracy of EBSD (i.e., 2°) are referred to as the recrystallized grains; otherwise, they are the unrecrystallized grains. The EBSD grain orientation spread map is shown in Figure 3a. In the figure, the white and gray regions indicate the recrystallized and uncrystallized grains having grain orientation spread values below and over 2°, respectively. In the stir zone, the average grain orientation spread value is 0.93, and the fractions of recrystallized and unrecrystallized grains are 73.5% and 26.5%, respectively. The C-free TWIP steel undergoes active dynamic recrystallization after FSW, given that the stir zone of Fe–13Mn–0.5C–1.6Al (wt.%) TWIP steel, hereafter referred to as C-added TWIP steel, had a lower fraction (=37.3%) of recrystallized grains in the previous study [9]. Generally, it is reported that the elevated processing temperature, the lack of pinning effect by impurity (i.e., interstitial atoms), and the higher stacking fault energy enhance the dislocation mobility during severe plastic deformation [27,28]. In this study, the conditions of C-free TWIP steel are as follows: lower welding temperature caused by lower rotation speed of 120 rpm, the lack of interstitial elements (e.g., carbon), and the higher stacking fault energy of 54 mJ m−2 based on the thermodynamic calculation [7]. On the other hand, it is considered that those of the C-added TWIP steel in the previous study [9] show a higher welding temperature caused by the rapid tool rotation speed of 700 rpm, a lower calculated stacking fault energy of 12 mJ m−2 [29], and the addition of carbon. Accordingly, the reason why the C-free TWIP steel in this study has a higher fraction of recrystallized grains in the stir zone than C-added TWIP steel, despite the high heat input energy, is presumably due to the promotion of dislocation movement caused by both the relatively high stacking-fault energy and the lack of pinning effect.
The comparison of microstructure characteristics between recrystallized and unrecrystallized grains in the stir zone in C-free TWIP steel is summarized in Figure 3b–d. For the misorientation angle distribution (Figure 3b), the boundary density of recrystallized grains gradually increases as a function of the misorientation angle value, whereas that of the unrecrystallized grains slowly increases. As such, recrystallized grains show a higher boundary density over a misorientation of approximately 36°. This is attributed mainly to the high density of HAB, caused by the grain refinement and profuse annealing twin boundaries (i.e., misorientation of ~60°) formation accompanying the active discontinuous dynamic recrystallization near the coarse serrated grains (Figure 1c). Instead, the developed LAB inside the unrecrystallized grains (Figure 3a) leads to the higher boundary density of relatively low misorientation, of approximately 36° (Figure 3b). As shown in Figure 3c, the boundary density of the Σ3 boundaries, whose misiorientation values are typically very close to the ideal Σ3 boundaries (=misorientation angle of 60°), is ~2.5 μm−1 in the recrystallized grains, more than twice the ~1.1 μm−1 of the unrecrystallized grains (Figure 3b). Considering that the grain diameter (1.5 ± 0.8 μm in Figure 3d) of recrystallized grains is smaller than that (6.9 ± 3.9 μm) of the base metal, the Σ3 twin boundaries of recrystallized grains in the stir zone are thought to be newly developed twin boundaries occurring during FSW.
Additionally, in the recrystallized grains of the stir zone specimen, the boundary density of the Σ3 boundaries of the C-free TWIP steel shows a higher value than that (≈ 0.12 μm−1) of the C-added TWIP steel in the previous study [9]. Generally, it is well-known that the density of annealing twins is inversely proportional to the stacking-fault energy [30] and grain size [31,32]. This is because the stacking-fault energy is twice the twin boundary energy, and the driving force of twin growth, which is the difference in the Gibbs free energy between the strained shrinking grain and strain-free growing grain, is inversely proportional to the grain size [31,32]. Looking into the mean grain size, including the annealing twin boundaries, that of the recrystallized grains is 1.5 ± 0.8 μm, caused by the more active discontinuous dynamic recrystallization together with the twin formation, which is finer than the 2.2 ± 0.8 μm of the unrecrystallized grains (Figure 3d). Regarding the mean grain size of recrystallized grains in the stir zone, the C-free TWIP steel in the present study is finer, compared to the 6.0 μm of the C-added TWIP steel caused by a higher heat input energy [9]. Accordingly, in this study, it is considered that the effect of grain size on the annealing twin growth is more dominant than that of stacking-fault energy, leading to the abundant annealing twins in the C-free TWIP steel.
3.2. Corrosion Behavior before and after the Friction Stir Welding
Figure 4a shows the estimated open circuit potential values as a function of immersion time in 3.5 wt.% NaCl aqueous solution. The potential value slowly increased as a function of the immersion time for base metal, whereas it exponentially reduced up to the immersion time of ~200 s and subsequently increased for the stir zone in the initial stage. For the stir zone sample, the sharp drop in potential value in the beginning of the test represents that the preliminarily stable oxidation might be activated immediately after immersion in the NaCl aqueous solution [33]. Subsequently, the open circuit potential value of both specimens remains relatively stable after immersion for ~1000 s, meaning the achievement of a stable surface state. The values of the base metal and stir zone at immersion times of 1000 s are −0.83 and −0.81 VSCE, respectively, corresponding to the slightly noble stir zone relative to the base metal.
After obtaining a stable potential value, the potentiodynamic polarization test was performed (Figure 4b). In the polarization curves, differential behavior was observed between both base metal and stir zone. Table 2 gives the corresponding fitting values of the electrochemical parameters by Tafel extrapolation using the polarization curves in Figure 4b. In general, both the higher corrosion potential (Ecorr) and the lower corrosion current density (Icorr) represent the more inactive dissolution ability of a steel specimen, indicating an enhanced corrosion resistance. Similar to the result of the open circuit potential (Figure 4a), the Ecorr value of −865 mV on the base metal is lower by 30 mV relative to the Ecorr value of −835 mV on the stir zone (Table 2), meaning that the corrosion phenomenon in the C-free TWIP steel before FSW generates easily in respect to the thermodynamic perspective. The Icorr value of the base metal is 6.080 μA cm−2, corresponding to the corrosion rate of 2.780 mils per year, whereas the Icorr value of the stir zone is 5.350 μA cm−2 and its corrosion rate is 2.444 mils per year (Table 2). Based on the polarization results, it is clear that the stir zone of C-free TWIP steel after FSW has a relatively higher corrosion resistance compared to the base metal, considering that, in general, the corrosion resistance of the fusion weld zone is drastically deteriorated due to the secondary phase and elemental segregation compared to the base metal [13]. Therefore, it is noteworthy that the FSW can drive the improved corrosion resistance of the weldment in the TWIP steels, different from the application of fusion welding [11].
To better understand the corrosion behavior of the C-free TWIP steel after FSW, the electrochemical impedance spectroscopy spectrum analyzer was utilized to get both the Nyquist and Bode plots (Figure 5a,b, respectively). The test is well known as a tool that functions by directly measuring the electrical parameters related to electrical resistance against the attack caused by chloride ions [18]. The corrosion process parameters from the Nyquist and Bode plots were determined for both the base metal and its stir zone by means of the fitting software. The selected model of the equivalent electrical circuit showing a replacement is as shown in the Supplementary Material Figure S3. In the selected model, the Rs element is the electrolyte resistance which is reflected in the corrosive environment, the Rct element is the charge transfer resistance of the interface between the metal specimen and the electrolyte of the 3.5 wt.% NaCl solution at room temperature, associated with the process of oxidation of metal, and the Cdl element is the double layer capacitance, occurring on the border of phases.
Figure 5a indicates the Nyquist impedance response of the base metal and the stir zone. The base metal shows a small semicircle relative to that of the stir zone, meaning the lower corrosion resistance performance of the base metal. Since the corrosion resistance of both specimens could be a function of the size of the impedance capacitive loops, we can then deduce that specimens corresponding to larger semicircle Nyquist curves are more resistant to chloride-induced corrosion [34]. By physical inspection, it can be inferred that the stir zone is more resistant to the corrosive environment than the base metal.
In the assessment of the corrosive properties by electrochemical impedance spectroscopy, the important parameter is the Rct, while Cdl allows one to determine the homogeneity of the corrosion process. In the present case, Cdl is an auxiliary parameter to determine the corrosion process. These parameters define the individual component of the model—the replacement of an electrical circuit. Figure 5b shows the Bode plots, which refer to the representation of impedance magnitude (e.g., real or imaginary components to the impedance) in the left y-axis and the phase angle in the right y-axis as a function of frequency. In general, the phase angle in the low frequency ranging from ~10−1 to ~100 Hz is related to the oxidation of the specimen; the higher the absolute value of the phase angle, the lower the corrosion rate. The maximum absolute value for phase angle in the entire range of frequency corresponds to the formation of the electrical double layer between the surface of the specimen and the corrosive solution; the higher the maximum absolute value, the higher the capacitance at the double layer, meaning a higher corrosion rate. From the phase angle graph, it can be seen that the absolute value for the phase angle in the stir zone is higher in the frequency range (0.2–0.6 Hz) than the base metal, indicating less oxidation of the specimen (i.e., lower corrosion rate). For the maximum absolute value of the phase angle, the stir zone has a lower value at the frequency ranging from 100 to 101 Hz relative to the base metal, indicating an inactive formation of a double layer on the surface of the stir zone specimen (i.e., lower corrosion rate).
For more quantitative analysis, the impedance spectra for different Bode plots were analyzed by fitting the experimental data using Equation (1) about the equivalent circuit model. The impedance, Z, is presented by
where ndl is the exponent determining the homogeneity of the corrosion process, ω is the pulsation with frequency derivative (rad/s), and j is the unit imaginary number (-). For a non-homogeneous system, the ndl values range from 0.9 to 1.
Figure 6 shows the fitted graph based on the experimental EIS test results using the equivalent circuit of Supplementary Material Figure S3. It also shows the similar corrosion behavior of both base and weld metals in the fitted EIS results. Based on this fitting graph, the values of Rs, Rct, and Cdl for the studied specimens in the 3.5 wt.% NaCl solution are given, as obtained from the electrochemical impedance measurements presented in Table 3, which are fitted by defining the individual components of the model—the replacement of an electrical circuit. As summarized in Table 3, the charge transfer resistance, Rct value (= 495.9 Ω), of the stir zone is higher, by about 30 Ω, than that (= 467.6 Ω) of the base metal, indicating relative resistance in the charge exchange between the material and the electrolyte. The electrolyte resistance, Rs, of both samples is the same level as ~16 Ω and smaller than the charge transfer resistance, Rct, which indicates the high electrical conductivity of the solution. The Rs value is not critical in the consideration of the corrosion resistance of the samples because the Rs value depends on the type of tested solution. In the layer, the overall corrosion varies monotonically and linearly along the charge transfer resistance, Rct, respectively. The Rct values of the base metal show a lower trend compared to the stir zone specimen, indicating that the corrosion resistance decreases relatively. The reduction of the Cdl value (= 387.1 μF) in the stir zone compared to that (= 439.3 μF) of the base metal (Table 3) leads to the increase in charge transfer resistance (Rct). As a result, the reduction of capacitance (Cdl) and the improvement of resistance (Rct) drive the enhanced corrosion resistance of the stir zone, which adheres to the results of the potentiodynamic polarization test (Figure 4 and Table 2).
4. Discussion
To clarify the improvement of the corrosion property originating from the microstructural change in the C-free TWIP steel after FSW, the corrosion morphology after the polarization test was observed by means of SEM (Figure 6). In common, the corrosion morphology is reflected by the synergetic effect of both the chemical composition and microstructural characteristics. In this study, because the difference in chemical composition before and after FSW is negligible due to the relatively low processing temperature compared to fusion welding [12,35,36,37], we focus on the effect of microstructure on the corrosion attack. Two types of corrosion attack can be categorized as follows: (a) general corrosion attack on the overall surface and (b) selective corrosion attack on a localized region. The local area of the base metal and the stir zone in Figure 6a1,b1 is magnified as shown in Figure 6a2,b2, respectively. The base metal has several deep and long dissolutions of facet morphology (Figure 6a1) along the boundaries (as indicated by the white broken lines in Figure 6a2). The selective corrosion is especially accelerated along the grain boundaries (=HAB) considering that the size of the localized corrosion region is similar to the grain size (6.9 ± 3.9 μm in Figure 2a) of the base metal. The penetration into the interior of the grains was found to be insignificant with the flat step unit, whereas there seemed to be shallow dissolution in the internal grain along the annealing twin boundaries in the base metal. It can be assumed that the effective parameter in respect to the acceleration of the corrosion phenomenon is due to the vulnerable HAB in the base metal.
Surprisingly, the whole stir zone was rarely observed to undergo selective corrosion attack relative to the base metal, indicating the general corrosion of the C-free TWIP steel after FSW despite being under a chloride solution environment (Figure 6b1). Based on the magnified area (Figure 6b2), the dissolution morphology consists of a small-sized facet with swallow depth, which is similar to the fine grains (1.7 ± 0.9 μm in Figure 2a) in the stir zone (as indicated by the white broken lines). It is well-known that an increase in the grain boundary density (i.e., grain refinement) drives the improved passive film’s stability on the surface caused by the result of the increased rate of diffusion in the fine-grained structures, resulting in the enhanced corrosion resistance [14,38,39,40]. Given that the oxide film was observed for Fe–(21, 25, 28) Mn–3Al–3Si (wt.%) steels under NaCl solution [11], the grain refinement in C-free TWIP steel after FSW can possibly improve the overall surface reactivity, leading to the generally uniform corrosion attack (Figure 6b2) caused by the improved corrosion resistance.
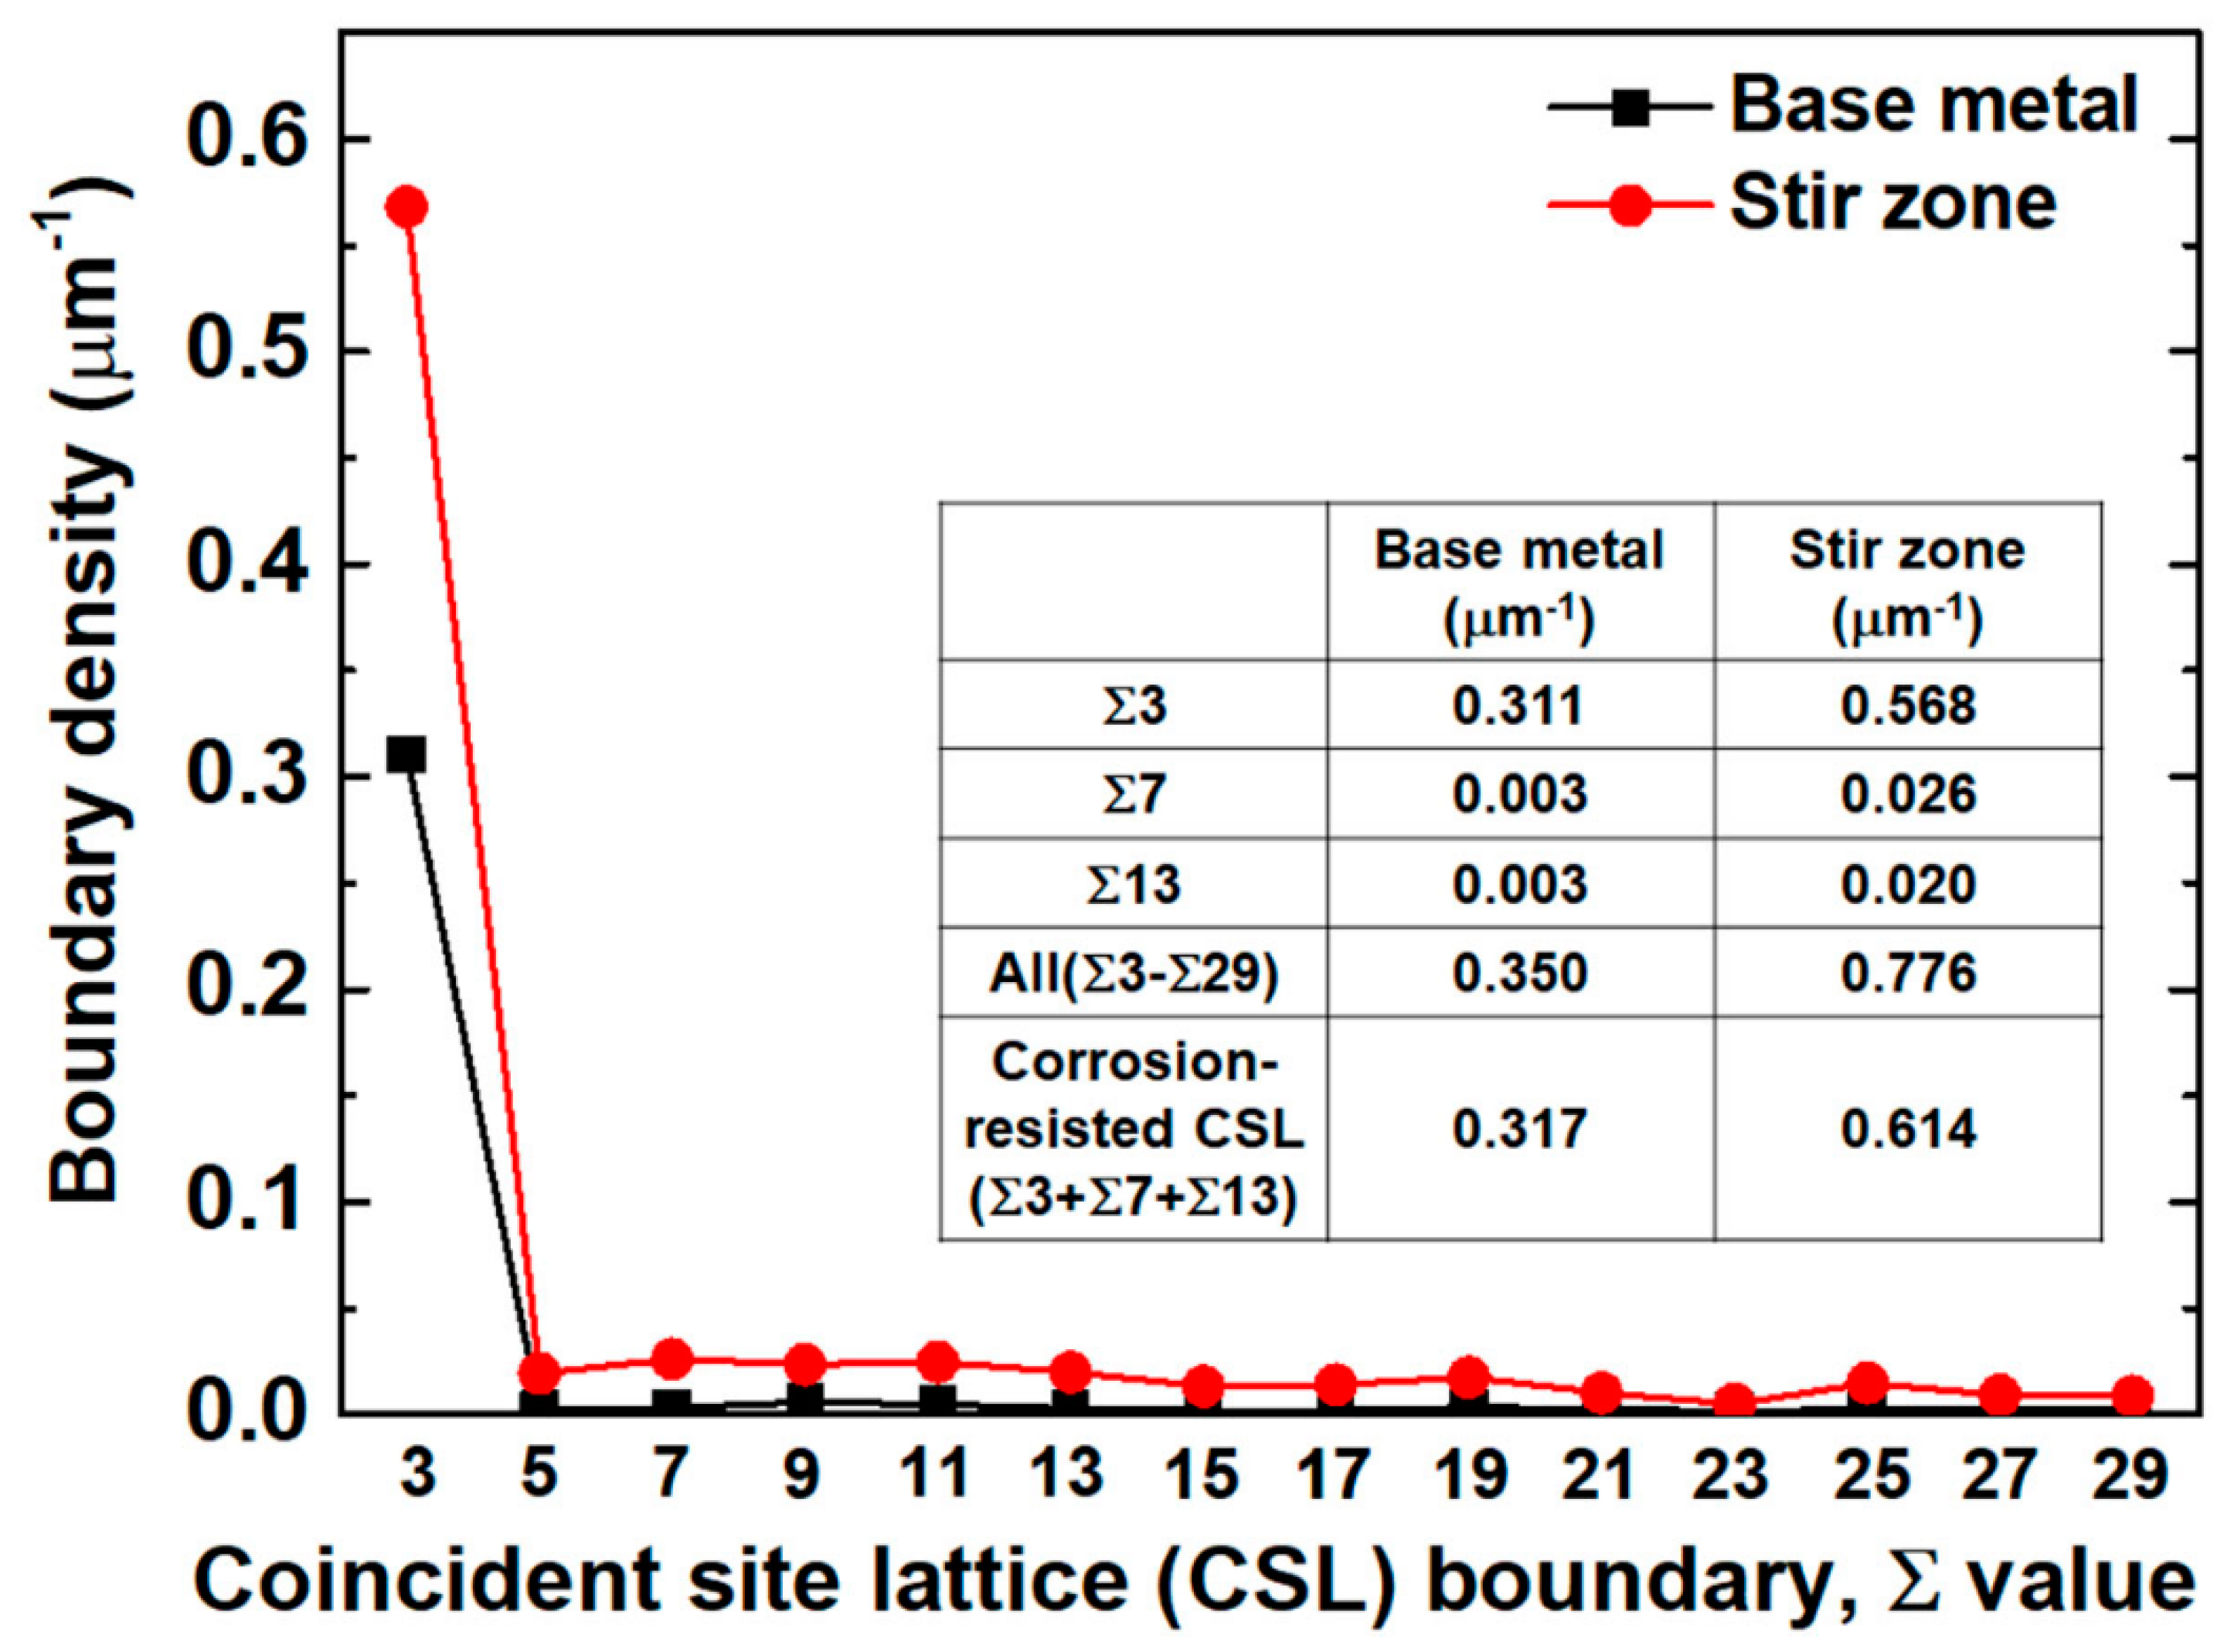
In addition, it is reported that the generation of coincident site lattice (CSL) boundaries can improve the corrosion resistance, because the CSL boundaries introduce a large number of low-energy segments in the network of the initial random boundary (i.e., HAB), and simultaneously are more stable, being less reactive with dislocations and other boundaries than random boundaries [41,42]. Among CSL boundaries, the Σ3, Σ7, and Σ13 boundaries possess better corrosion resistance relative to others [42]. Additionally, these corrosion-resistant CSL boundaries can reduce the connectivity of random boundaries susceptible to corrosion, resulting in the arrest of the corrosion attack. The distribution of CSL boundary density was evaluated via the corrosion-resistant CSL results (i.e., the Σ3, Σ7, and Σ13 boundaries) compared to other boundaries, as shown in Figure 7. After the FSW, all the CSL boundary densities developed in the stir zone, relative to the base metal. The corrosion-resistant CSL boundaries increased drastically from 0.317 μm−1 to 0.614 μm−1 after FSW, mainly due to an increase in Σ3 CSL boundaries from 0.311 μm−1 to 0.568 μm−1 after FSW. This is primarily caused by the newly developed twin formation during the discontinuous dynamic recrystallization during FSW (Figure 2b and Figure 3c).
The random boundaries gradually transform into Σ3 CSL boundaries (as indicated by the red arrows in Figure 1c), leading to the discontinuity of random boundaries susceptible to corrosion. Furthermore, the morphology in the Σ3 CSL boundaries changed from the relatively concentrated distribution of long boundaries to the uniform distribution of short boundaries less than ~1 μm. It is thought that the introduction of short corrosion-resistant CSL boundaries after FSW causes the arrest of the corrosion attack [41,42]. This results in the change from a lot of long and deep crack paths in the base metal to short and irregular crack paths in the stir zone, giving rise to the relatively enhanced corrosion resistance (i.e., low Icorr, high Rct, and low Cdl) after the FSW processing (Figure 4 and Figure 5).
5. Conclusions
In this study, we investigated both the microstructural evolution and corrosion resistance of the stir zone in Fe–30Mn–3Al–3Si (wt.%) TWIP steel after friction stir welding (FSW). FSW can drive the relatively enhanced corrosion resistance compared to the base metal, despite the application of a welding process. This is because of the corrosion-resistant coincidence site lattice boundaries (e.g., Σ3, Σ7, and Σ13) during the active discontinuous dynamic recrystallization.
Supplementary Materials
The following are available online at https://www.mdpi.com/2075-4701/10/11/1557/s1, Figure S1: Optical micrograph of the friction-stir-welded Fe–30Mn–3Al–3Si (wt.%) twinning–induced plasticity (TWIP) steel sheet and both base metal and stir zone samples milled area for the corrosion tests. Figure S2: Pole figures of (a) base metal and (b) stir zone in Fe–30Mn–3Al–3Si (wt.%) TWIP steel. Figure S3: Selected model of equivalent electrical circuit used to fit impedance data.
Author Contributions
H.-J.K., S.-J.L. conceived and designed the experiments; H.-J.K., S.-J.L. wrote the paper; H.F. supported the FSW and EBSD equipment; H.-J.K., S.-J.L. performed the experiments; H.-J.K., S.-J.L. proofread for English errors. All authors have read and agreed to the published version of the manuscript.
Funding
This study was supported by the Academic Promotion system funded by the Korea Polytechnic University (2019S02881).
Conflicts of Interest
The authors declare no conflict of interest. The sponsor had no role in the design of the study; in the collection, analyses, or interpretation of data; in the writing of the manuscript; or in the decision to publish the results.
References
- De Cooman, B.C.; Estrin, Y.; Kim, S.K. Twinning-induced plasticity (TWIP) steels. Acta Mater. 2018, 142, 283–362. [Google Scholar]
- Steinmetz, D.R.; Jäpel, T.; Wietbrock, B.; Eisenlohr, P.; Gutierrez-Urrutia, I.; Saeed–Akbari, A.; Hickel, T.; Roters, F.; Raabe, D. Revealing the strain-hardening behavior of twinning-induced plasticity steels: Theory, simulations, experiments. Acta Mater. 2013, 61, 494–510. [Google Scholar]
- Galindo-Nava, E.I.; Rivera-Díaz-del-Castillo, P.E.J. Understanding martensite and twin formation in austenitic steels: A model describing TRIP and TWIP effects. Acta Mater. 2017, 128, 120–134. [Google Scholar]
- Lee, S.-J.; Han, J.; Lee, S.; Kang, S.H.; Lee, S.M.; Lee, Y.K. Design for Fe-high Mn alloy with an improved combination of strength and ductility. Sci. Rep. 2017, 7, 3573. [Google Scholar]
- Chung, K.; Ahn, K.; Yoo, D.H.; Chung, K.H.; Seo, M.H.; Park, S.H. Formability of TWIP (twinning induced plasticity) automotive sheets. Int. J. Plast. 2011, 27, 52–81. [Google Scholar]
- Lee, S.-J.; Sun, Y.; Fujii, H. Stacking-fault energy, mechanical twinning and strain hardening of Fe-18Mn-0.6C-(0, 1.5)Al twinning-induced plasticity steels during friction stir welding. Acta Mater. 2018, 148, 235–248. [Google Scholar]
- Lee, S.-J.; Ushioda, K.; Fujii, H. Evaluation of stacking-fault energy in Fe-Mn based twinning-induced plasticity steels after friction stir welding. Mater. Charact. 2019, 147, 379–383. [Google Scholar]
- Park, G.; Kim, B.; Kang, Y.; Kang, H.; Lee, C. Characterization of bond line discontinuities in a high-Mn TWIP steel pipe welded by HF-ERW. Mater. Charact. 2016, 118, 14–21. [Google Scholar]
- Torganchuk, V.; Vysotskiy, I.; Malopheyev, S.; Mironov, S.; Kaibyshev, R. Microstructure evolution and strengthening mechanisms in friction-stir welded TWIP steel. Mater. Sci. Eng. A 2019, 746, 248–258. [Google Scholar]
- Kannan, M.B.; Raman, R.K.S.; Khoddam, S.; Liyanaarachchi, S. Corrosion behavior of twinning-induced plasticity (TWIP) steel. Mater. Corros. 2013, 64, 231–235. [Google Scholar]
- Fajardo, S.; Llorente, I.; Jiménez, J.A.; Bastidas, J.M.; Bastidas, D.M. Effect of Mn additions on the corrosion behaviour of TWIP Fe-Mn-Al-Si austenitic steel in chloride solution. Corros. Sci. 2019, 154, 246–253. [Google Scholar]
- Fujii, H.; Cui, L.; Tsuji, N.; Maeda, M.; Nakata, K.; Nogi, K. Friction stir welding of carbon steels. Mater. Sci. Eng. A 2006, 429, 50–57. [Google Scholar]
- Mújica Roncery, L.; Weber, S.; Theisen, W. Welding of twinning-induced plasticity steels. Scripta Mater. 2012, 66, 997–1001. [Google Scholar]
- Ralston, K.D.; Birbilis, N. Effect of Grain Size on Corrosion: A Review. Corrosion 2010, 66, 075005–075005-13. [Google Scholar]
- Orłowska, M.; Ura-Bińczyk, E.; Olejnik, L.; Lewandowska, M. The effect of grain size and grain boundary misorientation on the corrosion resistance of commercially pure aluminium. Corros. Sci. 2019, 148, 57–70. [Google Scholar]
- Hao, Y.W.; Deng, B.; Zhong, C.; Jiang, Y.M.; Li, J. Effect of Surface Mechanical Attrition Treatment on Corrosion Behavior of 316 Stainless Steel. J. Iron Steel Res. Int. 2009, 16, 68–72. [Google Scholar]
- Wang, X.Y.; Li, D.Y. Mechanical and electrochemical behavior of nanocrystalline surface of 304 stainless steel. Electrochim. Acta 2002, 47, 3939–3947. [Google Scholar]
- Tiamiyu, A.A.; Eduok, U.; Szpunar, J.A.; Odeshi, A.G. Corrosion behavior of metastable AISI 321 austenitic stainless steel: Investigating the effect of grain size and prior plastic deformation on its degradation pattern in saline media. Sci. Rep. 2019, 9, 12116. [Google Scholar]
- Kim, H.-J.; Jeon, S.-H.; Kim, S.-T.; Lee, I.-S.; Park, Y.-S.; Kim, K.-T.; Kim, Y.-S. Investigation of the sensitization and intergranular corrosion of tube-to-tubesheet welds of hyper duplex stainless steel using an electrochemical reactivation method. Corros. Sci. 2014, 87, 60–70. [Google Scholar]
- Wu, W.; Hu, S.; Shen, J. Microstructure, mechanical properties and corrosion behavior of laser welded dissimilar joints between ferritic stainless steel and carbon steel. Mater. Des. 2015, 65, 855–861. [Google Scholar]
- Huang, L.-Y.; Wang, K.-S.; Wang, W.; Zhao, K.; Yuan, J.; Qiao, K.; Zhang, B.; Cai, J. Mechanical and corrosion properties of low-carbon steel prepared by friction stir processing. Int. J. Miner. Metall. Mater. 2019, 26, 202–209. [Google Scholar]
- ASTM. ASTM G 5-04, Standard Reference Test Method for Making Potentiostatic and Potentiodynamic Anodic Polarization Measurements. In Annual Book of ASTM Standards; ASTM: West Conshohocken, PA, USA, 2011. [Google Scholar]
- ASTM. ASTM G-106, Standard Practice for Verification of Algorithm and Equipment for Electrochemical Impedance Measurements. In Annual Book of ASTM Standards; ASTM: West Conshohocken, PA, USA, 2010. [Google Scholar]
- Dudzik, K.; Charchalis, A. EIS Research of AW-7020 Alloy Joints Welded by FSW. Solid State Phenom. 2013, 199, 412–417. [Google Scholar]
- Starosta, R. Corrosion of Ni-Al and Ni-Al-Al2O3 Flame Sprayed Coatings of “CastoDyn 8000” System in 0.01 M H2SO4 and 3.5% NaCl Solutions. Solid State Phenom. 2012, 183, 185–192. [Google Scholar]
- Brandon, D.G. The structure of high-angle grain boundaries. Acta Metall. 1966, 14, 1479–1484. [Google Scholar]
- Sakai, T.; Belyakov, A.; Kaibyshev, R.; Miura, H.; Jonas, J.J. Dynamic and post-dynamic recrystallization under hot, cold and severe plastic deformation conditions. Progress Mater. Sci. 2014, 60, 130–207. [Google Scholar]
- Liu, X.C.; Sun, Y.F.; Nagira, T.; Fujii, H. Investigation of temperature dependent microstructure evolution of pure iron during friction stir welding using liquid CO2 rapid cooling. Mater. Charact. 2018, 137, 24–38. [Google Scholar]
- Pierce, J.; Jiménez, D.T.A.; Bentley, J.; Raabe, D.; Oskay, C.; Wittig, J.E. The influence of manganese content on the stacking fault and austenite/ε-martensite interfacial energies in Fe–Mn–(Al–Si) steels investigated by experiment and theory. Acta Mater. 2014, 68, 238–253. [Google Scholar]
- Bhattacharyya, M.; Langelier, B.; Purdy, G.R.; Zurob, H.S. Effect of Mn and C on Grain Growth in Mn Steels. Metall. Mater. Trans. A 2019, 50, 905–914. [Google Scholar]
- Cahoon, J.R.; Li, Q.; Richards, N.L. Microstructural and processing factors influencing the formation of annealing twins. Mater. Sci. Eng. A 2009, 526, 56–61. [Google Scholar]
- Gleiter, H. The formation of annealing twins. Acta Metall. 1969, 17, 1421–1428. [Google Scholar]
- Li, H.; Wang, Y.; Peng, Q. High degradation rate of Fe-20Mn-based bio-alloys by accumulative cryo-rolling and annealing. Mater. Sci. Eng. C 2017, 79, 37–44. [Google Scholar]
- Masroor, S.; Mobin, M.; Alam, M.J.; Ahmad, S. The novel iminium surfactant p-benzylidene benzyldodecyl iminium chloride as a corrosion inhibitor for plain carbon steel in 1 M HCl: Electrochemical and DFT evaluation. RSC Adv. 2017, 7, 23182–23196. [Google Scholar]
- Lee, S.-J.; Park, T.M.; Nam, J.-H.; Choi, W.S.; Sun, Y.; Fujii, H.; Han, J. The unexpected stress-strain response of medium Mn steel after friction stir welding. Mater. Sci. Eng. A 2019, 744, 340–348. [Google Scholar]
- Jia, Q.; Liu, L.; Guo, W.; Peng, Y.; Zou, G.; Tian, Z.; Zhou, Y.N. Microstructure and tensile-shear properties of resistance spot-welded medium Mn steels. Metals 2018, 8, 48. [Google Scholar]
- Casalino, G. Recent achievements in rotary, linear and friction stir welding of metals alloys. Metals 2020, 10, 80. [Google Scholar]
- Ralston, K.D.; Birbilis, N.; Davies, C.H.J. Revealing the relationship between grain size and corrosion rate of metals. Scr. Mater. 2010, 63, 1201–1204. [Google Scholar]
- Miyamoto, H.; Harada, K.; Mimaki, T.; Vinogradov, A.; Hashimoto, S. Corrosion of ultra-fine grained copper fabricated by equal-channel angular pressing. Corros. Sci. 2008, 50, 1215–1220. [Google Scholar]
- Gollapudi, S. Grain size distribution effects on the corrosion behaviour of materials. Corros. Sci. 2012, 62, 90–94. [Google Scholar]
- Kokawa, H.; Shimada, M.; Michiuchi, M.; Wang, Z.J.; Sato, Y.S. Arrest of weld-decay in 304 austenitic stainless steel by twin-induced grain boundary engineering. Acta Mater. 2007, 55, 5401–5407. [Google Scholar]
- Han, W.; Chen, D.; Ha, Y.; Kimura, A.; Serizawa, H.; Fujii, H.; Morisada, Y. Modifications of grain-boundary structure by friction stir welding in the joint of nano-structured oxide dispersion strengthened ferritic steel and reduced activation martensitic steel. Scr. Mater. 2015, 105, 2–5. [Google Scholar]
Figure 1.
Electron backscattered diffractometer (EBSD) grain boundary and phase maps of (a) base metal, (b) stir zone, and (c) inverse pole figure enlarged area of (b) stir zone sample. ND: normal direction, WD: welding direction, RD: rolling direction.
Figure 1.
Electron backscattered diffractometer (EBSD) grain boundary and phase maps of (a) base metal, (b) stir zone, and (c) inverse pole figure enlarged area of (b) stir zone sample. ND: normal direction, WD: welding direction, RD: rolling direction.
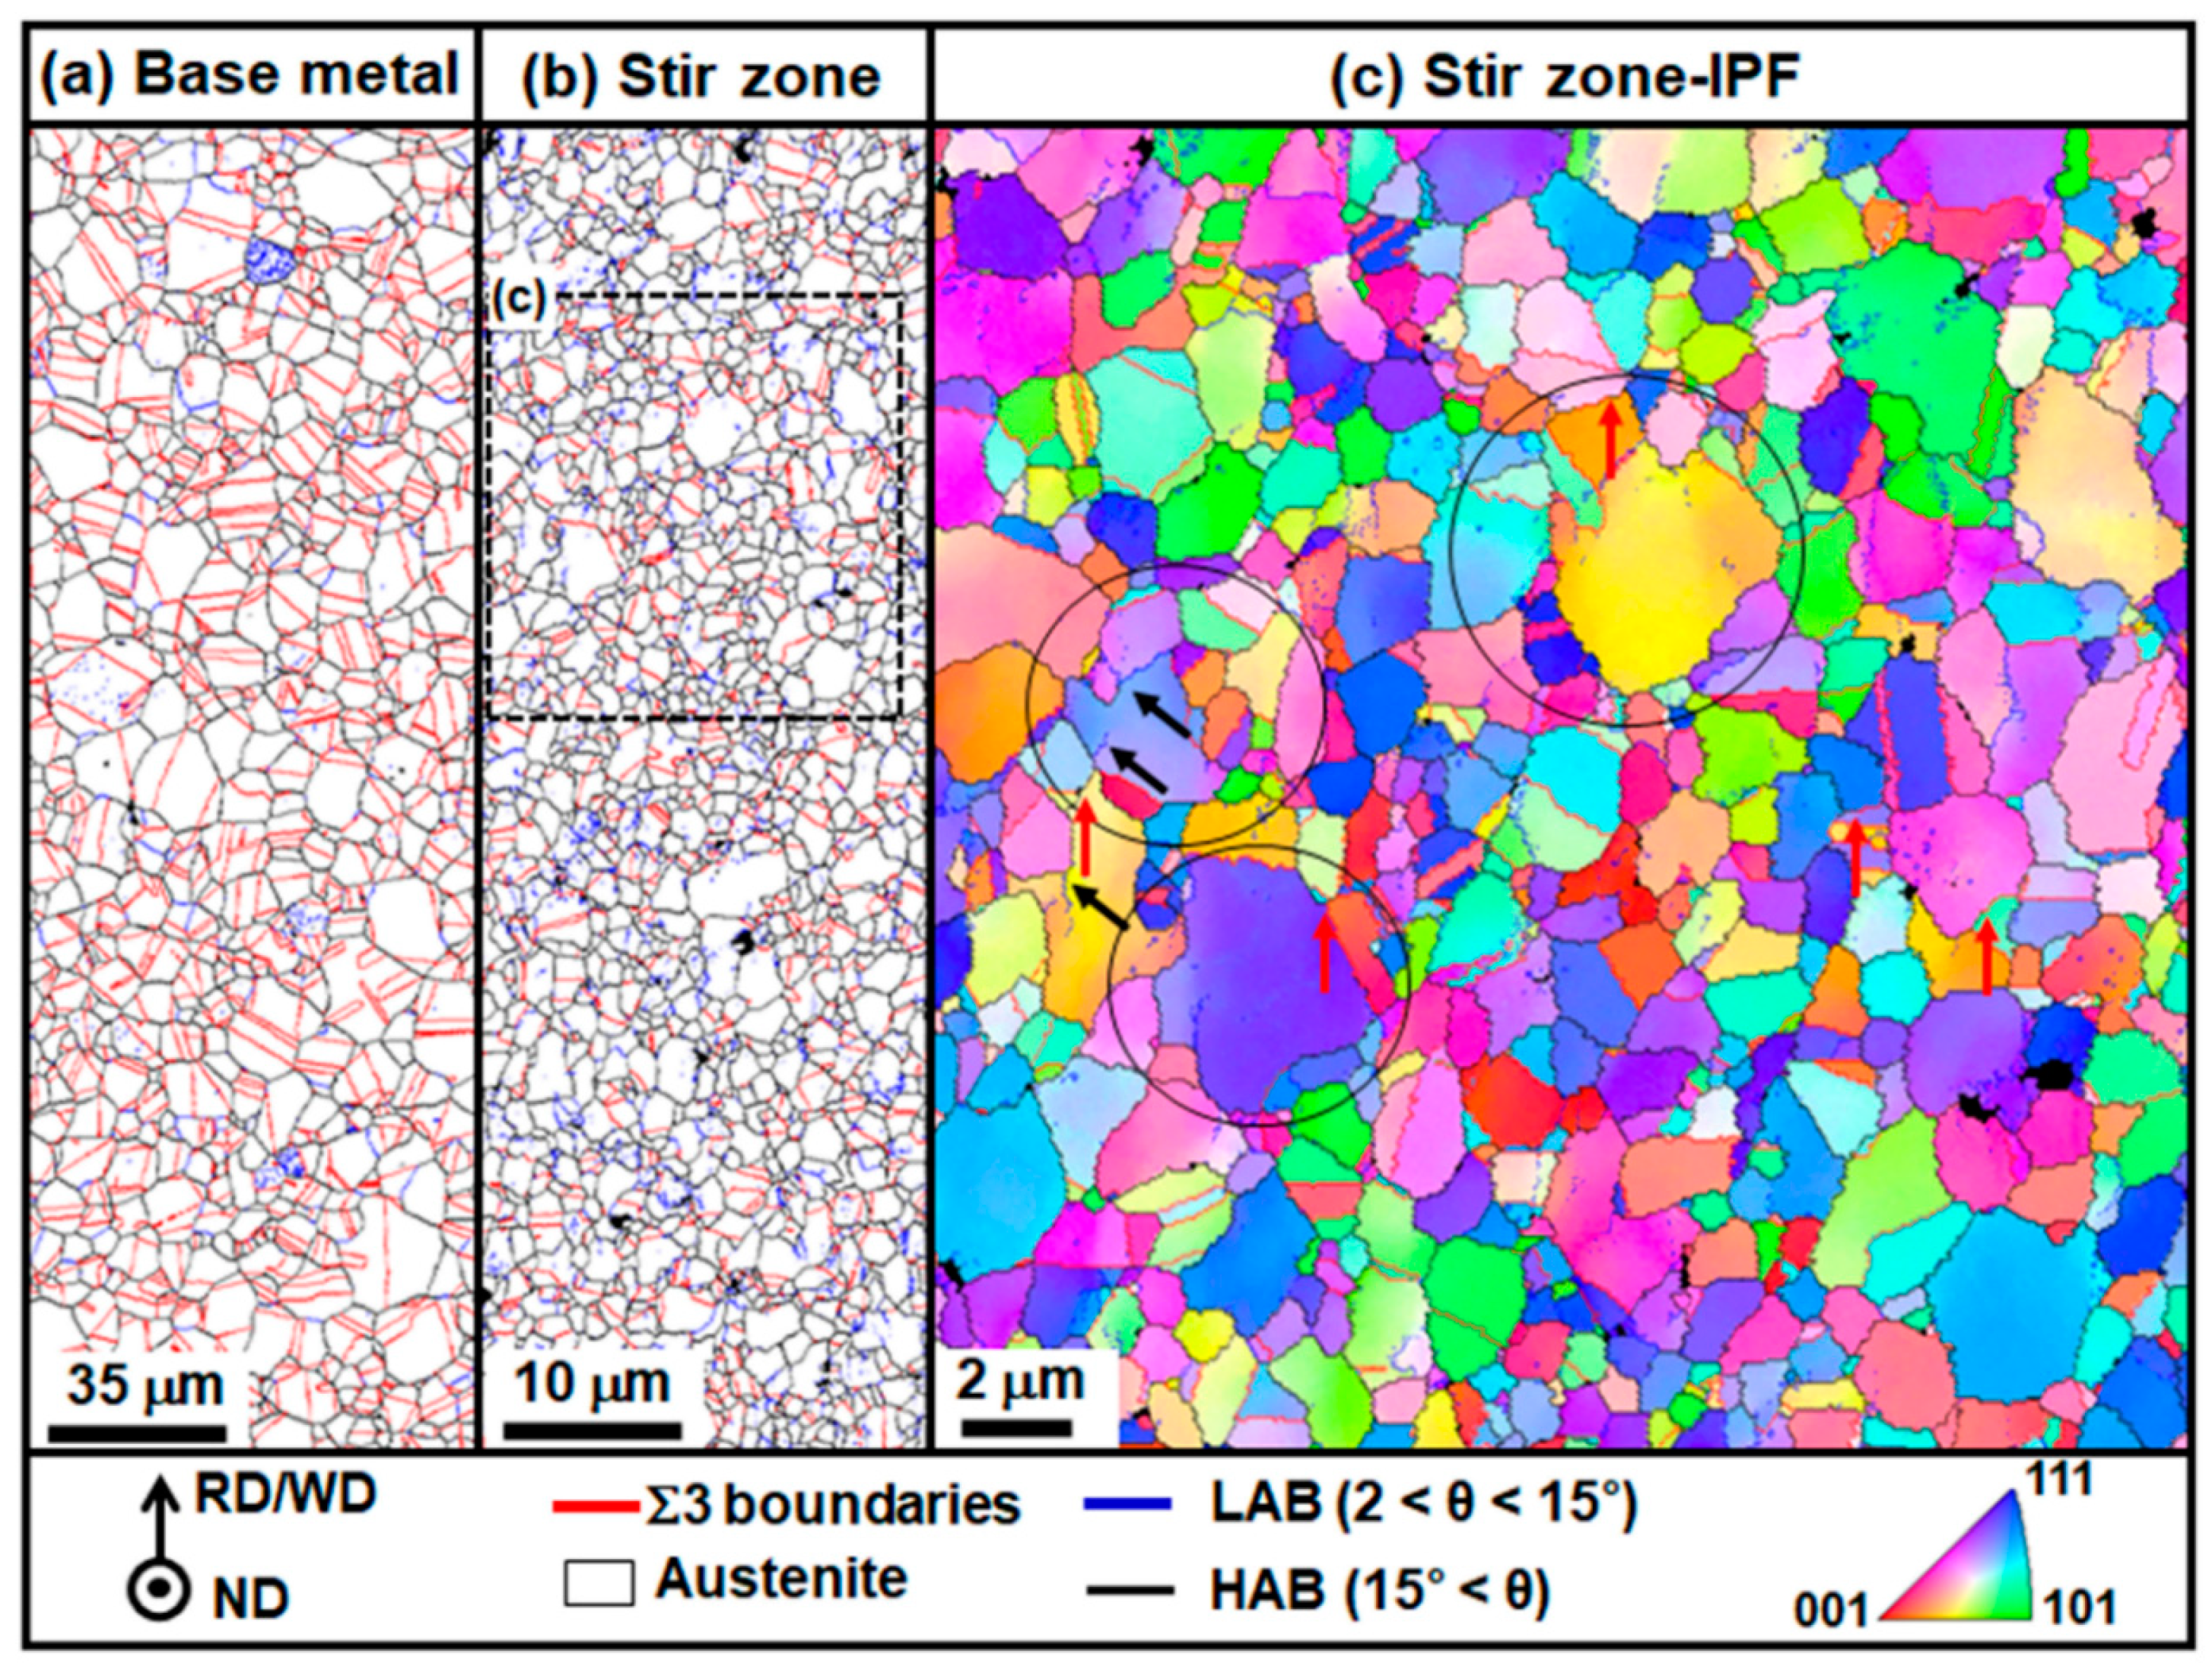
Figure 2.
Distribution of (a) grain diameter, (b) misorientation angle, (c) kernel average misorientation, and (d) the misorientation deviation measured along the ideal Σ3 twin boundaries in the base metal and stir zone specimens.
Figure 2.
Distribution of (a) grain diameter, (b) misorientation angle, (c) kernel average misorientation, and (d) the misorientation deviation measured along the ideal Σ3 twin boundaries in the base metal and stir zone specimens.
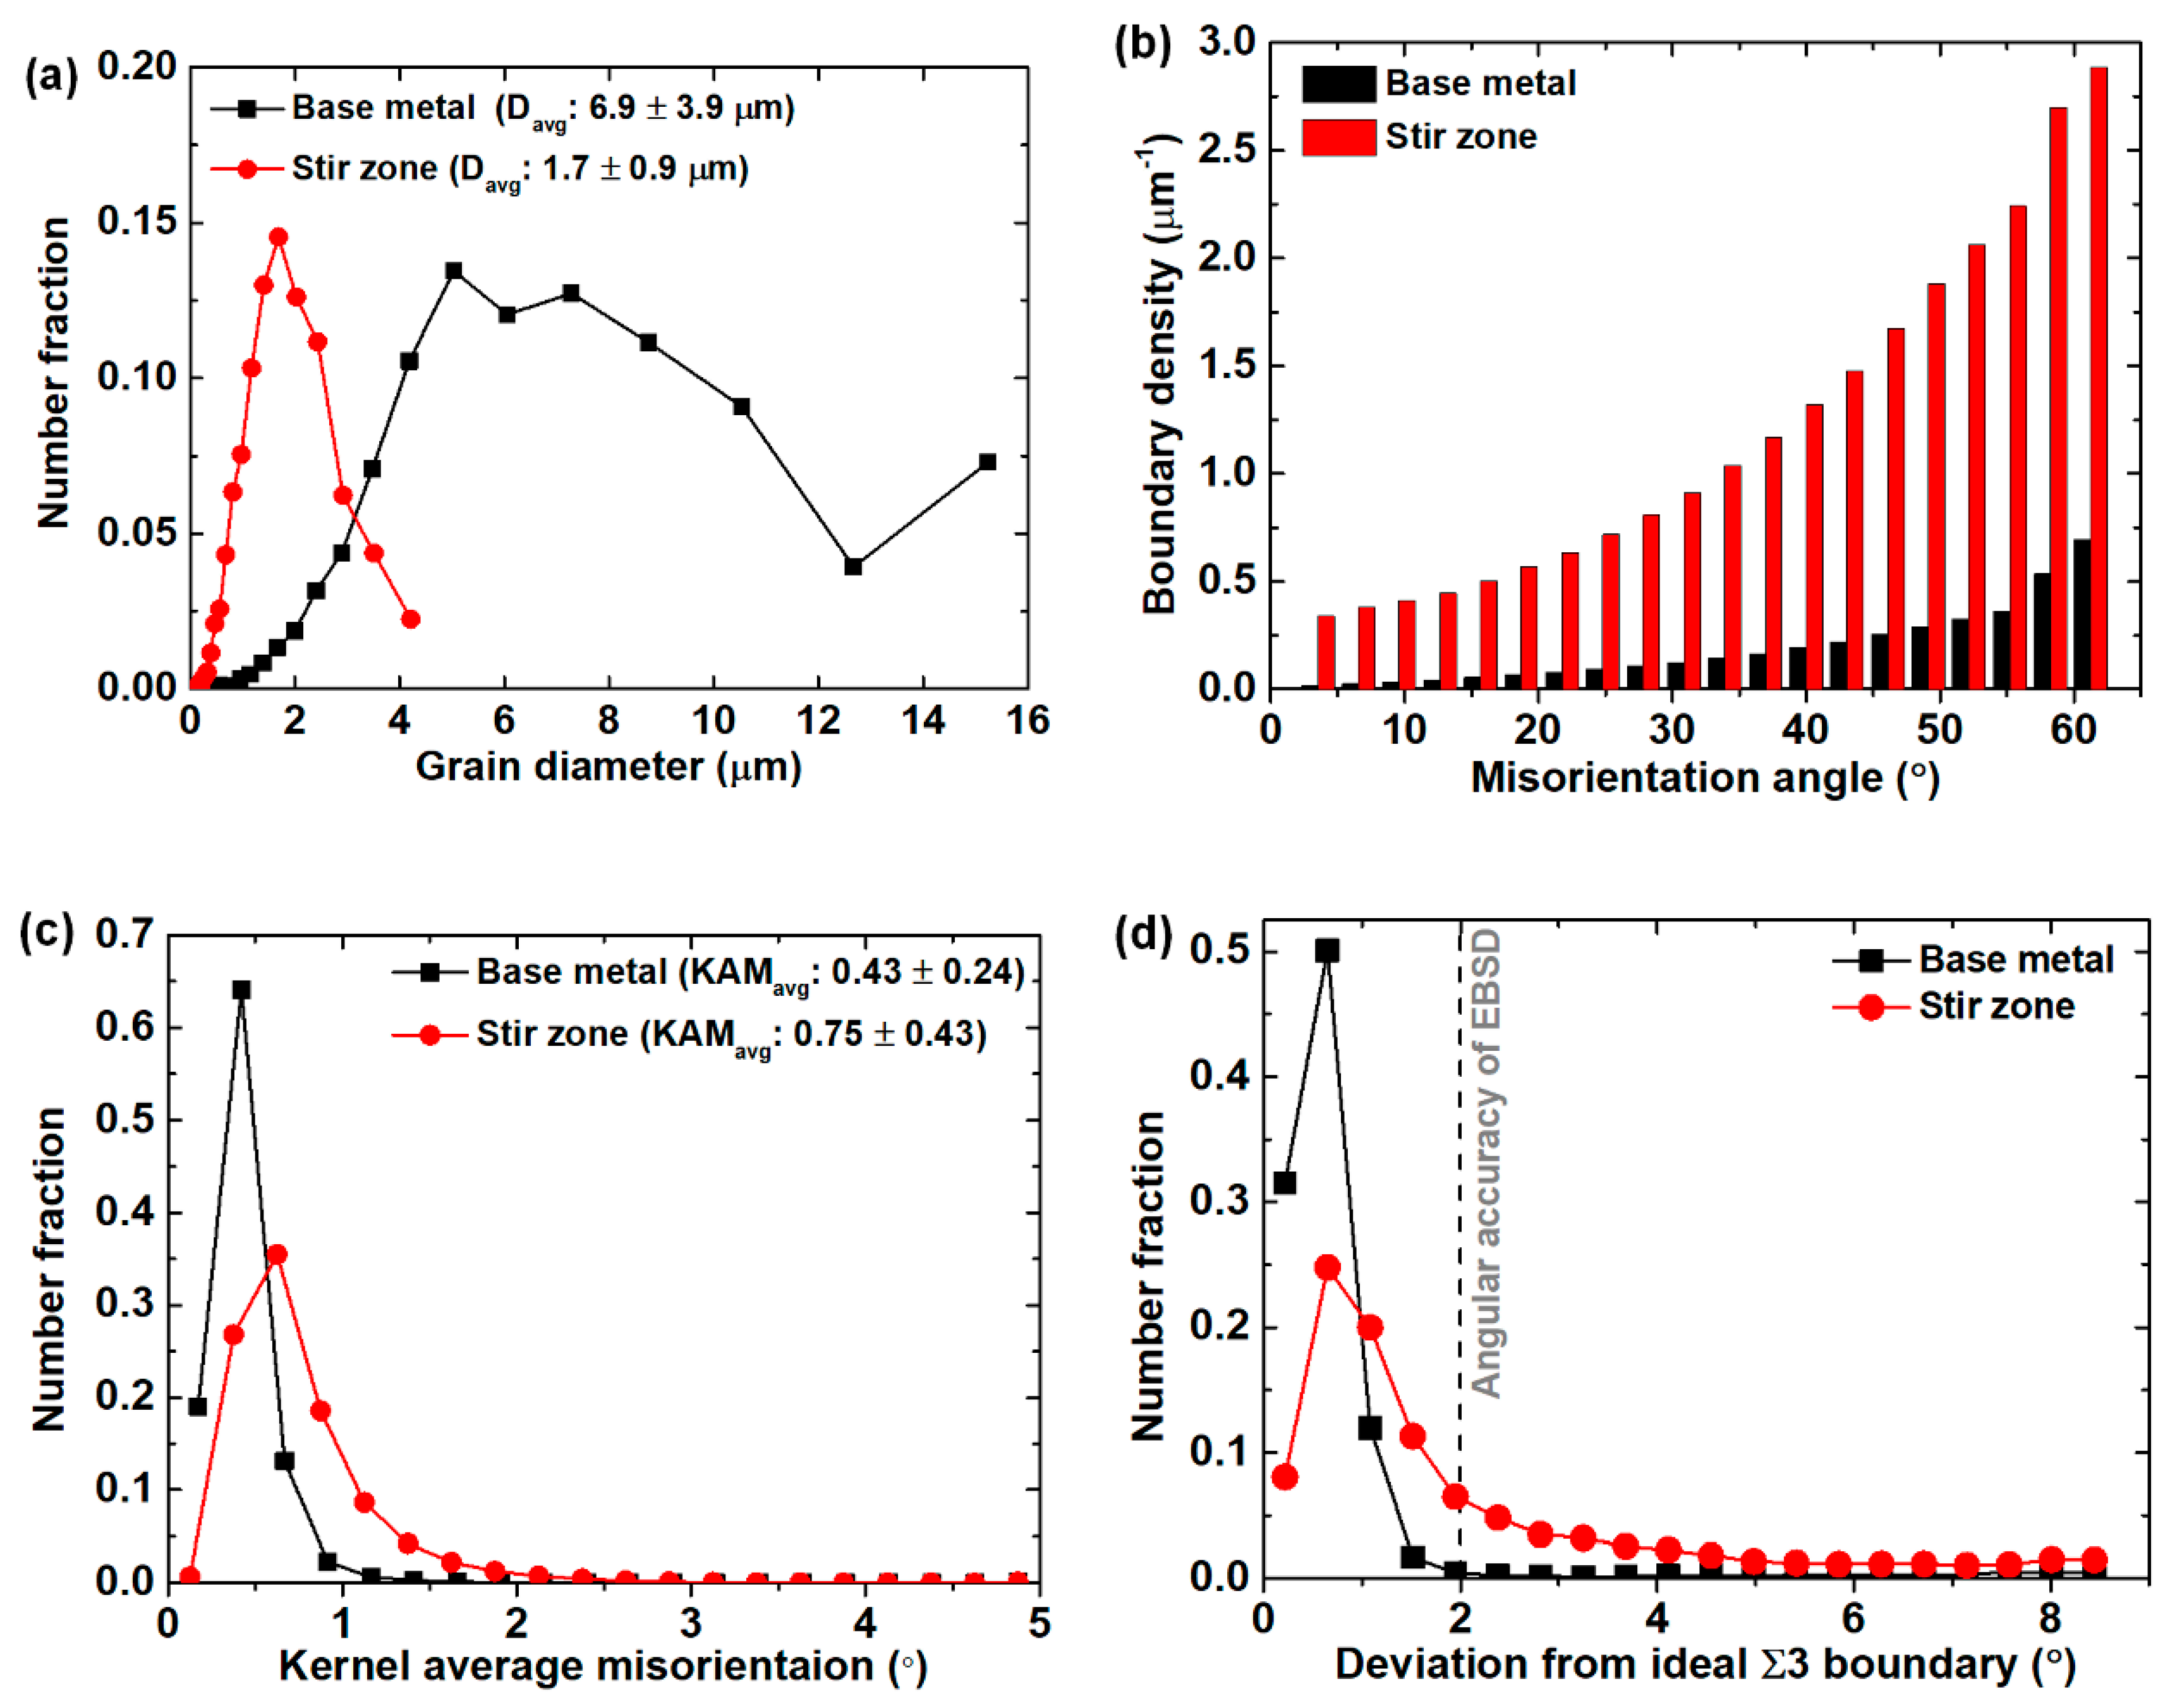
Figure 3.
Microstructure partitioning in stir zone. (a) Grain orientation spread map and microstructure and microstructural characteristics of recrystallized and unrecrystallized grains: (b) misorientation angle distribution, (c) misorientation deviations measured along ideal Σ3 twin boundaries, and (d) grain diameter distributions (including annealing twins).
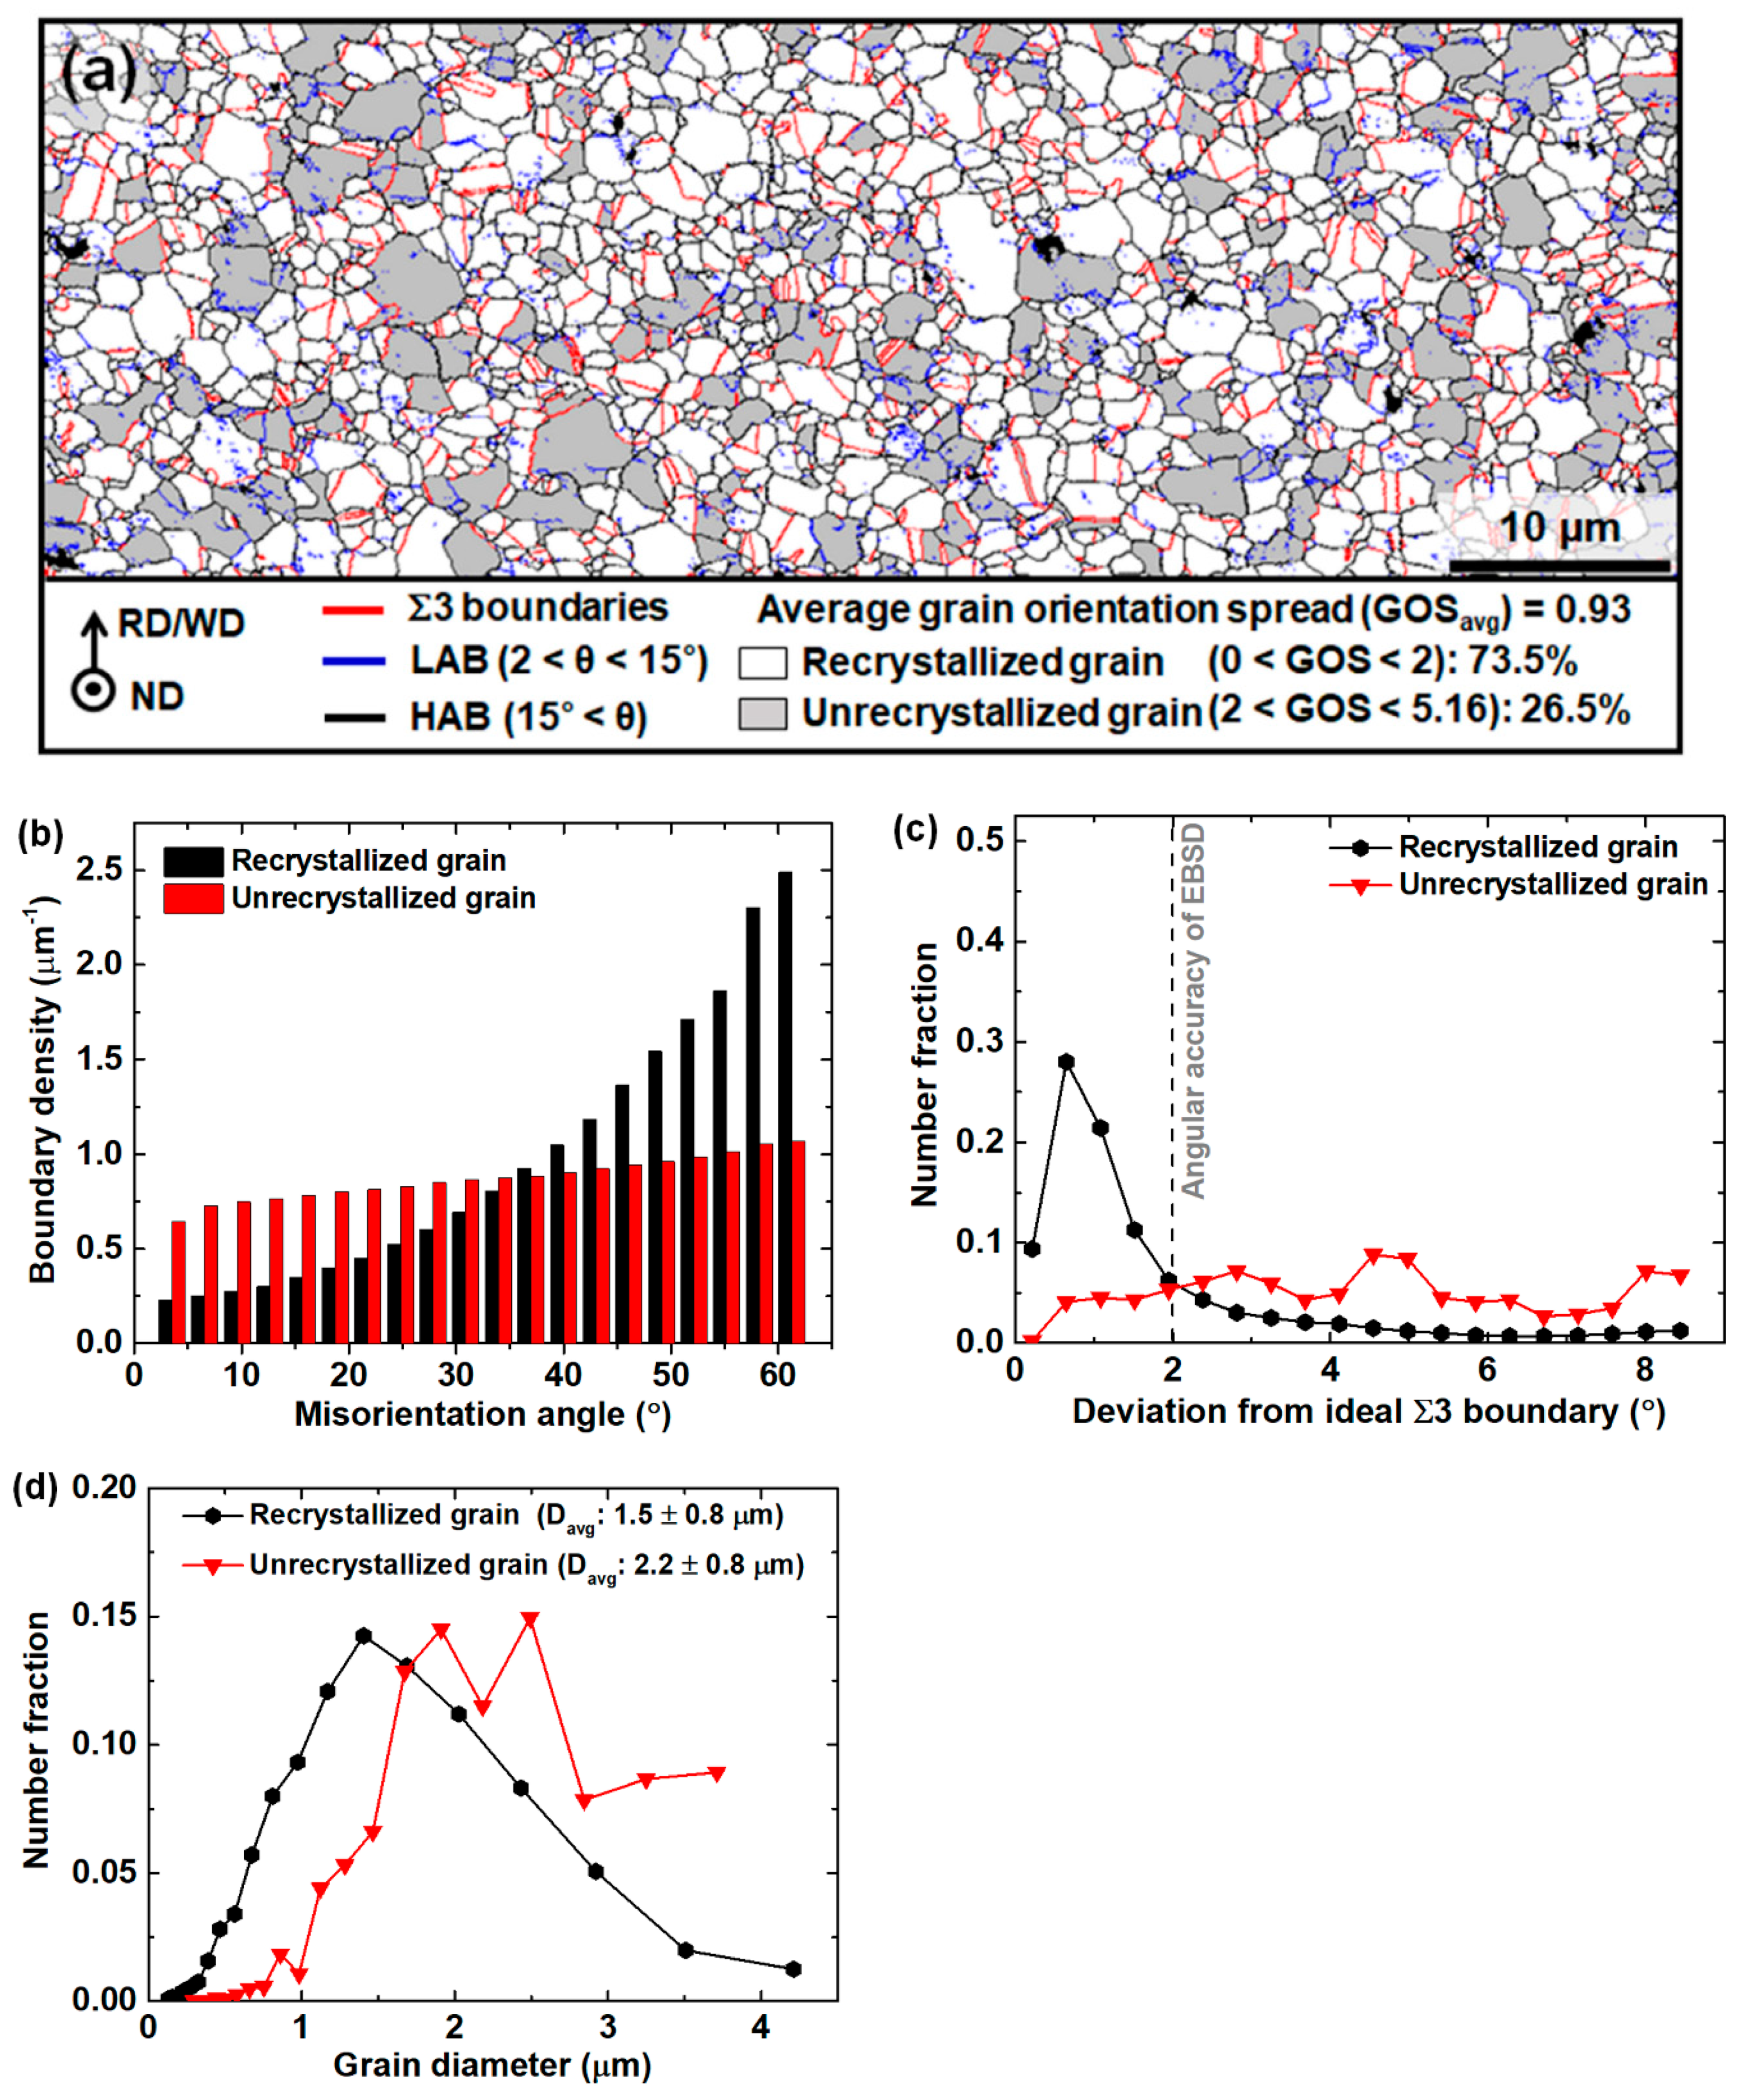
Figure 4.
Corrosion tests of base metal and stir zone specimens: (a) open circuit potential and (b) potentiodynamic plots.
Figure 4.
Corrosion tests of base metal and stir zone specimens: (a) open circuit potential and (b) potentiodynamic plots.
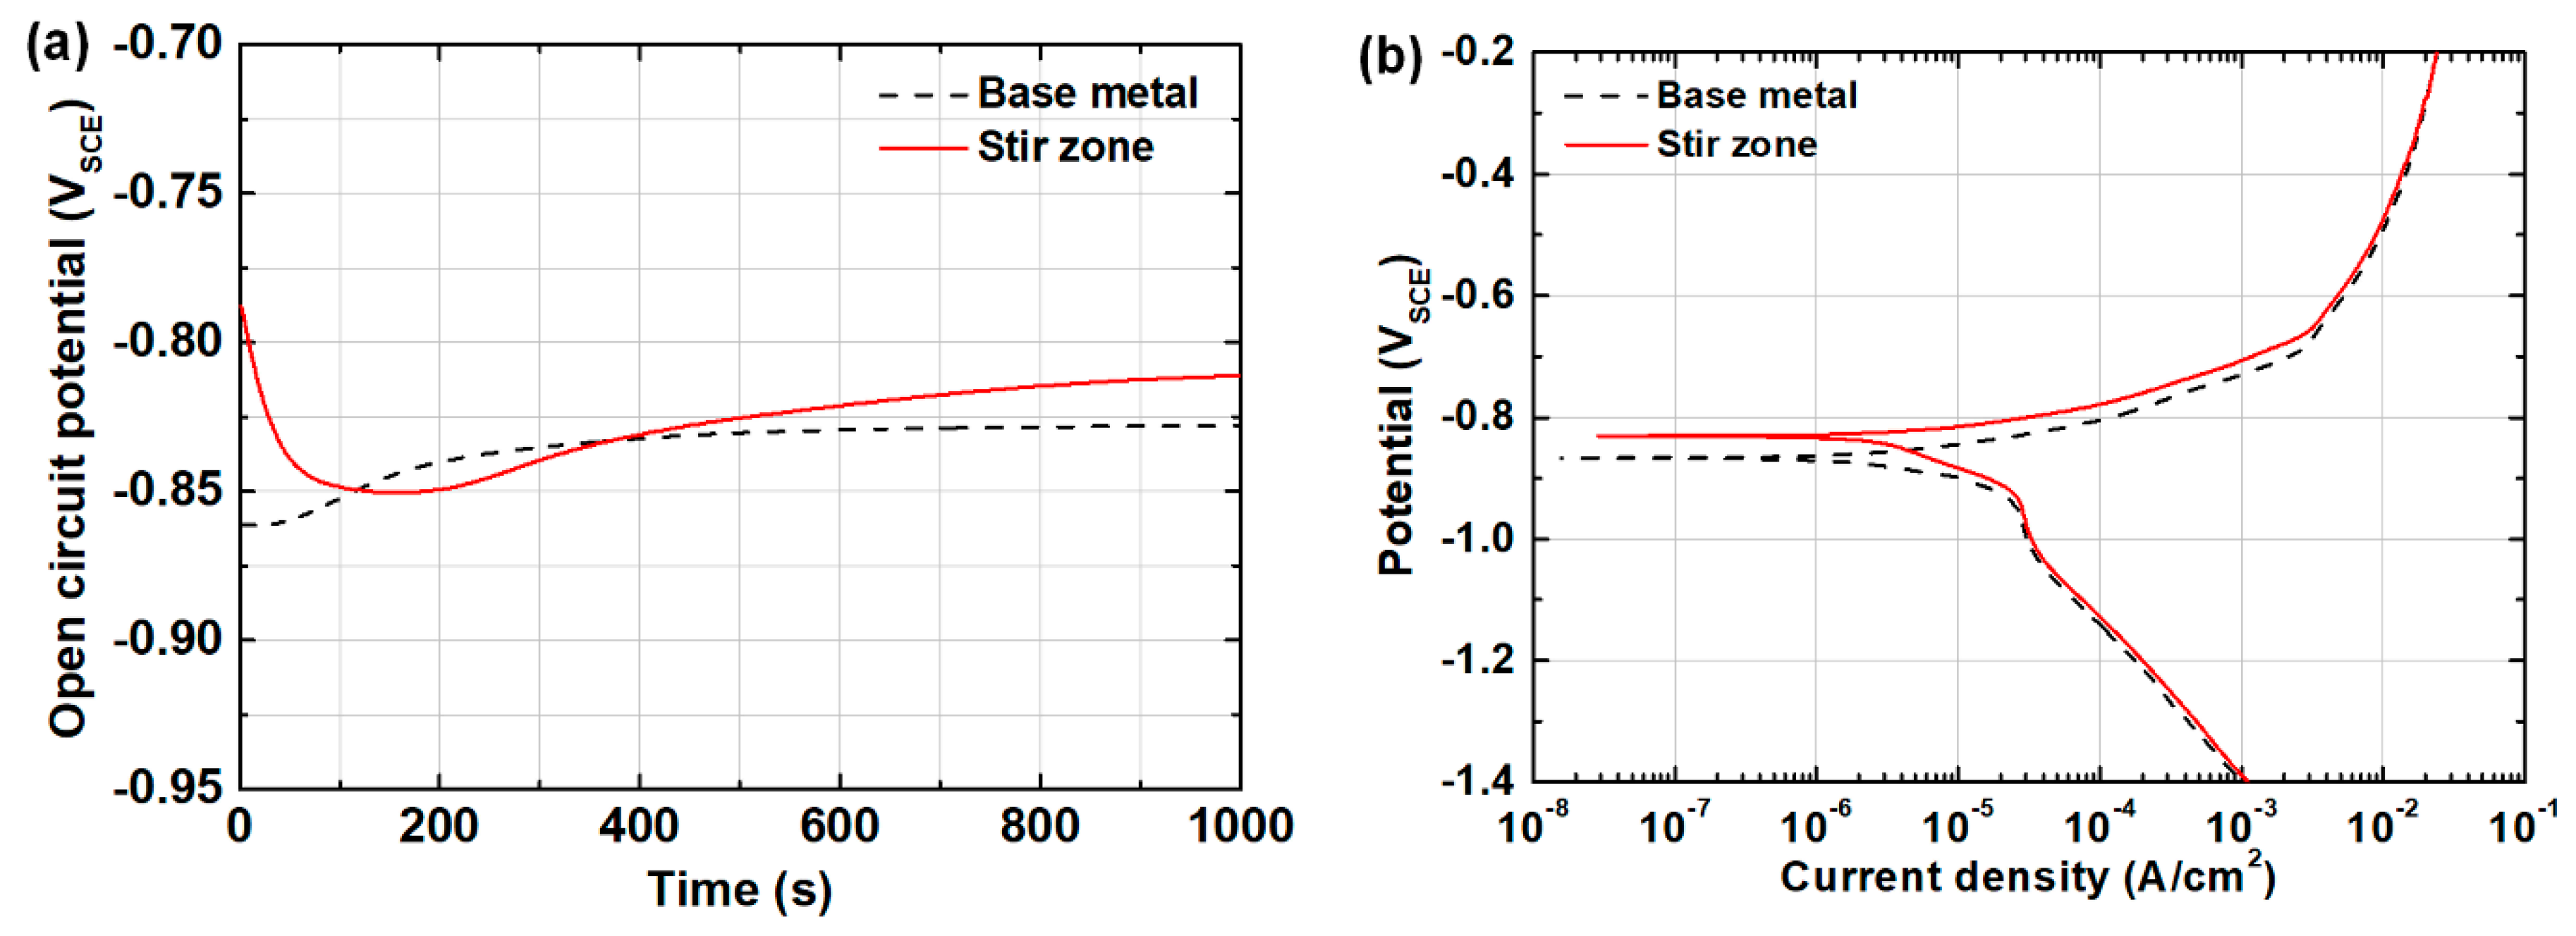
Figure 5.
Results of the non-destructive test for estimating the surface resistance of the base metal and stir zone specimens using an electrochemical impedance spectroscope: (a) Nyquist plot and (b) Bode plot.
Figure 5.
Results of the non-destructive test for estimating the surface resistance of the base metal and stir zone specimens using an electrochemical impedance spectroscope: (a) Nyquist plot and (b) Bode plot.

Figure 6.
SEM images showing the corrosion morphology after the polarization test: (a1,a2) base metal and (b1,b2) stir zone specimens. The local areas of the base metal and stir zone specimens is magnified as shown in (a2,b2), respectively.
Figure 6.
SEM images showing the corrosion morphology after the polarization test: (a1,a2) base metal and (b1,b2) stir zone specimens. The local areas of the base metal and stir zone specimens is magnified as shown in (a2,b2), respectively.

Figure 7.
Coincident site lattice boundaries distributions of base metal and stir zone specimens together with their fractions.
Figure 7.
Coincident site lattice boundaries distributions of base metal and stir zone specimens together with their fractions.

Table 1.
Actual chemical composition of C-free Fe-30Mn-3Al-3Si TWIP steel.
| Specimen | Chemical Composition (wt.%) | |||||
|---|---|---|---|---|---|---|
| Mn | Al | Si | C | S | Fe | |
| C-free TWIP | 29.9 | 2.95 | 3.09 | 0.032 | 0.010 | Bal. |
Table 2.
Estimated values of the electrochemical test on the potentiodynamic anodic polarization of Fe–30Mn–3Al–3Si (wt.%) TWIP steel and its stir zone after FSW.
Table 2.
Estimated values of the electrochemical test on the potentiodynamic anodic polarization of Fe–30Mn–3Al–3Si (wt.%) TWIP steel and its stir zone after FSW.
| Specimen | aEcorr (mV) | Corrosion Rate | Constant Tafel Value | ||
|---|---|---|---|---|---|
| bIcorr (μA/cm2) | cmpy (Mils/Year) | dβa (mV/Decade) | eβc (mV/Decade) | ||
| Base metal | −865 | 6.080 | 2.780 | 49.9 | 122.7 |
| Stir zone | −835 | 5.350 | 2.444 | 43.3 | 141.9 |
aEcorr refers to the potential, where the current reaches zero under polarization. b Icorr is the corrosion current density. c mpy is mils per year, indicating the corrosion rate. d βa is the Tafel slope of the cathodic polarization curve. e βc is the Tafel slope of the anodic polarization curve.
Table 3.
Parameters of the replacement corrosive electrical circuit of the electrochemical impedance spectroscopy test on Fe–30Mn–3Al–3Si (wt.%) TWIP steel and its stir zone after FSW.
Table 3.
Parameters of the replacement corrosive electrical circuit of the electrochemical impedance spectroscopy test on Fe–30Mn–3Al–3Si (wt.%) TWIP steel and its stir zone after FSW.
| Specimen | aRs (Ω) | bRct (Ω) | cCdl (μF) |
|---|---|---|---|
| Base metal | 16.46 | 467.6 | 439.3 |
| Stir zone | 15.97 | 495.9 | 387.1 |
aRs refers to the electrolyte resistance. b Rct refers to the charge transfer resistance. c Cdl refers to the double layer capacitance.
Publisher’s Note: MDPI stays neutral with regard to jurisdictional claims in published maps and institutional affiliations. |
© 2020 by the authors. Licensee MDPI, Basel, Switzerland. This article is an open access article distributed under the terms and conditions of the Creative Commons Attribution (CC BY) license (http://creativecommons.org/licenses/by/4.0/).
Share and Cite
MDPI and ACS Style
Kim, H.-J.; Fujii, H.; Lee, S.-J. Corrosion Behavior and Microstructure of Stir Zone in Fe-30Mn-3Al-3Si Twinning-Induced Plasticity Steel after Friction Stir Welding. Metals 2020, 10, 1557. https://doi.org/10.3390/met10111557
AMA Style
Kim H-J, Fujii H, Lee S-J. Corrosion Behavior and Microstructure of Stir Zone in Fe-30Mn-3Al-3Si Twinning-Induced Plasticity Steel after Friction Stir Welding. Metals. 2020; 10(11):1557. https://doi.org/10.3390/met10111557
Chicago/Turabian StyleKim, Hye-Jin, Hidetoshi Fujii, and Seung-Joon Lee. 2020. "Corrosion Behavior and Microstructure of Stir Zone in Fe-30Mn-3Al-3Si Twinning-Induced Plasticity Steel after Friction Stir Welding" Metals 10, no. 11: 1557. https://doi.org/10.3390/met10111557
Note that from the first issue of 2016, this journal uses article numbers instead of page numbers. See further details here.