Influence of Surface Finishing on Corrosion Behaviour of 3D Printed TiAlV Alloy


Department of metals and corrosion engineering, University of Chemistry and Technology in Prague, Technicka 5, 166 28 Prague, Czech Republic
*
Author to whom correspondence should be addressed.
Metals 2020, 10(11), 1547; https://doi.org/10.3390/met10111547
Submission received: 2 November 2020
/
Revised: 19 November 2020
/
Accepted: 20 November 2020
/
Published: 21 November 2020
(This article belongs to the Special Issue Processing and Treatment of Hexagonal Metallic Materials)
Abstract
:Additive manufacturing is currently one of the promising methods for the fabrication of products of complex shapes. It is also used in medical applications, thanks to technological progress, which also enables the printing of metallic materials. However, the final products often have to undergo a final surface treatment. In this work, the influence of surface finishing on the corrosion behavior of the medical alloy Ti-6Al-4V prepared by the selective laser melting technique is studied. The samples were subjected to mechanical, chemical and electrochemical treatments. Corrosion behavior was investigated using DC and AC electrochemical techniques such as potentiodynamic and potentiostatic curves and electrochemical impedance spectroscopy. Furthermore, the influence of surface treatments on the possibility of localized corrosion attack was evaluated. The results showed that the surface treatments have a positive effect on the corrosion resistance and reduce the risk of crevice corrosion.
1. Introduction
The manufacturing of products of specific shapes, which cannot be achieved in any other way than 3D printing, also known as additive manufacturing, is increasingly in demand. In contrast to the traditional method of metallic materials production (casting, forming and machining), the additive layer-by-layer technique results in a complex structure in almost final form. This makes the production of more complex components faster and cheaper. For this reason, 3D printing of titanium and its alloys is also promising for medical applications [1,2,3,4]. The only key disadvantage affecting 3D printing of metallic materials compared to traditional production is the random porosity of products, which still cannot be reduced below 0.5% [1,5]. The Ti-6Al-4V alloy has a less dense passive layer compared to commercially pure titanium Grade 2, but is still sufficiently corrosion resistant and is more widely used for biomaterials due to its improved mechanical properties. Furthermore, it has been experimentally found that the properties of this passive layer can be significantly influenced by various surface treatments. For example, the anodic oxidation of Ti-6Al-4V alloy can increase the thickness of the passive layer, resulting in increased corrosion resistance [6,7,8]. However, materials prepared by additive methods have a different microstructure and surface geometry, which also affects corrosion resistance [9]. Due to its microstructure, which is largely made of needle-like α‘martensite, compared to an alloy produced by traditional technology, Ti-6Al-4V alloy produced by selective laser melting (SLM) has a worse resistance to uneven corrosion attack in a solution containing 3.5 wt. % NaCl. When exposed to a simulated body solution (minimum essential media), the SLM-prepared alloy sample also had a slightly higher current density than potentiated specimens in the potentiodynamic measurement, but the passive layer failed. Faster repassivation was also measured in samples prepared by the additive method [10,11]. The corrosion resistance of 3D printed materials also depends on the orientation of the tested surface, the microstructure is different for the horizontal and vertical section of the sample. Potentiodynamic measurements show that the XY plane resists better corrosion attack, probably due to a higher proportion of titanium β phase [12]. Corrosion and tribocorrosion behavior of Ti-6Al-4V processed by SLM and HP in comparison with the commercial alloy was studied by Toptan et al. [13]. Electrochemical tests showed that decreased β phase and the formation of α′ phase affected the electrochemical response of the 3D printed alloy which formed a passive layer of lower quality. Further, it was found that stress-relief annealing has a positive influence on corrosion resistance of the TiAlV alloy prepared by additive manufacturing. The main effect is achieved by reducing the micro segregations and by forming a more stable passive layer [14]. Our previous study showed only negligible differences in corrosion behavior of 3D printed and commercial TiAlV alloy [15]. However, the final products made by additive manufacturing often require subsequent surface treatment. The SLM method uses metal powder to form the part, which is produced by atomization [16]. Unfortunately, partially melted particles remain on the surface after printing. These particles could be released and circulate through the human body. One possible way to remove these partially melted particles from the surface is by double acid etching. A mixture of hydrofluoric acid (HF) and nitric acid (HNO3) is used for the TiAlV alloy. A higher concentration of hydrofluoric acid, which reacts with titanium to form a fluoro complex, speeds up the etching process. By adding nitric acid to the mixture, it slows down the etching process and becomes more controllable, further preventing hydrogen from entering the metal structure. The process of removing partially melted particles from the surface is further influenced by temperature, time and flow [17,18]. Particle removal also depends on component design. If the component is in the form of a scaffold, the size and shape of the pores play a major role in the removal. If the pores are too small, there is insufficient flow of acids inside and outside the scaffold. This results in insufficient removal of particles within the scaffold [19].
This study aims to compare the corrosion behavior of a TiAlV alloy prepared by selective laser melting technique with different surface finishing.
2. Experimental
2.1. Materials
The samples were manufactured at ProSpon s.r.o. by selective laser melting technique from Ti-6Al-4V powder in an M2 fusing machine (Concept Laser GmbH, Lichtenfels, Germany) of following parameters: the energy of a laser beam was 200 W, beam width was 200 µm, raster distance (distance between individual scanning rows/scanning distance) was 80 µm and the laser moved with the speed of 1250 mm s−1. The build platform was preheated up to 473 K. An average grain size was 15–45 µm and layers were 30 µm thick. The whole process was carried out in a working chamber containing argon atmosphere (oxygen was present in a concentration lower than 0.5 vol. %). To minimize internal stresses, finished parts underwent heat treatment in a vacuum furnace. After 4 h of heating, the parts were kept at the temperature of 1093 K for 90 min and cooled down slowly. The two groups of specimens were tested. The first one was based on a compact surface (Figure 1a). This surface was tested with the following treatments: as printed (original, O), anodized (O 24 V), turned (T), etched (E), turned and anodized (T 24 V), etched and anodized (E 24 V). The second group has a trabecular structure on the top of the specimen (Figure 1b). The surface finishing was the same as for the compact specimens except turning. The surface finishing will be abbreviated in figures: original (trab), original and anodized (trab 24 V), etched (trab E), and etched and anodized (trab E 24 V).
2.2. Surface Finishing
For the surface etching, the mixture of HNO3 (65%), HF (38%) and H2O (20 mL, 2 mL, 78 mL) was used. Specimens were etched for 6 min in the ultrasonic bath followed by ultrasonication for 10 min in deionized water. The specimens were degreased in ethanol and acetone before the following treatment. The surface anodization was realized in 1 mol/L H2SO4 for 10 min at 24 V. The final color of the anodized samples was a vivid blue.
2.3. Electrochemical Measurement
The electrochemical behavior was studied in the physiological solution with 0.9 wt. % NaCl at 37 °C. Samples were cleaned with ethanol and acetone before the exposure. Standard three-electrode setup with glassy carbon counter electrodes and Ag/AgCl with 3 mol/L KCl (abbreviated as SSCE) as a reference electrode was used for electrochemical measurements. The open-circuit potential (OCP) was stabilized for 12 h. The electrochemical impedance spectra were measured in the frequency range from 60 kHz to 1.6 mHz with 10 mV/OCP AC amplitude after that. The measurement setup was finished by potentiodynamic scan from −0.05 V/OCP to 1 V/SSCE with a polarization rate of 1 mV/s. The susceptibility to non-uniform corrosion attack according to ASTM F746 standard was further measured for all samples. The samples were polarized to 0.85 V/SSCE for 900 s after one-hour stabilization of the OCP. The current density was monitored during the polarization. The material was subsequently polarized to a lower potential value (0.4 V/SSCE) and the repassivation potential was determined in the case of stable localized corrosion attack. As opposed to the standard measurement, no artificial crevice was created on the sample, so that only the effect of the non-homogeneity of the surface was observed. The exposure area was entered as a geometrical area 3 cm2. All electrochemical experiments were realized with Reference 600 potentiostat (Gamry, Warminster, PA, USA). The impedance spectra were evaluated in Echem Analyst 6.32 software (Gamry, Warminster, PA, USA).
3. Results and Discussion
Images of untreated surfaces (Figure 1) show residues of partly melted powder present on the surface of 3D printed materials. The bond strength between the material and this particle might not be high enough and there is a significant risk of loosening. This phenomenon is particularly evident in trabecular systems. The surface of both types of specimens after etching is shown in Figure 2. The partially melted particles of the powder were etched off during 6 min exposure. The compact sample surface after etching consists of the approx. 50 μm valleys surrounded by local sharp peaks (Figure 2a,b). The thickness of the trabecular single beams was reduced from 322 ± 21 μm to 243 ± 21 μm. It is clear that this treatment changes the surface morphology and also causes the dimensional changes that must be taken into account when using this treatment.
The open-circuit potential time dependences for all surfaces are summarized in Figure 3. The dependences were smooth without any sharp changes which could indicate corrosion attack. The open-circuit potential was stabilized during 12 h of exposure. Its values indicate a passive state of all samples [20]. The anodization caused the shift of potential to more noble values, especially in the case of etched samples.
Impedance spectra measured after 12 h OCP stabilization are summarized in Figure 4. The impedance spectra of the compact specimen showed typical shape for the passive surface of titanium alloys [21,22]. The phase angle was near −83° at the middle frequencies and rose at low frequencies. The impedance modulus increased linearly in the region of middle and low frequencies. There was another time constant at high frequency in the case of the trabecular surfaces (Figure 4a). The impedance spectra of the anodized surfaces (Figure 4b) were more complicated. Even though the anodized surface should act as an almost ideal capacitor, the impedance response does not match this behavior. There is a combination of the highly non-ideal surface and relatively thick surface oxide. The phase shift increases at low frequencies.
Figure 5 shows the equivalent circuits used to evaluate the impedance spectra. In these circuits, the constant phase element (CPE) is used instead of a capacitor, which considers the non-ideal behavior of the system. The impedance of the constant phase element is defined as Z = [C.(jω)α]−1, where α ∈ 〈0;1〉; if α = 1, the CPE acts as a pure capacitor and if α = 0, it acts as a pure resistor [23]. The CPE also describes diffusion control when the α is near 0.5 [23,24]. Even the simplest spectra contain two time constants. This is because the passive layer on titanium consists of an inner fully compact part and an outer porous part. This implies the meaning of the individual elements as follows: Rel—electrolyte resistance, CPEout and Rout—capacitance and resistance of the outer part of passive layer, CPEin and Rin—capacitance and resistance of the inner part of passive layer (this equivalent to charge transfer). [25,26,27]. The elements CPEs and Rs represent the capacitance and resistance of the surface inhomogeneity such as high roughness and big pores [28,29,30] and CPEdiff describes diffusion through the oxide layer [31,32].
Table 1 summarizes the results of the impedance spectra evaluation. The second column identified an equivalent circuit (EC) was used for spectra fitting. The goodness of fit was evaluated by chi-square interaction and errors reach the values in order of 10−4 and better. The validity of the steady-state impedance data was confirmed with the help of the Kramers–Kronig transformation (chi-square error 10−6). The α coefficients were approaching 1 in all cases except the CPEdiff element coefficient where the values α were close to 0.5. The resistance elements analysis showed that the main contribution to overall resistance was achieved by Rin.
The analysis of the equivalent circuit elements shows that the corrosion resistance increases in the case of anodized specimens in comparison with the original surface. The turned surface shows the highest values of the overall resistance. However, there is a significant difference between the geometrical area (which is used for R and CPE values calculations) and the real surface of the not turned specimens. The higher real area compared to the entered value caused a decrease in the calculated resistance. The specimen etching has a negative influence on the corrosion resistance, this effect is long term, as was mentioned in our previous study [33]. Nevertheless, the subsequent anodization increased the corrosion resistance to the same level or higher as for the original surface. The CPEout values indicate the thickening of the surface oxide layer and based on the analysis of the CPEdiff also diffusion control of the corrosion process.
The potentiodynamic curves measured after 16 h of exposure are summarized in Figure 6. The current density increases gradually from corrosion potential up to 0.4 V/SSCE in the case of surfaces without anodization (Figure 6a). This typical behavior of titanium alloys results from the passive layer reconstruction [7,11,22]. When the polarization rise stops, the current drops to a value corresponding to the actual passivation current. This phenomenon is further described below. Sharp peaks are also present on all types of non-anodized surfaces (except turned) indicating susceptibility to localized corrosion attack. It is also apparent from these data that the trabecular materials need to undergo surface modification because inhomogeneities on the surface resulting from the manufacturing process could also lead to a localized corrosion attack and it is not possible to machine the surface mechanically with such types of materials. Etching further amplifies this effect since the susceptible sites are already etched to form preferential places. Nevertheless, even in these cases, there are no stable active pits, which is evident from the fact that transients, even at higher potentials, do not result in a sudden and sustained increase in current density. The highest values of current densities were measured on trabecular samples; this was caused by higher real exposed surface relative to the geometrical area.
The situation was different in the case of anodized surfaces. It is obvious from both potentiodynamic curves (Figure 6b) and summarize results (Table 2) obtained from potentiodynamic curves measurement. The anodic Tafel slope was over 120 mV in all cases, this suggests a passive surface. The current densities at passivity decreased almost by two orders after anodization. The lowest changes were recorded in the case of specimens with trabecular structure. This is caused by difference in the real and geometrical surface area, which partly overlaps differences, especially in this case.
It is also evident from the development of current dependence on the potential change that in the case of turned and etched surfaces, which are subsequently anodized, the passive layer is fully stable and is not further reconstructed. The anodic slope over 1 V suggests a thick oxide layer, which blocks charge transfer. Comparing the current densities across the entire polarization region of the original, turned, and etched surfaces show that etching is a pretreatment that leads to a general reduction in current density for anodized materials. This effect is caused by the dissolution of the original layer, reduction in morphological inhomogeneities and subsequent formation of a new more compact layer after the etching process.
Transient peaks do not appear on any type of surface after anodization, and this significantly reduces the risk of non-localized corrosion attack. The corrosion current density of all alloys also decreases.
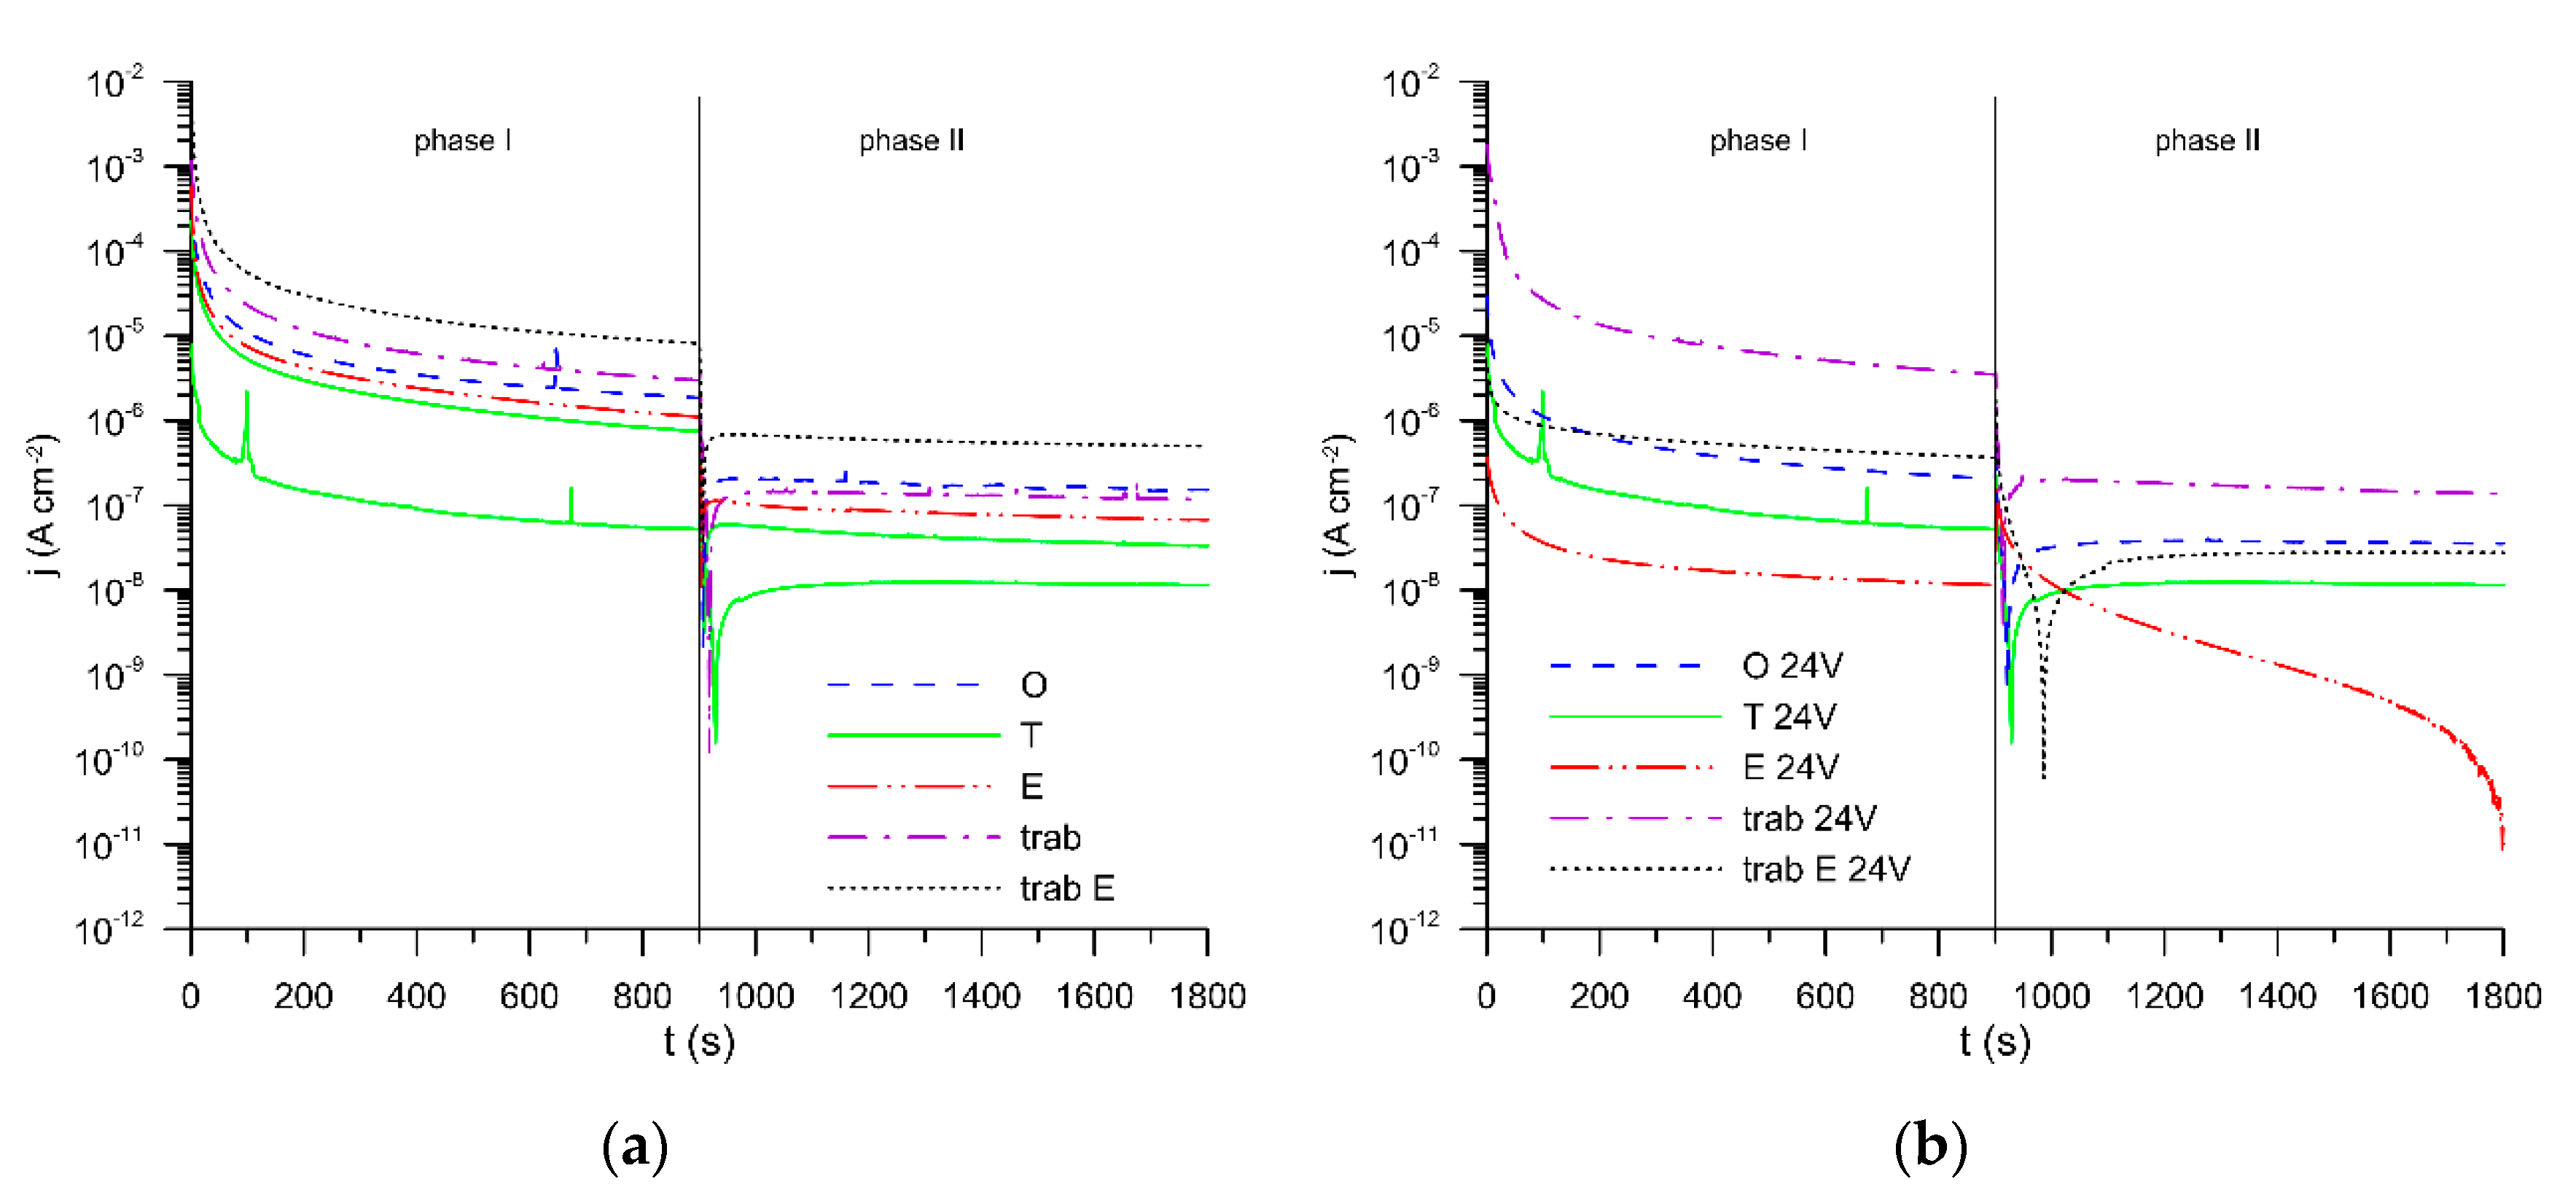
To verify the susceptibility to non-uniform forms of corrosion, a potentiostatic exposure was performed, at which a significant anodic polarization occurred first, which aims to induce a stable development of the localized attack. This part is followed by a phase with a reduced potential while observing the ability of repassivation as expressed by the current drop. The potentiostatic curves, measured after one-hour stabilization of the open circuit potential, are summarized in Figure 7. All curves showed the typical behavior of the passive surfaces. In the first part of polarization, the current densities exponentially decrease throughout whole duration of polarization. Some peaks were indicating the local breakdown of the passive layer. However, the stable development of the localized corrosion attack was not detected in any case. As discussed above, in the absence of breakdowns at such potentials, the passive layer on titanium alloys is finished, which is very gentle anodization. The overall differences of the passive current densities are mainly due to the different actual exposed area. In the case of non-anodized materials, the current density has dropped sharply each time the potential is reduced, which is due to the charging current. Subsequently, after polarization of the interface, the current density value is completely stable. This indicates that there are no significant changes in the passive layer. For non-etched anodized alloys, the situation is similar to that of non-anodized alloys. Different behavior occurs in etched and subsequently anodized alloys. There is a markedly longer polarization time of the interface, resulting in slower current response and higher overall charge required for polarization. A current density is not stabilized on the etched anodized surface for the entire second part of polarization. This is due to the quality of the passive layer created by this combination of treatments. This layer almost completely blocks charge transfer, providing excellent material protection and the current course represents a capacitor (thick oxide layer) discharge.
4. Conclusions
The corrosion resistance of the additively manufactured Ti-6Al-V alloy with different surface finishes was described. The as-printed surface with partially melted powder particles shows potential susceptibility to localized corrosion attack. The surface finishes attained by turning or etching minimize this risk. The surface anodization significantly increased corrosion resistance. The surface etching followed by anodization seems to be the best surface treatment from the practical point of view.
Author Contributions
Conceptualization, J.F.; methodology, J.F., V.H.; investigation, Z.K., J.F.; resources, E.P., Z.K.; data curation, Z.K., J.F.; writing—original draft preparation, J.F.; writing—review and editing, J.F., E.P., V.H. All authors have read and agreed to the published version of the manuscript.
Funding
This work was supported from the grant of Specific university research—grant No. A1_FCHT_2020_003.
Conflicts of Interest
The authors declare no conflict of interest.
References
- DebRoy, T.; Wei, H.L.; Zuback, J.S.; Mukherjee, T.; Elmer, J.W.; Milewski, J.O.; Beese, A.M.; Wilson-Heid, A.; De, A.; Zhang, W. Additive manufacturing of metallic components—Process, structure and properties. Prog. Mater. Sci. 2018, 92, 112–224. [Google Scholar] [CrossRef]
- Lin, H.H.; Lonic, D.; Lo, L.J. 3D printing in orthognathic surgery—A literature review. J. Formos. Med. Assoc. 2018, 117, 547–558. [Google Scholar] [CrossRef] [PubMed]
- Mah, D.; Pelletier, M.H.; Lovric, V.; Walsh, W.R. Corrosion of 3D-Printed Orthopaedic Implant Materials. Ann. Biomed. Eng. 2019, 47, 162–173. [Google Scholar] [CrossRef] [PubMed]
- Mangano, F.; Chambrone, L.; van Noort, R.; Miller, C.; Hatton, P.; Mangano, C. Direct metal laser sintering titanium dental implants: A review of the current literature. Int. J. Biomater. 2014, 2014, 461534. [Google Scholar] [CrossRef] [PubMed] [Green Version]
- Sames, W.J.; List, F.A.; Pannala, S.; Dehoff, R.R.; Babu, S.S. The metallurgy and processing science of metal additive manufacturing. Int. Mater. Rev. 2016, 61, 315–360. [Google Scholar] [CrossRef]
- Van Noort, R. Titanium: The implant material of today. J. Mater. Sci. 1987, 22, 3801–3811. [Google Scholar] [CrossRef]
- Grosgogeat, B.; Boinet, M.; Dalard, F.; Lissac, M. Electrochemical studies of the corrosion behaviour of titanium and the Ti-6Al-4V alloy using electrochemical impedance spectroscopy. Bio-Med. Mater. Eng. 2004, 14, 323–331. [Google Scholar]
- Karambakhsh, A.; Afshar, A.; Malekinejad, P. Corrosion Resistance and Color Properties of Anodized Ti-6Al-4V. J. Mater. Eng. Perform. 2012, 21, 121–127. [Google Scholar] [CrossRef]
- Zhao, B.; Wang, H.; Qiao, N.; Wang, C.; Hu, M. Corrosion resistance characteristics of a Ti-6Al-4V alloy scaffold that is fabricated by electron beam melting and selective laser melting for implantation in vivo. Mater. Sci. Eng. C Mater. Biol. Appl. 2017, 70, 832–841. [Google Scholar] [CrossRef]
- Dai, N.; Zhang, L.-C.; Zhang, J.; Chen, Q.; Wu, M. Corrosion behavior of selective laser melted Ti-6Al-4V alloy in NaCl solution. Corros. Sci. 2016, 102, 484–489. [Google Scholar] [CrossRef]
- Wang, J.L.; Liu, R.L.; Majumdar, T.; Mantri, S.A.; Ravi, V.A.; Banerjee, R.; Birbilis, N. A closer look at the in vitro electrochemical characterisation of titanium alloys for biomedical applications using in-situ methods. Acta Biomater. 2017, 54, 469–478. [Google Scholar] [CrossRef] [PubMed]
- Dai, N.; Zhang, L.-C.; Zhang, J.; Zhang, X.; Ni, Q.; Chen, Y.; Wu, M.; Yang, C. Distinction in corrosion resistance of selective laser melted Ti-6Al-4V alloy on different planes. Corros. Sci. 2016, 111, 703–710. [Google Scholar] [CrossRef] [Green Version]
- Toptan, F.; Alves, A.C.; Carvalho, Ó.; Bartolomeu, F.; Pinto, A.M.P.; Silva, F.; Miranda, G. Corrosion and tribocorrosion behaviour of Ti6Al4V produced by selective laser melting and hot pressing in comparison with the commercial alloy. J. Mater. Process. Technol. 2019, 266, 239–245. [Google Scholar] [CrossRef]
- Li, J.; Lin, X.; Wang, J.; Zheng, M.; Guo, P.; Zhang, Y.; Ren, Y.; Liu, J.; Huang, W. Effect of stress-relief annealing on anodic dissolution behaviour of additive manufactured Ti-6Al-4V via laser solid forming. Corros. Sci. 2019, 153, 314–326. [Google Scholar] [CrossRef]
- Fojt, J.; Fousova, M.; Jablonska, E.; Joska, L.; Hybasek, V.; Pruchova, E.; Vojtech, D.; Ruml, T. Corrosion behaviour and cell interaction of Ti-6Al-4V alloy prepared by two techniques of 3D printing. Mater. Sci. Eng. C 2018, 93, 911–920. [Google Scholar] [CrossRef]
- Harun, W.S.W.; Manam, N.S.; Kamariah, M.S.I.N.; Sharif, S.; Zulkifly, A.H.; Ahmad, I.; Miura, H. A review of powdered additive manufacturing techniques for Ti-6al-4v biomedical applications. Powder Technol. 2018, 331, 74–97. [Google Scholar] [CrossRef]
- Wysocki, B.; Idaszek, J.; Buhagiar, J.; Szlazak, K.; Brynk, T.; Kurzydlowski, K.J.; Swieszkowski, W. The influence of chemical polishing of titanium scaffolds on their mechanical strength and in-vitro cell response. Mater. Sci. Eng. C Mater. Biol. Appl. 2019, 95, 428–439. [Google Scholar] [CrossRef]
- Sutter, E.M.M.; Goetz-Grandmont, G.J. The behaviour of titanium in nitric-hydrofluoric acid solutions. Corros. Sci. 1990, 30, 461–476. [Google Scholar] [CrossRef]
- Wysocki, B.; Idaszek, J.; Szlazak, K.; Strzelczyk, K.; Brynk, T.; Kurzydlowski, K.J.; Swieszkowski, W. Post Processing and Biological Evaluation of the Titanium Scaffolds for Bone Tissue Engineering. Materials 2016, 9, 197. [Google Scholar] [CrossRef]
- Pourbaix, M. Atlas of Electrochemical Equilibria in Aqueous Solutions, 2nd ed.; NACE: Houston, TX, USA, 1974; p. 644. [Google Scholar]
- Milošev, I.; Kosec, T.; Strehblow, H.H. XPS and EIS study of the passive film formed on orthopaedic Ti–6Al–7Nb alloy in Hank’s physiological solution. Electrochim. Acta 2008, 53, 3547–3558. [Google Scholar] [CrossRef]
- Milosev, I.; Metikos-Hukovic, M.; Strehblow, H.H. Passive film on orthopedic TiAlV alloy formed in physiological solution investigated by X-ray photoelectron spectroscopy. Biomaterials 2000, 21, 2103–2113. [Google Scholar] [CrossRef]
- Lasia, A. Electrochemical Impedance Spectroscopy and its Applications. In Modern Aspects of Electrochemistry; Conway, B.E., Bockris, J.O.M., White, R.E., Eds.; Springer: Boston, MA, USA, 2002; pp. 143–248. [Google Scholar]
- Orazem, M.E.; Tribollet, B. Electrochemical Impedance Spectroscopy; John Wiley & Sons: Hoboken, NJ, USA, 2008; p. 523. [Google Scholar]
- Lewis, G.; Vejerla, R.; Mishra, S. One equivalent electrical circuit is applicable to model the interface between the passive surface layer on an orthopaedic alloy and a biosimulating aqueous solution. Bio-Med. Mater. Eng. 2007, 17, 97–108. [Google Scholar]
- Robin, A.; Meirelis, J.P. Influence of fluoride concentration and pH on corrosion behavior of titanium in artificial saliva. J. Appl. Electrochem. 2007, 37, 511–517. [Google Scholar] [CrossRef]
- Zhang, L.; Duan, Y.; Gao, R.; Yang, J.; Wei, K.; Tang, D.; Fu, T. The Effect of Potential on Surface Characteristic and Corrosion Resistance of Anodic Oxide Film Formed on Commercial Pure Titanium at the Potentiodynamic-Aging Mode. Materials 2019, 12, 370. [Google Scholar] [CrossRef] [PubMed] [Green Version]
- Fojt, J.; Joska, L.; Málek, J. Corrosion behaviour of porous Ti–39Nb alloy for biomedical applications. Corros. Sci. 2013, 71, 78–83. [Google Scholar] [CrossRef]
- Jüttner, K. Electrochemical impedance spectroscopy (EIS) of corrosion processes on inhomogeneous surfaces. Electrochim. Acta 1990, 35, 1501–1508. [Google Scholar] [CrossRef]
- Zhou, X.; Mohanty, P. Corrosion behaviour of cold sprayed titanium coatings in simulated body fluid. Corros. Eng. Sci. Technol. 2012, 47, 145–154. [Google Scholar] [CrossRef]
- Garsivaz jazi, M.R.; Golozar, M.A.; Raeissi, K.; Fazel, M. Surface Characteristics and Electrochemical Impedance Investigation of Spark-Anodized Ti-6Al-4V Alloy. J. Mater. Eng. Perform. 2014, 23, 1270–1278. [Google Scholar] [CrossRef]
- Li, J.; Lin, X.; Guo, P.; Song, M.; Huang, W. Electrochemical behaviour of laser solid formed Ti–6Al–4V alloy in a highly concentrated NaCl solution. Corros. Sci. 2018, 142, 161–174. [Google Scholar] [CrossRef]
- Fojt, J.; Kacenka, Z.; Jablonska, E.; Hybasek, V.; Pruchova, E. Influence of the surface etching on the corrosion behaviour of a three-dimensional printed Ti-6Al-4V alloy. Mater. Corros. 2020, 71, 1691–1696. [Google Scholar] [CrossRef]
Figure 1.
3D printed specimens used for corrosion measurement: (a) compact surface, (c) detail of the compact surface, (b) trabecular specimen and (d) single trabecula beam detail.
Figure 1.
3D printed specimens used for corrosion measurement: (a) compact surface, (c) detail of the compact surface, (b) trabecular specimen and (d) single trabecula beam detail.
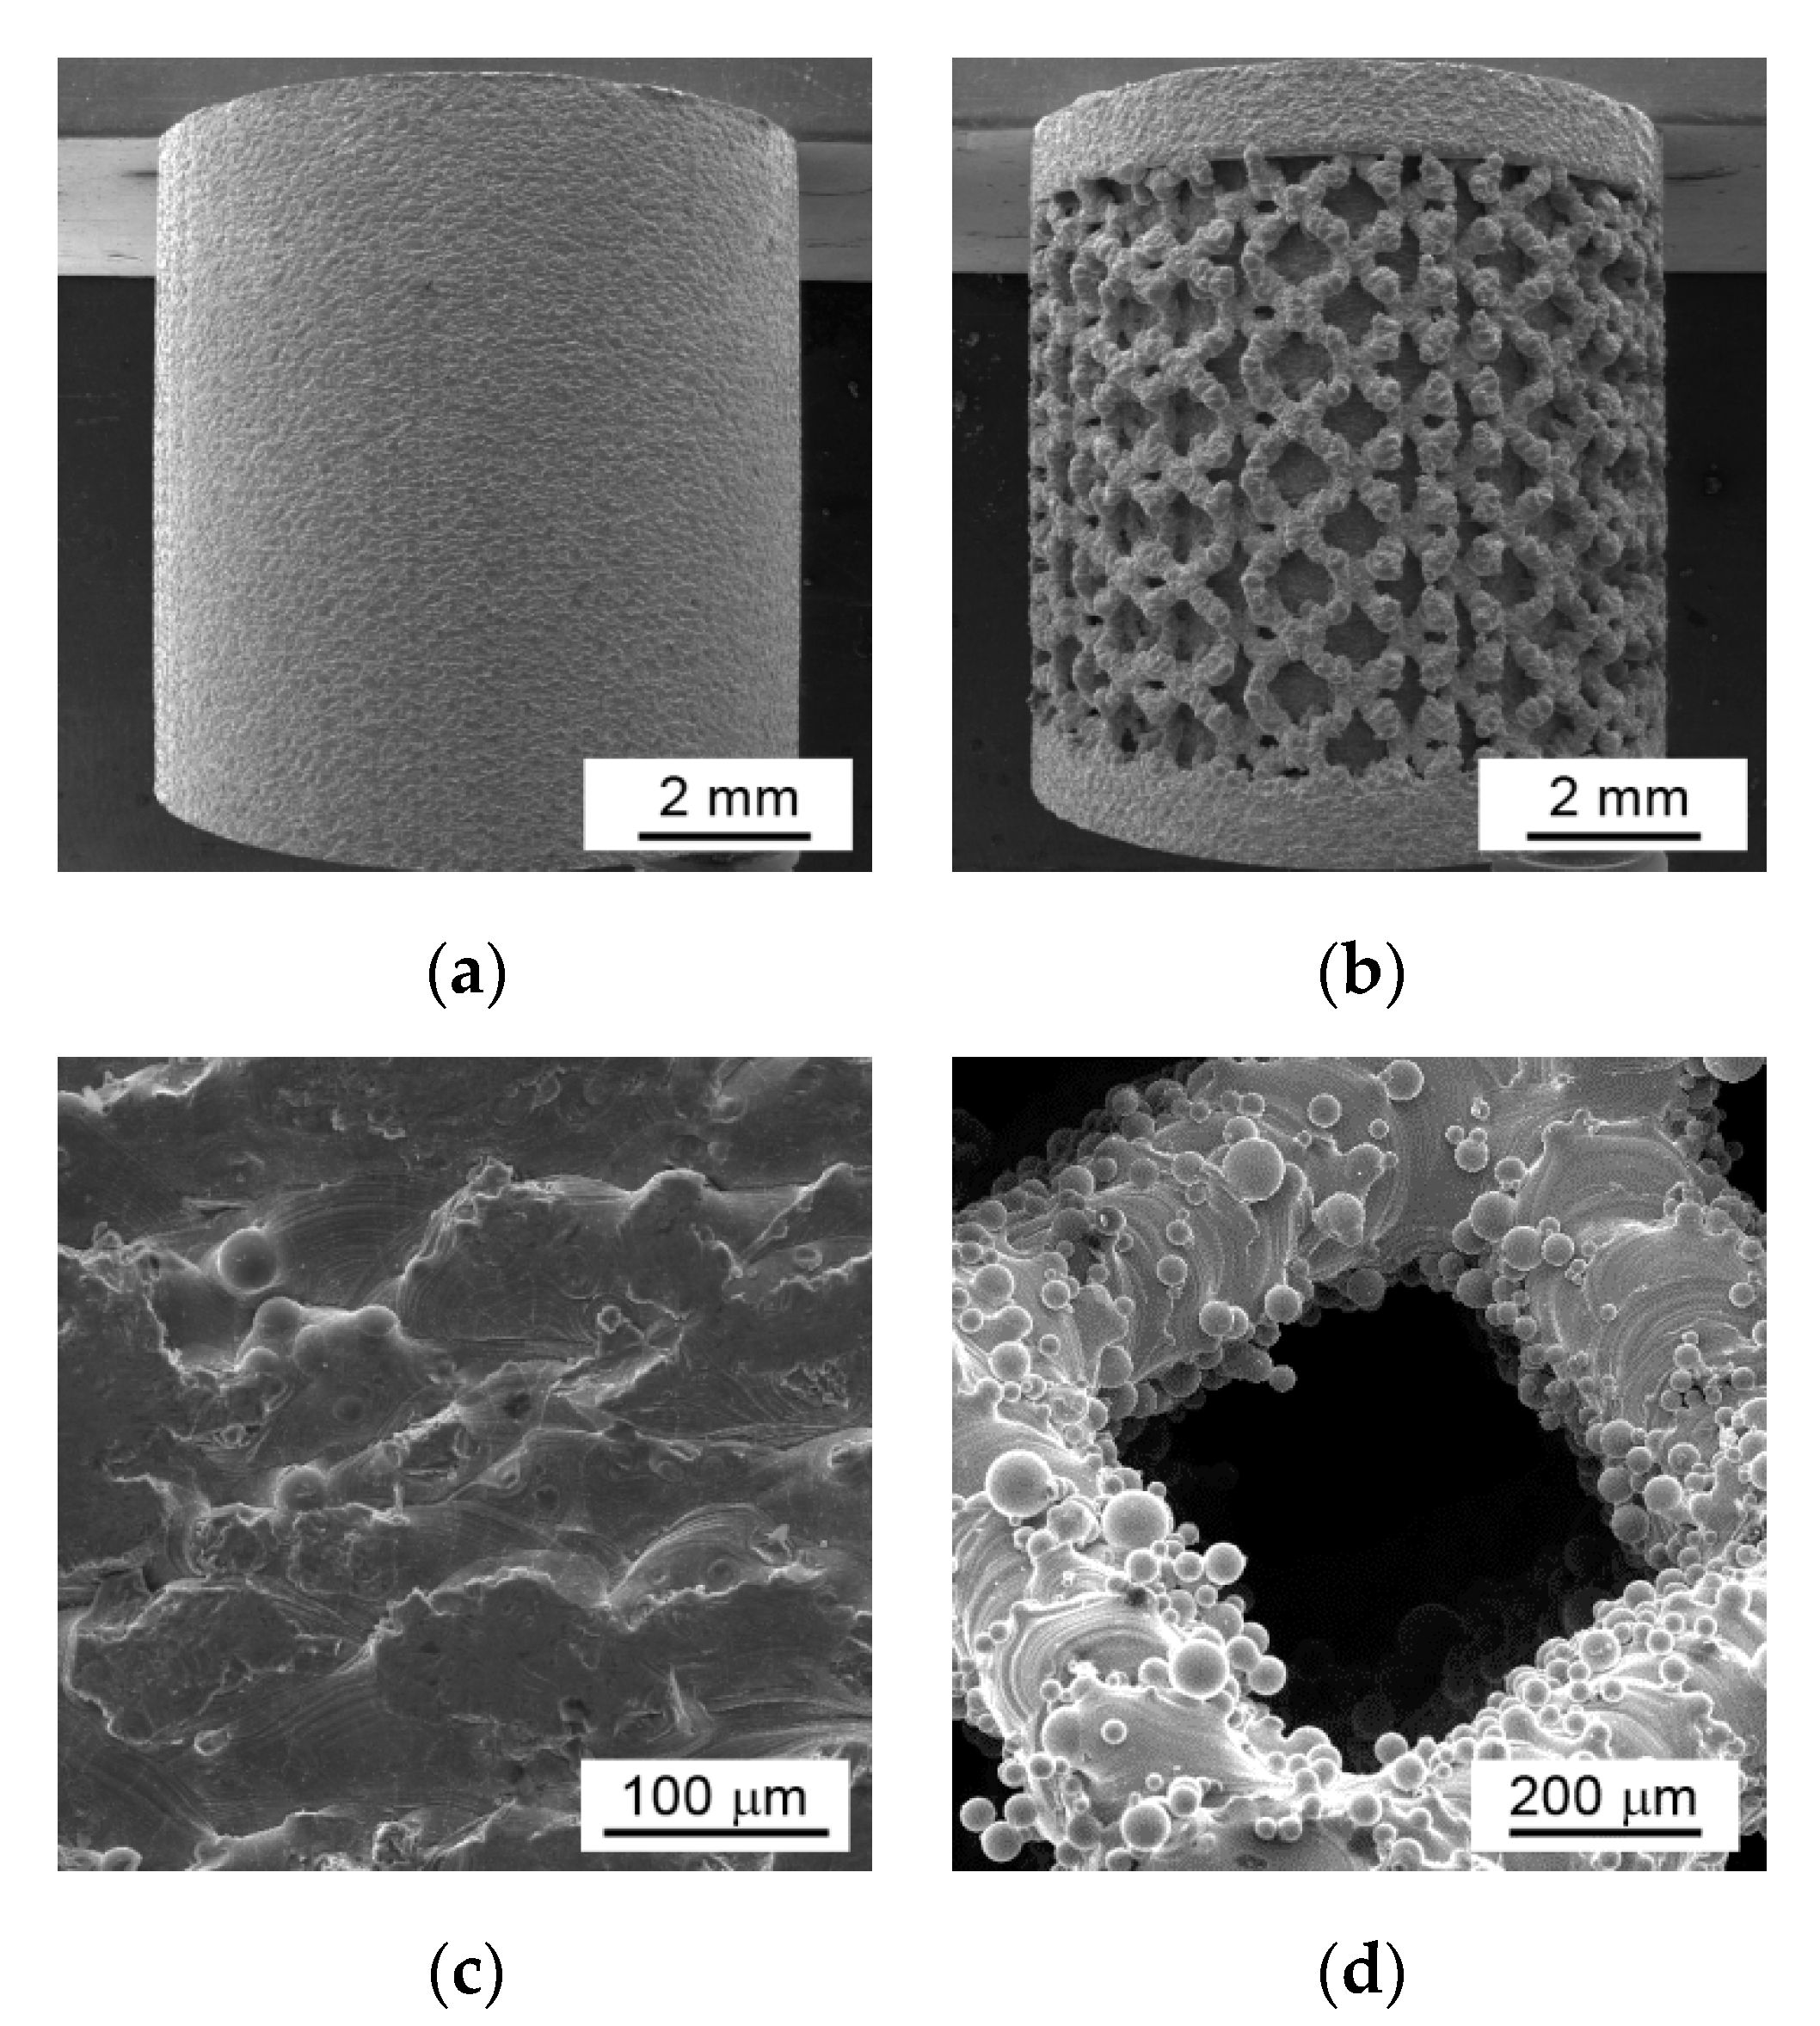
Figure 2.
Specimens after 6 min etching in acids mixture: (a,b) compact surface (plain and side view), (c) trabecula beams.
Figure 2.
Specimens after 6 min etching in acids mixture: (a,b) compact surface (plain and side view), (c) trabecula beams.

Figure 3.
The open-circuit potential of specimens in physiological solution: (a) surfaces without anodization, (b) anodized surfaces.
Figure 3.
The open-circuit potential of specimens in physiological solution: (a) surfaces without anodization, (b) anodized surfaces.
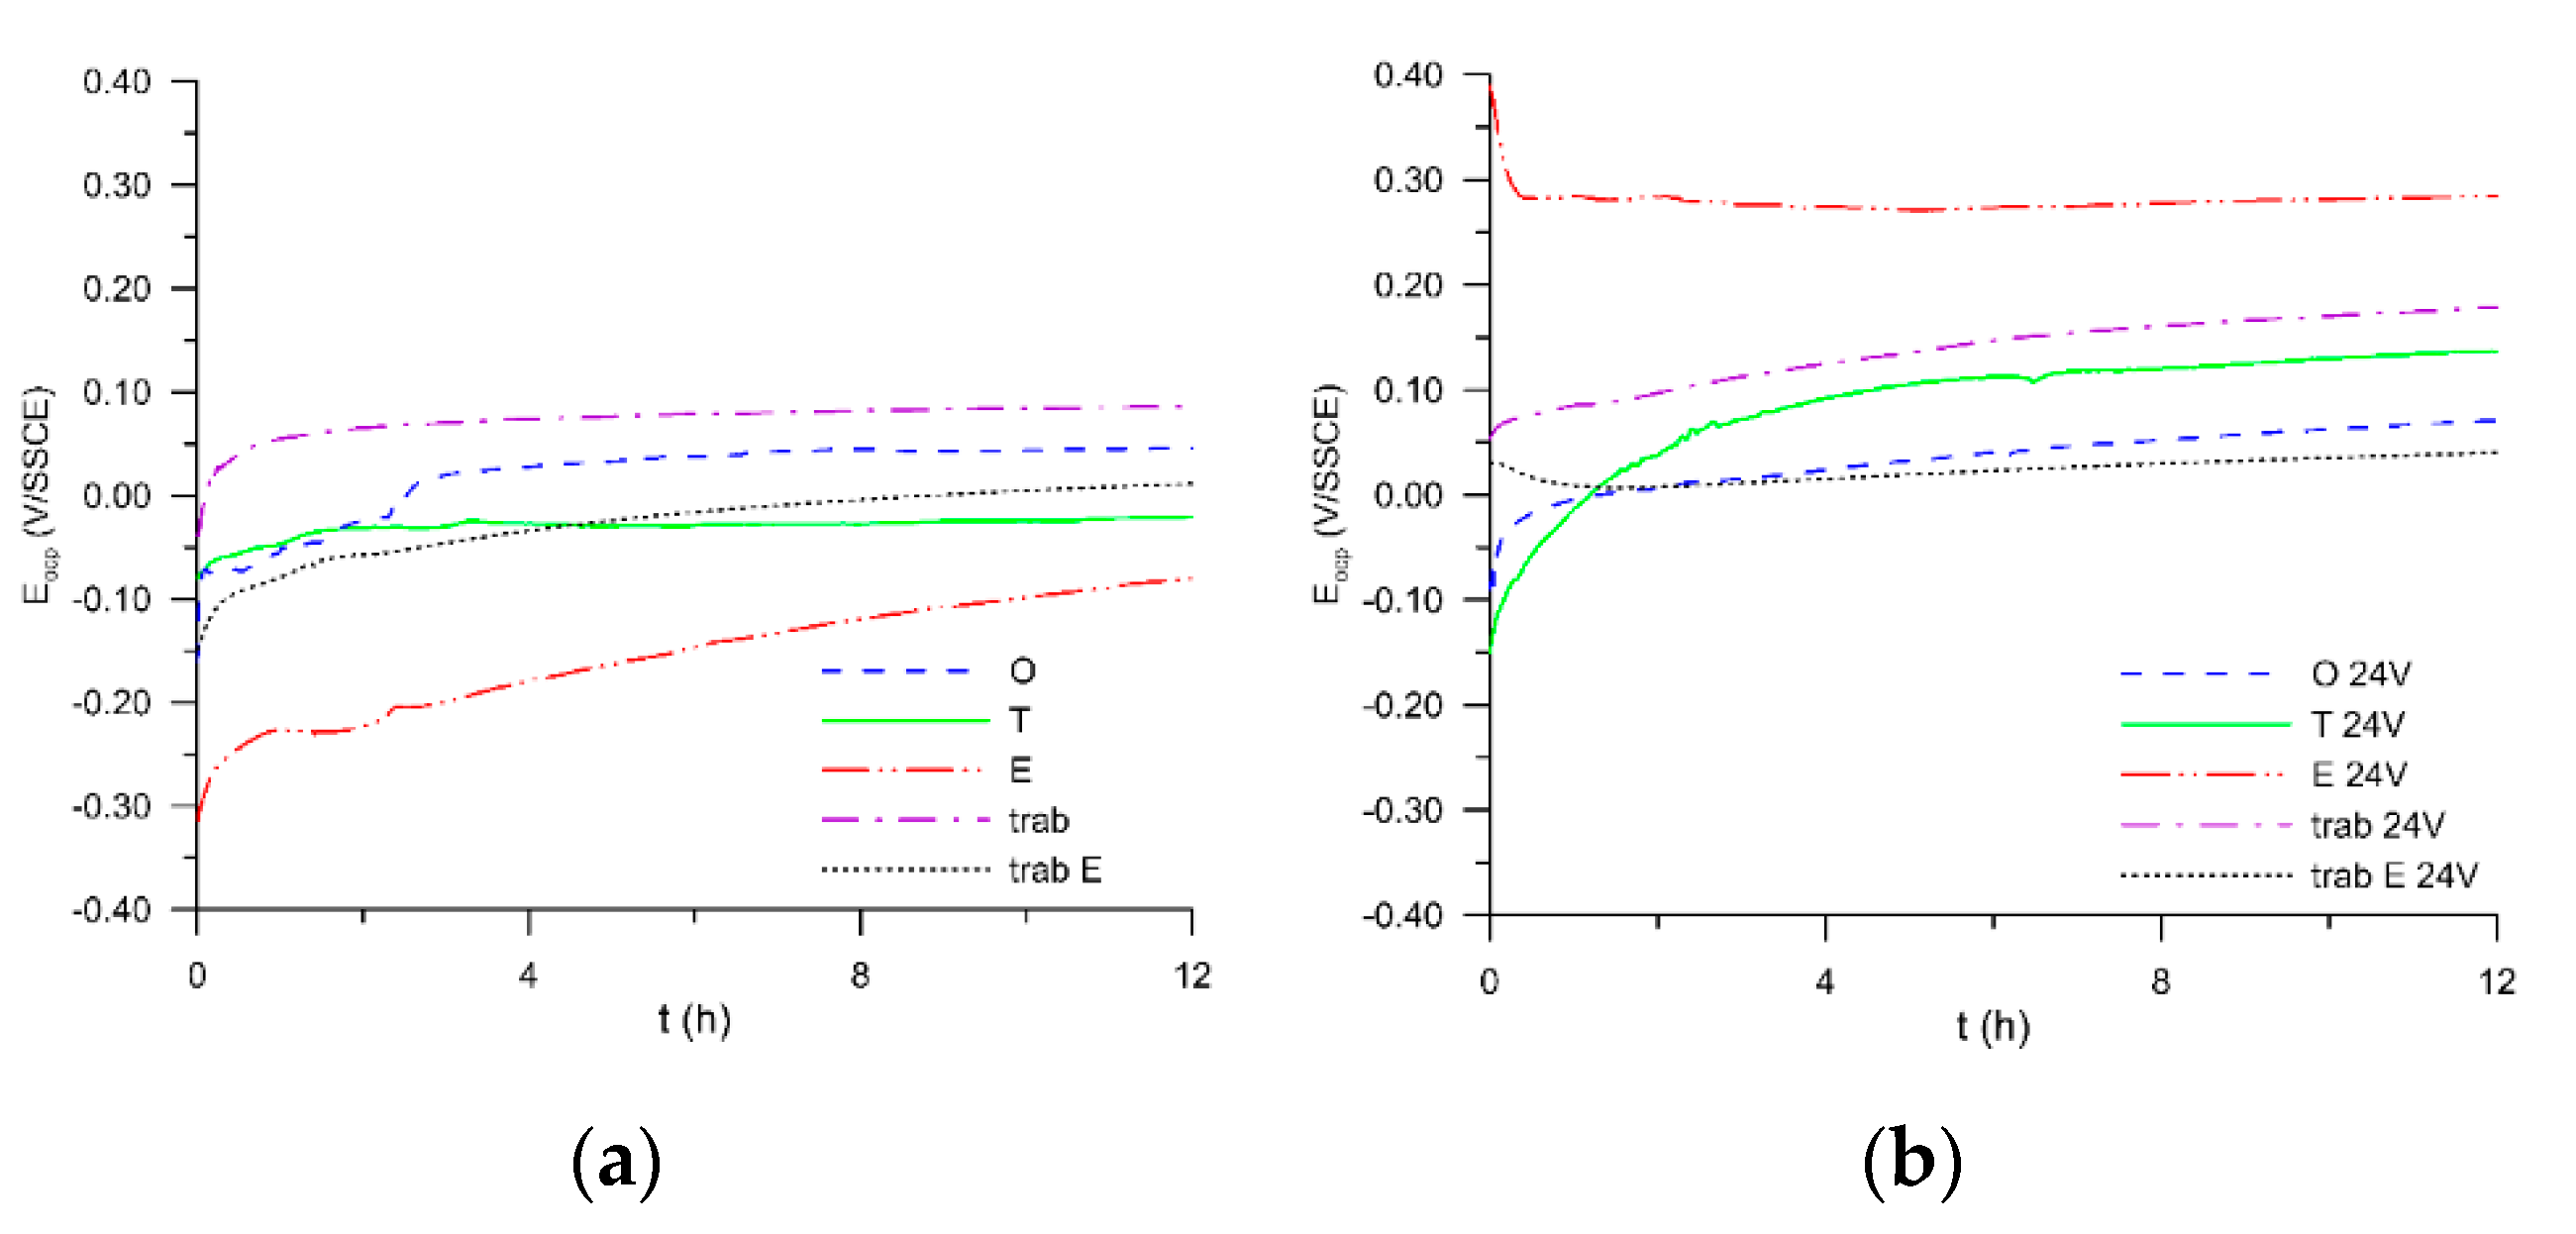
Figure 4.
The electrochemical impedance spectra of specimens after 12 h in physiological solution (symbols—data, line—fit): (a) surfaces without anodization, (b) anodized surfaces.
Figure 4.
The electrochemical impedance spectra of specimens after 12 h in physiological solution (symbols—data, line—fit): (a) surfaces without anodization, (b) anodized surfaces.
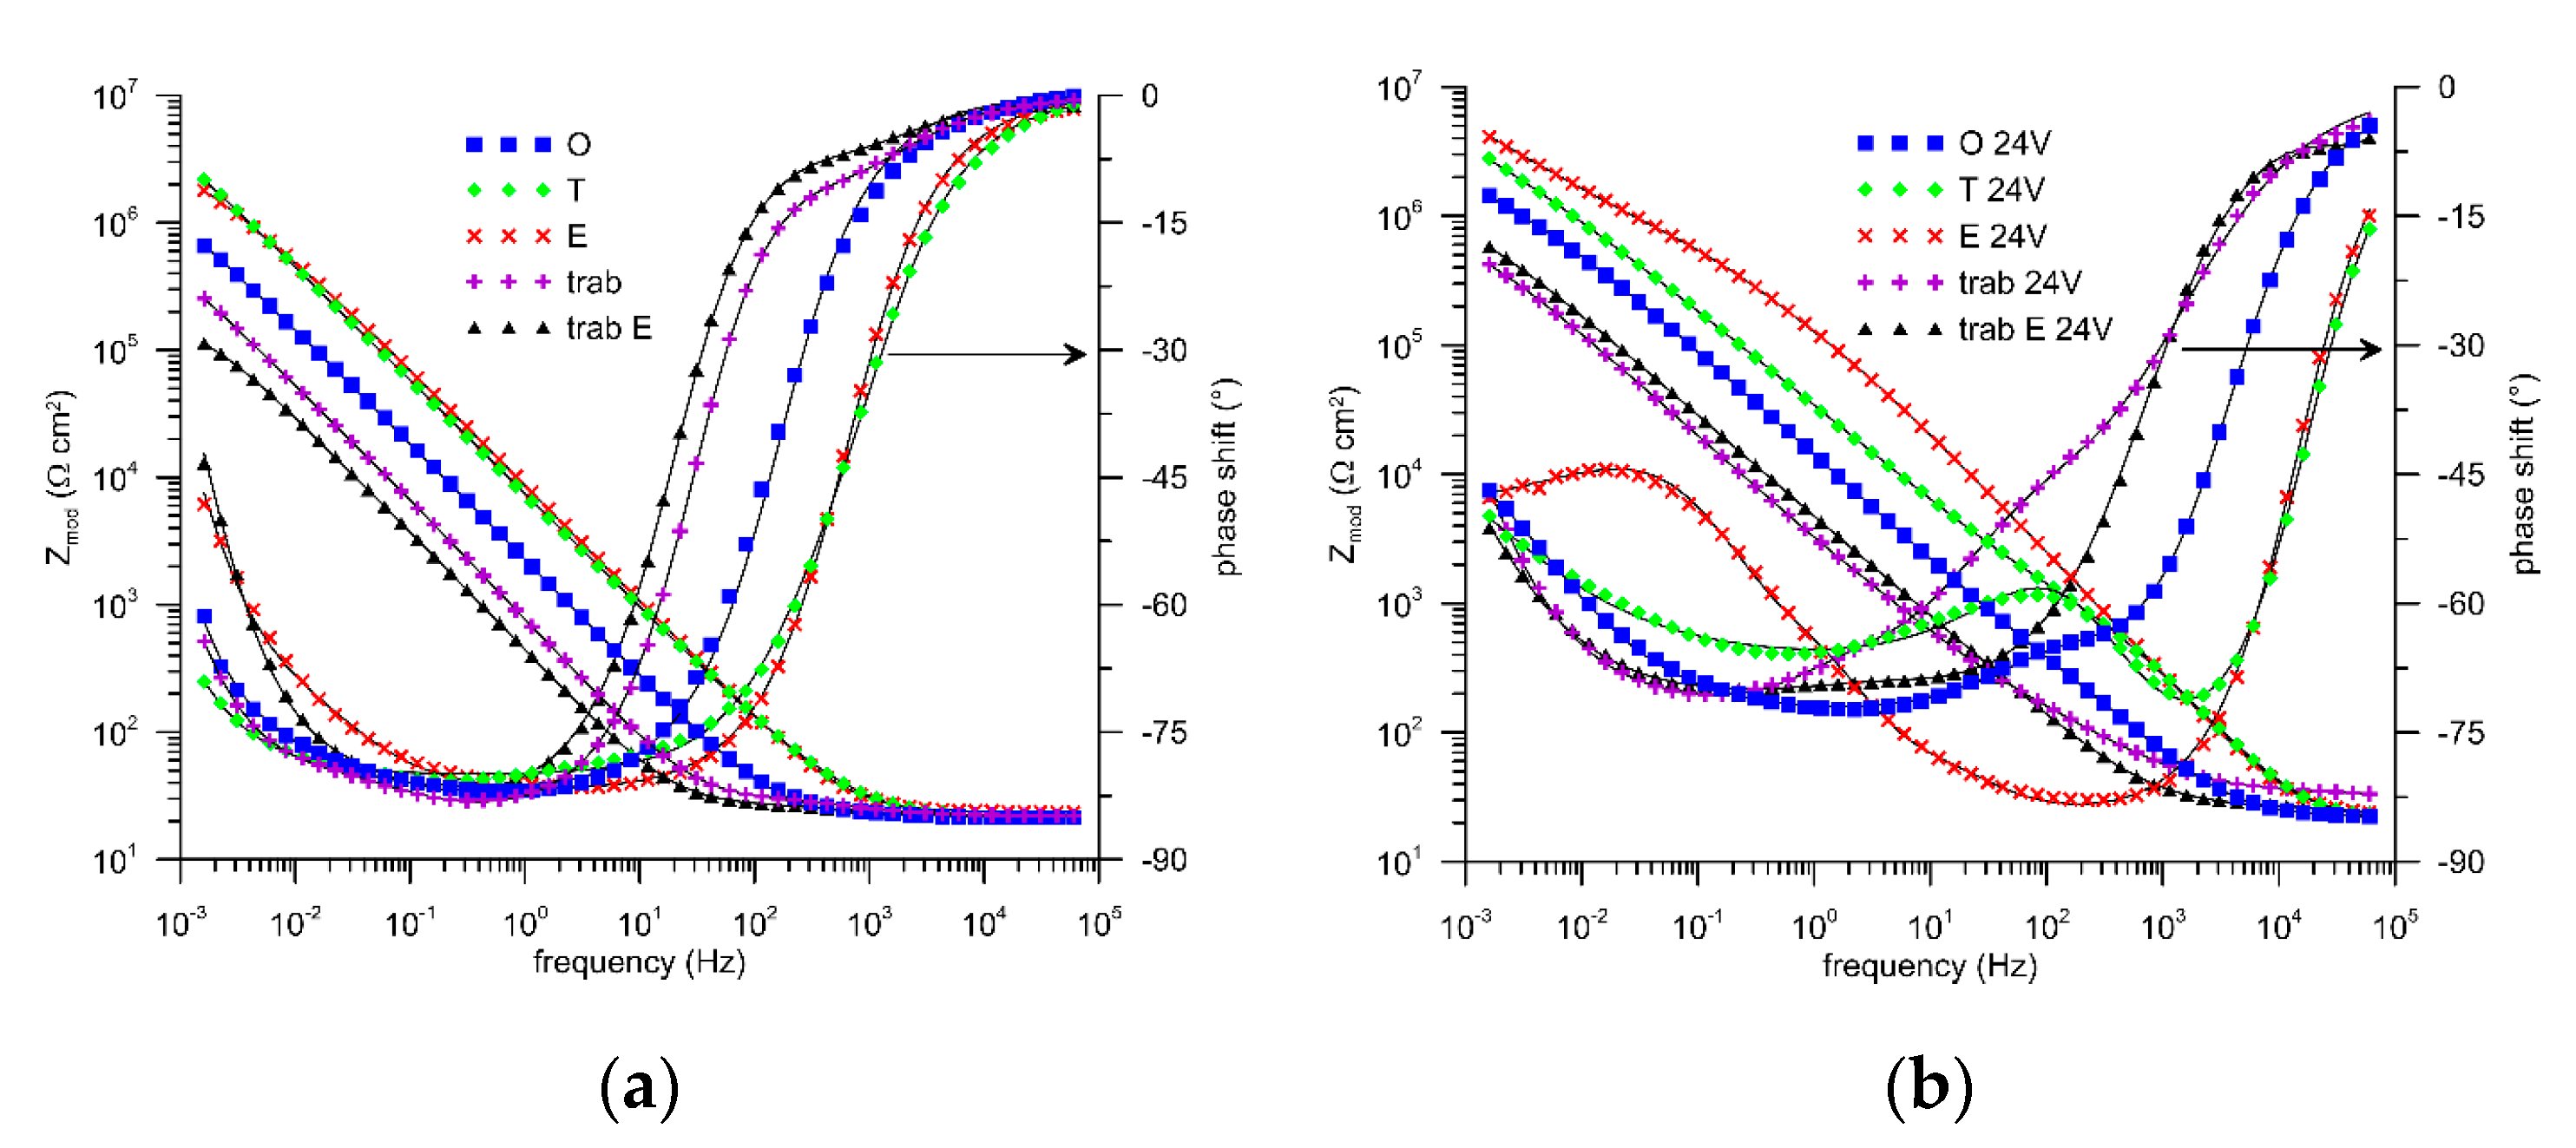
Figure 5.
Equivalent circuits used for impedance spectra evaluation: (a) equivalent circuit for porous surface, (b) equivalent circuit for porous surface with diffusion element, (c) equivalent circuit for porous surface with surface inhomogeneity, (d) equivalent circuit for porous surface with surface inhomogeneity and diffusion. R = resistance, CPE = constant phase element.
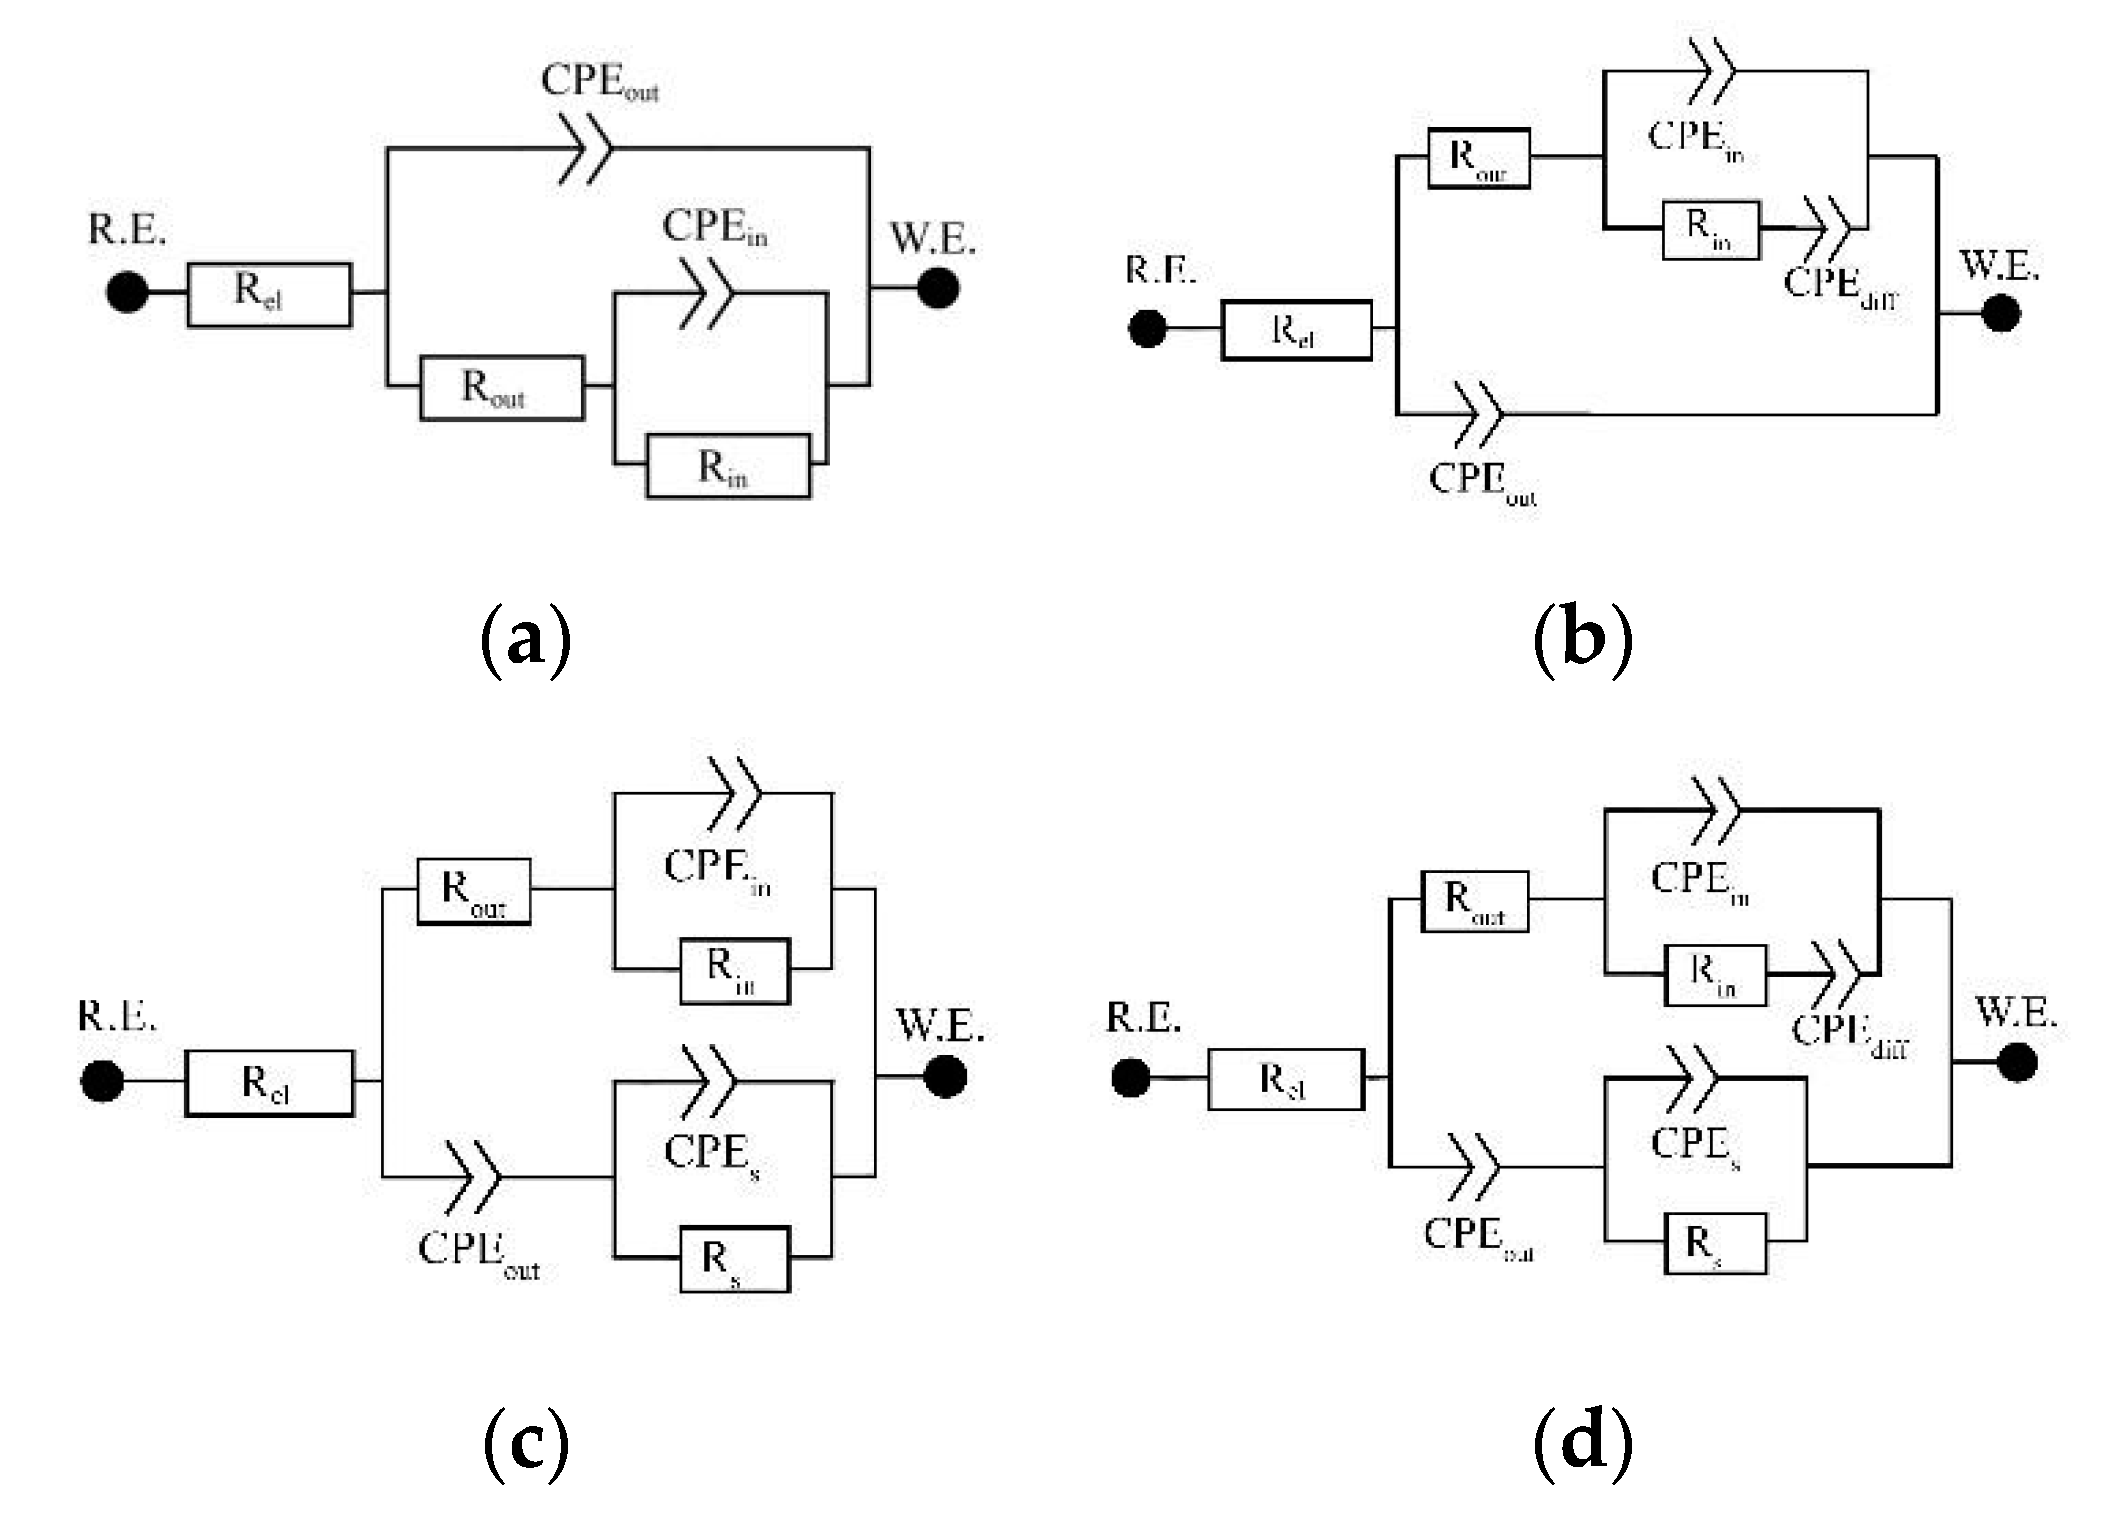
Figure 6.
The potentiodynamic curves of specimens in physiological solution: (a) surfaces without anodization, (b) anodized surfaces.
Figure 6.
The potentiodynamic curves of specimens in physiological solution: (a) surfaces without anodization, (b) anodized surfaces.
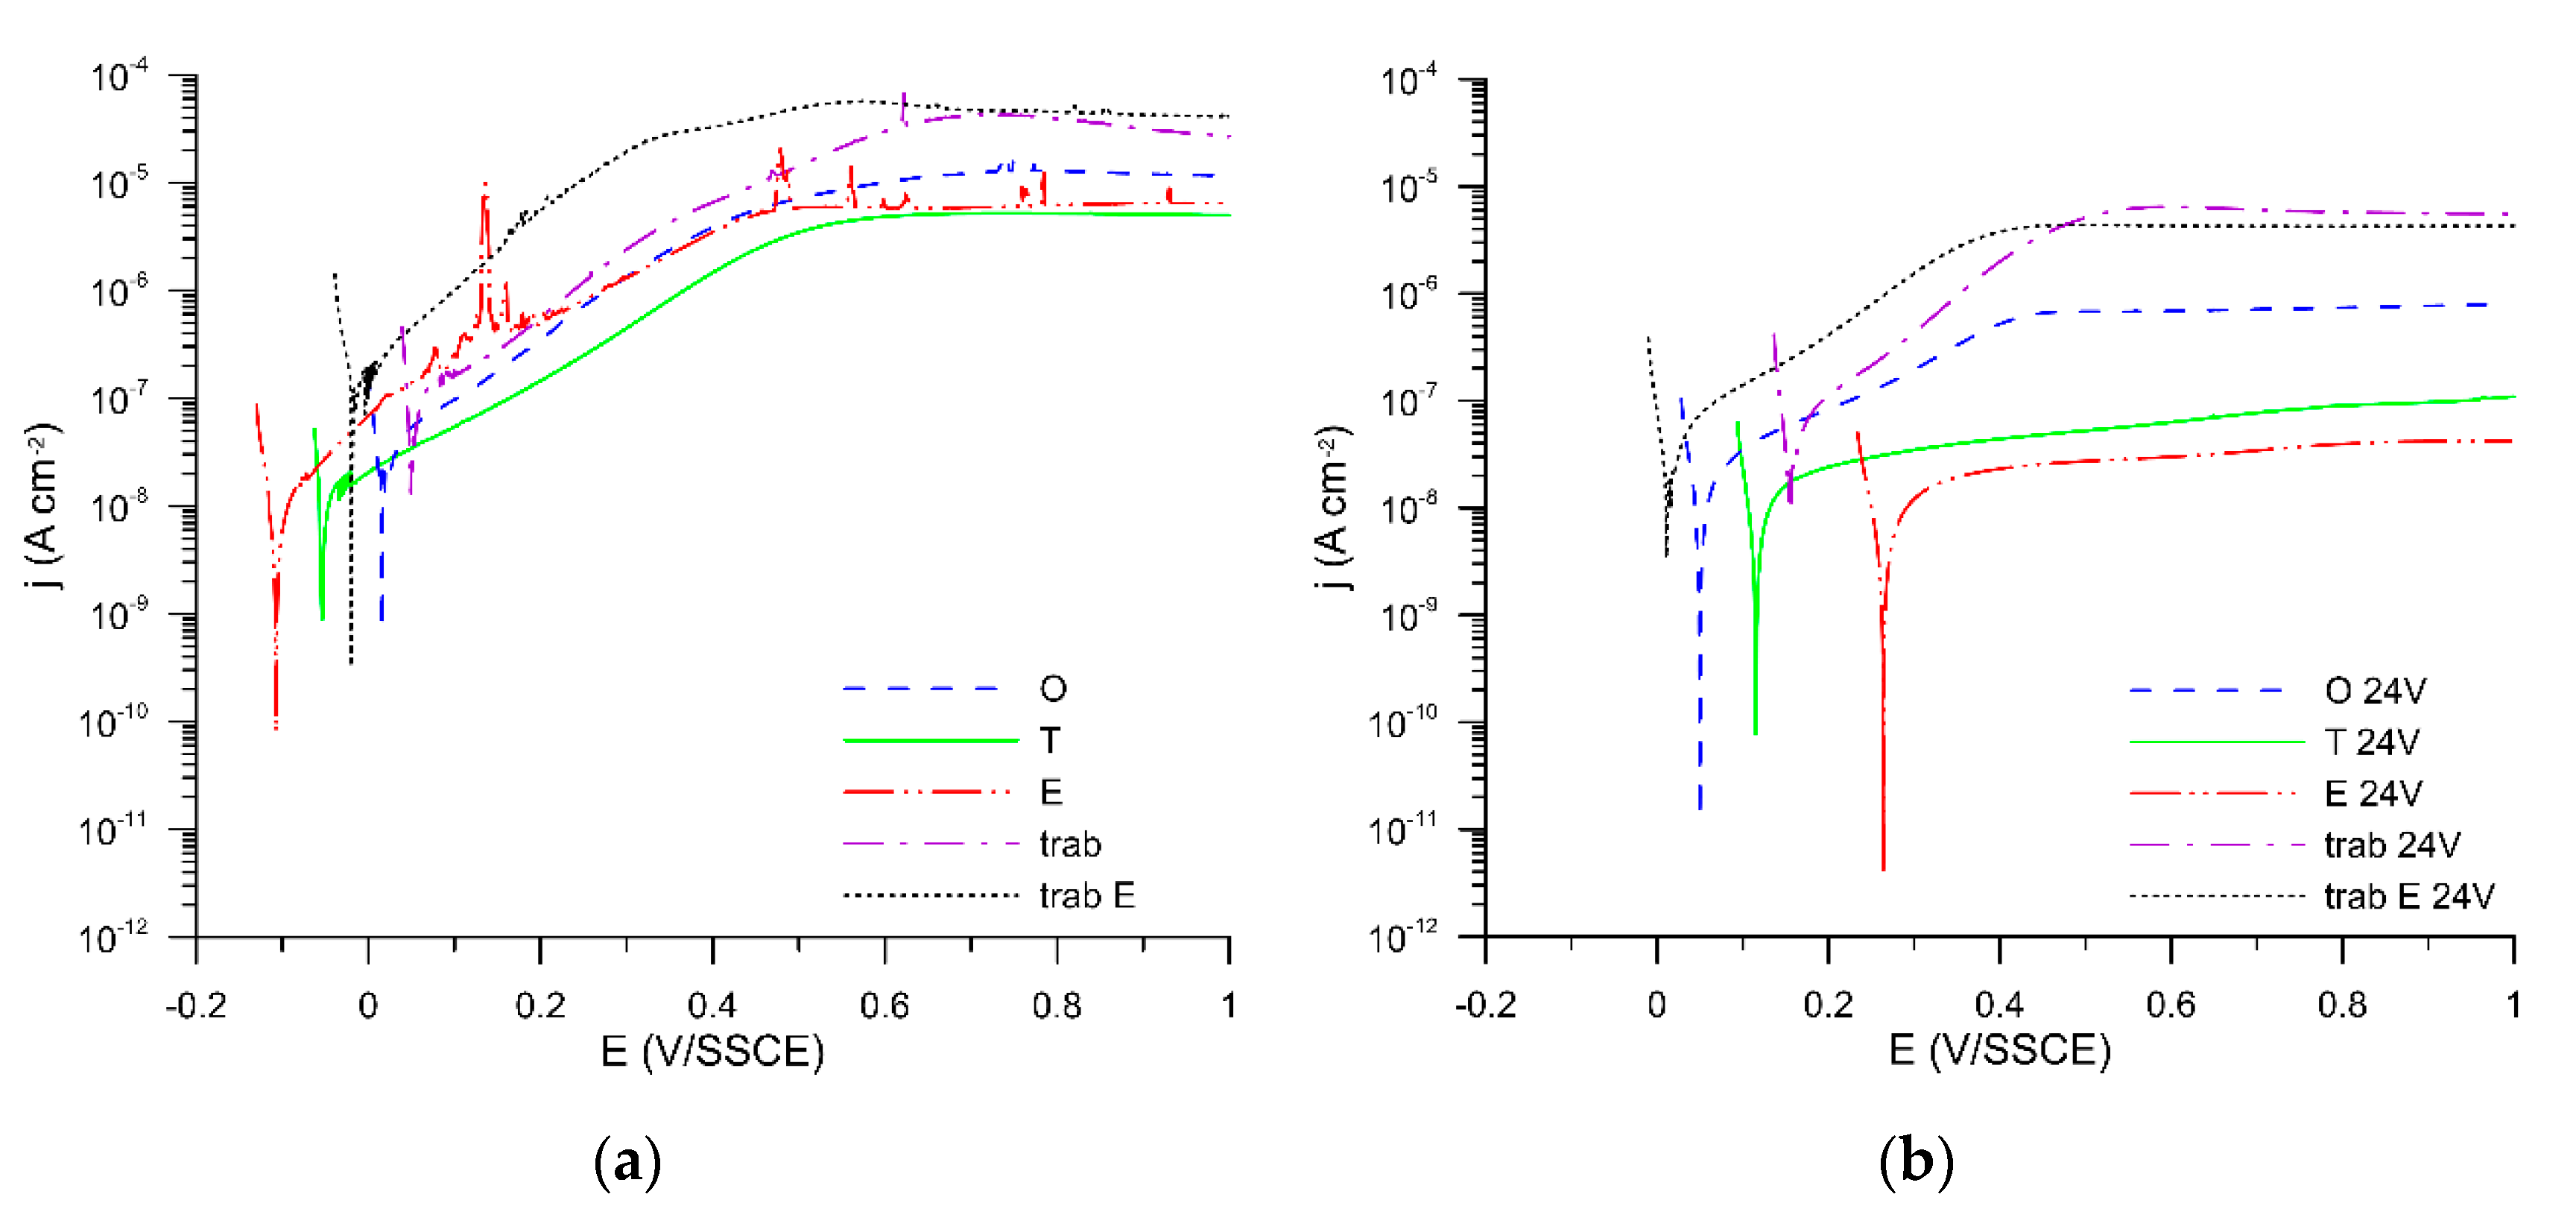
Figure 7.
The potentiostatic curves at 850 mV/SSCE measured according to ASTM F746 of specimens in physiological solution: (a) surfaces without anodization, (b) anodized surfaces.
Figure 7.
The potentiostatic curves at 850 mV/SSCE measured according to ASTM F746 of specimens in physiological solution: (a) surfaces without anodization, (b) anodized surfaces.

Table 1.
Impedance spectra evaluation according to the used equivalent circuit (EC).
| Specimen | EC | Rel | Rout | Rin | Rs | CPEout | αout | CPEin | αin | CPEs | αs | CPEdiff | αdiff | Goodness |
|---|---|---|---|---|---|---|---|---|---|---|---|---|---|---|
| (Ω cm2) | (Ω cm2) | (Ω cm2) | (Ω cm2) | (S sα cm−2) | (S sα cm−2) | (S sα cm−2) | (S sα cm−2) | of Fit | ||||||
| original | A | 21.9 | 7.77 × 10⁵ | 1.18 × 10⁶ | - | 4.64 × 10⁻⁵ | 0.999 | 8.32 × 10⁻⁵ | 0.910 | - | - | - | - | 8 × 10⁻⁴ |
| turned | A | 21.6 | 226.4 | 1.12 × 10⁷ | - | 2.12 × 10⁻⁵ | 0.893 | 4.84 × 10⁻⁶ | 0.878 | - | - | - | - | 2 × 10⁻⁴ |
| etched | A | 23.6 | 1.08 × 10⁶ | 2.24 × 10⁶ | - | 2.16 × 10⁻⁵ | 0.912 | 9.57 × 10⁻⁶ | 0.825 | - | - | - | - | 1 × 10⁻⁴ |
| original + 24 V | B | 22.0 | 714.4 | 1.54 × 10⁶ | - | 7.73 × 10⁻⁶ | 0.869 | 8.42 × 10⁻⁶ | 0.745 | - | - | 6.36 × 10⁻⁶ | 0.474 | 4 × 10⁻⁵ |
| turned + 24 V | B | 21.1 | 1.44 × 10³ | 4.76 × 10⁶ | - | 9.56 × 10⁻⁷ | 0.934 | 6.68 × 10⁻⁶ | 0.705 | - | - | 1.64 × 10⁻⁶ | 0.404 | 2 × 10⁻⁴ |
| trabecular | C | 22.0 | 1.03 × 10⁵ | 7.31 × 10⁵ | 7.6 | 2.29 × 10⁻⁴ | 0.945 | 3.23 × 10⁻⁵ | 0.792 | 1.58 × 10⁻⁴ | 0.813 | - | - | 1 × 10⁻⁵ |
| trabecular etched | C | 21.4 | 7.90 × 10⁴ | 8.85 × 10⁴ | 5.3 | 4.09 × 10⁻⁴ | 0.932 | 1.09 × 10⁻⁴ | 0.924 | 2.89 × 10⁻⁴ | 0.775 | - | - | 4 × 10⁻⁵ |
| trabecular + 24 V | C | 32.9 | 2.45 × 10⁴ | 9.12 × 10⁵ | 105.8 | 6.72 × 10⁻⁵ | 0.792 | 5.48 × 10⁻⁶ | 0.952 | 1.44 × 10⁻⁴ | 0.661 | - | - | 6 × 10⁻⁵ |
| etched 24 V | D | 22.6 | 2.16 × 10⁵ | 4.05 × 10⁵ | 1.29 × 10³ | 1.00 × 10⁻⁶ | 0.945 | 1.09 × 10⁻⁶ | 0.900 | 8.28 × 10⁻⁶ | 0.960 | 2.89 × 10⁻⁶ | 0.542 | 1 × 10⁻⁴ |
| trabecular etched 24 V | D | 22.1 | 1.40 × 10⁴ | 1.26 × 10⁶ | 3.8 | 4.38 × 10⁻⁵ | 0.803 | 6.67 × 10⁻⁶ | 0.718 | 9.52 × 10⁻⁷ | 1.000 | 3.13 × 10⁻⁵ | 0.487 | 5 × 10⁻⁵ |
Table 2.
Potentiodynamic curves evaluation.
| Specimen | Anodic Slope (mV/dec) | jcor (A/cm2) | jpas (A/cm2) |
|---|---|---|---|
| original | 199 | 3.05 × 10⁻⁸ | 1.3 × 10⁻⁵ |
| original + 24 V | 286 | 2.50 × 10⁻⁸ | 7.4 × 10⁻⁷ |
| turned | 246 | 1.30 × 10⁻⁸ | 5.3 × 10⁻⁶ |
| turned + 24 V | 1273 | 1.50 × 10⁻⁸ | 1.0 × 10⁻⁷ |
| etched | 243 | 3.05 × 10⁻⁸ | 6.6 × 10⁻⁶ |
| etched + 24 V | 2024 | 2.00 × 10⁻⁸ | 4.2 × 10⁻⁸ |
| trabecular | 220 | 9.70 × 10⁻⁸ | 2.9 × 10⁻⁵ |
| trabecular + 24 V | 177 | 6.50 × 10⁻⁸ | 5.8 × 10⁻⁶ |
| trabecular etched | 138 | 1.55 × 10⁻⁷ | 4.3 × 10⁻⁵ |
| trabecular etched + 24 V | 219 | 5.50 × 10⁻⁸ | 4.3 × 10⁻⁶ |
Publisher’s Note: MDPI stays neutral with regard to jurisdictional claims in published maps and institutional affiliations. |
© 2020 by the authors. Licensee MDPI, Basel, Switzerland. This article is an open access article distributed under the terms and conditions of the Creative Commons Attribution (CC BY) license (http://creativecommons.org/licenses/by/4.0/).
Share and Cite
MDPI and ACS Style
Fojt, J.; Hybášek, V.; Kačenka, Z.; Průchová, E. Influence of Surface Finishing on Corrosion Behaviour of 3D Printed TiAlV Alloy. Metals 2020, 10, 1547. https://doi.org/10.3390/met10111547
AMA Style
Fojt J, Hybášek V, Kačenka Z, Průchová E. Influence of Surface Finishing on Corrosion Behaviour of 3D Printed TiAlV Alloy. Metals. 2020; 10(11):1547. https://doi.org/10.3390/met10111547
Chicago/Turabian StyleFojt, Jaroslav, Vojtěch Hybášek, Zdeněk Kačenka, and Eva Průchová. 2020. "Influence of Surface Finishing on Corrosion Behaviour of 3D Printed TiAlV Alloy" Metals 10, no. 11: 1547. https://doi.org/10.3390/met10111547
Note that from the first issue of 2016, this journal uses article numbers instead of page numbers. See further details here.