Molecular Dynamics Study on the Impact of Cu Clusters at the BCC-Fe Grain Boundary on the Tensile Properties of Crystal

Key Laboratory of Ministry of Education for Modern Metallurgical Technology, College of Metallurgy and Energy, North China University of Science and Technology, Tangshan 063210, China
*
Author to whom correspondence should be addressed.
Metals 2020, 10(11), 1533; https://doi.org/10.3390/met10111533
Submission received: 4 October 2020
/
Revised: 6 November 2020
/
Accepted: 13 November 2020
/
Published: 18 November 2020
Abstract
:The molecular dynamics (MD) method was used to simulate and calculate the segregation energy and cohesive energy of Cu atoms at the Σ3{111}(110) and Σ3{112}(110) grain boundaries, and the tensile properties of the BCC-Fe crystal, with the grain boundaries containing coherent Cu clusters of different sizes (a diameter of 10 Å, 15 Å and 20 Å). The results showed that Cu atoms will spontaneously segregate towards the grain boundaries and tend to exist in the form of large-sized, low-density Cu clusters at the grain boundaries. When Cu cluster exists at the Σ3{111}(110) grain boundary, the increase in the size of the Cu cluster leads to an increase in the probability of vacancy formation inside the Cu cluster during the tensile process, weakening the breaking strength of the crystal. When the Cu cluster exists at the Σ3{112}(110) grain boundary, the Cu cluster with a diameter of 10 Å will reduce the strain hardening strength of the crystal, but the plastic deformation ability of the crystal will not be affected, and the existence of Cu clusters with a diameter of 15 Å and 20 Å will suppress the structural phase transformation of the crystal, and significantly decrease the plastic deformation ability of the crystal, thereby resulting in embrittlement of the crystal.
1. Introduction
In recent years, the nuclear industry has achieved significant progress and development thanks to the growth of nuclear energy and its increasing proportion in energy. The steel for the pressure vessels in pressurized water reactor (PWR) nuclear power plants is an important structural material in the nuclear industry, and its usability and safety are critical to the normal operation of the nuclear power plants. Therefore, its application life and safety performance are subjects of wide concerned [1,2,3,4]. These steels often contain solute atoms or impurity atoms such as Cr, Ni, Zr, Ta, P, He, and Cu, which will produce segregation and induce radiation embrittlement under irradiation, seriously affecting the service life and safety of the pressure vessels in PWR nuclear power plants [5,6,7,8]. Abundant studies [9,10] have shown that grain boundaries will reduce the total energy of the system by interacting with other lattice defects, such as solute atoms or impurity atoms, leading to the segregation and clusters of these atoms at the grain boundaries, changing the local structure of grain boundaries, and thereby severely weakening the plasticity and strength of the material. Therefore, understanding the interaction between solute atoms or impurity atoms and grain boundaries is vital for the design of better nuclear engineering materials. Samaras et al. [11] studied the interaction between He atoms and grain boundaries in BCC-Fe crystal through molecular dynamics (MD) method, and found that He atoms will accumulate He bubbles at the grain boundaries, resulting in a significant reduction in crystal strength and embrittlement of the crystal. By pre-storing Cr clusters and He bubbles at the Σ19{331}, Σ9{221}, Σ3{111}, Σ3{112}, Σ11{113} and Σ9{114} grain boundaries of BCC-Fe, Terentyev et al. [12] explored the influence of Cr clusters and He bubbles at the grain boundaries on the tensile properties of the crystal. They discovered that Cr clusters and He bubbles at the grain boundaries will weaken the strength and plasticity of the crystal, and He bubbles have a stronger effect on weakening crystal plasticity than Cr clusters. Solanki and Lejcek et al. [13,14] investigated the segregation law of P element in BCC-Fe material under irradiation and its influence on material properties, and reported that the P element in the material will produce segregation at grain boundaries under irradiation, causing serious embrittlement of the material. After injecting He into the BCC-Fe crystal and tempering at 700 K for 1 h, Wang et al. [15] used transmission electron microscopy (TEM) to characterize the distribution of He atoms in the crystal. The results showed that the proportion of He atoms at the grain boundaries is 35.29%, much higher than the proportion at other positions in the crystal. Hu et al. [16] calculated the segregation energy of Cr, Ni, Zr and Ta at the Σ3{111}(110) grain boundaries in BCC-Fe, and the grain boundary energy when these elements are contained at the grain boundary through the first-principles method. The calculation results demonstrated that the segregation energy of these alloying elements at the grain boundaries is a negative value, and the presence of these alloying elements at the grain boundary will reduce the grain boundary energy compared with the situation without these alloying elements, indicating that elements such as Cr, Ni, Zr and Ta will segregate towards the grain boundaries spontaneously.
Cu element is an important component of the material of pressure vessels in PWR nuclear power plants, but the impact of Cu segregation and clusters at grain boundaries on the tensile properties of the material has not been extensively studied. Therefore, considering the current research status, this work aims to analyze the interaction between the Cu element and the grain boundaries in BCC-Fe through the MD method, so as to lay a certain theoretical foundation for experimental research. Firstly, by calculating the segregation energy and the cohesive energy of Cu atoms, the impact of Σ3{111}(110) and Σ3{112}(110) symmetric tilt grain boundary on the existing form of Cu atoms in BCC-Fe crystal was explored. Then, the influence mechanism of Cu clusters of different sizes at the grain boundary on the tensile properties of the crystal was revealed by studying the microstructure of the BCC-Fe crystal and the evolution of point defects during the tensile process.
2. Simulation Method
This work firstly built the model of the BCC-Fe Σ3{111}(110) and Σ3{112}(110) symmetric tilt grain boundary using Atomsk [17] software based on the CSL theory (in the following content, the Σ symbol is omitted, and the type of grain boundaries is denoted by the index of crystal face {111} and {112}). As shown in Figure 1, the crystal orientation indexes at the X-axis, Y-axis and Z-axis of the constructed {111}/{112} grain boundary model are [10]/[0], [11]/[1] and [111]/[12] respectively. In the simulation process, a 69 Å × 69.49 Å × 140 Å simulation box containing 57,120 atoms was selected for the {111} and {112} grain boundary models. After that, the MD method was adopted for simulation, and the large-scale atomic/molecular massively parallel simulator (LAMMPS [18]) developed by the Sandia National Laboratory in the United States was used for simulation calculation. Finally, the simulation results were visualized by visualization software OVITO [19], and the common neighbor analysis and wigner-seitz defect analysis were used to analyze the microstructure and the evolution laws of point defects in the crystal during the simulated tensile process.
The influence of grain boundaries on the precipitation of clusters of Cu atoms was further illustrated through the grain boundary energy and the segregation energy of Cu atoms at the grain boundaries. The grain boundary energy () of {111} and {112} grain boundaries with and without vacancies was calculated by Formula (1) [16], and the segregation energy () of the Cu atoms at the grain boundaries was calculated by Formula (2) [16,20], where is the grain boundary energy, and denote the total potential energy of the system when the system contains grain boundaries and when X solute elements exist at the grain boundaries, respectively, and and respectively represent the total potential energy of the system when there are no grain boundaries and when X solute elements exist in the system. A is the grain boundary area (cross-sectional area of the XY plane). is the segregation energy of solute elements. Generally, the existence of the Cu atoms at the grain boundaries will make less than 0, indicating that Cu atoms have the thermodynamic driving force to segregate towards the grain boundaries. When is greater than 0, Cu atoms will not segregate towards grain boundaries [16,20].
By calculating the total potential energy of the system and the cohesive energy of Cu atoms, the existing form of the Cu atoms inside the crystal after the segregation to the grain boundary was described. The specific calculation steps are shown in Figure 2a–e. It can be seen that a total of five layers of atoms were selected from two upper layers and two lower layers of the central layer of the grain boundary, and 10% of the Fe atoms in this region were replaced with Cu atoms, and a total of 255 Cu atoms were obtained. Then, the size in the Z-axis direction was maintained unchanged, while the size in the X and Y-axis was reduced successively (by 5 Å each time) to narrow the region, and 255 Fe atoms were replaced with Cu atoms simultaneously, so that despite the reduction in the volume of the region, the number of Cu atoms in the region is unchanged, and the Cu atoms become more closely arranged as the region narrows. The total potential energy of the system and the cohesive energy of Cu atoms after each change were calculated (cohesive energy: the total energy of Cu atoms divided by the number of Cu atoms). The smaller the total potential energy of the system, the more stable the existing form of the system. The lower the cohesive energy of Cu atoms, the more possible Cu atoms exist in this state from the perspective of thermodynamics.
The method used for simulated tensile process is similar to that in [21]. The Cu clusters with a diameter of 10, 15 and 20 Å, which are coherent with BCC-Fe were inserted at the center of the grain boundary to replace Fe atoms, so as to obtain the model required for tensile simulation. As shown in Figure 1, the model is divided into three parts in the Z direction. The upper and lower shaded parts in the figure were set as rigid fixed regions, and the middle part was set as a region where atoms can move freely with the change in potential energy between atoms. The normal force of the two crystal grains in the Z direction is produced by the relative displacement of the two rigid fixed regions along the Z axis. Therefore, the normal stress σzz in the Z direction can be obtained, σzz = Fz/Axy, where Fz is the total force on all atoms in the middle free atom region at the Z direction, and Axy is the cross-sectional area of the xy plane of the system. In order to clearly express the relationship between strain and stress, the displacement increment is set to 0.025 Å, and the strain rate is 1 × 10⁹ s−1. In the simulation, free boundary conditions were used in the Z-axis direction, and periodic boundary conditions were adopted in the X- and Y-axis direction. Therefore, the dimensions of the X- and Y-axis directions of the model will remain unchanged during the stretching process. Before the tensile simulation, the model was relaxed for 20 ps under the NPT ensemble to eliminate the internal stress of the initial model, and then the tensile simulation was conducted under the NVE ensemble. The simulated time step was 0.002 ps. In order to avoid the influence of atomic thermal motion on the tensile process, the simulated temperature was set to 10 K. The interaction potential function developed by Bonny et al. [22] was adopted. This potential function system, which can accurately describe the relationship between Cu atoms and defects in Fe-Cu alloy, has been frequently used to study the interaction between Cu precipitation and point defects and dislocation in the Fe-Cu alloy system in the past few years [3,23,24].
3. Results and Discussion
3.1. Segregation Energy and Cohesive Energy of Cu Atoms
In order to explore the influence of {111} and {112} grain boundaries on the segregation and precipitation of Cu atoms in the crystal, the segregation energy of Cu atoms at the grain boundaries, and the boundary energy. The calculation results of grain boundary energy of other workers are listed. As shown in Table 1, Where {111} Fe-Fe and {112} Fe-Fe represent {111} and {112} grain boundaries without vacancy, {111} Fe-V and {112} Fe-V represent {111} and {112} grain boundaries containing a vacancy. Based on the visible result of the calculation, the grain boundary energy obtained in this paper is close to that calculated by others, which proves the correctness of the selected parameters of the simulation calculation in this paper. It can also be seen from Table 1 that the segregation energy of Cu atoms at the grain boundaries is less than 0, demonstrating that the segregation of Cu atoms towards the {111} and {112} grain boundaries is spontaneous. Besides, when there is a vacancy defect at the grain boundary, both {111} and {112} grain boundary energy increase, and the segregation energy of Cu atoms is negative at this time, indicating that the existence of vacancy at the grain boundary will drive the Cu atoms inside the crystal to segregate towards grain boundary.
According to the above research, when there are {111} and {112} grain boundaries in the system, the Cu atoms inside the crystal will spontaneously segregate towards the grain boundaries, but it has not been determined whether Cu atoms exist in the form of dispersed distribution or in the form of low-density and large-sized clusters after the segregation to the grain boundaries. Therefore, the influence of the morphological change in Cu atoms at the grain boundaries on the total potential energy of the system and the cohesive energy of Cu atoms was studied with the {111} grain boundary as an example. The results are exhibited in Figure 3. It can be seen that with the decreased volume of the region where Cu atoms are located, the distance between Cu atoms is shortened, and the total potential energy of the system and the cohesive energy of Cu atoms gradually reduce, indicating that as Cu atoms are closely arranged, the whole system becomes more stable. This verified that Cu atoms will exist in the form of low-density and large-sized clusters at the grain boundaries. Xi et al. [26] also observed the existence of large-size Cu clusters phase at the grain boundary of Cu-bearing 316L austenitic stainless steel, due to the experimental means.
3.2. The Impact of the Size of Cu Clusters at {111} Grain Boundary on the Tensile Properties of Crystal
Figure 4 shows the stress-strain curves of {111} grain boundary with no Cu cluster and with Cu clusters of different sizes. It can be found that the stress–strain curve of the grain boundary without Cu clusters is consistent with the results obtained by Terentyev et al. [12], which verifies the rationality of the parameters used in tensile simulation in this paper. The Figure reveals that whether there are Cu clusters at the {111} grain boundary or not, the stress and strain are in a linear relationship, indicating that the crystal did not experience plastic deformation during the tensile process, and the Cu clusters at the {111} grain boundary only have an impact on the breaking strength of the crystal, that is, the breaking strength of the crystal weakens with the increased size of the Cu clusters. In order to clarify the mechanism of the influence of Cu clusters at the {111} grain boundary on the breaking strength of the crystal, the vacancy formation energy () at the grain boundary was calculated, as shown in Table 2, from which it can be known that whether the {111} grain boundary contains Cu clusters or not has no obvious effect on the of grain boundary (except for the region of Cu clusters). However, the inside the Cu clusters is significantly lower than that in other positions at the grain boundary, demonstrating that vacancy defects are more likely to occur inside the Cu clusters during the tensile process, leading to a decrease in the breaking strength of the crystal. The internal of the Cu clusters rises with the increasing size of the Cu clusters. The reason for this is that is as the size of the cluster phase expands, the cohesive energy of Cu atoms drops, contributing to a more stable structure of Cu clusters. This is in contradiction with the effect of the size of the cluster on the breaking strength of the crystal. The interior of the small-sized Cu cluster is lower than that of large-sized one, thus, theoretically, the small-sized Cu cluster should produce vacancy defects first in the tensile process, and exerts greater impact on the breaking strength of crystal. However, owing to the small size, the small-sized Cu cluster has a lower probability of vacancy generation inside the cluster than large-sized cluster. Therefore, the breaking strength of the crystal weakens as the size of the Cu cluster increases.
With {111} grain boundary without Cu cluster and with a 20 Å Cu cluster respectively as examples, the Wigner-Seitz point defect analysis method was used to analyze the evolution of vacancy defects inside the crystal during the tensile process, and to investigate how the vacancy defects inside the Cu clusters affect the breaking strength of grain boundary during the tensile process. It was found that without Cu cluster, there is no vacancy defect at the grain boundary from the beginning of tension to the fracture of the grain boundary, which is an ideal dissociation fracture. To facilitate the observation of the evolution of the vacancies inside the Cu clusters, the Cu clusters in the model were separately extracted, as shown in Figure 5c–f. It can be seen that when the strain reaches 8.6%, vacancies appear in the Cu cluster, and the number of vacancies inside the Cu cluster increases with the continuous rise in the strain. When the strain reaches 12.5%, the vacancies originally dispersed in the cluster will bond together to form hole defects, and the hole region expands with the increasing strain until the grain boundary breaks. As displayed in Figure 5b, coloring was performed according to the energy of the atoms in the crystal. It can be observed that the energy of the atoms around the hole defects is significantly higher than that at other positions in the crystal, indicating that the holes result in serious deformation of the surrounding lattice, leading to the increase in the energy of the atoms around the holes, and the poorer structural stability at the grain boundary. Therefore, the grain boundary with Cu clusters will break earlier than the grain boundary without a Cu cluster during the tensile process, so that the breaking strength will be reduced.
3.3. The Influence of the Size of Cu Clusters at {112} Grain Boundary on the Tensile Properties of Crystal
First, the tensile strain–stress curve of {112} grain boundary without a Cu cluster obtained by simulation was analyzed. As shown in Figure 6, this curve can be divided into three parts. The first part is the stage where the strain is 0–8.5%. It is an elastic deformation stage where the stress increases with the rising strain and there is a basically linear relationship between the strain and stress. The second part is the stage where the strain is 8.5–22.5%. It is a plastic deformation stage of the crystal where the stress will not increase with the increase in strain, and will fluctuate at around 17 GPa. The third part is the stage where the strain is 22.5–28.5%. It is a strain-hardening stage where the crystal recovers its ability to resist deformation, and the stress rises as the strain increases. Figure 7 shows the visual snapshots of the microstructure of the crystal during the tensile process of {112} grain boundary without a Cu cluster. As shown in Figure 7a, a column of atoms in the model are selected and the trajectories of these atoms are tracked during the tensile process. Figure 7b shows that at the stage where the strain is 0–8.5%, the atoms in the system do not move, and the crystal structure is BCC without structural phase transition. When the strain exceeds 8.5%, as shown in Figure 7c–e, the atoms at the grain boundary begin to slide to the right. At this time, the crystal structure at the grain boundary starts to transform from BCC to FCC, and a structural phase transition occurs. Then, as the strain continues to rise, the atoms inside the crystal that are far away from the grain boundary also begin to move to the right, leading to the expansion of the region where the phase transition of the crystal structure occurs. When the strain reaches 22.5%, the atoms inside the crystal all slip, except for the fixed atoms in the upper and lower layers. At this time, the crystal structure changes from BCC to FCC except for the fixed regions. After that, the strain continues to increase until the crystal breaks, the atoms inside the crystal no longer slip, the crystal structure no longer changes, and finally breaking occurs at the phase boundary between the FCC structure and the BCC structure in the fixed region. Li et al. also found a similar structural phase transition in the study on the tensile properties of tungsten {112} grain boundary [27]. As displayed in Figure 7f, in region a, where structural phase transformation has occurred, the atoms are arranged in a regular quadrilateral, and in region b, without structural phase transition, the atoms are arranged in a rhombus shape. If the atoms in the row where the arrow is located in the figure move 0.9 Å to the right, the structural phase transition will also occur in region b. It can be seen that when the strain reaches 8.5%, the interior of the crystal will resist the rising strain through atomic slipping, resulting in the increase in the strain and the fluctuation in the stress around 17 GPa. Therefore, the structural phase transition of the crystal caused by the sliding of atoms during the tensile process is the cause of the plastic deformation during the tensile process of {112} grain boundary.
It can be seen from the stress–strain curve in Figure 6, as the size of Cu clusters at the {112} grain boundary changes, the mechanism of crystal deformation and fracture will change. The presence of the Cu cluster with a diameter of 10 Å at the grain boundary will not cause plastic deformation of the crystal, but only affects the strain hardening strength of the crystal. The expansion of the size of the Cu cluster at the grain boundary will suppress the plastic deformation of the crystal. In order to further explain the influence of the Cu clusters at the {112} grain boundary on the tensile fracture mechanism of the crystal, the evolution law of the crystal structure containing Cu clusters at the grain boundary during the tensile process was analyzed in detail. By observing the tensile process of the crystal containing Cu cluster with a diameter of 10 Å at the grain boundary, it was found that its region where structural phase transition occurs during tensile process is the same as that in the crystal without a Cu cluster at the grain boundary. Therefore, only the reasons for the reduction in the strain-hardening strength were investigated. As shown in Figure 8b,c, when the crystal structure transforms from BCC to FCC, microcracks will first generate inside the Cu cluster during the strain-hardening stage. As the strain rises, the microcrack region gradually expands and forms a larger hole defect, leading to stress concentration at the position of Cu cluster, thus causing crystal fracture and weakening the strain-hardening strength. When the diameter of the Cu clusters is 15 and 20 Å, the region where the structural phase transition of the crystal occurs during the tensile process is much smaller than that in the crystal without Cu cluster, and the larger the size of the cluster, the smaller the region of structural phase transition. With the grain boundary containing Cu cluster with a diameter of 20Å as an example, the evolution law of its structure during the tensile process was analyzed. As shown in Figure 8e,f, the internal structure of the crystal has not been fully transformed from BCC to FCC. When the strain reaches 9%, microcracks appear inside the Cu clusters. With the increase in the strains, the crystal structure no longer produces phase transformation. When the strain reaches 10%, the microcrack region expands to form a hole defect, resulting in the fracture of the crystal.
4. Conclusions
(1) When {111} and {112} grain boundaries exist in BCC-Fe crystal, Cu atoms inside the crystal will spontaneously segregate towards the grain boundaries, and when there are vacancies at the grain boundaries, Cu atoms are more likely to segregate towards the grain boundaries. The Cu atoms at the grain boundaries tend to exist in the form of large-sized, low-density Cu clusters.
(2) The inside the Cu cluster at the {111} grain boundary is much smaller than that at other positions of the grain boundary. During the tensile process, vacancies will be formed inside the Cu cluster, leading to more serious lattice distortion, resulting in uneven stress distribution at the grain boundary and reducing the breaking strength of the crystal. The larger the size of the Cu cluster, the more obvious the weakening effect on crystal breaking strength.
(3) During the tensile process of {112} grain boundary, the internal atoms of the crystal will slip, triggering structural phase transition and plastic deformation. When there is a Cu cluster with a diameter of 10 Å at the grain boundary, the law of phase change in the crystal structure is consistent with that of the grain boundary without a Cu cluster, indicating that the existence of the Cu cluster only weakens the strain-hardening strength of the crystal, rather than the plastic deformation ability. The presence of the Cu clusters with a diameter of 15 and 20 Å will inhibit the structural phase transition of the crystal and reduce the plastic deformation ability of the crystal.
Author Contributions
To calculate the data and writing manuscript, H.Z.; the literature research, X.W.; data collation and summary, H.L. and C.L.; provide ideas, Y.L. All authors have read and agreed to the published version of the manuscript.
Funding
The investigated is financially supported by the National Natural Science Foundation of China (Project No. 51774142).
Conflicts of Interest
The authors declare no conflict of interest.
References
- Zinkle, S.J.; Busby, J.T. Structural materials for fission & fusion energy. Mater. Today 2009, 12, 12–19. [Google Scholar] [CrossRef]
- Yvon, P.; Le Flem, M.; Cabet, C.; Seran, J.L. Structural materials for next generation nuclear systems: Challenges and the path forward. Nucl. Eng. Des. 2015, 294, 161–169. [Google Scholar] [CrossRef]
- Du, Y.K.; He, X.F.; Jia, L.X. Study on the contribution mechanism of Cu precipitates to α-Fe irradiation hardening. Mater. Rep. 2018, 32, 307–312. [Google Scholar]
- Zhang, X.; Hattar, K.; Chen, Y.; Shao, L.; Li, J.; Sun, C.; Yu, K.; Li, N.; Taheri, M.L.; Wang, H.; et al. Radiation damage in nanostructured materials. Prog. Mater. Sci. 2018, 96, 217–321. [Google Scholar] [CrossRef]
- Graeme, A. Controlling Radiation Damage. Science 2010, 327, 1587–1588. [Google Scholar]
- Kuksenko, V.; Pareige, C. Intra granular precipitation and grain boundary segregation under neutron irradiation in a low purity Fe–Cr based alloy. J. Nucl. Mater. 2012, 425, 125–129. [Google Scholar] [CrossRef]
- Kilmametov, A.; Balogh, A.; Ghafari, M.; Gammer, C.; Mangler, C.; Rentenberger, C.; Valiev, R.; Hahn, H. Radiation effects in bulk nanocrystalline FeAl alloy. Radiat. Eff. Defects Solids 2012, 167, 631–639. [Google Scholar] [CrossRef]
- Demkowicz, M.J.; Hoagland, R.G.; Hirth, J.P. Interface Structure and Radiation Damage Resistance in Cu-Nb Multilayer Nanocomposites. Phys. Rev. Lett. 2008, 100, 136102. [Google Scholar] [CrossRef]
- Wang, J.; Madsen, G.K.H.; Drautz, R. Grain boundaries in bcc-Fe: A density-functional theory and tight-binding study. Model. Simul. Mater. Sci. Eng. 2018, 26, 025008. [Google Scholar] [CrossRef]
- Lidiard, A.B. The migration of phosphorus in ferritic iron alloys under irradiation. Philos. Mag. A 1999, 79, 1493–1499. [Google Scholar]
- Samaras, M. Multiscale Modelling: The role of helium in iron. Mater. Today 2009, 12, 46–53. [Google Scholar] [CrossRef]
- Terentyev, D.; He, X. Effect of Cr precipitates and He bubbles on the strength of <110> tilt grain boundaries in BCC Fe: An atomistic study. Comput. Mater. Sci. 2011, 50, 925–933. [Google Scholar] [CrossRef]
- Solanki, K.N.; Tschopp, M.A.; Bhatia, M.A.; Rhodes, N.R. Atomistic Investigation of the Role of Grain Boundary Structure on Hydrogen Segregation and Embrittlement in α-Fe. Metall. Mater. Trans. A 2013, 44, 1365–1375. [Google Scholar]
- Lejček, P.; Všianská, M.; Šob, M. Recent trends and open questions in grain boundary segregation. J. Mater. Res. 2018, 33, 2647–2660. [Google Scholar] [CrossRef]
- Wang, J.; Gao, X.; Gao, N.; Wang, Z.; Cui, M.; Wei, K.; Yao, C.; Sun, J.R.; Li, B.; Zhu, Y.; et al. Grain size effects on He bubbles distribution and evolution. J. Nucl. Mater. 2015, 457, 182–185. [Google Scholar] [CrossRef]
- Wang, W.Y.; Wang, Y.; Wang, W.Y.; Darling, K.A.; Kecskes, L.J.; Liu, Z.-K. Solute effects on the Σ3 111[11-0] tilt grain boundary in BCC Fe: Grain boundary segregation, stability, and embrittlement. Comput. Mater. Sci. 2020, 171, 109271. [Google Scholar] [CrossRef]
- Hirel, P. Atomsk: A tool for manipulating and converting atomic data files. Comput. Phys. Commun. 2015, 197, 212–219. [Google Scholar] [CrossRef]
- Plimpton, S. Fast Parallel Algorithms for Short-Range Molecular Dynamics. J. Comput. Phys. 1995, 117, 1–19. [Google Scholar] [CrossRef] [Green Version]
- Stukowski, A. Visualization and analysis of atomistic simulation data with OVITO–the Open Visualization Tool. Model. Simul. Mater. Sci. Eng. 2009, 18, 015012. [Google Scholar] [CrossRef]
- Jin, H.; Elfimov, I.; Militzer, M. Study of the interaction of solutes with Σ5 (013) tilt grain boundaries in iron using density-functional theory. J. Appl. Phys. 2014, 115, 093506. [Google Scholar]
- Terentyev, D.; He, X. Dimensionality of interstitial He migration in <110> tilt grain boundaries in α-Fe. Comput. Mater. Sci. 2010, 49, 858–864. [Google Scholar] [CrossRef]
- Bonny, G.; Pasianot, R.C.; Castin, N.; Malerba, L. Ternary Fe–Cu–Ni many-body potential to model reactor pressure vessel steels: First validation by simulated thermal annealing. Philos. Mag. 2009, 89, 3531–3546. [Google Scholar] [CrossRef]
- Zheng, Z.X.; Zhang, L. Atomic scale calculation of structure change of Fe-Cu binary system containing Cu cluster in Fe matrix during heating. Acta Phys. Sin. 2017, 66, 282–292. [Google Scholar]
- Zhu, L.S. Molecular Dynamics Simulation Study on Early Precipitation Behavior of Fe-Cu-Ni Alloy Medium-rich Cu Clusters. Master’s Thesis, Shanghai University, Shanghai, China, 2014. [Google Scholar]
- Azeem, M.M.; Wang, Q.; Zhang, Y.; Liu, S.; Zubair, M. Effect of Grain Boundary on Diffusion of P in Alpha-Fe: A Molecular Dynamics Study. Front. Phys. 2019, 7, 97. [Google Scholar] [CrossRef] [Green Version]
- Xi, T.; Shahzad, M.B.; Xu, D.; Zhao, J.; Yang, C.; Qi, M.; Yang, K. Copper precipitation behavior and mechanical properties of Cu-bearing 316L austenitic stainless steel: A comprehensive cross-correlation study. Mater. Sci. Eng. A 2016, 675, 243–252. [Google Scholar] [CrossRef]
- Li, F.B.; Gao, N.; Li, Y.P. Molecular dynamics study of the effect of he on the tensile properties of W Σ3{112} symmetric grain boundaries. J. Mater. Heat Treat. 2019, 40, 96–104. [Google Scholar]
Figure 1.
Schematic diagram of tensile simulation model.
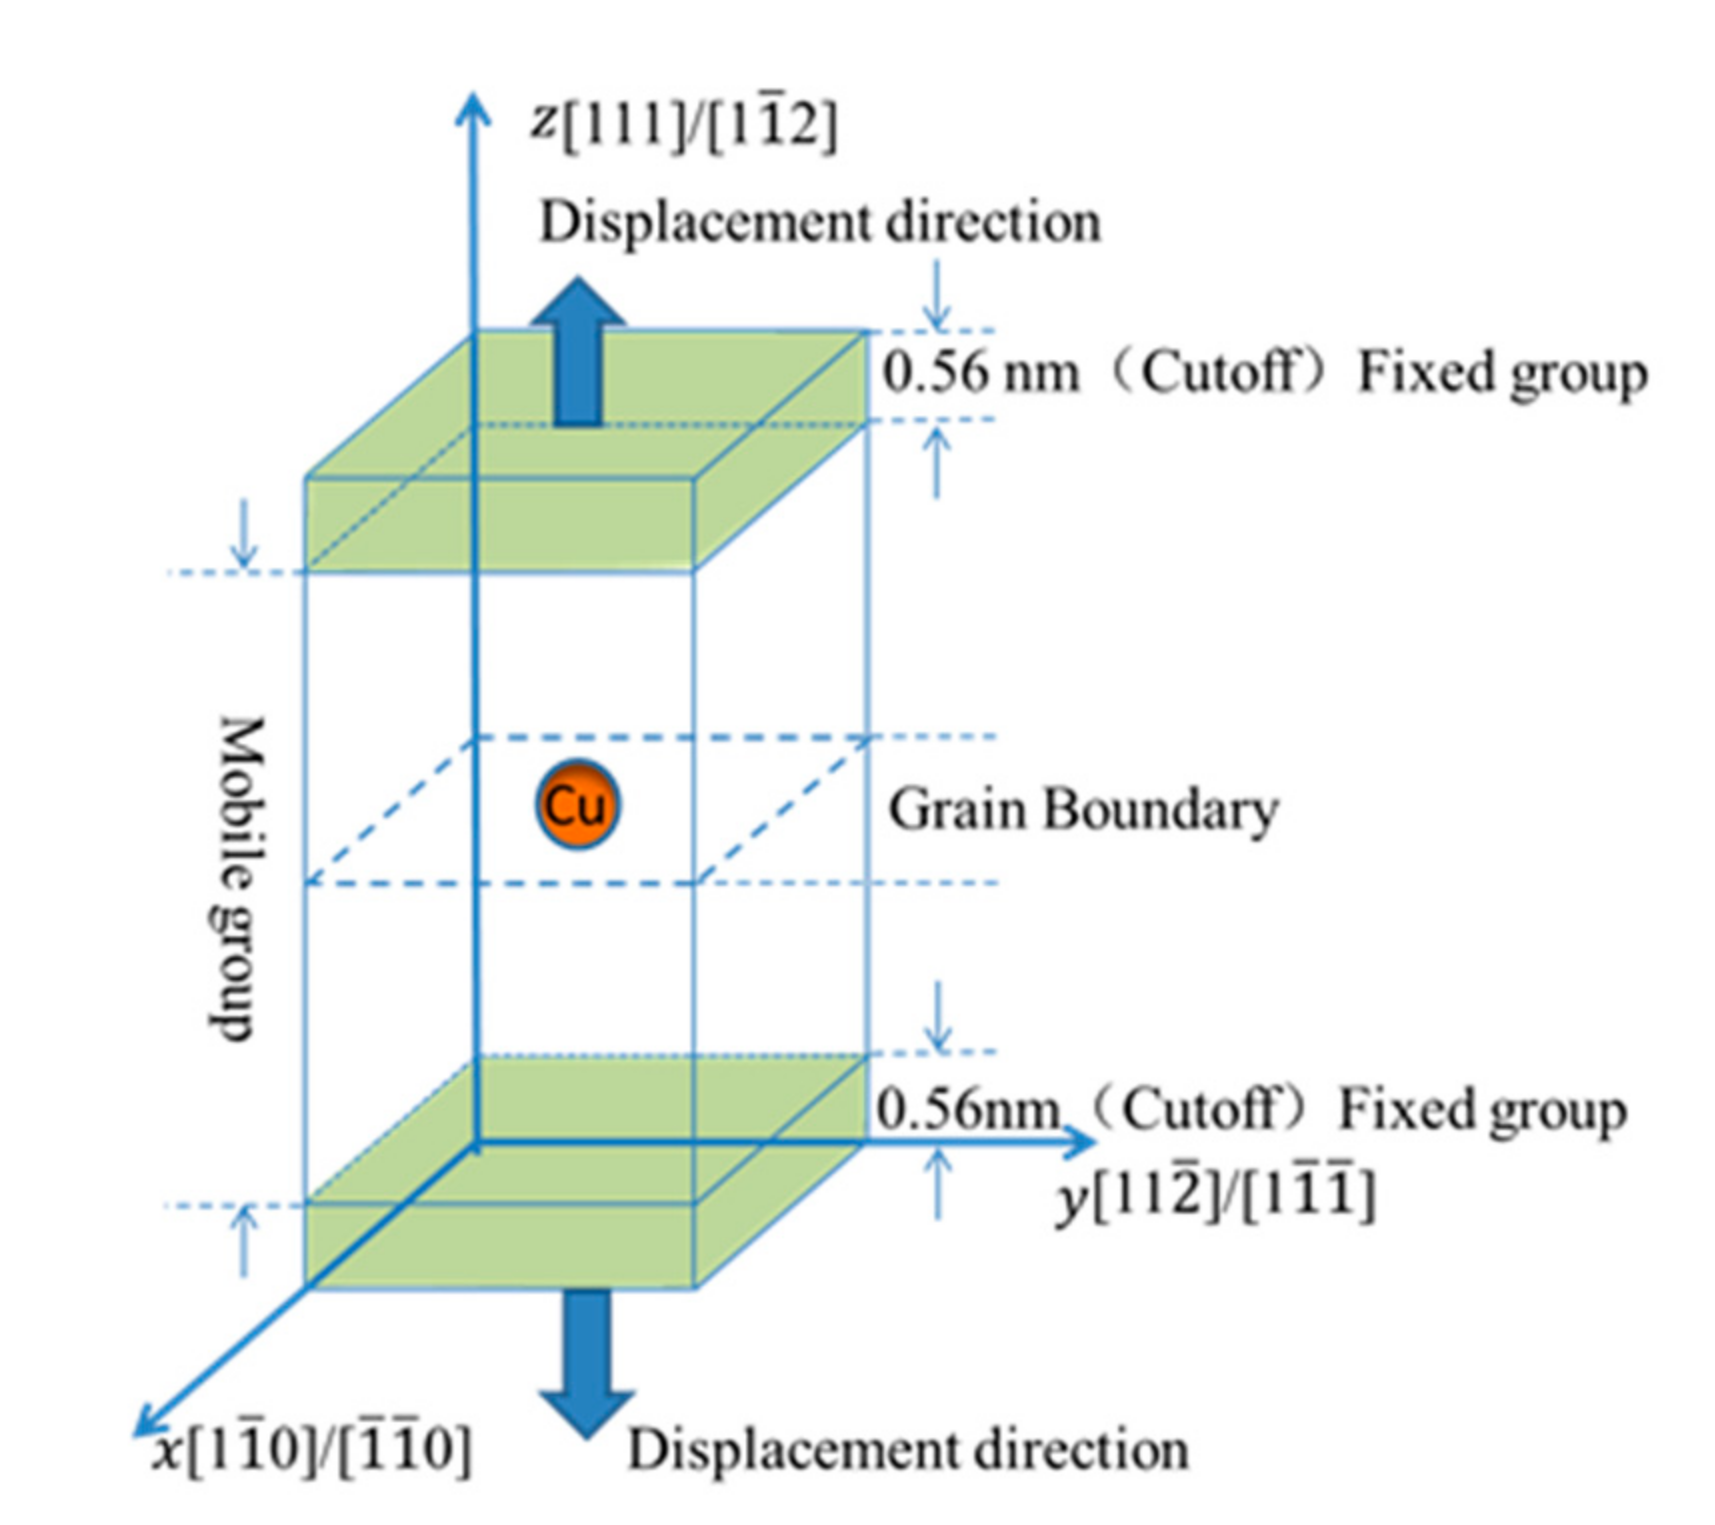
Figure 2.
Schematic diagram of the regions of Cu atoms in the model (a) the original region, (b–e) regions after the X and Y axis sizes are successively reduced.
Figure 2.
Schematic diagram of the regions of Cu atoms in the model (a) the original region, (b–e) regions after the X and Y axis sizes are successively reduced.
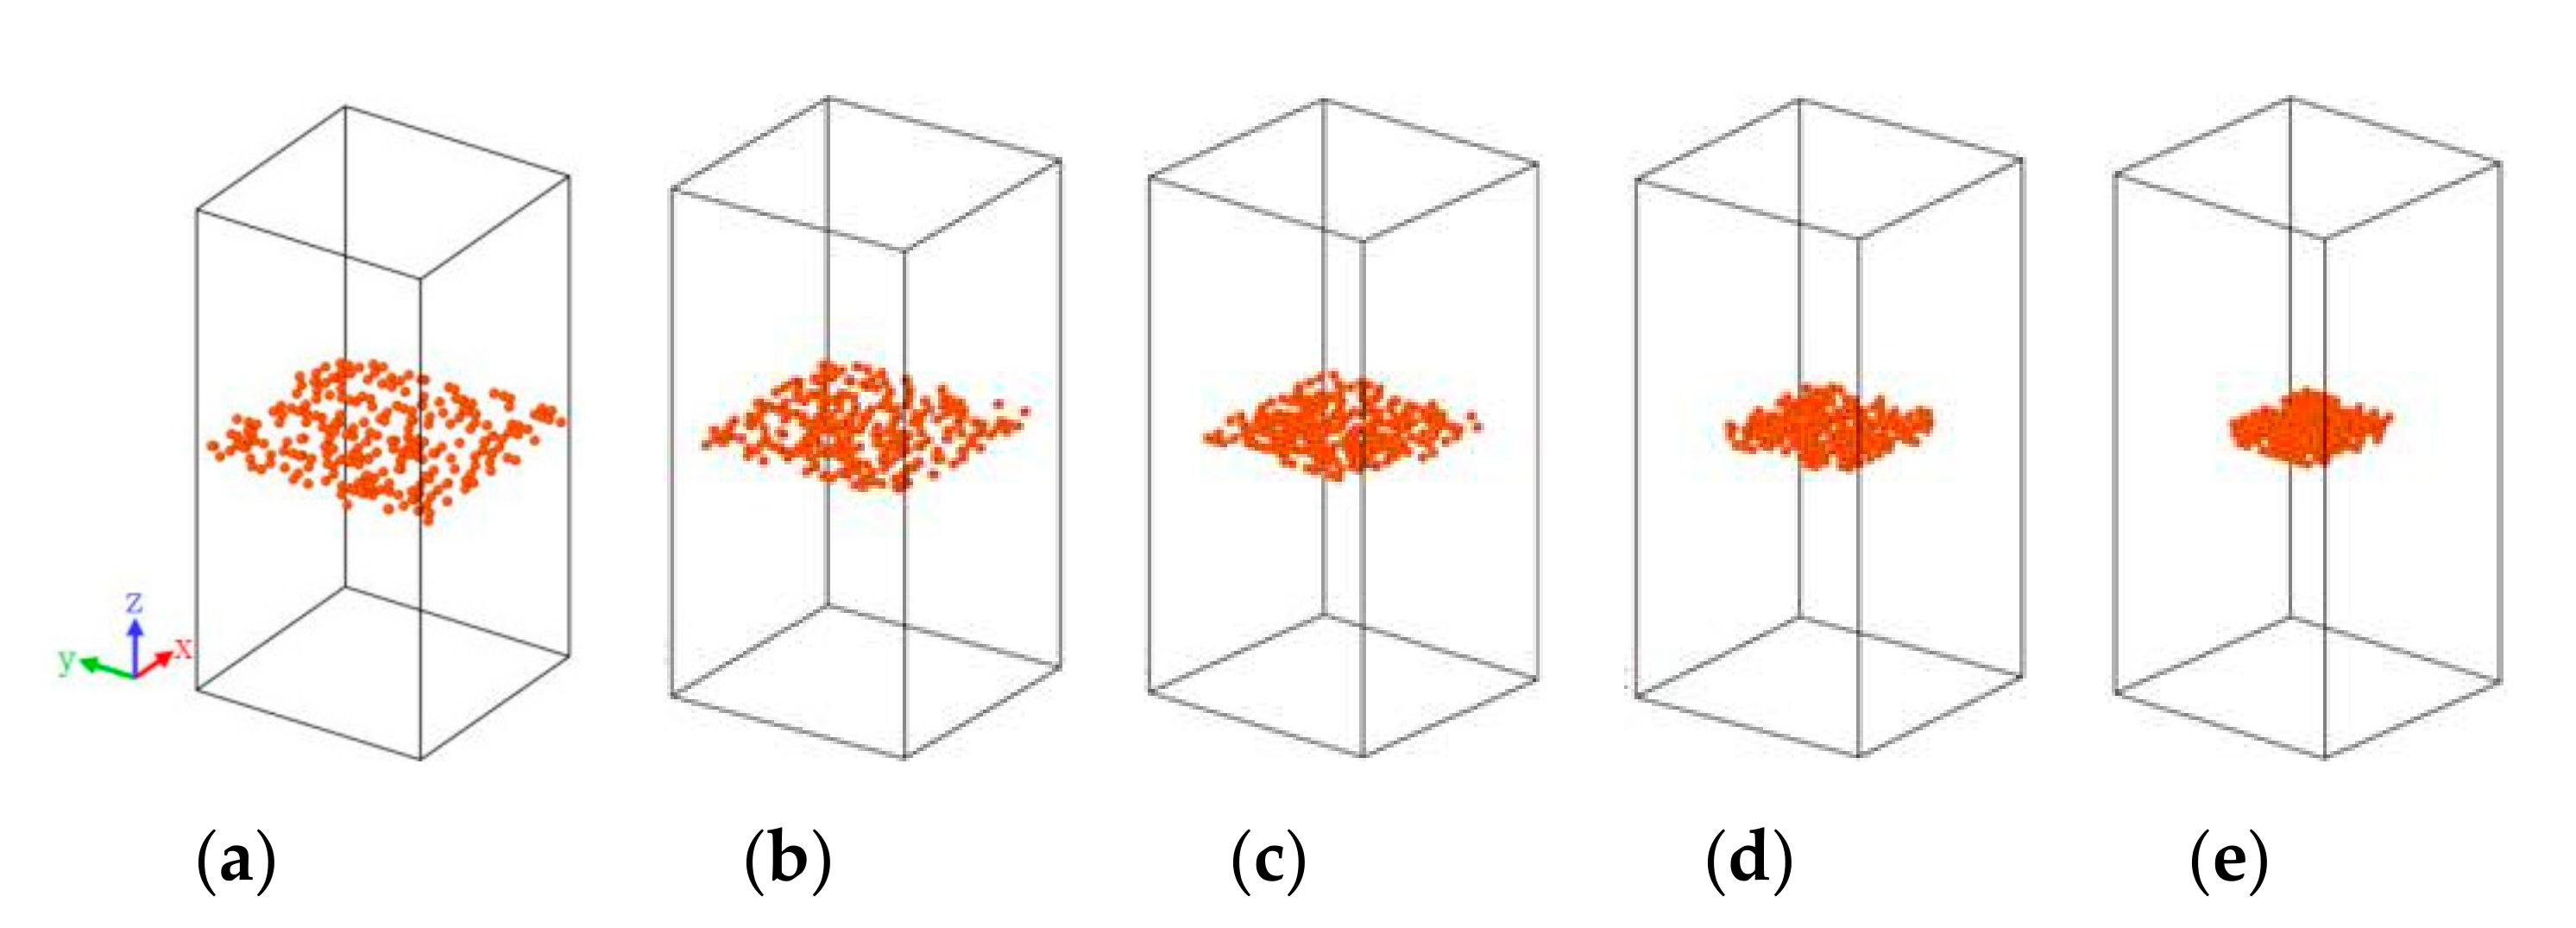
Figure 3.
Diagram of the potential energy and the cohesive energy of Cu atoms after the region of Cu atoms is successively reduced.
Figure 3.
Diagram of the potential energy and the cohesive energy of Cu atoms after the region of Cu atoms is successively reduced.
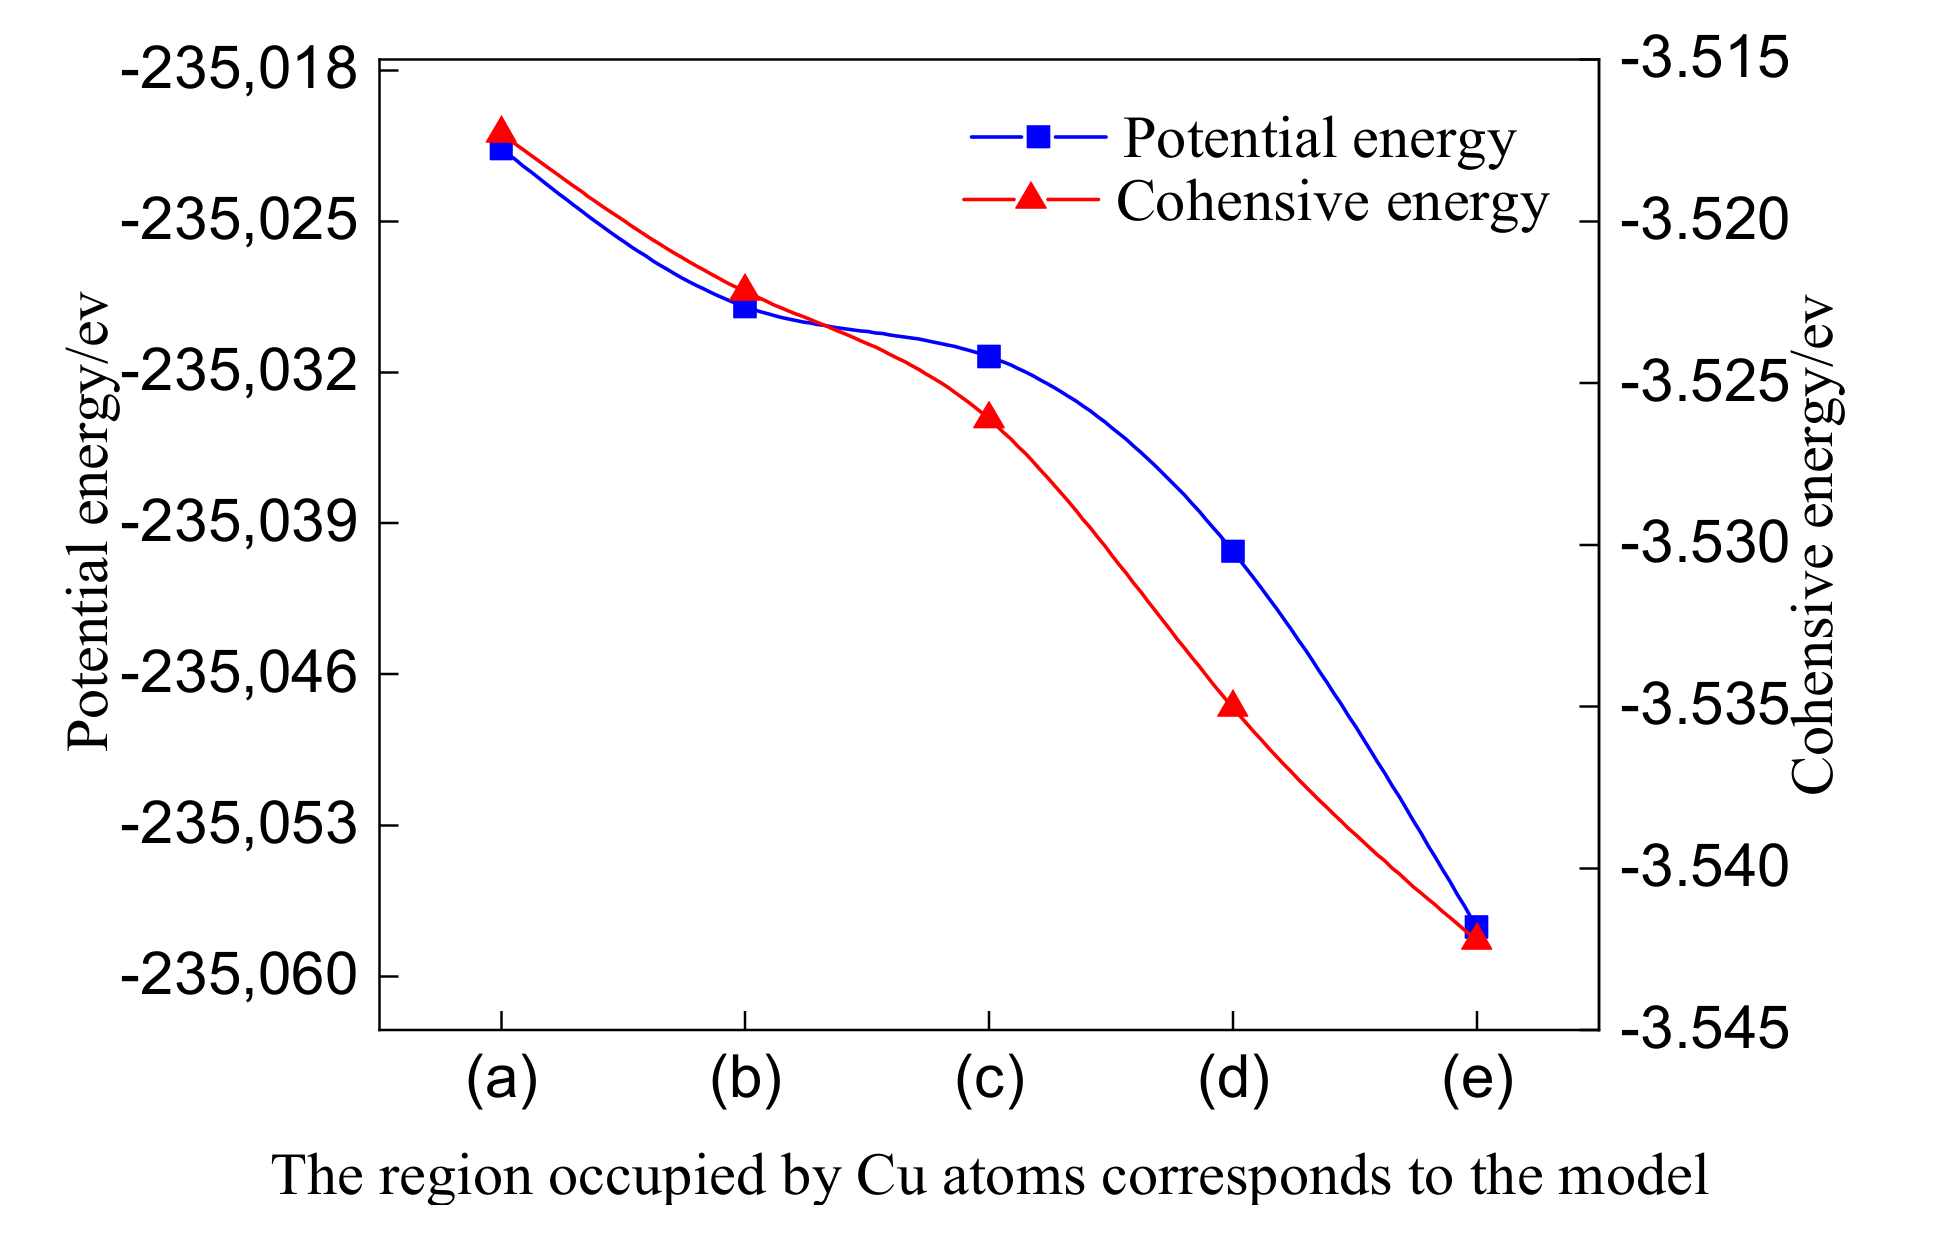
Figure 4.
Stress–strain diagram of {111} grain boundary with no Cu clusters and with Cu clusters of different sizes.
Figure 4.
Stress–strain diagram of {111} grain boundary with no Cu clusters and with Cu clusters of different sizes.
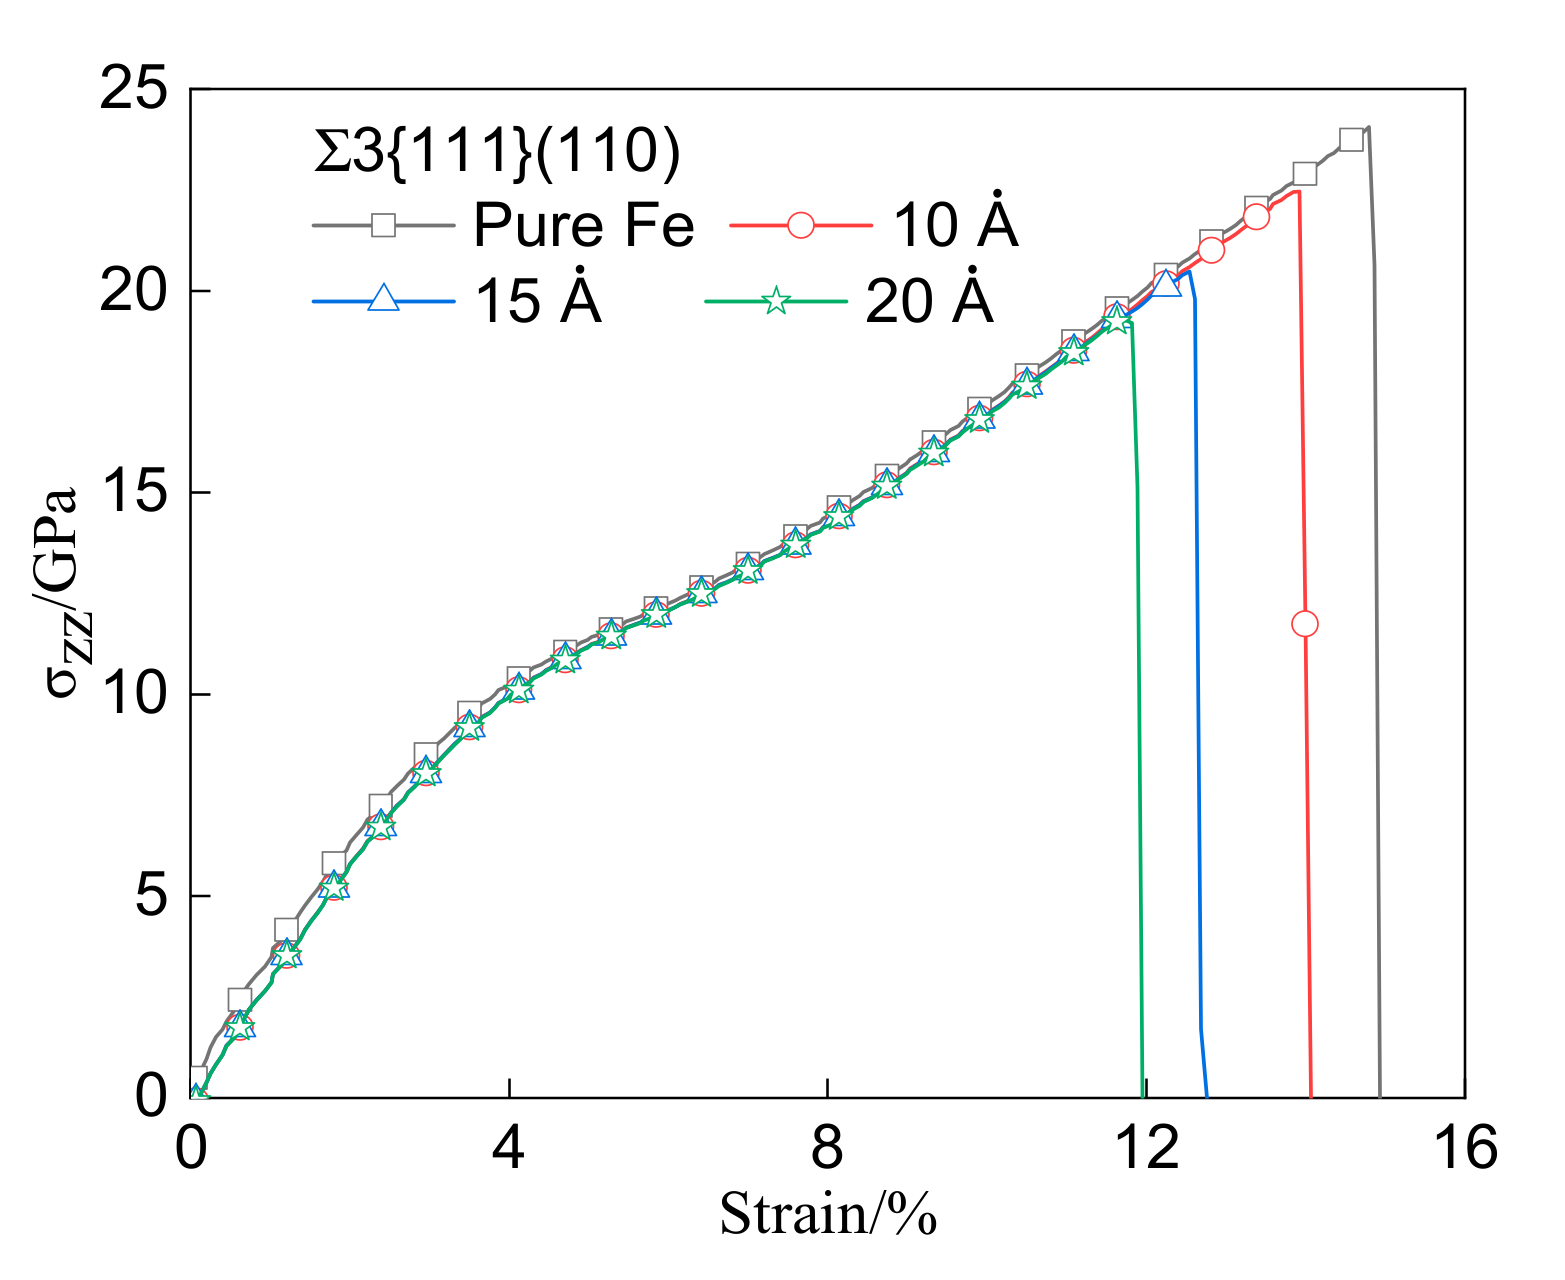
Figure 5.
Internal tension in the process of Cu clusters phase space evolution process and atomic energy distribution (a) with diameter of 20 a Cu clusters phase of the original grain boundary model (b) strain was 12.5%, according to the atomic energy staining (c–f), respectively, the strain was 8.6%, 9.5%, 11.6% and 12.5% when system within the space distribution of atoms: black Fe atom: red Cu atom: green space.
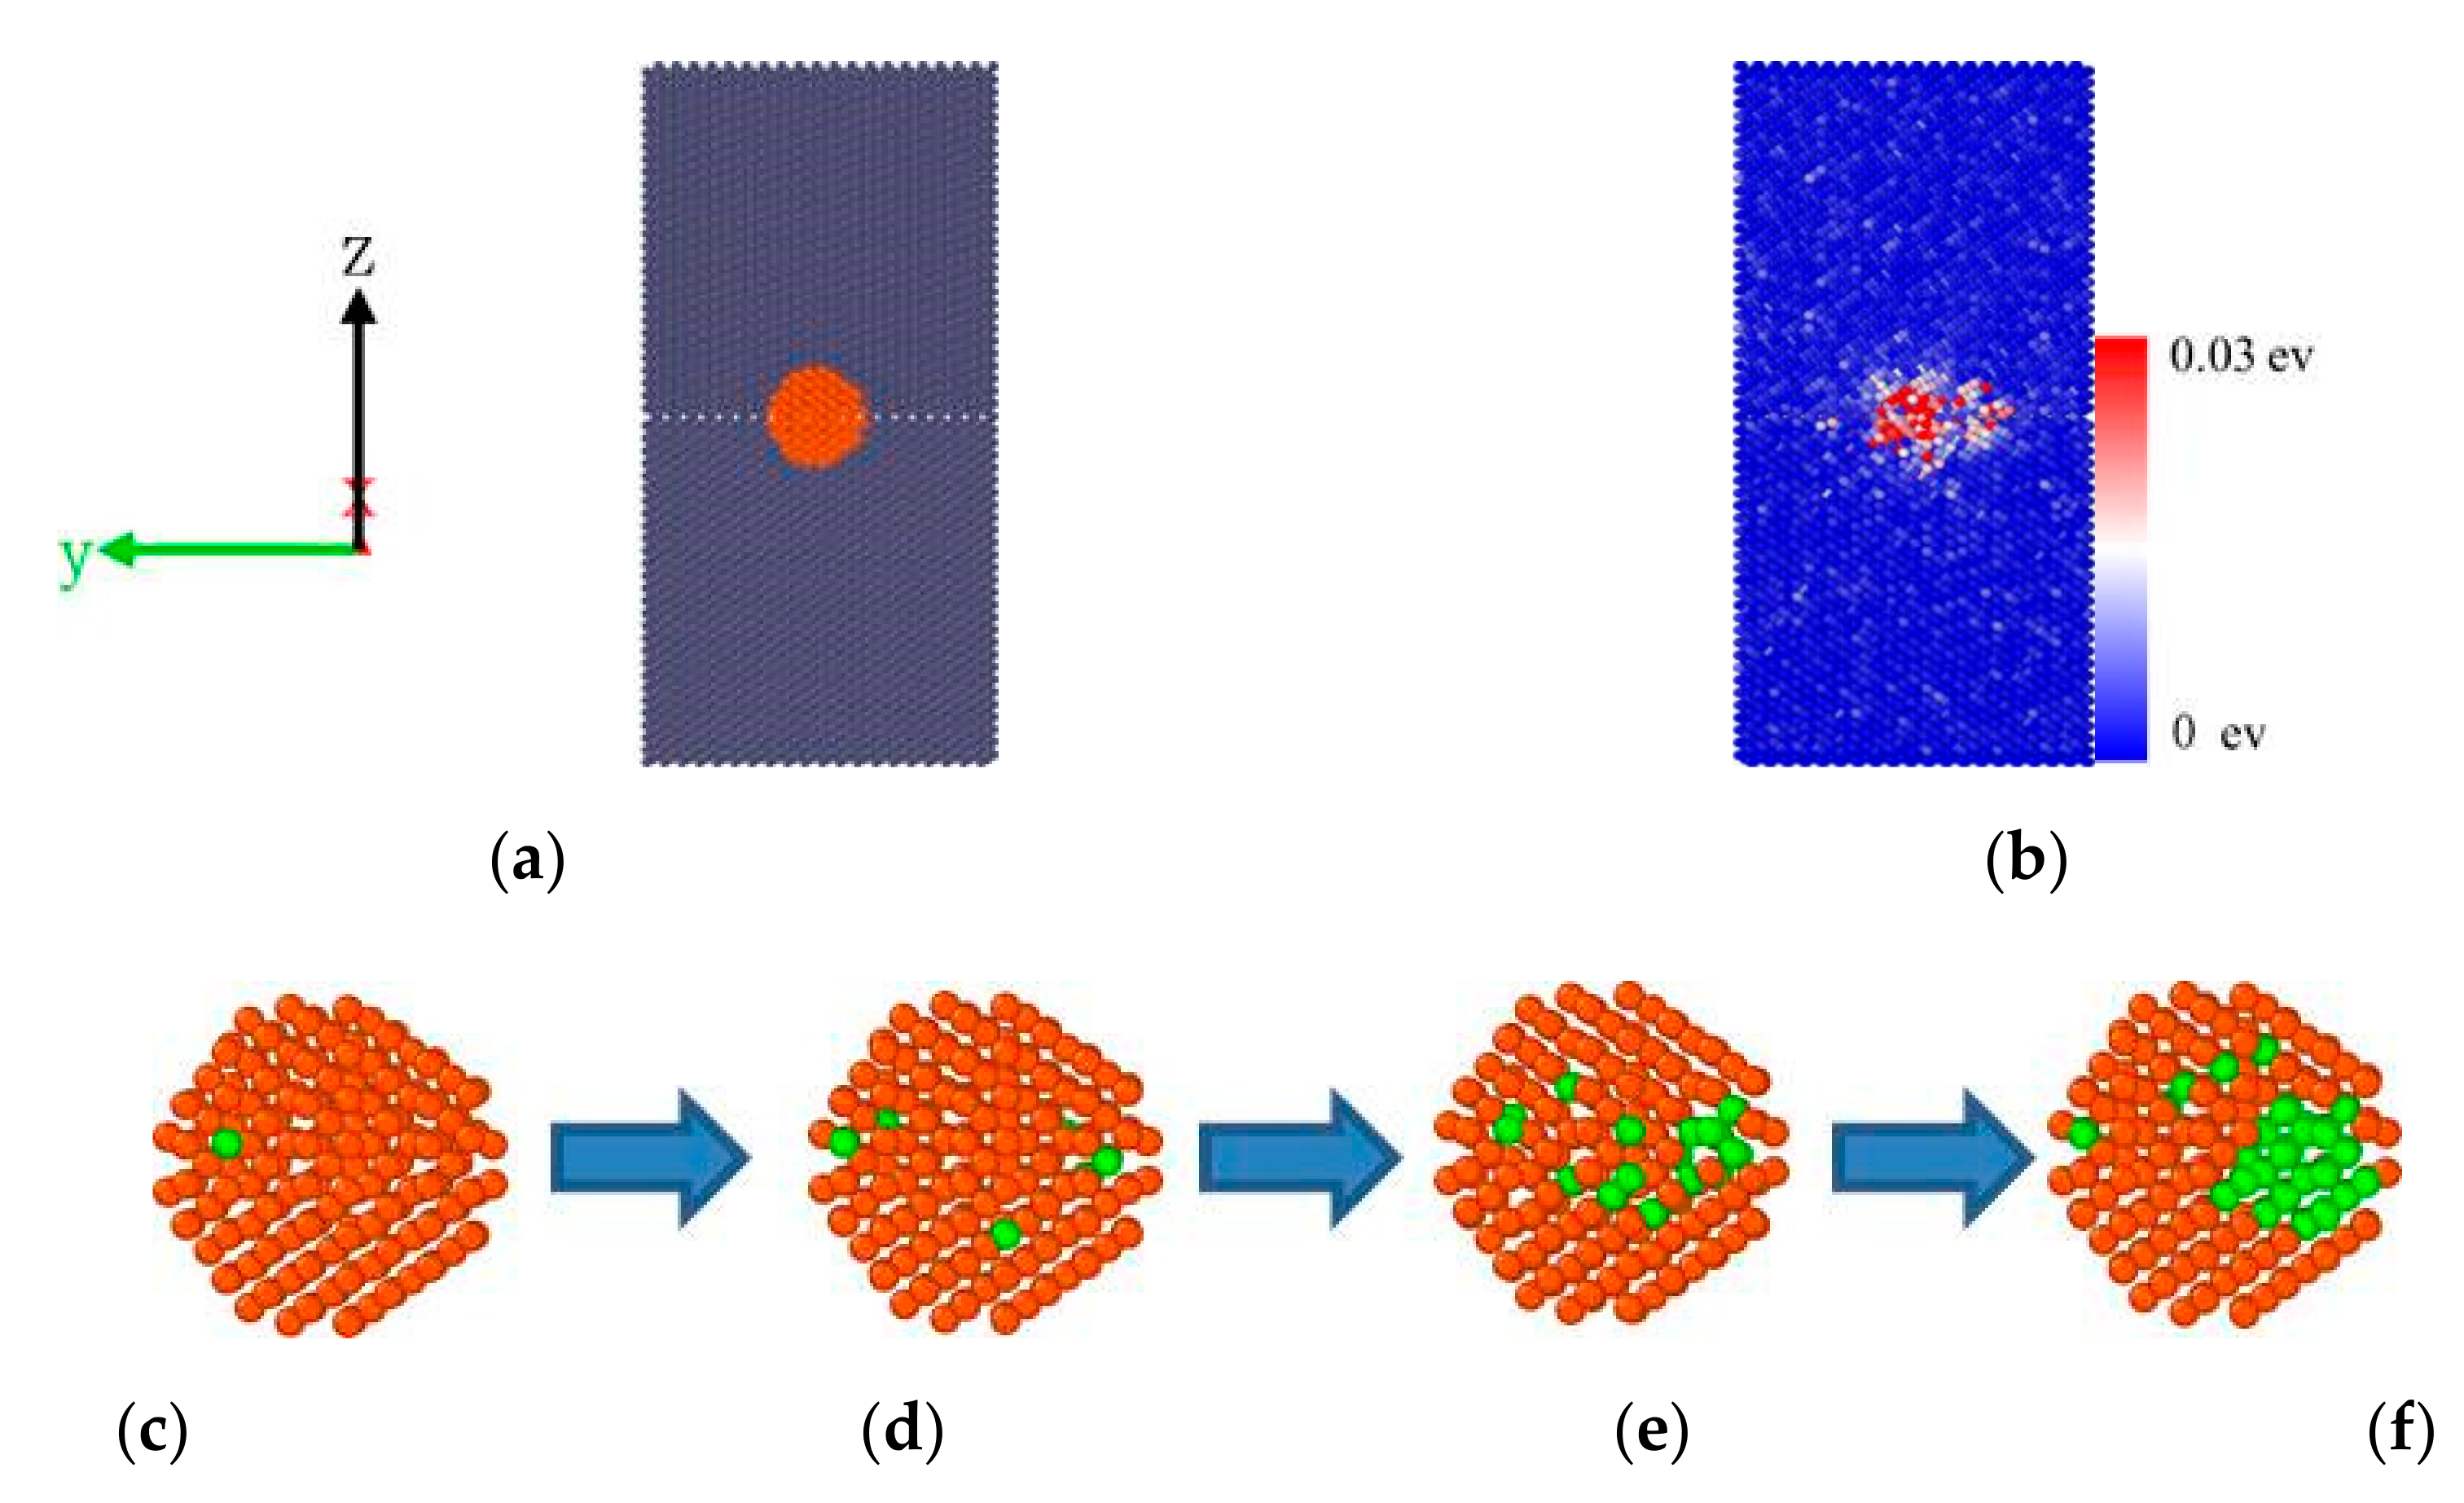
Figure 6.
Stress–strain diagram of {112} grain boundary with no Cu clusters and with Cu clusters of different sizes.
Figure 6.
Stress–strain diagram of {112} grain boundary with no Cu clusters and with Cu clusters of different sizes.

Figure 7.
Atomic trajectories in the tensile process without Cu clusters (a) the selection model to observe atoms (b) strain 0–8.5% when selected atomic position (c–e) strain were 9%, 16% and 22.5%, respectively, when the structural phase transformation in the atomic positions (f) and not structural phase transition area enlarge figure thumbnail in the green part of the blue part for the FCC structure to BCC structure.
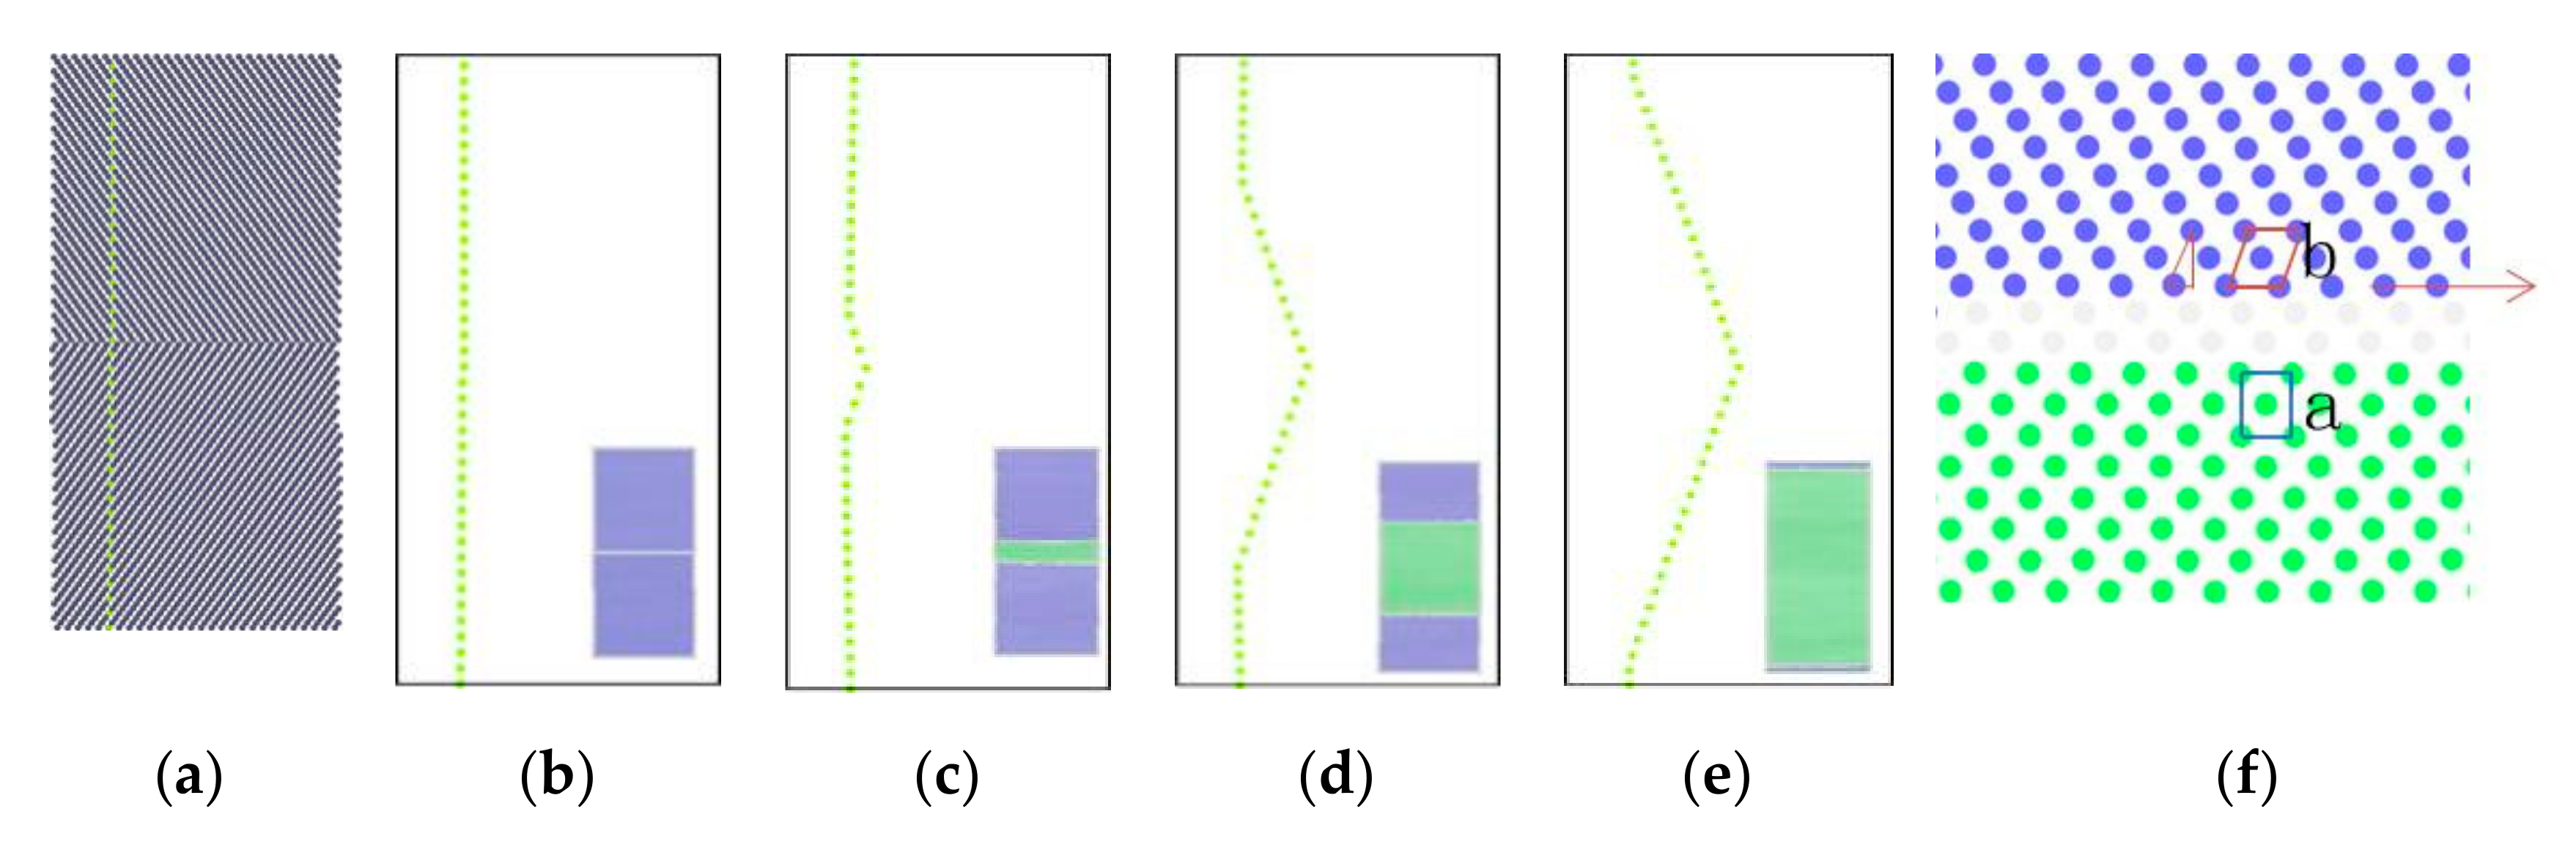
Figure 8.
Contains the evolution law of crystal structure at grain boundary with diameters of 10A and 20 Å Cu when the cluster phase is stretched (a,d). When the original grain boundary model (b) is not stretched, the clusters of 10 Å correspondingly change to 23% (c) the clusters of 10 Å correspondingly change to 24% (e) the clusters of 20 Å correspondingly change to 9% (f) the clusters of 20 Å correspondingly change to 10%.


Table 1.
{111} and {112} grain boundaries γ and Cu atoms .
| Type | In This Work γ/J/m2 | Other Work γ/J/m2 | /ev |
|---|---|---|---|
| {111}Fe-Fe | 1.306 | 1.311 [25] 1.292 [12] | −0.0558 |
| {111}Fe-V | 1.317 | - | −0.2142 |
| {112}Fe-Fe | 0.314 | 0.322 [25] 0.261 [12] | −0.0249 |
| {112}Fe-V | 0.316 | - | −0.1699 |
Table 2.
{111} with and without Cu clusters at grain boundaries.
| Type | {111} Grain Boundary Place /ev | {111} Interior of Cu Cluster at Grain Boundary /ev |
|---|---|---|
| No Cu cluster | 1.868 | - |
| 10 Å Cu cluster | 1.868 | 0.724 |
| 15 Å Cu cluster | 1.869 | 0.799 |
| 20 Å Cu cluster | 1.871 | 0.924 |
Publisher’s Note: MDPI stays neutral with regard to jurisdictional claims in published maps and institutional affiliations. |
© 2020 by the authors. Licensee MDPI, Basel, Switzerland. This article is an open access article distributed under the terms and conditions of the Creative Commons Attribution (CC BY) license (http://creativecommons.org/licenses/by/4.0/).
Share and Cite
MDPI and ACS Style
Zhang, H.; Wang, X.; Li, H.; Li, C.; Li, Y. Molecular Dynamics Study on the Impact of Cu Clusters at the BCC-Fe Grain Boundary on the Tensile Properties of Crystal. Metals 2020, 10, 1533. https://doi.org/10.3390/met10111533
AMA Style
Zhang H, Wang X, Li H, Li C, Li Y. Molecular Dynamics Study on the Impact of Cu Clusters at the BCC-Fe Grain Boundary on the Tensile Properties of Crystal. Metals. 2020; 10(11):1533. https://doi.org/10.3390/met10111533
Chicago/Turabian StyleZhang, Haichao, Xufeng Wang, Huirong Li, Changqing Li, and Yungang Li. 2020. "Molecular Dynamics Study on the Impact of Cu Clusters at the BCC-Fe Grain Boundary on the Tensile Properties of Crystal" Metals 10, no. 11: 1533. https://doi.org/10.3390/met10111533
Note that from the first issue of 2016, this journal uses article numbers instead of page numbers. See further details here.