Process Optimization and Formation Analysis of Friction Plug Welding of 6082 Aluminum Alloy

1
School of Materials Science and Engineering, Lanzhou University of Technology, Lanzhou 730050, China
2
State Key Laboratory of Advanced Processing and Recycling of Non-Ferrous Metals, Lanzhou University of Technology, Lanzhou 730050, China
3
Aeronautical Key Laboratory for Welding and Joining Technologies, AVIC Manufacturing Technology Institute AECC, Beijing 100024, China
*
Author to whom correspondence should be addressed.
Metals 2020, 10(11), 1454; https://doi.org/10.3390/met10111454
Submission received: 21 September 2020
/
Revised: 27 October 2020
/
Accepted: 29 October 2020
/
Published: 30 October 2020
(This article belongs to the Special Issue Advanced Process Technologies Based on Friction Stir Welding and Linear Friction Welding)
Abstract
:The response surface analysis method was used to systematically study the effect of various parameters on the tensile strength of 6082 aluminum alloy friction plug welding (FPW) joints in this work. The fluidity of the joint and microstructure were observed with a metallurgical microscope. Combined with the temperature field and force analysis, the reason why the root of the joint appears as a weak zone was explained. The results showed that the degree of influence on the tensile strength of FPW joints was rotational speed > upsetting speed > welding time. The optimal FPW joint was obtained when the rotational speed was 2254 rpm, the upsetting speed was 2 mm/s, and the welding time was 25 s, so the tensile strength could reach 262.34 MPa. The microstructure of the FPW joint appeared heterogeneous. According to the different plastic metal fluidities of the joint, it could be divided into four areas. The interaction force at the friction interface was not strong at the root of the FPW joint, so the root often becomes the weak area of the FPW joint.
1. Introduction
In recent years, the extensive application of aluminum alloys and magnesium alloys in the industrial field has led to the rapid development of friction stir welding (FSW), which has unique advantages in the welding of this type of metal [1,2]. However, due to the withdrawal of the stir needle, a keyhole will remain at the end of the weld, which forms the largest disadvantage of FSW. How to eliminate the keyhole has become a current research hotspot [3].
Friction plug welding (FPW) is a solid-phase welding process proposed by the welding institute (TWI) in 1995 [4], and it has been widely used in the repair of welds, especially the repair of aluminum alloy FSW keyholes. Although tungsten inert gas welding (TIG) and metal inert gas welding (MIG) can also be used to repair FSW keyholes, the repair of aluminum alloy welds is prone to defects such as alloy element burning and excessive residual stress. The use of the solid phase welding process to repair the workpiece can reduce the residual stress and solve the damage and other issues such as burning of alloy elements because the maximum temperature generated during repair welding is much lower than the heat generated by fusion welding [5,6]. Hartley et al. found that the FPW joints had 20% higher tensile strength than TIG-welded joints [7]. Metz et al. compared FPW joints with the joints repaired by TIG welding and found that FPW joints had higher strength and a longer fatigue life [8].
Due to the excellent performance of FPW joints, since its proposal, engineers from Lockheed Martin and Marshall Flight Center and TWI experts have conducted many experimental studies on the technology and formally applied the technology to aerospace weld repair of outer tanks in 2000 [7]. According to the macroscopic metallographic photos of FPW joints, Du et al. divided the joints into six typical areas: plug material (PM), plug thermo-mechanically affected zone (PTMAZ), recrystallization zone (RZ), base metal thermo-mechanically affected zone (TMAZ), heat affected zone (HAZ), and base material (BM) [9]. Hynes et al. used Ti-6Al-4V plugs to repair AA2024 aluminum alloy. After the joint with excellent mechanical properties has been applied, the impact energy of the joint can reach 286 kJ/m2 [10]. Cui et al. found that the mechanical properties of API X65 low-alloy pipeline steel FPW joints were not uniform [11]. Du et al. studied the structure and mechanical properties of AA2219-T87 aluminum alloy FPW joints and found that the source of cracks was located in the lower part of the joint recrystallization zone [12]. Metz et al. noted that the dissolution of the T1 phase at the interface of the 2195-T8 aluminum-lithium alloy FPW joints might cause local slippage of the HAZ and TMAZ, which reduced the fatigue performance of the joint [13]. Landell et al. used numerical simulation and titanium alloy tracing method to study the flow of materials during plug repair welding [14].
The quality of FPW joints is closely related to the welding parameters. The rotational speed, welding time, and upsetting speed directly affect the mechanical properties of the joint. Cui et al. found that the combination of low speed and low axial force more likely caused joint defects [15]. The reasonable coordination of axial force and rotation speed can increase the metal fluidity and heat input at the root of the joint and reduce the appearance of root defects [16,17,18]. Many scholars have studied the structure and properties of FPW joints by controlling the axial force, but no one has studied the change in resistance to plastic deformation during the welding process at constant pressing speed and upsetting speed. This study examines the change in plastic metal deformation resistance during welding and the effect of the rotation speed and upsetting speed on the joint structure and performance by optimizing the welding parameters. It also explains why the root of FPW joints easily produce defects.
2. Materials and Methods
2.1. Materials
6082-T6 aluminum alloy was used as the plug in the experiment. Table 1 shows the mechanical property of 6082-T6 aluminum alloy. The hole was processed in the center of the 6082-T8 aluminum alloy sheet (150 mm × 50 mm × 5 mm). As shown in Figure 1, the assembly of the plug and the hole are shown. The chemical composition of the 6082 aluminum alloy is shown in Table 2.
2.2. Welding Process of FPW
The welding process is divided into five stages as shown in Figure 2.
Warm-up stage: As shown in Figure 2a, the pre-assembly makes the shoulder and upper surface of the base material stay in close contact, and the plug and hole are in close contact. The shoulder and plug rotate at identical speeds to achieve the preheating effect.
Friction feed stage: As shown in Figure 2b, the shoulder and plug begin to press down at identical speed after warming up for a period of time, which makes the friction surface contact closer and generates a considerable amount of heat. After a certain displacement, the plug and shoulder simultaneously stop rotating and moving.
Upsetting stage: As shown in Figure 2c, after the shoulder and plug stop rotating, the striker immediately pushes the plug down at a certain speed under the action of the electric cylinder to upset.
Pressure-holding stage: As shown in Figure 2d, the striker does not immediately retract after being quickly pressed down, but stays for a period of time to ensure the tight connection of the bonding surface.
Departure stage: As shown in Figure 2e, the worktable and plug produce a horizontal relative displacement to cut off the excess part of the plug. Then, the shoulder drives the excess stopper material away from the workpiece at a certain speed.
According to the Box–Benhnken Design (BBD) method in the Design-Expert 8.0 software, a mathematical model with the tensile strength of the FPW joint as the response value was constructed. We selected the rotational speed, welding time, and upsetting speed as three factors of the response surface experiment method and selected three levels for each factor, as shown in Table 3. We found the optimal welding parameters, selected two factors with greater effect on the joint performance, and analyzed their effect on joint formation.
2.3. Microstructure Characterization
We removed the extruded part after welding. A wire cutting device was used to cut a sample with a size of 20 mm × 10 mm × 5 mm along the center line of the keyhole. After the sample was polished, it was corroded with Keller’s reagent (2.5 mL HNO3, 1.5 mL HCl, 1.0 mL HF, 95 mL distilled water) for 20 s. The Axio Scope A1 optical microscope (CARL ZEISS, Oberkochen, Germany) was used to observe the joint microstructure and metal fluidity. FEG-450 thermal field emission scanning electron microscope (FEI, Hillsboro, OR, USA) was used to observe the distribution of the second phase near the FPW joint.
2.4. Mechanical Performance Test
The working end of the K-type thermocouple (Feilong, Shanghai, China) was fixed by high-temperature glue at the position shown in the Figure 1. The cold end was connected to the GRAPHTEC GL240 temperature recorder (GRAPHTEC, Yokohama, Kanagawa, Japan) to record the temperature change data during FPW at each position. The tensile specimen was processed in accordance with the ISO 4136 standard. The AGS-X300kN electronic universal testing machine produced by Shimadzu of Japan was used for the tensile test of the joint (stretching rate was 0.2 mm/s). The material of 1 mm, 2 mm, and 3 mm from the upper surface to the lower surface of the sample was polished away. After the new surface was polished, A Wilson VH1102 microhardness tester (Wilson, Lake Bluff, IL, USA) measured the microhardness at an interval of 0.2 mm, during which the load of 0.981 N were applied for 10 s.
3. Results
3.1. Optimization of FPW Process
In the optimization process of experimental conditions, the response surface optimization process can be used to continuously analyze various levels of the experiment. The design layout and experimental results are shown in Table 4.
The test for significance of the regression models, the F-test for significance on individual model coefficients, and the lack-of-fit test were performed using the same statistical package. Then, the step-wise regression method was used to eliminate the insignificant model terms automatically, but respecting the hierarchy of the model terms. The resulting ANOVA table for the reduced quadratic models summarized the analysis of variance of tensile strength and showed the significant model terms (Table 5). With decreasing P and increasing F values, the effect of input factors on the responses will be more effective [19]. The analysis of variance for tensile strength showed that the main effects of the second-order effect of rotational speed (ω2), rotation speed (ω), and upsetting speed (v) were important factors affecting the model. Figure 3a shows the normal plot of residual of tensile strength (TS). Normal plots of residual indicated that points followed a straight line, which indicated that residuals followed a normal distribute. Figure 3b indicates the relationship between actual and predicted values; it can be seen from the figure that each point was distributed near the 45° line. Thus, the developed model was adequate.
The final mathematical models in terms of coded factor as determined by the design expert software are shown below, in Equation (1):
TS = 246.40 + 12.78ω + 0.90t + 9.89v − 1.49ωt − 0.45ωv − 0.23tv − 45.38ω2 − 3.57t2 + 4.72v2
To consider the effect of the interaction among various factors on the tensile strength of FPW joints, contour plots of the response surface were drawn according to the established quadratic regression model, as shown in Figure 4. It can be seen from Figure 4a that when the speed was constant, the color change gradient was small along the time axis. However, when the welding time was constant, the color change gradient was large along the rotational speed axis. This showed that the influence of rotational speed on the tensile strength of the joint was greater than that of the welding time. In the same way, it can be found from Figure 4b,c that the influence of rotational speed on the tensile strength of FPW joints was greater than the upsetting speed, and the influence of the upsetting speed on the tensile strength of the joint was greater than that of the welding time. It can be seen from Table 5 that the p-values of the rotational speed (ω), the upsetting speed (v), and the welding time (t) were 0.0071, 0.0227, and 0.7996, respectively. Therefore, the degree of influence on the tensile strength of the joint was rotational speed (ω) > upsetting speed (v) > welding time(t).
The optimal solution of the regression model of the tensile strength was obtained using the Design-Expert 8.0 software, as shown in Table 6. The actual tensile strength of FPW joints was notably close to the predicted value of the regression model, and the error of the tensile strength was only 0.6%. Thus, the response prediction value of the regression model was very accurate and had reference value in actual production.
3.2. Microstructure and Second-Phase Distribution of the FPW Joint
Figure 5 shows the macrograph of the cross-section of the FPW joint. Figure 5a–h respectively showed different areas of the FPW joint. The joint was wide at the top and narrow at the bottom with typical rivet-like characteristics, but it did not show symmetry. The dividing line on the left was thin and obvious, but the dividing line on the right was wide and fuzzy. This was mainly because the workbench produced a rightward displacement to cut off the excess plug material after the welding was completed, which was equivalent to giving a pressure to the left bonding surface and a pulling force to the right bonding surface. We made the tissue near the left bonding surface more closely integrated. From the perspective of the macroscopic appearance, the joint had obvious macroscopic microstructure inhomogeneity. The joint was mainly composed of five areas: (a) the plug zone (PM), (b) friction interface zone (FIZ), (c) thermo-mechanically affected zone (TMAZ), (d) heat affected zone (HAZ), and (e) base material (BM).
The microstructures of the FPW joint observed under Optical Microscope (OM) are shown in Figure 6. Figure 6a shows the plug material far away from the weld, which was less affected by heat and maintained the equiaxed grains of the plug. Figure 6b shows the friction interface zone, where the fine equiaxed grains of the plug were closely interspersed into the lath-shaped grains of the base material. Figure 6c shows the thermo-mechanically affected zone. Due to the combined action of the high-speed rotation of the plug, welding pressure, and shape of the counterbore, the lath-shaped grains were elongated and showed obvious directionality. Figure 6d shows the heat affected zone, where the grains of the base metal significantly grew because of the effect of frictional heat. Figure 6e shows the base material zone, which was the long lath-shaped grain structure formed by rolling. Considering the upper, middle, and lower three layers at the junction of the plug and the hole in Figure 6f–h, the fine equiaxed grains of the plug in the upper friction interface zone were closely inserted into the lath-shaped grains of the base material, which closely connected the plug and hole. However, the number of equiaxed grains of the plug that interspersed between the lath-shaped grains was significantly reduced at the lower layer.
Figure 7a shows the morphology and distribution of the second phase in different areas near the FPW joint. The base material (6082-T8 aluminum alloy) was Al-Mg-Si series aluminum alloy, which was obtained by cold working after solution heat treatment and artificial aging, while the plug 6082-T6 aluminum alloy had not undergone cold working deformation. The base material structure was accompanied by a large number of dislocations, α (Al) phase and β (Mg2Si) phase solid solution [20].
It can be seen from Figure 7b that the base material was a rolled lath structure, and a large number of β phases were streamlined and evenly distributed on the base material. As shown in Figure 7c, the morphology of β phase had no obvious change and distributed evenly on the collective in granular form because the plug was less affected by frictional heat. Compared with the base material area, although the quantity of the second phase was relatively reduced in TMAZ, the size was larger (Figure 7d,f,g,i,j,l). At the same time, due to the deformation of the grains in TMAZ, the morphology of the second phase changed and was consistent with the direction of grain deformation. It showed that the β phase gathered and grew due to the action of friction heat in TMAZ during FPW. Comparing the second phases of the upper (Figure 7d–f), middle (Figure 7g–i), and lower (Figure 7j–l) layers, the upper layer received more heat because the axial force mainly was contributed to the interaction between the interfaces on the upper metal, which made the second phase aggregation more serious. The axial force received by the lower metal was mainly contributed to the flow of the metal, and it received less heat. Hence, the second phase had a uniform linear distribution.
3.3. Flow and Hardness of FPW Joint Metal
In Figure 8, when the rotational speed was 2200 rpm and 2600 rpm, the difference in the amount of plasticized metal between upper and lower parts of the joint was maximal, and the width of the upper part of the joint plastic metal greatly decreased in the vertical direction. When the rotational speed was 1800 rpm, the opposite was true. The reason was that the hole and plug in this test fit at the same angle at 45°, and the upper and lower radii of the plug were different, which resulted in different heat generation per unit time between the upper and lower parts of the FPW joint. In addition, there was auxiliary heating on the upper part of the joint, so a higher rotational speed corresponded to greater difference in heat production between the upper and lower parts of the joint. As a result, the upper part of the joint was more plasticized than the lower part. For FPW of joints with 2200 rpm and 2600 rpm, the width of the plasticized metal was not greatly different. Thus, when the rotation speed was more than 2200 rpm, the plasticization effect of the rotation speed on the metal was not obvious.
Under different heat inputs, the degree of plastic deformation of the metal varied, and the feature of the structure was different under the metallurgical microscope. The white arrow in Figure 8 indicates the direction of plastic metal flow. According to different fluidities of the joint, the joint could be divided into four areas. Area A was the metal flow in the affected area of the shoulder, which was formed by the friction of the shoulder, and the surface was composed of plastic pits of different sizes. The black point was the contact position between the shoulder and the plug in the Figure 8. Due to the assembly gap at this point, a little plastic metal will flow to this point under the action of the axial force. Area B was the flow of plastic metal near the junction. Due to the rigid constraints of the base material and main shaft, with the continuous downward pressure of the plug, according to the law of least resistance, the plastic metal can only flow and deform downward along the bonding surface. Area C was the flow of plastic metal of the FPW joint on the upper part. In this area, when the metal was closer to the center of the plug, the degree of plasticization decreased. When the metal was closer to the bonding surface, the degree of plasticization increased. Under the combined action of the axial force and internal interaction force of the metal, this part of the metal will produce a common displacement in the vertical and horizontal directions. A larger area will correspond to better mechanical properties of the joint. The fluidity of the metal in area D was the worst because it produced less heat and contacted the backing plate, which resulted in faster heat dissipation. As a result, the interface of this area was not tightly bonded, and it often became the weak area of the entire joint [21,22].
Figure 9 shows the microhardness distribution of the upper, middle, and lower layers of the FPW joint with the optimal welding parameters. The hardness distribution of the FPW joint showed a “W” shape. BM was almost unaffected by welding friction heat and had the highest hardness (approximately 120 ± 5 HV). However, the overall hardness was reduced to approximately 80 ± 5 HV because PM was affected by heat. TMAZ was severely softened, and the hardness dropped to 60 ± 5 HV. The overall hardness of the upper layer material was relatively small, and the overall hardness of the lower layer material was relatively high. Comparing the hardness results and the distribution of the second phase of the joint, it can be seen that the hardness changes in each area of the FPW joint were closely related to the distribution of the second phase. The area where the second phase was more evenly distributed had higher hardness. In the area where the second phase gathered seriously, the hardness was lower.
3.4. Analysis of the Axial Force
According to the mechanical relationship, the axial force measured in this test was equal to the axial deformation resistance of the plastic metal at the joint. Figure 10 shows the change of axial force with time during FPW. The shape of the axial force change curve at different rotation speeds was similar. According to inflection points, the curve can be divided into 5 parts. In the early stage, the plug did not move in the vertical direction, so the axial force was always 0. As the plug continued to press down, the axial force increased rapidly. Due to the accumulation of heat input, the degree of softening about material increased in the later stage of welding, resulting in the increasing tendency for the axial force less than the earlier stage. The rapid upsetting of the plug caused the axial force to increase rapidly after the welding was completed. In the pressure-holding stage, with the completion of dynamic recrystallization, the axial force showed a downward trend. The axial force instantly became 0 because the excess stopper rod was sheared. When the rotation speed was 1800 rpm, the measured axial force was significantly higher than those of 2200 rpm and 2600 rpm at all stages. The axial forces of 2200 rpm and 2600 rpm were not greatly different mainly due to the increase in heat input, which reduced the deformation resistance of the material.
4. Discussion
Figure 11a shows a macrograph of the FPW joint with a rotation speed of 2200 rpm and an upsetting speed of 1 mm/s. As can be seen from Figure 11b,c, there were many micropores along the bonding surface at the root of the FPW joint, which makes the tissue loose due to the small squeeze force at the root of the FPW joint. However, there were significantly fewer holes near the bonding surface on the left than on the right, since in the disengagement stage, the workbench will produce a horizontal displacement to the right, which is equivalent to giving a squeezing force to the left side of the joint, which increases the interaction force at the left bonding surface and makes the left joint more tightly joined.
Figure 12 shows the temperature variation curve of different parts of the FPW joint with time at 2200 rpm. The temperature of the upper layer of the joint was significantly higher than that of the lower layer in each phase. According to inflection points, the curve can be divided into 3 parts. In the first and second stages, the temperature had been increasing due to the continuous rotation of the plug and shoulder, but the temperature increase in the second stage was significantly higher than that in the first stage. The reason was that the force between the friction interface was strong with the continuous pressing of the shoulder and plug, which made the heat generation more sufficient in the second stage. The temperature of each layer maximized when the plug stopped rotating (approximately 25 s). At 2200 rpm and a constant press speed, the friction contact surface was quickly formed at the joint. However, there was a small linear velocity at the bottom of the joint. In addition, low heat production and high heat dissipation resulted in a lower temperature. Furthermore, low temperature made the degree of metal plasticization small, which often fails to satisfy the requirements of interatomic bonding. Thus, this area was one of the most prone areas to defects in the root of the joint.
Figure 13 is a schematic diagram of the FPW joint structure and the area bounded by the acefdba line can be approximated as the shape of the FPW bonding surface. The lengths of ab, cd, and ef depended on the speed of rotation. A higher rotation speed corresponded to a greater heat input, an increase in the degree of plasticization of the material, and an increase in ab, cd, and ef. The heights of hi and ij were determined by the amount of axial deformation. Greater axial deformation corresponded to higher hj and lower ij. During welding, to obtain a better performance joint, i.e., to obtain a larger C zone and a smaller D zone (Figure 8), the rotational speed must match the upsetting speed. A higher upsetting speed corresponded to a higher deformation rate. The plastic metal deformation resistance increased and the required axial force also increased, which were identical to the results of Du’s study, where a reasonable coordination of the speed and axial force can obtain a welded joint with excellent joint performance [23]. Fa1 and Fa2 are the vertical and horizontal components of Fa and the bonding surface, respectively; FN is the interaction force between the interface and the plastic metal; Fr is the resistance to metal flow. There is an equality relationship:
FN = Fa1 = Fa sinθ
The value of θ is smaller at the bonding surface of the joint root. Most of the axial force provided by the main shaft contributes to the flow of the plastic metal, and the interaction force of the plastic metal at the bonding surface is very small, which results in weak connection defects in the joint [17]. When the upsetting speed increases, the upsetting deformation increases. Due to the rigid fixation on the back of the hole, the plastic metal can easily fill the root of the FPW joint. Increasing the upsetting speed can increase the interaction force between the bonding surfaces and make the metal with sufficient plasticization on the upper part to be squeezed to the root of the FPW joint, which reduces the micro-holes near the bonding surface and the probability of weak connection defects at the root of the FPW joint.
5. Conclusions
In this study, the response surface analysis method was used to study the effect of welding parameters on the mechanical properties of the FPW joint, and the optimal welding parameters were found. The formation and defect of 6082 aluminum alloy plug welded joints were studied by measuring the change in axial force. The main conclusions are as follows:
- This study adopted the response surface optimization method and found that the degree of influence of the welding parameters on the tensile strength of the joint was ω > v > t. The optimal welding parameters were: rotational speed, 2254 rpm; welding time, 25 s; and upsetting speed 2 mm/s. The maximal tensile strength of the FPW joint was 262.34 MPa.
- In the welding process, a reasonable coordination of the rotational speed and upsetting speed can enhance the plastic metal fluidity at the joint to improve its mechanical properties.
- The fundamental reason for the weak connection at the root of the FPW joint is that the interaction force between the plastic metals on the bonding surface is not strong, and improving the axial force can enhance the interaction force between interfaces to achieve a reliable connection.
Author Contributions
Z.Z. (Zaolong Zhao), X.L. and C.J. designed and planned the experiment. X.L. made the tests, analyzed the data, and wrote the paper. Z.Z. (Zhongke Zhang) modified the paper. H.Z. provided the funding acquisition. All authors have read and agreed to the published version of the manuscript.
Funding
This research was funded by the Aviation Science Fund of China (No. 201611U2001) and Major Science and Technology Project of Gansu Province (No. 18ZD2GC013).
Conflicts of Interest
The authors declare no conflict of interest.
References
- Kazuhiro, N. Friction stir welding of magnesium alloys. Weld. Int. 2009, 23, 328–332. [Google Scholar]
- Li, K.; Liu, X.-M.; Zhao, Y. Research Status and Prospect of Friction Stir Processing Technology. Coatings 2019, 9, 129. [Google Scholar] [CrossRef] [Green Version]
- Magalhães, V.M.; Leitão, C.; Rodrigues, D. Friction stir welding industrialisation and research status. Sci. Technol. Weld. Join. 2017, 23, 400–409. [Google Scholar] [CrossRef]
- Beamish, K. Friction taper plug welding of 10mm AA6082-T6. Wti Rep. 2003. No. 768. [Google Scholar]
- Li, W.; Jiang, D.; Yang, L.; Pan, J.; Qu, R.; Sun, T. Numerical simulation of temperature field and prediction of microstructure in friction hydro pillar processing. J. Mater. Process. Technol. 2018, 252, 370–380. [Google Scholar] [CrossRef]
- Sun, Y.; Fujii, H.; Sato, Y.; Morisada, Y. Friction stir spot welding of SPCC low carbon steel plates at extremely low welding temperature. J. Mater. Sci. Technol. 2019, 35, 733–741. [Google Scholar] [CrossRef]
- Hartley Paula, J. Friction plug weld repair of space shuttle external tank. Weld. Metal. Fabric. 2000, 68, 6–8. [Google Scholar]
- Metz, D.; Barkey, M.E. Fatigue behavior of friction plug welds in 2195 Al–Li alloy. Int. J. Fatigue 2012, 43, 178–187. [Google Scholar] [CrossRef]
- Du, B.; Cui, L.; Yang, X.; Wang, D.; Sun, Z. Weakening mechanism and tensile fracture behavior of AA 2219-T87 friction plug welds. Mater. Sci. Eng. A 2017, 693, 129–135. [Google Scholar] [CrossRef]
- Hynes, N.R.J.; Velu, P.S.; Nithin, A.M. Friction push plug welding in airframe structures using Ti-6Al-4V plug. J. Braz. Soc. Mech. Sci. Eng. 2018, 40, 158. [Google Scholar] [CrossRef]
- Cui, L.; Yang, X.; Wang, D.; Hou, X.; Cao, J.; Xu, W. Friction taper plug welding for S355 steel in underwater wet conditions: Welding performance, microstructures and mechanical properties. Mater. Sci. Eng. A 2014, 611, 15–28. [Google Scholar] [CrossRef]
- Du, B.; Yang, X.; Liu, K.; Sun, Z.; Wang, D. Effects of supporting plate hole and welding force on weld formation and mechanical property of friction plug joints for AA2219-T87 friction stir welds. Weld. World 2019, 63, 989–1000. [Google Scholar] [CrossRef]
- Metz, D.F.; Weishaupt, E.R.; Barkey, M.E.; Fairbee, B.S. A Microstructure and Microhardness Characterization of a Friction Plug Weld in Friction Stir Welded 2195 Al-Li. J. Eng. Mater. Technol. 2012, 134, 021005. [Google Scholar] [CrossRef]
- Landell, R.; Kanan, L.F.; Buzzatti, D.; Vicharapu, B.; De, A.; Clarke, T. Material flow during friction hydro-pillar processing. Sci. Technol. Weld. Join. 2019, 25, 228–234. [Google Scholar] [CrossRef]
- Cui, L.; Yang, X.; Wang, D.; Cao, J.; Xu, W. Experimental study of friction taper plug welding for low alloy structure steel: Welding process, defects, microstructures and mechanical properties. Mater. Des. 2014, 62, 271–281. [Google Scholar] [CrossRef]
- Gao, J.; Yang, L.; Cui, L.; Lu, P.; Yang, J.; Gao, Y. Improving the Weld Formation and Mechanical Properties of the AA-5A06 Friction Pull Plug Welds by Axial Force Control. Acta Met. Sin. English Lett. 2020, 33, 828–838. [Google Scholar] [CrossRef]
- Du, B.; Yang, X.Q.; Tang, W.; Sun, Z.; Wang, D. Numerical analyses of material flows and thermal processes during friction plug welding for AA2219 aluminum alloy. J. Mater. Process. Technol. 2020, 278, 116466. [Google Scholar] [CrossRef]
- Wang, Z.; Teng, J.; Wang, D.P.; Cui, L.; Liu, H.; Yang, J.; Zhang, Y.; Zhu, H. Observations of repair process by friction stitch welding in simulated wet conditions—Flaws, microstructure and hardness evolutions in overlapping welds. J. Mater. Process. Technol. 2019, 264, 220–233. [Google Scholar] [CrossRef]
- Mohammadzadeh, A.; Azadbeh, M.; Danninger, H. New concept in analysis of supersolidus liquid phase sintering of alpha brass. Powder Met. 2014, 58, 123–132. [Google Scholar] [CrossRef]
- Johannes, A.Ö.; Manoj, K.; Andreas, S.; Sabine, S.; Gilles, R.B. Secondary precipitation during homogenization of Al-Mg-Si alloys: Influence on high temperature flow stress. Mater. Sci. Eng. 2017, 687, 175–180. [Google Scholar]
- Yan, Y.; Shen, Y.; Liu, W.; Li, J.; Gao, J. Friction plug welding of glass fiber reinforced PA6 sheets using a newly designed tool. J. Manuf. Process. 2019, 45, 614–623. [Google Scholar] [CrossRef]
- Li, J.; Shen, Y.; Yan, Y.; Tang, J.; Hou, W.; Huang, G.; Liu, W. Consumable friction plug welding of TC4 plate: Parameters, microstructures, and mechanical properties. Mater. Res. Express 2019, 6, 116520. [Google Scholar] [CrossRef]
- Du, B.; Sun, Z.; Yang, X.; Cui, L.; Song, J.; Zhang, Z. Characteristics of friction plug welding to 10 mm thick AA2219-T87 sheet: Weld formation, microstructure and mechanical property. Mater. Sci. Eng. A 2016, 654, 21–29. [Google Scholar] [CrossRef]
Figure 1.
Plug and hole structure diagram and temperature measurement location.
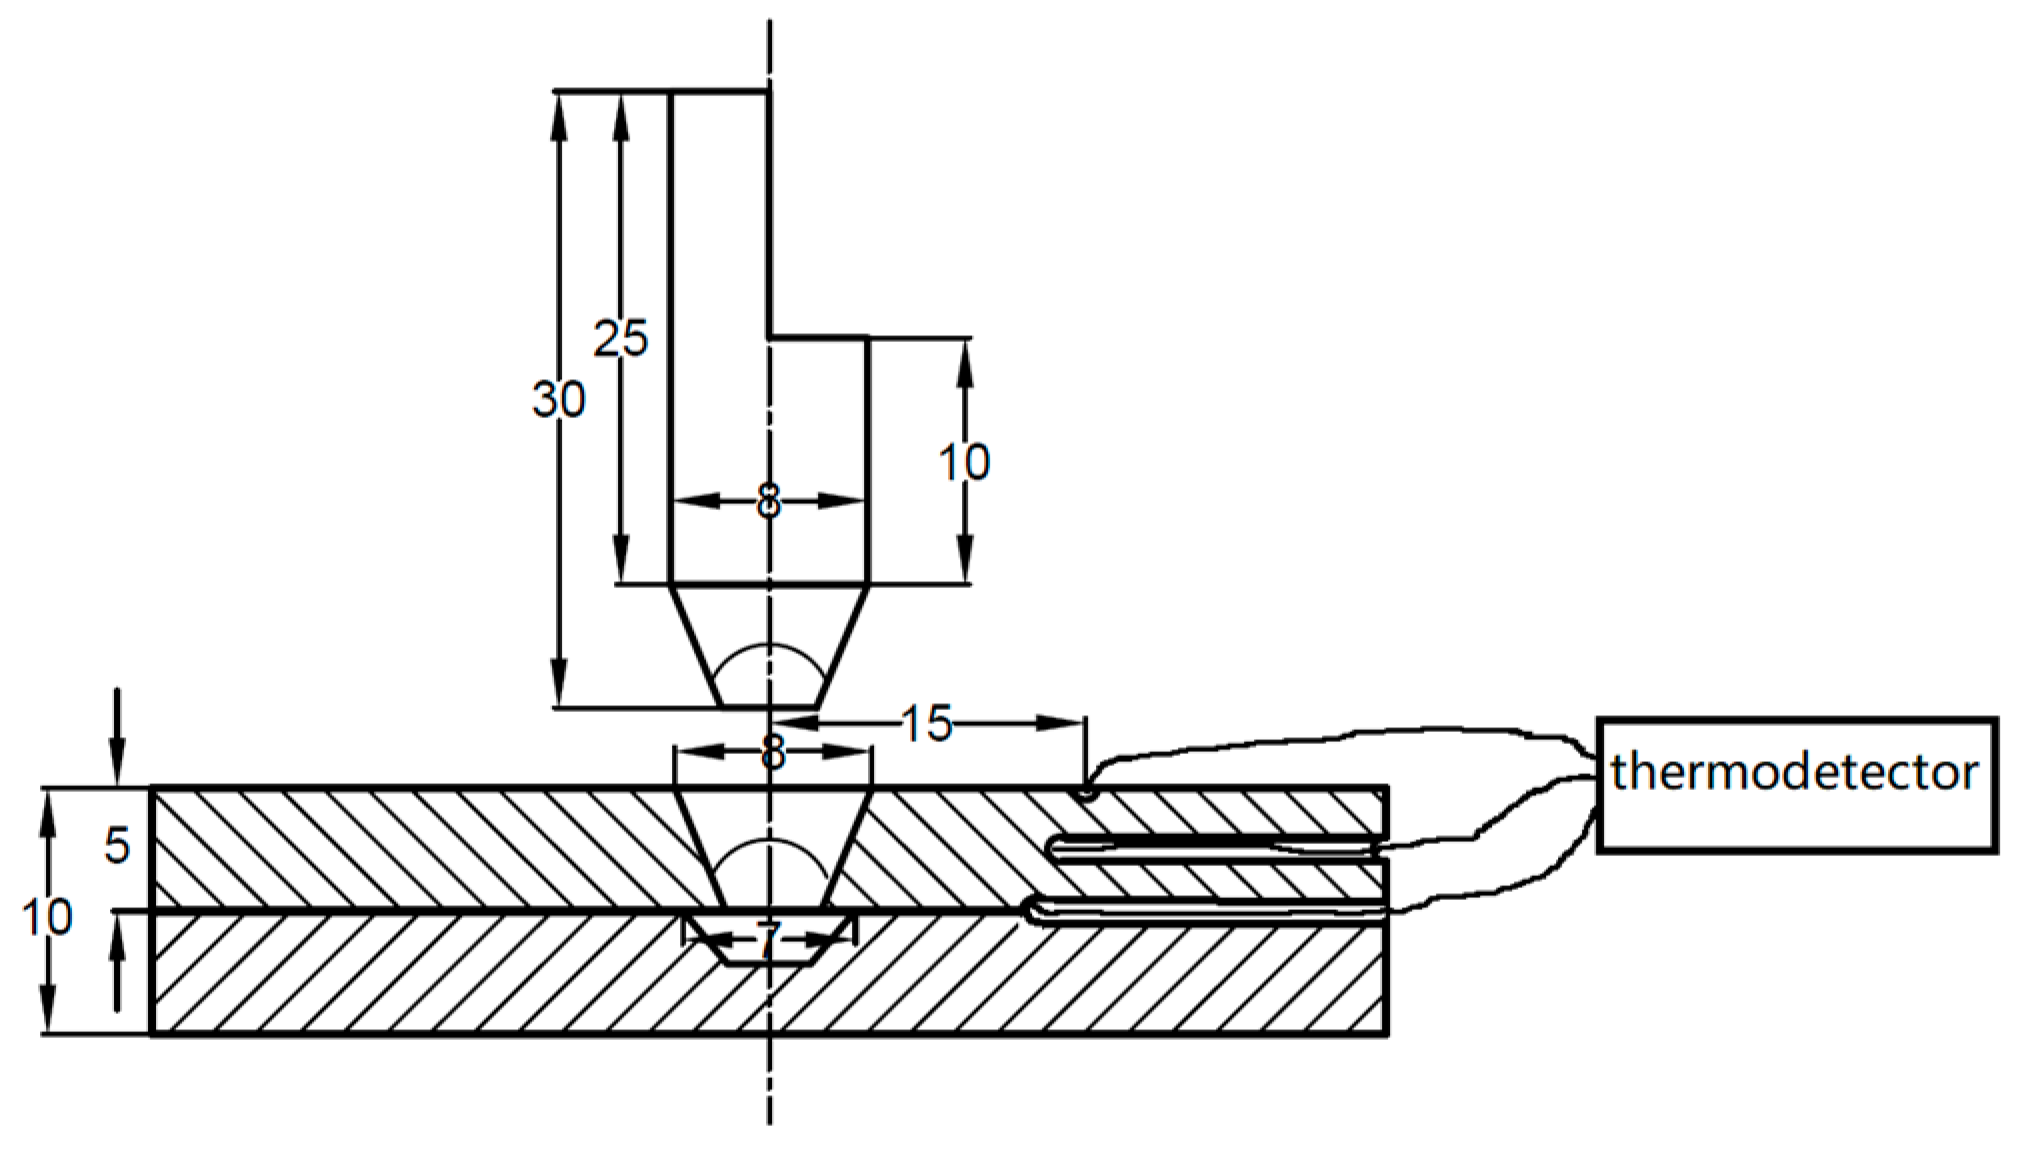
Figure 2.
Schematic diagram of friction plug welding (FPW) process: (a) preheat phase, (b) friction feed phase, (c) upsetting phase, (d) pressure-holding phase, (e) disengagement phase.
Figure 2.
Schematic diagram of friction plug welding (FPW) process: (a) preheat phase, (b) friction feed phase, (c) upsetting phase, (d) pressure-holding phase, (e) disengagement phase.

Figure 3.
(a) Normal plots of response residuals for tensile strength (TS) and (b) actual vs. predicted values of the response for TS.
Figure 3.
(a) Normal plots of response residuals for tensile strength (TS) and (b) actual vs. predicted values of the response for TS.

Figure 4.
Contour plots showing the effect of the parameters on the tensile strength of the FPW joints: (a) interaction effect of the rotational speed and welding time, (b) interaction effect of the rotational speed and upsetting speed, and (c) interaction effect of the upsetting speed and welding time.
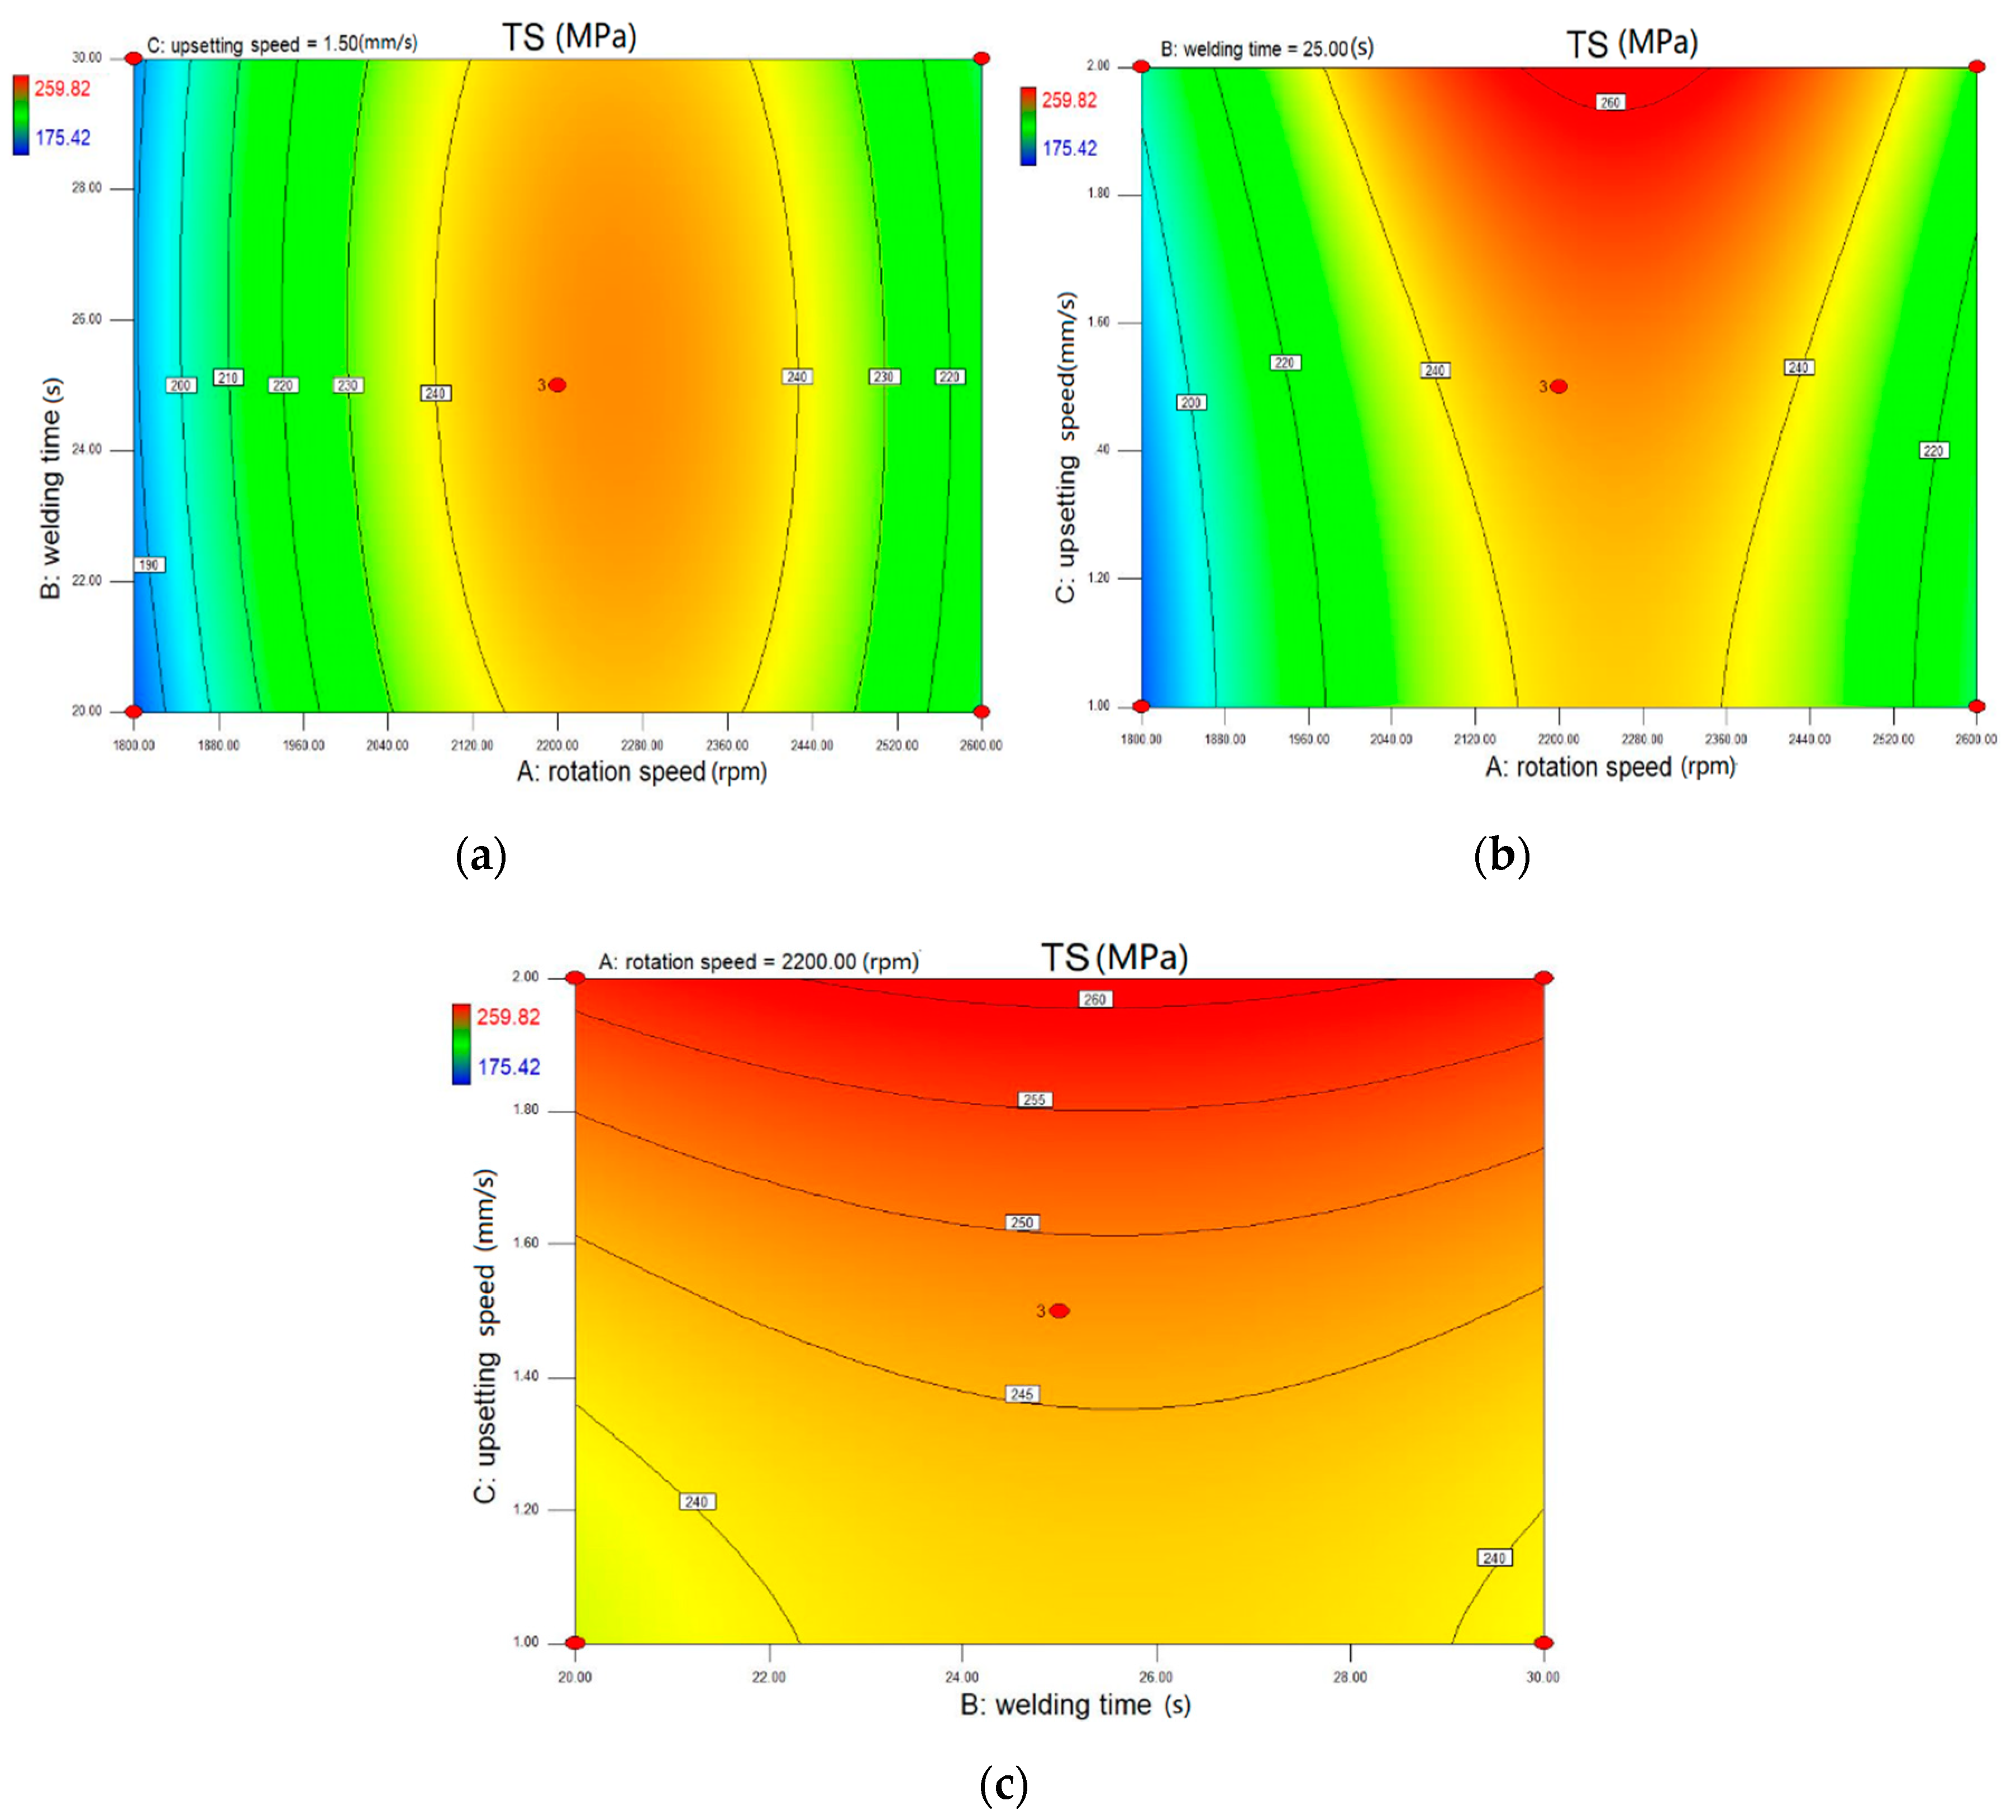
Figure 5.
Macrograph of FPW joint welded by optimal condition.
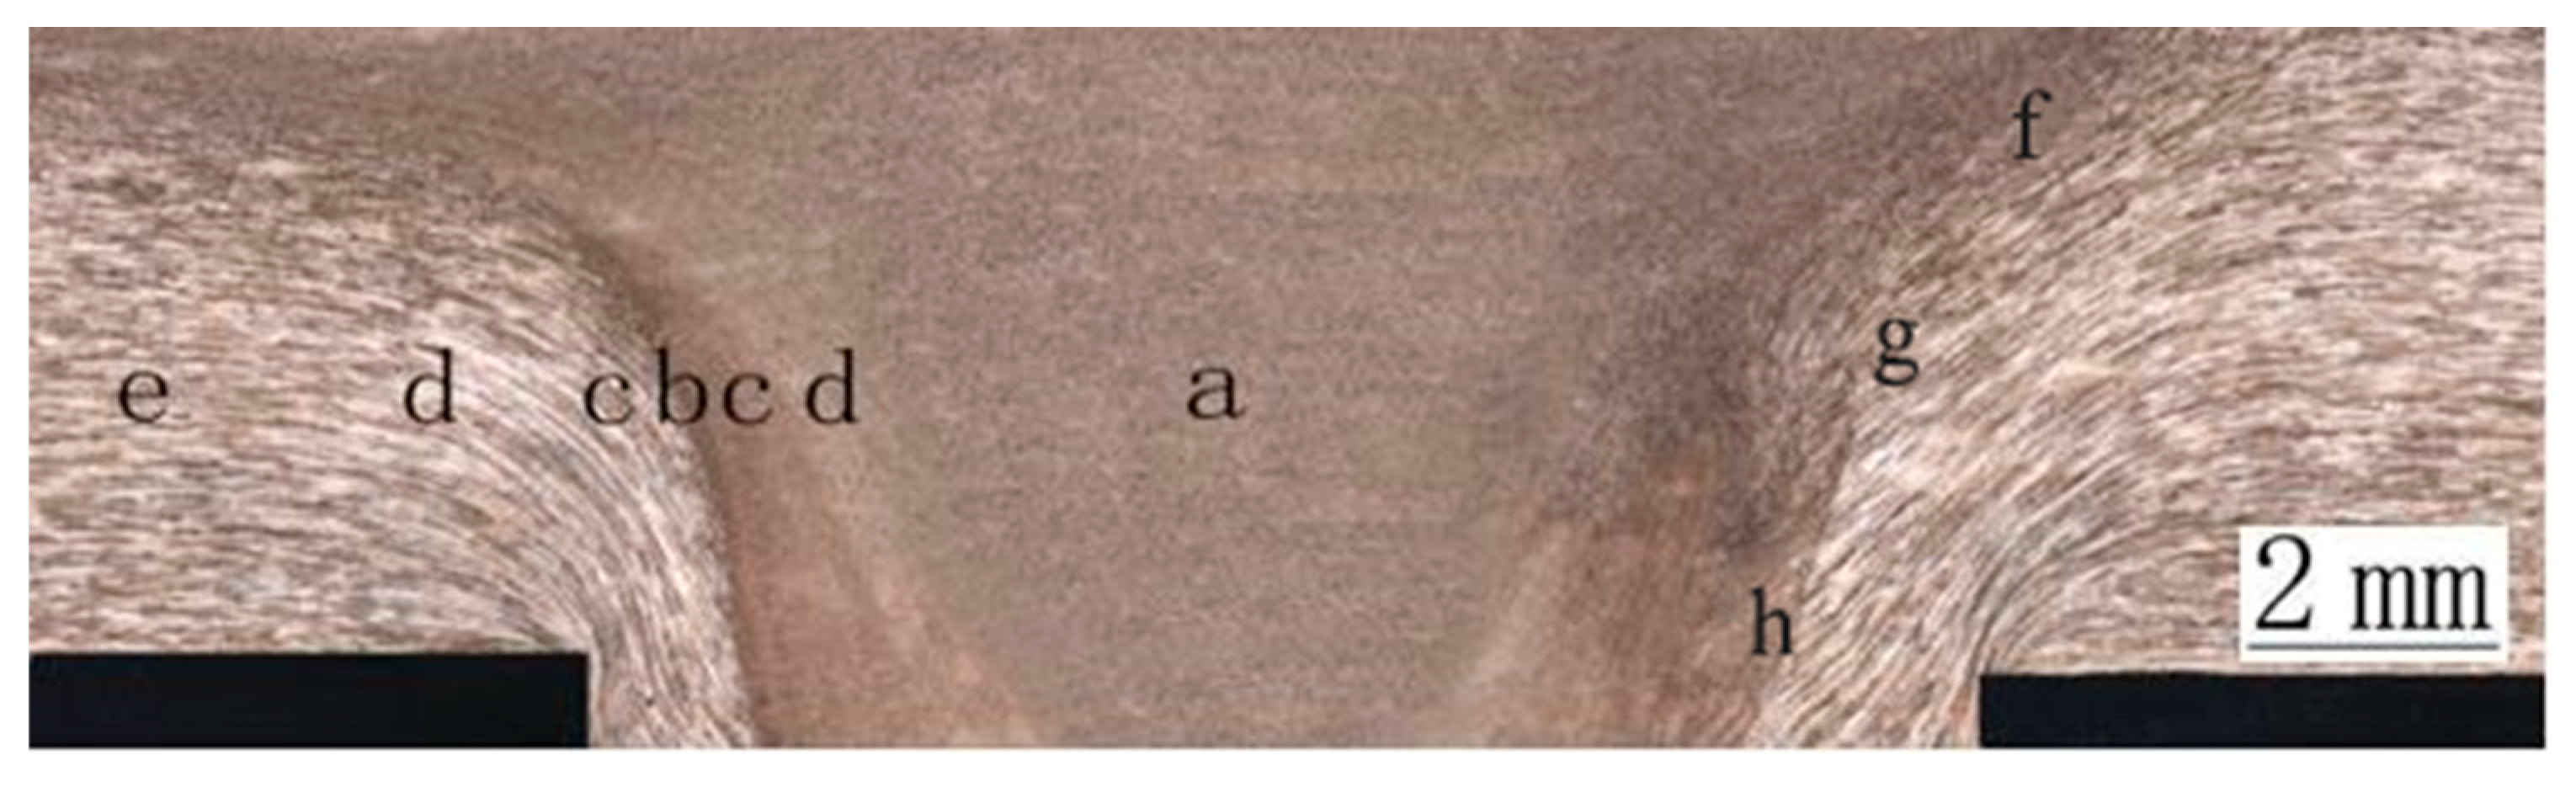
Figure 6.
Microstructure in different regions of the joint welded by optimal condition: (a) plug zone (PM), (b) friction interface zone (FIZ), (c) thermo-mechanically affected zone (TMAZ), (d) heat affected zone (HAZ), (e) base material (BM), (f–h) bonding interface.
Figure 6.
Microstructure in different regions of the joint welded by optimal condition: (a) plug zone (PM), (b) friction interface zone (FIZ), (c) thermo-mechanically affected zone (TMAZ), (d) heat affected zone (HAZ), (e) base material (BM), (f–h) bonding interface.
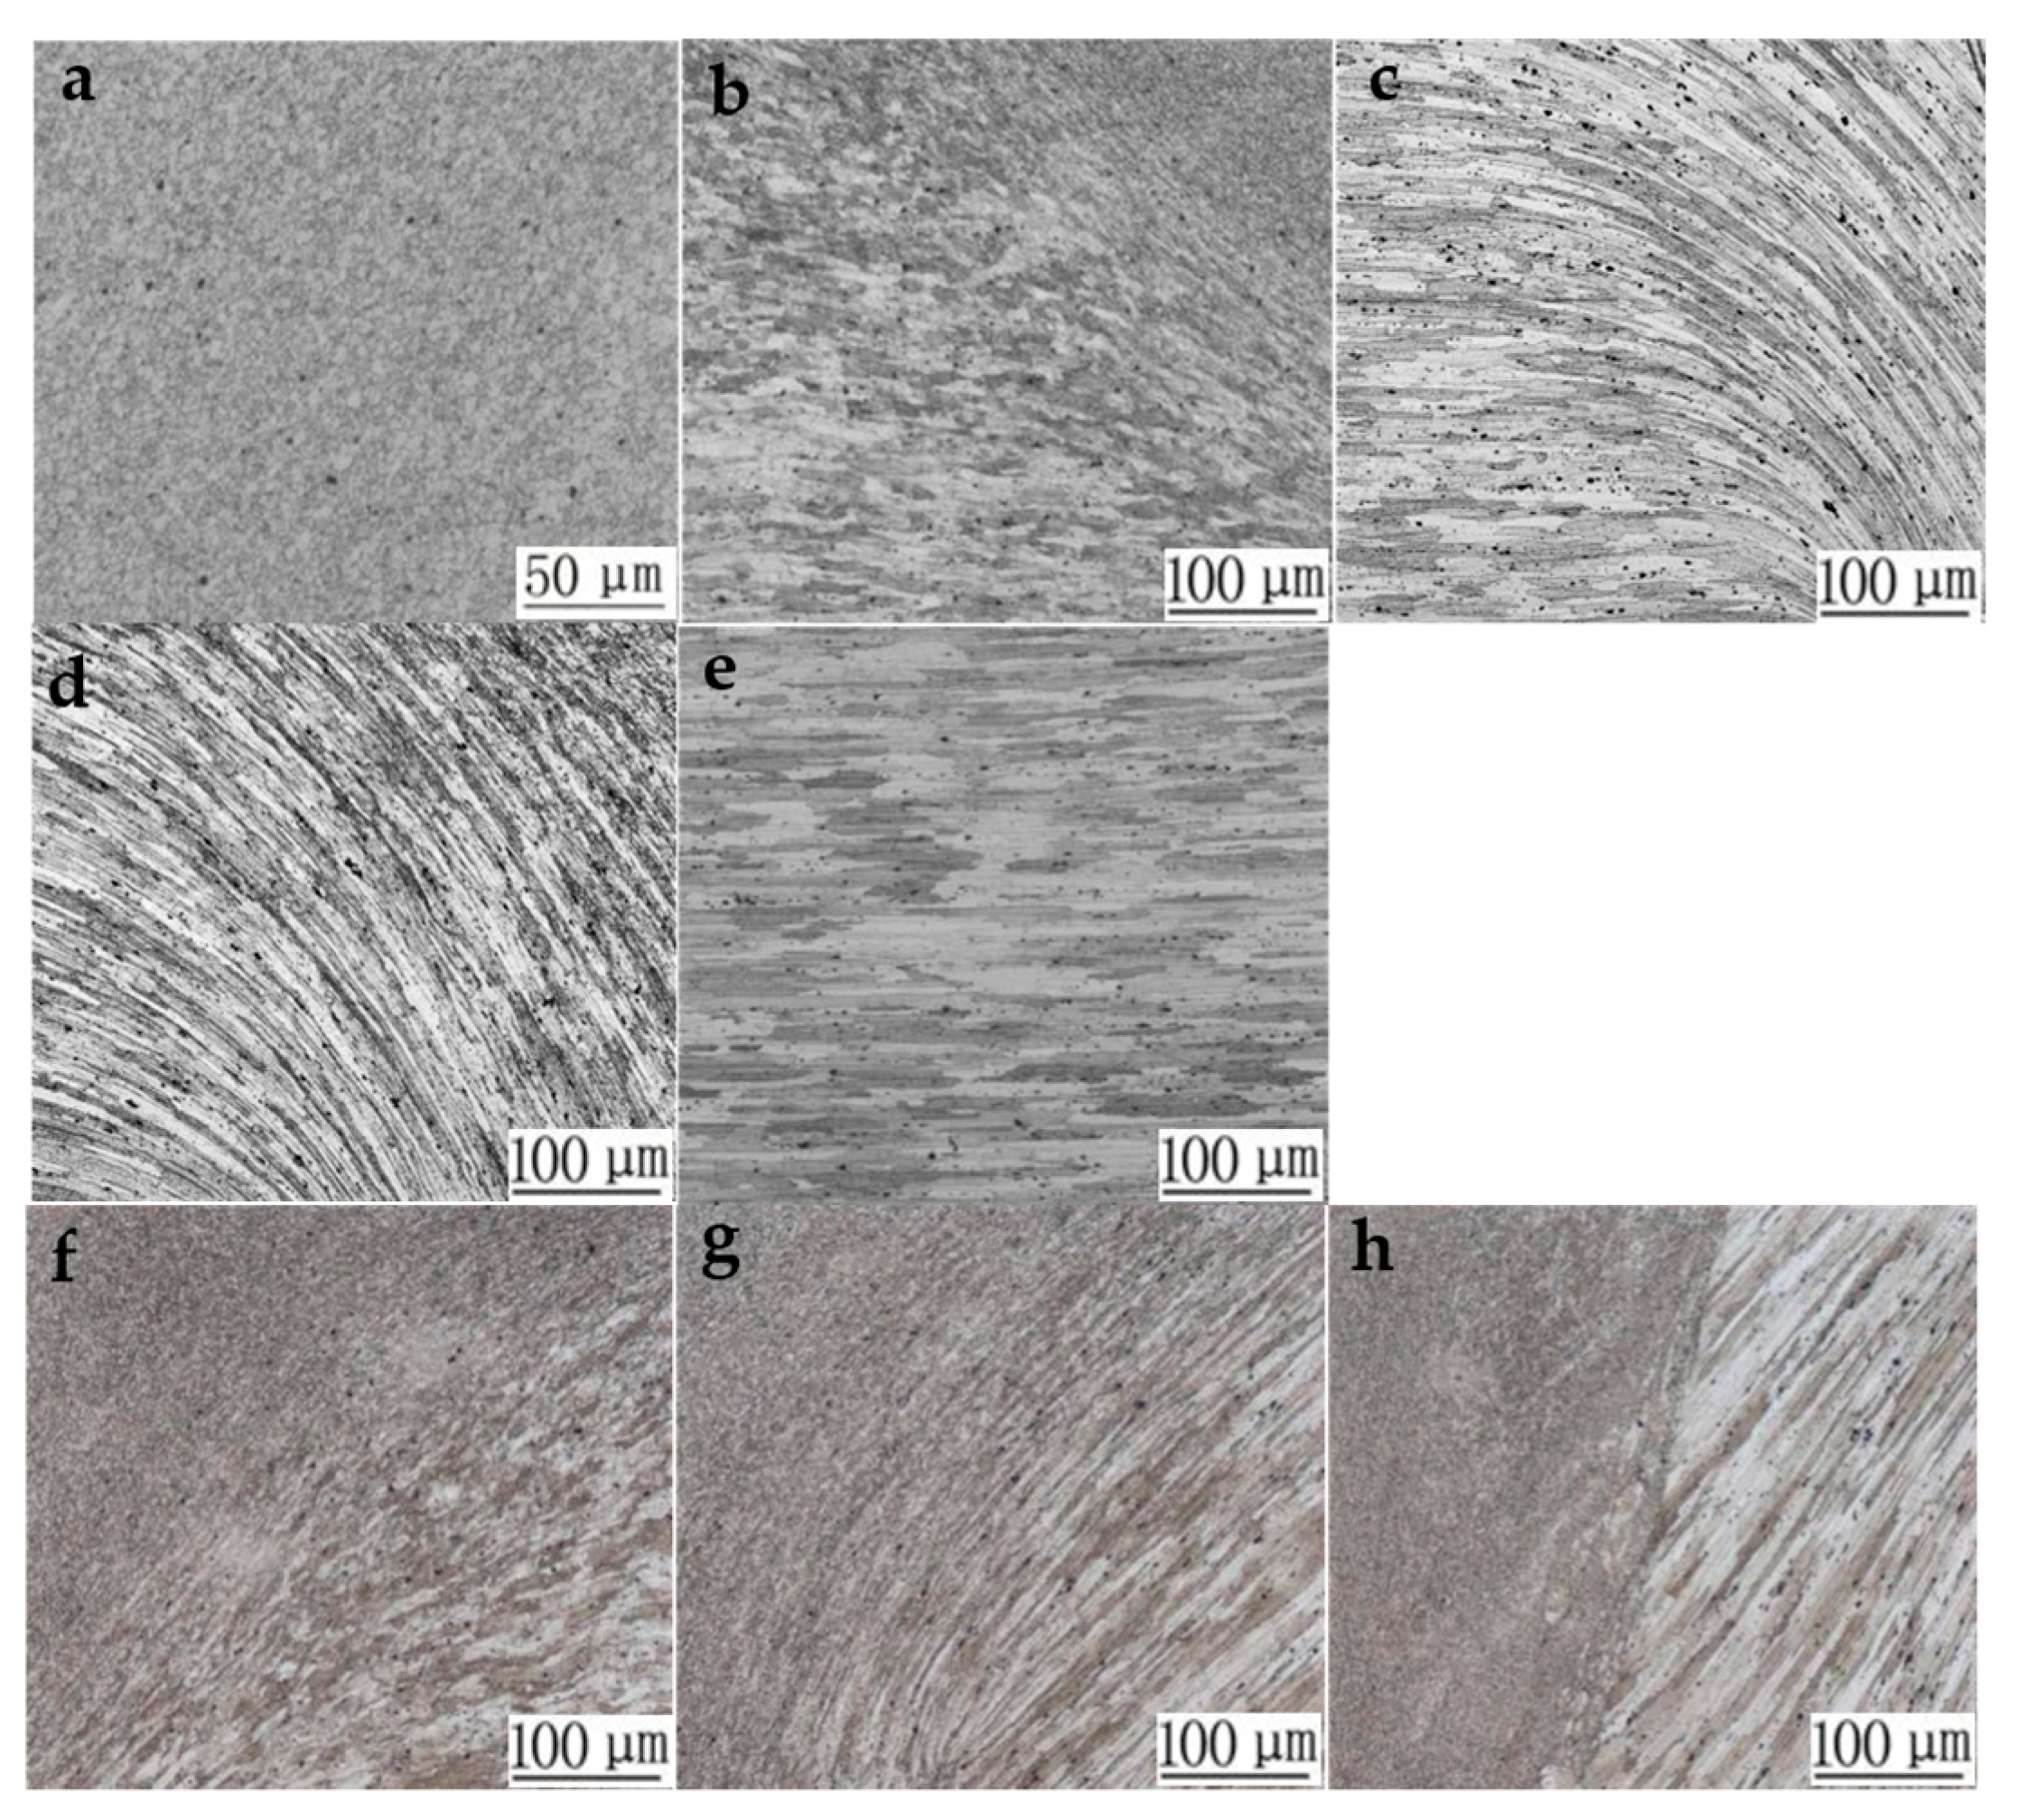
Figure 7.
Scanning position and second phase distribution: (a) scanning electron microscope observation position, (b) area A, (c) area B, (d) area C, (e) area D, (f) area E, (g) area F, (h) area G, (i) area H, (j) area I, (k) area J, and (l) area K.
Figure 7.
Scanning position and second phase distribution: (a) scanning electron microscope observation position, (b) area A, (c) area B, (d) area C, (e) area D, (f) area E, (g) area F, (h) area G, (i) area H, (j) area I, (k) area J, and (l) area K.
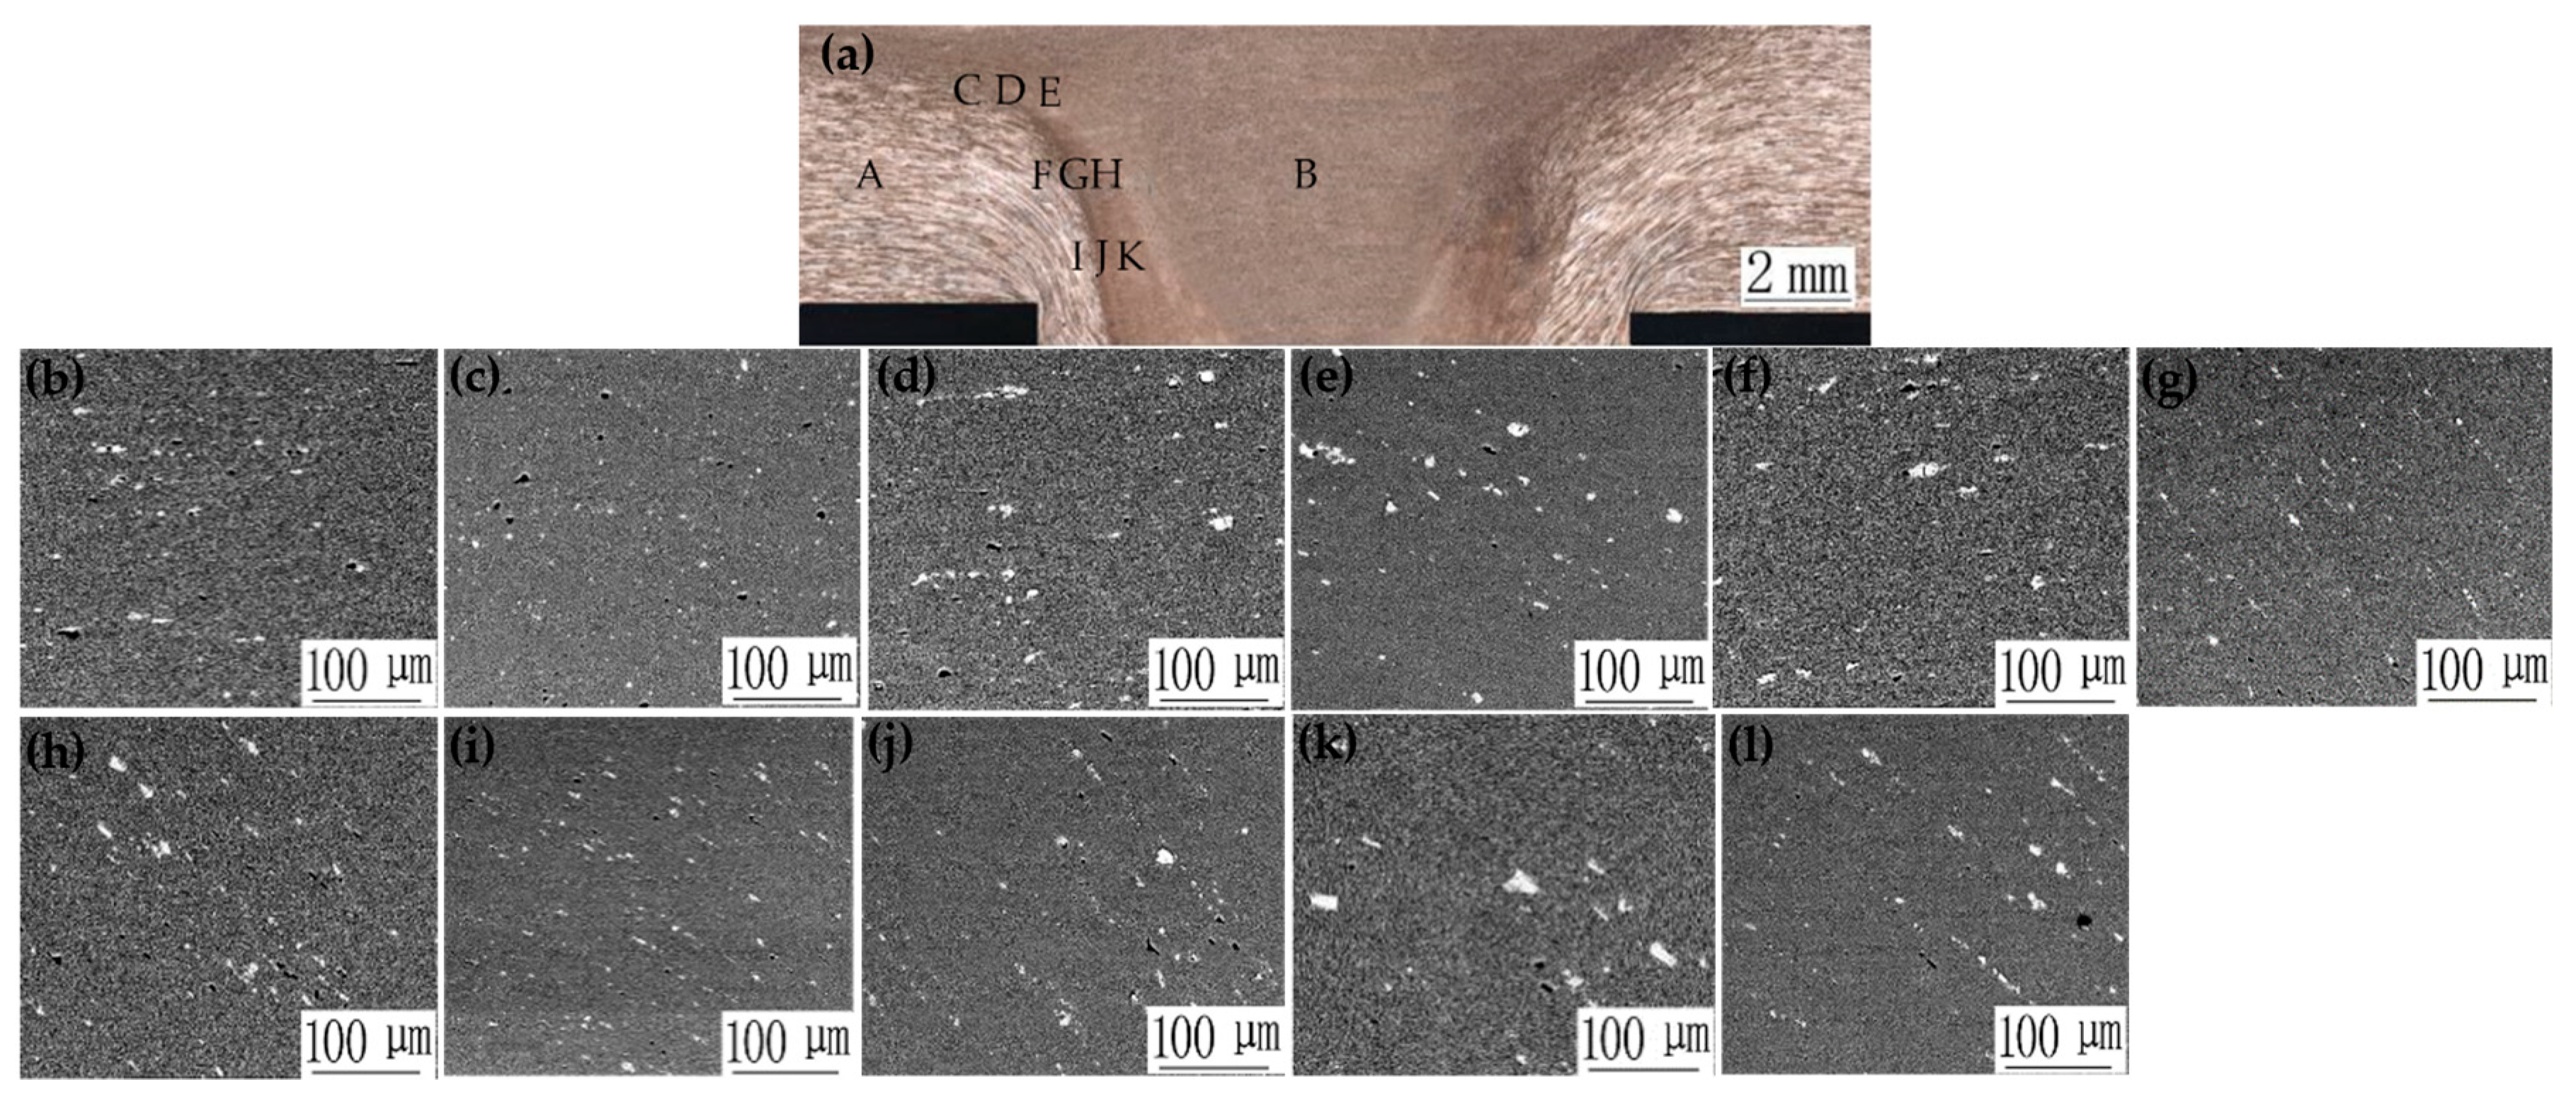
Figure 8.
Fluidity of joint metal at different rotational speeds when upsetting speed was 2 mm/s. (a) 1800 rpm, (b) 2200 rpm, and (c) 2600 rpm.
Figure 8.
Fluidity of joint metal at different rotational speeds when upsetting speed was 2 mm/s. (a) 1800 rpm, (b) 2200 rpm, and (c) 2600 rpm.

Figure 9.
Hardness distribution of FPW joint.
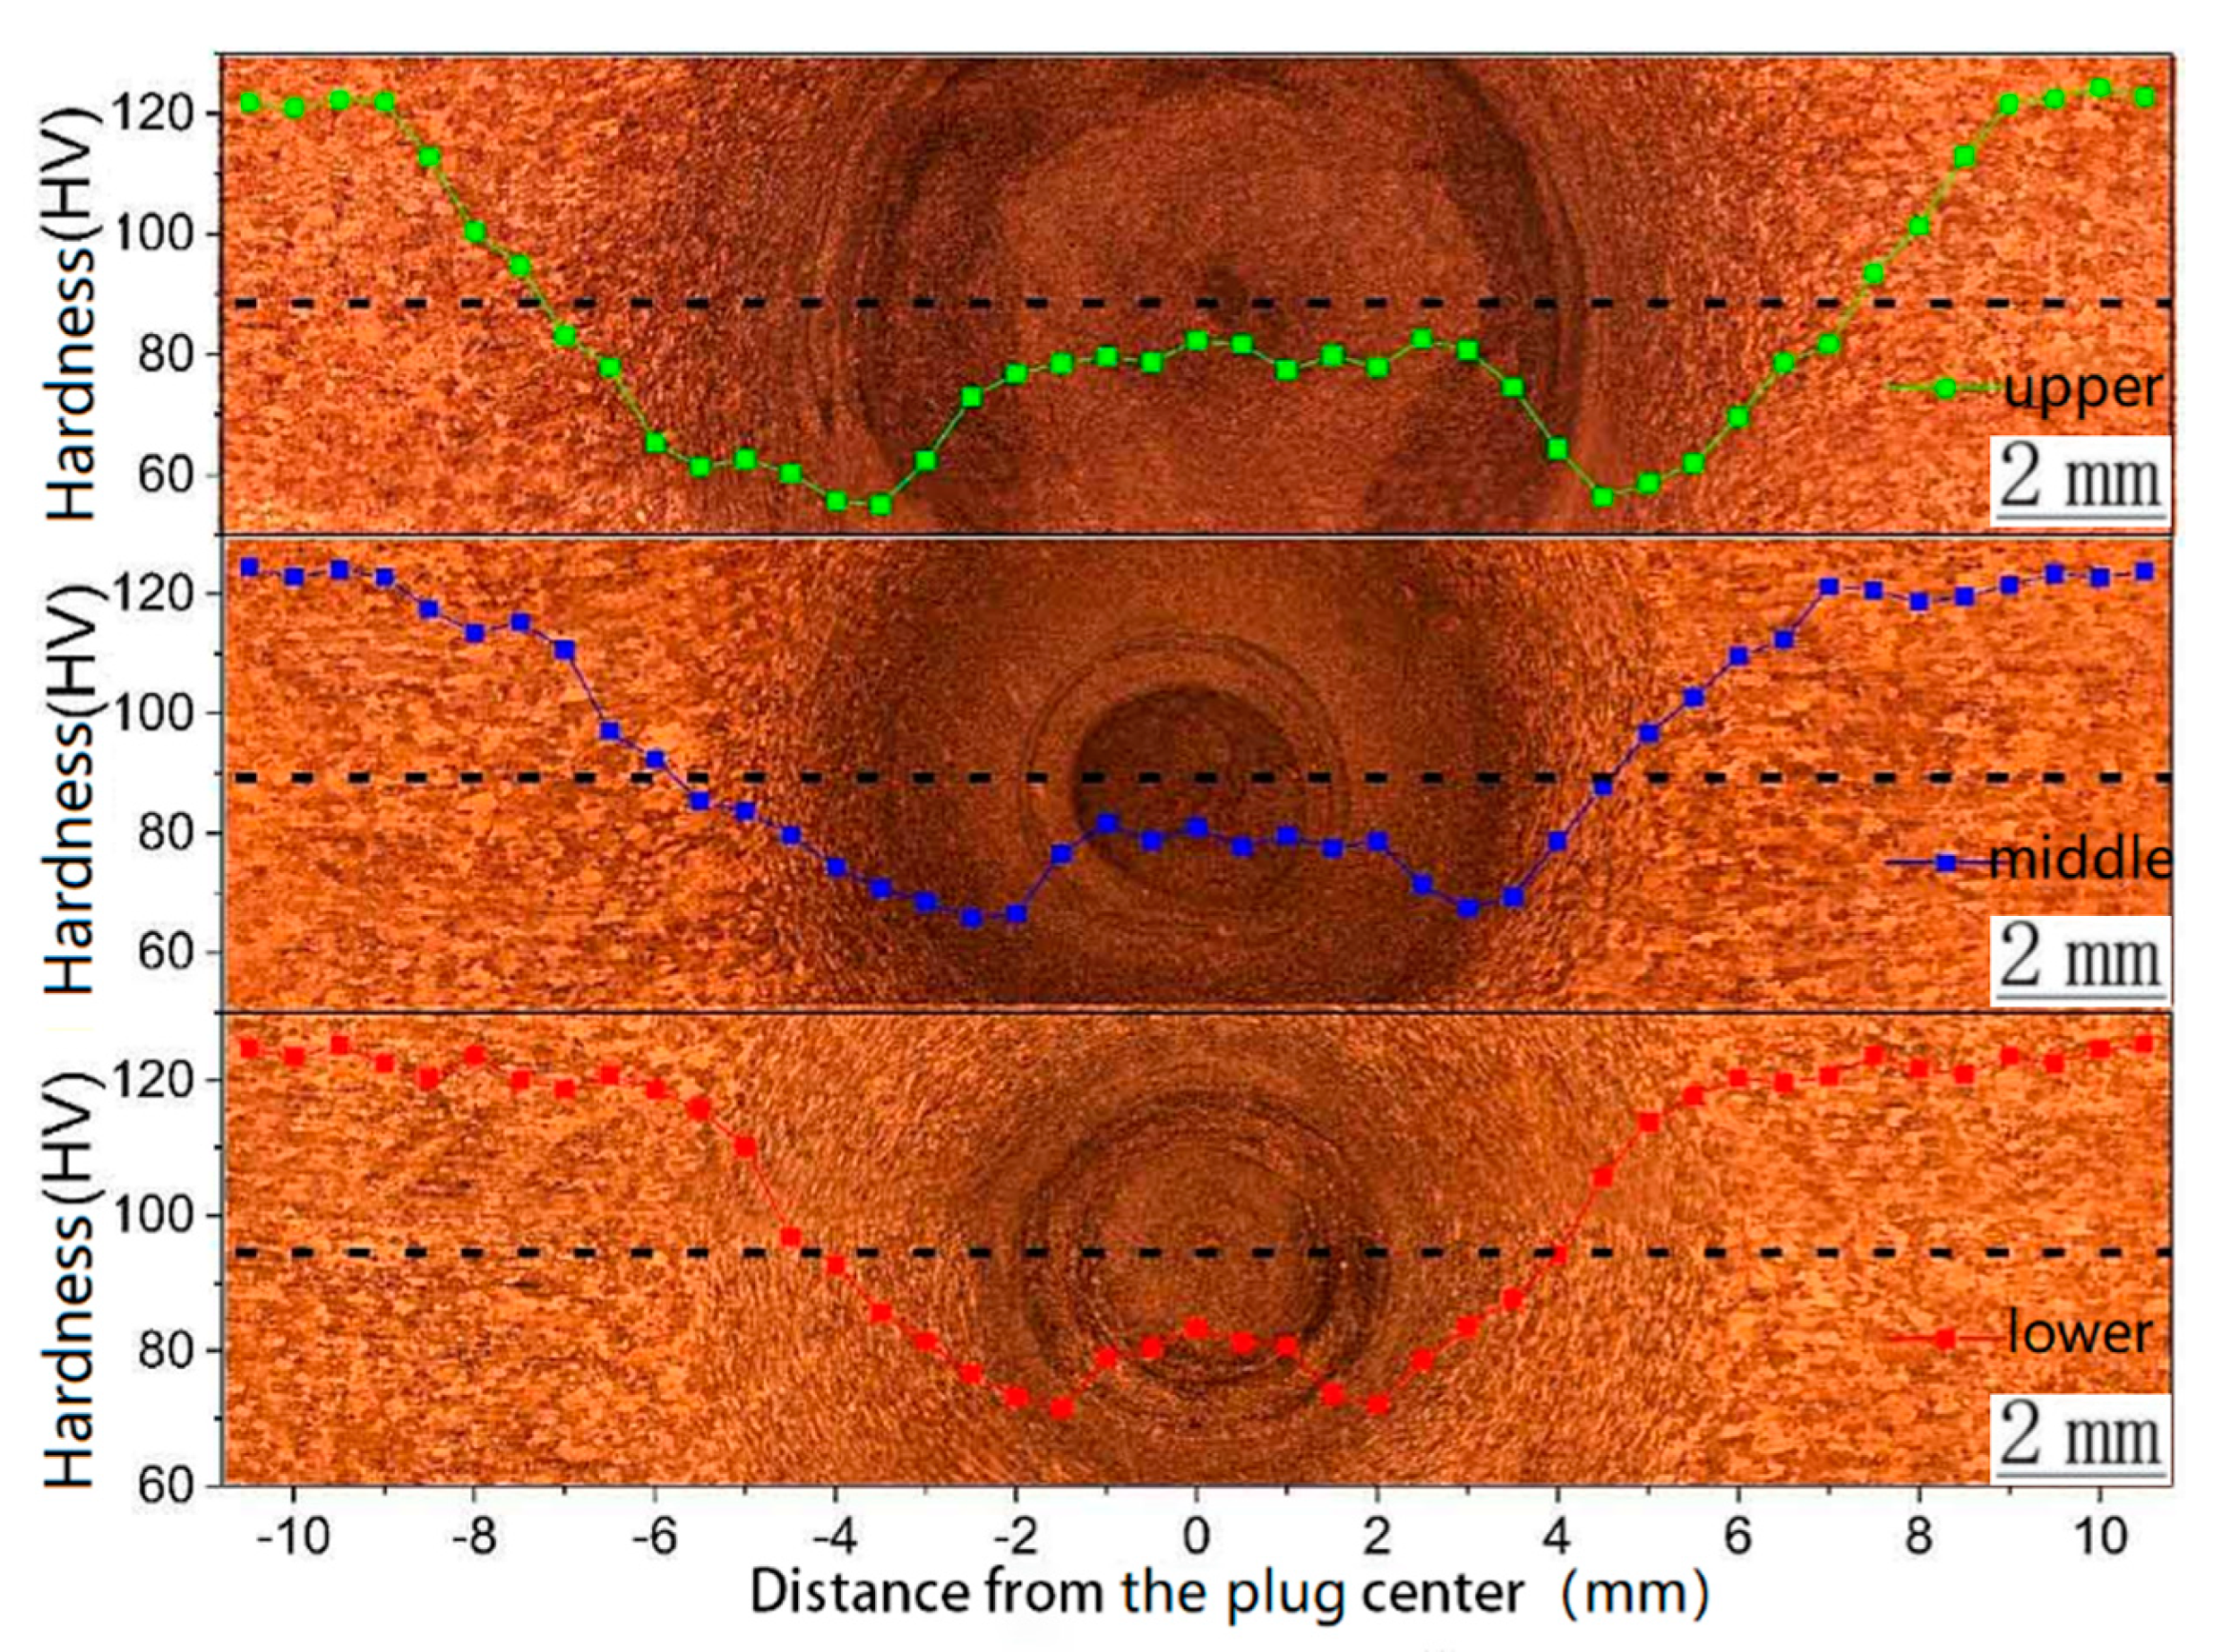
Figure 10.
Axial force test result during FPW.

Figure 11.
Defects of the FPW joint with a rotating speed of 2200 rpm and an upsetting speed of 1 mm/s: (a) macrograph of FPW joint, (b) left side, and (c) right side.
Figure 11.
Defects of the FPW joint with a rotating speed of 2200 rpm and an upsetting speed of 1 mm/s: (a) macrograph of FPW joint, (b) left side, and (c) right side.
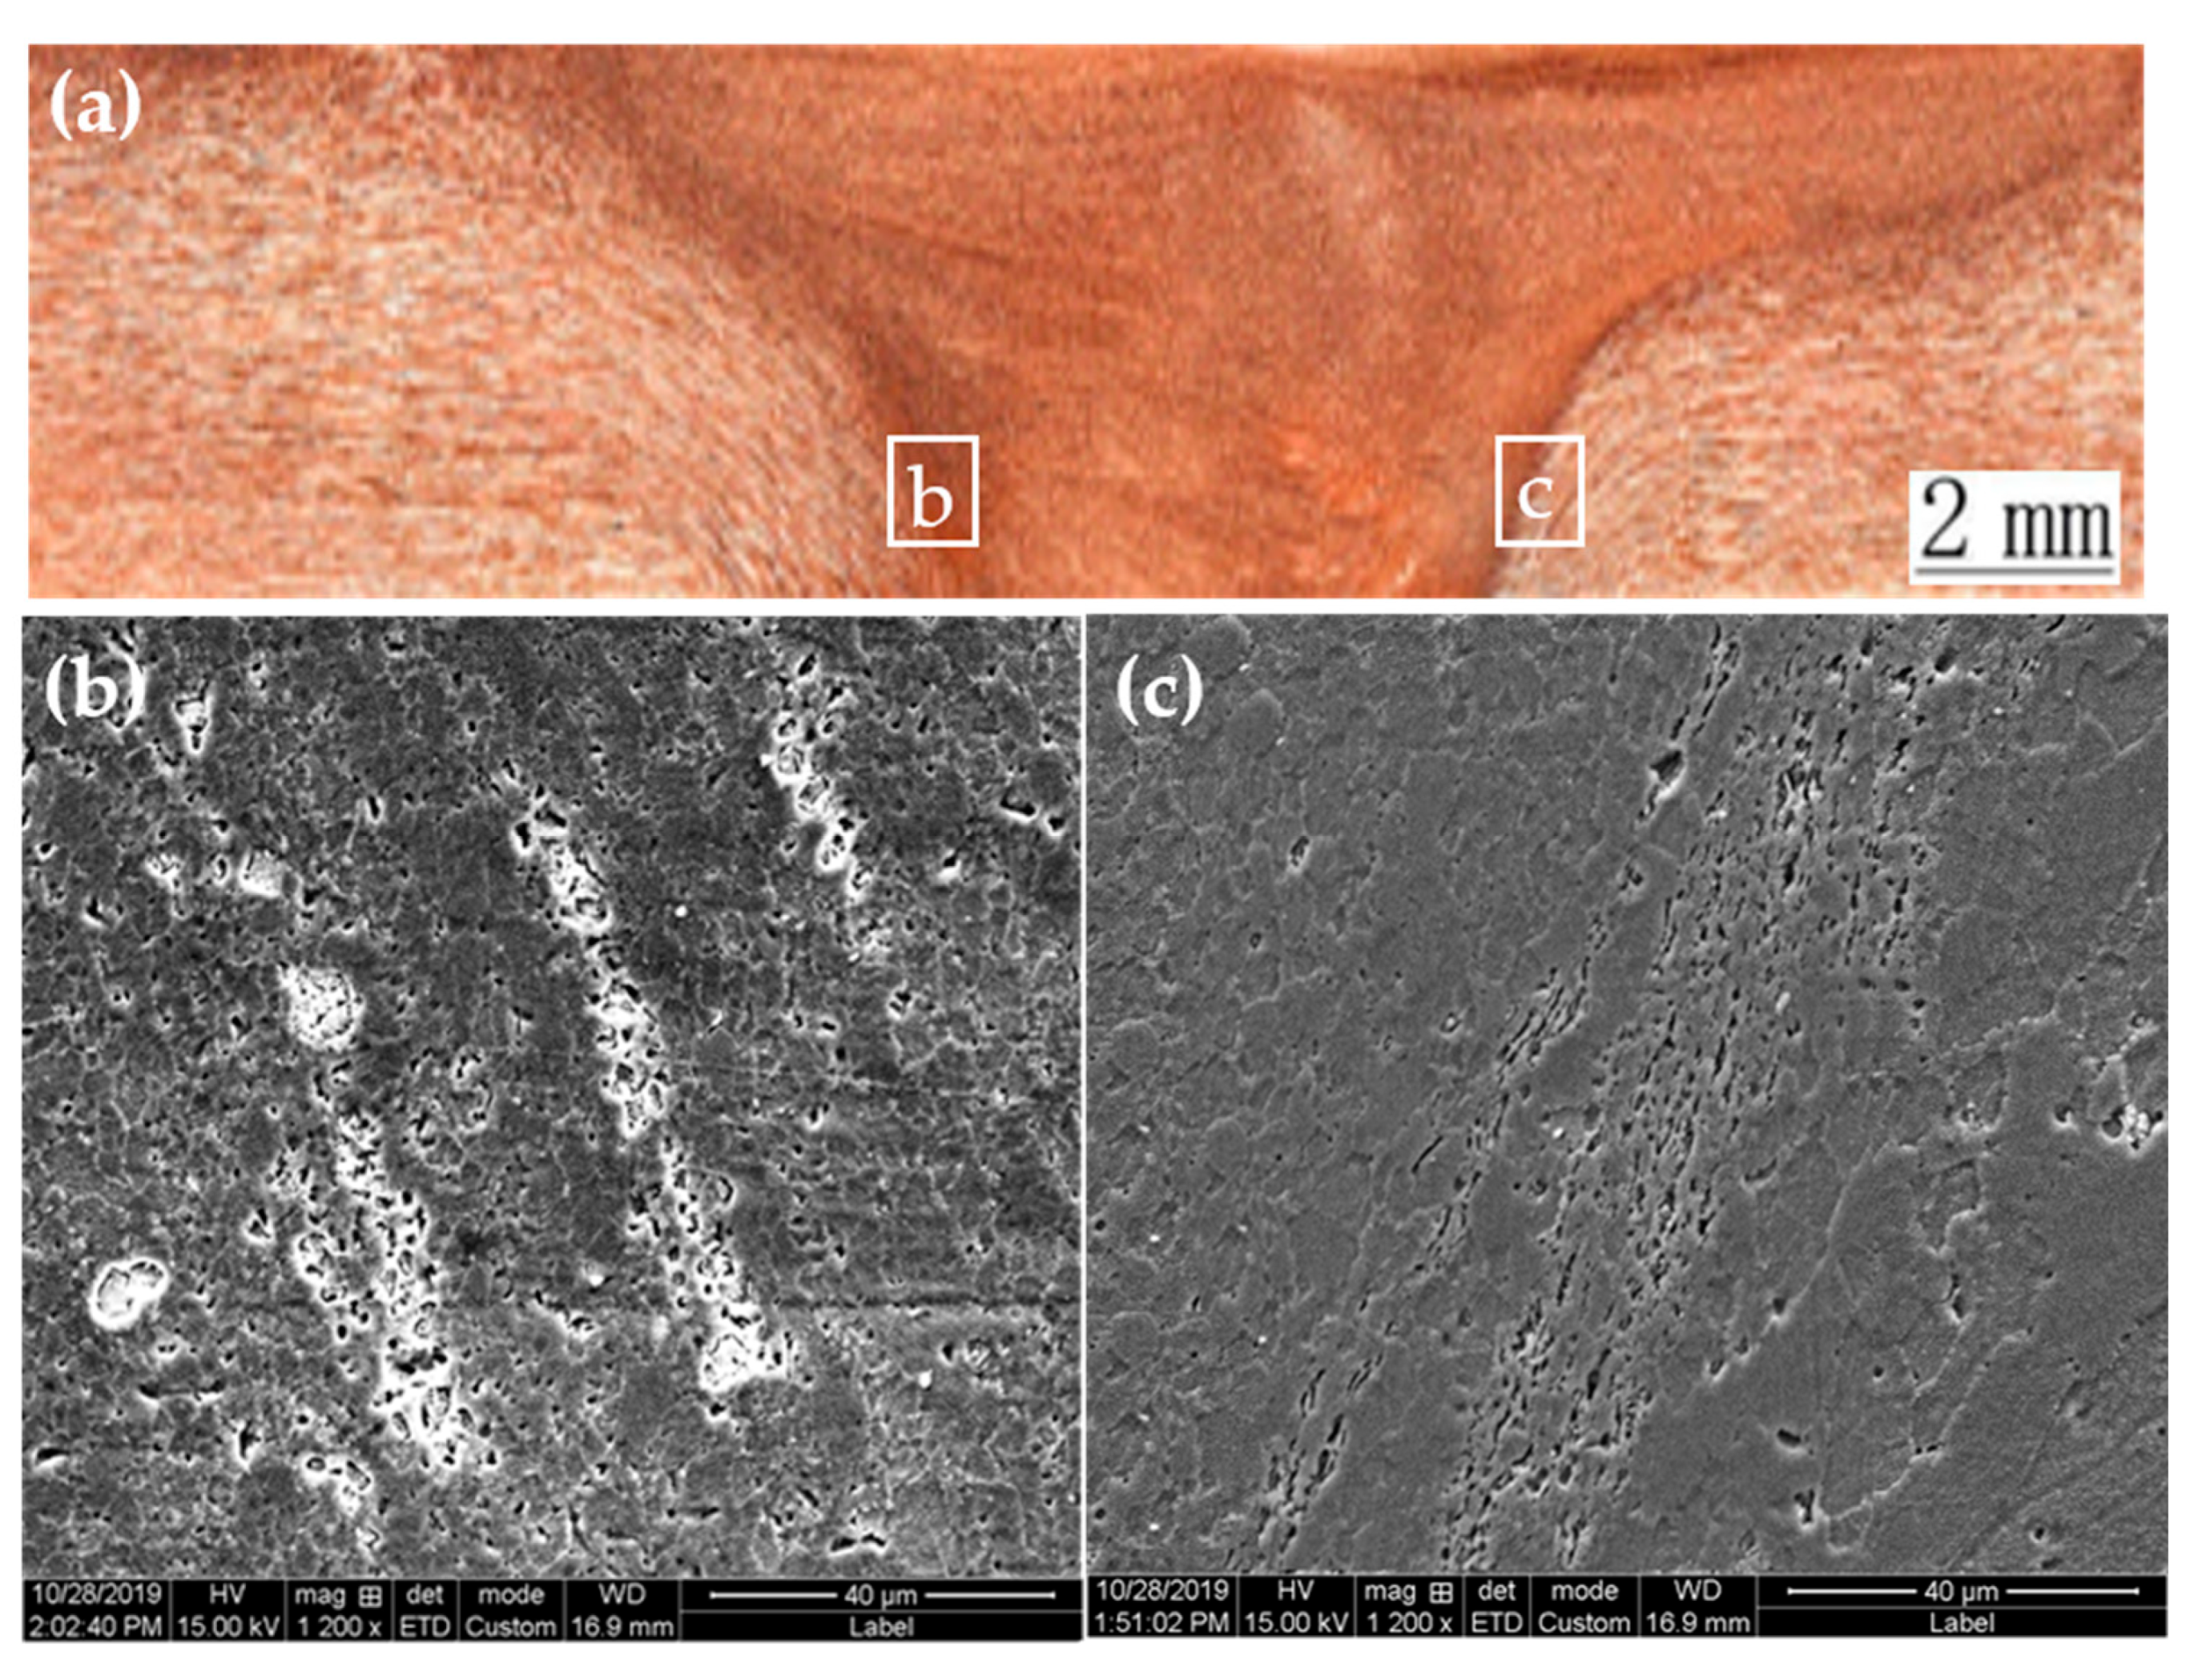
Figure 12.
Temperature profile during FPW.
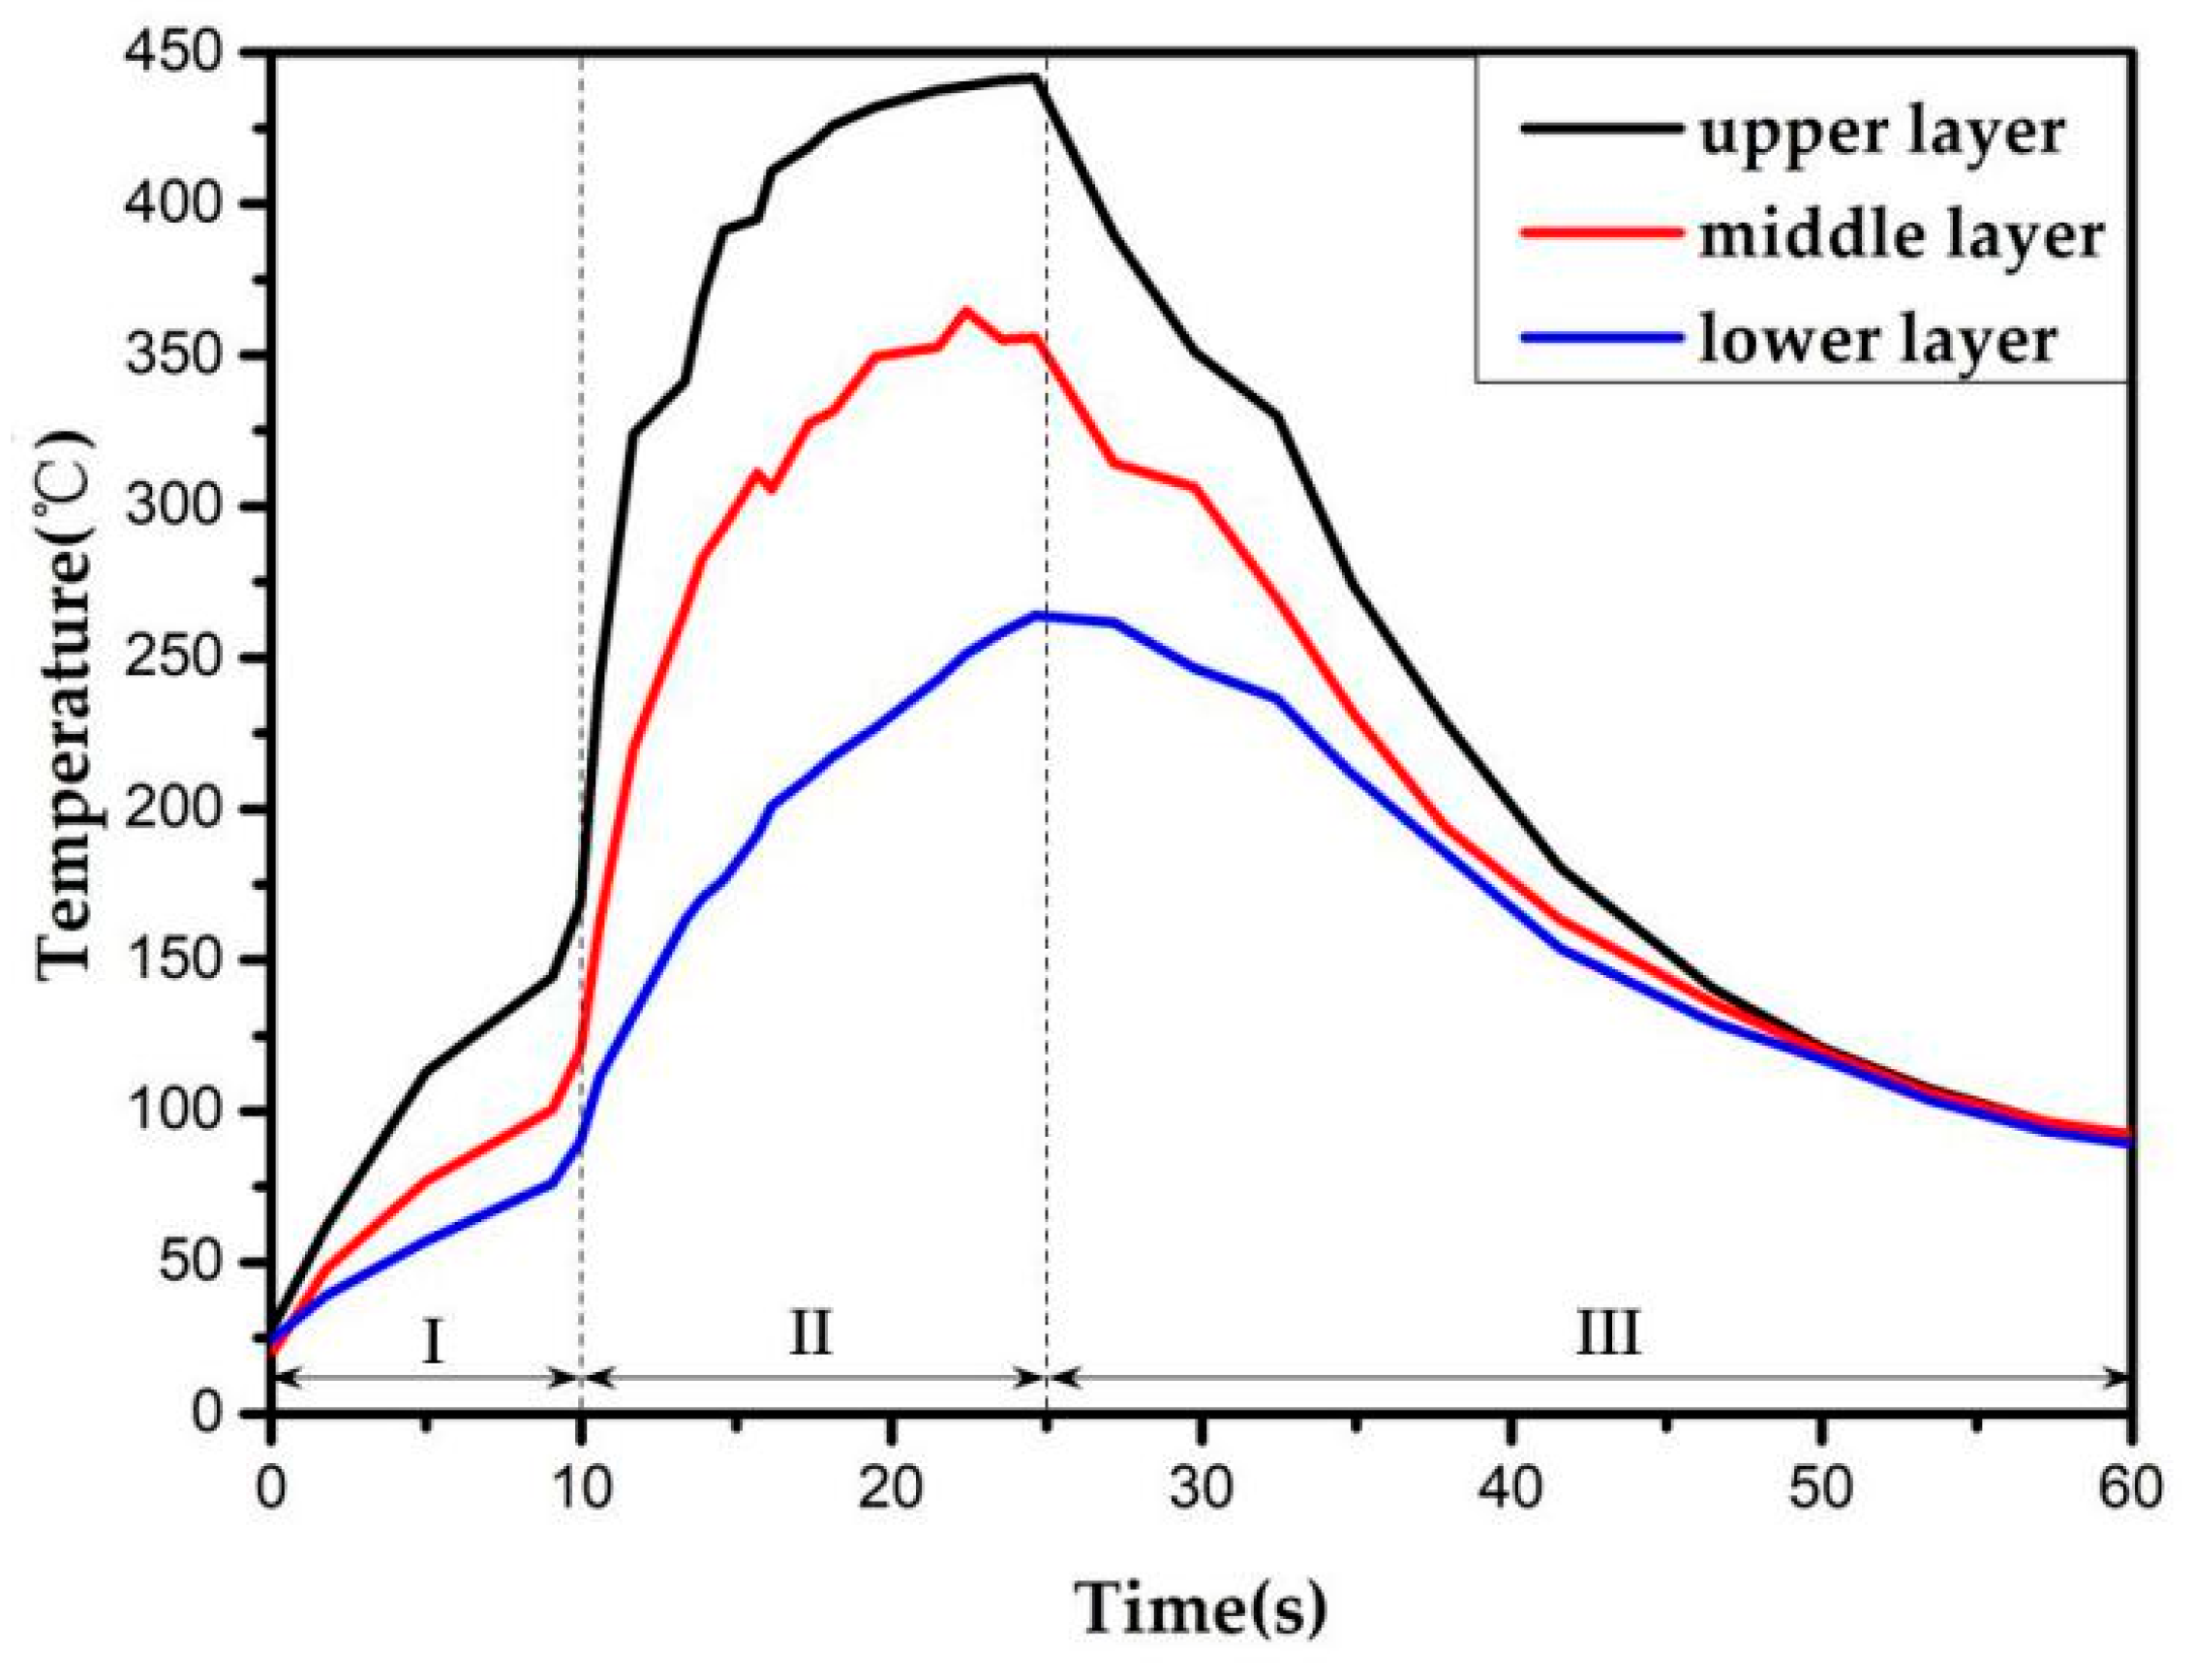
Figure 13.
Schematic diagram of the FPW joint structure and force analysis.


Table 1.
The mechanical property of 6082-T6 aluminum alloy.
| Materials | Yield Strength (MPa) | Tensile Strength (MPa) | Elongation (%) |
|---|---|---|---|
| 6082-T6 aluminum alloy | 255 | 320 | 12 |
Table 2.
The chemical composition of 6082 aluminum alloy (in wt. %).
| Mg | Si | Mn | Fe | Cr | Zn | Cu | Ti | Al |
|---|---|---|---|---|---|---|---|---|
| 0.6–1.2 | 0.7–1.3 | 0.8 | 0.5 | 0.25 | 0.2 | 0.1 | 0.1 | Bal. |
Table 3.
Coded and actual values of FPW parameters.
| Parameters | Unit | Levels | ||
|---|---|---|---|---|
| −1 | 0 | 1 | ||
| Rotational Speed (ω) | rpm | 1800 | 2200 | 2600 |
| Welding Time (t) | s | 20 | 25 | 30 |
| Upsetting Speed (υ) | mm/s | 1.0 | 1.5 | 2.0 |
Table 4.
Design layout including experimental values.
| No. | Coded Values of Parameters | Tensile Strength (MPa) | ||
|---|---|---|---|---|
| ω | t | v | ||
| 1 | −1 | −1 | 0 | 175.42 |
| 2 | 1 | −1 | 0 | 221.38 |
| 3 | −1 | 1 | 0 | 176.51 |
| 4 | 1 | 1 | 0 | 216.53 |
| 5 | −1 | 0 | −1 | 191.21 |
| 6 | 1 | 0 | −1 | 200.25 |
| 7 | −1 | 0 | 1 | 212.14 |
| 8 | 1 | 0 | 1 | 219.38 |
| 9 | 0 | −1 | −1 | 234.84 |
| 10 | 0 | 1 | −1 | 240.76 |
| 11 | 0 | −1 | 1 | 254.81 |
| 12 | 0 | 1 | 1 | 259.82 |
| 13 | 0 | 0 | 0 | 247.63 |
| 14 | 0 | 0 | 0 | 246.38 |
| 15 | 0 | 0 | 0 | 248.47 |
Table 5.
ANOVA table for the response, tensile strength.
| Source | Sum of Squares | Degree of Freedom | Mean Square | F-Value | p-Value | Significance Level |
|---|---|---|---|---|---|---|
| Model | 10,942.19 | 9 | 1215.80 | 13.15 | 0.0013 | Significant |
| ω | 1307.14 | 1 | 1307.14 | 14.14 | 0.0071 | - |
| t | 6.43 | 1 | 6.43 | 0.07 | 0.7996 | - |
| v | 781.90 | 1 | 781.90 | 8.46 | 0.0227 | - |
| Ω—t | 8.82 | 1 | 8.82 | 0.095 | 0.7664 | - |
| Ω—v | 0.81 | 1 | 0.81 | 0.0087 | 0.9280 | - |
| t—v | 0.21 | 1 | 0.21 | 0.0022 | 0.9636 | - |
| ω2 | 8670.26 | 1 | 8670.26 | 93.78 | <0.0001 | - |
| t2 | 53.54 | 1 | 53.54 | 0.58 | 0.4715 | - |
| v2 | 93.77 | 1 | 93.77 | 1.01 | 0.3474 | - |
| Residual | 647.17 | 7 | 92.54 | - | - | - |
| Lack of Fit | 634.37 | 3 | 211.46 | 66.06 | 0.0637 | Not significant |
| Pure error | 12.80 | 4 | 3.20 | - | - | - |
| Sum | 11,589.36 | 16 | - | - | - | - |
Table 6.
Optimum conditions and predicted and experimental values.
| Optimal Condition | Tensile Strength (MPa) | |||
|---|---|---|---|---|
| Rotational Speed (rpm) | Welding Time (s) | Upsetting Speed (mm/s) | Predicted | Experimental |
| 2254 | 25 | 2 | 263.86 | 262.34 |
Publisher’s Note: MDPI stays neutral with regard to jurisdictional claims in published maps and institutional affiliations. |
© 2020 by the authors. Licensee MDPI, Basel, Switzerland. This article is an open access article distributed under the terms and conditions of the Creative Commons Attribution (CC BY) license (http://creativecommons.org/licenses/by/4.0/).
Share and Cite
MDPI and ACS Style
Zhang, Z.; Li, X.; Zhao, Z.; Jiang, C.; Zhao, H. Process Optimization and Formation Analysis of Friction Plug Welding of 6082 Aluminum Alloy. Metals 2020, 10, 1454. https://doi.org/10.3390/met10111454
AMA Style
Zhang Z, Li X, Zhao Z, Jiang C, Zhao H. Process Optimization and Formation Analysis of Friction Plug Welding of 6082 Aluminum Alloy. Metals. 2020; 10(11):1454. https://doi.org/10.3390/met10111454
Chicago/Turabian StyleZhang, Zhongke, Xuanbai Li, Zaolong Zhao, Changming Jiang, and Huaxia Zhao. 2020. "Process Optimization and Formation Analysis of Friction Plug Welding of 6082 Aluminum Alloy" Metals 10, no. 11: 1454. https://doi.org/10.3390/met10111454
Note that from the first issue of 2016, this journal uses article numbers instead of page numbers. See further details here.