
Star Excursion Balance Test in Young Athletes with Back Pain

Abstract
:1. Introduction
2. Materials and Methods
2.1. Subjects
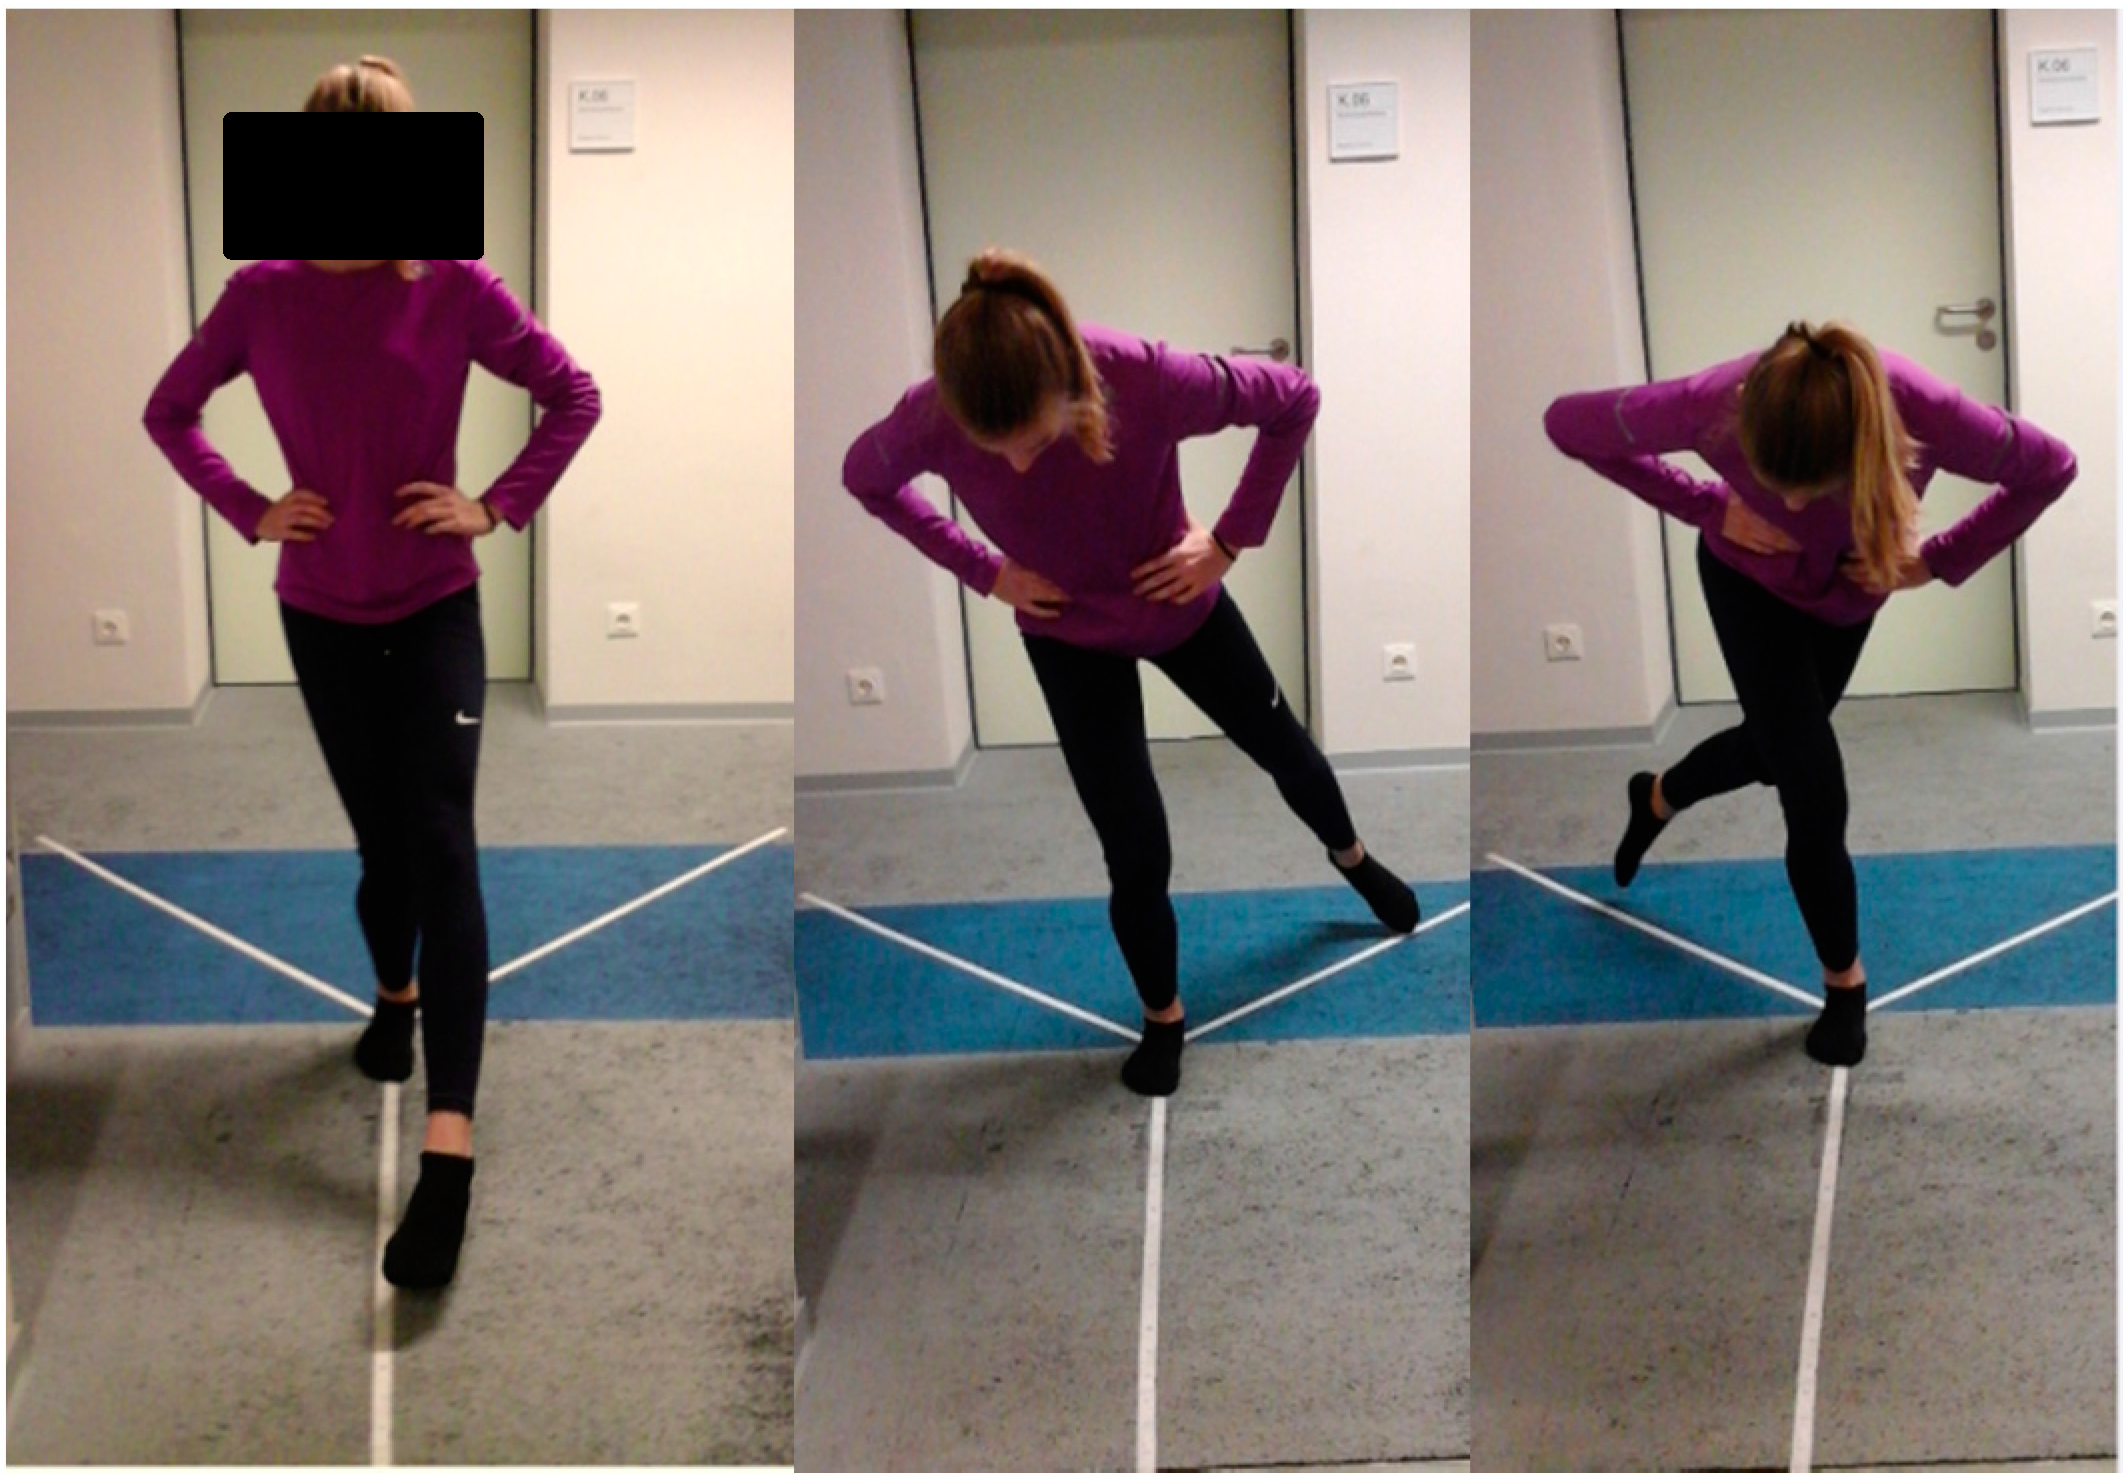
2.2. Test Description
2.3. Measurement Procedure
2.4. Outcome Measure
2.5. Data and Statistical Analysis
3. Results
4. Discussion
Limitations of the Study
5. Conclusions
Acknowledgments
Author Contributions
Conflicts of Interest
References
- Balaqué, F.; Troussier, B.; Salminen, J.J. Non-Specific low back pain in children and adolescents: Risk factors. Eur. Spine J. 1999, 8, 429–438. [Google Scholar]
- Calvo-Muñoz, I.; Gómez-Conesa, A.; Sánchez-Meca, J. Prevalence of low back pain in children and adolescents: A meta-analysis. BMC Pediatr. 2013, 13. [Google Scholar] [CrossRef]
- Müller, J; Müller, S; Stoll, J; Fröhlich, K.; Otto, C.; Mayer, F. Back pain prevalence in adolescent athletes. Scand. J. Med. Sci. Sports 2016. [Google Scholar] [CrossRef]
- D’Hemecourt, P.A.; Gerbino, P.G.; Micheli, L.J. Back injuries in the young athlete. Clin. Sports Med. 2000, 19, 663–679. [Google Scholar] [CrossRef]
- George, S.Z.; Delitto, A. Management of athlete with low back pain. Clin. Sports Med. 2002, 21, 313–320. [Google Scholar] [CrossRef]
- Sassmannhausen, G.; Smith, B.G. Back pain in the young athlete. Clin. Sports Med. 2002, 21, 121–132. [Google Scholar] [CrossRef]
- Haus, B.M.; Micheli, L.J. Back pain in the paediatric and adolescent athlete. Clin. Sports Med. 2012, 31, 423–440. [Google Scholar] [CrossRef] [PubMed]
- Schmidt, C.P.; Zwingenberger, S.; Walther, A.; Reuter, U.; Kasten, P.; Seifert, J.; Günther, K.P.; Stiehler, M. Prevalence of low back pain in adolescent athletes—An epidemiological investigation. Int. J. Sports Med. 2014, 35, 684–689. [Google Scholar] [CrossRef] [PubMed]
- Moseley, G.L.; Hodges, P.W. Are the changes in postural control associated with low back pain caused by pain interference? Clin. J. Pain 2005, 21, 323–329. [Google Scholar] [CrossRef] [PubMed]
- Radebold, A.; Cholewicki, J.; Polzhofer, G.K.; Greene, H.S. Impaired postural control of the lumbar spine is associated with delayed muscle response times in patients with chronic idiopathic low back pain. Spine 2001, 26, 724–730. [Google Scholar] [CrossRef] [PubMed]
- Hodges, P.W.; Richardson, C.A. Inefficient muscular stabilization of the lumbar spine associated with low back pain: A motor control evaluation of transversus abdominis. Spine 1996, 21, 2640–2650. [Google Scholar] [CrossRef] [PubMed]
- Hodges, P.; Moseley, L.; Gabrielsson, A.; Gandevia, S.C. Acute experimental pain changes postural recruitment of the trunk muscles in pain-free humans. Exp. Brain Res. 2003, 151, 262–271. [Google Scholar] [CrossRef] [PubMed]
- Ruhe, A.; Fejer, R.; Walker, B. Is there a relationship between pain intensity and postural sway in patients with non-specific low back pain? BMC Musculoskelet. Disord. 2011, 12. [Google Scholar] [CrossRef] [Green Version]
- Harringe, M.L.; Halvorsen, K.; Renström, P.; Werner, S. Postural control measured as the center of pressure excursion in young female gymnasts with low back pain or lower extremity injury. Gait Posture 2008, 28, 38–45. [Google Scholar] [CrossRef] [PubMed]
- Gribble, P.A; Hertel, J. Using the Star Excursion Balance Test to Assess Dynamic Postural Control Deficits and Outcomes in Lower Extremity Injury: A Literature and Systematic Review. J. Athl. Train. 2012, 47, 339–357. [Google Scholar] [PubMed]
- Olmsted, L.C.; Carcia, C.R.; Hertel, J.; Shultz, S.J. Efficacy of the star excursion balance tests in detecting reach deficits in subjects with chronic ankle instability. J. Athl. Train. 2002, 37, 501–506. [Google Scholar] [PubMed]
- Hodges, P.W.; Richardson, C.A. Delayed postural contraction of transversus abdominis in low back pain associated with movement of the lower limb. J. Spinal Disord. 1998, 11, 46–56. [Google Scholar] [CrossRef] [PubMed]
- Müller, R.; Ertelt, T.; Blickhan, R. Low back pain affects trunk as well as lower limb movements during walking and running. J. Biomech. 2015, 48, 1009–1014. [Google Scholar] [CrossRef] [PubMed]
- Ganesh, G.S.; Chhabra, D.; Mrityunjay, K. Efficacy of the star excursion balance test in detecting reach deficits in subjects with chronic low back pain. Physiother. Res. Int. 2015, 20, 9–15. [Google Scholar] [CrossRef] [PubMed]
- Ellert, U.; Neuhauser, H.; Roth-Isigkeit, A. Pain in children and adolescents in Germany: The prevalence and usage of medical services. Results of the German Health Interview and Examination Survey for Children and Adolescents (KiGGS). Bundesgesundheitsblatt Gesundheitsforschung Gesundheitsschutz 2007, 50, 711–717. [Google Scholar] [CrossRef] [PubMed]
- Hertel, J.; Braham, R.; Hale, S.; Olmsted-Kramer, L. Simplifying the Star Excursion Balance Test: Analyses of subjects with and without chronic ankle instability. J. Sci. Med. Sport 2006, 36, 131–137. [Google Scholar] [CrossRef] [PubMed]
- Gribble, P.A.; Kelly, S.E.; Refshauge, K.M.; Hiller, C.E. Interrater reliability of the star excursion balance test. J. Athl. Train. 2013, 48, 621–626. [Google Scholar] [CrossRef] [PubMed]
- Hertel, J.; Miller, J.; Denegar, C.R. Intratester and Intertester Reliability during the star excursion balance tests. J. Sports Rehabil. 2000, 9, 104–116. [Google Scholar] [CrossRef]
- Coughlan, G.F.; Fullam, K.; Delahunt, E.; Gissane, C.; Caulfield, B.M. A comparison between performance on selected directions of the star excursion balance test and the Y balance test. J. Athl. Train. 2012, 47, 366–371. [Google Scholar] [PubMed]
- Plisky, P.J.; Rauh, M.J.; Kaminski, T.W.; Underwood, F.B. Star Excursion Balance Test as a predictor of lower extremity injury in high school basketball players. J. Orthop. Sport Phys. Ther. 2006, 36, 911–919. [Google Scholar] [CrossRef]
- Robinson, R.; Gribble, P. Kinematic predictors of performance on the Star Excursion Balance Test. J. Sport Rehabil. 2008, 17, 347–357. [Google Scholar] [CrossRef] [PubMed]
- Terry, M.A.; Winell, J.J.; Green, D.W.; Schneider, R.; Peterson, M.; Marx, R.G.; Widmann, R.F. Measurement variance in limb length discrepancy: Clinical and radiographic assessment of interobserver and intraobserver variability. J. Pediatr. Orthop. 2005, 25, 197–201. [Google Scholar] [CrossRef] [PubMed]
- Holden, S.; Boreham, C.; Doherty, C.; Wang, D.; Delahunt, E. Dynamic Postural Stability in Young Adolescent Male and Female Athletes. Pediatr. Phys. Ther. 2014, 26, 447–452. [Google Scholar] [CrossRef] [PubMed]
- Faul, F.; Erdfelder, E.; Buchner, A.; Lang, A.G. Statistical power analyses using G*Power 3.1: Test for correlation and regression analyses. Behav. Res. Methods 2009, 41, 1149–1160. [Google Scholar]
- Massion, J. Movement, posture and equilibrium: Interaction and coordination. Prog. Neurobiol. 1992, 38, 35–56. [Google Scholar] [CrossRef]
- Nashner, L.M.; Black, F.O.; Wall, C., III. Adaptation to altered support and visual conditions during stance: Patients with vestibular deficits. J. Neurosci. 1982, 2, 536–544. [Google Scholar] [PubMed]
- Brumagne, S; Cordo, P; Lysens, R; Verschueren, S; Swinnen, S. The role of paraspinal muscle spindles in lumbosacral position sense in individuals with and without low back pain. Spine (Phila Pa 1976) 2000, 25, 989–994. [Google Scholar] [CrossRef]
- Hrysomallis, C. Balance ability and athletic performance. Sports Med. 2011, 41, 221–232. [Google Scholar] [CrossRef] [PubMed] [Green Version]
- Latash, M. Neurophysiological Basis of Movement; Human Kinetics: Champaign, IL, USA, 1998. [Google Scholar]
- Jacobs, J.V.; Henry, S.M.; Jones, S.L.; Hitt, J.R.; Bunn, J.Y. A history of low back pain associates with altered electromyographic activation patterns in response to perturbations of standing balance. J. Neurophysiol. 2011, 106, 2506–2514. [Google Scholar] [CrossRef] [PubMed]
- Ashton-Miller, J.A.; Wojtys, E.M.; Huston, L.J.; Fry-Welch, D. Can proprioception really be improved by exercises? Knee Surg. Sports Traumatol. Arthrosc. 2001, 9, 128–136. [Google Scholar] [CrossRef] [PubMed]
- Alonso, A.C.; Brech, G.C.; Bourquin, A.M.; Greve, J.M. The influence of lower-limb dominance on postural balance. Sao Paulo Med. J. 2011, 129, 410–413. [Google Scholar] [PubMed]
- Bressel, E.; Yonker, J.C.; Kras, J.; Heath, E.M. Comparison of Static and Dynamic Balance in Female Collegiate Soccer, Basketball, and Gymnastics Athletes. J. Athl. Train. 2007, 42, 42–46. [Google Scholar] [PubMed]
- Gribble, P.; Hertel, J. Considerations for normalizing measures of the Star Excursion Balance Test. Meas. Phys. Educ. Exerc. Sci. 2003, 7, 89–100. [Google Scholar] [CrossRef]
- Gribble, P.A.; Robinson, R.H.; Hertel, J.; Denegar, C.R. The Effects of Gender and Fatigue on Dynamic Postural Control. J. Sport Rehabil. 2009, 18, 240–257. [Google Scholar] [CrossRef] [PubMed]
- Sabin, M.J.; Ebersole, K.T.; Martindale, A.R.; Price, J.W.; Broglio, S.P. Balance performance in male and female collegiate basketball athletes: Influence of testing surface. J. Strength. Cond. Res. 2010, 24, 2073–2078. [Google Scholar] [CrossRef] [PubMed]
- Cohen, J. Statistical Power Analysis for Behavioural Sciences, 2nd ed.; Lawerence Earlbaum Associates: Hilldale, NJ, USA, 1988. [Google Scholar]
- Thorpe, J.L.; Ebersole, K.T. Unilateral balance performance in female collegiate soccer athletes. J. Strength. Cond. Res. 2008, 22, 1429–1433. [Google Scholar] [CrossRef] [PubMed]


| Normalized Reach Distance (Limb Length %) for BP Subjects | |||
|---|---|---|---|
| RLL | LLL | p Value | |
| Anterior | 87.2 ± 5.3 | 87.7 ± 5.8 | 0.27 |
| Posteromedial | 82.5 ± 8.2 | 82.6 ± 7.9 | 0.86 |
| Posterolateral | 78.7 ± 8.1 | 77.7 ± 8.0 | 0.06 |
| CRDS | 91.2 ± 10.1 | 90.9 ± 9.8 | 0.53 |
| Limb length (cm) | 91.3 ± 6.3 | 91.4 ± 6.3 | 0.37 |
| Normalized Reach Distance (% Limb Length) for NBP Subjects | |||
|---|---|---|---|
| RLL | LLL | p Value | |
| Anterior | 87.8 ± 5.6 | 88.3 ± 6.2 | 0.22 |
| Posteromedial | 82.4 ± 8.0 | 82.1 ± 8.6 | 0.53 |
| Posterolateral | 80.0 ± 8.8 | 79.2 ± 8.2 | 0.19 |
| CRDS | 91.9 ± 10.8 | 91.8 ± 11.1 | 0.81 |
| Limb length (cm) | 91.3 ± 6.4 | 91.3 ± 6.5 | 0.63 |
| Normalized Reach Distance (% of Limb Length) for RLL | Effect Size | |||
|---|---|---|---|---|
| BP | NBP | p Value | ||
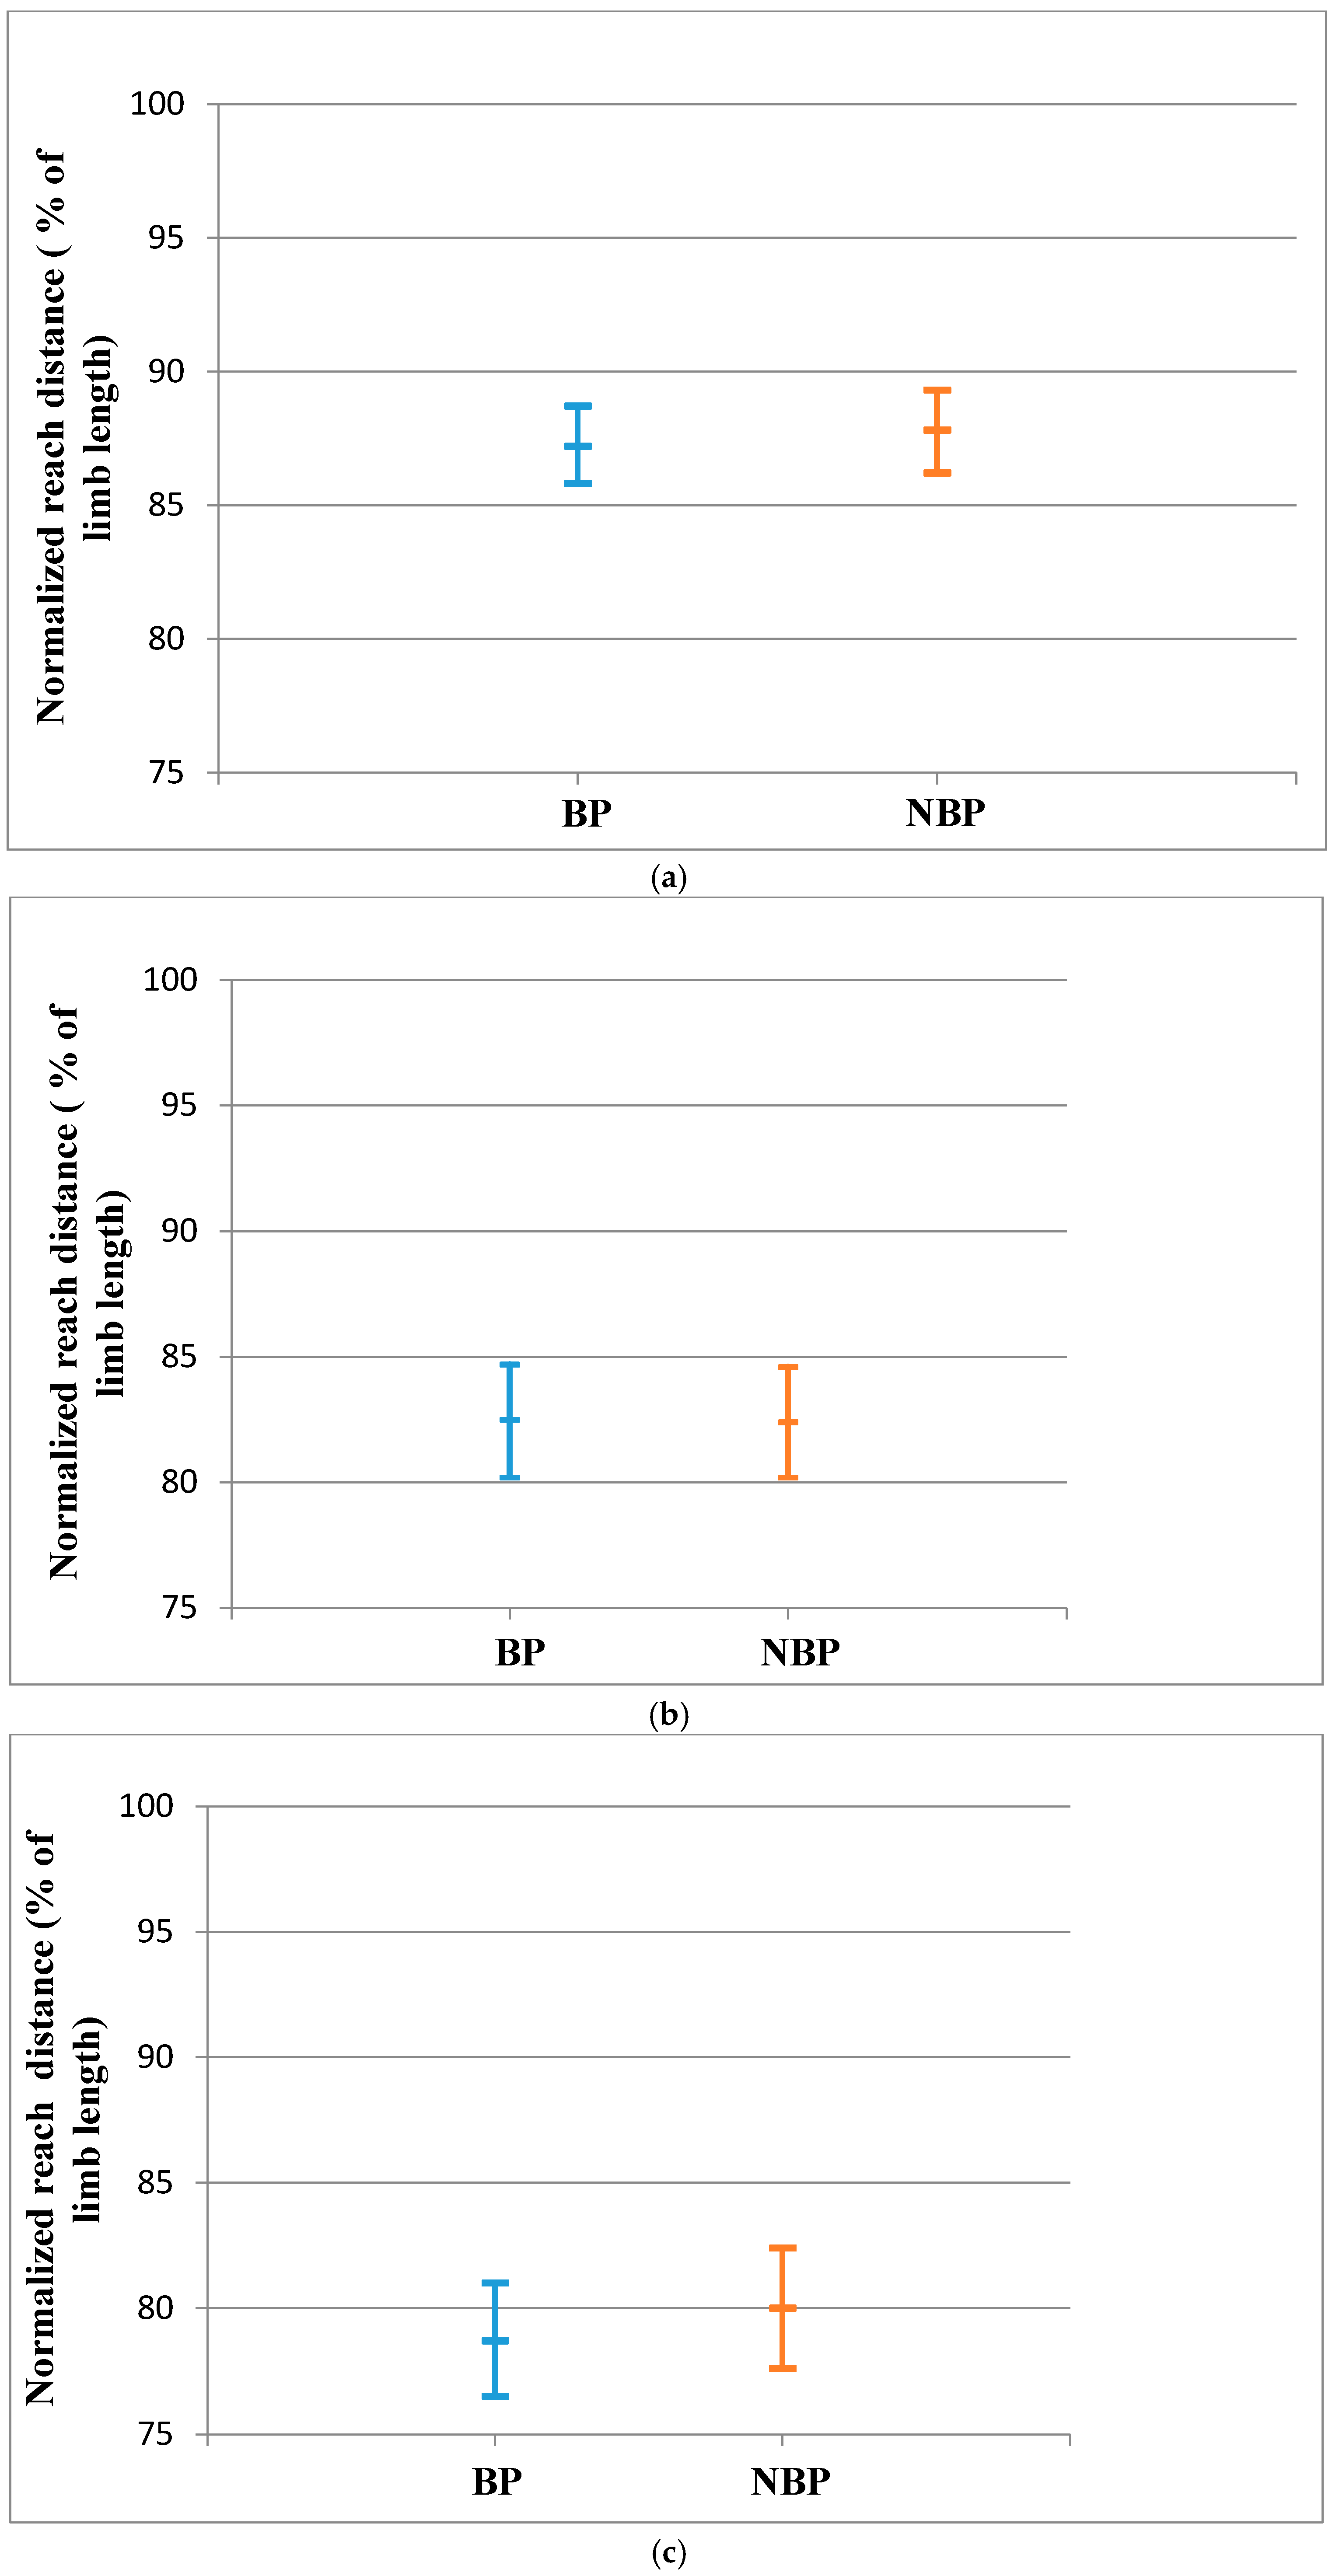
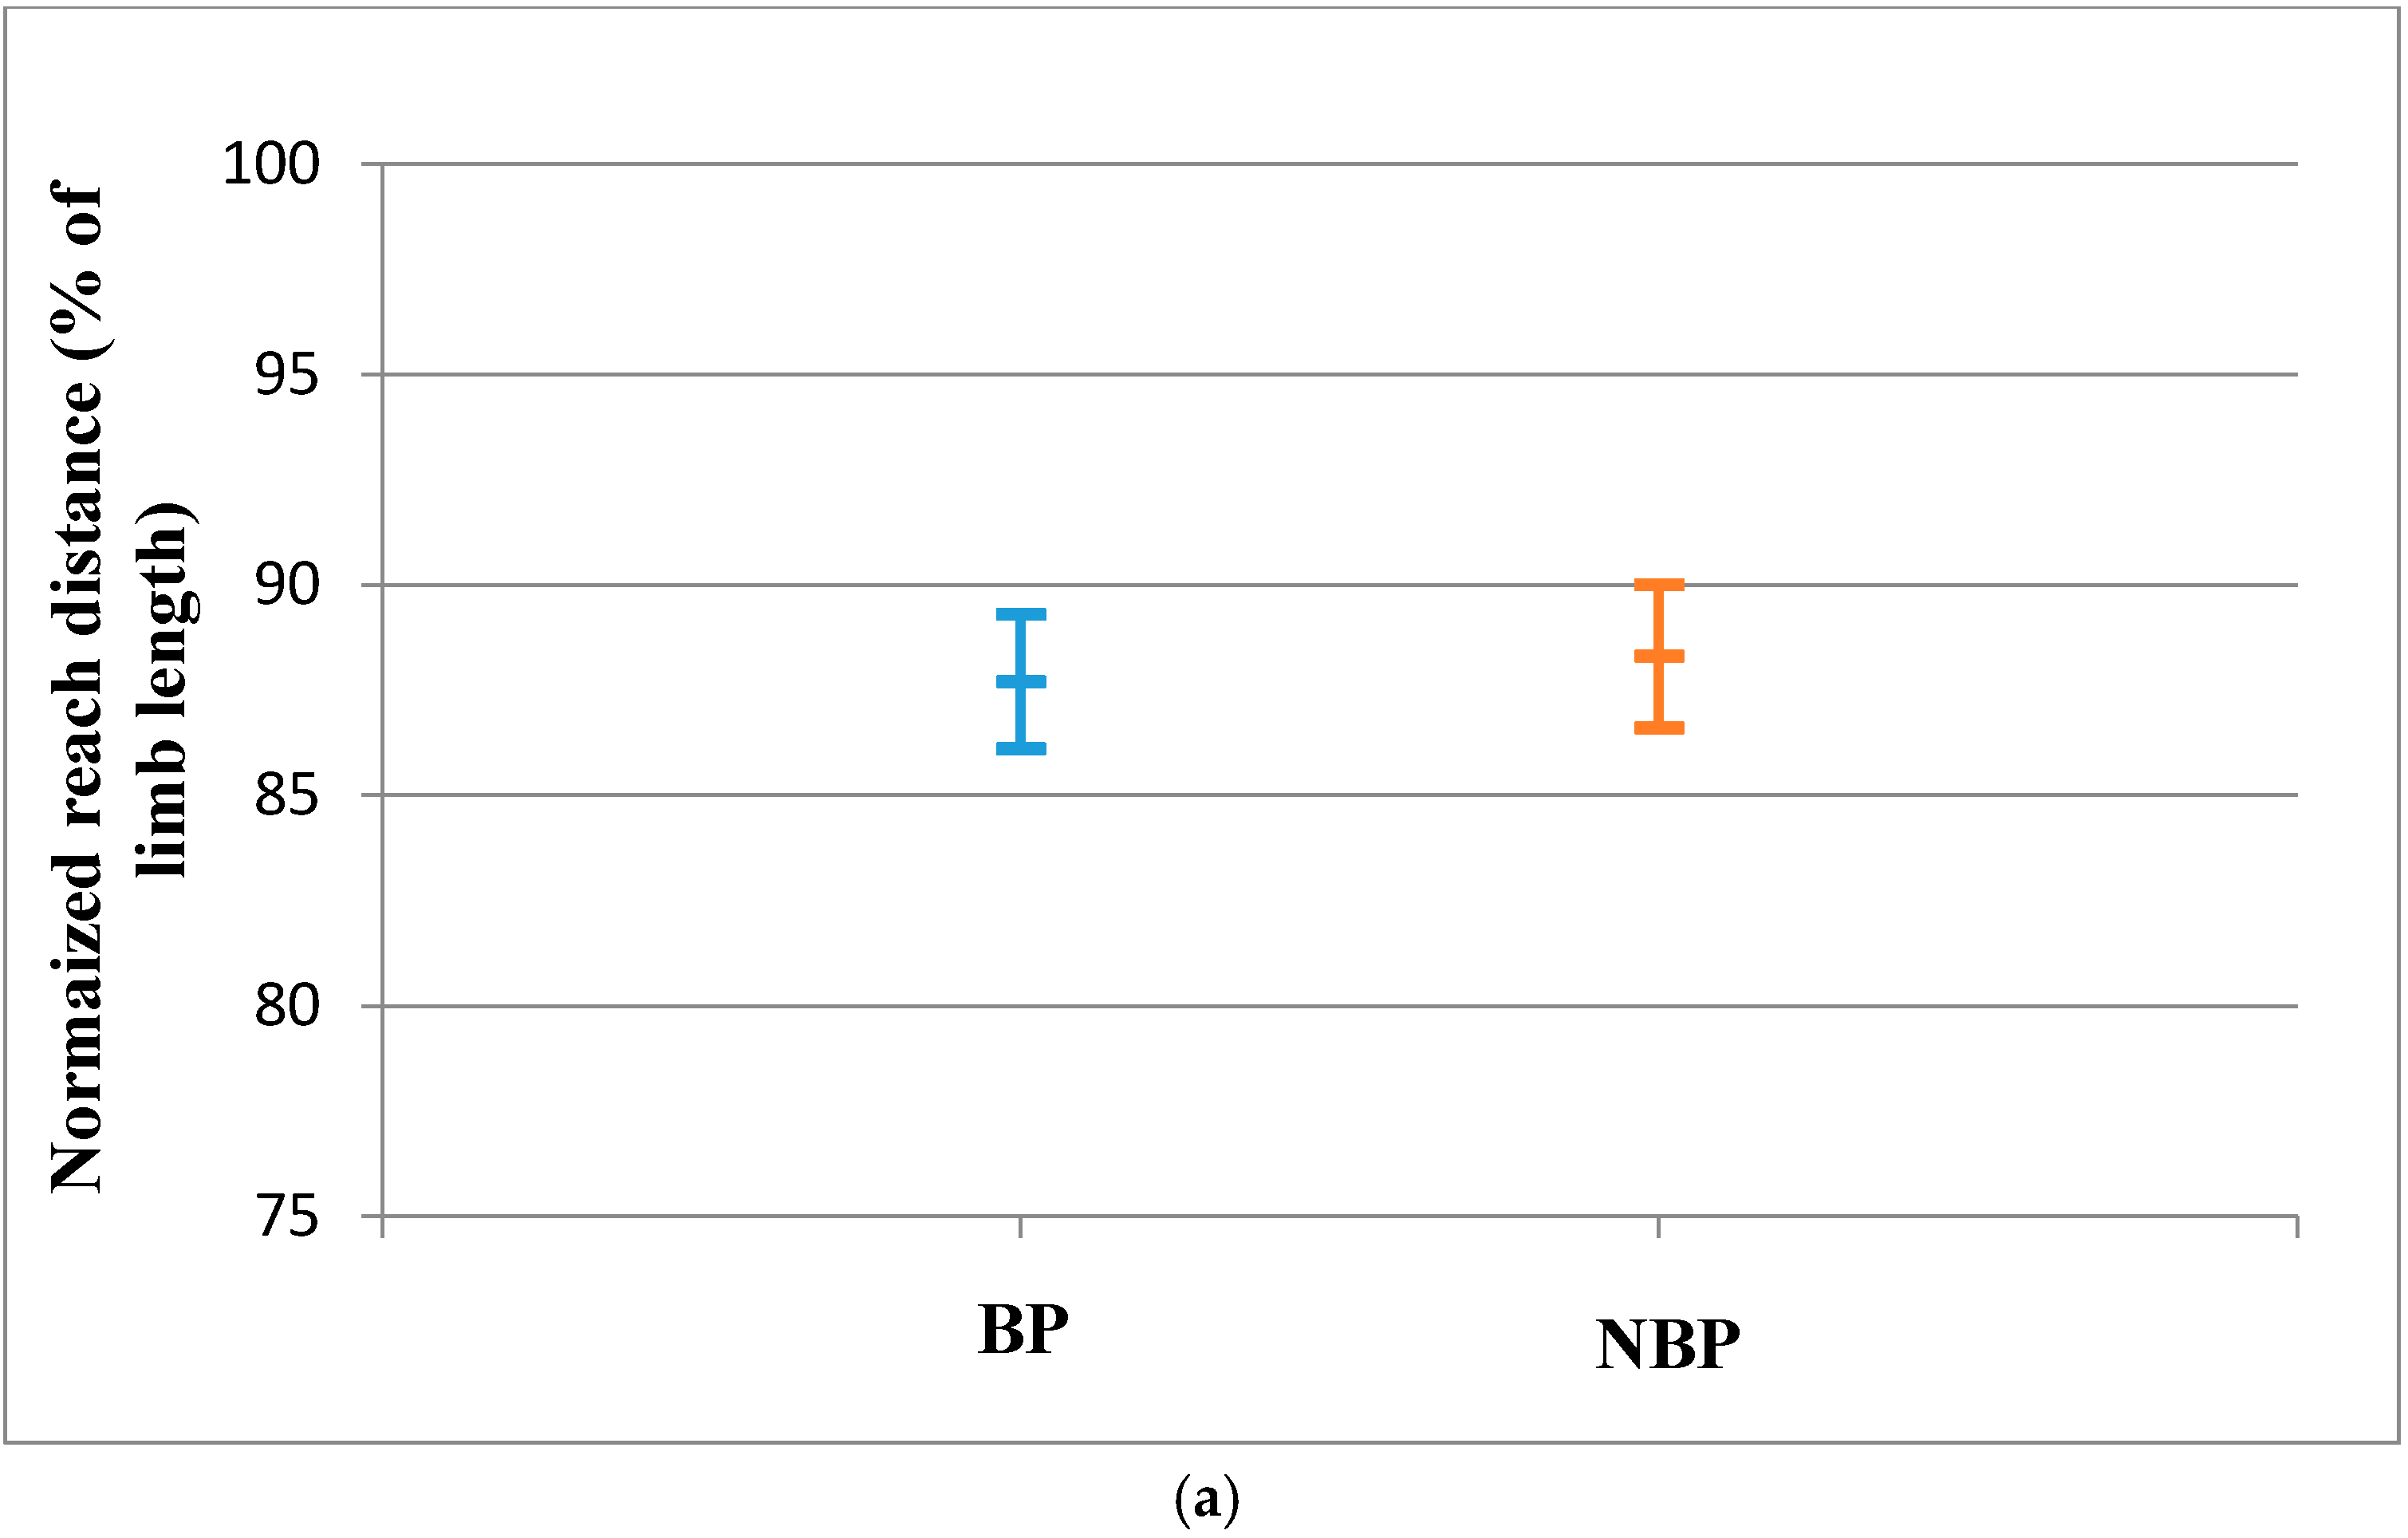
| Anterior | 87.2 ± 5.3 | 87.8 ± 5.6 | 0.63 | 0.11 |
| Posteromedial | 82.5 ± 8.2 | 82.4 ± 8.0 | 0.65 | 0.01 |
| Posterolateral | 78.7 ± 8.1 | 80.0 ± 8.6 | 0.44 | 0.16 |
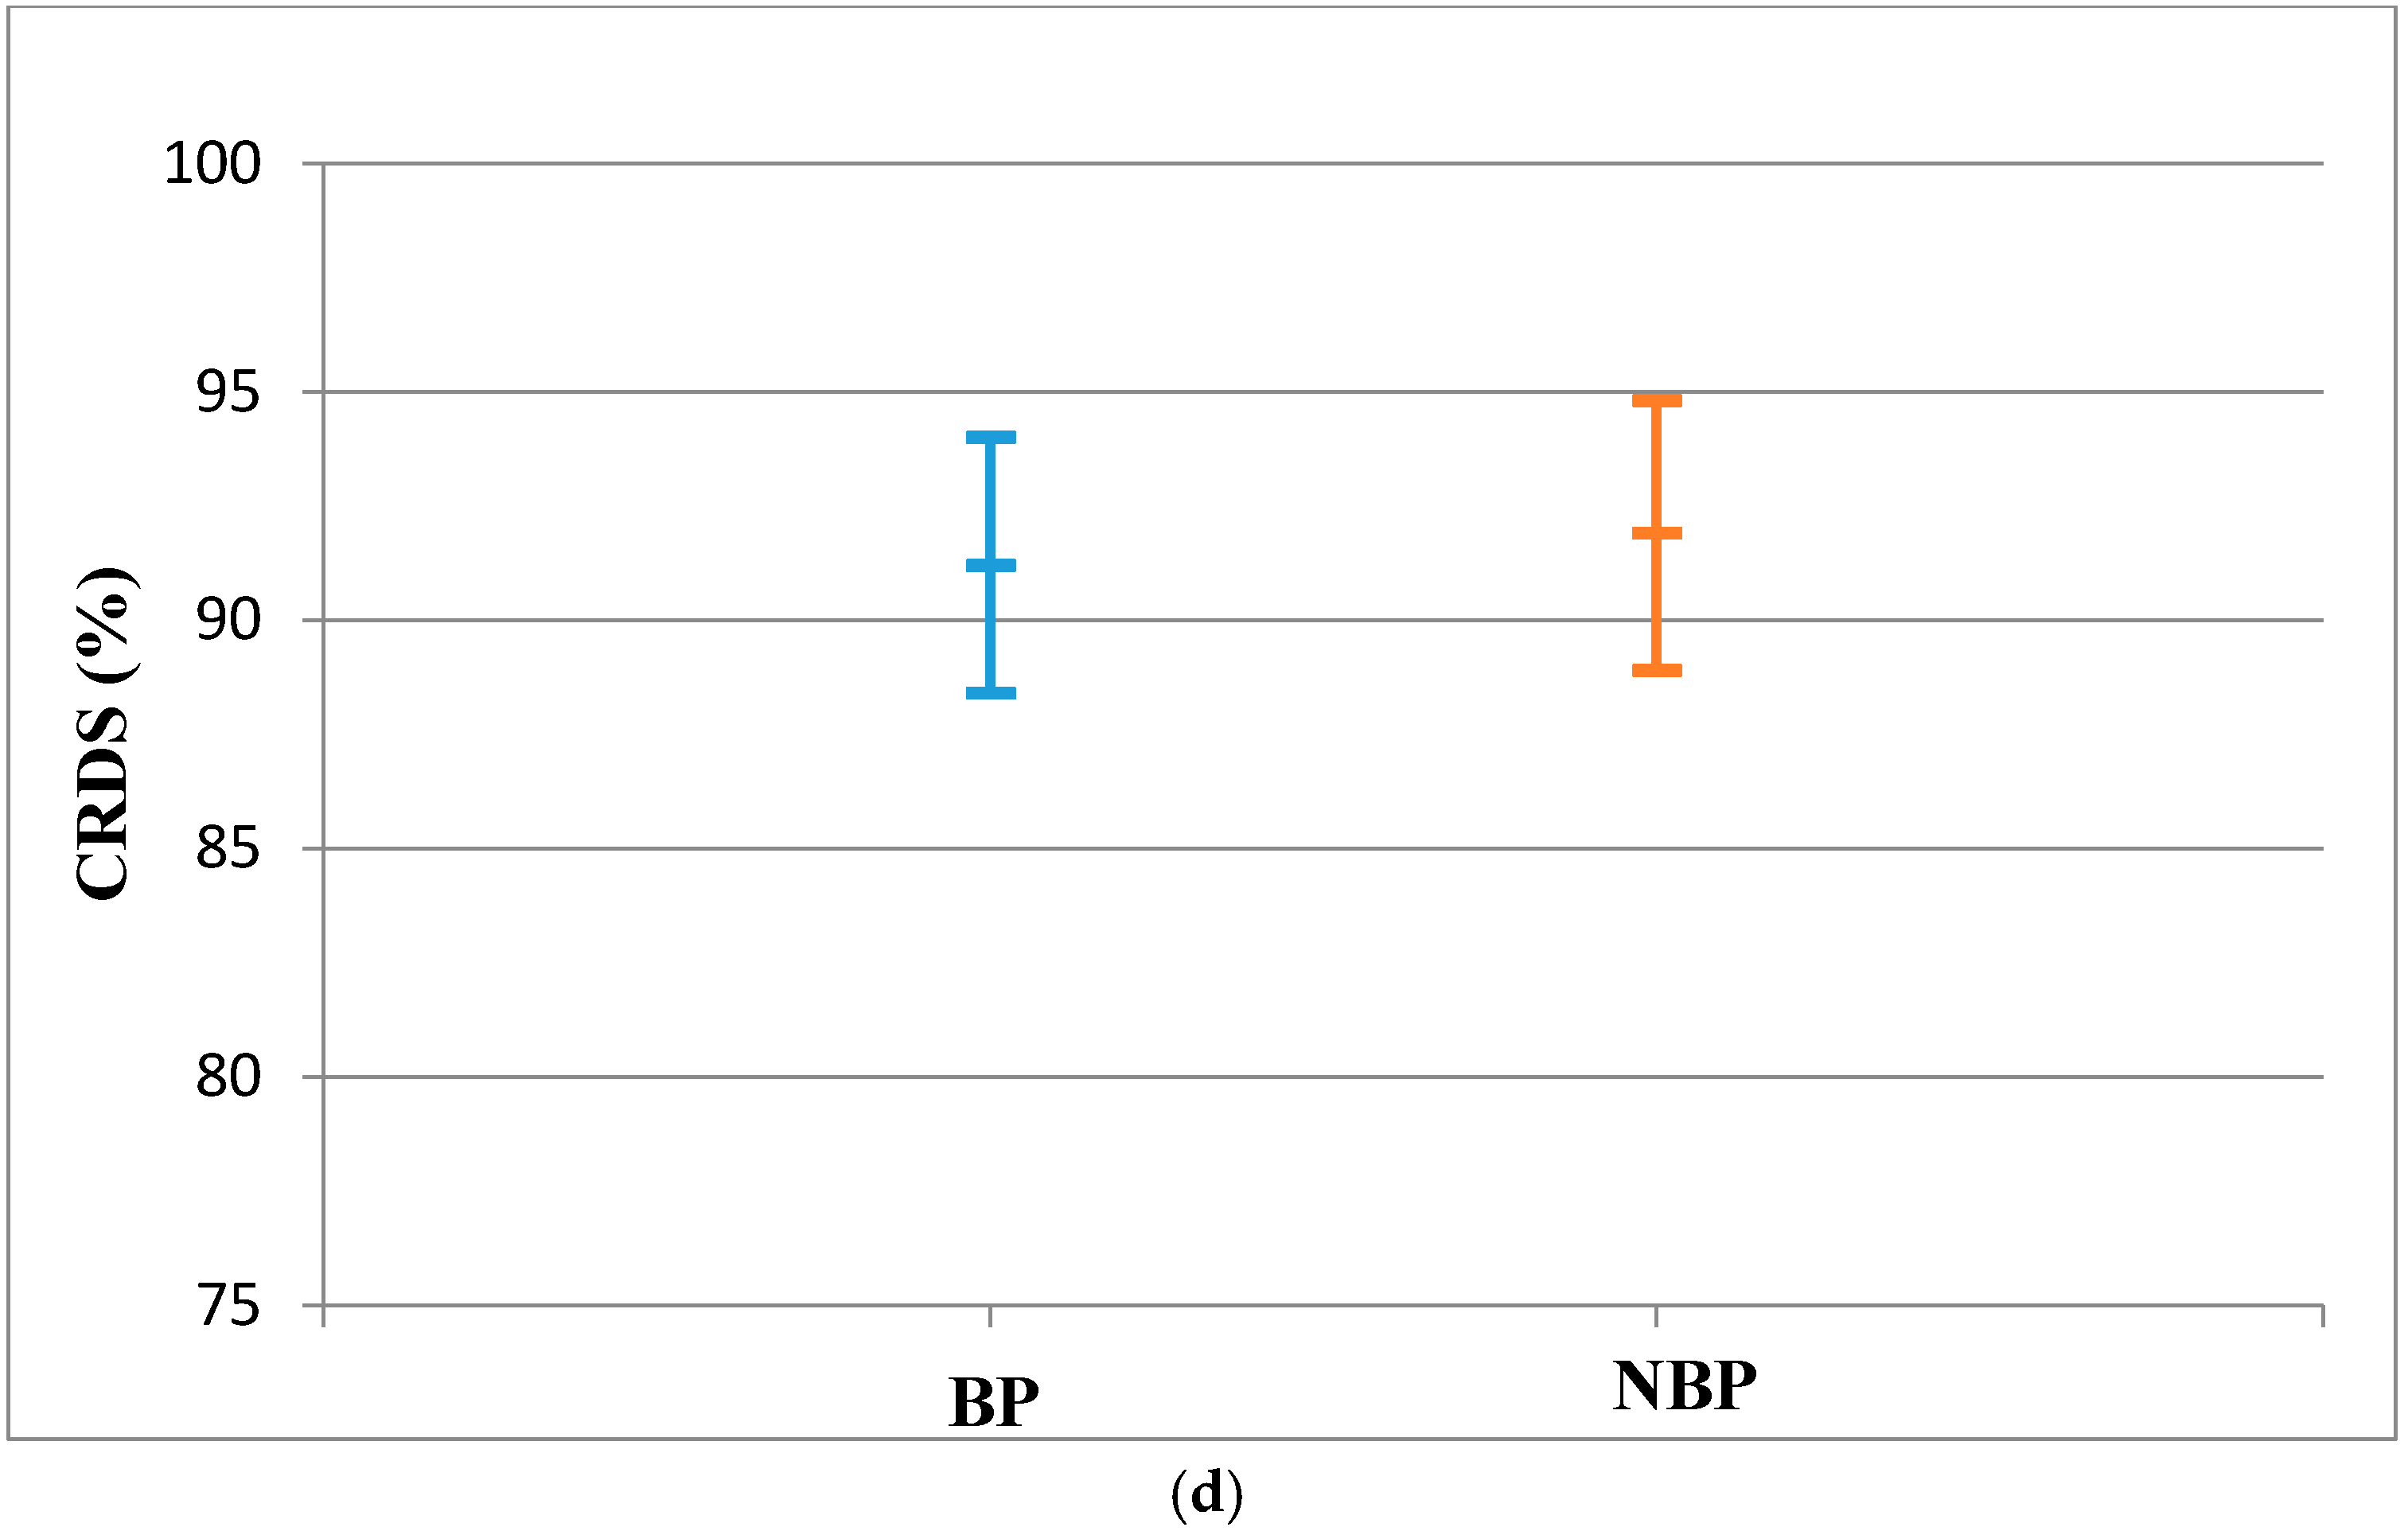
| CRDS | 91.2 ± 10.1 | 91.9 ± 10.8 | 0.75 | 0.07 |
| Normalized Reach Distance (% of Limb Length) for LLL | Effect Size | |||
|---|---|---|---|---|
| BP | NBP | p Value | ||
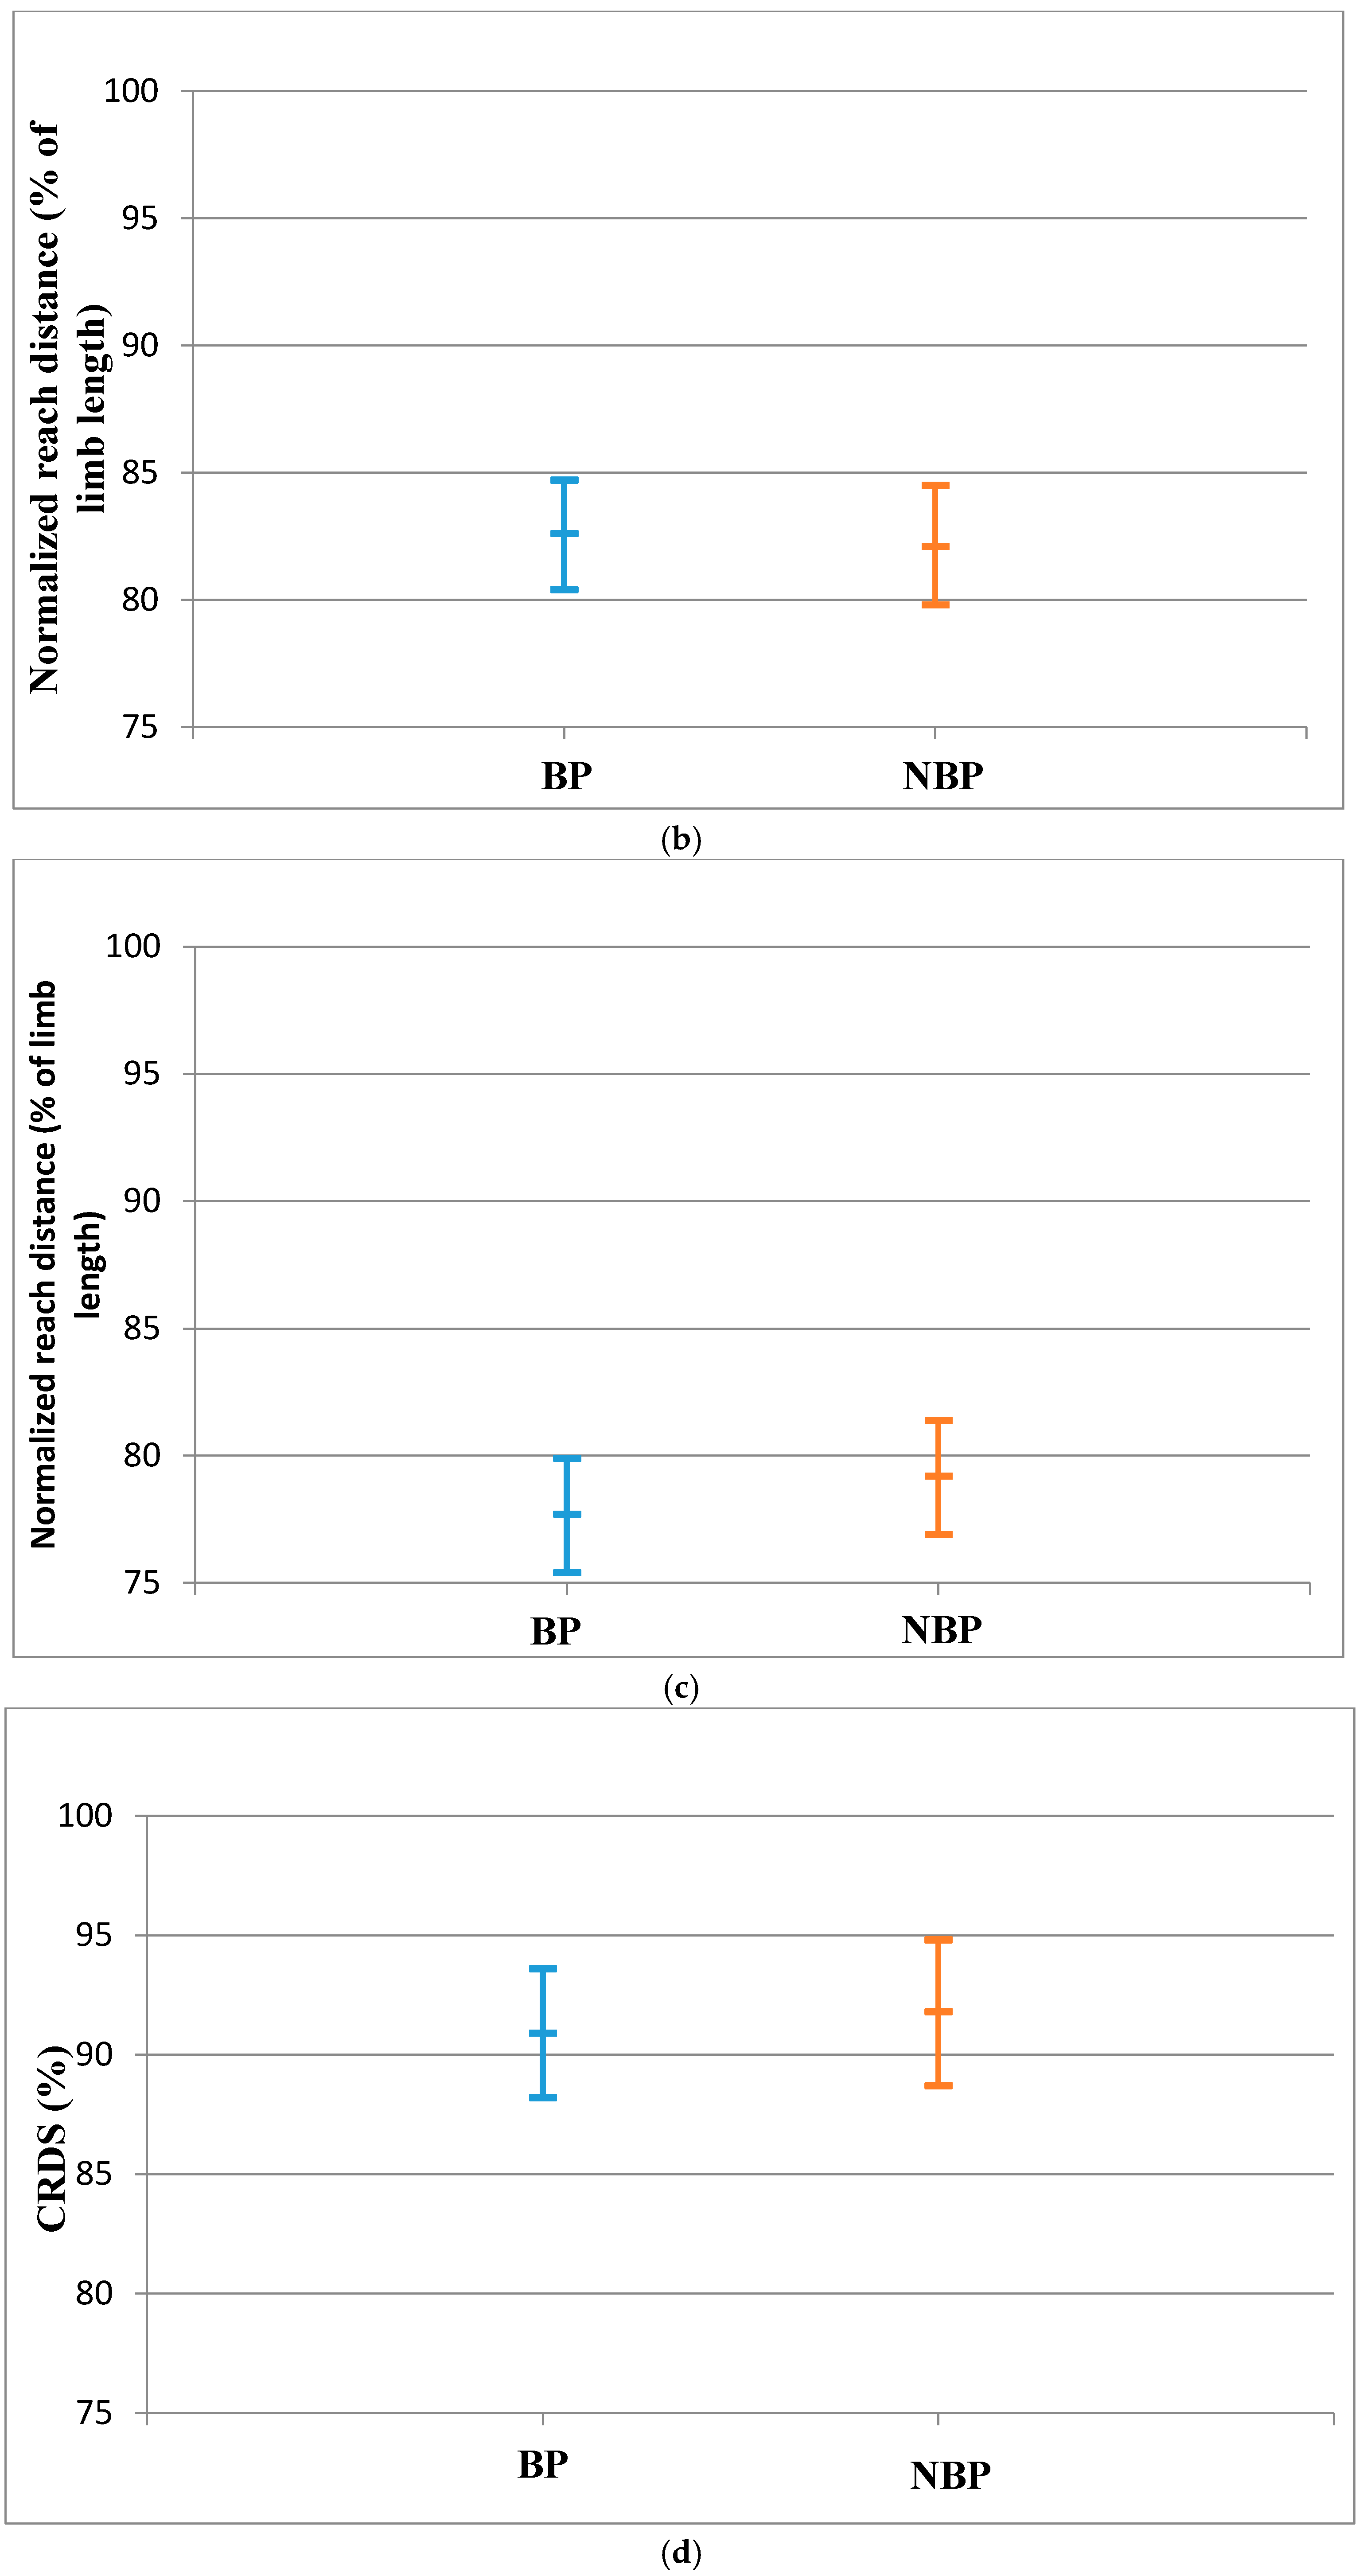
| Anterior | 87.7 ± 5.8 | 88.3 ± 6.2 | 0.61 | 0.10 |
| Posteromedial | 82.6 ± 7.9 | 82.1 ± 8.6 | 0.79 | 0.06 |
| Posterolateral | 77.7 ± 8.0 | 79.2 ± 8.2 | 0.41 | 0.25 |
| CRDS | 90.9 ± 9.8 | 91.8 ± 11.1 | 0.68 | 0.09 |
© 2016 by the authors; licensee MDPI, Basel, Switzerland. This article is an open access article distributed under the terms and conditions of the Creative Commons Attribution (CC-BY) license (http://creativecommons.org/licenses/by/4.0/).
Share and Cite
Appiah-Dwomoh, E.K.; Müller, S.; Hadzic, M.; Mayer, F. Star Excursion Balance Test in Young Athletes with Back Pain. Sports 2016, 4, 44. https://doi.org/10.3390/sports4030044
Appiah-Dwomoh EK, Müller S, Hadzic M, Mayer F. Star Excursion Balance Test in Young Athletes with Back Pain. Sports. 2016; 4(3):44. https://doi.org/10.3390/sports4030044
Chicago/Turabian StyleAppiah-Dwomoh, Edem Korkor, Steffen Müller, Miralem Hadzic, and Frank Mayer. 2016. "Star Excursion Balance Test in Young Athletes with Back Pain" Sports 4, no. 3: 44. https://doi.org/10.3390/sports4030044