
Tribology of Graphite-Filled Polystyrene


Imerys Graphite & Carbon Switzerland Ltd., Strada Industriale 12, 6743 Bodio, Switzerland
Lubricants 2016, 4(2), 20; https://doi.org/10.3390/lubricants4020020
Submission received: 14 March 2016
/
Revised: 6 April 2016
/
Accepted: 18 May 2016
/
Published: 9 June 2016
(This article belongs to the Special Issue Tribofilms and Solid Lubrication)
Abstract
:Self-lubricating polymer compounds are currently used for a wide range of applications such as bearings, gears, and water meters. Under severe conditions such as high pressure, high velocity, and/or high temperatures, the material fails (PV limit). In this study, we investigated the effect of graphite on the tribological properties of polystyrene (PS) with “ball-on-three-plates” tests. Graphite-filled PS plates were produced via an internal mixer and compression molding. Unhardened steel (1.4401) and nylon (PA66) balls were used for the tribological tests. Our results indicate that graphite loading, graphite type, and particle size have a big influence on the friction coefficient, the wear resistance, and the PV limit of PS both against steel and PA66. In particular, primary synthetic graphite performs better than secondary synthetic graphite due to the higher degree of crystallinity.
1. Introduction
Polymers have been increasingly used as an alternative to metals for different applications [1,2]. The main advantages of plastic parts vs. metal parts are a reduced weight, design flexibility, and higher durability (e.g., lower corrosion). However, in order to fulfill the requirements of each application, polymers need to be compounded with suitable fillers. For tribological applications such as water meter valves, bearings, gears, bushes, and rollers, there are several properties that need to be considered such as mechanical properties, viscoelastic properties, temperature stability, heat dissipation, the friction coefficient, and the wear resistance [1]. The choice of the polymer type is very important, but the selection of suitable fillers is also crucial in order to achieve the desired performance.
Most polymers typically have high-friction coefficients that produce high wear at high loading and/or high sliding velocity. The tribological stress (PV) is defined by multiplying the pressure (P) by the sliding speed (V). Above the so-called PV limit, the friction coefficient and/or wear drastically increase, and the polymer fails under these conditions. The PV limit can be increased by decreasing the friction coefficient (reduction of frictional heating), or by improving the mechanical strength (resistance to deformation) and thermal conductivity (reduction of surface temperature). Graphite powders are well-known fillers that have been used for decades as a solid lubricant for self-lubricating polymers, either alone or in combination with other fillers such as PTFE, glass fibers, carbon fibers, or molybdenum disulfide powders. However, there are few studies on the effect of different graphite types on the tribological properties of polymer compounds [2,3,4,5,6,7].
In this study, we did an extensive investigation of the effect of graphite type on the tribological properties of polystyrene (PS), which is known to have higher brittleness compared to other polymers [1]. Five different graphites were considered for this study (see Table 1). The tribological properties of polymer compounds were evaluated by the ball-on-three-plates method, described in Section 4, using different balls (unhardened steel 1.4401 and polyamide PA66). The results of our tests indicate that graphite is an effective solid lubricant for PS and extends the PV limit to a much higher pressure/velocity range compared to virgin PS. The tribological performance of graphite-filled compounds strongly depends on the counterpart material. The dynamic friction coefficient and wear against steel is higher compared to PA66. On the other hand, the PV limit is higher for steel compared to PA66. The tribological behavior is also influenced by the graphite loading level, the graphite particle size, and the graphite type. In particular, primary synthetic graphite performs better than secondary synthetic graphite due to the higher degree of crystallinity.
2. Results
2.1. Graphite-Filled PS against a Steel Ball
2.1.1. PV Limit Tests
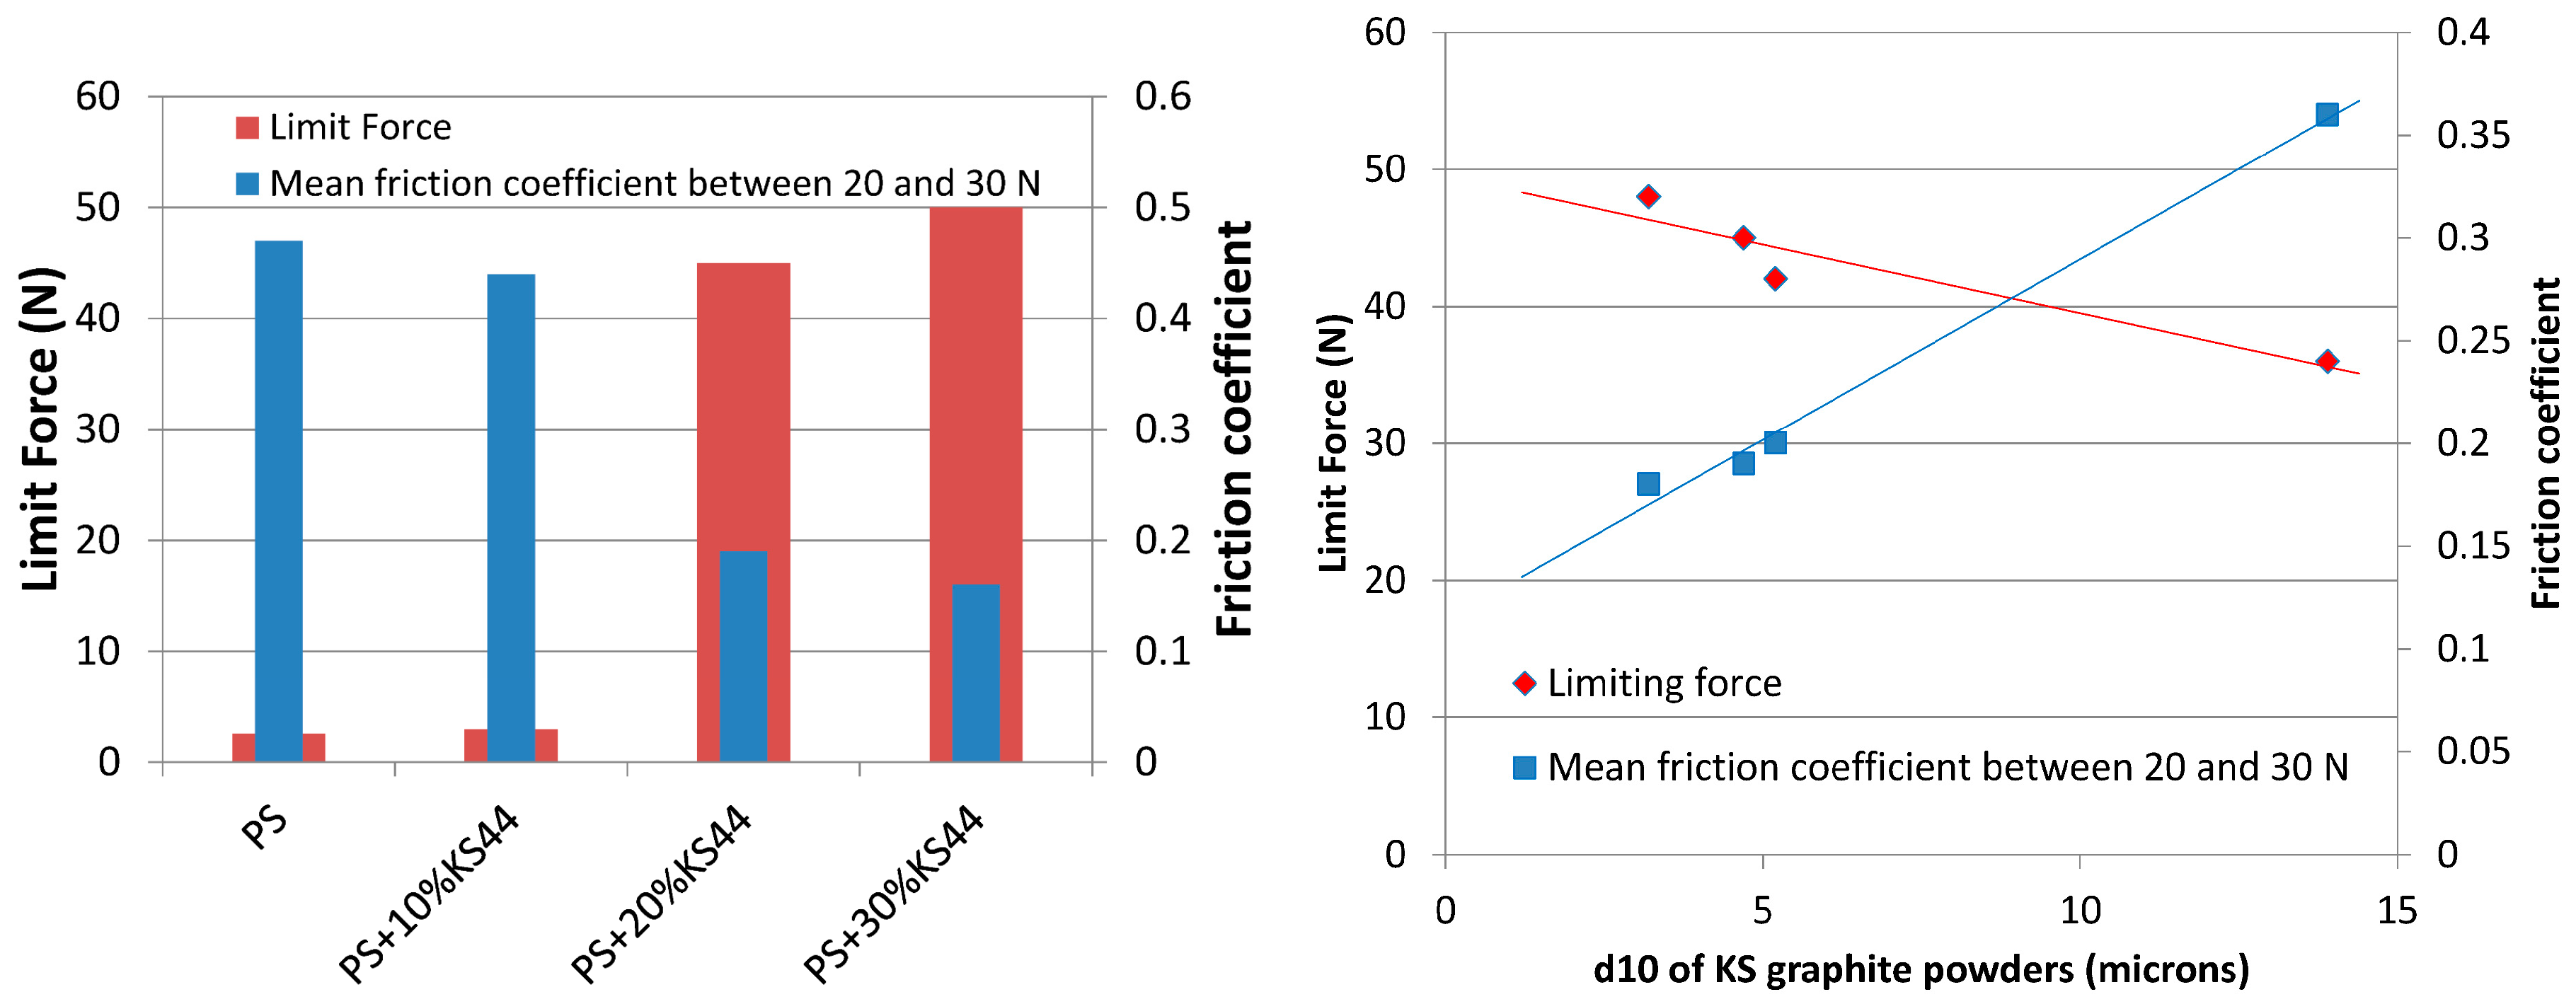
Figure 1 displays the results of the tribological tests with a steel ball rotating on graphite-filled PS plates at a constant speed (500 rpm corresponding to 0.235 m/s) and varying normal force. For unfilled PS, the dynamic friction coefficient already increases to ca. 0.5 at very low forces, and a similar behavior is observed for PS filled with 10% of KS44. This means that a 10 wt % graphite loading is not sufficient to impart self-lubricating properties to the compound. At 20 wt % KS44, the friction coefficient is decreased to ca. 0.2 and is stable up to ca. 40 N. Above 45 N, the friction coefficient starts to increase, indicating that the PV limit has been reached. This is the so-called limiting force. By further increasing the loading of KS44 to 30 wt %, we observed a slight decrease in friction coefficient (ca. 0.16) and higher limiting force (50 N). The loading level of graphite in PS is therefore very important to achieve the desired friction coefficient and PV limit against steel. The effect of graphite loading is not linear: at 10 wt %, there is no difference compared to virgin PS, whereas the results at 30 wt % are only slightly better compared to 20 wt % (see also Figure 2 (left)).
Comparing the same graphite type (KS) with a different particle size distribution (PSD) at the same loading (20%), we can observe that fine graphite particles are very important in order to improve the friction coefficient and PV limit of PS against steel. In fact, KS5-75 with a low amount of fines (d10 = 14 microns) has a low limiting force and a high friction coefficient (only slightly better than virgin PS), whereas KS15 (d90 = 17 microns) has a low friction coefficient and a high limiting force. KS44 and KS75 give intermediate performance, as shown in Figure 2 (right). This effect might be explained by the fact that fine graphite is able to form a better transfer film between the PS plate and steel ball.
We also observed a very big difference between primary and secondary synthetic graphite with similar PSDs (KS75 and SCRAP). In fact, the SCRAP graphite has a higher friction coefficient and a lower limiting force (ca. 0.3/38 N) compared to KS75 (ca. 0.2/42 N). This is probably due to the lower crystallinity (Lc) of SCRAP graphite compared to KS75 (see Table 1).
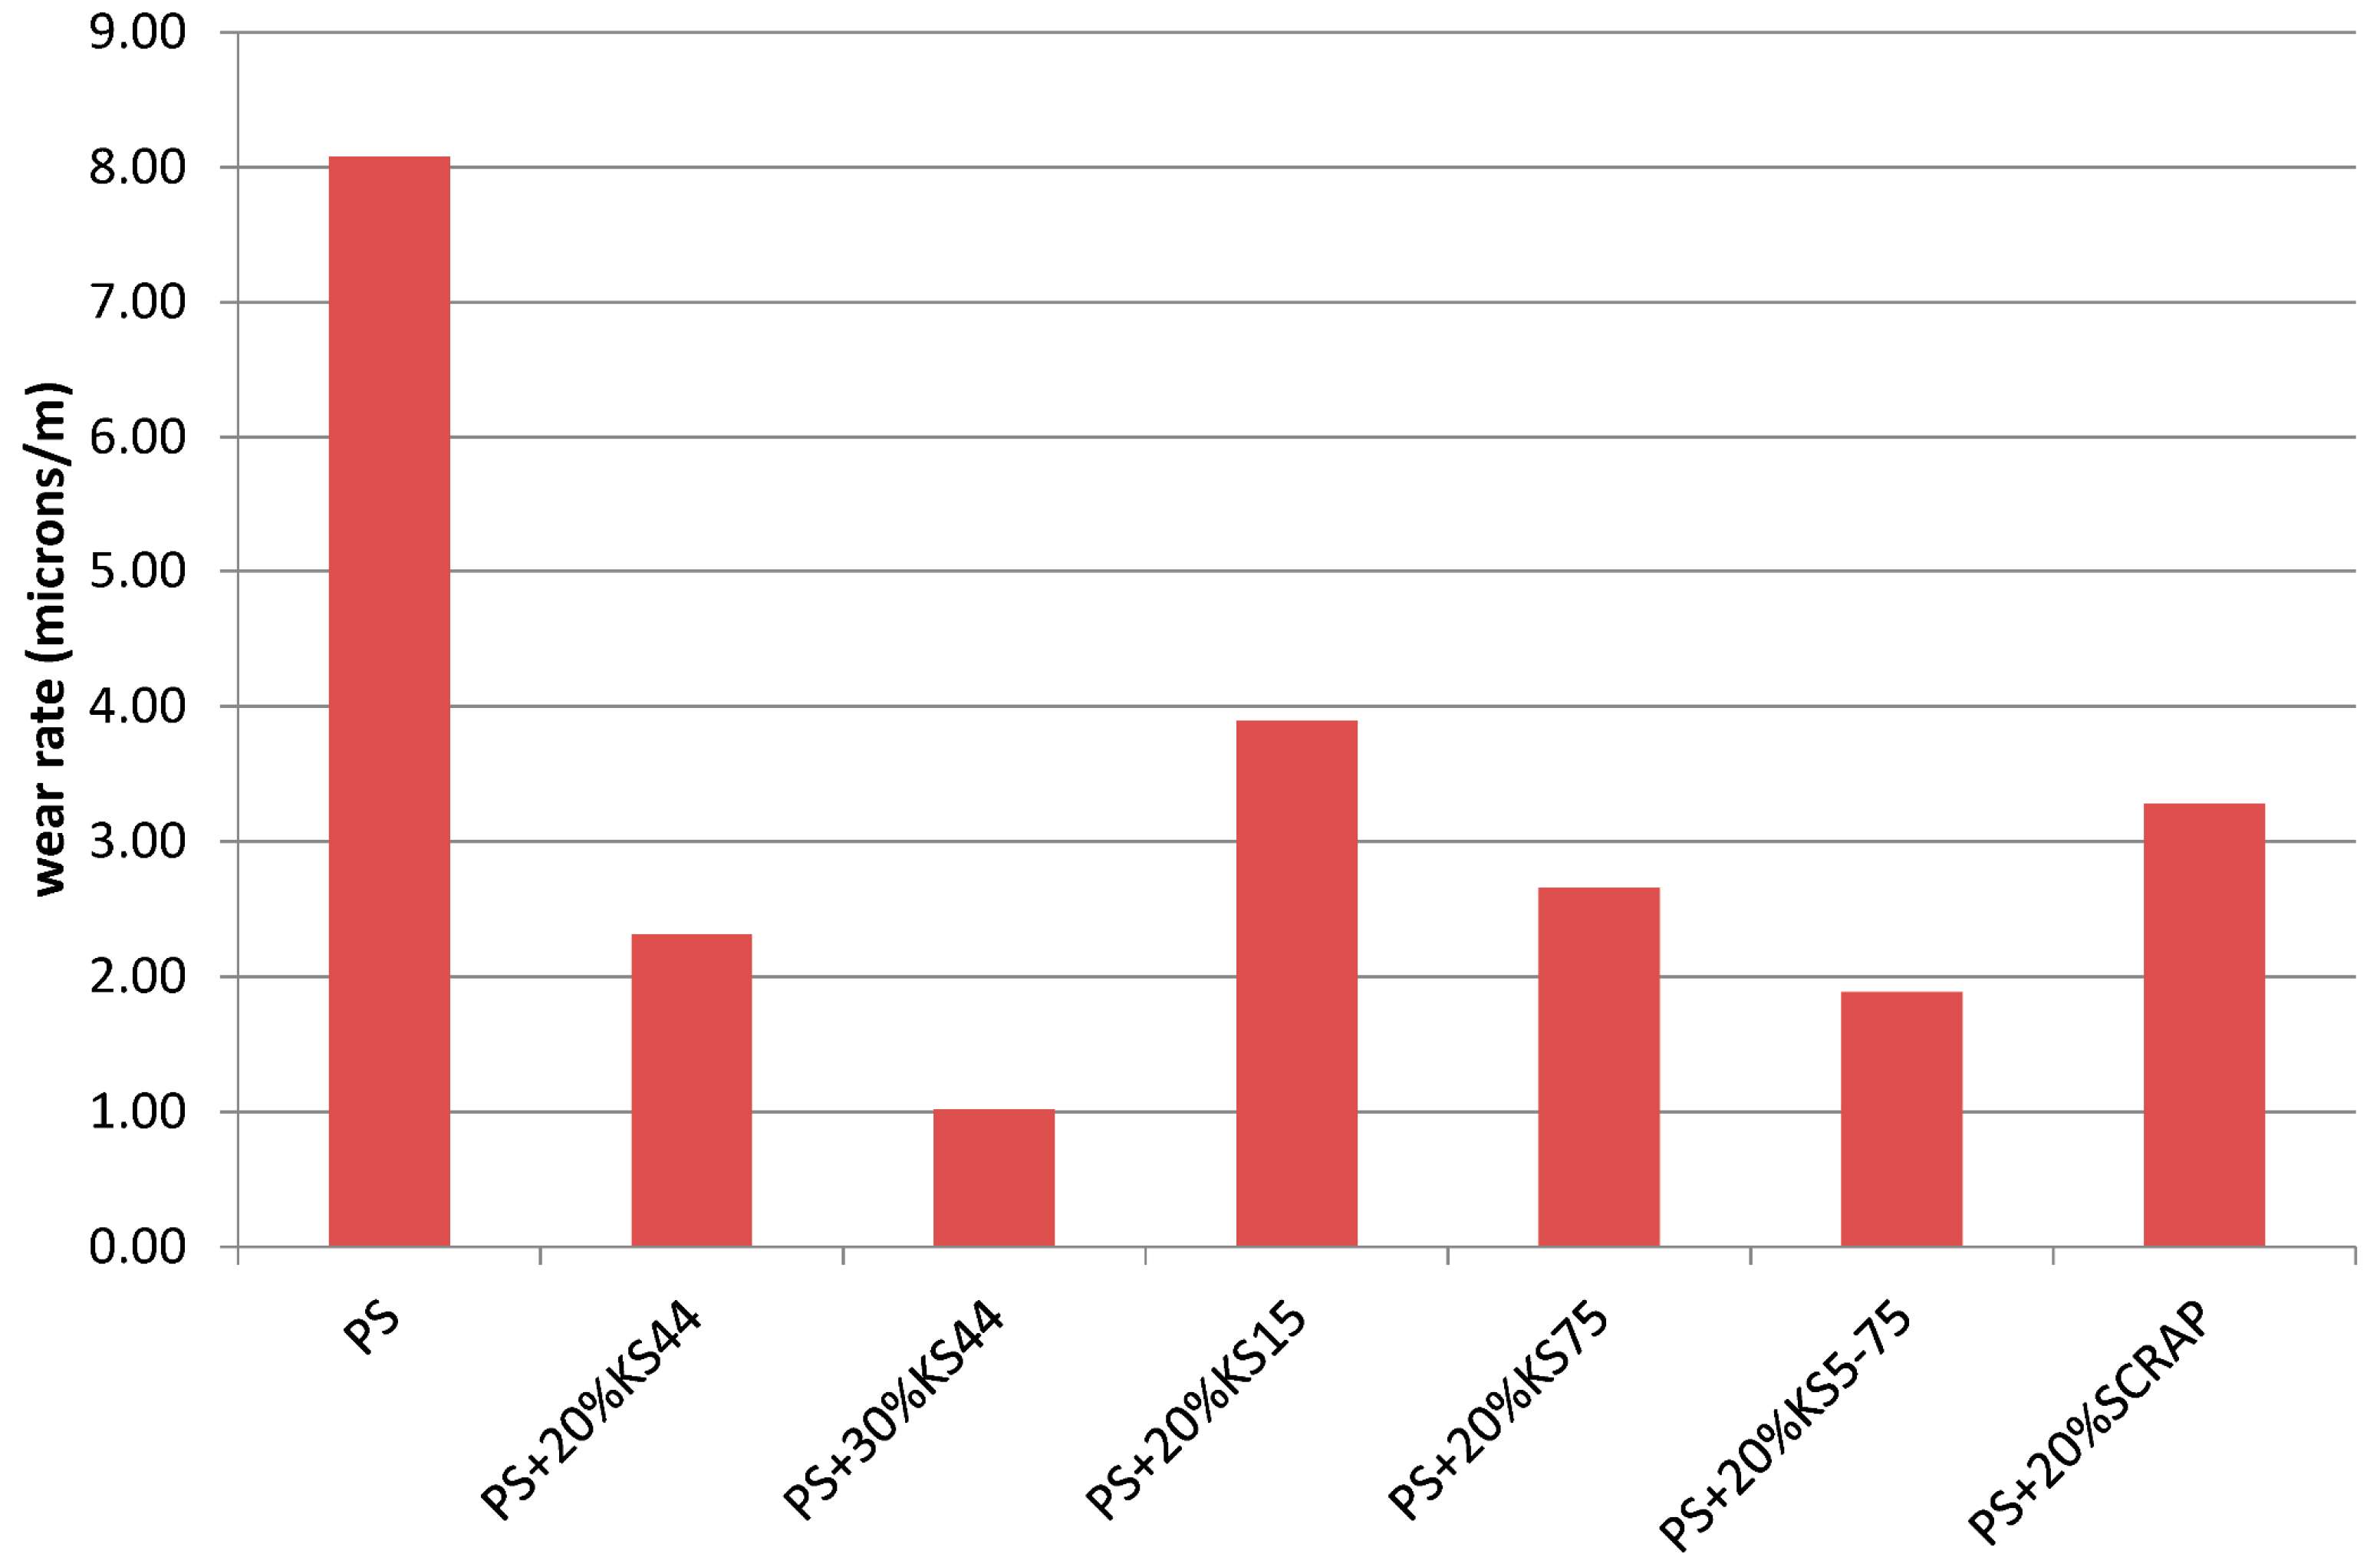
2.1.2. Wear Tests
Wear tests were performed at a constant force (30 N) and a constant speed (500 rpm). The friction coefficient and wear rate were measured for all the compounds apart from the one with 10% KS10. As shown in Figure 3, the wear rate of virgin PS is very high (due to the high friction coefficient). Surprisingly, the wear rate for the fine graphite (KS15) was higher than that for the coarse graphite (KS5-75) despite the lower friction coefficient and higher PV limit (see Figure 1). A possible explanation is that fine graphite can more easily wear out from the PS compound and therefore create a good tribofilm that gives a low friction coefficient and a high limiting force. On the other hand, coarse graphite is probably more difficult to detach from the polymer compound (which is good for a high wear resistance) and cannot create a nice tribofilm on steel (which is bad for the friction coefficient and limiting force). KS44 and KS75 have wear rates between KS5-75 and KS15 (which is consistent with our explanation), whereas the SCRAP graphite has a slightly higher wear rate than KS75, probably due to the lower degree of crystallinity.
2.2. Graphite-Filled PS against Polyamide Ball
2.2.1. PV Limit Tests
In Figure 4, the results from tribological tests are shown with the PA66 ball rotating on graphite-filled PS plates at a constant speed (500 rpm corresponding to 0.235 m/s) and varying normal force. By changing the ball material from metal (steel) to plastic (PA66), there is a dramatic change in the test results. Unfilled PS can withstand higher forces against PA66 compared to steel and only after the limiting force of 10 N, there is a sharp increase in friction coefficient.
With the PA66 ball, 10% KS44 is sufficient to stabilize the friction at ca. 0.1 up to 13 N. By adding more graphite (20% KS44, 30% KS44), one can further improve the performance. The friction coefficient is only slightly reduced compared to 10% KS44, whereas the limiting force increases up to 19 N. The effect of the graphite particle size is less evident than in the case of the steel ball, with KS15, KS44, KS75, and KS5-75 showing a similar friction coefficient and limiting force. As in the case of the steel ball, we observed a big difference between primary and secondary synthetic graphite: SCRAP graphite has a slightly higher friction coefficient and a much lower limiting force (14 N) compared to KS75 (19 N).
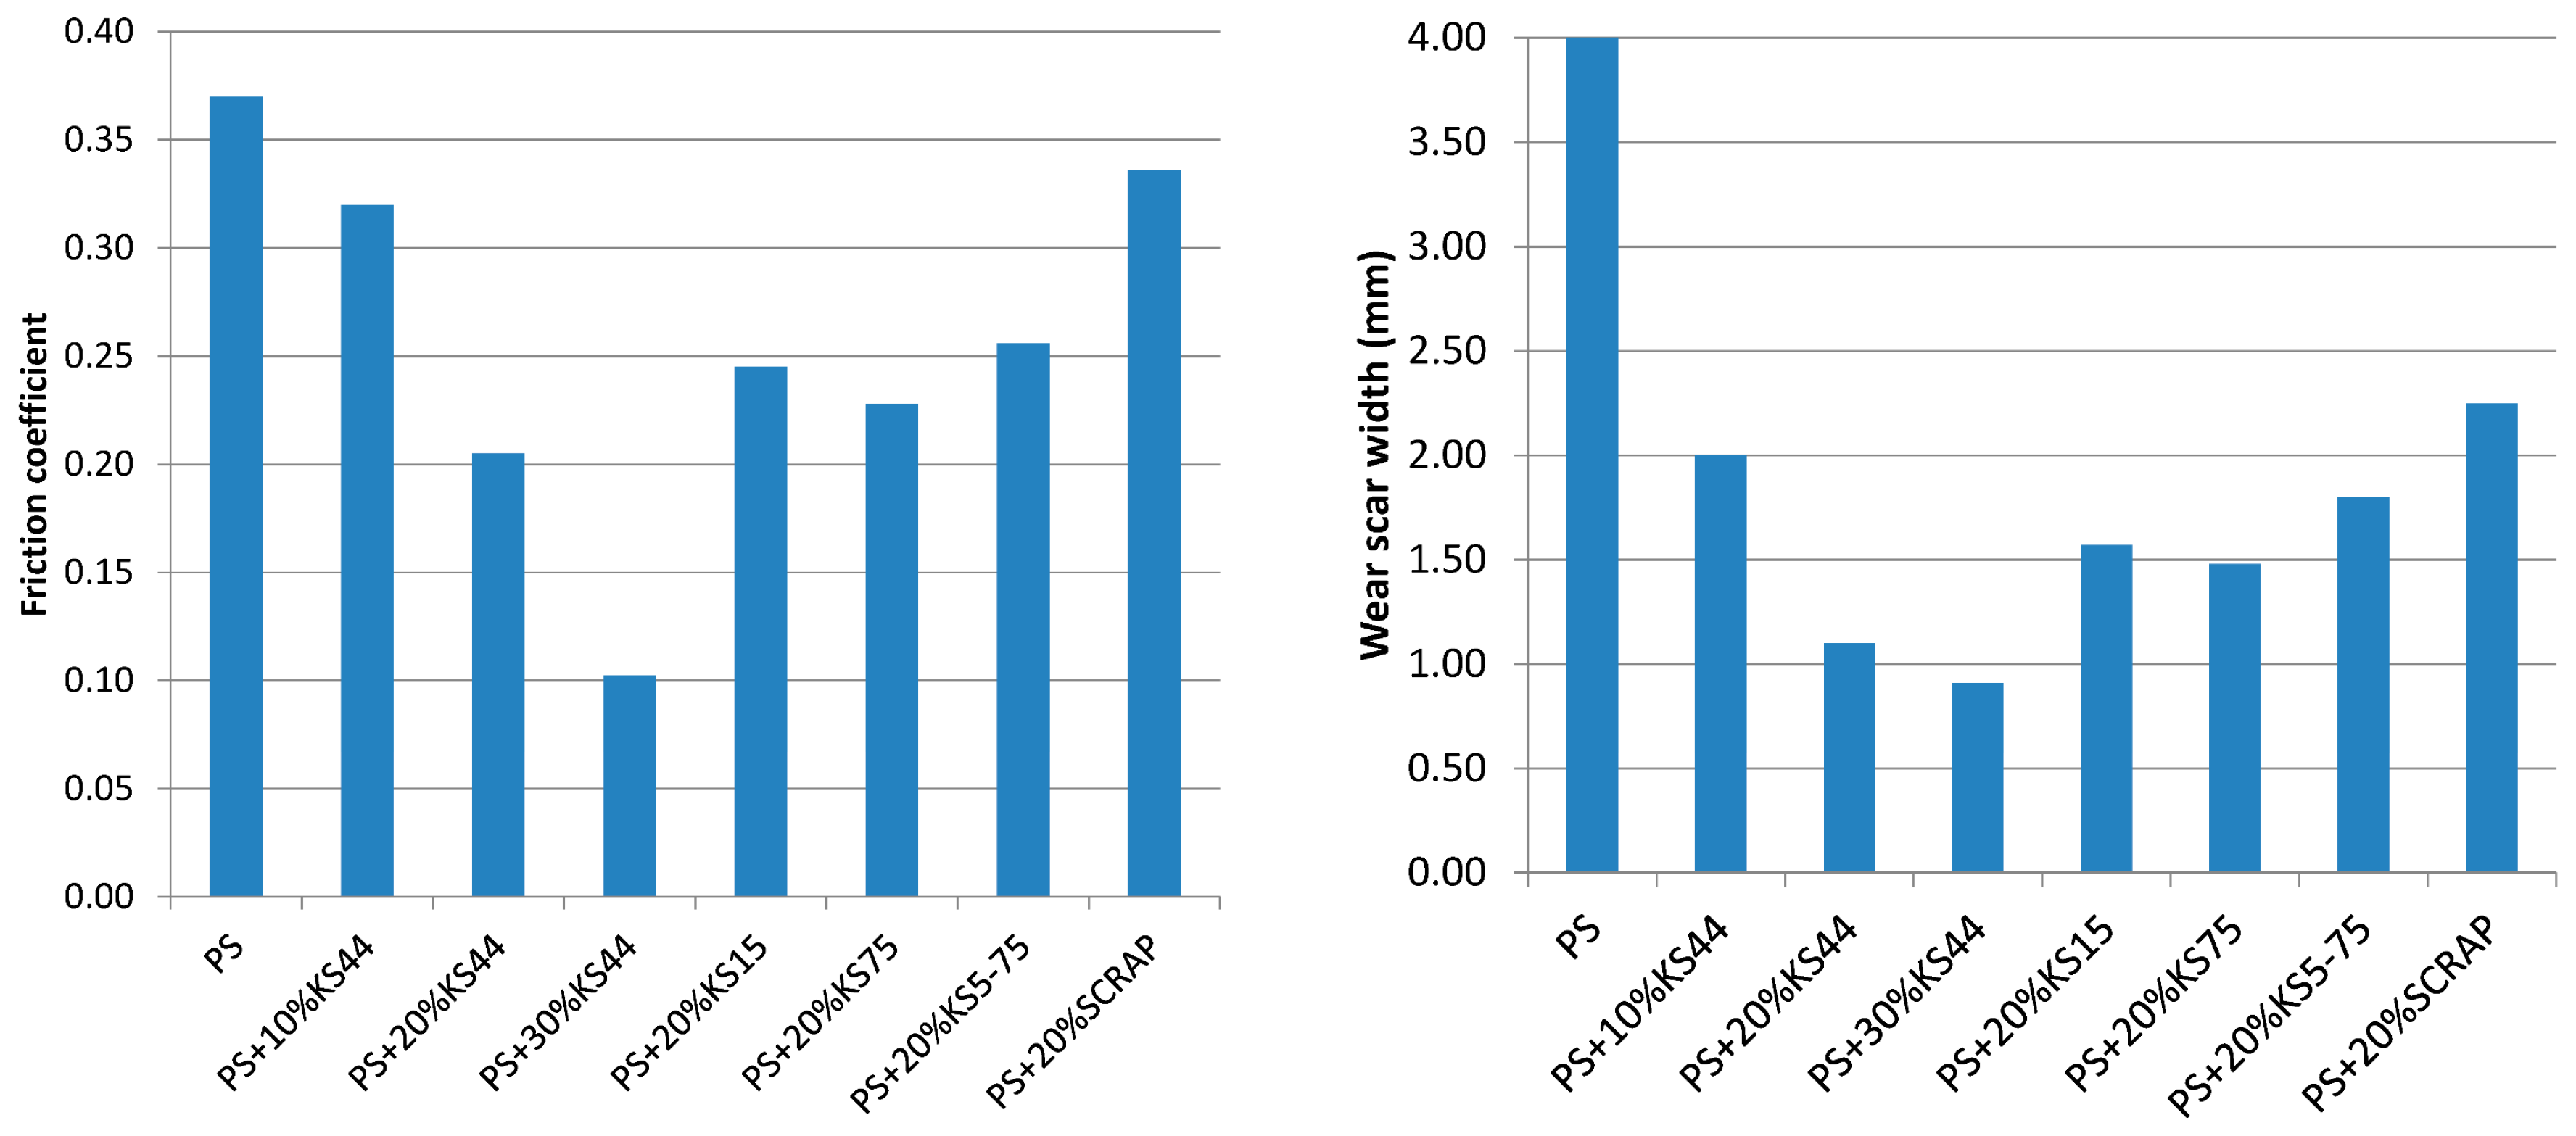
2.2.2. Wear Tests
Wear tests were performed at a constant force (10 N) and a constant speed (500 rpm). For most of the samples, the friction coefficient is not stable for the entire duration of the test (10 min) and gradually increases from ca. 0.1 up to the final value shown in Figure 5 (left). Only formulations with 30% KS44 could maintain a low and stable friction coefficient for the entire duration of the tests. The friction coefficient increased up to ca. 0.20–0.25 for samples with 20% KS graphite, whereas, for samples with 10% KS44 and 20% SCRAP, the friction coefficient increased to >0.30.
After the wear tests, the wear scar images were analyzed with a digital optical microscope (see Figure 6), and the measured width of the wear scar is displayed in Figure 5 (right).
As expected, samples with a higher final friction coefficient have larger wear scars. In the case of unfilled PS, the wear scar is extremely large, and we could observe molten polymer transported from the ball on the side of the wear scar. This means that, during the wear test, local temperatures >200 °C had been reached. The wear scar size was strongly reduced as the amount of KS44 increased. At a 20% loading level, SCRAP graphite leads to larger wear scars compared to KS graphite.
3. Discussion
Our test results clearly show that the tribological behavior of graphite-filled PS against metal (unhardened steel 1.4401) is very different compared to plastic (PA66). In particular, tests with the steel ball produced a higher friction coefficient and a higher wear rate, but also a higher PV limit, compared to PA66 ball. This apparent contradiction can be explained by the fact that steel has higher thermal conductivity compared to PA66 (16.2 W/m·K vs. 0.25 W/m·K). Therefore, the steel ball can dissipate part of the frictional heat, whereas in the case of PA66 most of the heat has to be dissipated by the graphite-filled PS plates. As a consequence, the limiting force in the case of the steel ball was higher than the PA66 ball despite the higher friction coefficient (and related frictional heat).
Besides material combinations and thermal conductivity, other factors that influence the tribological performance of PS are graphite loading and graphite particle size. Against steel, 20% primary synthetic graphite is necessary to decrease the friction coefficient and increase the PV limit. Fine graphite particles lead to better performance in terms of a low friction coefficient, whereas coarse graphite is better in terms of wear resistance. Against PA66, 10% primary synthetic graphite is sufficient to decrease the friction coefficient and increase the PV limit, whereas graphite PSD has no significant influence.
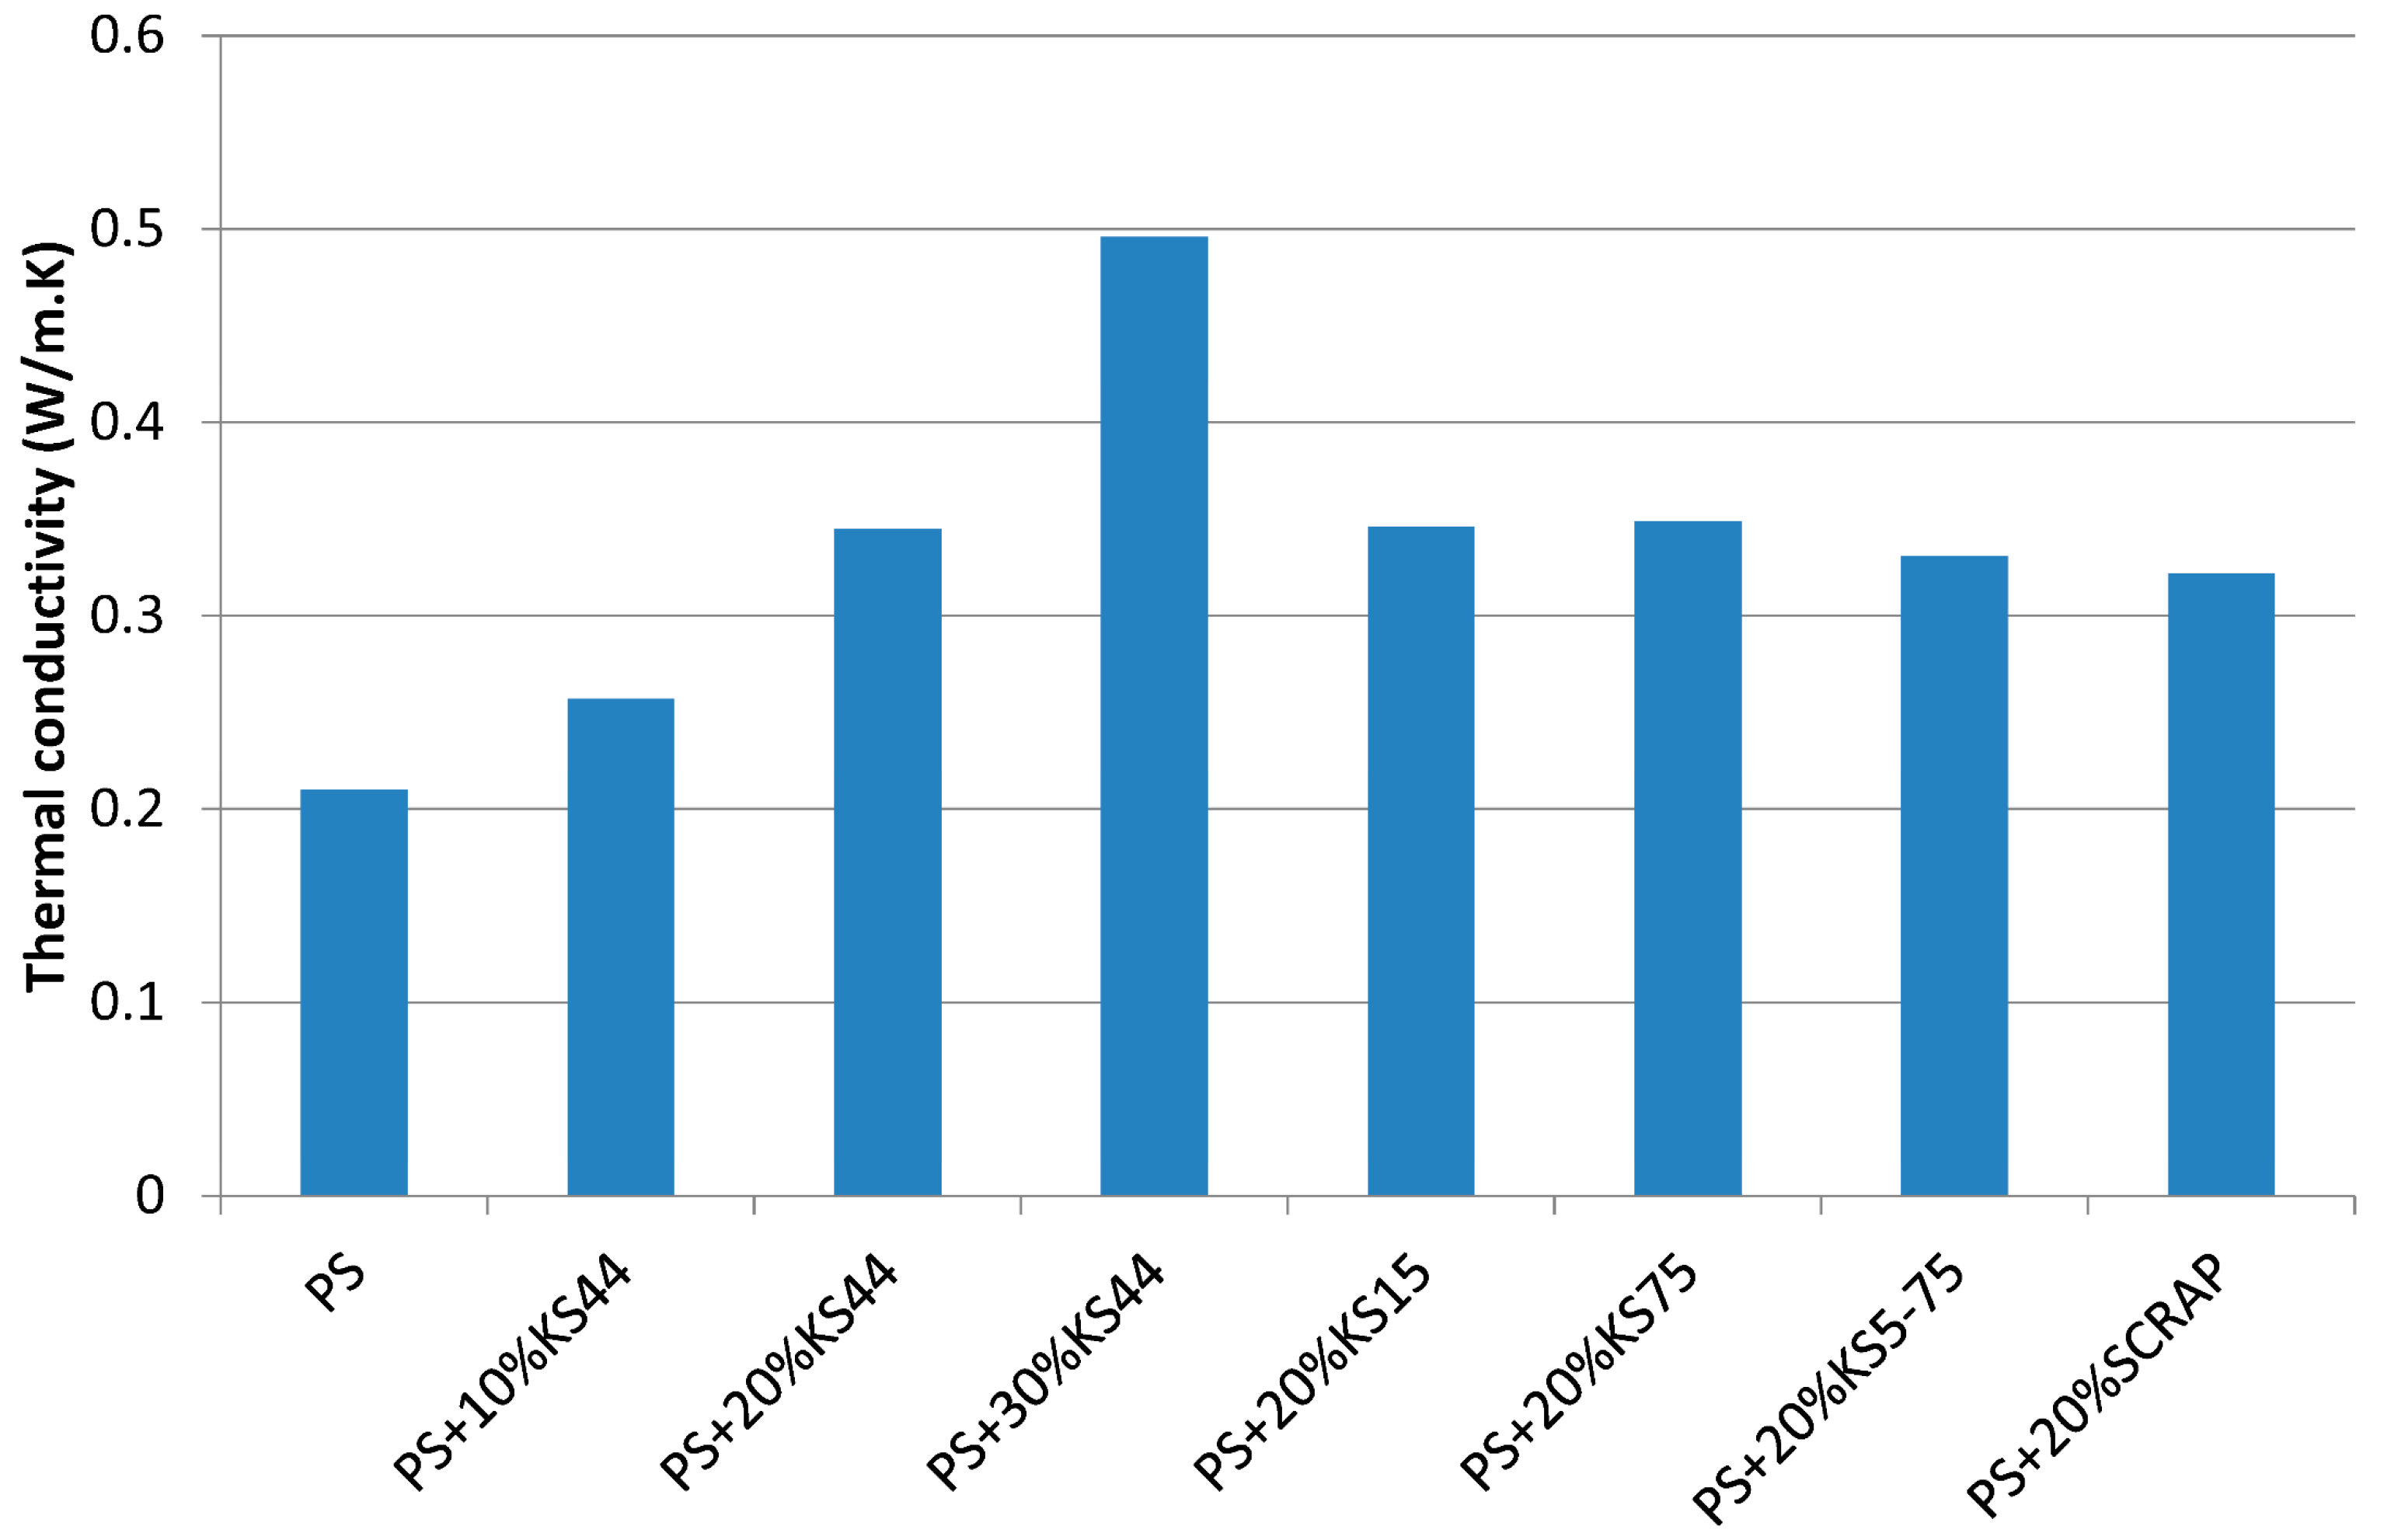
Secondary synthetic graphite performs worse than primary synthetic graphite in all aspects, probably due to the lower crystallinity, which leads to a lower degree of lubrication and lower thermal conductivity (see Figure 7). Overall, polystyrene compounds with KS44 graphite at loading levels of 20%–30% show optimal tribological performance in our experiments.
4. Materials and Methods
4.1. Graphite Powders
Five different graphite powders have been considered for this study:
- primary synthetic graphite (KS) with four different particle size distributions (PSDs);
- secondary synthetic graphite (SCRAP).
Secondary synthetic graphite is a by-product of the graphite electrode industry and usually has a lower level of crystallinity and shows wider property variations between different production lots compared to primary synthetic graphite that is produced with a dedicated process (Acheson furnace) [2]. The properties of the tested graphite powders are listed in Table 1.
All graphites have a high purity and have a particle size below 100 microns. As expected, by increasing the particle size the BET is strongly reduced. SCRAP graphite has lower crystallinity compared to primary synthetic graphite with a similar PSD (KS 75).
4.2. Polymer Compounds and Sample Preparation
The following graphite-filled polystyrene (PS) compounds were prepared by internal mixer (HAAKE Rheomix 600 OS).
- PS + 10 wt % KS44
- PS + 20 wt % KS44
- PS + 30 wt % KS44
- PS + 20 wt % KS15
- PS + 20 wt % KS75
- PS + 20 wt % KS5-75
- PS + 20 wt % SCRAP
Polystyrene (EMPERA 124 N) was mixed with graphite for 5 min at 220 °C and 100 rpm. 100 × 100 × 4 mm3 plates were prepared by compression molding using a LabTech Scientific LP-S-20 press. Samples for tribology tests (14 × 6 × 4 mm3) and discs for thermal conductivity measurements were cut using a CNC machine.
4.3. Tribology Tests
Tribology tests were performed on a MCR 302 rheometer (Anton Paar, Graz, Austria) equipped with a tribology cell (T-PTD 200). The setup is based on the ball-on-three-plates principle consisting of a shaft, where a ball is held, and an inset where three small plates can be placed [8]. In our case, the three plates were the graphite-filled PS specimen produced via an internal mixer and compression molding, whereas unhardened steel (1.4401) and polyamide (PA6.6) balls were used for our experiments. In order to determine the limiting force (PV limit), we performed tests at a constant rotational speed (500 rpm corresponding to 0.235 m/s) and then an increasing normal force (from 1 N to 50 N over 10 min). Wear tests were performed at a constant velocity (500 rpm) and constant speed (10 N for PA66 ball, 30 N for steel ball) for 10 min. The wear rate can be quantified by measuring the height of the shaft as a function of time during the test or by measuring the wear scar diameter after the tests. Images of wear scars were taken by digital optical microscope (DM4000, Leica Microsystems, Wetzlar, Germany). All tests were performed at ambient temperature.
4.4. Thermal Conductivity Tests
Thermal conductivity tests were performed in the through-plane direction at room temperature using Laserflash (NETZSCH LFA 447) on discs with a diameter of 25.4 mm and a thickness of 4 mm. The results are summarized in Figure 7. Thermal conductivity increases with increasing graphite content (KS44). The thermal conductivity at the same loading level (20 wt %) is similar for all synthetic graphites, but slightly lower for the SCRAP graphite.
5. Conclusions
Our experimental study of graphite-filled polystyrene indicates that the tribological performance strongly depends on many factors.
First of all, the counterpart material can completely change the friction coefficient and wear resistance of the polymer compound. The friction coefficient and wear against metals (steel in this case) is much higher compared to plastics (PA66 in this case). On the other hand, the PV limit is higher for steel compared to PA66.
Secondly, as expected, the graphite loading level has a significant influence on the tribological performance. However, the loading effect on the friction coefficient, the wear resistance, and the PV limit is not linear. At very low loadings (≤10%), graphite has no effect. At medium loadings (ca. 20%), there is a strong improvement in all tribological properties, whereas, at high loadings (≥30%), the performance is only slightly improved. The optimum loading level depends on many parameters and must be determined for each final application.
Thirdly, the graphite particle size can play a significant role. In our study, we observed a significant influence on PSD, especially against steel, but not against PA66.
Finally, the selection of the graphite type is crucial in order to achieve good tribological performance. In particular, primary synthetic graphite performs better than secondary synthetic graphite due to the higher degree of crystallinity, which leads to a higher degree of lubrication and higher thermal conductivity (better dissipation of frictional energy).
Acknowledgments
The author would like to acknowledge his colleagues at Imerys Graphite & Carbon: Guglielmo Fieni for preparing the polymer compounds, Diego Paini for preparing the samples for tribology and thermal conductivity tests, Samantha Novak for performing tribology tests, and Massimo Bulgheroni for performing tribology and thermal conductivity tests.
Conflicts of Interest
The author declares no conflict of interest.
Abbreviations
The following abbreviations are used in this manuscript:
| PSD | particle size distribution |
| PV | tribological stress (pressure–velocity) |
| P | pressure |
| V | velocity |
| PS | Polystyrene |
| PA66 | polyamide 6.6 |
References
- Brostow, W.; Kovacevic, V.; Vrsaliko, D.; Whitworth, J. Tribology of polymers and polymer-based composites. J. Mater. Educ. 2010, 32, 273–290. [Google Scholar]
- Gilardi, R.; Bonacchi, D.; Spahr, M.E. Graphitic Carbon Powders for Polymer Applications. In Polymers and Polymeric Composites: A Reference Series; Palsule, S., Ed.; Springer-Verlag: Heidelberg, Germany, 2016; pp. 1–25. [Google Scholar]
- Bijwe, J.; Nidhi. Potential of fibers and solid lubricants to enhance the tribo-utility of PEEK in adverse operating conditions. Ind. Lubr. Technol. 2007, 59, 156–165. [Google Scholar] [CrossRef]
- Xian, G.; Zhang, Z. Sliding wear of polyetherimide matrix composites II. Influence of graphite flakes. Wear 2005, 258, 783–788. [Google Scholar] [CrossRef]
- Samyn, P.; Schoukens, G. On the efficiency of internal lubricants for polymers under different sliding conditions. J. Vinyl Addit. Technol. 2008, 14, 126–135. [Google Scholar] [CrossRef]
- Bijwe, J.; Kadiyala, A.K.; Kumar, K.; Puhan, D.; Parida, T.; Trivedi, P. Development of high performance poly (ether-ketone) composites based on novel processing technique. Mater. Des. 2015, 73, 50–59. [Google Scholar] [CrossRef]
- Kalin, M.; Zalaznik, M.; Novak, S. Wear and friction behavior of poly-ether-ether-ketone (PEEK) filled with graphene, WS2 and CNT nanoparticles. Wear 2015, 332–333, 855–862. [Google Scholar] [CrossRef]
- Heyer, P.; Läuger, J. Correlation between friction and flow of lubricating greases in a new tribometer device. Lubr. Sci. 2009, 21, 253–268. [Google Scholar] [CrossRef]
Figure 1.
Friction coefficient as a function of normal force for a steel ball at constant rotational speed (500 rpm) for different graphite-filled compounds.
Figure 1.
Friction coefficient as a function of normal force for a steel ball at constant rotational speed (500 rpm) for different graphite-filled compounds.
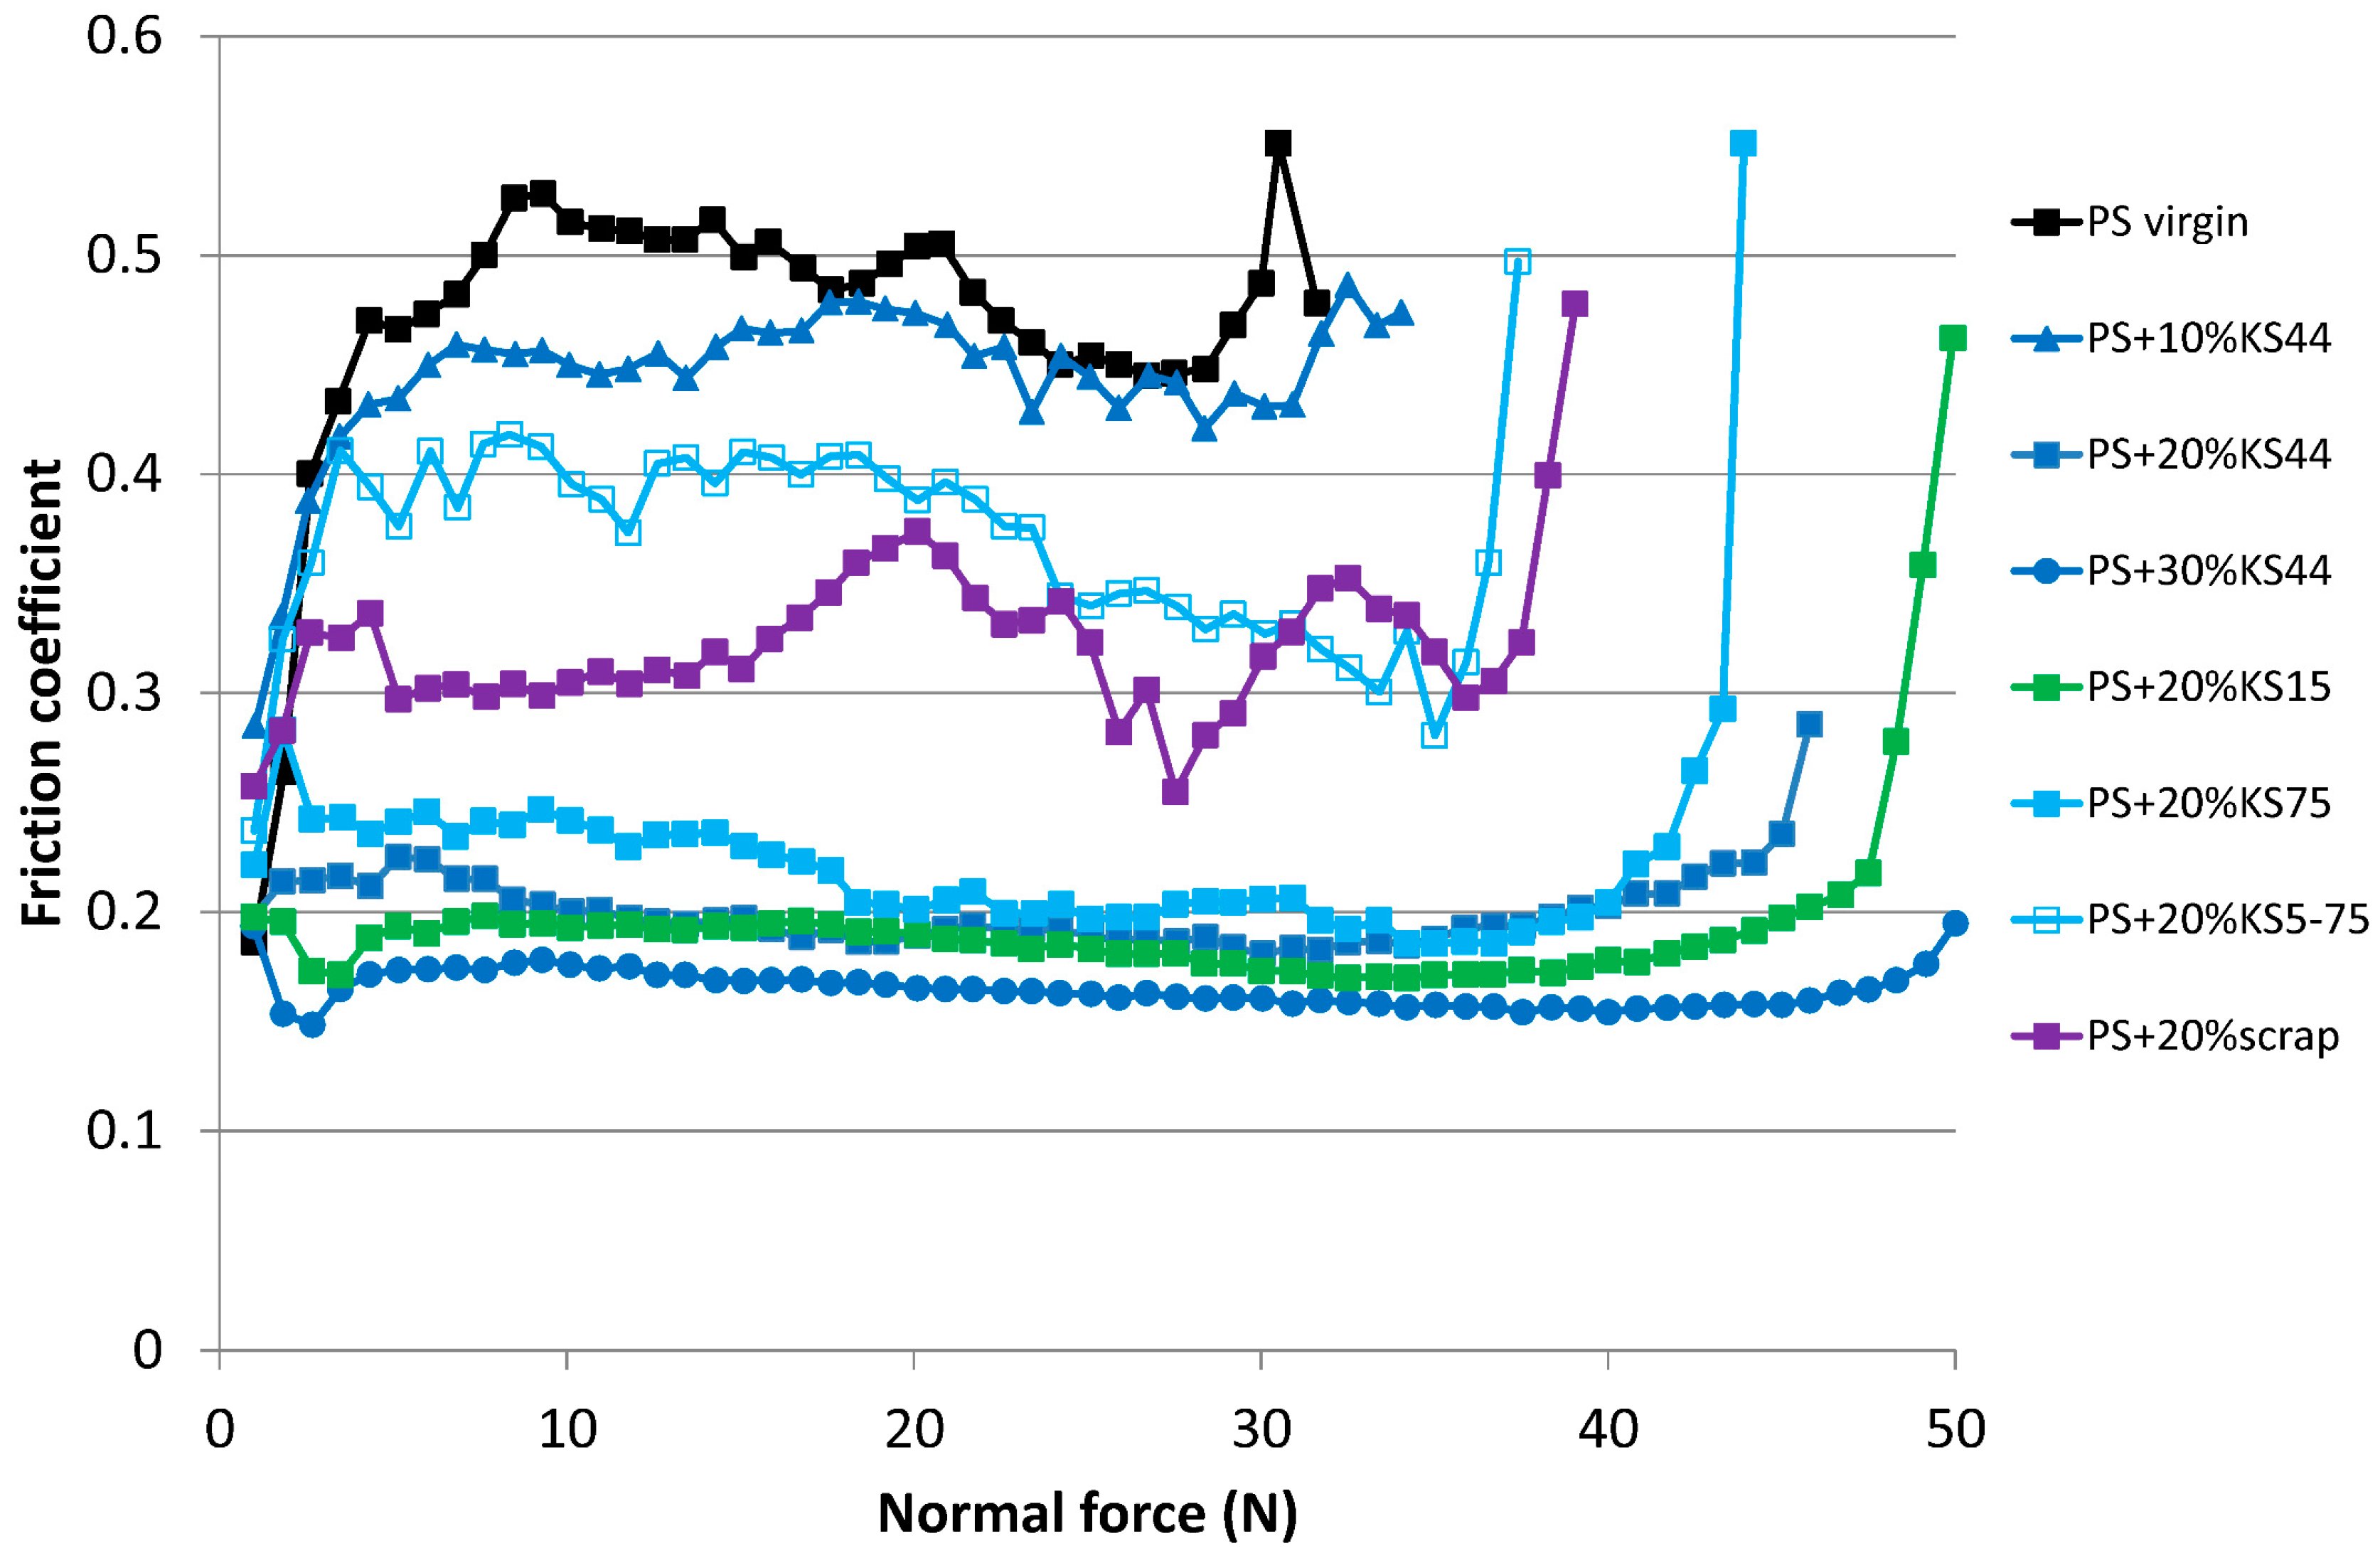
Figure 2.
Friction coefficient and limiting force for graphite-filled PS compounds against a steel ball as a function of the KS44 graphite loading (left) and as a function of the particle size (right).
Figure 2.
Friction coefficient and limiting force for graphite-filled PS compounds against a steel ball as a function of the KS44 graphite loading (left) and as a function of the particle size (right).

Figure 3.
Wear rate of the graphite-filled PS compounds at a constant velocity (500 rpm) and force (30 N) against the steel ball.
Figure 3.
Wear rate of the graphite-filled PS compounds at a constant velocity (500 rpm) and force (30 N) against the steel ball.

Figure 4.
Friction coefficient as a function of normal force for PA66 ball at fixed rotational speed (500 rpm) for different graphite-filled compounds.
Figure 4.
Friction coefficient as a function of normal force for PA66 ball at fixed rotational speed (500 rpm) for different graphite-filled compounds.
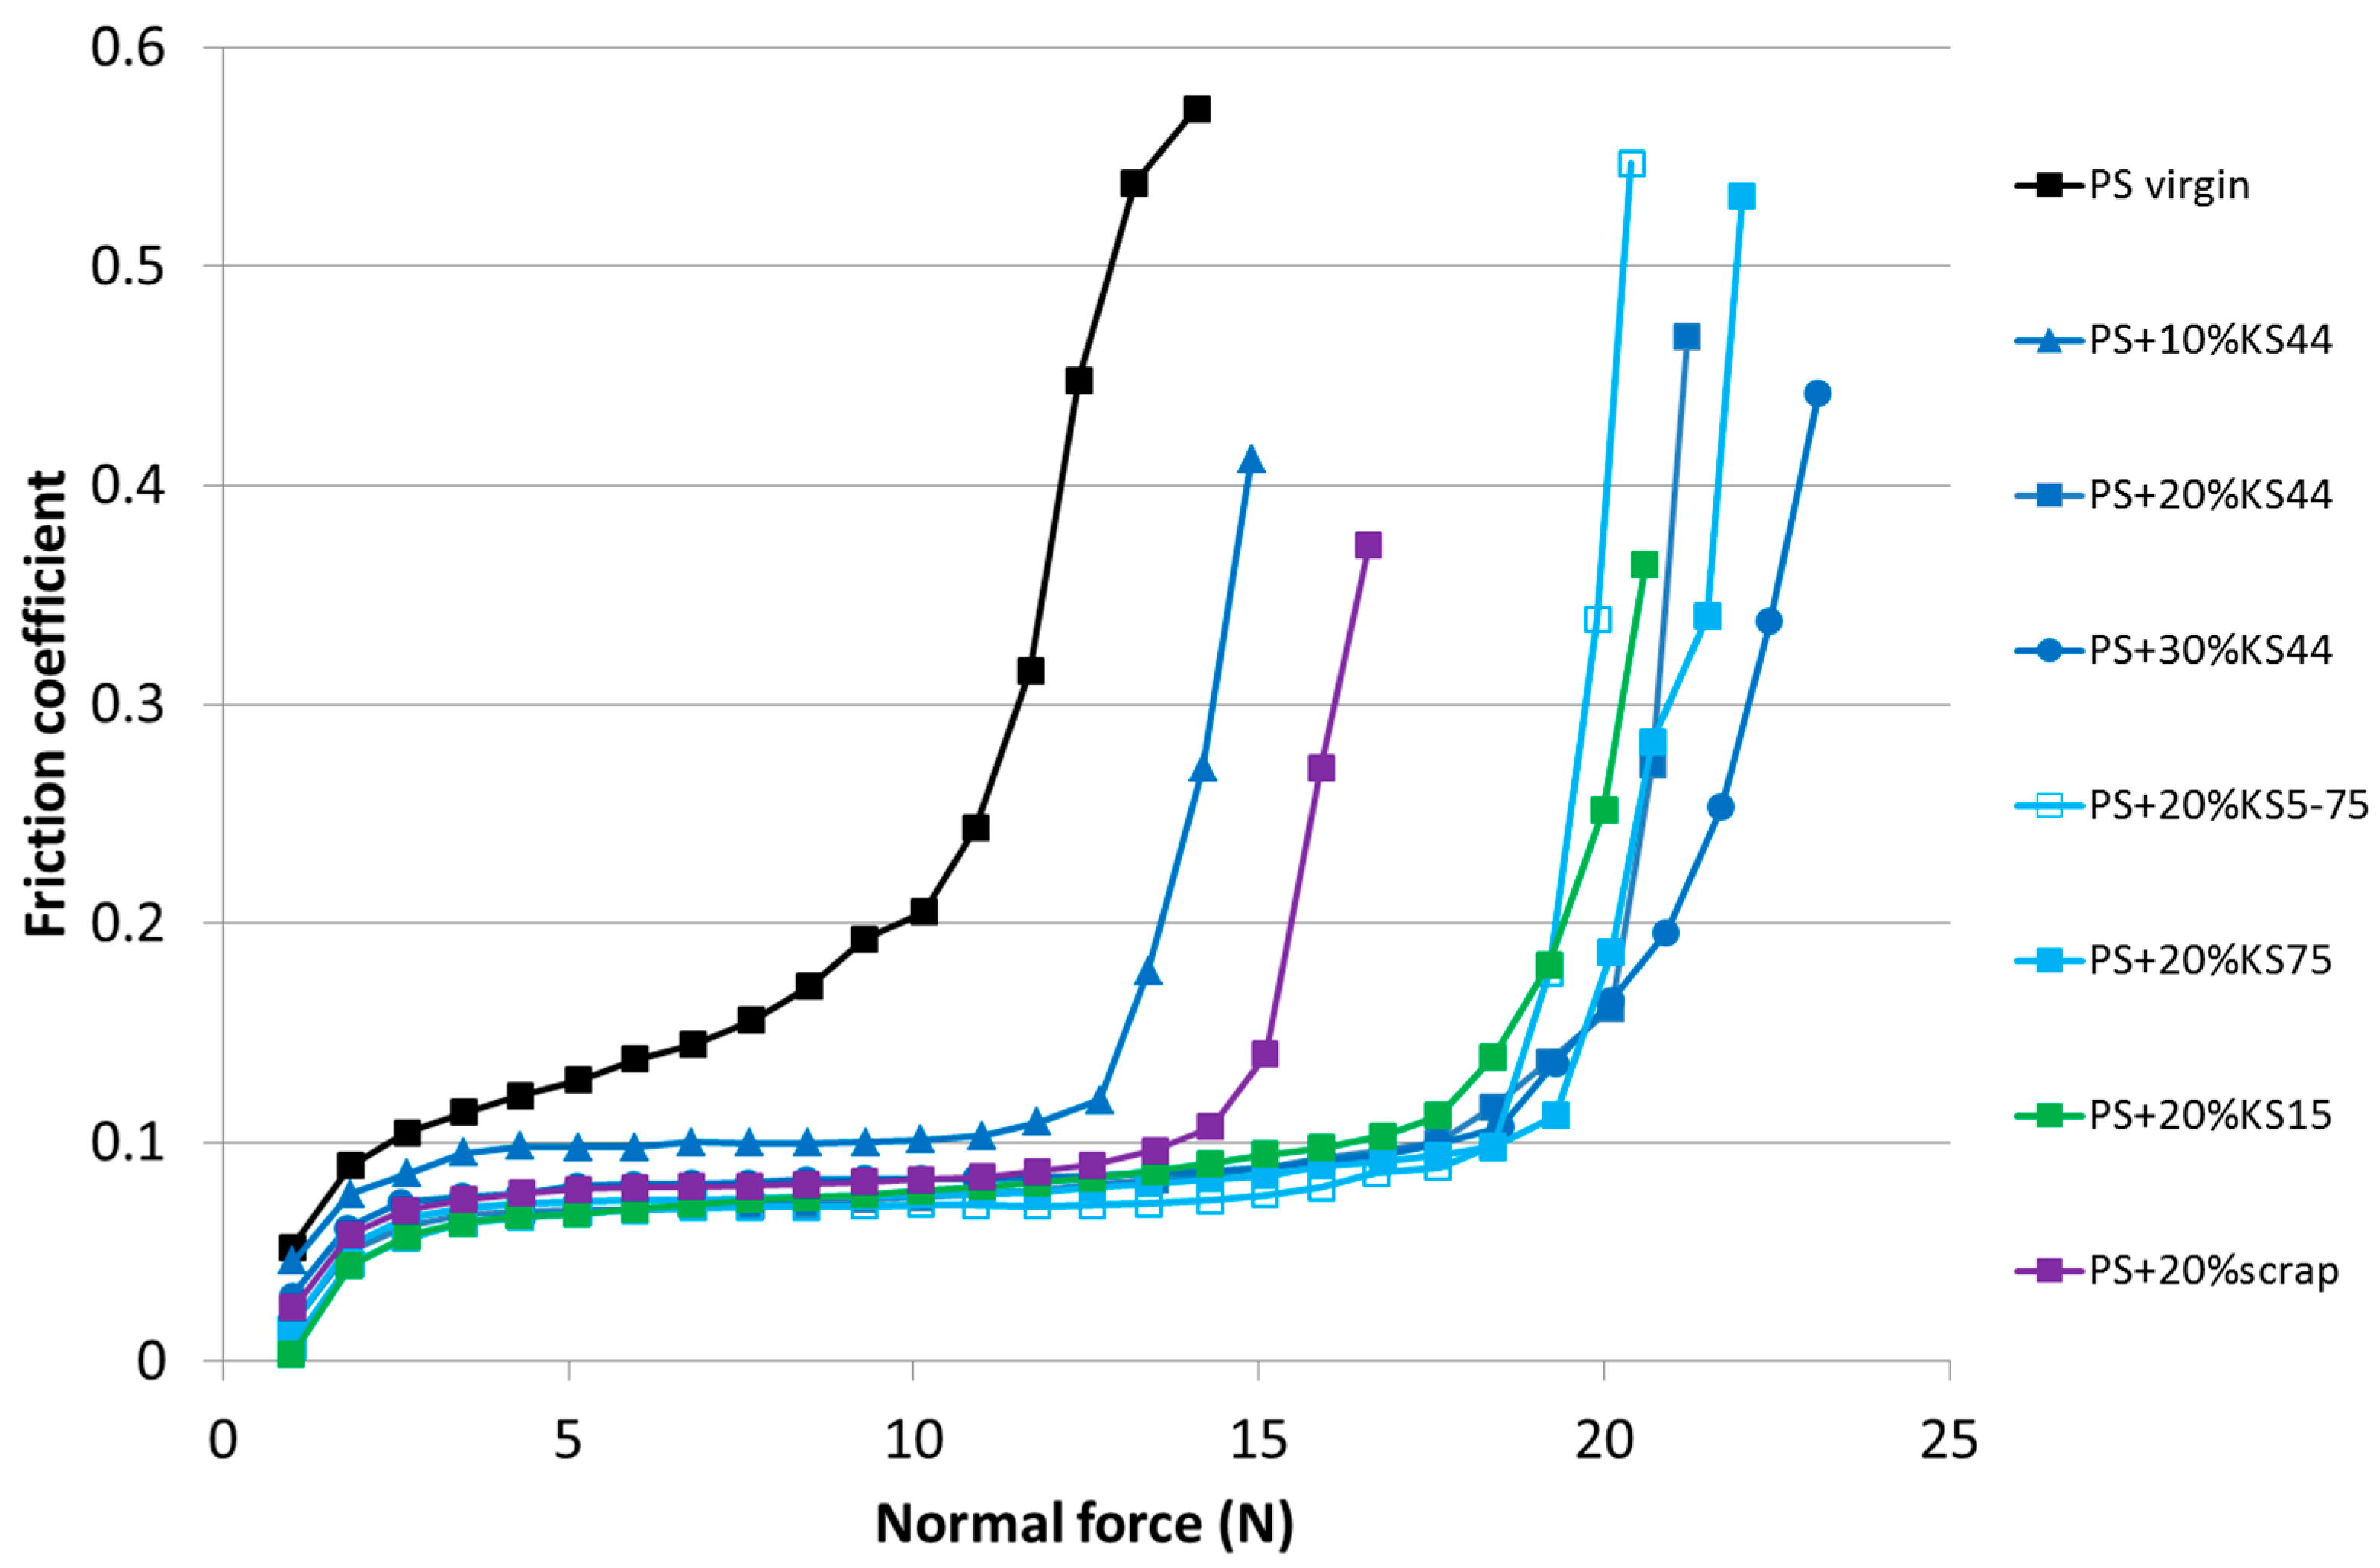
Figure 5.
Friction coefficient (left) and wear scar width (right) at the end of the wear test with PA66 ball (after 10 min at 10 N/500 rpm).
Figure 5.
Friction coefficient (left) and wear scar width (right) at the end of the wear test with PA66 ball (after 10 min at 10 N/500 rpm).

Figure 6.
Images of wear scar after wear tests with the PA66 ball. The blue bars represent 1 mm.
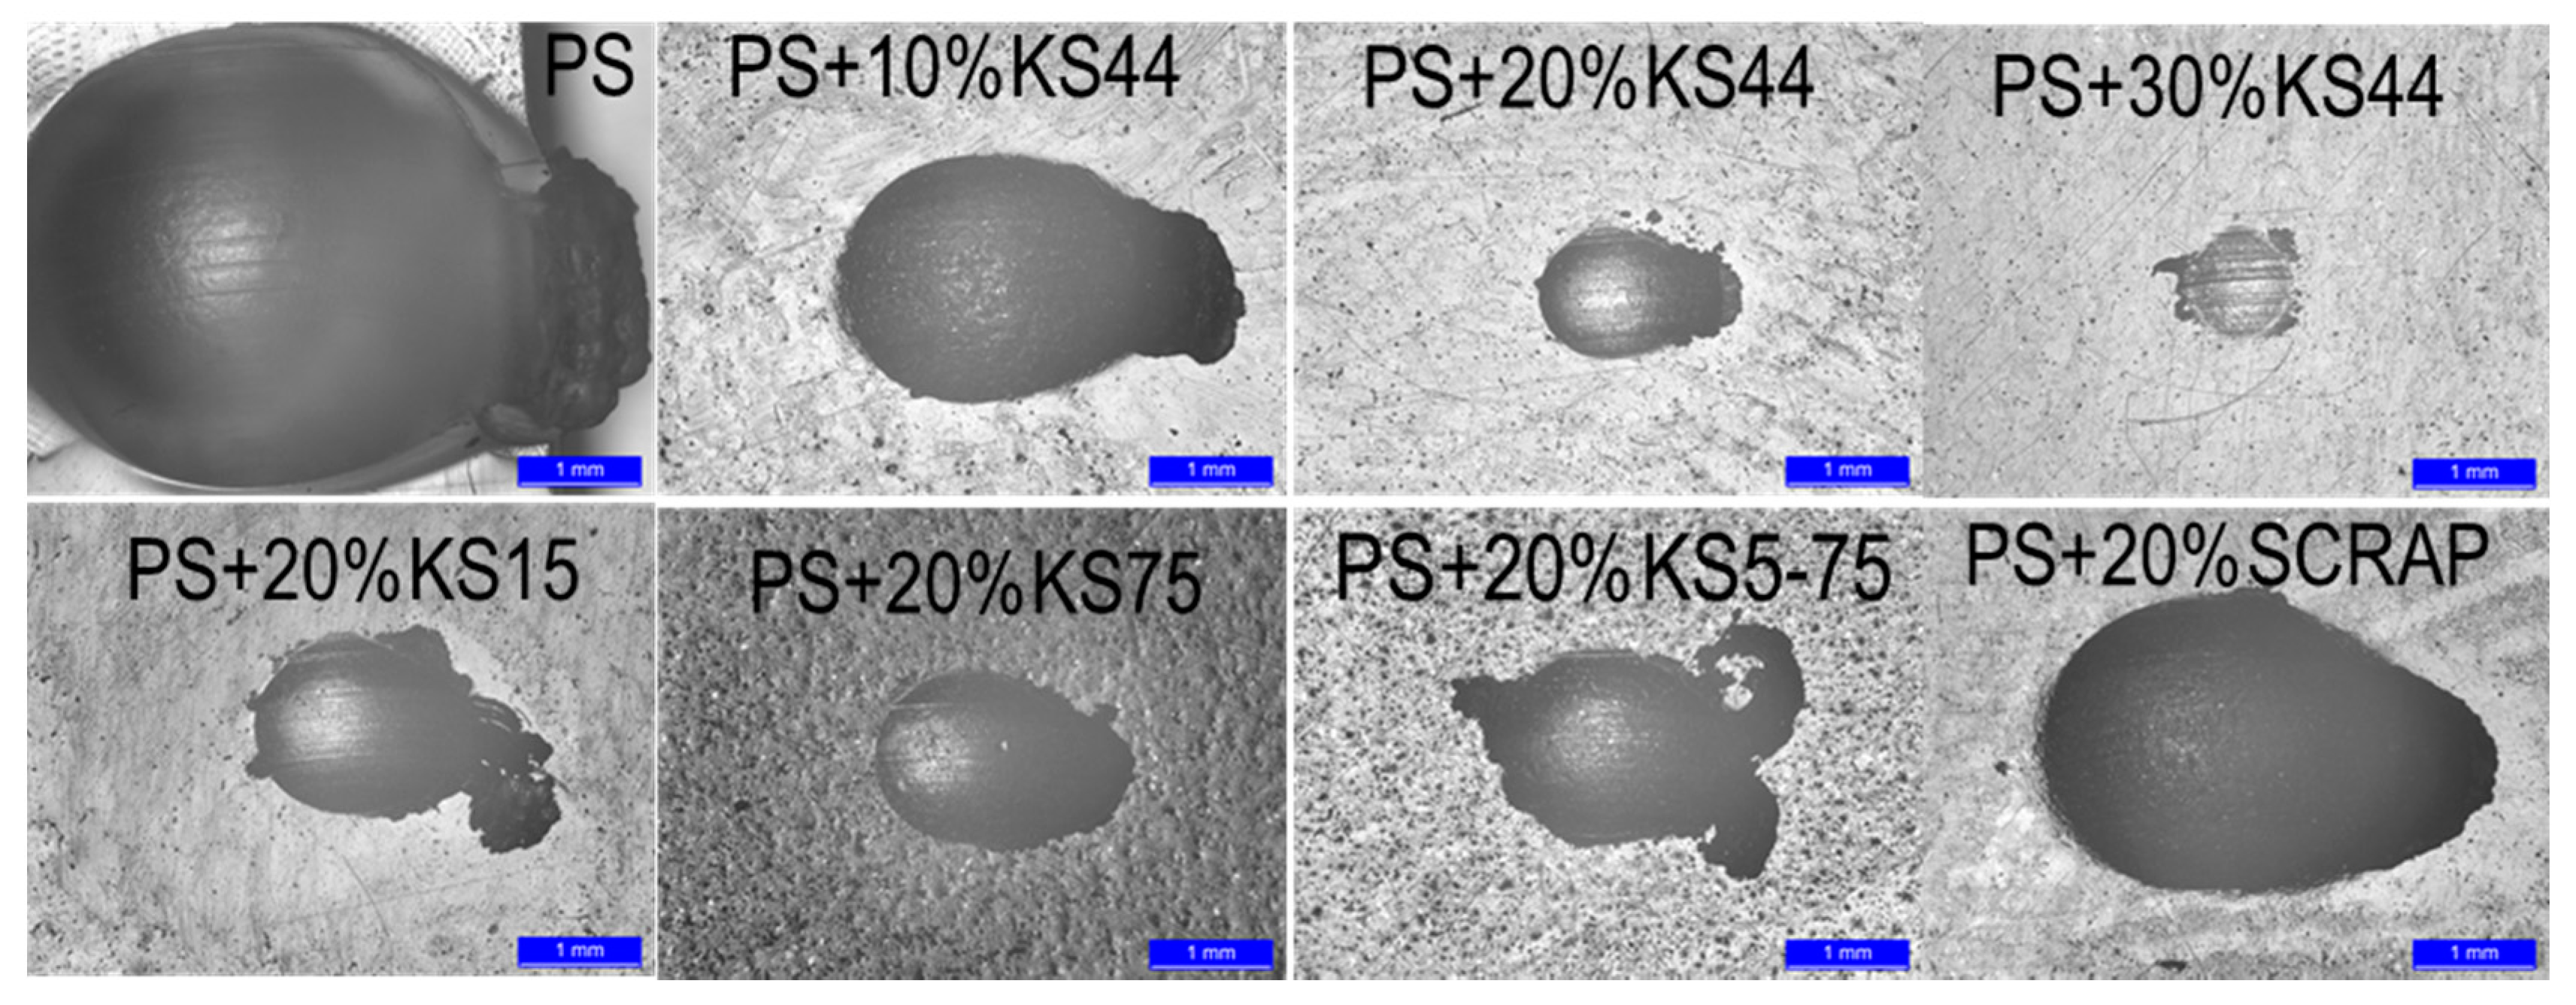
Figure 7.
Through-plane thermal conductivity of compression-molded plates.


Table 1.
Properties of tested graphites: purity (ash content), particle size distribution (d10, d50, d90), crystallinity (Lc), and specific surface area (BET).
| Graphite | Ash (%) | d10 (μm) | d50 (μm) | d90 (μm) | Lc (nm) | BET (m2/g) |
|---|---|---|---|---|---|---|
| KS15 | 0.02 | 3.2 | 8.1 | 17.4 | 107 | 12.7 |
| KS44 | 0.02 | 4.7 | 18.0 | 46.1 | 161 | 8.9 |
| KS75 | 0.02 | 5.2 | 21.8 | 54.2 | 159 | 6.9 |
| KS5-75 | 0.01 | 13.9 | 37.3 | 67.6 | 206 | 4.1 |
| SCRAP | 0.10 | 5.4 | 23.4 | 58.9 | 109 | 5.9 |
© 2016 by the author; licensee MDPI, Basel, Switzerland. This article is an open access article distributed under the terms and conditions of the Creative Commons Attribution (CC-BY) license (http://creativecommons.org/licenses/by/4.0/).
Share and Cite
MDPI and ACS Style
Gilardi, R. Tribology of Graphite-Filled Polystyrene. Lubricants 2016, 4, 20. https://doi.org/10.3390/lubricants4020020
AMA Style
Gilardi R. Tribology of Graphite-Filled Polystyrene. Lubricants. 2016; 4(2):20. https://doi.org/10.3390/lubricants4020020
Chicago/Turabian StyleGilardi, Raffaele. 2016. "Tribology of Graphite-Filled Polystyrene" Lubricants 4, no. 2: 20. https://doi.org/10.3390/lubricants4020020
Note that from the first issue of 2016, this journal uses article numbers instead of page numbers. See further details here.